PiN LANDSCAPE ASSESSMENT PHASE 1
24
WORKING PAPER #5 PiN LANDSCAPE ASSESSMENT PHASE 1 THE INTERDISCIPLINARY SITUATION ANALYSIS NATHAN DEUTSCH INTERNATIONAL UNION FOR CONSERVATION OF NATURE COMMISSION ON ENVIRONMENTAL, ECONOMIC AND SOCIAL POLICY
Transcript of PiN LANDSCAPE ASSESSMENT PHASE 1

WORKING PAPER #5
PiN LANDSCAPE ASSESSMENT PHASE 1THE INTERDISCIPLINARY SITUATION ANALYSIS
NATHAN DEUTSCH
INTERNATIONAL UNION FOR CONSERVATION OF NATURE
COMMISSION ON ENVIRONMENTAL, ECONOMIC AND SOCIAL POLICY

© 2016 International Union for Conservation of Nature and Natural Resources
Reproduction of this publication for educational or other non-commercial uses is authorised without prior written permission from the copyright holder(s) provided the source is fully acknowledged.
Reproduction of this publication for resale or other commercial purposes is prohibited without prior written permission of the copyright holder(s).
The views expressed in this publication do not necessarily reflect those of International Union for the Conservation of Nature (IUCN) or of the Commission on Environmental, Economic and Social Policy (CEESP).
The designation of geographical entities in this book, and the presentation of the material, do not imply the expression of any opinion whatsoever on the part of IUCN [**or other participating organisations] concerning the legal status of any country, territory, or area, or of its authorities, or concerning the delimitation of its frontiers or boundaries.
This publication should be cited as: Deutsch, Nathan. 2016. PiN Landscape Assessment Phase 1: The Interdisciplinary Situation Analysis. People in Nature Working Paper No. 5. Gland, Switzerland: IUCN and CEESP.
PiN LANDSCAPE ASSESSMENT PHASE 1THE INTERDISCIPLINARY SITUATION ANALYSIS
Rationale 5
Approach to PiN Interdisciplinary Situation Analysis 5
1. Formation of Assessment Team 6
Roles of assessment team members in the ISA 7
2. Scoping of Problems and Goals 8
3. Delimitation of the Assessment Area 8
4. Gathering and Evaluation of Secondary Data 8
Current and potential use of Nature 8
Secondary data on variables that shape use 12
PiN domains 14
Secondary data on social and economic dimensions 14
Summary of secondary data requirements 15
5. Definition of Data Collection Protocols and Identification of Data Needs to Guide Primary Data Collection in Phase II 18
6. Authoring and Presentation of the Secondary Data Synthesis 18
Using cumulative reporting from ISA results for metrics on data coverage and completeness of existing databases and portals 18
7. Creation of a Project Data Repository for Use by the Assessment Team 19
Portal file type issues 19
Team Duties and Timelines 19
Digital Tools 20
Complementary of PiN ISA with IUCN Situation Analysis 21
Limitations and Moving Forward 21
Sources Cited 22
INTERNATIONAL UNION FOR CONSERVATION OF NATURE
COMMISSION ON ENVIRONMENTAL, ECONOMIC AND SOCIAL POLICY


PiN WORKING PAPER
PiN LANDSCAPE ASSESSMENT PHASE 1 | 5
RATIONALE
The initial phase of the PiN landscape assessment method-ology involves collection and preliminary analysis of publicly available secondary data on the interrelationships between people and nature and social, economic and political as-pects of the assessment area. This phase has been given the name interdisciplinary situation analysis (ISA) (Idrobo et al. 2016). The intent of this document is to provide detailed rationale and directions for ISA procedure, data sources, analysis and document storage.
This document provides information on the ISA workflow from start to finish with the intention of guiding the PiN team in making decisions about what information and procedures should be included and excluded and who to involve. This pa-per also makes suggestions as to the organization of the ISA report that marks the transition between PiN phases I and II.
APPROACH TO PiN INTERdIsCIPLINARy sITuATION ANALysIs
The PiN mixed methodology (Idrobo et al. 2016) outlines the phases of the PiN landscape assessment (figure 1) and gives early guidance for the ISA (figure 2). The current docu-ment aims to provide a detailed description of the ISA to be followed during early PiN project implementation, and pro-vides suggestions for moving forward in terms of adopting a consistent ISA workflow that may then be integrated with
other IUCN tools and approaches. We take note of com-plementarity of approaches between PiN ISA and existing IUCN situation analysis (SA) approaches.
The main purpose of the PiN ISA is to identify and analyse existing information regarding interrelationships between people and nature, and identify gaps in knowledge and data needed to inform the main areas of focus of the landscape assessment itself. The use of existing information will help avoid duplication of effort and reduce so-called research fa-tigue for communities by assisting the assessment team in designing data collection strategies according to gaps and needs. As with the IUCN SA, the PiN ISA is also strategic for making any final decisions on assessment design and strategy in the field. The PiN ISA can be described as having the following steps:
1. Formation of assessment team
2. Scoping problems and goals
3. Delimitation of area of study
4. Gathering and evaluation of secondary data
5. Definition of data collection protocols and identifica-tion of data needs to guide primary data collection in phase II
6. Authoring and presentation of the secondary data synthesis
7. Creation of a project data repository for use by the assessment team
Figure 1: PiN mixed methodology approach from Idrobo et al. (2016)

PiN WORKING PAPER
6 | PiN LANDSCAPE ASSESSMENT PHASE 1
Figure 2: PiN Phase I process (Idrobo et al. 2016)
The procedure is sequential but feedback between steps may be necessary for adaptation of the ISA to reflect specif-ic needs identified along the way.
An aim of the PiN secondary data module (Deutsch et al. 2016) is to employ crowdsourcing tools in order to gain better access to existing data and to be more thorough in terms of data coverage. The digital tools to support this approach have not yet been built at the time of writing, so it is assumed that manual work will be needed to find sourc-es that are difficult to located on and offline. The approach suggested in Deutsch et al. (2016) is aimed at significant-ly reducing the amount of effort for both researchers and communities in the field phase of the PiN methodology, and additionally may be viewed as part of an effort to repatriate data in secondary sources to the community or communi-ties involved in the landscape assessment. A knowledge of what public information is already available in relation to biodiversity and landscapes they use and value is im-portant for community empowerment in assessment and planning processes.
The following sections guide the reader through the stages of phase I and provide indications as to which information is required and whom to involve.
1. FORmATION OF THE AssEssmENT TEAm
Ideally, the team that is responsible for implementing phase II of the mixed methodology will be formed in the initial stage in the ISA and will be involved in its execution. The IUCN SA emphasizes identification and analysis of stakeholder groups for inclusion or consultation during implementation of the project. While identification of stakeholders is import-ant during the PiN ISA, phase I also focuses on formation of an assessment team, and which will necessarily involve some key stakeholders and rights holders and calls for at-tention to which individuals to involve at the landscape level. PiN landscape assessments may be community-based and as such require an attentive eye towards the partnerships and team composition that can support communities in building an understanding of the biodiversity-based sys-tem and solutions to the problems they identify. PiN takes a rights based approach (RBA) with particular attention to rural and remote communities and Indigenous Peoples. Some stakeholders may be rights holders, and as such, further stakeholder identification and analysis should be carried out with their involvement.1
PiN is still in early development, and is jointly being devel-oped by both secretariat staff and commission members
1 A Preliminary Framework of IUCN’s Rights-Based Approach: Systemization of the Union’s Policy Instruments, Standards and Guidelines. Prepared by Vanessa Retana for IUCN’s Global Forest Conservation and Climate Change Programme and Social Policy Unit. Draft, November 2015.

PiN WORKING PAPER
PiN LANDSCAPE ASSESSMENT PHASE 1 | 7
under IUCN’s one programme approach. As such, the land-scape assessment team will likely need to involve both sec-retariat staff and commission members that are members of PiN working groups dedicated to specific regions or meth-odological development issues. As PiN is being developed through regional assessments, assessment teams may also involve IUCN regional staff, organizations and local com-munity researchers involved in implementation of projects.
Thus, assessment teams may draw on two levels of organiza-tion in the project structure: the regional level, comprising PiN regional working group membership and IUCN regional office staff, and the local community level, including actors who are part of community institutions and/or implementing organiza-tion staff for projects to which the PiN assessment is linked.
Members of the assessment team will need to convene at least once during phase I in order to identify objectives, key stakeholders and rights holders, and to delineate the as-sessment area. Once the ISA has been completed, another meeting may be necessary to review gaps in the secondary data and agree upon primary data collection protocols.2
Roles of assessment team members in the IsA
A coordinator for the ISA phase should be chosen. The coordinator may effectively perform most of the tasks of gathering secondary data and analysis. It will be necessary, however, to involve members of the assessment team, in keeping with the principle of participatory involvement throughout the landscape assessment process. In practice, this would mean sharing data collection responsibilities, as well as the data collected with team members through use of a common shared folder on the Union Portal (see below). The coordinator may involve those close to the ground in collection of data that is accessible only locally, e.g., in gov-ernment or NGO offices and information available only in local languages. Likewise, if data is archived at sites distant from the landscape assessment area, team members may need to be located at these sites, or choose to contact oth-ers in partner networks who are able to access this data.
Membership of the team in the early stages of PiN develop-ment may be shaped by the need to better communicate decisions with the appropriate constituencies. Coordination of PiN development is guided by the Steering Group, while landscape assessments are coordinated and implemented by project teams (see figure 3). The project team is likely to contain members of both the Steering Group and Re-gional Working Group, at least in early stages of PiN de-velopment. Regional Working Groups may contain IUCN regional staff, members or partners with knowledge of re-gional issues more generally and project sites in particular.
Communication between these different levels is necessary in the scoping phase, following which, responsibilities for data collection and analysis during Phase I of the landscape assessment lie with the project team, which can work rel-atively independently of other levels. The results of the ISA (synthesis) should be shared with both the Steering Group and Regional Working Group at which point decisions on how to proceed in Phase II can be taken collaboratively.
2 This is an issue that will require more detailed attention in future discussions.
Members of the assessment team may be able to access data that is difficult for the coordinator to access if distributed in collections on/off site and not available on the internet. Proj-ect team members, together with other team levels can be instrumental in activating a wider network of IUCN Members, Commissions and partners (partner networks) in order to find people who may hold data relevant to the project that they are able and willing to contribute publicly. This data will even-tually be contributed through a dedicated platform designed to crowdsource data (planned as part of the PiN secondary data module). Figure 4 suggests how the project team and partner networks may be directly involved in filling in these gaps through, 1) desk review of available data, 2) compiling data sources from partners, and 3) employing crowdsourcing tools to sources data from wider partner networks.
Figure 3: Hierarchy of project responsibilities.

PiN WORKING PAPER
8 | PiN LANDSCAPE ASSESSMENT PHASE 1
2. sCOPINg OF PRObLEms ANd gOALs
The initial scoping section of the ISA report must provide a rationale for the site-based study, of its participants and of the landscape assessment area. Initial community meetings to form the assessment team will help to define goals and vision, but a defining feature for PiN in its current state of development is that assessment teams work alongside or within the structure of existing on-the-ground projects. The assessment team thus needs to nest within, and indeed pro-vide support for existing projects. The following set of ques-tions can guide the process of scoping problems and goals:
• Why is PiN being used at this site?
• Who are the regional and local project partners?
• What are the main problems to be addressed?
• What are the main objectives of the assessment (e.g. planning for climate change adaptability, land use cor-ridors, etc.)?
This section should describe threats, trends and pressures that affect people and ecosystems. Local project imple-mentation experts and regional IUCN office staff may be involved at this stage due to their knowledge of policies that guide decision-making at higher levels. These team mem-bers may also identify useful indicators used regionally and nationally, and data available in policy documents. An ad-ditional advantage to working this way with regional teams and local experts is that they will be able to provide informa-tion on how previous projects in the area have scoped prob-lems, and how project governance has worked. Experience held regionally and locally will also be important for defining protocols for primary data collection, and may have project governance and policy impact implications.
3. dELImITATION OF THE AssEssmENT AREA
The boundaries of the assessment area may be defined in terms of ecological variables, e.g., to reflect an ecolog-
Figure 4: Illustration of data flows for filling in secondary data gaps
ical area such as a watershed, a particular ecosystem or the range of a species of interest (Springate-Baginski et al. 2009). They may be shaped socially and culturally, i.e., the area in which a particular livelihood or cultural practice of a given group of people is undertaken; or in terms of planning areas or political-administrative factors, including an indige-nous territory or planning unit over which local communities may exercise control. The delimitation of the area may then be brought in line with agreement of the assessment team on a set of problems, goals and protocols.
The study area description in the ISA report should clearly define the study area boundaries, referring to existing maps and documents when possible. This section of the report will require team members to assemble maps and spatial data layers from government repositories, other institutions/partners, and from open data sources. The ISA may refer to existing maps of planning boundaries, ecological classi-fications, land use and development plans, and protected areas planning documents, and might make references to ethnographic data to describe people, group and territories in order to describe the study area. Maps and map layers need to be collected and stored digitally. It may be conve-nient to keep a table or spreadsheet updated with a list of map layers available to the assessment team.
4. gATHERINg ANd EvALuATION OF sECONdARy dATA
Current and potential use of Nature
Phases I and II together provide a comprehensive assess-ment of people’s interrelationships with nature with a focus on understanding material use of nature, including flows of services from biodiversity – from genes to ecosystems, wa-ter, and potentially other services and the factors that shape and constrain this use. Phase I aims to generate baseline socio-economic and ecological data but also plays a funda-mental role in the landscape assessment by collecting and presenting information regarding known uses of nature, ac-cess of local communities to natural resources, and knowl-edge about conservation status of species, ecosystems and genetic resources that underlie the potential of nature to con-tribute to human livelihoods and wellbeing. In this respect, the PiN ISA guides the assessment team beyond commonly researched questions focused on current use of biodiversity by including questions on potential uses (e.g., of species, ge-netic resources, habitats). As such, data collection in phase I is structured around the importance of understanding current and potential uses of nature that can influence livelihoods and wellbeing of communities. The ISA aims to find and anal-yse documentation on interrelationships between people and nature in the past and present, and also documentation of known uses of nature that is potentially available within the assessment area, where actual uses may relate to a species

PiN WORKING PAPER
PiN LANDSCAPE ASSESSMENT PHASE 1 | 9
or other level of biodiversity in places geographically removed from the landscape assessment site.
The ISA analysis is designed to get the landscape assess-ment project team thinking about the reasons that biodiver-sity that is known from the secondary data to have potential to meet human needs is not being realized in a particular assessment area. The critical feature of this approach is that it should help communities themselves identify specific impacts of different interventions in terms of this potential, while recognizing that some changes in ecosystems that degrade biodiversity may improve wellbeing in other cases (e.g. by bringing electrical energy from hydro dam or ex-panding agriculture) (Myers et al. 2013).
The relationship between current use and potential use of biodiversity is articulated through four analytical catego-ries: availability, stability, access and perception (David-son-Hunt et al. 2016). Current use of nature in a study area (Uc) is currently defined as the total number of species or subspecies and agricultural landraces currently used by members of a community, including all ages, households, and individuals. Potential use (U) is defined as the number of species, subspecies and landraces in an area that have a documented use in the secondary literature or global datasets, regardless of whether they are currently used by community members at the time of assessment.3
Figure 5: use, trade and livelihoods data schema for assessment scale (figure provided by Kevin smith, species Programme, Cambridge, uK)
While the variable U is calculated based on existing second-ary data, the variable Uc can only be verified using primary data collection procedures undertaken during phase II. Sec-ondary data cannot be reliably used to collect information on current use because sources likely do not contain recent and comprehensive information on biodiversity currently used in a particular community or study area.
Secondary sources on uses of nature may include ethnobiolo-gy papers and datasets containing accounts of species use or inventories of species used, reports from previous projects, and planning and management documents. Ethnographic literature may contribute to an understanding of use in terms of the ana-lytical categories described below, and detailed narratives may be referenced. Notably, IUCN’s Species Information Service (SIS) stores species use data in the use, trade and livelihoods tabs. Species use data is stored either globally by species ac-cording to end use, or within Wild Harvest Records, which con-stitute local reports on species use (see figure 5).
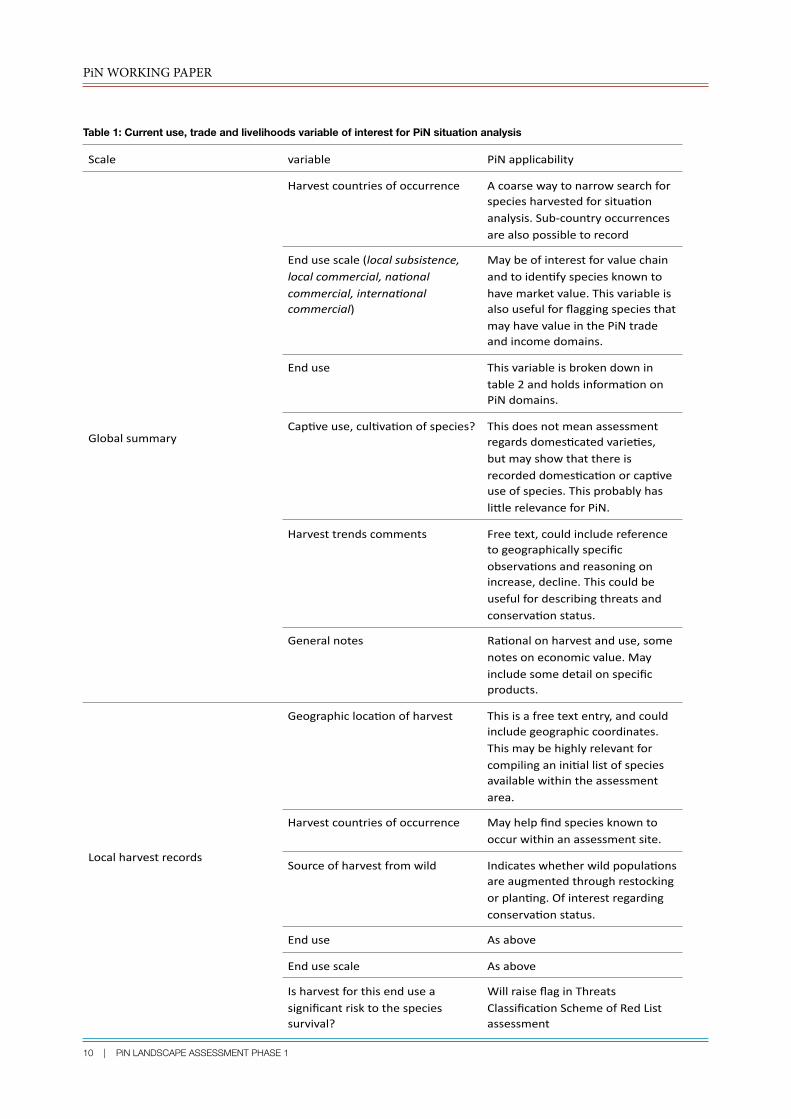
Table 1 makes note of the potential importance of a selec-tion of SIS variables for the ISA that may be stored in either the global-level summary section or in local harvest records of the use, trade and livelihoods tabs. These ‘tabs’ of the SIS are not yet stable and further development in the future means these categories may change.
3 A similar variable may be employed to characterise use of abiotic parts of nature, e.g., water and potentially other services.
PiN WORKING PAPER
10 | PiN LANDSCAPE ASSESSMENT PHASE 1
Table 1: Current use, trade and livelihoods variable of interest for PiN situation analysis
Scale variable PiNapplicability
Globalsummary
Harvestcountriesofoccurrence Acoarsewaytonarrowsearchforspeciesharvestedforsitua<onanalysis.Sub-countryoccurrencesarealsopossibletorecord
Endusescale(localsubsistence,localcommercial,na0onalcommercial,interna0onalcommercial)
Maybeofinterestforvaluechainandtoiden<fyspeciesknowntohavemarketvalue.ThisvariableisalsousefulforflaggingspeciesthatmayhavevalueinthePiNtradeandincomedomains.
Enduse Thisvariableisbrokendownintable2andholdsinforma<ononPiNdomains.
Cap<veuse,cul<va<onofspecies? Thisdoesnotmeanassessmentregardsdomes<catedvarie<es,butmayshowthatthereisrecordeddomes<ca<onorcap<veuseofspecies.ThisprobablyhasliKlerelevanceforPiN.
Harvesttrendscomments Freetext,couldincludereferencetogeographicallyspecificobserva<onsandreasoningonincrease,decline.Thiscouldbeusefulfordescribingthreatsandconserva<onstatus.
Generalnotes Ra<onalonharvestanduse,somenotesoneconomicvalue.Mayincludesomedetailonspecificproducts.
Localharvestrecords
Geographicloca<onofharvest Thisisafreetextentry,andcouldincludegeographiccoordinates.Thismaybehighlyrelevantforcompilinganini<allistofspeciesavailablewithintheassessmentarea.
Harvestcountriesofoccurrence Mayhelpfindspeciesknowntooccurwithinanassessmentsite.
Sourceofharvestfromwild Indicateswhetherwildpopula<onsareaugmentedthroughrestockingorplan<ng.Ofinterestregardingconserva<onstatus.
Enduse Asabove
Endusescale Asabove
Isharvestforthisenduseasignificantrisktothespeciessurvival?
WillraiseflaginThreatsClassifica<onSchemeofRedListassessment

PiN WORKING PAPER
PiN LANDSCAPE ASSESSMENT PHASE 1 | 11
A concern that has arisen at several points during PiN meth-odological workshops pertains to how PiN plans to inte-grate community-level and regional-level assessment data with data that has been organized in the SIS and other ma-jor databases according to species. The concern is whether PiN landscape studies can interface easily with a database (SIS) that is organized around species, and not around ter-ritories. Regarding the ISA, a simple answer would be that the assessment team requires a list of species with known uses that may be found within the assessment area. In practical terms, it is difficult if not impossible to derive a list of species that may be found within the area at the time of the assessment due to variability in populations and ranges. However, databases and datasets may be used to build a list that can then be verified during Phase II, which draws on participatory biodiversity assessment methodology. A list of species that is potentially available locally may be drawn from 1) occurrence datasets, 2) Red List spatial data (spe-cies range estimates), and 3) Ethnobiology datasets for the area of interest. A combination of these sources would likely yield the best results.
Information available through the SIS Habitats & Ecosys-tems and Occurrence modules, and Red List Spatial data on species and subspecies ranges may be brought into the ISA to narrow down the list of species with potential use. Suitable occurrence datasets external to SIS, including the Global Biodiversity Information Facility (GBIF) can be used to collate lists of species with potential local use. The sug-gested methodological workflow for understanding this re-lationship is illustrated in figure 6 and involves:
1. Compiling comprehensive data on documented uses of nature, including species/subspecies and landraces that are likely present in the study area;
2. Collecting and reporting on variables that shape or me-diate use of species, or that constrain or prevent poten-tial sustainable uses from being fully realized;
3. Identifying threats and factors that shape use of na-ture, including conservation status of species and local landraces, and of the habitats and ecosystems they rely upon.
Figure 6: The situation analysis data collection and analysis workflow on use of nature and status of access (Ac) availability (Av), stability (sb) and perception (Pc).

PiN WORKING PAPER
12 | PiN LANDSCAPE ASSESSMENT PHASE 1
secondary data on variables that shape use
The variables in the above framework are treated more ex-tensively in Davidson-Hunt et al. (2016). This section con-siders the availability of data sources and the purposes to which they may be put to use. The ISA makes headway in collecting information on these variables using secondary data sources, contributing towards a partial understanding of the way use is shaped by availability, stability, access and perception. The ISA should be carried out within a short timeframe given by project needs. It is thus beyond the scope of the team to be exhaustive in research. Rather, the ISA should aim to reveal a range of issues regarding the abil-ity of people and communities to benefit from biodiversity.
Access
Access describes the ability of an individual or group to benefit from biodiversity, whether through access to ma-terials, persons, institutions or symbols. This includes who has access according to normative frameworks, legislation, action plans, planning and management frameworks as well as through customary or traditional rights and authority. PiN takes a rights-based approach and as such, work on access would need to identify rights of access to resourc-es, e.g. property ownership or common property rules with regard to wetlands, forests, fisheries. These refer to legal frameworks, including customary law.
The ISA needs to identify national and international legal and normative frameworks that apply to area in the most basic case of application. An understanding of normative frame-works may include understanding international conventions that have been ratified by the national government, incorpo-ration of international conventions into national law, under-standing of infringements of conventions and national laws. Voluntary standards signed by private companies operation-al in the assessment area may also be scrutinized in order to understand duties that companies may bear in relation to local communities and their environments. The relevance of specific instruments and standards in national contexts may be explored, e.g. UN Declaration on Rights of Indigenous Peoples and CBD, as well as other frameworks that regulate or restrict access to biodiversity and land (e.g., protected areas management documents, planning documents).
In developing the ISA methodology, more attention needs to be dedicated regarding assessment of national, regional and local level standards and rights. Gonzalo Oviedo (Se-nior Advisor, IUCN Social Policy Programme) has recom-mended a three step approach to the assessment of rights. The first task should be to examine the relevant (applicable) legal frameworks to understand the existing normative pro-visions, followed by an analysis of the institutional frame-works, to understand roles, responsibilities, capacities and
accountability. Subsequently, the analysis should focus on implementation, looking at the situation of stakeholders, with particular attention to vulnerable groups, including the situation of women. Data on equity, i.e. distribution of ben-efits by gender, income, ethnic group, and other relevant groups may be used where available.
With an interest in how interrelationships between people and nature are shaped by social, economic and institution-al factors, we can broaden our focus from rights to abili-ties of people to benefit from nature. Abilities encompass a broader set of governance issues, including customary norms and traditional knowledge, constraining or enabling factors for collective action and decision-making. Project team members may have access to data available through public planning and management offices, through NGOs, public offices, census data, etc.
Rights on paper will often differ from rights practiced or rights understood to exist on paper. For example, it will be important to understand a range of rights – both formal and customary, including:
• Land tenure (gender stratified) and resource access rights (beyond formal/legal property rights).
• Any bioprospecting activities and IPR in a place, and terms for access and benefits sharing from these activities
• rights to harvesting and cultivation within protected areas
• Rights to use of fresh water
• Decision-making rights
Gonzalo Oviedo has suggested the following rights catego-ries for assessment during an ISA:
a. Substantive rights:
• tenure rights: land rights, resource access rights
• right to water (access to water)
• right to food (situation in terms of food security and nutrition security)
• right to health (specifically in relation to natural re-sources, e.g. nutritional problems that derive from food insecurity or lack of access to clean and safe water)
• right to a healthy environment (clean of pollution and other adverse impacts) and to ecosystem goods and services for livelihoods
b. Procedural rights:
• Right to participation and consultation
PiN WORKING PAPER
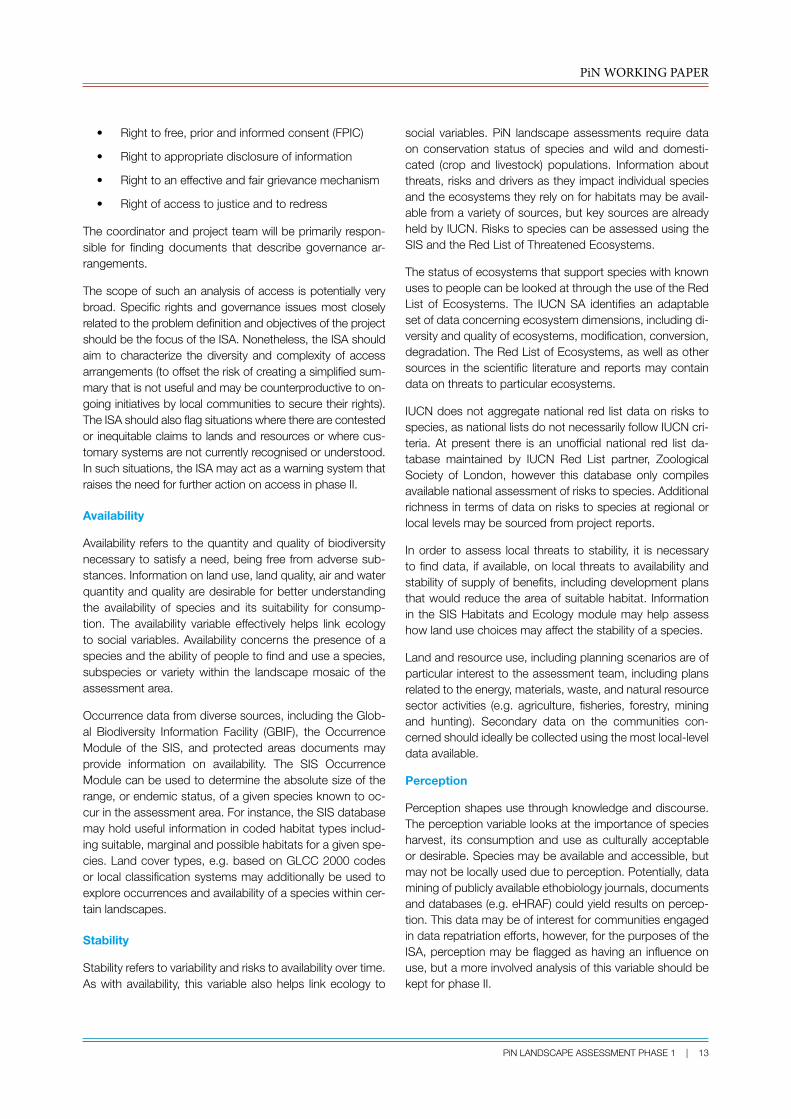
PiN LANDSCAPE ASSESSMENT PHASE 1 | 13
• Right to free, prior and informed consent (FPIC)
• Right to appropriate disclosure of information
• Right to an effective and fair grievance mechanism
• Right of access to justice and to redress
The coordinator and project team will be primarily respon-sible for finding documents that describe governance ar-rangements.
The scope of such an analysis of access is potentially very broad. Specific rights and governance issues most closely related to the problem definition and objectives of the project should be the focus of the ISA. Nonetheless, the ISA should aim to characterize the diversity and complexity of access arrangements (to offset the risk of creating a simplified sum-mary that is not useful and may be counterproductive to on-going initiatives by local communities to secure their rights). The ISA should also flag situations where there are contested or inequitable claims to lands and resources or where cus-tomary systems are not currently recognised or understood. In such situations, the ISA may act as a warning system that raises the need for further action on access in phase II.
Availability
Availability refers to the quantity and quality of biodiversity necessary to satisfy a need, being free from adverse sub-stances. Information on land use, land quality, air and water quantity and quality are desirable for better understanding the availability of species and its suitability for consump-tion. The availability variable effectively helps link ecology to social variables. Availability concerns the presence of a species and the ability of people to find and use a species, subspecies or variety within the landscape mosaic of the assessment area.
Occurrence data from diverse sources, including the Glob-al Biodiversity Information Facility (GBIF), the Occurrence Module of the SIS, and protected areas documents may provide information on availability. The SIS Occurrence Module can be used to determine the absolute size of the range, or endemic status, of a given species known to oc-cur in the assessment area. For instance, the SIS database may hold useful information in coded habitat types includ-ing suitable, marginal and possible habitats for a given spe-cies. Land cover types, e.g. based on GLCC 2000 codes or local classification systems may additionally be used to explore occurrences and availability of a species within cer-tain landscapes.
stability
Stability refers to variability and risks to availability over time. As with availability, this variable also helps link ecology to
social variables. PiN landscape assessments require data on conservation status of species and wild and domesti-cated (crop and livestock) populations. Information about threats, risks and drivers as they impact individual species and the ecosystems they rely on for habitats may be avail-able from a variety of sources, but key sources are already held by IUCN. Risks to species can be assessed using the SIS and the Red List of Threatened Ecosystems.
The status of ecosystems that support species with known uses to people can be looked at through the use of the Red List of Ecosystems. The IUCN SA identifies an adaptable set of data concerning ecosystem dimensions, including di-versity and quality of ecosystems, modification, conversion, degradation. The Red List of Ecosystems, as well as other sources in the scientific literature and reports may contain data on threats to particular ecosystems.
IUCN does not aggregate national red list data on risks to species, as national lists do not necessarily follow IUCN cri-teria. At present there is an unofficial national red list da-tabase maintained by IUCN Red List partner, Zoological Society of London, however this database only compiles available national assessment of risks to species. Additional richness in terms of data on risks to species at regional or local levels may be sourced from project reports.
In order to assess local threats to stability, it is necessary to find data, if available, on local threats to availability and stability of supply of benefits, including development plans that would reduce the area of suitable habitat. Information in the SIS Habitats and Ecology module may help assess how land use choices may affect the stability of a species.
Land and resource use, including planning scenarios are of particular interest to the assessment team, including plans related to the energy, materials, waste, and natural resource sector activities (e.g. agriculture, fisheries, forestry, mining and hunting). Secondary data on the communities con-cerned should ideally be collected using the most local-level data available.
Perception
Perception shapes use through knowledge and discourse. The perception variable looks at the importance of species harvest, its consumption and use as culturally acceptable or desirable. Species may be available and accessible, but may not be locally used due to perception. Potentially, data mining of publicly available ethobiology journals, documents and databases (e.g. eHRAF) could yield results on percep-tion. This data may be of interest for communities engaged in data repatriation efforts, however, for the purposes of the ISA, perception may be flagged as having an influence on use, but a more involved analysis of this variable should be kept for phase II.

PiN WORKING PAPER
14 | PiN LANDSCAPE ASSESSMENT PHASE 1
PiN domains
The PiN use domains bundle uses of nature into aggregated categories aimed to increase visibility and comprehension of PiN findings within broader policy domains (e.g., food and nutrition security, health, climate change adaptation, fuel-wood use). The following domains have been stabilised: in-come, medicine and health, food and nutrition, energy, shel-ter, trade, and ceremony. PiN domains have not yet been set in stone, and may change as policy discourses change. This set of domains has been designed to link information on bio-diversity to consideration of multiple dimensions of poverty and wellbeing for people who use biodiversity. A good way to approach the PiN domains at the ISA phase is to focus on finding data on projects and interventions relevant to the domains listed, then to review species uses and think about where publicly available data supports biodiversity-based solutions to existing problems locally.
A number of hierarchical standardized schemata exist for categorising use data for various purposes. For instance, the Kew Economic Botany unit has created a standard for categories of use.4 Similarly, the SIS has adopted a stan-dard for use data. The SIS use categories and the Econom-ic Botany Data Standard are considered in table 2, which proposes how these categories can be compared to the PiN domains. These standards have been developed to multiple levels or depths with progressively more detailed description of use at lower levels. It will be necessary to collapse data on use into PiN domains while ensuring that data is stored in its original format such that other domains may be studied. Similarly, data taken directly from the sec-ondary literature should retain as much information on use as possible, thus, original narrative data on use and relative categories, if present, should be preserved.
Many categories of use listed in table 2 may not fit directly into PiN domains, however, each of these empty categories represents potential trade and income. More information is necessary on trade of products from species in order to cor-rectly assess use in the trade and income domains. The SIS stores information on scale of trade (from local to interna-tional markets) along with use categories for both local de-tailed wild harvest records and global species assessments. The scale of trade can inform PiN assessments by showing which species may be of commercial importance, although information specific to trade within the assessment area may not exist. For example, it would be possible to simply flag species with a known market value (locally, nationally, internationally) during the ISA in order to make choices in terms of which value chains may be of interest to consider during phase II. Similarly, the ceremony domain is absent in the standards in table 2. Yet reference to ceremonial uses
may be found in ethnobiology datasets, necessitating de-velopment of a ‘ceremony’ section of the SIS use tab.
The project team may choose to focus within a particular policy domain for the purposes of the project (e.g., impacts of climate change on food and nutrition security). However, digital workflow tools that are planned for PiN will allow us-ers to rapidly assess uses across other domains in order to identify the potential of biodiversity to address multiple poli-cy areas. For instance, if a PiN assessment is being carried out alongside a local project to restore forested landscapes, a rapid analysis across use domains may identify species that may be useful for food and nutrition, income, shelter and medicine that may be replaced instead with species for restoration that fulfil a narrower set of local needs.
secondary data on social and economic dimensions
For the scoping of problems and goals within the assess-ment area, maps or map layers are needed for adminis-trative boundaries, protected areas and development plan-ning. The key is identifying how this data may contribute to a better understanding of use of nature with the scoping of the study in mind. The IUCN SA identifies health and popu-lation data, wealth data (economy, income, material goods, infrastructure, basic needs such as food, water, clothing, shelter) as areas of relevance for collection of secondary data. The social and economic dimensions for understand-ing of livelihoods and wellbeing suggested for PiN in Suich et al. (2016a) are education, employment, energy, food and nutrition, health, income, water and sanitation, asset ownership and social and cultural relations (core domains). Locally defined dimensions not included in this list may be added if they are seen to be critical to the project team.
Demographic and economic data on assets, including household wealth, any census or household survey data, health and nutrition (nutrition surveys), ethnic, gender equality and equity data may be collected and collated. Regional data or country-level data may be of interest for the sake of drawing comparisons or contrasts with local realities, depending on needs and data availability. Wealth data from census or household surveys may be collat-ed and used to inform understanding of household and community dynamics regarding use of nature if sufficient-ly disaggregated (i.e. by wealth, gender, age). This data may help to emphasise potential regional socio-economic disparities and make linkages with species and ecological data to assess the potential for biodiversity to meet critical needs within these areas.
Previous research, census data and nutrition surveys can be used to assess food security status and poverty in rela-
4 Kew standard: http://www.kew.org/tdwguses/rptLevel1_2States.htm. See also http://www.tdwg.org/standards/ for progress on integration of the Kew standard into the Biodiversity Information Standards for greater data interoperability with other existing biodiversity information platforms and data services. See Deutsch et al. (2016) on a proposed strategy for interoperability between available data services.

PiN WORKING PAPER
PiN LANDSCAPE ASSESSMENT PHASE 1 | 15
Table 2: sIs use category fit with PiN domains
SISusecategory EconomicBotanyDataStandard(level1&2only)
SuggestedPiNusedomain
Food–human FOOD,FOODADDITIVES FoodandnutriFon
Food–animal ANIMALFOOD FoodandnutriFon
Medicine–human&veterinary MEDICINES Medicines
Poisons VERTEBRATEPOISONS, NON-VERTEBRATEPOISONS
PotenFallymedicines
Manufacturingchemicals MATERIALS-Tannins/Dyestuffs, -Gums/Resins,-EssenFalOils, -Waxes,-Alcohols
N/A
Otherchemicals MATERIALS-Other,Materials/Chemicals
N/A
Fuels FUELS Energy
Fibre MATERIALS-Fibres N/A
ConstrucFonorstructuralmaterials
MATERIALS-Wood,-Caneetc., -Gums/Resins,-Latex/Rubber
Shelter
Wearingapparel,accessories MATERIALS-Fibres N/A
Otherhouseholdgoods MATERIALS N/A
HandicraWs,jewellery,etc. MATERIALS N/A
Pets,displayanimals,horFculture ENVIRONMENTALUSES-Ornamentals
Trade,Income
Research N/A
SporthunFng/specimencollecFng Trade,Income
Establishingex-situproducFon N/A
Other(freetext)
Unknown
tion to livelihood assets. Disaggregated data may be used
when appropriate (i.e. data regarding individuals disaggre-
gated in terms of gender, age, wealth, nutrition status, etc.)
such that intra-household distributional issues can be un-
derstood and analysis can be gender sensitive, but may not
be available in many cases. Especially when considering re-
sources use, impacts and contributions of biodiversity may
be masked if only looking at the household or community
levels, and not at individualised use.
summary of secondary data requirements
Indicators may be used to create baselines for assessment. These are not meant to be comparable across sites, as the relative number of species and habitats within landscapes vary widely globally. However, they may be useful for moni-toring assessment sites over time. Indicators for the variables and associated potential data sources are listed in table 3. Table 4 identifies specific data needs guided by PiN use do-mains and provides suggestions for roles of team and steer-ing group members in terms of data collection and collation.

PiN WORKING PAPER
16 | PiN LANDSCAPE ASSESSMENT PHASE 1
Table 3: data sources and indicators by variable
Variable Indicatorsforassessment Datasources
Access ▪ Numberofhabitatsaccessibleforharves3ng;▪ Bundlesofrightsandpowers(setofrightsand
powerstobeassessed);▪ Impact/contribu3on/rela3veimportanceofuse
ongroup;▪ Accesstomarketsforharvestedproducts;
▪ Interna3onalagreementsandvoluntarystandards
▪ Na3onallawsandpolicies▪ Lawsandagreementsonspecies
harvestandtrade▪ Ac3onplansandframeworks▪ Planningdocuments▪ NGOreports▪ Marketdataandindicators▪ Foodconsump3onstudiesandsurveys
(e.g.FAO/WHOGIFT)
Availability ▪ Numberofhabitatsinareawhereagivenspeciesisavailable;
▪ Abundance,numberofindividuals/volume/biomassofannualharvest;
▪ Levelofcontamina3on(hasitreducedconsump3on/useofspecies?);
▪ SIS&Na3onalandregionalredlists▪ Developmentplanningdocuments▪ Speciesrangedata▪ Habitatdata▪ Harveststudiesandmanagement
documentsforabundance▪ Agriculturalproduc3vity(maps)▪ Soilsdata
Stability ▪ Abundanceofspeciesremainedstableinrecenthistoryofcommunity?
▪ What/whenarepeaksofabundanceofspeciesduringtheyear?
▪ Conserva3onstatus:IsspecieslistedasthreatenedinglobalorregionalRLassessment?
▪ Threatstoecosystemsthatprovidehabitatforspecies.
▪ SIS&Na3onalredlists▪ RLE▪ Managementdocumentsandreports
ontrendsinspeciesabundance▪ Harveststudies
Percep3on ▪ Proper3es(orvalues)thataspecieshasforcommunity
Consump3on,Exchange,Cultural(recrea3on/ceremonial)
▪ Howhasusechangedover3meandwhy?
▪ Ethnographicdata▪ NGO/donorreports▪ eHRAF

PiN WORKING PAPER
PiN LANDSCAPE ASSESSMENT PHASE 1 | 17
Table 4: Assessment team roles regarding data search and collation
Datatype Datasources Assessmentteamrole
Useofbiodiversity Journals• EconomicBotany(1947-current)• EthnobotanicalLeaflets(Free1997-2010)• EthnobotanyResearchandApplicaGons(Free
2003-2015)• JournalofEthnobiology(Free1981-2004;Paid
2004-current)• JournalofEthnobiologyandEthnomedicine
(2005-current)• JournalofEthnopharmacology(1979-current)• Phytochemistry(1961-current)• JournalofNaturalProducts(Free2008-current)• journalsthatpublishlivelihoods,rural
developmentinformaGon,someimpactassessmentsofdevelopmentintervenGons,etc.
Databases• KewEconomicBotany• SIS• EncyclopediaofLifedataportal
• SpeciesProgrammestaff• ISAcoordinator
ConservaGonstatus Databases• SIS• RedListofEcosystems• Natureserve(Americasonly)• NaGonalredlists
• Speciesprogrammestaff
FoodcomposiGon Journals• JournalofFoodComposiGonandAnalysis(1987-
current)Databases• FAOINFOODSFoodComposiGonDatabasefor
Biodiversity• USDANaGonalNutrientDatabaseforStandard
Reference• NaGonalfoodcomposiGondatasets
• NutriGonexpert
NutriGonalstatusofcommuniGes
• GlobalNutriGonReport• FAONutriGonCountryProfiles
• NutriGonexpert
Access/governance • FAOGenderandLandRightsdatabase• InternaGonalnormaGveframeworks• NaGonallegalframeworks• Customary/tradiGonalrulesandregulaGonsin
reports,academicliterature• Planningandmanagementreports• Pastprojectreports(NGOs,dataheldbyIUCN
members)
• Localteam• ISAcoordinator• Governance,socialscience
expert
Socio-economicstatusandtrends
• Household,livelihoodsurveys• LSMS,HIESsurveys,etc.• NaGonalstaGsGcs• Planningandmanagementreports• Pastprojects• Marketandtradedata
• Localteam• ISAcoordinator• Economicsexpert

PiN WORKING PAPER
18 | PiN LANDSCAPE ASSESSMENT PHASE 1
5. dEFINITION OF dATA COLLECTION PROTOCOLs ANd IdENTIFICATION OF dATA NEEds TO guIdE PRImARy dATA COLLECTION IN PHAsE II
Following collection of data, the project team members that were responsible for collecting and analysing secondary data for the ISA should be involved in developing necessary protocols for primary data collection, and identifying gaps in the secondary data record that require further work in phase II. Further work is required by the PiN team in order to assess needs for data collection protocol development, and suggest appropriate approaches.
6. AuTHORINg ANd PREsENTATION OF THE sECONdARy dATA syNTHEsIs
The ISA report contains a descriptive synthesis of 1-5, above, with emphasis on data and knowledge gaps, and proposal for data collection needs. The report might be or-ganised into the following sections:
1. Executive summary
2. Scope of the assessment/objectives
3. Methodology
4. Assessment area description: boundaries, ecology, so-cio-economic trends and governance
5. Analysis of potential biodiversity use (U) by PiN domain and habitat/ecology
6. Analysis of variables that shape and constrain use
7. Gaps in secondary data and proposal for primary data collection
The ISA contributes to the biodiversity use metric, current use/potential use (Uc/U), drawing the variable, U, from the ISA secondary data assessment. By comprehensively com-piling and analysing data on potential use of species (U) and mediating variables that may constrain current use (Uc), the ISA may complement other methods and project-based in-dicators identified in the initial stages of project planning. As such, PiN methodology may contribute the biodiversity use metric to monitoring of project-specific indicators over time. Other more specific metrics may be derived or suggested by the ISA report in order to monitor change under policy domains of interest. Some suggestions might include:
• The number of species making important nutritional contributions to childhood and maternal health;
• The number of households with prevalent malnutrition;
• The status of ecosystems most critically important for provisioning of important species within PiN domains;
• The total number of farmer’s varieties/landraces in use;
• The total area accessible to households with different socio-economic status for harvesting, including forests, coastal areas;
• Change in the sizes of land holdings of households over time.
using cumulative reporting from IsA results for metrics on data coverage and completeness of existing databases and portals
PiN is interested in working with the use, trade and liveli-hoods sections of the SIS which store data on global uses of species. One simple indicator related to species use data coverage that can be calculated for each PiN landscape as-sessment is the number of species for which there is avail-able information on one or more species uses within the SIS. It would also be feasible to create a metric for species at a site for which conservation status has been assessed (thus informing PiN teams on stability).
The use, trade and livelihoods sections of the SIS have not yet been populated for the majority of species in the SIS, so it will be useful to have data available on species use cov-erage to guide future work in filling data gaps. Species use coverage may be further disaggregated to domain level, providing a metric for monitoring SIS coverage relevant to specific policy domains. Some global metrics already exist that PiN may want to relate to in this regard. For example, on food and nutrition, an indicator is being developed by FAO for species for which food composition data exists. This metric is focused on monitoring availability of data on food biodiversity.5 PiN has only committed to working with openly available data that is licensed for open access use or is in the public domain. As such, these metrics would only apply to data that is already openly accessible and for this reason, may also help steer campaigns to increase avail-ability and accessibility of global open data.
For cumulative ISAs, it should be possible to disaggregate metrics by, for example, geographic regions or cultures. This information can then be used to inform IUCN and various partner initiatives on critical geographical gaps in available data. It is envisioned that through iterations of landscape assessments at different sites, new global or regional data sources will be discovered and put to use, making future assessments progressively less time consuming (i.e., less time will need to be dedicated to searching for, and extract-ing data from existing sources), and more complete (i.e., fewer uses of biodiversity and threats would be overlooked due to data availability and accessibility issues.
5 The open access Biodiversity Indicators Partnership nutrition indicator for biodiversity (http://www.bipindicators.net/nutirtionindicators) draws directly on FAO INFOODS databases.

PiN WORKING PAPER
PiN LANDSCAPE ASSESSMENT PHASE 1 | 19
7. CREATION OF A PROjECT dATA REPOsITORy FOR usE by THE AssEssmENT TEAm
All data collected for the ISA will need to be stored safely for access by the landscape assessment team members. At the moment there is no permanent database that can be used to store documents used in the ISA. Instead, a document folder on the IUCN Union Portal has been sug-gested that can hold materials, and that is only accessible to team members. A single folder containing all documents is necessary because of limitations in the way the Portal allows documents to be searched. Documents will need to be labelled using standardized tags in order to facilitate their retrieval using the Portal’s search function. Suggested tags are listed in box 1. There are some disadvantages to file storage on the Portal. Access to these files is limited to those with access to the Portal.
Portal file type issues
Many types of documents may be stored on the Portal, but others cannot. Reports on governance, socio-economic analysis, indigenous/local knowledge; plans for protected areas and community or regional development; and scien-tific literature, including peer reviewed papers, book chap-ters published in scientific literature may be stored in com-mon document formats. Online documents, articles, maps and databases may be referred to by their url/uri or doi. Be-cause the portal restricts file types that can be stored, this folder might contain images, e.g. maps in jpeg of pdf for-mat, metadata for GIS data repositories, but not most spa-tial data formats. While maps may be stored on the Portal in popular image formats, raw spatial data may not. Database tables may be downloaded as excel files to be stored in the portal folder, or a document containing searches performed on a specific database may be saved.
TEAm duTIEs ANd TImELINEs
ISA project teams that include members of different organi-sations and organisational units will need to make decisions on budget and time requirements in order to perform an ISA. For instance, it will be necessary to budget for costs associated with the time of Species Programme staff to perform an SIS data extract on species found in the area, and for staff from the regional office or local project team for collection and collation of data sources. An ISA coordinator, whose duty it is to compile data into the database and over-see authorship of the ISA report needs to be chosen and budget dedicated toward their work.
Table 5 estimates timelines and costs for completion of the ISA. Five weeks are thought necessary for research and re-port authoring. A complete ISA may be produced with esti-
mated total of 41 days of work, distributed among different team over a five-week period.
These estimates exclude initial meetings and activities needed to come to agreement on location and partner-ships to be entered into in order to get the project of the ground. Time and budget estimates will also likely change as progress is made on the PiN secondary data module, which is required to streamline secondary data research, analysis and document storage. It is assumed that all ma-jor tasks listed in the table below can be undertaken from the desk and no additional international travel is necessary. Local travel may be added to the budget in order to meet with data holders or access physical documents that are not available digitally.
Finally, additional time and budget must be calculated if it is thought that team members require more face-to-face con-tact (with stakeholders) to develop the scope and objectives of the study. Face-to-face time to develop protocols for pri-mary data collection is also not estimated, as this stage will be dependent on context.
Box 1: Suggested hierarchical tags for Portal file storage>Use:
Household incomeTradeMedicineFood and nutritionEnergyShelter and materialsCulture/ceremonyWater
>Land use:PlanningAgricultural productivityOrthophotoSatellite imageEcology and habitatsWaterSpatial
>Governance:Legal rules and regulationsCustomary and traditional rulesCommunity protocolsManagement planProtected areasTerritorial developmentWater
>Threats:SIS extractOther literature
>Socio-economic:MarketsLabourGenderAgeEthnicity

PiN WORKING PAPER
20 | PiN LANDSCAPE ASSESSMENT PHASE 1
Table 5: Timeline and day estimates for situation analysis based on a five-day work week
dIgITAL TOOLs
The use of a digital platform containing workflow tools and linkages between diverse databases is planned, and can eventually simplify several parts of the ISA workflow for team members (see Deutsch et al. 2016). Digital tools and approaches include a platform for crowdsourcing data on
Week1 Weeks2&3 Week4 Week5
Specifictasks
• Localstaffmee,ngstoiden,fyfocalissuesforISAandusefullocaldocuments
• Databaseandliteraturesearchforspeciesandvarie,es
• AssembleGISdata• AssembleSocio-
economicandgovernancedata
• SISextractonspecieslist.
• SpeciesdatafromliteratureandSISinputintocommonprojectdatabase
• Createmaps• Createfiguresand
tables• Distribute
responsibili,esforanalysisandauthorshipandbeginwri,ngsec,ons
• AuthorISAreport
• FinaliseISAandsharewithauthorsandPiNsteeringgroup
• Finalisedatabaseandextractspeciesdatatoappendix
• FinaliseportalfolderwithallISAmaterialsused
Dayes5matesforteam
5dayslocalstaff5daysISAcoordinator
4daysSpeciesProgramme5daysISAcoordinator5dayslocalstaff
5daysISAcoordinator5dayslocalstaff
2dayslocalstaff5daysISAcoordinator
Table 6: IsA digital workflow
ISAworkflowtask Digitaltoolsandapproaches
Buildalistofbiodiversity(species,subspecies,agriculturallandraces)withknownusesthathaverangesoverlappingwiththestudyarea
Crowdsourcingusedata,datamining,linkingtoGBIFandRedListspaBaldata
IdenBfyecologicalunitswithinthestudyareathatsupportspeciesontheabovelistandassignspeciestohabitats
DrawuponexisBngdataminingtoolsforlinkingspeciestohabitatdata
Break out informaBon on uses of biodiversity by PiNdomains
Crowdsourcing to clean data and idenBfy use categoriesfromdata, linkingacrossdatabasesstoringusedata (e.g.,Kew Economic Botany database). Link to datasets onnutriBonandfoodcomposiBon.
Find informaBon on conservaBon status of species andecosystems, known threats that affect species found instudyarea,andfactorsthatshapetheiruse
No specific tools to be developed, but potenBal tocrowdsource data on conservaBon and link to data onagriculturalspeciesandlandracesthatarenotcoveredbytheSIS
species use, data mining tools for pulling information from diverse documents and databases, and software to link databases across different data standards. These tools will not be available for initial PiN pilot assessments. Digital tools will help with the ISA tasks described in table 6 below.

PiN WORKING PAPER
PiN LANDSCAPE ASSESSMENT PHASE 1 | 21
COmPLEmENTARITy OF PiN IsA wITH IuCN sITuATION ANALysIs
During early methodological workshops, it was suggested that PiN adopt the term ‘situation analysis’, as it reflects a set of IUCN project methodologies already in use.6 The IUCN situation analysis (IUCN SA) can take two paths, re-sulting in either a basic or a comprehensive situation anal-ysis. While the basic IUCN SA aims to create an overview of the context, strategy and partners, the comprehensive situation analysis draws on a more rigorous set of sustain-ability assessment procedures and is explicit about use of its humans and ecosystems framework. It calls on the project team to establish social, economic and ecological baselines, and requires the team to choose indicators and performance criteria to track status and trends in ecosys-tems and human wellbeing. Figure 7 illustrates the method-ological workflow of a comprehensive IUCN SA.7
The choice of generalized social, ecological and economic indicators and performance criteria is beyond the scope of PiN, but may be complementary to ISA methodology de-pending on the needs of the project team. Reference exam-
Figure 7: Representation of IuCN comprehensive situation analysis methodology
6 The document describing the IUCN Situation Analysis approach can be found at the following link for the basic SA: http://cmsdata.iucn.org/downloads/approach_and_method.pdf. For the comprehensive SA (PPT learning module): http://cmsdata.iucn.org/downloads/resource_kit_c_eng.pdf. In order to avoid confusion, PiN phase 1 will be referred to in this docu-ment as the interdisciplinary situation analysis (SA), while the accepted IUCN situation analysis approach outlined in the linked documents is understood to comprise a set of objectives and methodological frameworks to be considered in parallel.
7 http://cmsdata.iucn.org/downloads/resource_kit_c_eng.pdf
ples of a write-up of a brief basic SA can be found García et al. (2010), while a comprehensive IUCN SA methodology can be found in the IUCN SA on East and Southeast Asian intertidal habitats (MacKinnon et al. 2012).
Whether the PiN ISA develops as an ‘add on’ to the tradi-tional IUCN SA approach, becomes integrated within ex-isting assessment methodologies across IUCN projects, or evolves into a set of stand-alone tools or modules is an important point for future discussion. For now, the scope and objectives of the PiN ISA differ from those of the ac-cepted IUCN SA approach. Secondary data requirements differ significantly in that PiN aims to assess a set of vari-ables that shape potential local uses of nature. For PiN landscape assessments, it is clear that specific PiN ISA approaches will replace the existing IUCN SA approaches as currently packaged.
LImITATIONs ANd mOvINg FORwARd
We have only made passing reference to how PiN will as-sess peoples’ use of water as part of their interrelationships with nature. Work on water will be integrated into the ISA workflow as informed by a PiN ‘water module’, which is to be developed in the future.
Access and governance have been used largely inter-changeably thus far, but it is recognised that further input is needed on this. PiN ISAs performed in the near future may continue to follow a tighter focus on access as defined above and in Davidson-Hunt et al. 2016, but also see Suich et al. (2016b). Input on governance may be provided by those working on the Natural Resource Governance Frame-work, a complementary CEESP knowledge basket.

PiN WORKING PAPER
22 | PiN LANDSCAPE ASSESSMENT PHASE 1
sOuRCEs CITEd
Deutsch, N., Boe, K., Davidson-Hunt, I.J. and Smith, K. (2016b). ‘A data module for PiN’. In: I.J. Davidson-Hunt, H. Suich, S.S. Meijer and N. Olsen (eds) People in Nature: valu-ing the diversity of interrelationships between people and nature. Gland: IUCN.
García, N., Cuttelod, A. and Abdul Malak, D. (eds.) (2010). The Status and Distribution of Freshwater Biodiversity in Northern Africa. Gland, Switzerland, Cambridge, UK, and Malaga, Spain: IUCN.
Idrobo, C.J., Asselin, H., Davidson-Hunt, I.J., McConney, P., Meijer, S.S., Olsen, N. and Suich, H. (2016). ‘Mixed meth-odology for PiN landscape assessments’. In: I.J. David-son-Hunt, H. Suich, S.S. Meijer and N. Olsen (eds) People in Nature: valuing the diversity of interrelationships between people and nature. Gland: IUCN.
MacKinnon, J., Verkuil, Y.I. and Murray, N. (2012). IUCN situation analysis on East and Southeast Asian intertidal habitats, with particular reference to the Yellow Sea (includ-ing the Bohai Sea). Occasional Paper of the IUCN Species Survival Commission No. 47. Gland, Switzerland and Cam-bridge, UK: IUCN.
Myers, S.S., Gaffikin, L., Golden, C.D., Ostfeld, R.S., Red-ford, K.H., Ricketts, T.H., Turner, W.R. and Osofsky, S.A. (2013). Human Health Impacts of Ecosystem Alteration. Proceedings of the National Academy of Sciences 110 (47): 18753–60. doi:10.1073/pnas.1218656110.
Springate-Baginski, O., Allen, D. and Darwall, W.R.T. (eds.) 2009. An Integrated Wetland Assessment Toolkit: A guide to good practice. Gland, Switzerland and Cambridge, UK: IUCN.
Suich, H., Idrobo, C.J., Neba, G.A. and Tyrrell, T. (2016a). ‘Understanding the interrelationships between nature, live-lihoods, wellbeing and poverty’. In: I.J. Davidson-Hunt, H. Suich, S.S. Meijer and N. Olsen (eds) People in Nature: valu-ing the diversity of interrelationships between people and nature. Gland: IUCN.
Suich, H., Davidson-Hunt, I.J., Meijer, S.S., Olsen, N. and Oviedo, G. (2016b). ‘The next steps for People in Nature’. In: I.J. Davidson-Hunt, H. Suich, S.S. Meijer and N. Olsen (eds) People in Nature: Valuing the diversity of interrelation-ships between people and nature. Gland: IUCN.


IUCN is a membership Union composed of both government and civil society organisations. It harnesses the experience, resources and reach of its 1,300 Member organisations and the input of some 15,000 experts. IUCN is the global authority on the status of the natural world and the measures needed to safeguard it.
CEESP, the IUCN Commission on Environmental, Economic and Social Policy, is an inter-disciplinary network of profes-sionals whose mission is to act as a source of advice on the environmental, economic, social and cultural factors that affect natural resources and biological diversity and to provide guidance and support towards effective policies and practices in environmental conservation and sustainable development.
The People in Nature (PiN) Knowledge Basket is an initiative established by the IUCN programme of work and whose development is led by a steering group composed of representatives from CEESP, IUCN secretariat and IUCN members. As described in the 2017-2020 CEESP mandate, PiN will promote learning to improve our understanding of how nature contributes to local livelihoods and well-being. It will focus on material use while recognising that use is embedded within worldviews that include deep-seated cultural norms, values, and understandings. It will also consider symbolic interrela-tionships with nature expressed through cultural narratives, language, and traditions, including diverse understandings of sacred and divine aspects of nature and our relationship with natural resources. This work will contribute to valuing and conserving nature through understanding the value of nature to human societies.