PIMCO Funds CommodityRealReturn Strategy Fund Portfolio Holdings 731
PIMCO Europe Ltd.
February 2015
For professional use only

1
Important information
For professional use only
The services and products described in this communication are only available to professional clients as defined in the Financial Conduct Authority's Handbook.
This communication is not a public offer and individual investors should not rely on this document. Opinion and estimates offered constitute our judgment and are subject to
change without notice, as are statements of financial market trends, which are based on current market conditions. We believe the information provided here is reliable, but
do not warrant its accuracy or completeness.
PIMCO Europe Ltd (Company No. 2604517), PIMCO Europe Ltd Amsterdam Branch (Company No. 24319743), and PIMCO Europe Ltd – Italy (Company No. 07533910969) are
authorised and regulated by the Financial Conduct Authority (25 The North Colonnade, Canary Wharf, London E14 5HS) in the UK. The Amsterdam and Italy Branches are
additionally regulated by the AFM and CONSOB in accordance with Article 27 of the Italian Consolidated Financial Act, respectively. PIMCO Europe Ltd services and products
are available only to professional clients as defined in the Financial Conduct Authority’s Handbook and are not available to individual investors, who should not rely on this
communication. | PIMCO Deutschland GmbH (Company No. 192083, Seidlstr. 24-24a, 80335 Munich, Germany) is authorised and regulated by the German Federal Financial
Supervisory Authority (BaFin) (Marie- Curie-Str. 24-28, 60439 Frankfurt am Main) in Germany in accordance with Section 32 of the German Banking Act (KWG). The services
and products provided by PIMCO Deutschland GmbH are available only to professional clients as defined in Section 31a para. 2 German Securities Trading Act (WpHG).
They are not available to individual investors, who should not rely on this communication.
(Presented in the UK)

2
Biographical information
Mike Amey
Mr. Amey is a managing director and portfolio manager in the London office. He is
responsible for sterling portfolios, the European insurance (ex Germany) and the
European LDI (liability-driven investing) portfolio management groups. Prior to joining
PIMCO in 2003, he was head of U.K. fixed income at Rothschild Asset Management and
after their merger, at Insight Investment. Prior to joining Rothschild in 1994, Mr. Amey
spent two years tutoring in the Department of Economics at the University of Durham. He
has 21 years of investment experience and holds undergraduate and master's degrees in
corporate and international finance from the University of Durham. Mr. Amey is also a
member of the U.K. Society of Investment Professionals.

3
Government bond yields at historic lows
As of 20 January 2015
SOURCE: Bloomberg, Bank of England
The high interest rates of the 70s and 80s, not today’s low yields, were the aberration
3cs_intl_outlook_02
0
2
4
6
8
10
12
14
16
1713 1763 1813 1863 1913 1963 2013
Yie
ld (
%)
Three centuries of long-term yields in the UK
4
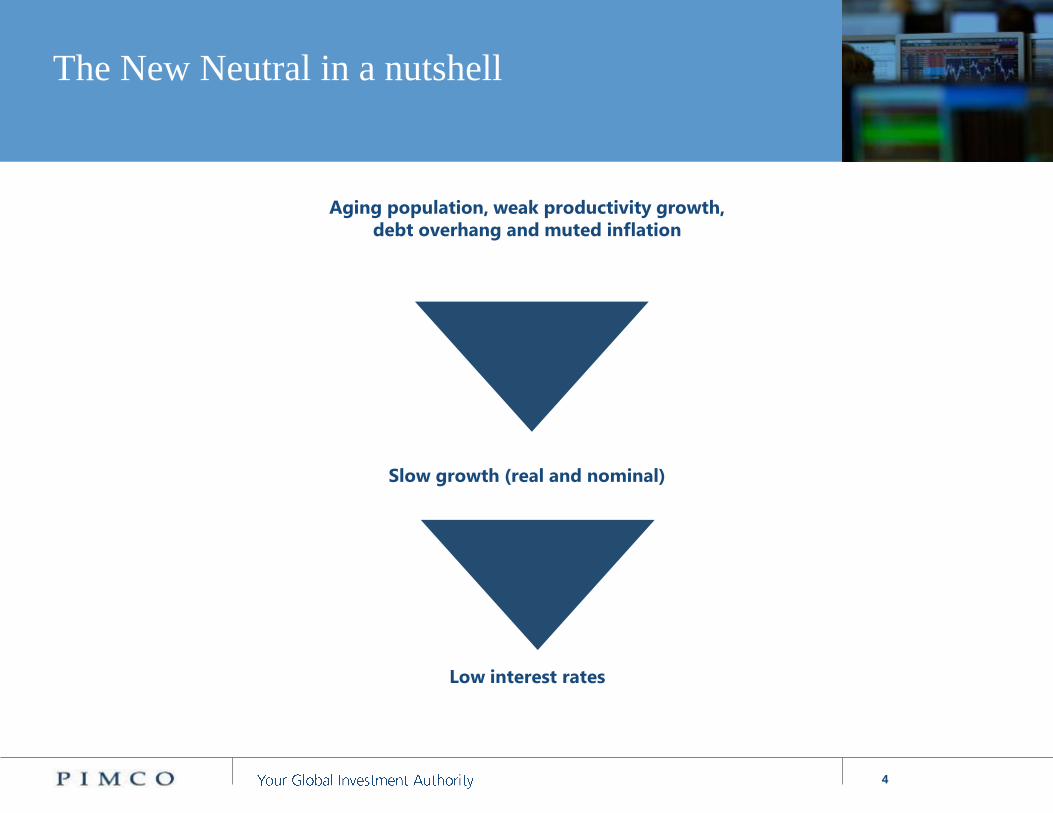
The New Neutral in a nutshell
Aging population, weak productivity growth,
debt overhang and muted inflation
Slow growth (real and nominal)
Low interest rates
5
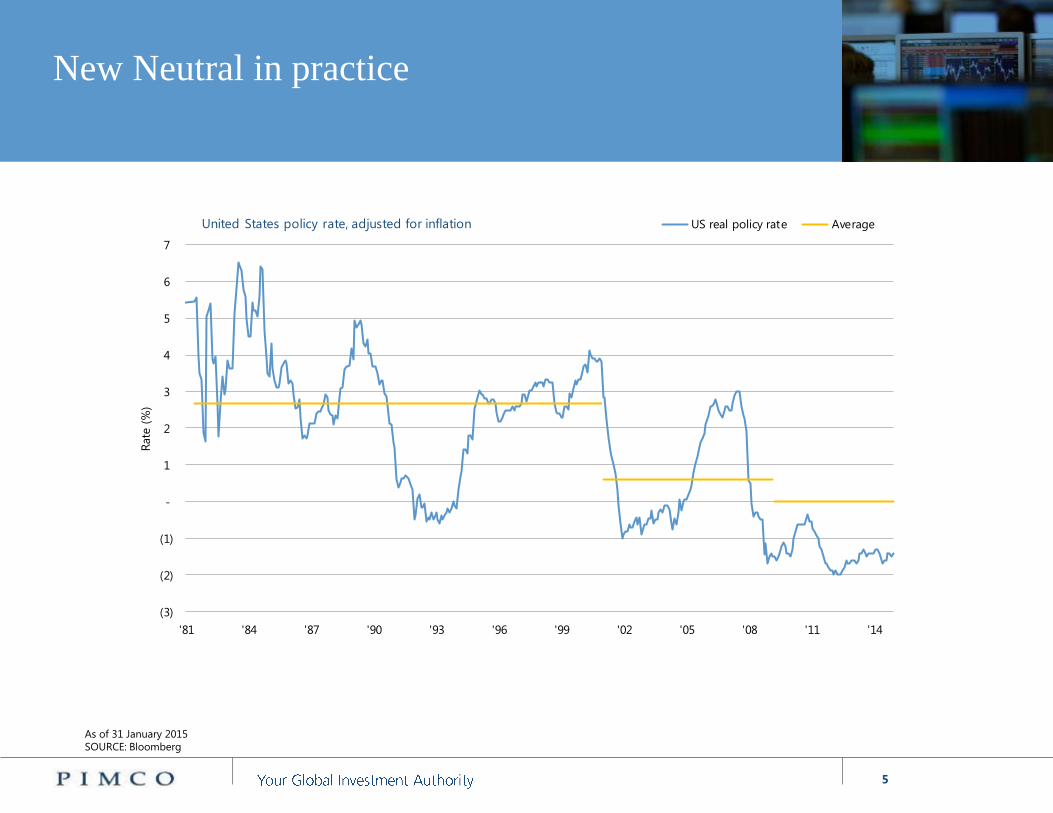
New Neutral in practice
As of 31 January 2015
SOURCE: Bloomberg
2cs_euro_outlook_02
(3)
(2)
(1)
-
1
2
3
4
5
6
7
'81 '84 '87 '90 '93 '96 '99 '02 '05 '08 '11 '14
Rate
(%
)
United States policy rate, adjusted for inflation US real policy rate Average
6
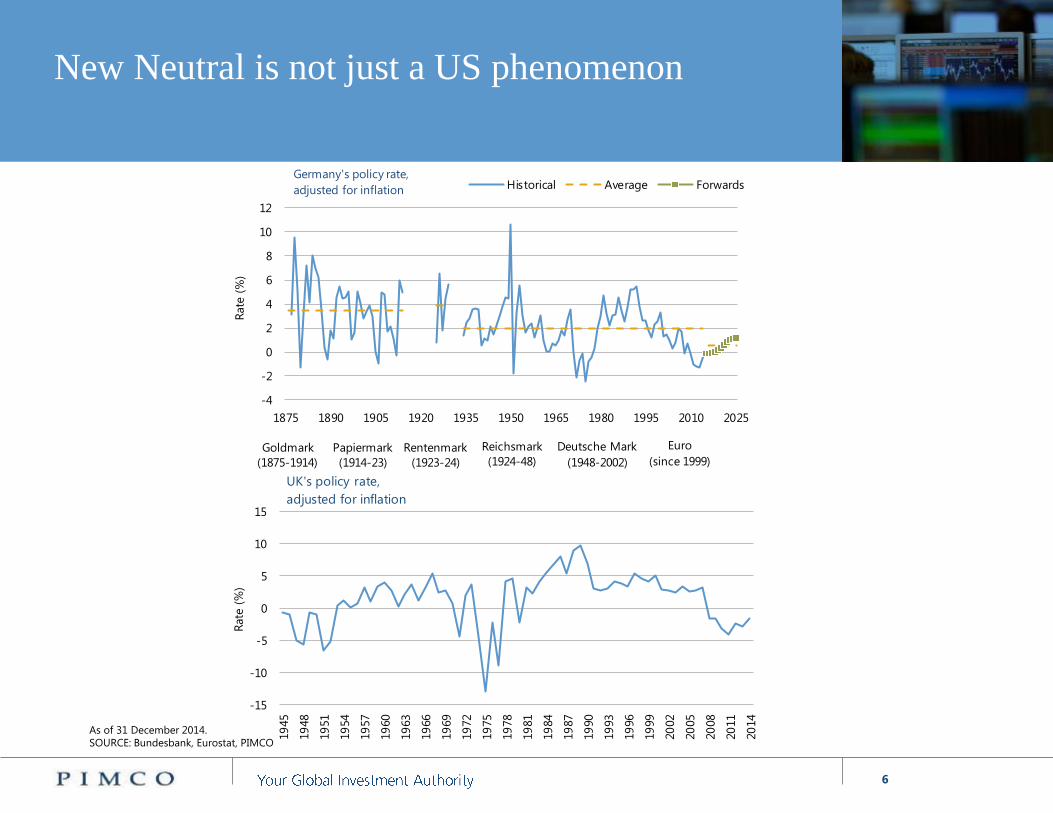
As of 31 December 2014.
SOURCE: Bundesbank, Eurostat, PIMCO
New Neutral is not just a US phenomenon
-15
-10
-5
0
5
10
15
19
45
19
48
19
51
19
54
19
57
19
60
19
63
19
66
19
69
19
72
19
75
19
78
19
81
19
84
19
87
19
90
19
93
19
96
19
99
20
02
20
05
20
08
20
11
20
14
Rate
(%
)
UK's policy rate,
adjusted for inflation
-4
-2
0
2
4
6
8
10
12
1875 1890 1905 1920 1935 1950 1965 1980 1995 2010 2025
Rate
(%
)
Germany's policy rate,
adjusted for inflation Historical Average Forwards
Goldmark
(1875-1914)
Papiermark
(1914-23)
Rentenmark
(1923-24)
Reichsmark
(1924-48)
Deutsche Mark
(1948-2002)
Euro
(since 1999)

7
PIMCO’s cyclical outlook: increased divergence
ahead
* PIMCO Forecast as of 31 December 2014
BRIM is Brazil, Russia, India, Mexico. Refer to appendix for further outlook information.
Real GDP and inflation projections represent PIMCO’s forecasts for the four quarters ending Q4 2015
4cs_intl_outlook_01
U.S.
3%
GDP
1%
Inflation
BRIM
2%
GDP
5.75%
Inflation
U.K.
2.75%
GDP
1.25%
Inflation
Eurozone
1%
GDP
0.75%
Inflation
China
6.5%
GDP
2%
Inflation
Japan
1.5%
GDP
1%
Inflation
8
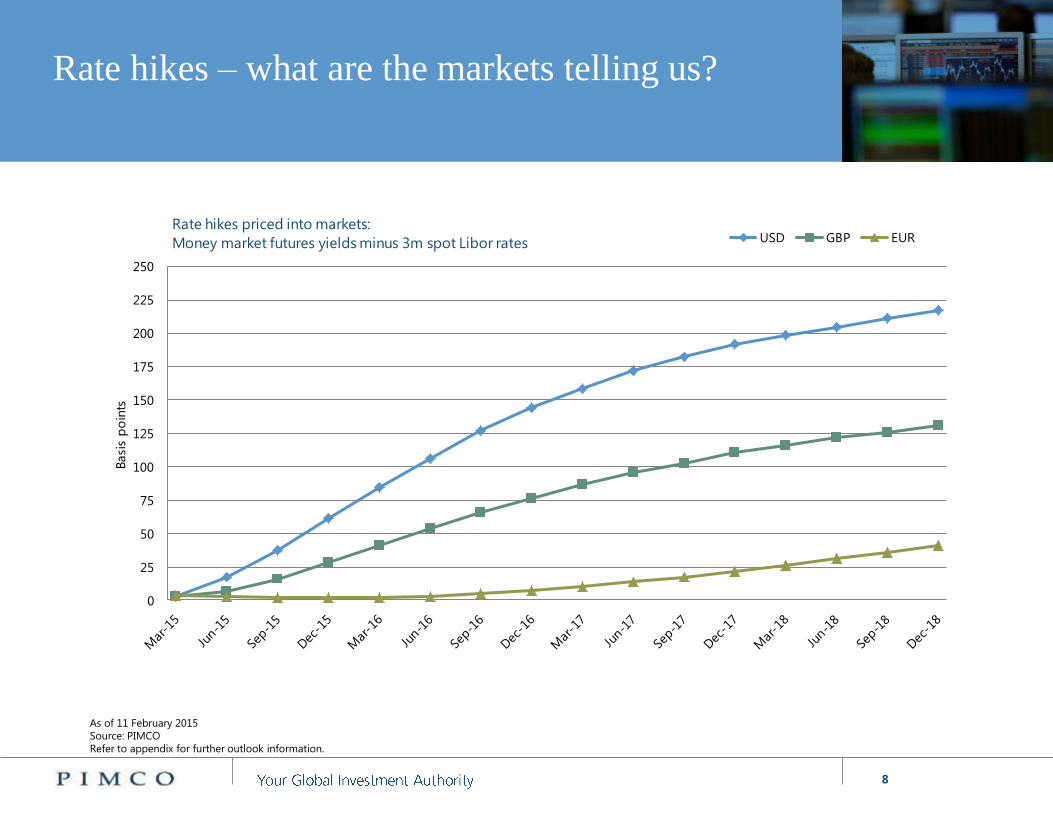
Rate hikes – what are the markets telling us?
As of 11 February 2015
Source: PIMCO
Refer to appendix for further outlook information.
0
25
50
75
100
125
150
175
200
225
250
Basi
s p
oin
ts
Rate hikes priced into markets:
Money market futures yields minus 3m spot Libor rates USD GBP EUR

9
Low interest rates plague the insurance industry
Source: Spence Johnson “IAM European Insurance Asset Management 2013”. For illustrative purposes only
10
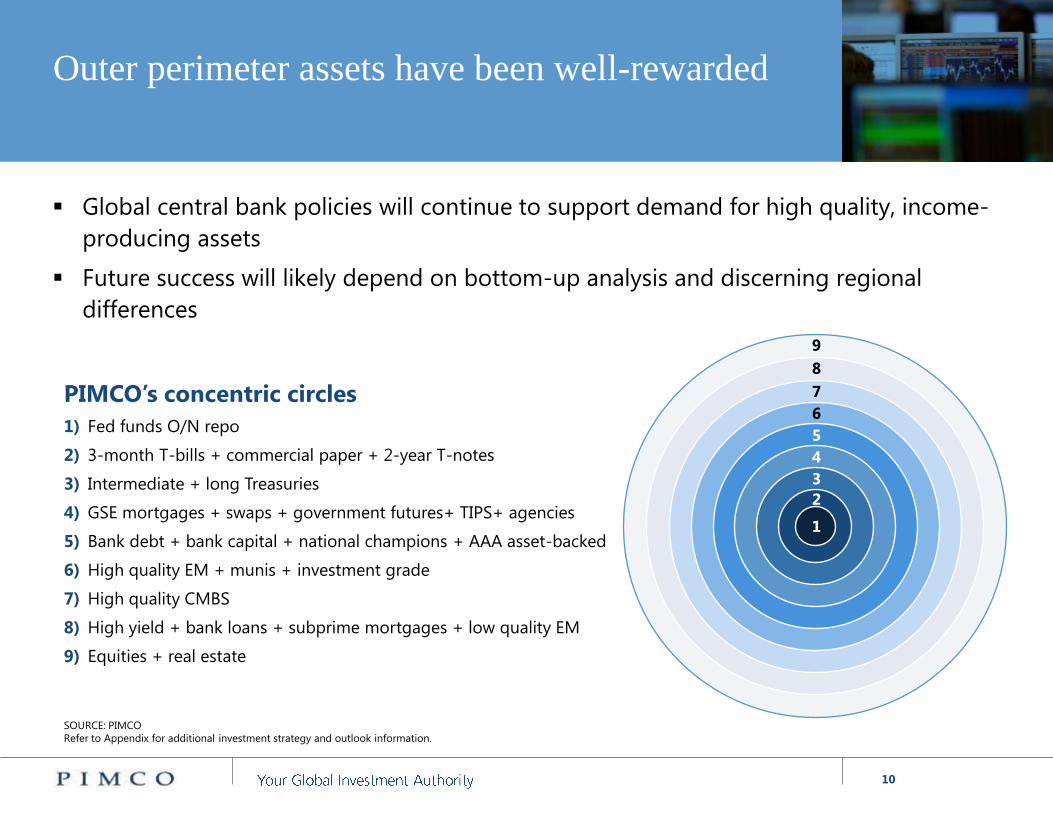
Outer perimeter assets have been well-rewarded
Global central bank policies will continue to support demand for high quality, income-
producing assets
Future success will likely depend on bottom-up analysis and discerning regional
differences
9
8
7
6
5
4
3
2
1
PIMCO’s concentric circles
1) Fed funds O/N repo
2) 3-month T-bills + commercial paper + 2-year T-notes
3) Intermediate + long Treasuries
4) GSE mortgages + swaps + government futures+ TIPS+ agencies
5) Bank debt + bank capital + national champions + AAA asset-backed
6) High quality EM + munis + investment grade
7) High quality CMBS
8) High yield + bank loans + subprime mortgages + low quality EM
9) Equities + real estate
SOURCE: PIMCO
Refer to Appendix for additional investment strategy and outlook information.
11
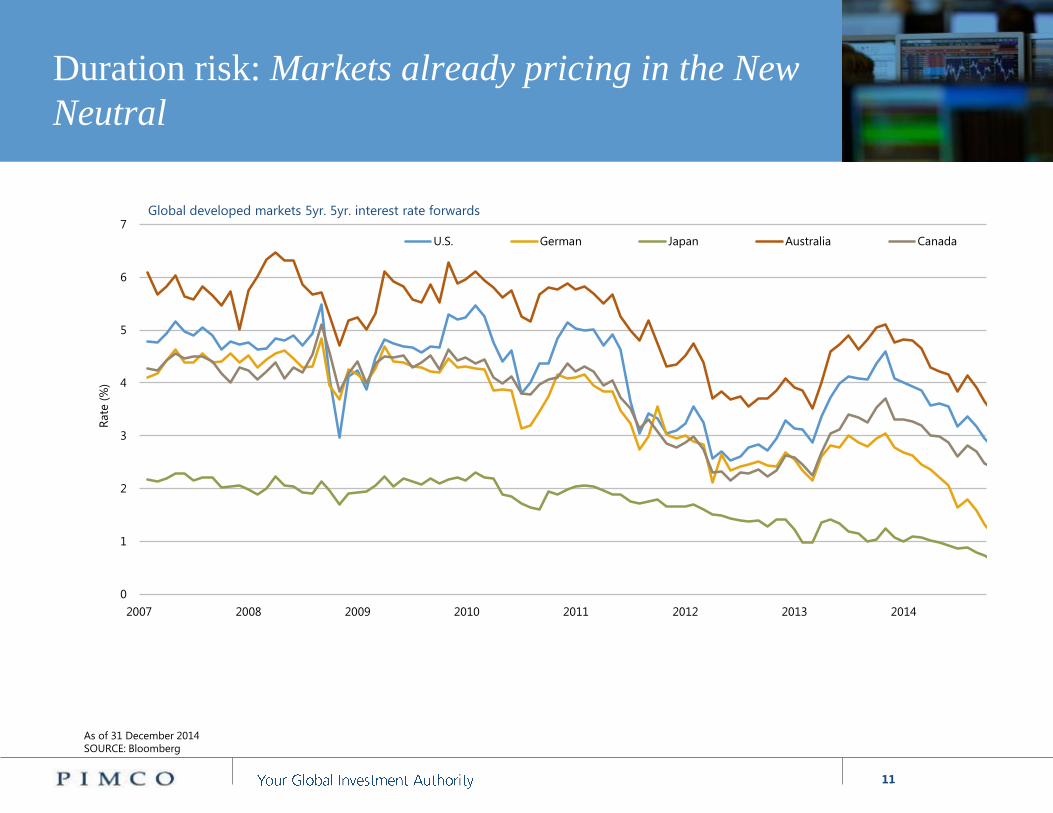
Duration risk: Markets already pricing in the New
Neutral
mk_4cs_income_review_02
As of 31 December 2014
SOURCE: Bloomberg
0
1
2
3
4
5
6
7
2007 2008 2009 2010 2011 2012 2013 2014
Rate
(%
)
U.S. German Japan Australia Canada
Global developed markets 5yr. 5yr. interest rate forwards
12
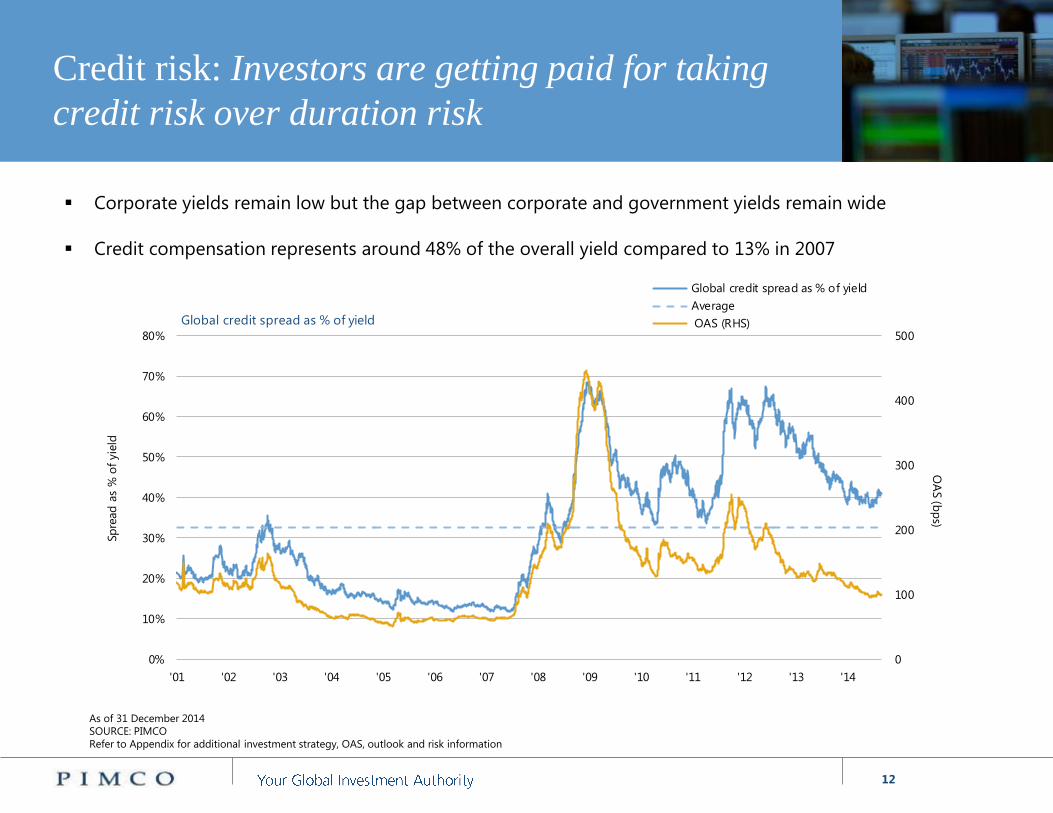
Credit risk: Investors are getting paid for taking
credit risk over duration risk
Corporate yields remain low but the gap between corporate and government yields remain wide
Credit compensation represents around 48% of the overall yield compared to 13% in 2007
mk_GIGC_outlook_10
As of 31 December 2014
SOURCE: PIMCO
Refer to Appendix for additional investment strategy, OAS, outlook and risk information
0
100
200
300
400
500
0%
10%
20%
30%
40%
50%
60%
70%
80%
'01 '02 '03 '04 '05 '06 '07 '08 '09 '10 '11 '12 '13 '14
OA
S (b
ps)
Sp
read
as
% o
f yie
ld
Global credit spread as % of yield
Global credit spread as % of yield
Average
OAS (RHS)
13
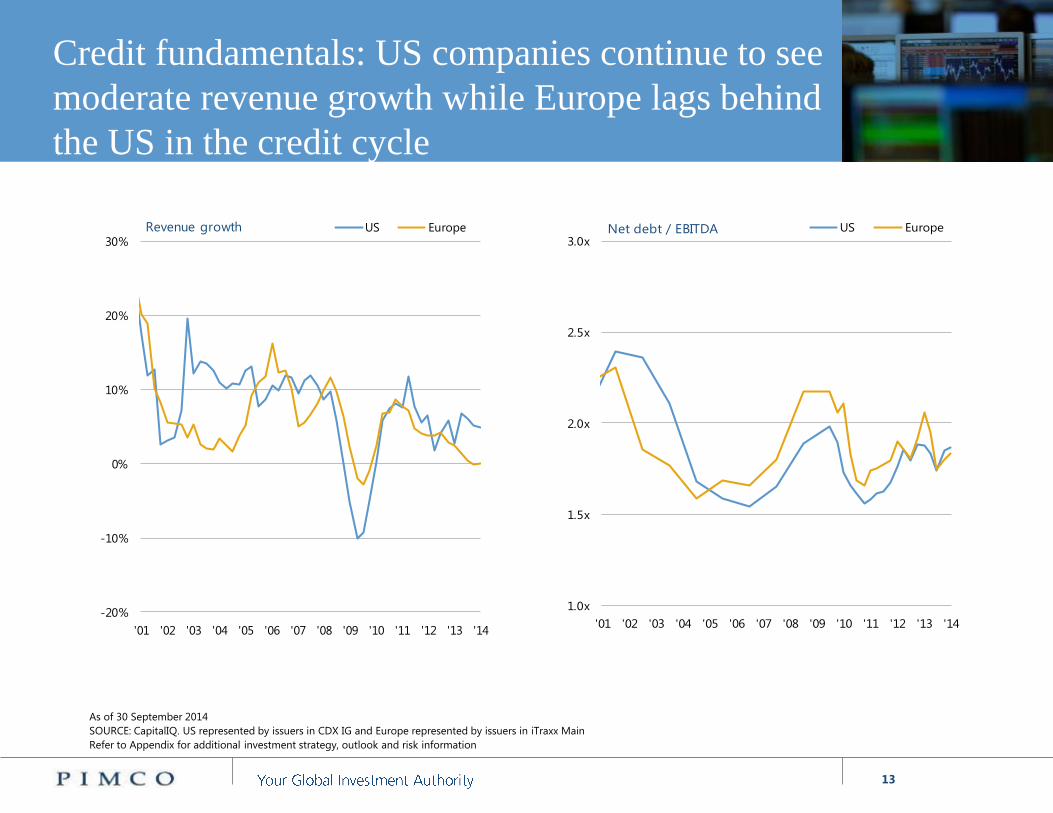
Credit fundamentals: US companies continue to see
moderate revenue growth while Europe lags behind
the US in the credit cycle
As of 30 September 2014
SOURCE: CapitalIQ. US represented by issuers in CDX IG and Europe represented by issuers in iTraxx Main
Refer to Appendix for additional investment strategy, outlook and risk information
mk_GIGC_outlook_04
-20%
-10%
0%
10%
20%
30%
'01 '02 '03 '04 '05 '06 '07 '08 '09 '10 '11 '12 '13 '14
Revenue growth US Europe
1.0x
1.5x
2.0x
2.5x
3.0x
'01 '02 '03 '04 '05 '06 '07 '08 '09 '10 '11 '12 '13 '14
Net debt / EBITDA US Europe

14
0
100
200
300
400
500
600
'97 '98 '99 '00 '01 '02 '03 '04 '05 '06 '07 '08 '09 '10 '11 '12 '13 '14 '15
OA
S (
bp
s)
Barclays Long U.S. Corporate OAS Sterling Non-Gilts 10+
Barclays Long U.S. Corporate Average OAS Sterling Non-Gilts 10+ Average OAS
Long-dated spreads have become more attractive
2cs_euro_outlook_03
As of January 2015. SOURCE: PIMCO
Refer to Appendix for further outlook, OAS, investment strategy and isk information.
15
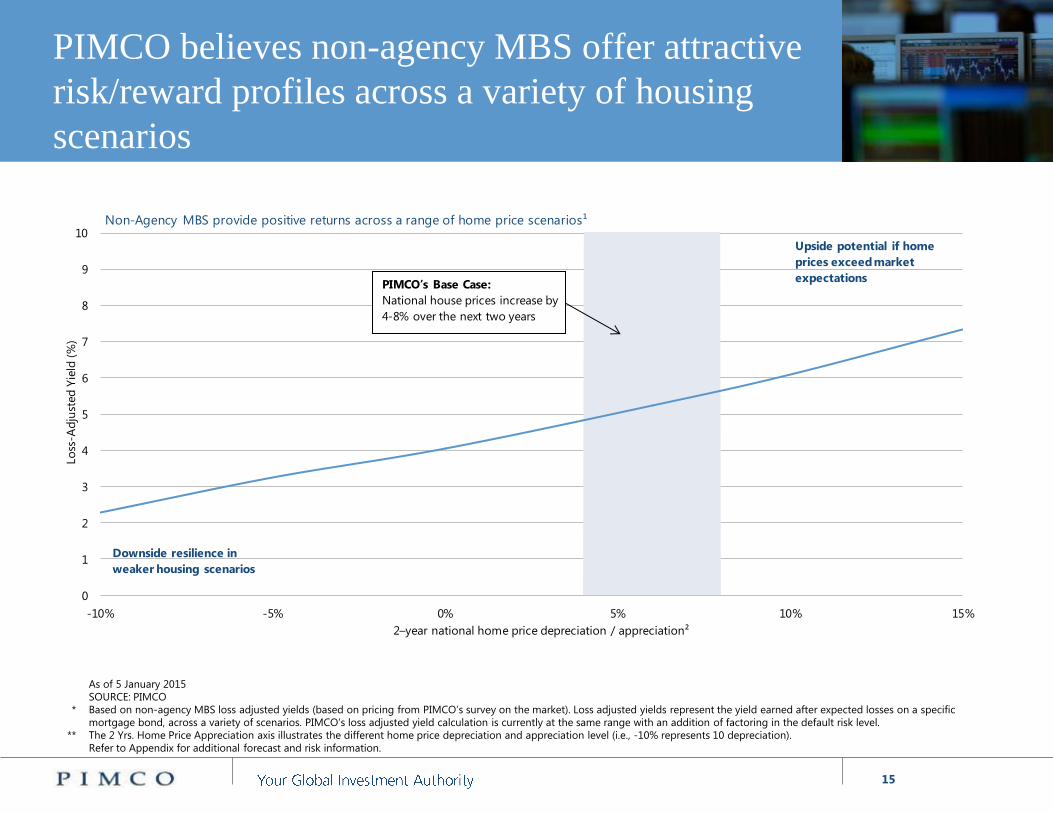
PIMCO believes non-agency MBS offer attractive
risk/reward profiles across a variety of housing
scenarios
As of 5 January 2015
SOURCE: PIMCO
* Based on non-agency MBS loss adjusted yields (based on pricing from PIMCO’s survey on the market). Loss adjusted yields represent the yield earned after expected losses on a specific
mortgage bond, across a variety of scenarios. PIMCO’s loss adjusted yield calculation is currently at the same range with an addition of factoring in the default risk level.
** The 2 Yrs. Home Price Appreciation axis illustrates the different home price depreciation and appreciation level (i.e., -10% represents 10 depreciation).
Refer to Appendix for additional forecast and risk information.
0
1
2
3
4
5
6
7
8
9
10
-10% -5% 0% 5% 10% 15%
Lo
ss-A
dju
sted
Yie
ld (
%)
2–year national home price depreciation / appreciation²
Non-Agency MBS provide positive returns across a range of home price scenarios¹
PIMCO’s Base Case:
National house prices increase by
4-8% over the next two years
Upside potential if home
prices exceed market
expectations
Downside resilience in
weaker housing scenarios
4cs_DI_outlook_03
16
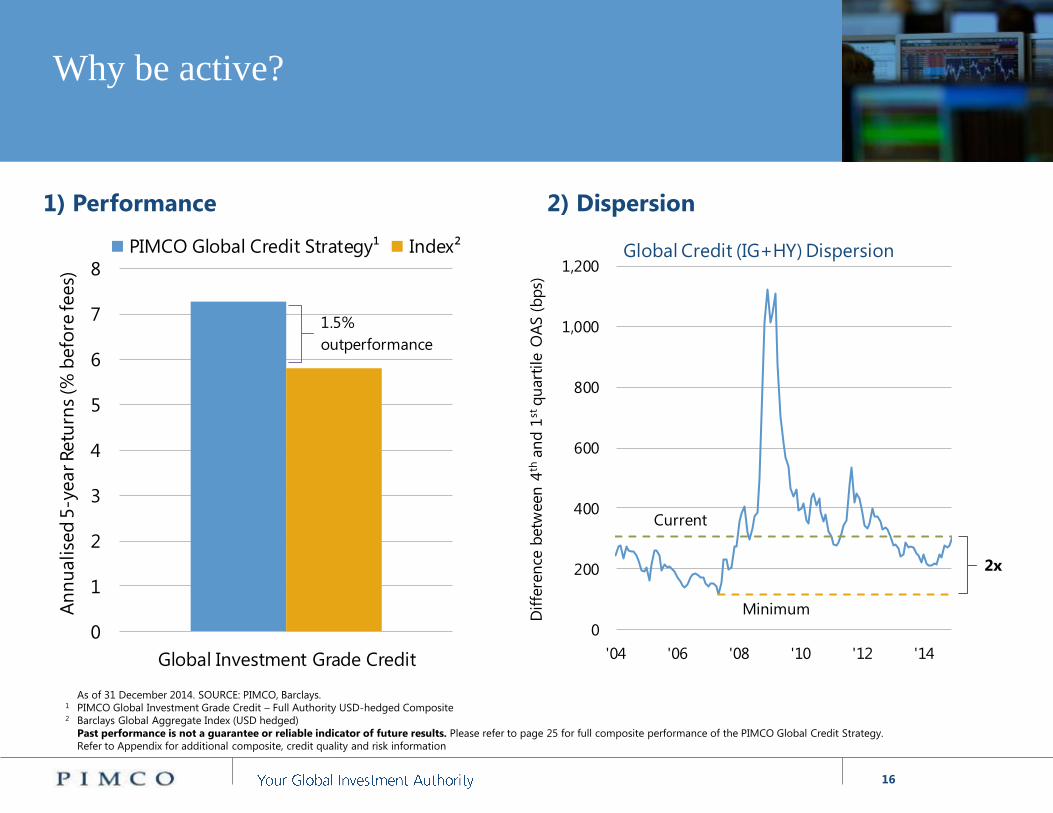
Why be active?
As of 31 December 2014. SOURCE: PIMCO, Barclays.
1 PIMCO Global Investment Grade Credit – Full Authority USD-hedged Composite 2 Barclays Global Aggregate Index (USD hedged)
Past performance is not a guarantee or reliable indicator of future results. Please refer to page 25 for full composite performance of the PIMCO Global Credit Strategy.
Refer to Appendix for additional composite, credit quality and risk information
2) Dispersion
0
200
400
600
800
1,000
1,200
'04 '06 '08 '10 '12 '14
Dif
fere
nce
betw
een
4th
an
d 1
stq
uart
ile O
AS
(b
ps)
Global Credit (IG+HY) Dispersion
Current
Minimum
2x
1) Performance
0
1
2
3
4
5
6
7
8
Global Investment Grade Credit
An
nu
alise
d 5
-year Retu
rns
(% b
efo
re fees)
PIMCO Global Credit Strategy¹ Index²
1.5%
outperformance

17
Five reasons to favour fixed income management
Potential advantages of active management
1. Differences create opportunities
2. Avoidance of structural biases created by
market indices
3. New issuance can offer potential
for price appreciation
4. Independent research and analysis
can inform valuation
5. Playing defense can potentially boost
performance
Investment considerations
1. Investors’ objectives differ meaningfully
2. Indices’ weightings based on stock of debt not
fundamentals
3. Importance of new issuance
4. Purchases and sales are negotiations
5. Fixed income returns are skewed to the left
Refer to Appendix for additional investment strategy and risk information.

18
Appendix
PERFORMANCE AND FEES
Past performance is not a guarantee or a reliable indicator of future results. The “gross of fees” performance figures above are presented before management fees and custodial fees (in
the case of both separate accounts and mutual funds), but do reflect commissions, other expenses and reinvestment of earnings. The “net of fees" performance figures reflect the deduction of
actual investment advisory fees but do not reflect the deduction of custodial fees.
ALPHA
Alpha represents a portfolio's risk-adjusted performance (the difference between a portfolio's actual returns and the expected performance, given the portfolio's level of risk as measured by
beta). It is possible that during any timeframe, the alpha of a portfolio can be positive while the actual total return performance of the portfolio is negative.
CHARTS
Performance results for certain charts and graphs may be limited by date ranges specified on those charts and graphs; different time periods may produce different results.
CREDIT QUALITY
The credit quality of a particular security or group of securities does not ensure the stability or safety of an overall portfolio. The quality ratings of individual issues/issuers are provided to
indicate the credit-worthiness of such issues/issuer and generally range from AAA, Aaa, or AAA (highest) to D, C, or D (lowest) for S&P, Moody’s, and Fitch respectively.
CORRELATION
The correlation of various indices or securities against one another or against inflation is based upon data over a certain time period. These correlations may vary substantially in the future or
over different time periods that can result in greater volatility.
CURRENCY
Currency rates in non-U.S. countries may fluctuate significantly over short periods of time and may reduce the returns of a portfolio.
DEFAULT RATE
The Investment Grade default percentages are calculated using cost of the defaulted security over the market values of PIMCO GIS Global Investment Credit Fund on the day prior to the default
date. For the purposes of this analysis, a security is considered defaulted if it was held in the Portfolio on the securities reported default date. The High Yield defaults are measured by the sum
of the cost value of defaulted issues divided by the respective market value of the representative account in the month in which the default occurred.
DIVERSIFICATION
Diversification does not ensure against losses.
GIGC_appendix_01_euro

19
Appendix
Unless otherwise stated in the prospectus or in the relevant key investor information document, the Fund referenced in this material is not managed against a particular benchmark or index,
and any reference to a particular benchmark or index in this material is made solely for risk or performance comparison purposes. This material may contain additional information, not explicit
in the prospectus, on how the Fund or strategy is currently managed. Such information is current as at the date of the presentation and may be subject to change without notice.
In accordance with the UCITS regulations and subject to any investment restrictions outlined in the Fund’s prospectus, the Fund may invest over 35% of net assets in different transferable
securities and money market instruments issued or guaranteed by any of the following: OECD Governments (provided the relevant issues are investment grade), Government of Singapore,
European Investment Bank, European Bank for Reconstruction and Development, International Finance Corporation, International Monetary Fund, Euratom, The Asian Development Bank,
European Central Bank, Council of Europe, Eurofima, African Development Bank, International Bank for Reconstruction and Development (The World Bank), The Inter American Development
Bank, European Union, Federal National Mortgage Association (Fannie Mae), Federal Home Loan Mortgage Corporation (Freddie Mac), Government National Mortgage Association (Ginnie
Mae), Student Loan Marketing Association (Sallie Mae), Federal Home Loan Bank, Federal Farm Credit Bank, Tennessee Valley Authority, Straight-A Funding LLC.
HYPOTHETICAL EXAMPLE
No representation is being made that any account, product, or strategy will or is likely to achieve profits, losses, or results similar to those shown. Hypothetical or simulated performance
results have several inherent limitations. Unlike an actual performance record, simulated results do not represent actual performance and are generally prepared with the benefit of hindsight.
There are frequently sharp differences between simulated performance results and the actual results subsequently achieved by any particular account, product, or strategy. In addition, since
trades have not actually been executed, simulated results cannot account for the impact of certain market risks such as lack of liquidity. There are numerous other factors related to the
markets in general or the implementation of any specific investment strategy, which cannot be fully accounted for in the preparation of simulated results and all of which can adversely affect
actual results.
INVESTMENT STRATEGIES
There is no guarantee that these investment strategies will work under all market conditions and each investor should evaluate their ability to invest for a long-term especially during periods of
downturn in the market. No representation is being made that any account, product, or strategy will or is likely to achieve profits, losses, or results similar to those shown.
ISSUER
The issuers referenced are examples of issuers PIMCO considers to be well known and that may fall into the stated sectors. References to specific issuers are not intended and should not be
interpreted as recommendations to purchase, sell or hold securities of those issuers. PIMCO products and strategies may or may not include the securities of the issuers referenced and, if such
securities are included, no representation is being made that such securities will continue to be included.
OPTION ADJUSTED SPREAD (OAS)
The Option Adjusted Spread (OAS) measures the spread over a variety of possible interest rate paths. A security's OAS is the average return an investor will earn over Treasury returns, taking all
possible future interest rate scenarios into account.
OPINIONS
This material contains the current opinions of the manager and such opinions are subject to change without notice.
OUTLOOK AND STRATEGY
Statements concerning financial market trends are based on current market conditions, which will fluctuate. There is no guarantee that these investment strategies will work under all market
conditions, and each investor should evaluate their ability to invest for the long-term, especially during periods of downturn in the market. Outlook and strategies are subject to change
without notice.
Statements concerning financial market trends or portfolio strategies are based on current market conditions, which will fluctuate. There is no guarantee that these investment strategies will
work under all market conditions or are suitable for all investors and each investor should evaluate their ability to invest for the long term, especially during periods of downturn in the market.
Outlook and strategies are subject to change without notice.
PORTFOLIO STRUCTURE
Portfolio structure is subject to change without notice and may not be representative of current or future allocations.
GIGC_appendix_01_euro

20
Appendix
REPRESENTATIVE ACCOUNT
These accounts were chosen because they represent the accounts with the largest market value in their respective composites. No guarantee is being made that the structure or actual account
holdings of any account will be the same or that similar returns will be achieved. PIMCO may or may not own the securities referenced and, if such securities are owned, no representation is
being made that such securities will continue to be held.
RETURN TARGET
The return objectives presented are not a prediction or a projection of return. The portfolio manager expects to run these portfolios such that the risk factor exposures scale in accordance with
the factor multipliers in in the information shown. The return objectives scale differently from the factor multipliers due to other factors such as the timing of cash flows and differences in
guideline constraints, including leverage.
RISK
Investing in the bond market is subject to risks, including market, interest rate, issuer, credit, inflation risk, and liquidity risk. The value of most bonds and bond strategies are impacted by
changes in interest rates. Bonds and bond strategies with longer durations tend to be more sensitive and volatile than those with shorter durations; bond prices generally fall as interest rates
rise, and the current low interest rate environment increases this risk. Current reductions in bond counterparty capacity may contribute to decreased market liquidity and increased price
volatility. Bond investments may be worth more or less than the original cost when redeemed. Investing in foreign denominated and/or domiciled securities may involve heightened risk due to
currency fluctuations, and economic and political risks, which may be enhanced in emerging markets. Mortgage and asset-backed securities may be sensitive to changes in interest rates,
subject to early repayment risk, and their value may fluctuate in response to the market’s perception of issuer creditworthiness; while generally supported by some form of government or
private guarantee there is no assurance that private guarantors will meet their obligations. High-yield, lower-rated, securities involve greater risk than higher-rated securities; portfolios that
invest in them may be subject to greater levels of credit and liquidity risk than portfolios that do not. Equities may decline in value due to both real and perceived general market, economic,
and industry conditions. Derivatives may involve certain costs and risks such as liquidity, interest rate, market, credit, management and the risk that a position could not be closed when most
advantageous. Investing in derivatives could lose more than the amount invested. Diversification does not ensure against loss.
SECURITIES REFERENCED
The table above is provided for illustrative purposes only and is not intended to be a recommendation to purchase or sell such securities. PIMCO may or may not own the securities referenced
and, if such securities are owned, no representation is being made that such securities will continue to be held.
TOTAL CARRY
Total Carry refers to the assumed total return a portfolio would potentially achieve over a 3 month period provided that par rates and option adjusted spread (OAS) of each security held in the
portfolio and currency exchange rates remain unchanged. This hypothetical example also assumes no defaults are held in the account for the time period calculated. PIMCO makes no
representation that any account will achieve similar results and the statistical information provided as total carry in no way reflects the actual returns of any current PIMCO portfolio.
GIGC_appendix_01_euro

21
Appendix
INDEX DESCRIPTION
The Barclays Global Aggregate Credit Index is an unmanaged market index representative of the global credit taxable fixed income universe.
The Barclays Global Aggregate Credit (Ex-Gov't Ex-Sec) Index is an unmanaged Index that provides a broad-based measure of the global investment-grade fixed income markets. The three
major components of this index are the U.S. Aggregate, the Pan-European Aggregate, and the Asian-Pacific Aggregate Indices. This index excludes Government and Securitized Securities. The
index also includes Eurodollar and Euro-Yen corporate bonds, Canadian securities, and USD investment grade 144A securities. It is not possible to invest directly in this index.
The Barclays Credit Index is an unmanaged, market-weighted index generally representative of investment grade corporations and non-corporate entities. Prior to November 1, 2008, this index
was published by Lehman Brothers.
Barclays Credit Investment Grade Index is an unmanaged index comprised of publicly issued U.S. corporate and specified non-U.S. debentures and secured notes that meet the specified
maturity, liquidity, and quality requirements. To qualify, bonds must be SEC-registered. Prior to November 1, 2008, this index was published by Lehman Brothers.
The Barclays Euro-Aggregate Corporate Index contains fixed-rate, investment-grade Euro-denominated securities from industrial, utility and financial issuers only. Inclusion is based on the
currency of the issue, and not the domicile of the issuer. Securities in the index are also part of the Euro-Aggregate, Pan-European Aggregate and the Global Aggregate Indices. The Euro-
Aggregate Corporate Index was launched on July 1, 1998.
The Barclays U.S. Credit Index is the U.S. Credit component of the U.S. Government/Credit Index. It consists of publicly issued U.S. corporate and specific foreign debentures and secured notes
that meet the specified maturity, liquidity, and quality requirements. Prior to November 1, 2008, this index was published by Lehman Brothers.
The BofA Merrill Lynch EMU Corporate Index measures the performance of the EMU investment-grade euro-denominated corporate bond market.
It is not possible to invest in an unmanaged index.
This presentation contains the current opinions of the manager and such opinions are subject to change without notice. This presentation has been distributed for informational purposes only
and should not be considered as investment advice or a recommendation of any particular security, strategy or investment product. Information contained herein has been obtained from
sources believed to be reliable, but not guaranteed. No part of this presentation may be reproduced in any form, or referred to in any other publication, without express written permission.
PIMCO Europe Ltd (Company No. 2604517), PIMCO Europe, Ltd Amsterdam Branch (Company No. 24319743), and PIMCO Europe Ltd – Italy (Company No. 07533910969) are authorised and
regulated by the Financial Conduct Authority (25 The North Colonnade, Canary Wharf, London E14 5HS) in the UK. The Amsterdam and Italy Branches are additionally regulated by the AFM
and CONSOB in accordance with Article 27 of the Italian Consolidated Financial Act, respectively. PIMCO Europe Ltd services and products are available only to professional clients as defined
in the Financial Conduct Authority’s Handbook and are not available to individual investors, who should not rely on this communication. | PIMCO Deutschland GmbH (Company No. 192083,
Seidlstr. 24-24a, 80335 Munich, Germany) is authorised and regulated by the German Federal Financial Supervisory Authority (BaFin) (Marie- Curie-Str. 24-28, 60439 Frankfurt am Main) in
Germany in accordance with Section 32 of the German Banking Act (KWG). The services and products provided by PIMCO Deutschland GmbH are available only to professional clients as
defined in Section 31a para. 2 German Securities Trading Act (WpHG). They are not available to individual investors, who should not rely on this communication.
GIGC_appendix_01_euro
22
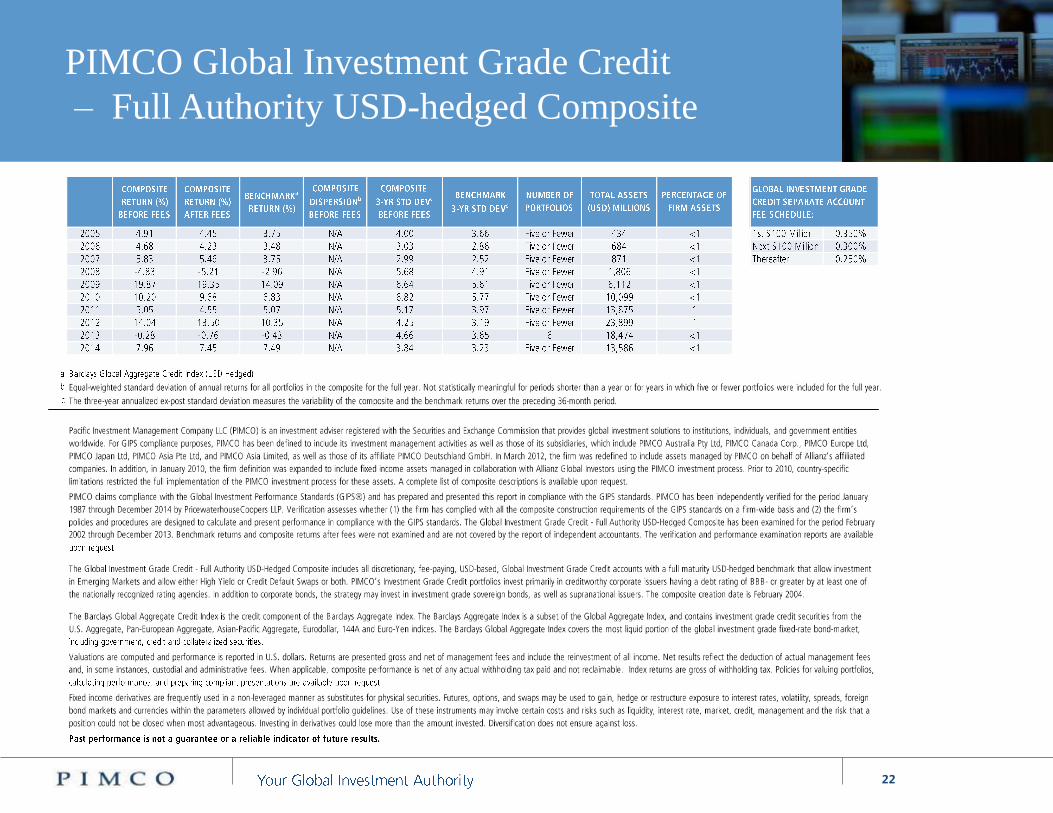
PIMCO Global Investment Grade Credit
– Full Authority USD-hedged Composite
GIPS_1051