
PIM.1.1.1.0712 PEM.1.0.1.0712 Program Big Rivers Prairie ... · 2009 2010 National Region 1 -...
19
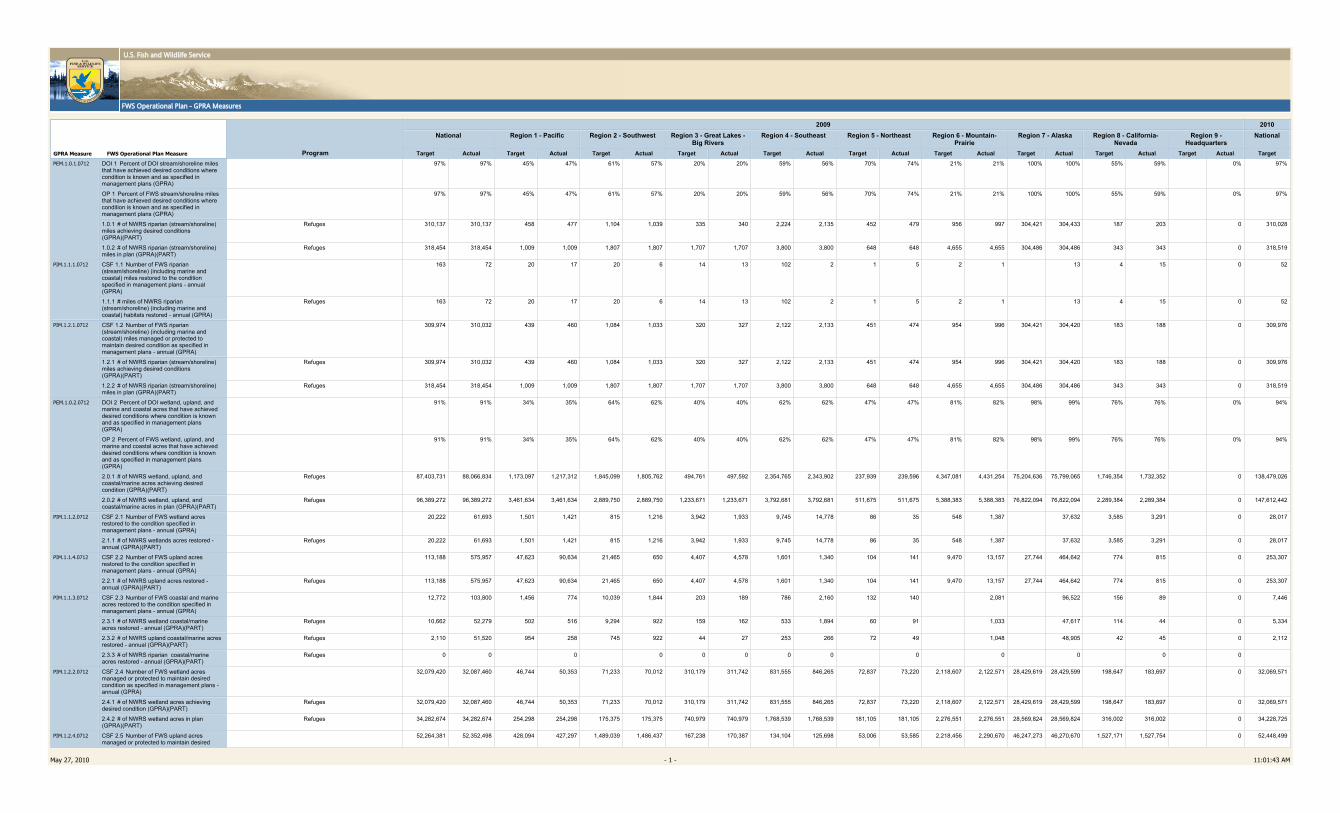
U.S. Fish and Wildlife Service FWS Operational Plan - GPRA Measures GPRA Measure FWS Operational Plan Measure Program 2009 2010 National Region 1 - Pacific Region 2 - Southwest Region 3 - Great Lakes - Big Rivers Region 4 - Southeast Region 5 - Northeast Region 6 - Mountain- Prairie Region 7 - Alaska Region 8 - California- Nevada Region 9 - Headquarters National Target Actual Target Actual Target Actual Target Actual Target Actual Target Actual Target Actual Target Actual Target Actual Target Actual Target PEM.1.0.1.0712 DOI 1 Percent of DOI stream/shoreline miles that have achieved desired conditions where condition is known and as specified in management plans (GPRA) 97% 97% 45% 47% 61% 57% 20% 20% 59% 56% 70% 74% 21% 21% 100% 100% 55% 59% 0% 97% OP 1 Percent of FWS stream/shoreline miles that have achieved desired conditions where condition is known and as specified in management plans (GPRA) 97% 97% 45% 47% 61% 57% 20% 20% 59% 56% 70% 74% 21% 21% 100% 100% 55% 59% 0% 97% 1.0.1 # of NWRS riparian (stream/shoreline) miles achieving desired conditions (GPRA)(PART) Refuges 310,137 310,137 458 477 1,104 1,039 335 340 2,224 2,135 452 479 956 997 304,421 304,433 187 203 0 310,028 1.0.2 # of NWRS riparian (stream/shoreline) miles in plan (GPRA)(PART) Refuges 318,454 318,454 1,009 1,009 1,807 1,807 1,707 1,707 3,800 3,800 648 648 4,655 4,655 304,486 304,486 343 343 0 318,519 PIM.1.1.1.0712 CSF 1.1 Number of FWS riparian (stream/shoreline) (including marine and coastal) miles restored to the condition specified in management plans - annual (GPRA) 163 72 20 17 20 6 14 13 102 2 1 5 2 1 13 4 15 0 52 1.1.1 # miles of NWRS riparian (stream/shoreline) (including marine and coastal) habitats restored - annual (GPRA) Refuges 163 72 20 17 20 6 14 13 102 2 1 5 2 1 13 4 15 0 52 PIM.1.2.1.0712 CSF 1.2 Number of FWS riparian (stream/shoreline) (including marine and coastal) miles managed or protected to maintain desired condition as specified in management plans - annual (GPRA) 309,974 310,032 439 460 1,084 1,033 320 327 2,122 2,133 451 474 954 996 304,421 304,420 183 188 0 309,976 1.2.1 # of NWRS riparian (stream/shoreline) miles achieving desired conditions (GPRA)(PART) Refuges 309,974 310,032 439 460 1,084 1,033 320 327 2,122 2,133 451 474 954 996 304,421 304,420 183 188 0 309,976 1.2.2 # of NWRS riparian (stream/shoreline) miles in plan (GPRA)(PART) Refuges 318,454 318,454 1,009 1,009 1,807 1,807 1,707 1,707 3,800 3,800 648 648 4,655 4,655 304,486 304,486 343 343 0 318,519 PEM.1.0.2.0712 DOI 2 Percent of DOI wetland, upland, and marine and coastal acres that have achieved desired conditions where condition is known and as specified in management plans (GPRA) 91% 91% 34% 35% 64% 62% 40% 40% 62% 62% 47% 47% 81% 82% 98% 99% 76% 76% 0% 94% OP 2 Percent of FWS wetland, upland, and marine and coastal acres that have achieved desired conditions where condition is known and as specified in management plans (GPRA) 91% 91% 34% 35% 64% 62% 40% 40% 62% 62% 47% 47% 81% 82% 98% 99% 76% 76% 0% 94% 2.0.1 # of NWRS wetland, upland, and coastal/marine acres achieving desired condition (GPRA)(PART) Refuges 87,403,731 88,066,834 1,173,097 1,217,312 1,845,099 1,805,762 494,761 497,592 2,354,765 2,343,902 237,939 239,596 4,347,081 4,431,254 75,204,636 75,799,065 1,746,354 1,732,352 0 138,479,026 2.0.2 # of NWRS wetland, upland, and coastal/marine acres in plan (GPRA)(PART) Refuges 96,389,272 96,389,272 3,461,634 3,461,634 2,889,750 2,889,750 1,233,671 1,233,671 3,792,681 3,792,681 511,675 511,675 5,388,383 5,388,383 76,822,094 76,822,094 2,289,384 2,289,384 0 147,612,442 PIM.1.1.2.0712 CSF 2.1 Number of FWS wetland acres restored to the condition specified in management plans - annual (GPRA) 20,222 61,693 1,501 1,421 815 1,216 3,942 1,933 9,745 14,778 86 35 548 1,387 37,632 3,585 3,291 0 28,017 2.1.1 # of NWRS wetlands acres restored - annual (GPRA)(PART) Refuges 20,222 61,693 1,501 1,421 815 1,216 3,942 1,933 9,745 14,778 86 35 548 1,387 37,632 3,585 3,291 0 28,017 PIM.1.1.4.0712 CSF 2.2 Number of FWS upland acres restored to the condition specified in management plans - annual (GPRA) 113,188 575,957 47,623 90,634 21,465 650 4,407 4,578 1,601 1,340 104 141 9,470 13,157 27,744 464,642 774 815 0 253,307 2.2.1 # of NWRS upland acres restored - annual (GPRA)(PART) Refuges 113,188 575,957 47,623 90,634 21,465 650 4,407 4,578 1,601 1,340 104 141 9,470 13,157 27,744 464,642 774 815 0 253,307 PIM.1.1.3.0712 CSF 2.3 Number of FWS coastal and marine acres restored to the condition specified in management plans - annual (GPRA) 12,772 103,800 1,456 774 10,039 1,844 203 189 786 2,160 132 140 2,081 96,522 156 89 0 7,446 2.3.1 # of NWRS wetland coastal/marine acres restored - annual (GPRA)(PART) Refuges 10,662 52,279 502 516 9,294 922 159 162 533 1,894 60 91 1,033 47,617 114 44 0 5,334 2.3.2 # of NWRS upland coastal/marine acres restored - annual (GPRA)(PART) Refuges 2,110 51,520 954 258 745 922 44 27 253 266 72 49 1,048 48,905 42 45 0 2,112 2.3.3 # of NWRS riparian coastal/marine acres restored - annual (GPRA)(PART) Refuges 0 0 0 0 0 0 0 0 0 0 0 0 0 PIM.1.2.2.0712 CSF 2.4 Number of FWS wetland acres managed or protected to maintain desired condition as specified in management plans - annual (GPRA) 32,079,420 32,087,460 46,744 50,353 71,233 70,012 310,179 311,742 831,555 846,265 72,837 73,220 2,118,607 2,122,571 28,429,619 28,429,599 198,647 183,697 0 32,069,571 2.4.1 # of NWRS wetland acres achieving desired condition (GPRA)(PART) Refuges 32,079,420 32,087,460 46,744 50,353 71,233 70,012 310,179 311,742 831,555 846,265 72,837 73,220 2,118,607 2,122,571 28,429,619 28,429,599 198,647 183,697 0 32,069,571 2.4.2 # of NWRS wetland acres in plan (GPRA)(PART) Refuges 34,282,674 34,282,674 254,298 254,298 175,375 175,375 740,979 740,979 1,768,539 1,768,539 181,105 181,105 2,276,551 2,276,551 28,569,824 28,569,824 316,002 316,002 0 34,228,725 PIM.1.2.4.0712 CSF 2.5 Number of FWS upland acres managed or protected to maintain desired 52,264,381 52,352,498 428,094 427,297 1,489,039 1,486,437 167,238 170,387 134,104 125,698 53,006 53,585 2,218,456 2,290,670 46,247,273 46,270,670 1,527,171 1,527,754 0 52,448,499 May 27, 2010 - 1 - 11:01:43 AM
Transcript of PIM.1.1.1.0712 PEM.1.0.1.0712 Program Big Rivers Prairie ... · 2009 2010 National Region 1 -...
U.S. Fish and Wildlife Service
FWS Operational Plan - GPRA Measures
GPRA Measure FWS Operational Plan Measure Program
2009 2010National Region 1 - Pacific Region 2 - Southwest Region 3 - Great Lakes -
Big RiversRegion 4 - Southeast Region 5 - Northeast Region 6 - Mountain-
PrairieRegion 7 - Alaska Region 8 - California-
NevadaRegion 9 -
HeadquartersNational
Target Actual Target Actual Target Actual Target Actual Target Actual Target Actual Target Actual Target Actual Target Actual Target Actual TargetPEM.1.0.1.0712 DOI 1 Percent of DOI stream/shoreline miles
that have achieved desired conditions where condition is known and as specified in management plans (GPRA)
97% 97% 45% 47% 61% 57% 20% 20% 59% 56% 70% 74% 21% 21% 100% 100% 55% 59% 0% 97%
OP 1 Percent of FWS stream/shoreline miles that have achieved desired conditions where condition is known and as specified in management plans (GPRA)
97% 97% 45% 47% 61% 57% 20% 20% 59% 56% 70% 74% 21% 21% 100% 100% 55% 59% 0% 97%
1.0.1 # of NWRS riparian (stream/shoreline) miles achieving desired conditions (GPRA)(PART)
Refuges 310,137 310,137 458 477 1,104 1,039 335 340 2,224 2,135 452 479 956 997 304,421 304,433 187 203 0 310,028
1.0.2 # of NWRS riparian (stream/shoreline) miles in plan (GPRA)(PART)
Refuges 318,454 318,454 1,009 1,009 1,807 1,807 1,707 1,707 3,800 3,800 648 648 4,655 4,655 304,486 304,486 343 343 0 318,519
PIM.1.1.1.0712 CSF 1.1 Number of FWS riparian (stream/shoreline) (including marine and coastal) miles restored to the condition specified in management plans - annual (GPRA)
163 72 20 17 20 6 14 13 102 2 1 5 2 1 13 4 15 0 52
1.1.1 # miles of NWRS riparian (stream/shoreline) (including marine and coastal) habitats restored - annual (GPRA)
Refuges 163 72 20 17 20 6 14 13 102 2 1 5 2 1 13 4 15 0 52
PIM.1.2.1.0712 CSF 1.2 Number of FWS riparian (stream/shoreline) (including marine and coastal) miles managed or protected to maintain desired condition as specified in management plans - annual (GPRA)
309,974 310,032 439 460 1,084 1,033 320 327 2,122 2,133 451 474 954 996 304,421 304,420 183 188 0 309,976
1.2.1 # of NWRS riparian (stream/shoreline) miles achieving desired conditions (GPRA)(PART)
Refuges 309,974 310,032 439 460 1,084 1,033 320 327 2,122 2,133 451 474 954 996 304,421 304,420 183 188 0 309,976
1.2.2 # of NWRS riparian (stream/shoreline) miles in plan (GPRA)(PART)
Refuges 318,454 318,454 1,009 1,009 1,807 1,807 1,707 1,707 3,800 3,800 648 648 4,655 4,655 304,486 304,486 343 343 0 318,519
PEM.1.0.2.0712 DOI 2 Percent of DOI wetland, upland, and marine and coastal acres that have achieved desired conditions where condition is known and as specified in management plans (GPRA)
91% 91% 34% 35% 64% 62% 40% 40% 62% 62% 47% 47% 81% 82% 98% 99% 76% 76% 0% 94%
OP 2 Percent of FWS wetland, upland, and marine and coastal acres that have achieved desired conditions where condition is known and as specified in management plans (GPRA)
91% 91% 34% 35% 64% 62% 40% 40% 62% 62% 47% 47% 81% 82% 98% 99% 76% 76% 0% 94%
2.0.1 # of NWRS wetland, upland, and coastal/marine acres achieving desired condition (GPRA)(PART)
Refuges 87,403,731 88,066,834 1,173,097 1,217,312 1,845,099 1,805,762 494,761 497,592 2,354,765 2,343,902 237,939 239,596 4,347,081 4,431,254 75,204,636 75,799,065 1,746,354 1,732,352 0 138,479,026
2.0.2 # of NWRS wetland, upland, and coastal/marine acres in plan (GPRA)(PART)
Refuges 96,389,272 96,389,272 3,461,634 3,461,634 2,889,750 2,889,750 1,233,671 1,233,671 3,792,681 3,792,681 511,675 511,675 5,388,383 5,388,383 76,822,094 76,822,094 2,289,384 2,289,384 0 147,612,442
PIM.1.1.2.0712 CSF 2.1 Number of FWS wetland acres restored to the condition specified in management plans - annual (GPRA)
20,222 61,693 1,501 1,421 815 1,216 3,942 1,933 9,745 14,778 86 35 548 1,387 37,632 3,585 3,291 0 28,017
2.1.1 # of NWRS wetlands acres restored - annual (GPRA)(PART)
Refuges 20,222 61,693 1,501 1,421 815 1,216 3,942 1,933 9,745 14,778 86 35 548 1,387 37,632 3,585 3,291 0 28,017
PIM.1.1.4.0712 CSF 2.2 Number of FWS upland acres restored to the condition specified in management plans - annual (GPRA)
113,188 575,957 47,623 90,634 21,465 650 4,407 4,578 1,601 1,340 104 141 9,470 13,157 27,744 464,642 774 815 0 253,307
2.2.1 # of NWRS upland acres restored - annual (GPRA)(PART)
Refuges 113,188 575,957 47,623 90,634 21,465 650 4,407 4,578 1,601 1,340 104 141 9,470 13,157 27,744 464,642 774 815 0 253,307
PIM.1.1.3.0712 CSF 2.3 Number of FWS coastal and marine acres restored to the condition specified in management plans - annual (GPRA)
12,772 103,800 1,456 774 10,039 1,844 203 189 786 2,160 132 140 2,081 96,522 156 89 0 7,446
2.3.1 # of NWRS wetland coastal/marine acres restored - annual (GPRA)(PART)
Refuges 10,662 52,279 502 516 9,294 922 159 162 533 1,894 60 91 1,033 47,617 114 44 0 5,334
2.3.2 # of NWRS upland coastal/marine acres restored - annual (GPRA)(PART)
Refuges 2,110 51,520 954 258 745 922 44 27 253 266 72 49 1,048 48,905 42 45 0 2,112
2.3.3 # of NWRS riparian coastal/marine acres restored - annual (GPRA)(PART)
Refuges 0 0 0 0 0 0 0 0 0 0 0 0 0
PIM.1.2.2.0712 CSF 2.4 Number of FWS wetland acres managed or protected to maintain desired condition as specified in management plans - annual (GPRA)
32,079,420 32,087,460 46,744 50,353 71,233 70,012 310,179 311,742 831,555 846,265 72,837 73,220 2,118,607 2,122,571 28,429,619 28,429,599 198,647 183,697 0 32,069,571
2.4.1 # of NWRS wetland acres achieving desired condition (GPRA)(PART)
Refuges 32,079,420 32,087,460 46,744 50,353 71,233 70,012 310,179 311,742 831,555 846,265 72,837 73,220 2,118,607 2,122,571 28,429,619 28,429,599 198,647 183,697 0 32,069,571
2.4.2 # of NWRS wetland acres in plan (GPRA)(PART)
Refuges 34,282,674 34,282,674 254,298 254,298 175,375 175,375 740,979 740,979 1,768,539 1,768,539 181,105 181,105 2,276,551 2,276,551 28,569,824 28,569,824 316,002 316,002 0 34,228,725
PIM.1.2.4.0712 CSF 2.5 Number of FWS upland acres managed or protected to maintain desired
52,264,381 52,352,498 428,094 427,297 1,489,039 1,486,437 167,238 170,387 134,104 125,698 53,006 53,585 2,218,456 2,290,670 46,247,273 46,270,670 1,527,171 1,527,754 0 52,448,499
May 27, 2010 - 1 - 11:01:43 AM

U.S. Fish and Wildlife Service
FWS Operational Plan - GPRA Measures
GPRA Measure FWS Operational Plan Measure Program
2009 2010National Region 1 - Pacific Region 2 - Southwest Region 3 - Great Lakes -
Big RiversRegion 4 - Southeast Region 5 - Northeast Region 6 - Mountain-
PrairieRegion 7 - Alaska Region 8 - California-
NevadaRegion 9 -
HeadquartersNational
Target Actual Target Actual Target Actual Target Actual Target Actual Target Actual Target Actual Target Actual Target Actual Target Actual TargetPIM.1.2.4.0712 condition as specified in management plans -
annual (GPRA)
2.5.1 # of NWRS upland acres achieving desired condition (GPRA)(PART)
Refuges 52,264,381 52,352,498 428,094 427,297 1,489,039 1,486,437 167,238 170,387 134,104 125,698 53,006 53,585 2,218,456 2,290,670 46,247,273 46,270,670 1,527,171 1,527,754 0 52,448,499
2.5.2 # of NWRS upland acres in plan (GPRA)(PART)
Refuges 57,161,508 57,161,508 1,234,290 1,234,290 2,264,355 2,264,355 476,121 476,121 291,972 291,972 110,253 110,253 3,111,832 3,111,832 47,752,270 47,752,270 1,920,416 1,920,416 0 57,140,692
PIM.1.2.3.0712 CSF 2.6 Number of FWS coastal and marine acres managed and protected to maintain desired condition as specified in management plans - annual (GPRA)
2,913,747 2,913,747 647,679 646,832 252,508 245,602 8,792 8,763 1,376,974 1,353,661 111,774 112,474 1,387 500,000 500,000 16,021 16,706 0 53,672,185
2.6.1 # of NWRS coastal and marine acres achieving desired condition (excludes Alaska) (GPRA)(PART)
Refuges 2,913,747 2,913,747 647,679 646,832 252,508 245,602 8,792 8,763 1,376,974 1,353,661 111,774 112,474 1,387 500,000 500,000 16,021 16,706 0 53,672,185
2.6.2 # of NWRS coastal and marine acres in plan (excludes Alaska) (GPRA)(PART)
Refuges 4,945,089 4,945,089 1,973,045 1,973,045 450,020 450,020 16,571 16,571 1,732,170 1,732,170 220,317 220,317 0 500,000 500,000 52,966 52,966 0 56,243,025
PEM.1.0.7.0712 CSF 2.7 Percent of treated burned acres that have achieved the desired condition (GPRA)
0 0 0 0 0 0 0 0 0 0
2.7.1 Percent of treated burned acres that have achieved the desired condition (GPRA)
Refuges 0% 0% 0% 0% 0% 0% 0% 0% 0% 0%
PEM.1.0.6.0712 2.7.1.1 # of treated burned acres that have achieved the desired condition (GPRA)
Refuges 0 0 0 0 0 0 0 0 0 0
2.7.1.2 # of treated burned acres (GPRA) Refuges 0 0 0 0 0 0 0 0 0 0
PIM.1.1.9.0712 2.7.2 % of natural ignitions occurring in areas designated for wildland fire use and consistent with wildland fire use strategies that are managed for resource protection benefits (i.e., "allowed to burn") (GPRA)
Refuges 0% 0% 0% 0% 0% 0% 0% 0% 0% 0%
2.7.2.1 # of natural ignitions, occurring in areas designated for wildland fire use or consistent with wildland fire use strategies, that are managed for resource protection benefits (i.e., "allowed to burn") (GPRA)
Refuges 0 0 0 0 0 0 0 0 0 0
2.7.2.2 total # of natural ignitions (GPRA) Refuges 0 0 0 0 0 0 0 0 0 0
PIM.1.1.10.0712 2.7.3 % FWS acres treated either to diminish the ecological, economic, or social risks associated with wildfire or to mitigate the adverse effects of wildland fire (GPRA)
Refuges 0% 0% 0% 0% 0% 0% 0% 0% 0% 0%
2.7.3.1 # acres treated moved toward desired condition (GPRA)
Refuges 0 0 0 0 0 0 0 0 0 0
2.7.3.2 total # acres treated (GPRA) Refuges 0 0 0 0 0 0 0 0 0 0
PIM.1.1.11.0712 2.7.4 % of fire acres treated which are maintained in desired condition (GPRA)
Refuges 0% 0% 0% 0% 0% 0% 0% 0% 0% 0%
2.7.4.1 # acres treated maintained in desired condition (GPRA)
Refuges 0 0 0 0 0 0 0 0 0 0
2.7.4.2 total # acres treated (GPRA) Refuges 0 0 0 0 0 0 0 0 0 0
PEM.1.0.9.0412 2.8.6 # of surface and ground water systems directly managed or influenced by FWS that are protected and/or restored, as specified in management plans and by working with State and local resource managers, as appropriate, to meet ecological needs (GPRA)
Refuges 809 809 79 0 71 0 525 0 0 0 0 0 0 0 134 0 0 0 809 809
PEM1.0.8A.0412 2.8.7 % of surface water acres managed by FWS that meet State (EPA approved) Water Quality Standards (GPRA)
Refuges 97% 451% 100% 2,656% 99% 86% 15% 14% 78% 77% 77% 75% 96% 97% 100% 100% 15% 15% 0% 99%
2.8.7.1 # of surface water acres achieving standard (GPRA)
Refuges 13,935,592 65,117,207 1,996,712 53,202,013 95,850 82,984 28,824 27,499 811,182 799,526 28,203 27,209 351,607 354,742 10,610,595 10,610,596 12,619 12,638 0 65,103,942
2.8.7.2 # of acres in plan (GPRA) Refuges 14,429,297 14,429,297 2,003,144 2,003,144 96,518 96,518 197,959 197,959 1,036,906 1,036,906 36,470 36,470 364,407 364,407 10,610,598 10,610,598 83,295 83,295 0 65,618,541
PEM1.0.8B.0412 2.8.8 % of surface water miles (stream/shoreline) managed by FWS that meet State (EPA approved) Water Quality Standards (GPRA)
Refuges 0% 0% 0% 0% 0% 0% 0% 0% 0% 0%
2.8.8.1 # of surface water miles achieving standard (GPRA)
Refuges 0 0 0 0 0 0 0 0 0 0
2.8.8.2 # of miles in plan (GPRA) Refuges 0 0 0 0 0 0 0 0 0 0
PIM.1.1.12.0412 2.9.2 % of known contaminated sites on NWRS lands remediated during the FY (GPRA)
Refuges 42% 62% 25% 50% 33% 33% 14% 29% 75% 75% 0% 0% 33% 33% 67% 67% 0% 0% 0% 41%
2.9.2.1 # of NWRS sites remediated (GPRA) Refuges 10 15 1 2 1 1 1 2 3 3 0 3 1 1 2 2 1 1 0 9
2.9.2.2 total # of known NWRS sites (GPRA) Refuges 24 24 4 4 3 3 7 7 4 4 0 0 3 3 3 3 0 0 0 22
PIM.1.0.3.0712 DOI 3 Number of non-DOI stream/shoreline miles that have achieved watershed and landscape goals as specified in watershed or
6,010 22,350 273 575 151 458 220 506 1,074 11,907 953 3,163 2,900 3,526 283 296 155 1,719 1 200 2,668
May 27, 2010 - 2 - 11:01:43 AM

U.S. Fish and Wildlife Service
FWS Operational Plan - GPRA Measures
GPRA Measure FWS Operational Plan Measure Program
2009 2010National Region 1 - Pacific Region 2 - Southwest Region 3 - Great Lakes -
Big RiversRegion 4 - Southeast Region 5 - Northeast Region 6 - Mountain-
PrairieRegion 7 - Alaska Region 8 - California-
NevadaRegion 9 -
HeadquartersNational
Target Actual Target Actual Target Actual Target Actual Target Actual Target Actual Target Actual Target Actual Target Actual Target Actual TargetPIM.1.0.3.0712 landscape management plans or agreements
that involve DOI (GPRA)
OP 3 Number of non-FWS stream/shoreline miles that have achieved watershed and landscape goals as specified in watershed or landscape management plans or agreements that involve FWS (GPRA)
6,010 22,350 273 575 151 458 220 506 1,074 11,907 953 3,163 2,900 3,526 283 296 155 1,719 1 200 2,668
PIM.1.1.5.0712 CSF 3.1 Number of non-FWS riparian (stream/shoreline) miles restored, including miles restored through partnerships, as specified in management plans or agreements that involve FWS - annual (GPRA)
1,593 11,054 181 191 65 63 66 126 395 9,547 524 449 230 226 18 18 113 433 1 0 1,252
3.1.1 # of non-FWS riparian (stream/shoreline) miles restored, including miles restored through partnerships (includes miles treated for invasives & now restored) - PartnersProg - annual (GPRA)(PART)
Partners for Fish and Wildlife - HC 478 702 46 56 60 54 50 69 45 58 65 87 105 119 17 17 90 242 0 503
3.1.2 # of non-FWS riparian (stream/shoreline) miles restored, including miles restored through partnerships - CoastProg - annual (GPRA)(PART)
Coastal Programs - HC 21 35 8 12 0 0 6 4 1 14 3 4 0 2 2 2 0 0 73
3.1.3 # of non-FWS riparian (stream/shoreline) miles restored through technical assistance, including partnerships (GPRA)(PART)
Environmental Contaminants 501 410 100 100 0 0 1 8 147 145 151 60 101 82 0 15 1 0
3.1.4 # of non-FWS riparian (stream/shoreline) miles enhanced/restored through NRDA - annual (GPRA)(PART)
Environmental Contaminants 51 97 2 11 0 9 7 20 15 5 5 0 19 20 0 3 32 0 111
3.1.5 # of non-FWS riparian (stream/shoreline) miles restored through Federal Assistance technical assistance and grants (GPRA)
Federal Assistance 394 9,462 11 8 0 0 180 9,244 200 207 3 3 0 0 0 413
3.1.6 # of non-FWS riparian (stream/shoreline) miles restored/enhanced through grants - Tribal Wildlife Grants (GPRA)
External Affairs 0 0 0 0 0 0 0 0 0 0
3.1.7 # of non-FWS riparian (stream/shoreline) miles restored/enhanced through grants - Tribal Landowner Incentive Grants (GPRA)
External Affairs 0 0 0 0 0 0 0 0 0 0
3.1.13 # of non-FWS riparian (stream/shoreline) miles restored/enhanced through conservation planning assistance
Conservation Planning Assistance - HC 149 348 15 4 5 0 2 25 7 81 100 91 2 3 0 0 18 144 0 152
PIM.1.2.5.0712 CSF 3.2 Number of non-FWS riparian (stream/shoreline) miles managed or protected to maintain desired condition, including miles managed or protected through partnerships, as specified in management plans or agreements that involve FWS - annual (GPRA)
4,416 11,296 92 383 86 395 154 379 679 2,360 429 2,714 2,670 3,300 264 278 42 1,286 0 200 1,416
3.2.1 # of non-FWS riparian (stream/shoreline) miles protected through voluntary partnerships - annual (GPRA)(PART)
Coastal Programs - HC 61 91 7 7 4 4 0 5 7 40 68 0 6 6 0 0 74
3.2.2 # of non-FWS riparian (stream/shoreline) miles managed or protected through technical assistance, including partnerships - annual (GPRA)(PART)
Environmental Contaminants 2,764 8,159 0 0 30 315 94 187 130 1,650 71 2,249 2,439 3,192 0 0 366 0 200
3.2.3 # of non-FWS riparian (stream/shoreline) miles managed or protected through NRDA - annual (GPRA)
Environmental Contaminants 484 383 0 0 0 28 31 104 7 68 63 9 10 254 254 21 18 0 324
3.2.4 # of non-FWS instream miles protected/conserved through technical assistance - annual (GPRA)(PART)
Conservation Planning Assistance - HC 576 1,399 25 170 46 20 12 68 212 296 150 24 128 60 0 3 2 758 0 557
3.2.5 # of non-FWS riparian (stream/shoreline) miles protected/conserved through technical assistance - annual (GPRA)(PART)
Conservation Planning Assistance - HC 532 1,264 60 206 6 56 20 93 228 401 100 310 94 38 5 15 19 144 0 461
PEM.1.0.4.0712 DOI 4 Number of non-DOI wetland, upland, and marine and coastal acres that have achieved watershed and landscape goals as specified in watershed or landscape management plans or agreements that involve DOI (GPRA)
1,902,983 3,874,691 31,130 46,997 46,218 64,906 53,824 1,776,272 85,548 797,211 43,640 72,428 331,823 267,526 5,402 6,576 17,736 77,843 1,287,662 764,932 1,524,147
OP 4 Number of non-FWS wetland, upland, and marine and coastal acres restored, including acres restored through partnerships, as specified in management plans or agreements that involve FWS - annual (GPRA)
1,902,983 3,874,691 31,130 46,997 46,218 64,906 53,824 1,776,272 85,548 797,211 43,640 72,428 331,823 267,526 5,402 6,576 17,736 77,843 1,287,662 764,932 1,524,147
PIM.1.1.6.0712 CSF 4.1 Number of non-FWS wetland acres restored, including acres restored through partnerships, as specified in management plans or agreements that involve FWS -
708,180 458,713 21,424 21,336 2,152 4,060 5,567 6,359 53,700 134,049 2,837 5,297 14,449 15,225 24 49 5,407 8,111 602,620 264,228 656,578
May 27, 2010 - 3 - 11:01:43 AM

U.S. Fish and Wildlife Service
FWS Operational Plan - GPRA Measures
GPRA Measure FWS Operational Plan Measure Program
2009 2010National Region 1 - Pacific Region 2 - Southwest Region 3 - Great Lakes -
Big RiversRegion 4 - Southeast Region 5 - Northeast Region 6 - Mountain-
PrairieRegion 7 - Alaska Region 8 - California-
NevadaRegion 9 -
HeadquartersNational
Target Actual Target Actual Target Actual Target Actual Target Actual Target Actual Target Actual Target Actual Target Actual Target Actual TargetPIM.1.1.6.0712 annual (GPRA)
4.1.1 # of wetlands acres enhanced/restored through voluntary partnerships (includes acres treated for invasives & now restored) - annual (GPRA)(PART)
Partners for Fish and Wildlife - HC 26,902 33,273 1,842 1,828 1,988 2,609 5,000 5,495 3,000 4,852 2,750 2,599 7,300 9,026 23 49 5,000 6,815 0 26,997
4.1.2 # of wetlands enhanced/restored through technical assistance, including partnerships - annual (GPRA)(PART)
Environmental Contaminants 37,466 112,280 19,200 19,200 3 500 18,010 91,939 3 31 227 242 0 1 326 25 39
4.1.3 # of non-FWS wetland acres enhanced/restored through NRDA - annual (GPRA)
Environmental Contaminants 1,387 3,601 282 273 137 1,448 254 210 85 0 84 531 236 221 0 309 918 0 1,882
4.1.4 # of wetlands acres enhanced/restored through the Tribal Wildlife Grants Program - annual (GPRA)
External Affairs 0 0 0 0 0 0 0 0 0 0
4.1.5 # of wetlands acres enhanced/restored through the Tribal Landowner Incentive Grants Program - annual (GPRA)
External Affairs 0 0 0 0 0 0 0 0 0 0
4.1.6 # of habitat acres enhanced/restored of habitat in North America through NAWCF - annual (GPRA)
Migratory Birds 602,595 264,189 0 0 0 0 0 0 0 0 602,595 264,189 463,959
4.1.18 # of non-FWS wetland acres restored/enhanced through conservation planning assistance
Conservation Planning Assistance - HC 39,829 45,370 100 35 27 0 313 154 32,605 37,258 0 2,136 6,686 5,736 1 0 97 52 0 163,740
PIM.1.1.8.0712 CSF 4.2 Number of non-FWS upland acres restored, including acres restored through partnerships, as specified in management plans or agreements that involve FWS - annual (GPRA)
187,492 271,138 3,617 6,795 20,698 41,992 12,441 15,780 11,433 33,993 2,505 4,208 129,203 140,963 26 28 7,319 27,130 250 250 182,650
4.2.1 # of non-FWS upland acres enhanced/restored through voluntary partnerships (includes acres treated for invasives & now restored) - annual (GPRA)(PART)
Partners for Fish and Wildlife - HC 164,702 230,638 2,482 4,141 20,698 41,958 12,000 15,233 7,000 32,187 2,500 4,062 115,000 122,873 22 28 5,000 10,156 0 169,605
4.2.2 # of non-FWS upland acres enhanced/restored through technical assistance, including partnerships - annual (GPRA)(PART)
Environmental Contaminants 910 1,114 21 21 0 9 262 50 0 0 5 580 576 0 0 250 250
4.2.3 # of non-FWS upland acres enhanced/restored through NRDA - annual (GPRA)
Environmental Contaminants 3,333 18,010 614 630 0 34 64 162 73 0 5 60 276 241 0 2,301 16,883 0 1,286
4.2.4 # of non-FWS upland acres enhanced/restored through the Tribal Wildlife Grants Program - annual (GPRA)
External Affairs 0 0 0 0 0 0 0 0 0 0
4.2.5 # of non-FWS upland acres enhanced/restored through the Tribal Landowner Incentive Grants Program - annual (GPRA)
External Affairs 0 0 0 0 0 0 0 0 0 0
4.2.9 # of non-FWS upland acres restored/enhanced through conservation planning assistance
Conservation Planning Assistance - HC 18,547 21,376 500 2,003 0 0 368 123 4,310 1,806 0 81 13,347 17,273 4 0 18 91 0 11,759
PIM.1.1.7.0712 CSF 4.3 Number of non-FWS coastal and marine acres restored, including acres restored through partnerships, as specified in management plans or agreements that involve FWS - annual (GPRA)
15,243 85,925 719 511 8,700 10,719 265 397 2,368 68,239 2,740 5,345 0 1 21 450 692 0 9,743
4.3.1 # of non-FWS coastal/marine wetlands acres enhanced/restored through voluntary partnerships (includes acres treated for invasives & now restored) - annual (GPRA)(PART)
Coastal Programs - HC 7,047 17,130 376 226 3,100 3,390 173 161 698 8,207 2,500 5,110 0 21 200 15 0 5,608
4.3.2 # of non-FWS coastal/marine upland acres enhanced/restored through voluntary partnerships (includes acres treated for invasives & now restored) - annual (GPRA)(PART)
Coastal Programs - HC 7,158 8,972 342 285 5,600 7,182 91 105 635 1,152 240 171 0 0 250 77 0 2,762
4.3.4 # of non-FWS coastal/marine acres restored/enhanced through conservation planning assistance
Conservation Planning Assistance - HC 1,038 59,823 1 0 148 1 131 1,035 58,879 0 64 0 1 0 600 0 1,373
PIM.1.2.6.0712 CSF 4.4 Number of non-FWS wetland acres managed or protected to maintain desired condition, including acres managed or protected through partnerships, as specified in management plans or agreements that involve FWS - annual (GPRA)
748,660 2,440,943 32 969 4,776 1,157 17,223 1,691,344 9,627 194,239 1,827 4,822 27,293 16,122 2,066 2,030 1,024 32,807 684,792 497,454 600,667
4.4.1 # of non-FWS wetland acres protected/secured through NAWCF - annual (GPRA)
Migratory Birds 684,792 497,254 0 0 0 0 0 0 0 0 684,792 497,254 518,641
May 27, 2010 - 4 - 11:01:43 AM

U.S. Fish and Wildlife Service
FWS Operational Plan - GPRA Measures
GPRA Measure FWS Operational Plan Measure Program
2009 2010National Region 1 - Pacific Region 2 - Southwest Region 3 - Great Lakes -
Big RiversRegion 4 - Southeast Region 5 - Northeast Region 6 - Mountain-
PrairieRegion 7 - Alaska Region 8 - California-
NevadaRegion 9 -
HeadquartersNational
Target Actual Target Actual Target Actual Target Actual Target Actual Target Actual Target Actual Target Actual Target Actual Target Actual TargetPIM.1.2.6.0712 4.4.2 # of non-FWS wetland acres protected
by land acquisition through Federal Assistance - annual (GPRA)
Federal Assistance 17,941 6,737 0 0 16,015 4,943 1,026 894 0 0 0 0 900 900 0 20,016
4.4.4 # of non-FWS wetland acres managed or protected through technical assistance, including partnerships - annual (GPRA)(PART)
Environmental Contaminants 17,647 144,021 0 8 1,100 299 266 135 2 135,200 180 390 16,098 5,972 0 0 1 1,817 0 200
4.4.5 # of non-FWS wetland acres managed or protected through NRDA - annual (GPRA)
Environmental Contaminants 3,763 1,720,669 7 22 2,959 374 240 1,681,093 85 8,465 147 425 300 290 0 0 25 30,000 0 39,603
4.4.6 # of non-FWS wetland acres protected/conserved through technical assistance - annual (GPRA)(PART)
Conservation Planning Assistance - HC 24,517 72,262 25 939 717 484 702 5,173 8,514 49,680 1,500 4,007 10,895 9,860 2,066 2,030 98 90 0 22,407
PIM.1.2.8.0712 CSF 4.5 Number of non-FWS upland acres managed or protected to maintain desired condition, including acres managed or protected through partnerships, as specified in management plans or agreements that involve FWS - annual (GPRA)
201,587 486,816 4,661 15,436 7,345 3,581 18,288 49,039 5,072 302,531 1,631 9,395 160,878 94,735 216 628 3,496 8,472 0 3,000 48,077
4.5.1 # of non-FWS upland acres managed or protected through technical assistance or land management actions, including partnerships - annual (GPRA)(PART)
Environmental Contaminants 112,569 31,556 1,035 3,666 10 173 171 0 5 5,010 50 420 111,298 15,813 0 0 0 3,474 0 3,000
4.5.2 # of non-FWS upland acres managed or protected through NRDA - annual (GPRA)
Environmental Contaminants 7,136 5,625 426 863 535 408 594 220 15 1 1,581 594 580 209 0 3,405 3,330 0 6,497
4.5.3 # of non-FWS upland acres protected through land acquisition via Federal Assistance - annual (GPRA)
Federal Assistance 68,853 352,770 0 2,300 2,809 16,053 11,999 1,500 288,951 0 49,000 49,011 0 0 0 15,461
4.5.4 # of non-FWS upland acres protected/conserved through technical assistance - annual (GPRA)(PART)
Conservation Planning Assistance - HC 13,029 96,865 3,200 10,907 4,500 191 1,470 36,820 3,552 8,569 0 8,381 0 29,702 216 628 91 1,668 0 26,119
PIM.1.2.7.0712 CSF 4.6 Number of non-FWS coastal and marine acres managed or protected to maintain desired condition, including acres managed or protected through partnerships, as specified in management plans or agreements that involve FWS - annual (GPRA)
41,821 131,156 677 1,950 2,547 3,398 40 13,354 3,348 64,161 32,100 43,361 481 3,069 3,820 40 631 0 26,432
4.6.1 # of non-FWS coastal/marine wetlands acres protected through voluntary partnerships - annual (GPRA)(PART)
Coastal Programs - HC 11,636 16,598 310 498 1,630 2,558 0 1,250 1,398 6,000 9,692 0 2,406 2,452 40 0 0 11,810
4.6.2 # of non-FWS coastal/marine upland acres protected through voluntary partnerships - annual (GPRA)(PART)
Coastal Programs - HC 27,984 34,314 97 1,160 500 250 0 800 2,063 26,000 30,254 0 587 587 0 0 12,032
4.6.3 # of non-FWS coastal/marine acres protected/conserved through technical assistance - annual (GPRA)(PART)
Conservation Planning Assistance - HC 2,201 80,244 270 292 417 590 40 13,354 1,298 60,700 100 3,415 481 76 781 0 631 0 2,590
PEM.2.0.1.0712 DOI 5 Percent of fish species of management concern that are managed to self-sustaining levels, in cooperation with affected States and others, as defined in approved management documents (GPRA)
15% 30% 0% 100% 0% 6% 4% 9% 40% 0% 0% 15% 50% 29% 91% 200% 0% 50% 0% 8%
OP 5 Percent of fish species of management concern that are managed to self-sustaining levels, in cooperation with affected States and others, as defined in approved management documents (GPRA)
15% 30% 0% 100% 0% 6% 4% 9% 40% 0% 0% 15% 50% 29% 91% 200% 0% 50% 0% 8%
CSF 5.1 Percent of fish species of management concern that are managed to self-sustaining levels, in cooperation with affected States and others, as defined in approved management documents (GPRA)
15% 30% 0% 100% 0% 6% 4% 9% 40% 0% 0% 15% 50% 29% 91% 200% 0% 50% 0% 8%
5.1.1 % of fish species of management concern that are managed to self-sustaining levels, in cooperation with affected States and others, as defined in approved management documents (GPRA)
Management Assistance - F 15% 30% 0% 100% 0% 6% 4% 9% 40% 0% 0% 15% 50% 29% 91% 200% 0% 50% 0% 8%
5.1.1.1 # of species of management concern at self-sustaining levels (GPRA)
Management Assistance - F 22 17 0 5 0 1 3 7 2 0 0 2 7 4 10 22 0 3 0 17
5.1.1.2 total # of species of management concern (GPRA)
Management Assistance - F 146 146 5 5 18 18 74 74 5 5 13 13 14 14 11 11 6 6 0 211
PEM.2.0.2.0712 DOI 6 Percent of all migratory bird species that are at healthy and sustainable levels (GPRA) (PART)
62.3% 62.3% 0.0% 0.0% 0.0% 0.0% 0.0% 0.0% 0.0% 0.0% 62.3% 62.3% 62.5%
OP 6 Percent of all migratory bird species that are at healthy and sustainable levels (GPRA) (PART)
62.3% 62.3% 0.0% 0.0% 0.0% 0.0% 0.0% 0.0% 0.0% 0.0% 62.3% 62.3% 62.5%
CSF 6.1 Percent of all migratory bird species that are at healthy and sustainable levels
62.3% 62.3% 0.0% 0.0% 0.0% 0.0% 0.0% 0.0% 0.0% 0.0% 62.3% 62.3% 62.5%
May 27, 2010 - 5 - 11:01:43 AM

U.S. Fish and Wildlife Service
FWS Operational Plan - GPRA Measures
GPRA Measure FWS Operational Plan Measure Program
2009 2010National Region 1 - Pacific Region 2 - Southwest Region 3 - Great Lakes -
Big RiversRegion 4 - Southeast Region 5 - Northeast Region 6 - Mountain-
PrairieRegion 7 - Alaska Region 8 - California-
NevadaRegion 9 -
HeadquartersNational
Target Actual Target Actual Target Actual Target Actual Target Actual Target Actual Target Actual Target Actual Target Actual Target Actual TargetPEM.2.0.2.0712 (GPRA) (PART)
6.1.1 % of all migratory bird species that are at healthy and sustainable levels (GPRA)(PART)
Migratory Birds 62.3% 62.3% 0.0% 0.0% 0.0% 0.0% 0.0% 0.0% 0.0% 0.0% 62.3% 62.3% 62.5%
6.1.1.1 # of all migratory bird species that are at healthy and sustainable levels (GPRA)(PART)
Migratory Birds 568 568 0 0 0 0 0 0 0 0 568 568 570
6.1.1.2 # of all migratory bird species (GPRA)(PART)
Migratory Birds 912 912 0 0 0 0 0 0 0 0 912 912 912
PEM.2.0.3.0712 DOI 7 Percent of threatened or endangered species that are stabilized or improved (GPRA)
42% 47% 39% 46% 53% 52% 59% 74% 40% 45% 36% 43% 60% 67% 29% 43% 39% 41% 0% 44%
7.11.2 % of threatened or endangered species that are stabilized or improved (GPRA)
Endangered Species 42% 47% 39% 46% 53% 52% 59% 74% 40% 45% 36% 43% 60% 67% 29% 43% 39% 41% 0%
7.11.2.1 # of species listed under the ESA that are stabilized or improving (GPRA)
Endangered Species 534 592 145 169 71 70 23 29 130 146 15 18 35 39 2 3 113 118 0
7.11.2.2 # of listed species (U.S. Listings Only) (GPRA)
Endangered Species 1,270 1,270 371 371 135 135 39 39 327 327 42 42 58 58 7 7 291 291 0
7.19.2 % of threatened or endangered species that are stabilized or improved (GPRA)
Endangered Species 42% 47% 39% 46% 53% 52% 59% 74% 40% 45% 36% 43% 60% 67% 29% 43% 39% 41% 44%
7.19.2.1 # of species listed under the ESA that are stabilized or improving (GPRA)
Endangered Species 534 592 145 169 71 70 23 29 130 146 15 18 35 39 2 3 113 118 561
7.19.2.2 # of listed species (U.S. Listings Only) (GPRA)
Endangered Species 1,270 1,270 371 371 135 135 39 39 327 327 42 42 58 58 7 7 291 291 1,271
PEM.2.0.4.0412 DOI 8 Percent of candidate species where listing is unnecessary as a result of conservation actions, including actions taken through agreements (GPRA)
0.0% 0.0% 0.0% 0.0% 0.0% 0.0% 0.0% 0.0% 0.0% 0.0%
8.3.5 % of candidate species where listing is unnecessary as a result of conservation actions, including actions taken through agreements (GPRA)
Endangered Species
8.3.5.1 # of candidate species where listing is unnecessary as a result of conservation actions or agreements (GPRA)
Endangered Species
8.3.5.2 total # of candidate species (GPRA) Endangered Species 210 210 84 84 31 31 3 3 59 59 4 4 6 6 1 1 22 22 232
8.11.4 % of candidate species where listing is unnecessary as a result of conservation actions, including actions taken through agreements (GPRA)
Endangered Species 0% 0% 0% 0% 0% 0% 0% 0% 0% 0%
8.11.4.1 # of candidate species where listing is unnecessary as a result of conservation actions or agreements (GPRA)
Endangered Species 0 0 0 0 0 0 0 0 0 0
8.11.4.2 total # of candidate species (GPRA) Endangered Species 210 210 84 84 31 31 3 3 59 59 4 4 6 6 1 1 22 22 0
PIM.2.2.1.0712 DOI 9 Percent of populations of species of management concern that are managed to desired condition (GPRA)
62% 71% 50% 53% 60% 76% 83% 110% 59% 77% 67% 67% 50% 52% 74% 74% 87% 83% 0% 62%
OP 9 Percent of populations of species of management concern that are managed to desired condition (GPRA)
62% 71% 50% 53% 60% 76% 83% 110% 59% 77% 67% 67% 50% 52% 74% 74% 87% 83% 0% 62%
9.0.1 Percent of populations of species of management concern that are managed to desired condition (GPRA)
62% 71% 50% 53% 60% 76% 83% 110% 59% 77% 67% 67% 50% 52% 74% 74% 87% 83% 0% 62%
9.0.1.1 # of populations of species of management concern that are managed to desired condition (GPRA)
455 521 45 48 107 135 40 53 65 86 61 61 60 63 31 31 46 44 0 504
9.0.1.2 # of populations of species of management concern (GPRA)
733 733 90 90 178 178 48 48 111 111 91 91 120 120 42 42 53 53 0 811
CSF 9.1 Percent of marine mammals achieving optimal sustainable populations (GPRA)
30% 40% 100% 0% 0% 0% 0% 0% 50% 50% 0% 0% 40%
9.1.1 % of marine mammals achieving optimal sustainable populations (GPRA)
Management Assistance - F 30% 40% 100% 0% 0% 0% 0% 0% 50% 50% 0% 0% 40%
9.1.1.1 # marine mammals with optimal sustainable population (GPRA)
Management Assistance - F 3 4 1 0 0 0 0 0 3 3 0 0 4
9.1.1.2 total # marine mammal populations (GPRA)
Management Assistance - F 10 10 1 1 0 0 2 2 0 0 6 6 1 1 0 10
9.3.1 % of populations of indicator species with improved or stable numbers (GPRA)
Refuges 63% 72% 51% 53% 60% 76% 83% 110% 60% 79% 67% 67% 50% 52% 78% 78% 88% 85% 0% 62%
9.3.1.1 # of indicator species populations with improved/stable numbers (GPRA)
Refuges 452 517 45 47 107 135 40 53 65 86 61 61 60 63 28 28 46 44 0 500
9.3.1.2 total # of indicator species populations (GPRA)
Refuges 723 723 89 89 178 178 48 48 109 109 91 91 120 120 36 36 52 52 0 801
May 27, 2010 - 6 - 11:01:43 AM

U.S. Fish and Wildlife Service
FWS Operational Plan - GPRA Measures
GPRA Measure FWS Operational Plan Measure Program
2009 2010National Region 1 - Pacific Region 2 - Southwest Region 3 - Great Lakes -
Big RiversRegion 4 - Southeast Region 5 - Northeast Region 6 - Mountain-
PrairieRegion 7 - Alaska Region 8 - California-
NevadaRegion 9 -
HeadquartersNational
Target Actual Target Actual Target Actual Target Actual Target Actual Target Actual Target Actual Target Actual Target Actual Target Actual TargetPIM.2.2.2.0712 DOI 10 Number of international species of
management concern whose status has been improved in cooperation with affected countries (GPRA)
298 298 0 0 0 0 0 0 0 0 298 298 284
CSF 10.1 Number of international species of management concern whose status has been improved in cooperation with affected countries (GPRA)
87 87 0 0 0 0 0 0 0 0 87 87 49
10.1.1 Number of international species of management concern whose status has been improved in cooperation with affected countries (GPRA)
International Affairs 87 87 0 0 0 0 0 0 0 0 87 87 49
10.1.2 Influence the conservation of X species through activities that promote and sustain species of international concern relative to the provisions of the Convention on Nature Protection and Wildlife Preservation in the Western Hemisphere. (GPRA)
International Affairs 2 2 0 0 0 0 0 0 0 0 2 2 2
10.1.3 Influence the conservation of X species through activities that promote and sustain species of international concern relative to the provisions of the Convention on Wetlands of International Importance Especially as Waterfowl Habitat (Ramsar). (GPRA)
International Affairs 2 2 0 0 0 0 0 0 0 0 2 2 2
10.1.4 Influence the conservation of X species through activities that promote and sustain species of international concern relative to the provisions of the U.S. - Russia Agreement in the Field of Protection of the Environment and Natural Resources. (GPRA)
International Affairs 1 1 0 0 0 0 0 0 0 0 1 1 1
10.1.5 Influence the conservation of X species through activities that promote and sustain species of international concern relative to the provisions of the Convention on International Trade in Endangered Species. (GPRA)
International Affairs 33 33 0 0 0 0 0 0 0 0 33 33 33
10.1.6 Influence the conservation of X species through activities that promote and sustain species of international concern relative to the provisions of the Endangered Species Act. (GPRA)
International Affairs 49 49 0 0 0 0 0 0 0 0 49 49 11
PEM.2.0.5.0412 DOI 11 Percent of baseline acres infested with invasive plant species that are controlled (GPRA)
5% 6% 3% 3% 8% 8% 1% 2% 9% 23% 8% 7% 7% 7% 3% 1% 1% 2% 0% 6%
OP 11 Percent of baseline acres infested with invasive plant species that are controlled (GPRA)
5% 6% 3% 3% 8% 8% 1% 2% 9% 23% 8% 7% 7% 7% 3% 1% 1% 2% 0% 6%
CSF 11.1 Percent of baseline acres infested with invasive plant species that are controlled (GPRA)
5% 6% 3% 3% 8% 8% 1% 2% 9% 23% 8% 7% 7% 7% 3% 1% 1% 2% 0% 6%
11.1.1 % of NWRS baseline acres infested with invasive plant species that are controlled (GPRA)(PART)
Refuges 5% 6% 3% 3% 8% 8% 1% 2% 9% 23% 8% 7% 7% 7% 3% 1% 1% 2% 0% 6%
11.1.1.1 # of NWRS acres invasive plants controlled (GPRA)(PART)
Refuges 107,657 146,938 17,267 20,595 27,585 26,859 5,424 7,164 24,245 61,100 2,430 2,142 28,327 26,285 154 66 2,225 2,727 0 160,893
11.1.1.2 Total # of NWRS acres infested with invasive plants (GPRA)(PART)
Refuges 2,312,632 2,312,632 658,657 658,657 343,692 343,692 474,641 474,641 264,528 264,528 31,904 31,904 383,288 383,288 4,622 4,622 151,300 151,300 0 2,508,387
PEM.2.0.6.0412 DOI 12 Percent of invasive animal species populations that are controlled (GPRA)
7% 8% 6% 6% 12% 16% 8% 10% 15% 13% 11% 18% 16% 14% 4% 5% 3% 4% 0% 8%
OP 12 Percent of invasive animal species populations that are controlled (GPRA)
7% 8% 6% 6% 12% 16% 8% 10% 15% 13% 11% 18% 16% 14% 4% 5% 3% 4% 0% 8%
CSF 12.1 Percent of invasive animal species populations that are controlled (GPRA)
7% 8% 6% 6% 12% 16% 8% 10% 15% 13% 11% 18% 16% 14% 4% 5% 3% 4% 0% 8%
12.1.1 % of invasive animal species populations that are controlled (GPRA)(PART)
Refuges 7% 8% 6% 6% 12% 16% 8% 10% 15% 13% 11% 18% 16% 14% 4% 5% 3% 4% 0% 8%
12.1.1.1 # of invasive animal populations controlled during year (GPRA)(PART)
Refuges 285 298 148 150 15 21 14 18 57 52 11 18 31 27 3 4 6 8 0 300
12.1.1.2 total # of invasive animal populations (GPRA)(PART)
Refuges 3,900 3,900 2,609 2,609 128 128 174 174 392 392 101 101 192 192 77 77 227 227 0 3,844
PEM.3.0.1.0712 13.1.2 % of archaeological sites on FWS inventory in good condition
Refuges 15% 15% 0% 0% 0% 9% 9% 2% 3% 3% 3% 0% 53% 53% 0% 0% 19%
13.1.2.1 # of archaeological sites on FWS inventory in good condition (GPRA)
Refuges 2,785 2,796 1 1 0 679 680 56 63 28 28 0 2,021 2,021 3 0 2,831
13.1.2.2 # of archaeological sites (GPRA) Refuges 18,849 18,849 812 812 0 7,988 7,988 2,356 2,356 884 884 1,470 1,470 3,807 3,807 1,532 1,532 0 14,563
PEM.3.0.2.0712 13.1.3 % of historic structures on FWS inventory in good condition (GPRA)
5% 4% 19% 18% 1% 1% 0% 60% 54% 2% 2% 1% 1% 45% 45% 0% 0% 5%
May 27, 2010 - 7 - 11:01:43 AM

U.S. Fish and Wildlife Service
FWS Operational Plan - GPRA Measures
GPRA Measure FWS Operational Plan Measure Program
2009 2010National Region 1 - Pacific Region 2 - Southwest Region 3 - Great Lakes -
Big RiversRegion 4 - Southeast Region 5 - Northeast Region 6 - Mountain-
PrairieRegion 7 - Alaska Region 8 - California-
NevadaRegion 9 -
HeadquartersNational
Target Actual Target Actual Target Actual Target Actual Target Actual Target Actual Target Actual Target Actual Target Actual Target Actual TargetPEM.3.0.2.0712 13.1.3.1 # of historic structures on FWS
inventory in good condition (GPRA)127 120 42 39 4 5 0 39 35 5 5 20 19 17 17 0 0 119
13.1.3.2 # of historic structures on FWS inventory (GPRA)
2,759 2,759 218 218 554 554 157 157 65 65 203 203 1,524 1,524 38 38 0 0 2,249
13.1.4 % of NWRS historic structures in FWS inventory that are in good condition (GPRA)
Refuges 4% 3% 16% 14% 1% 1% 0% 61% 55% 2% 2% 0% 45% 45% 0% 0% 4%
13.1.4.1 # of NWRS historic structures on FWS inventory in good condition (GPRA)
Refuges 98 92 33 30 4 5 0 39 35 5 5 0 17 17 0 0 90
13.1.4.2 # of NWRS historic structures on FWS inventory (GPRA)
Refuges 2,723 2,723 207 207 554 554 157 157 64 64 203 203 1,500 1,500 38 38 0 0 2,213
13.1.5 % of NFHS historic structures in FWS inventory that are in good condition (GPRA)
Hatcheries - F 81% 78% 82% 82% 0% 0% 0% 0% 0% 83% 79% 0% 0% 0% 81%
13.1.5.1 # of NFHS historic structures on FWS inventory in good condition (GPRA)
Hatcheries - F 29 28 9 9 0 0 0 0 0 20 19 0 0 0 29
13.1.5.2 # of NFHS historic structures on FWS inventory (GPRA)
Hatcheries - F 36 36 11 11 0 0 1 1 0 24 24 0 0 0 36
PEM.3.0.5.0412 13.1.9 % of paleontological localities in FWS inventory in good condition (GPRA)
Refuges 0% 0% 0% 0% 0% 100% 100% 0% 0% 1% 1% 0% 0% 0%
13.1.9.1 # of paleontological localities in good condition (GPRA)
Refuges 3 3 0 0 0 1 1 0 0 2 2 0 0 3
13.1.9.2 total # of paleontological localities in inventory (GPRA)
Refuges 902 902 4 4 1 1 0 1 1 0 572 572 322 322 2 2 0 901
PEM.3.0.4.0412 CSF 13.2 Percent of collections in FWS inventory in good condition (i.e., maintained according to DOI museum property management collection standards) (GPRA)
30% 30% 8% 2% 100% 100% 34% 34% 30% 30% 15% 14% 18% 18% 39% 39% 0% 9% 0% 35%
13.2.1 % of cultural collections in FWS inventory in good condition (combined NWRS and NFHS) (GPRA)
30% 30% 8% 2% 100% 100% 34% 34% 30% 30% 15% 14% 18% 18% 39% 39% 0% 9% 0% 35%
13.2.1.1 # of cultural collections in good condition (GPRA)
669 669 3 1 10 10 207 209 37 37 76 72 4 4 332 332 0 2 0 688
13.2.1.2 Total # of cultural collections (GPRA) 2,205 2,205 40 40 10 10 613 613 125 125 520 520 22 22 853 853 22 22 0 1,947
13.2.2 % of NWRS cultural collections in FWS inventory that are in good condition (GPRA)
Refuges 30% 30% 8% 2% 100% 100% 34% 34% 30% 30% 15% 14% 14% 14% 39% 39% 0% 9% 0% 35%
13.2.2.1 # of NWRS cultural collections in good condition (GPRA)
Refuges 668 668 3 1 10 10 207 209 37 37 76 72 3 3 332 332 0 2 0 687
13.2.2.2 Total # of NWRS cultural collections (GPRA)
Refuges 2,204 2,204 40 40 10 10 613 613 125 125 520 520 21 21 853 853 22 22 0 1,946
13.2.3 % of NFHS cultural collections in FWS inventory are in good condition (GPRA)
Hatcheries - F 100% 100% 0% 0% 0% 0% 0% 100% 100% 0% 0% 0% 100%
13.2.3.1 # of NFHS cultural collections in good condition (GPRA)
Hatcheries - F 1 1 0 0 0 0 0 1 1 0 0 0 1
13.2.3.2 Total # of NFHS cultural collections (GPRA)
Hatcheries - F 1 1 0 0 0 0 0 1 1 0 0 0 1
PEM.3.0.6.0712 CSF 13.3 Percent of acres of Wilderness Areas and other Special Management Areas under FWS management meeting their heritage resource objectives under the authorizing legislation (GPRA)
89% 89% 87% 87% 63% 61% 86% 86% 98% 99% 91% 91% 93% 93% 90% 90% 100% 100% 0% 88%
13.3.1 % of Wilderness Area acres achieving unique values described in the Wilderness Act (GPRA)
Refuges 89% 89% 87% 87% 63% 61% 86% 86% 98% 99% 91% 91% 93% 93% 90% 90% 100% 100% 0% 88%
13.3.1.1 # of Wilderness Area acres achieving objectives (GPRA)
Refuges 18,334,877 18,334,877 1,543 1,543 883,713 855,043 37,476 37,476 453,752 455,860 19,088 19,088 73,319 73,319 16,865,845 16,869,518 141 141 0 18,314,921
13.3.1.2 # of Wilderness Area acres (GPRA) Refuges 20,699,257 20,699,257 1,779 1,779 1,400,953 1,400,953 43,376 43,376 461,634 461,634 20,977 20,977 78,902 78,902 18,691,495 18,691,495 141 141 0 20,700,342
PEM.3.0.7.0712 13.3.2 % of miles of National Historic Trails, Wild and Scenic Rivers, and other linear Special Management Areas under FWS management meeting their heritage resource objectives under the authorizing legislation (GPRA)
Refuges 82% 96% 5% 15% 52% 152% 26% 141% 101% 142% 92% 100% 100% 100% 87% 97% 76% 76% 0% 87%
13.3.2.1 # of Wild and Scenic River miles achieving unique values (GPRA)
Refuges 1,058 1,252 14 26 44 83 3 15 22 22 1,033 1,048 0 0 1,086
13.3.2.2 total # of Wild and Scenic River miles (GPRA)
Refuges 1,086 1,086 0 0 0 0 15 15 22 22 1,049 1,049 0 0 1,086
13.3.2.3 # of National Historic Trail miles achieving unique values (GPRA)
Refuges 518 592 7 8 15 18 10 10 131 102 141 141 185 185 3 102 26 26 0 593
13.3.2.4 total # of National Historic Trail miles (GPRA)
Refuges 840 840 143 143 29 29 38 38 130 130 141 141 184 184 140 140 34 34 0 839
REM.1.0.1.0412 DOI 15 Percent of visitors satisfied with the quality of their experience based on results of survey of the adult American public (18 years
85% 85% 0% 0% 0% 0% 0% 0% 0% 0% 85% 170% 85%
May 27, 2010 - 8 - 11:01:43 AM

U.S. Fish and Wildlife Service
FWS Operational Plan - GPRA Measures
GPRA Measure FWS Operational Plan Measure Program
2009 2010National Region 1 - Pacific Region 2 - Southwest Region 3 - Great Lakes -
Big RiversRegion 4 - Southeast Region 5 - Northeast Region 6 - Mountain-
PrairieRegion 7 - Alaska Region 8 - California-
NevadaRegion 9 -
HeadquartersNational
Target Actual Target Actual Target Actual Target Actual Target Actual Target Actual Target Actual Target Actual Target Actual Target Actual TargetREM.1.0.1.0412 or older and residing in the U.S.) (GPRA)
OP 15 Percent of visitors satisfied with the quality of their experience based on results of survey of the adult American public (18 years or older and residing in the U.S.) (GPRA)
85% 85% 0% 0% 0% 0% 0% 0% 0% 0% 85% 170% 85%
15.2.20 % of visitors are satisfied with the quality of experience (GPRA)
Refuges 85% 85% 0% 0% 0% 0% 0% 0% 0% 0% 85% 85% 85%
15.2.20.1 # of surveyed visitors satisfied with the quality of their experience (GPRA)
Refuges 85 85 0 0 0 0 0 0 0 0 85 85 85
15.2.20.2 Total # of surveyed visitors (GPRA) Refuges 100 100 0 0 0 0 0 0 0 0 100 100 100
RIM.1.2.1.0712 15.2.18 Overall condition of trails and campgrounds as determined by the Facilities Condition Index (GPRA)(PART)
Refuges 0.137 0.127 0.254 0.269 0.195 0.104 0.223 0.250 0.025 0.032 0.233 0.188 0.198 0.206 0.067 0.057 0.093 0.072 0.000 0.120
15.2.18.1 value ($) of deferred maintenance backlog of trails and campgrounds having undergone condition assessment (GPRA)(PART)
Refuges 21,620,784 19,959,093 4,126,612 4,367,910 1,987,128 1,059,860 4,293,646 4,822,427 978,826 1,228,068 6,413,606 5,177,122 749,753 780,759 2,140,597 1,804,690 930,617 718,258 0 21,990,410
15.2.18.2 replacement value ($) of trails and campgrounds having undergone condition assessment (GPRA)(PART)
Refuges 157,728,768 157,728,768 16,236,943 16,236,943 10,190,325 10,190,325 19,295,045 19,295,045 38,793,304 38,793,304 27,542,858 27,542,858 3,785,765 3,785,765 31,929,682 31,929,682 9,954,846 9,954,846 0 0 183,770,393
RIM.1.1.1.0712 15.2.19 % of NWRs/WMDs open to public visitation have a current Visitor Services plan (GPRA)
Refuges 38% 31% 18% 13% 50% 33% 37% 30% 43% 34% 37% 32% 33% 33% 31% 25% 47% 42% 0% 38%
15.2.19.1 # of NWRs/WMDs open to public visitation have a current Visitor Services plan (GPRA)
Refuges 174 145 8 6 21 14 21 17 48 38 23 20 31 31 5 4 17 15 0 176
15.2.19.2 total # of refuges open to the public (GPRA)
Refuges 464 464 45 45 42 42 57 57 112 112 62 62 94 94 16 16 36 36 0 462
RIM.1.5.1.0412 15.2.21 % of customers satisfied with the value for fee paid based on annual, seasonal surveys conducted at selected recreation areas on FWS lands asking visitors about the value they experienced for fees paid (GPRA)
Refuges 85% 85% 0% 0% 0% 0% 0% 0% 0% 0% 85% 85% 85%
15.2.21.1 # of surveyed customers satisfied with the value for fee paid (GPRA)
Refuges 85 85 0 0 0 0 0 0 0 0 85 85 85
15.2.21.2 Total # of surveyed customers (GPRA)
Refuges 100 100 0 0 0 0 0 0 0 0 100 100 100
RIM.1.5.2.0512 15.2.22 % of recreation fee program receipts spent on fee collection (GPRA)
Refuges 14% 15% 0% 0% 0% 0% 0% 0% 0% 0% 14% 15% 15%
15.2.22.1 Amount of recreation fee program receipts spent on fee collection ($) (GPRA)
Refuges 650,000 700,000 0 0 0 0 0 0 0 0 650,000 700,000 700,000
15.2.22.2 Total recreation fee program receipts ($) (GPRA)
Refuges 4,500,000 4,750,000 0 0 0 0 0 0 0 0 4,500,000 4,750,000 4,750,000
RIM.1.4.1.0712 15.2.24 # of serious injuries per 100,000 visitors on FWS lands and in FWS facilities (only include visitors to fee areas and permitted users (duck stamps)) (GPRA)
Refuges 0 0 0 0 0 0 0 0 0 0 0
15.2.24.1 # of serious injuries on FWS lands and in FWS facilities (only include visitors to fee areas and permitted users (duck stamps)) (GPRA)
Refuges 12 0 0 0 0 0 0 0 0 12 13
15.2.24.2 # of visitors (divided by 100,000) on FWS lands and in FWS facilities (only include visitors to fee areas and permitted users (duck stamps)) (GPRA)
Refuges 360 0 0 0 0 0 0 0 0 360 413
RIM.1.4.2.0712 15.2.25 # of fatalities per 100,000 visitors on FWS lands and in FWS facilities (only include visitors to fee areas and permitted users (duck stamps)) (GPRA)
Refuges 0 0 0 0 0 0 0 0 0 0 0
15.2.25.1 # of fatalities on FWS lands and in FWS facilities (only include visitors to fee areas and permitted users (duck stamps)) (GPRA)
Refuges 20 0 0 0 0 0 0 0 0 20 25
15.2.25.2 # of visitors (divided by 100,000) on FWS lands and in FWS facilities (only include visitors to fee areas and permitted users (duck stamps)) (GPRA)
Refuges 360 0 0 0 0 0 0 0 0 360 413
RIM.1.2.2.0712 15.2.26 % of priority recreation facilities that meet applicable accessibility standards (GPRA)
Refuges 75% 86% 87% 84% 75% 95% 42% 47% 82% 96% 81% 98% 73% 83% 72% 81% 82% 94% 0% 97%
15.2.26.1 # of priority recreation facilities that meet applicable accessibility standards (GPRA)
Refuges 346 399 39 38 32 40 24 27 92 108 50 61 68 78 12 13 29 34 0 447
15.2.26.2 total # of refuges open to the public Refuges 464 464 45 45 42 42 57 57 112 112 62 62 94 94 16 16 36 36 0 462
May 27, 2010 - 9 - 11:01:43 AM

U.S. Fish and Wildlife Service
FWS Operational Plan - GPRA Measures
GPRA Measure FWS Operational Plan Measure Program
2009 2010National Region 1 - Pacific Region 2 - Southwest Region 3 - Great Lakes -
Big RiversRegion 4 - Southeast Region 5 - Northeast Region 6 - Mountain-
PrairieRegion 7 - Alaska Region 8 - California-
NevadaRegion 9 -
HeadquartersNational
Target Actual Target Actual Target Actual Target Actual Target Actual Target Actual Target Actual Target Actual Target Actual Target Actual TargetRIM.1.2.2.0712 (GPRA)
REM.2.0.2.0712 15.8.2 Number non-FWS river, shoreline, and trail miles made available for recreation through financial support and technical assistance (GPRA)
338 3,722 2 3 3 6 70 3,453 8 1 4 2 254 254 0 0 0 3,684
15.8.3 # of non-FWS river, trail and shoreline miles made available for recreation through Federal Assistance financial support and technical assistance (GPRA)
Federal Assistance 10 3,404 0 0 0 10 3,403 0 0 0 0 0 0 3,403
15.8.4 # of non-FWS river, trail and shoreline miles for recreational opportunities made available through NRDA restorations - annual (GPRA)
Environmental Contaminants 328 319 2 3 3 6 60 50 8 1 4 2 254 254 0 0 0 281
REM.2.0.1.0712 15.8.5 Number of non-FWS acres made available for recreation through financial support and technical assistance (GPRA)
24,209,267 31,716,660 4,694,682 3,093,072 2,000,000 2,517,317 1,695,998 2,050,244 2,000,065 10,213,255 5,801,147 5,828,144 7,798,375 7,797,628 0 0 219,000 217,000 0 31,454,457
15.8.6 # of non-FWS acres made available for recreation through Federal Assistance financial support and technical assistance (GPRA
Federal Assistance 24,207,390 31,714,183 4,694,392 3,092,782 2,000,000 2,515,839 1,695,998 2,050,114 2,000,000 10,213,255 5,800,000 5,827,957 7,798,000 7,797,236 0 0 219,000 217,000 0 31,452,996
15.8.7 # of non-FWS acres opened or enhanced for fish and wildlife-related recreation including: hunting, fishing, wildlife observation, photography, interpretation, and environmental education through the Tribal Wildlife Grants Program (GPRA)
External Affairs 0 0 0 0 0 0 0 0 0 0
15.8.8 # of non-FWS acres opened or enhanced for fish and wildlife-related recreation including: hunting, fishing, wildlife observation, photography, interpretation, and environmental education through the Tribal Landowner Incentive Grants Program (GPRA)
External Affairs 0 0 0 0 0 0 0 0 0 0
15.8.9 # of non-FWS acres of recreational opportunities made available through NRDA restorations - annual (GPRA)
Environmental Contaminants 1,877 2,477 290 290 0 1,478 130 65 0 1,147 187 375 392 0 0 0 0 1,461
REM.2.0.3.0712 15.8.10 # of waters where recreational fishing opportunities are provided - NFHS (GPRA)(PART)
Hatcheries - F 221 230 0 0 0 0 0 0 0 0 221 230 230
SEM.1.0.1.0712 DOI 16 Percent change from the 10-year average in the number of acres burned by unplanned and unwanted wildland fires on FWS lands (GPRA)
0% 0% 0% 0% 0% 0% 0% 0% 0% 0%
OP 16 Percent change from the 10-year average in the number of acres burned by unplanned and unwanted wildland fires on FWS lands (GPRA)
0% 0% 0% 0% 0% 0% 0% 0% 0% 0%
16.1.2 % change from the 10-year average in the number of acres burned by unplanned and unwanted wildland fires on FWS lands (GPRA)
Refuges 0% 0% 0% 0% 0% 0% 0% 0% 0% 0%
16.1.2.1 # of acres burned by unplanned and unwanted wildland fires on FWS lands (GPRA)
Refuges 0 0 0 0 0 0 0 0 0 0
16.1.2.2 10-year average in the # of acres burned by unplanned and unwanted wildland fires on FWS lands (GPRA)
Refuges 0 0 0 0 0 0 0 0 0 0
SIM.1.1.1.0412 CSF 16.1 Percent of unplanned and unwanted wildland fires on FWS land controlled during initial attack (GPRA)
0% 0% 0% 0% 0% 0% 0% 0% 0% 0%
16.1.1 % of unplanned and unwanted wildland fires on FWS land controlled during initial attack (GPRA)
Refuges 0% 0% 0% 0% 0% 0% 0% 0% 0% 0%
16.1.1.1 # of unplanned and unwanted wildland fires on FWS land controlled during initial attack (GPRA)
Refuges 0 0 0 0 0 0 0 0 0 0
16.1.1.2 # of unplanned and unwanted wildland fires on FWS land (GPRA)
Refuges 0 0 0 0 0 0 0 0 0 0
SIM.1.1.2.0712 CSF 16.2 Percent of acres treated which achieve fire management objectives as identified in applicable management plans (GPRA)
0 0 0 0 0 0 0 0 0 0
16.2.1 % of acres treated which achieve fire management objectives as identified in applicable management plans (GPRA)
Refuges 0% 0% 0% 0% 0% 0% 0% 0% 0% 0%
16.2.1.1 # of acres treated which achieve fire management objectives as identified in applicable management plans (GPRA)
Refuges 0 0 0 0 0 0 0 0 0 0
May 27, 2010 - 10 - 11:01:43 AM

U.S. Fish and Wildlife Service
FWS Operational Plan - GPRA Measures
GPRA Measure FWS Operational Plan Measure Program
2009 2010National Region 1 - Pacific Region 2 - Southwest Region 3 - Great Lakes -
Big RiversRegion 4 - Southeast Region 5 - Northeast Region 6 - Mountain-
PrairieRegion 7 - Alaska Region 8 - California-
NevadaRegion 9 -
HeadquartersNational
Target Actual Target Actual Target Actual Target Actual Target Actual Target Actual Target Actual Target Actual Target Actual Target Actual TargetSIM.1.1.2.0712 16.2.1.2 # acres treated (GPRA) Refuges 0 0 0 0 0 0 0 0 0 0
SIM.1.1.3B.0712 16.2.2 % of treated WUI acres that are identified in Community Wildfire Protection Plans or other applicable collaboratively developed plans (GPRA)
Refuges 0% 0% 0% 0% 0% 0% 0% 0% 0% 0%
16.2.2.2 # of treated WUI acres (GPRA) Refuges 0 0 0 0 0 0 0 0 0 0
SIM.1.1.3A.0712 16.2.2.1 # of treated WUI acres that are identified in Community Wildfire Protection Plans or other applicable collaboratively developed plans (GPRA)
Refuges 0 0 0 0 0 0 0 0 0 0
SIM.1.1.4.0412 16.2.3 # of acres in WUI treated per million dollars gross investment (GPRA)
Refuges 0 0 0 0 0 0 0 0 0 0
SEM.1.0.2.0712 17.1.8 % of facilities meeting the minimum Department security guidelines (GPRA)
Refuges 0% 0% 0% 0% 0% 0% 0% 0% 0% 0% 60%
17.1.8.1 # of facilities meeting the minimum Department security guidelines (GPRA)
Refuges 0 0 0 0 0 0 0 0 0 0 430
17.1.8.2 # of facilities (GPRA) Refuges 0 0 0 0 0 0 0 0 0 0 718
SIM.1.2.2.0712 17.1.9 % physical security vulnerabilities mitigated at FWS facilities
Refuges 0% 0% 0% 0% 0% 0% 0% 0% 0% 0%
17.1.9.1 # of physical security vulnerabilities reduced at FWS facilities (GPRA)
Refuges 0 0 0 0 0 0 0 0 0 0
17.1.9.2 # of physical security vulnerabilities identified at FWS facilities (GPRA)
Refuges 0 0 0 0 0 0 0 0 0 0
SEM.1.0.4.0712 17.1.10 % change in Part I offenses that occur on FWS lands or under FWS jurisdiction (GPRA)
Refuges -13% 0% 0% 0% 0% 0% 0% 0% 0% 0% 5%
17.1.10.1 # of Part 1 offenses from prior year on FWS lands (GPRA)
Refuges -65 0 0 0 0 0 0 0 0 -65 25
17.1.10.2 # of Part I offenses at end of year on FWS lands (GPRA)
Refuges 511 511 57 57 57 57 53 53 208 208 89 89 5 5 7 7 35 35 0 536
SEM.1.0.5.0712 17.1.11 % change in Part II offenses (excluding natural, cultural and heritage resource crimes) that occur on FWS lands or under FWS jurisdiction (GPRA)
Refuges 0% 0% 0% 0% 0% 0% 0% 0% 0% 0% 5%
17.1.11.1 # of Part II offenses (excluding natural, cultural and heritage resource crimes) reduced that occur on FWS lands (GPRA)
Refuges 0 0 0 0 0 0 0 0 0 0 1,851
17.1.11.2 # of Part II offenses (excluding natural, cultural and heritage resource crimes) (GPRA)
Refuges 37,027 37,027 1,435 1,435 16,063 16,063 1,719 1,719 9,949 9,949 3,817 3,817 1,719 1,719 554 554 1,771 1,771 0 38,878
SEM.1.0.6.0712 17.1.12 % change in natural, cultural and heritage resource crimes that occur on FWS lands or under FWS jurisdiction (GPRA)
Refuges 32% 0% 0% 0% 0% 0% 0% 0% 0% 0% 5%
17.1.12.1 # of natural, cultural and heritage resource crimes reduced that occur on FWS lands (GPRA)
Refuges 12,815 0 0 0 0 0 0 0 0 12,815 2,660
17.1.12.2 # of natural, cultural and heritage resource crimes that occur on FWS lands (GPRA)
Refuges 40,421 40,421 1,484 1,484 16,120 16,120 2,650 2,650 5,436 5,436 8,306 8,306 3,802 3,802 633 633 1,990 1,990 0 55,900
SIM.1.2.3.0712 17.1.13 % reduction of incidents/investigations closed for Part I, Part II and natural, cultural and heritage resource offenses (GPRA)
Refuges 0% 0% 0% 0% 0% 0% 0% 0% 0% 0%
17.1.13.1 # of incidents/investigations closed for Part I, Part II and natural, cultural and heritage resource offenses (GPRA)
Refuges 0 0 0 0 0 0 0 0 0 0
17.1.13.2 # of incidents/investigations for Part I, Part II and natural, cultural and heritage resource offenses (GPRA)
Refuges 0 0 0 0 0 0 0 0 0 0
SIM.1.3.1.0712 17.1.14 % of open complaints received from property owners, concerning FWS actions affecting the status of their private property, resolved within one year (GPRA)
Refuges 0% 0% 0% 0% 0% 0% 0% 0% 0% 0%
17.1.14.1 # of open complaints received from property owners, concerning FWS actions affecting the status of their private property, resolved within one year (GPRA)
Refuges 0 0 0 0 0 0 0 0 0 0
17.1.14.2 # of open complaints received from property owners, concerning FWS actions affecting the status of their private property (GPRA)
Refuges 0 0 0 0 0 0 0 0 0 0
SEM.1.0.3.0712 17.1.15 Emergency Management: Level of emergency preparedness as measured by the Interior Readiness (I-READ) Index (GPRA)
Refuges 97 0 0 0 0 0 0 0 0 97 80
May 27, 2010 - 11 - 11:01:43 AM

U.S. Fish and Wildlife Service
FWS Operational Plan - GPRA Measures
GPRA Measure FWS Operational Plan Measure Program
2009 2010National Region 1 - Pacific Region 2 - Southwest Region 3 - Great Lakes -
Big RiversRegion 4 - Southeast Region 5 - Northeast Region 6 - Mountain-
PrairieRegion 7 - Alaska Region 8 - California-
NevadaRegion 9 -
HeadquartersNational
Target Actual Target Actual Target Actual Target Actual Target Actual Target Actual Target Actual Target Actual Target Actual Target Actual TargetSIM.1.2.1.0712 17.1.16 Mitigate hazards: % of physical and
chemical hazards mitigated in appropriate time to ensure visitor or public safety (GPRA)
Refuges 75% 32% 67% 9% 57% 77% 76% 44% 80% 29% 92% 70% 80% 19% 37% 8% 0% 0% 46%
17.1.16.1 # of physical and chemical hazards mitigated in appropriate time to ensure visitor or public safety (GPRA)
Refuges 541 232 83 11 30 41 67 39 132 48 65 50 150 36 14 3 4 0 232
17.1.16.2 # of physical and chemical hazards identified (GPRA)
Refuges 724 724 123 123 53 53 88 88 164 164 71 71 187 187 38 38 0 0 0 509
SIM.1.2.4.0712 17.1.17 % of FWS public lands management units where travel management plans or equivalent regulatory or policy documents are completed (GPRA)
Refuges 57% 77% 27% 38% 60% 96% 68% 92% 53% 91% 49% 78% 73% 73% 38% 81% 55% 59% 0% 89%
17.1.17.1 # of FWS public lands management units where travel management plans or equivalent regulatory or policy documents completed (GPRA)
Refuges 332 450 17 24 27 43 45 61 68 117 35 56 107 107 6 13 27 29 0 520
17.1.17.2 # of FWS public lands management units (GPRA)
Refuges 586 586 64 64 45 45 66 66 128 128 72 72 146 146 16 16 49 49 0 586
XIM.2.5.1.0412-1 CSF 2.11 Conservation and Biological Research Facilities Improvement: Overall condition of NWRS buildings and structures (as measured by the FCI) that are mission critical and mission dependent (as measured by the API) with emphasis on improving the condition of assets with critical health and safety needs (GPRA)
0.071 0.076 0.175 0.194 0.057 0.047 0.138 0.124 0.048 0.059 0.091 0.090 0.047 0.051 0.000 0.014 0.014 0.000 0.069
2.11.1 The condition of NWRS conservation and biological research facilities, as measured by the DOI FCI, is x. (GPRA)(PART)
Refuges 0.071 0.076 0.175 0.194 0.057 0.047 0.138 0.124 0.048 0.059 0.091 0.090 0.047 0.051 0.000 0.014 0.014 0.000 0.069
2.11.1.1 value ($) of deferred maintenance backlog of impoundments, canals, drainage ditches, WCS, pumping stations, nesting islands having undergone condition assessment (GPRA)(PART)
Refuges 377,358,020 404,262,451 123,456,612 137,038,402 13,458,637 11,057,882 87,644,383 78,435,196 94,749,561 117,658,208 21,960,432 21,830,438 21,790,328 23,944,930 0 14,298,067 14,297,394 0 414,647,152
2.11.1.2 replacement value ($) of impoundments, canals, drainage ditches, WCS, pumping stations, nesting islands having undergone condition assessment (GPRA)(PART)
Refuges 5,294,933,472 5,294,933,472 704,621,400 704,621,400 236,814,840 236,814,840 634,507,555 634,507,555 1,989,651,816 1,989,651,816 241,252,791 241,252,791 465,618,200 465,618,200 615,998 615,998 1,021,850,872 1,021,850,872 0 0 5,973,130,488
XIM.2.5.1.0412-2 CSF 5.5 Conservation and Biological Research Facilities Improvement: Overall condition of NFHS buildings and structures (as measured by the FCI) that are mission critical and mission dependent (as measured by the API) with emphasis on improving the condition of assets with critical health and safety needs (GPRA)
0.119 0.106 0.097 0.086 0.175 0.168 0.163 0.215 0.189 0.186 0.160 0.100 0.103 0.081 0.000 0.012 0.013 0.000 0.098
5.5.1 The condition of NFHS mission critical water management assets, as measured by the DOI FCI, is x. (GPRA)
Hatcheries - F 0.119 0.106 0.097 0.086 0.175 0.168 0.163 0.215 0.189 0.186 0.160 0.100 0.103 0.081 0.000 0.012 0.013 0.000 0.098
5.5.1.1 Total NFHS deferred maintenance needs ($) for MCWM assets (GPRA)
Hatcheries - F 129,476,777 115,472,369 27,950,556 24,604,711 18,029,365 17,343,542 12,679,317 16,637,765 25,702,121 25,184,146 26,244,058 16,451,476 17,054,788 13,322,137 0 1,816,572 1,928,592 0 128,244,148
5.5.1.2 Total NFHS replacement value ($) for MCWM assets (GPRA)
Hatcheries - F 1,087,233,873 1,087,233,873 287,248,982 287,248,982 103,045,303 103,045,303 77,552,052 77,552,052 135,749,399 135,749,399 164,143,515 164,143,515 165,407,773 165,407,773 0 154,086,849 154,086,849 0 1,305,484,969
13.1.6 NWRS Cultural and Natural Heritage-related Facilities Improvement: Overall condition of NWRS cultural and natural heritage facilities (as measured by the FCI) that are mission critical and mission dependent (as measured by the API) with emphasis on improving the condition of assets with critical health and safety needs (GPRA) (PART)
Refuges 0.125 0.149 0.224 0.230 0.314 0.307 0.851 0.802 0.078 0.072 0.079 0.120 0.050 0.056 0.201 0.190 0.104 0.110 0.000 0.149
13.1.6.1 value ($) of deferred maintenance backlog of historic landmarks/National Register of Historic Properties having undergone condition assessment (GPRA)(PART)
Refuges 13,685,243 16,295,673 4,508,400 4,622,177 1,239,563 1,215,000 1,072,938 1,012,206 445,703 412,510 4,886,600 7,408,900 226,246 253,000 93,280 88,000 1,212,512 1,283,880 0 16,322,523
13.1.6.2 replacement value ($) of historic landmarks/National Register of Historic Properties having undergone condition assessment (GPRA) (PART)
Refuges 109,468,431 109,468,431 20,129,631 20,129,631 3,951,311 3,951,311 1,261,489 1,261,489 5,693,760 5,693,760 61,743,557 61,743,557 4,547,956 4,547,956 463,110 463,110 11,677,617 11,677,617 0 0 109,694,177
13.1.7 NFHS Cultural and Natural Heritage-related Facilities Improvement: Overall condition of NFHS cultural and natural heritage facilities (as measured by the FCI) that are mission critical and mission dependent (as measured by the API) with emphasis on improving the condition of assets with critical
Hatcheries - F 0.055 0.066 0.038 0.041 0.000 0.000 0.243 0.043 0.000 0.067 0.133 0.000 0.000 0.000 0.043
May 27, 2010 - 12 - 11:01:43 AM
U.S. Fish and Wildlife Service
FWS Operational Plan - GPRA Measures
GPRA Measure FWS Operational Plan Measure Program
2009 2010National Region 1 - Pacific Region 2 - Southwest Region 3 - Great Lakes -
Big RiversRegion 4 - Southeast Region 5 - Northeast Region 6 - Mountain-
PrairieRegion 7 - Alaska Region 8 - California-
NevadaRegion 9 -
HeadquartersNational
Target Actual Target Actual Target Actual Target Actual Target Actual Target Actual Target Actual Target Actual Target Actual Target Actual TargetXIM.2.5.1.0412-2 health and safety needs (GPRA)
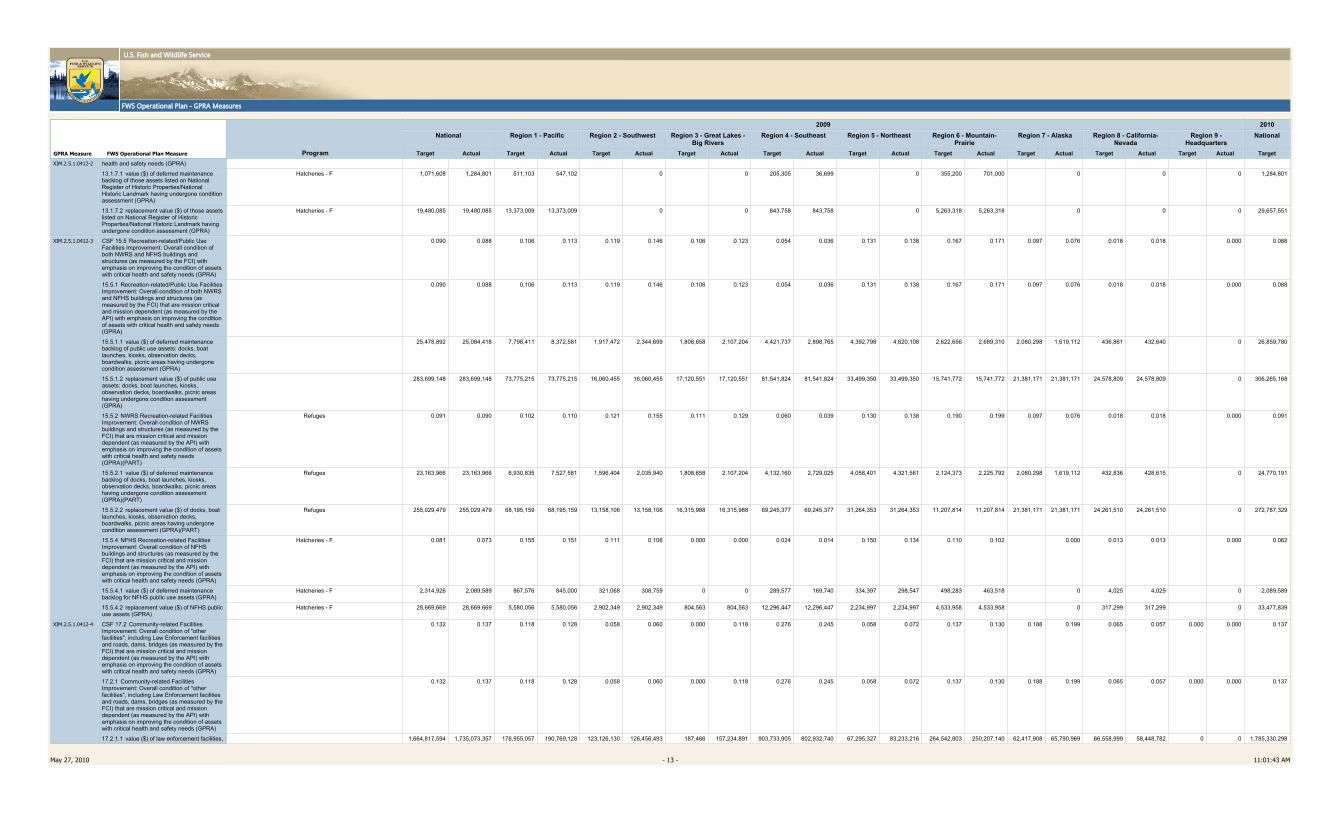
13.1.7.1 value ($) of deferred maintenance backlog of those assets listed on National Register of Historic Properties/National Historic Landmark having undergone condition assessment (GPRA)
Hatcheries - F 1,071,608 1,284,801 511,103 547,102 0 0 205,305 36,699 0 355,200 701,000 0 0 0 1,284,801
13.1.7.2 replacement value ($) of those assets listed on National Register of Historic Properties/National Historic Landmark having undergone condition assessment (GPRA)
Hatcheries - F 19,480,085 19,480,085 13,373,009 13,373,009 0 0 843,758 843,758 0 5,263,318 5,263,318 0 0 0 29,657,551
XIM.2.5.1.0412-3 CSF 15.5 Recreation-related/Public Use Facilities Improvement: Overall condition of both NWRS and NFHS buildings and structures (as measured by the FCI) with emphasis on improving the condition of assets with critical health and safety needs (GPRA)
0.090 0.088 0.106 0.113 0.119 0.146 0.106 0.123 0.054 0.036 0.131 0.138 0.167 0.171 0.097 0.076 0.018 0.018 0.000 0.088
15.5.1 Recreation-related/Public Use Facilities Improvement: Overall condition of both NWRS and NFHS buildings and structures (as measured by the FCI) that are mission critical and mission dependent (as measured by the API) with emphasis on improving the condition of assets with critical health and safety needs (GPRA)
0.090 0.088 0.106 0.113 0.119 0.146 0.106 0.123 0.054 0.036 0.131 0.138 0.167 0.171 0.097 0.076 0.018 0.018 0.000 0.088
15.5.1.1 value ($) of deferred maintenance backlog of public use assets: docks, boat launches, kiosks, observation decks, boardwalks, picnic areas having undergone condition assessment (GPRA)
25,478,892 25,084,418 7,798,411 8,372,581 1,917,472 2,344,699 1,808,658 2,107,204 4,421,737 2,898,765 4,392,798 4,620,108 2,622,656 2,689,310 2,080,298 1,619,112 436,861 432,640 0 26,859,780
15.5.1.2 replacement value ($) of public use assets: docks, boat launches, kiosks, observation decks, boardwalks, picnic areas having undergone condition assessment (GPRA)
283,699,148 283,699,148 73,775,215 73,775,215 16,060,455 16,060,455 17,120,551 17,120,551 81,541,824 81,541,824 33,499,350 33,499,350 15,741,772 15,741,772 21,381,171 21,381,171 24,578,809 24,578,809 0 306,265,168
15.5.2 NWRS Recreation-related Facilities Improvement: Overall condition of NWRS buildings and structures (as measured by the FCI) that are mission critical and mission dependent (as measured by the API) with emphasis on improving the condition of assets with critical health and safety needs (GPRA)(PART)
Refuges 0.091 0.090 0.102 0.110 0.121 0.155 0.111 0.129 0.060 0.039 0.130 0.138 0.190 0.199 0.097 0.076 0.018 0.018 0.000 0.091
15.5.2.1 value ($) of deferred maintenance backlog of docks, boat launches, kiosks, observation decks, boardwalks, picnic areas having undergone condition assessment (GPRA)(PART)
Refuges 23,163,966 23,163,966 6,930,835 7,527,581 1,596,404 2,035,940 1,808,658 2,107,204 4,132,160 2,729,025 4,058,401 4,321,561 2,124,373 2,225,792 2,080,298 1,619,112 432,836 428,615 0 24,770,191
15.5.2.2 replacement value ($) of docks, boat launches, kiosks, observation decks, boardwalks, picnic areas having undergone condition assessment (GPRA)(PART)
Refuges 255,029,479 255,029,479 68,195,159 68,195,159 13,158,106 13,158,106 16,315,988 16,315,988 69,245,377 69,245,377 31,264,353 31,264,353 11,207,814 11,207,814 21,381,171 21,381,171 24,261,510 24,261,510 0 272,787,329
15.5.4 NFHS Recreation-related Facilities Improvement: Overall condition of NFHS buildings and structures (as measured by the FCI) that are mission critical and mission dependent (as measured by the API) with emphasis on improving the condition of assets with critical health and safety needs (GPRA)
Hatcheries - F 0.081 0.073 0.155 0.151 0.111 0.106 0.000 0.000 0.024 0.014 0.150 0.134 0.110 0.102 0.000 0.013 0.013 0.000 0.062
15.5.4.1 value ($) of deferred maintenance backlog for NFHS public use assets (GPRA)
Hatcheries - F 2,314,926 2,089,589 867,576 845,000 321,068 308,759 0 0 289,577 169,740 334,397 298,547 498,283 463,518 0 4,025 4,025 0 2,089,589
15.5.4.2 replacement value ($) of NFHS public use assets (GPRA)
Hatcheries - F 28,669,669 28,669,669 5,580,056 5,580,056 2,902,349 2,902,349 804,563 804,563 12,296,447 12,296,447 2,234,997 2,234,997 4,533,958 4,533,958 0 317,299 317,299 0 33,477,839
XIM.2.5.1.0412-4 CSF 17.2 Community-related Facilities Improvement: Overall condition of "other facilities", including Law Enforcement facilities and roads, dams, bridges (as measured by the FCI) that are mission critical and mission dependent (as measured by the API) with emphasis on improving the condition of assets with critical health and safety needs (GPRA)
0.132 0.137 0.118 0.128 0.058 0.060 0.000 0.118 0.276 0.245 0.058 0.072 0.137 0.130 0.188 0.199 0.065 0.057 0.000 0.000 0.137
17.2.1 Community-related Facilities Improvement: Overall condition of "other facilities", including Law Enforcement facilities and roads, dams, bridges (as measured by the FCI) that are mission critical and mission dependent (as measured by the API) with emphasis on improving the condition of assets with critical health and safety needs (GPRA)
0.132 0.137 0.118 0.128 0.058 0.060 0.000 0.118 0.276 0.245 0.058 0.072 0.137 0.130 0.188 0.199 0.065 0.057 0.000 0.000 0.137
17.2.1.1 value ($) of law enforcement facilities, 1,664,817,594 1,735,073,357 176,955,057 190,769,128 123,126,130 126,456,493 187,466 157,234,891 903,733,905 802,932,740 67,295,327 83,233,216 264,542,803 250,207,140 62,417,908 65,790,969 66,558,999 58,448,782 0 0 1,785,330,298
May 27, 2010 - 13 - 11:01:43 AM

U.S. Fish and Wildlife Service
FWS Operational Plan - GPRA Measures
GPRA Measure FWS Operational Plan Measure Program
2009 2010National Region 1 - Pacific Region 2 - Southwest Region 3 - Great Lakes -
Big RiversRegion 4 - Southeast Region 5 - Northeast Region 6 - Mountain-
PrairieRegion 7 - Alaska Region 8 - California-
NevadaRegion 9 -
HeadquartersNational
Target Actual Target Actual Target Actual Target Actual Target Actual Target Actual Target Actual Target Actual Target Actual Target Actual TargetXIM.2.5.1.0412-4 roads/bridges/dams having undergone
condition assessment (GPRA)
17.2.1.2 replacement value ($) of law enforcement facilities, roads/bridges/dams having undergone condition assessment (GPRA)
12,646,837,822 12,646,837,822 1,495,083,958 1,495,083,958 2,118,463,027 2,118,463,027 1,328,612,209 1,328,612,209 3,270,748,159 3,270,748,159 1,159,086,982 1,159,086,982 1,926,657,384 1,926,657,384 331,235,118 331,235,118 1,016,950,984 1,016,950,984 0 0 12,996,259,519
17.2.2 Community-related Facilities Improvement: Overall condition of NWRS "other facilities", including roads, dams, bridges (as measured by the FCI) that are mission critical and mission dependent (as measured by the API) with emphasis on improving the condition of assets with critical health and safety needs (GPRA) (PART)
Refuges 0.132 0.137 0.118 0.128 0.058 0.060 0.000 0.118 0.276 0.245 0.058 0.072 0.137 0.130 0.188 0.199 0.065 0.057 0.000 0.000 0.137
17.2.2.1 value ($) of deferred maintenance of roads/bridges/dams having undergone condition assessment (GPRA) (PART)
Refuges 1,664,817,594 1,735,073,357 176,955,057 190,769,128 123,126,130 126,456,493 187,466 157,234,891 903,733,905 802,932,740 67,295,327 83,233,216 264,542,803 250,207,140 62,417,908 65,790,969 66,558,999 58,448,782 0 0 1,785,330,298
17.2.2.2 replacement value ($) of roads/bridges/dams having undergone condition assessment (GPRA) (PART)
Refuges 12,646,837,822 12,646,837,822 1,495,083,958 1,495,083,958 2,118,463,027 2,118,463,027 1,328,612,209 1,328,612,209 3,270,748,159 3,270,748,159 1,159,086,982 1,159,086,982 1,926,657,384 1,926,657,384 331,235,118 331,235,118 1,016,950,984 1,016,950,984 0 0 12,996,259,519
17.2.3 Community-related Facilities Improvement: Overall condition of Law Enforcement facilities (as measured by the FCI) that are mission critical and mission dependent (as measured by the API) with emphasis on improving the condition of assets with critical health and safety needs (GPRA)
Law Enforcement 0.000 0.000 0.000 0.000 0.000 0.000 0.000 0.000 0.000 0.000
17.2.3.1 value ($) deferred maintenance of LE facilities having undergone condition assessment (GPRA)
Law Enforcement 0 0 0 0 0 0 0 0 0 0
17.2.3.2 replacement value ($) of LE facilities having undergone condition assessment (GPRA)
Law Enforcement 0 0 0 0 0 0 0 0 0 0
XEM.1.0.1.0712 50.1.1 Percent of reporting entities with unqualified audits - Yes or No (GPRA)
Business Management & Operations - BMO - GenOps 100% 0% 0% 0% 0% 0% 0% 0% 0% 100% 100% 100%
XEM.1.0.2.0612 50.1.2 Percent of bureaus and offices that establish and maintain an effective, risk based internal control environment as defined by the Federal Managers Financial Integrity Act (FMFIA) and revised OMB Circular A-123 - Yes or No (GPRA)
Business Management & Operations - BMO - GenOps 0% 0% 0% 0% 0% 0% 0% 0% 0% 0% 0% 0%
XIM.1.1.1.0612 50.1.3 % of material weaknesses and non-compliance issues that are corrected on schedule (GPRA)
Business Management & Operations - BMO - GenOps 92% 92% 0% 0% 0% 0% 0% 0% 0% 0% 92% 92%
50.1.3.1 # of material weaknesses and material non-compliance issues that are corrected on schedule (GPRA)
Business Management & Operations - BMO - GenOps 11 11 0 0 0 0 0 0 0 0 11 11
50.1.3.2 # of material weaknesses and material non-compliance issues (GPRA)
Business Management & Operations - BMO - GenOps 12 12 0 0 0 0 0 0 0 0 12 12 1
XIM.1.1.2.0612 50.1.4 % of established targets in Financial Performance Metrics met, as defined in FAM No. 2003-015 (GPRA)
Business Management & Operations - BMO - GenOps 78% 92% 100% 75% 75% 100% 75% 75% 75% 100% 75% 100% 75% 100% 50% 75% 100% 100% 75% 100% 83%
50.1.4.1 # of established targets in Financial Performance Metrics met (GPRA)
Business Management & Operations - BMO - GenOps 28 33 4 3 3 4 3 3 3 4 3 4 3 4 2 3 4 4 3 4 30
50.1.4.2 # of established targets in Financial Performance Metrics (GPRA)
Business Management & Operations - BMO - GenOps 36 36 4 4 4 4 4 4 4 4 4 4 4 4 4 4 4 4 4 4 36
XEM.2.0.1.0412 50.1.6 % of time that networks are operational for all users (GPRA)
Information Resources Technology Management - CIO - GenOps 99% 99% 0% 0% 0% 0% 0% 0% 0% 0% 99% 99% 99%
50.1.6.1 time (hours) that networks are operational for all users (GPRA)
Information Resources Technology Management - CIO - GenOps 8,716 8,716 0 0 0 0 0 0 0 0 8,716 8,716 8,716
50.1.6.2 time (hours) that networks are supposed to be available for all users (GPRA)
Information Resources Technology Management - CIO - GenOps 8,760 8,760 0 0 0 0 0 0 0 0 8,760 8,760 8,760
XEM.2.0.2.0712 50.1.7 % of completed IT projects for which customers report objectives were met based on post-implementation review results and/or operational analysis results (GPRA)
Information Resources Technology Management - CIO - GenOps 100% 100% 0% 0% 0% 0% 0% 0% 0% 0% 100% 100% 100%
50.1.7.1 # of completed IT projects for which customers report objectives were met (GPRA)
Information Resources Technology Management - CIO - GenOps 1 1 0 0 0 0 0 0 0 0 1 1 1
50.1.7.2 # of completed IT projects (GPRA) Information Resources Technology Management - CIO - GenOps 1 1 0 0 0 0 0 0 0 0 1 1 1
XEM.2.0.3.0712 50.1.8 % of systems, and lines of business/functional areas associated with an approved modernization blueprint that are managed consistent with that blueprint (GPRA)
Information Resources Technology Management - CIO - GenOps 100% 136% 92%
50.1.8.1 # of systems, and lines of Information Resources Technology Management - CIO - GenOps 1 11 15 11
May 27, 2010 - 14 - 11:01:43 AM
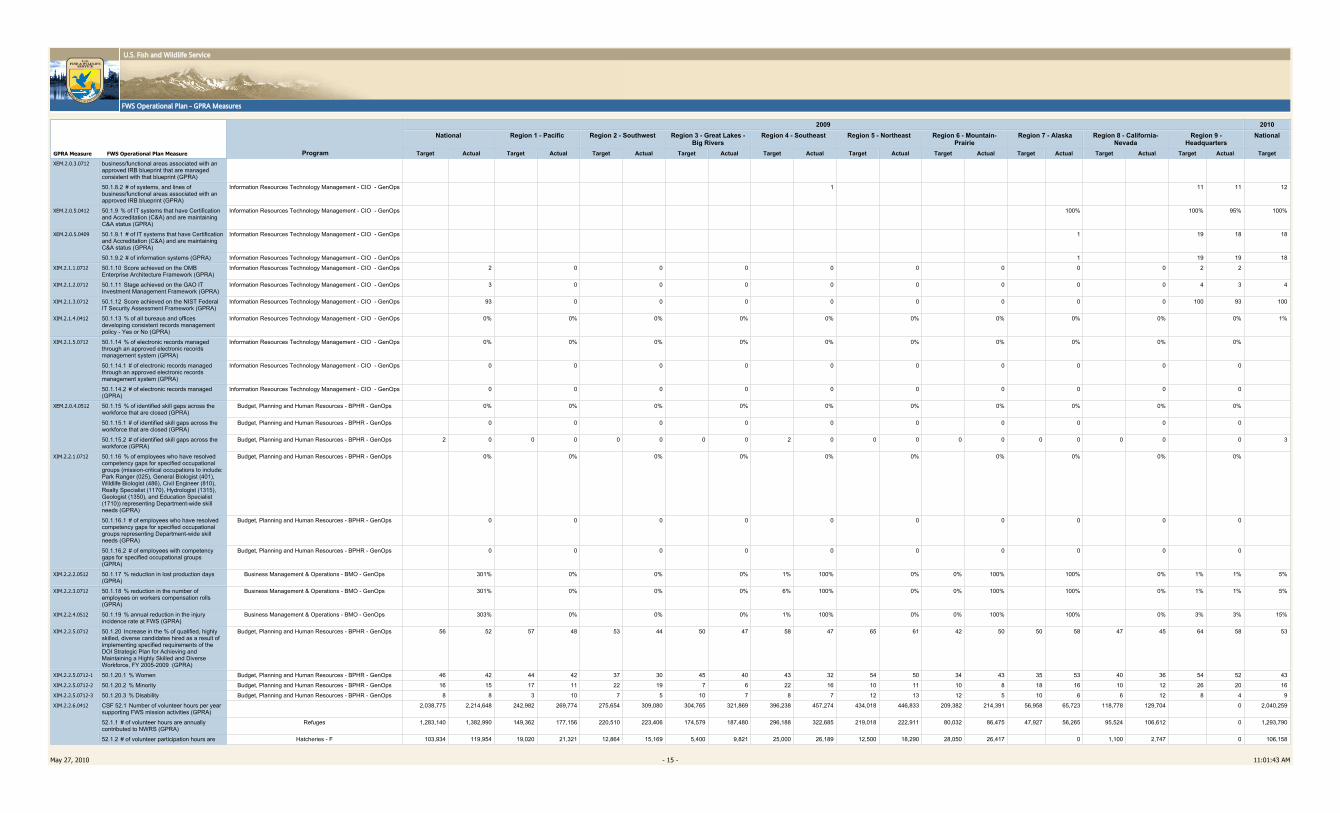
U.S. Fish and Wildlife Service
FWS Operational Plan - GPRA Measures
GPRA Measure FWS Operational Plan Measure Program
2009 2010National Region 1 - Pacific Region 2 - Southwest Region 3 - Great Lakes -
Big RiversRegion 4 - Southeast Region 5 - Northeast Region 6 - Mountain-
PrairieRegion 7 - Alaska Region 8 - California-
NevadaRegion 9 -
HeadquartersNational
Target Actual Target Actual Target Actual Target Actual Target Actual Target Actual Target Actual Target Actual Target Actual Target Actual TargetXEM.2.0.3.0712 business/functional areas associated with an
approved IRB blueprint that are managed consistent with that blueprint (GPRA)
50.1.8.2 # of systems, and lines of business/functional areas associated with an approved IRB blueprint (GPRA)
Information Resources Technology Management - CIO - GenOps 1 11 11 12
XEM.2.0.5.0412 50.1.9 % of IT systems that have Certification and Accreditation (C&A) and are maintaining C&A status (GPRA)
Information Resources Technology Management - CIO - GenOps 100% 100% 95% 100%
XEM.2.0.5.0409 50.1.9.1 # of IT systems that have Certification and Accreditation (C&A) and are maintaining C&A status (GPRA)
Information Resources Technology Management - CIO - GenOps 1 19 18 18
50.1.9.2 # of information systems (GPRA) Information Resources Technology Management - CIO - GenOps 1 19 19 18
XIM.2.1.1.0712 50.1.10 Score achieved on the OMB Enterprise Architecture Framework (GPRA)
Information Resources Technology Management - CIO - GenOps 2 0 0 0 0 0 0 0 0 2 2
XIM.2.1.2.0712 50.1.11 Stage achieved on the GAO IT Investment Management Framework (GPRA)
Information Resources Technology Management - CIO - GenOps 3 0 0 0 0 0 0 0 0 4 3 4
XIM.2.1.3.0712 50.1.12 Score achieved on the NIST Federal IT Security Assessment Framework (GPRA)
Information Resources Technology Management - CIO - GenOps 93 0 0 0 0 0 0 0 0 100 93 100
XIM.2.1.4.0412 50.1.13 % of all bureaus and offices developing consistent records management policy - Yes or No (GPRA)
Information Resources Technology Management - CIO - GenOps 0% 0% 0% 0% 0% 0% 0% 0% 0% 0% 1%
XIM.2.1.5.0712 50.1.14 % of electronic records managed through an approved electronic records management system (GPRA)
Information Resources Technology Management - CIO - GenOps 0% 0% 0% 0% 0% 0% 0% 0% 0% 0%
50.1.14.1 # of electronic records managed through an approved electronic records management system (GPRA)
Information Resources Technology Management - CIO - GenOps 0 0 0 0 0 0 0 0 0 0
50.1.14.2 # of electronic records managed (GPRA)
Information Resources Technology Management - CIO - GenOps 0 0 0 0 0 0 0 0 0 0
XEM.2.0.4.0512 50.1.15 % of identified skill gaps across the workforce that are closed (GPRA)
Budget, Planning and Human Resources - BPHR - GenOps 0% 0% 0% 0% 0% 0% 0% 0% 0% 0%
50.1.15.1 # of identified skill gaps across the workforce that are closed (GPRA)
Budget, Planning and Human Resources - BPHR - GenOps 0 0 0 0 0 0 0 0 0 0
50.1.15.2 # of identified skill gaps across the workforce (GPRA)
Budget, Planning and Human Resources - BPHR - GenOps 2 0 0 0 0 0 0 0 2 0 0 0 0 0 0 0 0 0 0 3
XIM.2.2.1.0712 50.1.16 % of employees who have resolved competency gaps for specified occupational groups (mission-critical occupations to include: Park Ranger (025), General Biologist (401), Wildlife Biologist (486), Civil Engineer (810), Realty Specialist (1170), Hydrologist (1315), Geologist (1350), and Education Specialist (1710)) representing Department-wide skill needs (GPRA)
Budget, Planning and Human Resources - BPHR - GenOps 0% 0% 0% 0% 0% 0% 0% 0% 0% 0%
50.1.16.1 # of employees who have resolved competency gaps for specified occupational groups representing Department-wide skill needs (GPRA)
Budget, Planning and Human Resources - BPHR - GenOps 0 0 0 0 0 0 0 0 0 0
50.1.16.2 # of employees with competency gaps for specified occupational groups (GPRA)
Budget, Planning and Human Resources - BPHR - GenOps 0 0 0 0 0 0 0 0 0 0
XIM.2.2.2.0512 50.1.17 % reduction in lost production days (GPRA)
Business Management & Operations - BMO - GenOps 301% 0% 0% 0% 1% 100% 0% 0% 100% 100% 0% 1% 1% 5%
XIM.2.2.3.0712 50.1.18 % reduction in the number of employees on workers compensation rolls (GPRA)
Business Management & Operations - BMO - GenOps 301% 0% 0% 0% 6% 100% 0% 0% 100% 100% 0% 1% 1% 5%
XIM.2.2.4.0512 50.1.19 % annual reduction in the injury incidence rate at FWS (GPRA)
Business Management & Operations - BMO - GenOps 303% 0% 0% 0% 1% 100% 0% 0% 100% 100% 0% 3% 3% 15%
XIM.2.2.5.0712 50.1.20 Increase in the % of qualified, highly skilled, diverse candidates hired as a result of implementing specified requirements of the DOI Strategic Plan for Achieving and Maintaining a Highly Skilled and Diverse Workforce, FY 2005-2009 (GPRA)
Budget, Planning and Human Resources - BPHR - GenOps 56 52 57 48 53 44 50 47 58 47 65 61 42 50 50 58 47 45 64 58 53
XIM.2.2.5.0712-1 50.1.20.1 % Women Budget, Planning and Human Resources - BPHR - GenOps 46 42 44 42 37 30 45 40 43 32 54 50 34 43 35 53 40 36 54 52 43
XIM.2.2.5.0712-2 50.1.20.2 % Minority Budget, Planning and Human Resources - BPHR - GenOps 16 15 17 11 22 19 7 6 22 16 10 11 10 8 18 16 10 12 26 20 16
XIM.2.2.5.0712-3 50.1.20.3 % Disability Budget, Planning and Human Resources - BPHR - GenOps 8 8 3 10 7 5 10 7 8 7 12 13 12 5 10 6 6 12 8 4 9
XIM.2.2.6.0412 CSF 52.1 Number of volunteer hours per year supporting FWS mission activities (GPRA)
2,038,775 2,214,648 242,982 269,774 275,654 309,080 304,765 321,869 396,238 457,274 434,018 446,833 209,382 214,391 56,958 65,723 118,778 129,704 0 2,040,259
52.1.1 # of volunteer hours are annually contributed to NWRS (GPRA)
Refuges 1,283,140 1,382,990 149,362 177,156 220,510 223,406 174,579 187,480 296,188 322,685 219,018 222,911 80,032 86,475 47,927 56,265 95,524 106,612 0 1,293,790
52.1.2 # of volunteer participation hours are Hatcheries - F 103,934 119,954 19,020 21,321 12,864 15,169 5,400 9,821 25,000 26,189 12,500 18,290 28,050 26,417 0 1,100 2,747 0 106,158
May 27, 2010 - 15 - 11:01:43 AM

U.S. Fish and Wildlife Service
FWS Operational Plan - GPRA Measures
GPRA Measure FWS Operational Plan Measure Program
2009 2010National Region 1 - Pacific Region 2 - Southwest Region 3 - Great Lakes -
Big RiversRegion 4 - Southeast Region 5 - Northeast Region 6 - Mountain-
PrairieRegion 7 - Alaska Region 8 - California-
NevadaRegion 9 -
HeadquartersNational
Target Actual Target Actual Target Actual Target Actual Target Actual Target Actual Target Actual Target Actual Target Actual Target Actual TargetXIM.2.2.6.0412 supporting Fisheries objectives for Hatcheries
(GPRA)
52.1.3 # of volunteer participation hours are supporting Fisheries objectives for FWMA (GPRA)
Management Assistance - F 12,020 18,789 400 337 2,280 2,140 3,150 3,161 50 5,130 2,500 3,930 2,800 2,620 800 1,227 40 244 0 12,485
52.1.4 # of volunteer participation hours supporting Hunter Education objectives through Federal Assistance (GPRA)
Federal Assistance 639,681 692,915 74,200 70,960 40,000 68,365 121,636 121,407 75,000 103,270 200,000 201,702 98,500 98,879 8,231 8,231 22,114 20,101 0 627,826
XIM.2.2.7.0712 52.1.13 Cooperative Conservation Internal Capacity: Percent of organizations that have trained and developed skills for employees in collaboration and partnering competencies (GPRA)
External Affairs 0% 0% 0% 0% 0% 0% 0% 0% 0% 0%
52.1.13.1 # of organizations that have trained and developed employees in collaboration and partnering competencies (GPRA)
External Affairs 0 0 0 0 0 0 0 0 0 0
52.1.13.2 # of organizations (GPRA) External Affairs 0 0 0 0 0 0 0 0 0 0
52.1.16 Cooperative Conservation Internal Capacity: Percent of employees that have been trained and developed in collaboration and partnering competencies (GPRA)
External Affairs 61% 61% 0% 0% 0% 0% 0% 0% 0% 0% 61% 61% 64%
52.1.16.1 # of employees that have been trained and developed in collaboration and partnering competencies (GPRA)
External Affairs 4,872 4,872 0 0 0 0 0 0 0 0 4,872 4,872 5,116
52.1.16.2 # of employees (GPRA) External Affairs 8,000 8,000 0 0 0 0 0 0 0 0 8,000 8,000 8,000
XIM.2.2.8.0712 52.1.17 Cooperative Conservation External Capacity: % of conservation projects that actively involve the use of knowledge and skills of people in the area, and local resources in priority setting, planning, and implementation processes (GPRA)
100% 100% 0% 0% 0% 0% 0% 0% 0% 0% 100% 488% 98%
52.1.17.1 # of conservation projects that actively involve the use of knowledge and skills of people in the area, and local resources in priority setting, planning, and implementation processes (GPRA)
2,563 2,604 0 0 0 0 0 0 0 0 2,563 2,604 2,879
52.1.17.2 # of conservation projects (GPRA) 2,563 2,610 0 0 0 0 0 0 0 0 2,563 2,610 2,927
52.1.17.3 # of conservation projects that actively involve the use of knowledge and skills of people in the area, and local resources in priority setting, planning, and implementation processes (GPRA)
Coastal Programs - HC 190 190 0 0 0 0 0 0 0 0 190 190 190
52.1.17.4 # of conservation projects (GPRA) Coastal Programs - HC 190 190 0 0 0 0 0 0 0 0 190 190 190
52.1.17.5 # of conservation projects that actively involve the use of knowledge and skills of people in the area, and local resources in priority setting, planning, and implementation processes (GPRA)
Environmental Contaminants 0 0 0 0 0 0 0 0 0 0
52.1.17.6 # of conservation projects (GPRA) Environmental Contaminants 0 0 0 0 0 0 0 0 0 0
52.1.17.7 # of conservation projects that actively involve the use of knowledge and skills of people in the area, and local resources in priority setting, planning, and implementation processes (GPRA)
Endangered Species 8 8 0 0 0 0 0 0 0 0 8 8 8
52.1.17.8 # of conservation projects (GPRA) Endangered Species 8 8 0 0 0 0 0 0 0 0 8 8 8
52.1.17.9 # of conservation projects that actively involve the use of knowledge and skills of people in the area, and local resources in priority setting, planning, and implementation processes (GPRA)
Management Assistance - F 1 1 0 0 0 0 0 0 0 0 1 1 16
52.1.17.10 # of conservation projects (GPRA) Management Assistance - F 1 1 0 0 0 0 0 0 0 0 1 1 16
52.1.17.11 # of conservation projects that actively involve the use of knowledge and skills of people in the area, and local resources in priority setting, planning, and implementation processes (GPRA)
Hatcheries - F 3 3 0 0 0 0 0 0 0 0 3 3 3
52.1.17.12 # of conservation projects (GPRA) Hatcheries - F 3 3 0 0 0 0 0 0 0 0 3 3 3
52.1.17.13 # of conservation projects that actively involve the use of knowledge and skills of people in the area, and local resources in priority setting, planning, and implementation processes (GPRA)
International Affairs 521 521 0 0 0 0 0 0 0 0 521 521 521
52.1.17.14 # of conservation projects (GPRA) International Affairs 521 521 0 0 0 0 0 0 0 0 521 521 521
52.1.17.15 # of conservation projects that actively involve the use of knowledge and
Migratory Birds 40 40 0 0 0 0 0 0 0 0 40 40 293
May 27, 2010 - 16 - 11:01:43 AM

U.S. Fish and Wildlife Service
FWS Operational Plan - GPRA Measures
GPRA Measure FWS Operational Plan Measure Program
2009 2010National Region 1 - Pacific Region 2 - Southwest Region 3 - Great Lakes -
Big RiversRegion 4 - Southeast Region 5 - Northeast Region 6 - Mountain-
PrairieRegion 7 - Alaska Region 8 - California-
NevadaRegion 9 -
HeadquartersNational
Target Actual Target Actual Target Actual Target Actual Target Actual Target Actual Target Actual Target Actual Target Actual Target Actual TargetXIM.2.2.8.0712 skills of people in the area, and local resources
in priority setting, planning, and implementation processes (GPRA)
52.1.17.16 # of conservation projects (GPRA) Migratory Birds 40 40 0 0 0 0 0 0 0 0 40 40 336
52.1.17.17 # of conservation projects that actively involve the use of knowledge and skills of people in the area, and local resources in priority setting, planning, and implementation processes (GPRA)
Marine Mammals 0 0 0 0 0 0 0 0 0 0
52.1.17.18 # of conservation projects (GPRA) Marine Mammals 0 0 0 0 0 0 0 0 0 0
52.1.17.19 # of conservation projects that actively involve the use of knowledge and skills of people in the area, and local resources in priority setting, planning, and implementation processes (GPRA)
Partners for Fish and Wildlife - HC 1,800 1,800 0 0 0 0 0 0 0 0 1,800 1,800 1,800
52.1.17.20 # of conservation projects (GPRA) Partners for Fish and Wildlife - HC 1,800 1,800 0 0 0 0 0 0 0 0 1,800 1,800 1,800
52.1.17.21 # of conservation projects that actively involve the use of knowledge and skills of people in the area, and local resources in priority setting, planning, and implementation processes (GPRA)
Conservation Planning Assistance - HC 0 0 0 0 0 0 0 0 0 0
52.1.17.22 # of conservation projects (GPRA) Conservation Planning Assistance - HC 0 0 0 0 0 0 0 0 0 0
52.1.17.23 # of conservation projects that actively involve the use of knowledge and skills of people in the area, and local resources in priority setting, planning, and implementation processes (GPRA)
Refuges 0 0 0 0 0 0 0 0 0 0
52.1.17.24 # of conservation projects (GPRA) Refuges 0 0 0 0 0 0 0 0 0 0
52.1.17.25 # of conservation projects that actively involve the use of knowledge and skills of people in the area, and local resources in priority setting, planning, and implementation processes (GPRA)
Management Assistance - F 0 41 0 0 0 0 0 0 0 0 0 41 48
52.1.17.26 # of conservation projects (GPRA) Management Assistance - F 0 47 0 0 0 0 0 0 0 0 0 47 53
52.1.17.28 # conservation projects Law Enforcement 0 0 0 0 0 0 0 0 0 0
52.1.17.29 # conservation projects with knowledge/skilled local resources
Federal Assistance 0 0 0 0 0 0 0 0 0 0
52.1.17.30 # conservation projects Federal Assistance 0 0 0 0 0 0 0 0 0 0
52.1.17.31 # conservation projects with knowledge/skilled local resources
National Wetlands Inventory - HC 0 0 0 0 0 0 0 0 0 0
52.1.17.32 # conservation projects National Wetlands Inventory - HC 0 0 0 0 0 0 0 0 0 0
XIM.2.2.8.0712 52.1.17.27 # conservation projects with knowledge/skilled local resources
Law Enforcement 0 0 0 0 0 0 0 0 0 0
XIM.2.2.9.0712 52.1.18 Collocation: Number of facilities with multi-agency use/occupancy that coordinate services (GPRA)
2 2 0 0 0 0 0 0 0 0 0 2 2
XIM.2.3.1.0412 50.1.22 # of full time equivalent employees in competitive sourcing studies completed during the fiscal year (GPRA)
Budget, Planning and Human Resources - BPHR - GenOps 0 0 0 0 0 0 0 0 0 0
XIM.2.3.2.0712 50.1.23 % savings compared to relevant GSA Federal Supply Schedule prices for contracts awarded through Strategic Sourcing (GPRA)
Business Management & Operations - BMO - GenOps 10% 0% 0% 0% 0% 0% 0% 0% 0% 8% 10% 8%
XIM.2.3.3.0712 50.1.24 Increase Competition: % of eligible service contract actions over $25,000 awarded as performance-based acquisitions (GPRA)
Business Management & Operations - BMO - GenOps 17% 49% 21% 47% 30% 40% 60% 60% 4% 80% 50% 100% 78% 167% 10% 7% 20% 30% 45% 75% 50%
50.1.24.1 # of eligible service contract actions over $25,000 awarded as performance-based acquisitions (GPRA)
Business Management & Operations - BMO - GenOps 51 173 11 59 3 4 3 3 3 66 1 2 7 15 7 5 12 13 4 6 147
50.1.24.2 # of eligible service contract actions over $25,000 (GPRA)
Business Management & Operations - BMO - GenOps 300 356 53 126 10 10 5 5 83 83 2 2 9 9 70 70 60 43 8 8 293
XIM.2.3.4.0712 50.1.25 Efficiencies (in dollars) achieved through utilization of core operations principles (GPRA)
Business Management & Operations - BMO - GenOps 0 0 0 0 0 0 0 0 0 0
XIM.2.4.1.0712 50.1.26 % of programs with demonstrated use of performance measures in budget justifications and decisions (GPRA)
Budget, Planning and Human Resources - BPHR - GenOps 100% 100% 0% 0% 0% 0% 0% 0% 0% 0% 100% 100% 100%
50.1.26.1 # of programs with demonstrated use of performance measures in budget justifications and decisions (GPRA)
Budget, Planning and Human Resources - BPHR - GenOps 12 12 0 0 0 0 0 0 0 0 12 12 12
50.1.26.2 # of programs (GPRA) Budget, Planning and Human Resources - BPHR - GenOps 12 12 0 0 0 0 0 0 0 0 12 12 12
XIM.2.4.2.0712 50.1.27 % of programs that can estimate marginal cost of changing of performance (GPRA)
Budget, Planning and Human Resources - BPHR - GenOps 100% 100% 0% 0% 0% 0% 0% 0% 0% 0% 100% 100% 100%
May 27, 2010 - 17 - 11:01:43 AM

U.S. Fish and Wildlife Service
FWS Operational Plan - GPRA Measures
GPRA Measure FWS Operational Plan Measure Program
2009 2010National Region 1 - Pacific Region 2 - Southwest Region 3 - Great Lakes -
Big RiversRegion 4 - Southeast Region 5 - Northeast Region 6 - Mountain-
PrairieRegion 7 - Alaska Region 8 - California-
NevadaRegion 9 -
HeadquartersNational
Target Actual Target Actual Target Actual Target Actual Target Actual Target Actual Target Actual Target Actual Target Actual Target Actual TargetXIM.2.4.2.0712 50.1.27.1 # of programs that can demonstrate
marginal cost of changing of performance (GPRA)
Budget, Planning and Human Resources - BPHR - GenOps 12 12 0 0 0 0 0 0 0 0 12 12 12
50.1.27.2 # of programs (GPRA) Budget, Planning and Human Resources - BPHR - GenOps 12 12 0 0 0 0 0 0 0 0 12 12 12
XIM.2.5.1.0412-5 CSF 54.1 Service-wide Comprehensive Facilities Improvement: Overall condition of buildings and structures (as measured by the FCI) that are mission critical and mission dependent (as measured by the API) with emphasis on improving the condition of assets with critical health and safety needs (GPRA)
0.119 0.112 0.157 0.165 0.064 0.066 0.094 0.068 0.183 0.171 0.099 0.106 0.116 0.113 0.179 0.170 0.041 0.037 0.012 0.012 0.117
54.1.1 Service-wide Comprehensive Facilities Improvement: Overall condition of buildings and structures (as measured by the FCI) that are mission critical and mission dependent (as measured by the API) with emphasis on improving the condition of assets with critical health and safety needs (GPRA)
0.119 0.112 0.157 0.165 0.064 0.066 0.094 0.068 0.183 0.171 0.099 0.106 0.116 0.113 0.179 0.170 0.041 0.037 0.012 0.012 0.117
54.1.1.1 value ($) of deferred maintenance backlog of buildings having undergone condition assessment (GPRA)
2,845,713,995 2,676,766,402 463,461,124 488,647,190 173,776,065 176,954,821 425,981,745 308,050,122 1,049,297,097 977,545,092 205,224,854 220,823,634 328,947,393 319,784,949 102,182,759 97,184,723 95,042,959 85,946,770 1,800,000 1,829,100 2,768,726,982
54.1.1.2 replacement value ($) of buildings having undergone condition assessment (GPRA)
23,813,857,472 23,813,857,472 2,952,621,369 2,952,621,369 2,695,916,011 2,695,916,011 4,511,815,001 4,511,815,001 5,720,034,718 5,720,034,718 2,077,812,659 2,077,812,659 2,826,139,157 2,826,139,157 570,883,299 570,883,299 2,313,961,497 2,313,961,497 144,673,761 144,673,761 23,608,699,199
54.1.2 NWRS Comprehensive Facilities Improvement: Overall condition of buildings and structures (as measured by the FCI) that are mission critical and mission dependent (as measured by the API) with emphasis on improving the condition of assets with critical health and safety needs (GPRA) (PART)
Refuges 0.121 0.113 0.166 0.177 0.058 0.059 0.093 0.065 0.184 0.171 0.094 0.107 0.118 0.115 0.179 0.170 0.043 0.039 0.000 0.000 0.120
54.1.2.1 value ($) of deferred maintenance backlog of buildings having undergone condition assessment (GPRA)(PART)
Refuges 2,682,226,673 2,521,649,530 429,867,516 457,622,529 148,787,773 150,740,980 411,413,944 288,814,181 1,014,878,950 943,907,895 175,273,103 199,186,360 306,683,859 300,234,286 102,182,759 97,184,723 93,138,770 83,929,475 0 29,100 2,600,838,331
54.1.2.2 replacement value ($) of buildings having undergone condition assessment (GPRA)(PART)
Refuges 22,244,732,662 22,244,732,662 2,583,699,687 2,583,699,687 2,544,812,617 2,544,812,617 4,419,721,669 4,419,721,669 5,514,244,551 5,514,244,551 1,867,628,200 1,867,628,200 2,602,409,393 2,602,409,393 570,883,299 570,883,299 2,141,333,246 2,141,333,246 0 0 21,752,229,169
54.1.3 Service-wide Administrative Facilities Improvement: Overall condition of buildings and structures (e.g. administrative, employee housing) (as measured by the FCI) that are mission critical and mission dependent (as measured by the API) with emphasis on improving the condition of assets with critical health and safety needs (GPRA)
0.145 0.087 0.341 0.342 0.074 0.085 0.132 0.021 0.085 0.121 0.192 0.209 0.092 0.118 0.173 0.137 0.126 0.113 0.012 0.012 0.137
54.1.3.1 value ($) of deferred maintenance backlog of buildings having undergone condition assessment (Combined Refuges, Hatcheries, and NCTC) (GPRA)
633,825,862 379,293,333 122,280,985 122,693,090 16,004,897 18,537,205 322,588,983 52,622,860 20,038,765 28,422,024 80,445,639 87,279,496 22,355,371 28,667,433 37,591,272 29,686,642 10,719,949 9,555,483 1,800,000 1,829,100 396,038,279
54.1.3.2 replacement value ($) of buildings having undergone condition assessment (Combined Refuges, Hatcheries, and NCTC) (GPRA)
4,372,204,640 4,372,204,640 358,389,174 358,389,174 217,581,074 217,581,074 2,452,761,145 2,452,761,145 235,806,001 235,806,001 418,086,464 418,086,464 242,902,753 242,902,753 217,187,902 217,187,902 84,816,366 84,816,366 144,673,761 144,673,761 2,888,207,326
54.1.4 NWRS Administrative Facilities Improvement: Overall condition of NWRS buildings and structures (e.g. administrative, employee housing) (as measured by the FCI) that are mission critical and mission dependent (as measured by the API) with emphasis on improving the condition of assets with critical health and safety needs (GPRA)(PART)
Refuges 0.153 0.087 0.399 0.398 0.054 0.058 0.131 0.021 0.066 0.113 0.206 0.220 0.093 0.121 0.173 0.137 0.160 0.142 0.000 0.000 0.150
54.1.4.1 value ($) of deferred maintenance backlog of NWRS buildings having undergone condition assessment (GPRA)(PART)
Refuges 603,201,851 343,023,220 118,016,612 117,665,242 9,367,038 9,975,665 320,700,499 50,024,684 11,817,621 20,175,412 77,072,343 82,392,245 18,000,108 23,603,425 37,591,272 29,686,642 10,636,357 9,470,805 0 29,100 359,768,166
54.1.4.2 replacement value ($) of NWRS buildings having undergone condition assessment (GPRA)(PART)
Refuges 3,938,463,457 3,938,463,457 295,669,539 295,669,539 172,425,332 172,425,332 2,439,024,428 2,439,024,428 178,905,438 178,905,438 374,280,517 374,280,517 194,378,038 194,378,038 217,187,902 217,187,902 66,592,263 66,592,263 0 0 2,400,357,655
54.1.5 NCTC Administrative Facilities Improvement: Overall condition of NCTC buildings and structures (e.g. administrative, employee housing) (as measured by the FCI) that are mission critical and mission dependent (as measured by the API) with emphasis on improving the condition of assets with critical health and safety needs (GPRA)
External Affairs 0.012 0.012 0.000 0.000 0.000 0.000 0.000 0.000 0.000 0.000 0.012 0.012 0.012
54.1.5.1 value ($) of deferred maintenance backlog of NCTC facilities (e.g. administrative, employee housing) having undergone condition assessment (GPRA)
External Affairs 1,800,000 1,800,000 0 0 0 0 0 0 0 0 1,800,000 1,800,000 1,800,000
May 27, 2010 - 18 - 11:01:43 AM

U.S. Fish and Wildlife Service
FWS Operational Plan - GPRA Measures
GPRA Measure FWS Operational Plan Measure Program
2009 2010National Region 1 - Pacific Region 2 - Southwest Region 3 - Great Lakes -
Big RiversRegion 4 - Southeast Region 5 - Northeast Region 6 - Mountain-
PrairieRegion 7 - Alaska Region 8 - California-
NevadaRegion 9 -
HeadquartersNational
Target Actual Target Actual Target Actual Target Actual Target Actual Target Actual Target Actual Target Actual Target Actual Target Actual TargetXIM.2.5.1.0412-5 54.1.5.2 replacement value ($) of NCTC (e.g.
administrative, employee housing) facilities having undergone condition assessment (GPRA)
External Affairs 144,673,761 144,673,761 0 0 0 0 0 0 0 0 144,673,761 144,673,761 155,285,589
54.1.6 NFHS Administrative Facilities Improvement: Overall condition of NFHS buildings and structures (e.g. storage, administrative, employee housing) (as measured by the FCI) that are mission critical and mission dependent (as measured by the API) with emphasis on improving the condition of assets with critical health and safety needs (GPRA)
Hatcheries - F 0.100 0.119 0.068 0.080 0.147 0.190 0.137 0.189 0.144 0.145 0.077 0.112 0.090 0.104 0.000 0.005 0.005 0.000 0.104
54.1.6.1 value ($) of deferred maintenance cost estimate for NFHS direct infrastructure support assets (GPRA)
Hatcheries - F 28,824,011 34,470,113 4,264,373 5,027,848 6,637,859 8,561,540 1,888,484 2,598,176 8,221,144 8,246,612 3,373,296 4,887,251 4,355,263 5,064,008 0 83,592 84,678 0 34,470,113
54.1.6.2 total replacement value ($) of NFHS direct infrastructure support assets (GPRA)
Hatcheries - F 289,067,422 289,067,422 62,719,635 62,719,635 45,155,742 45,155,742 13,736,717 13,736,717 56,900,563 56,900,563 43,805,947 43,805,947 48,524,715 48,524,715 0 18,224,103 18,224,103 0 332,564,082
XIM.2.5.2.0712-2 54.1.7 Percent change in the Operating Costs (operations and maintenance costs) per square foot of buildings that are "Not-Mission Dependent" as reported in the Federal Real Property Profile (FRPP) in the current fiscal year compared to the previous fiscal year (GPRA)
0% 88% 374% 88% 88% 0% 88% -11%
XIM.2.5.2.0712-1 54.1.8 Percent change in the total number of buildings (office, warehouse, laboratory, and housing) reported as "Under Utilized" or "Not Utilized" in the Federal Real Property Profile (FRPP) in the current fiscal year compared to the previous fiscal year (GPRA)
0% -5% -10% -13% 0% -30% 33%
XIM.2.5.4.0712 54.1.9 Percent of assets targeted for disposal that were disposed (GPRA)
Refuges 117% 117% 100% 100% 0% 100% 100% 100% 100% 400% 367% 100% 100% 100% 100% 0% 0% 0% 100%
54.1.9.1 # of assets targeted for disposal that were disposed (GPRA)
Refuges 62 62 8 8 0 6 6 23 23 12 11 11 11 2 2 1 0 0 124
54.1.9.2 # of assets targeted for disposal (GPRA)
Refuges 53 53 8 8 0 6 6 23 23 3 3 11 11 2 2 0 0 0 124
May 27, 2010 - 19 - 11:01:43 AM


![UPRR TRAINING AREA TIMETABLE #1 - Smart Union0306.utu.org/Files/[4269]2012_uprr_training_timetable.pdfRED (Trk.1) BR030 BIG RIVERS 2 RIO GRANDE BR025 BIG RIVERS 2 SACRAMENTO JCT BR001](https://static.fdocuments.in/doc/165x107/5ae953887f8b9a087790d6fb/uprr-training-area-timetable-1-smart-42692012uprrtrainingtimetablepdfred.jpg)


