pilwaukee Public Schools, Wis. Dept. of Educationalfiles.eric.ed.gov/fulltext/ED111894.pdfportion of...
27
P ,, ED 111 894 DOCUMENT RESUME DD 015-427 AUTHOR Rowe, G. Dwight' TITLE),---- Educational Outcomes Associated With Ethnic Changes in School Populations. - INSTITUTION pilwaukee Public Schools, Wis. Dept. of Educational Research and Program Assessment'. PUB DATE 1 Apr 75 NOTE 27p.; Paper presented at the Annual Meeting of the Al. , American Education Research Association (Washington, D.C., April 1, 1975) EDRS PRICE MF-$0.76 HC-$1.95.Plus Postage DESCRIPTORS *Academic Achievement; Demography; *Ethnic Distribution; Indians; Mathematics; Migration; ( *Minority Group Children; Negroes; Open Enrollment; Reading.Achievement; School Integration; spanish. Americans; *Student Distribution IDENTIFIERS Wisconsin ('Milwaukee) ABSTRACT . . This document examines the data on changes in the ethnic coaliosition of the schaoirtr-talwaukee, and relates them to student achievement. A consideration of the relationship of ethnicity and academic achievement is said to entail six questions as follows: how ethnic proportions of pupilS'have changed over a ten-year period; their patterng of achievement in reading and math during an eight-year period; the relationship between percent of minority in school and reading/math achievement; whether the strength of the relationship changes with an increase in proportion of minority pupils; whether the rate of change in ethnicity affects the propoktion of the relationship; and the extent to which open enrollment serves as voluntary desegregation or resegregation. Minority subgroups. included American Indian, black, Asian, and Spanish-surnamed children. Findings of the study noted an increase, in the number of minority pupils with a decrease of non-minority pupils in the -n-year period. Open enrollment is said to have had a slight effect in increasing segregation. Although achievement in reading and math are said to have decreased, a- reduced rate of decrease had been found. A double proportion of minority students in the eight-ylar period had not been found to increase the strength of the relationship between proportion of minority students and achievement, and rate of change in ethnicity not found to Show a stable relationship with the variable of student achievement. (Author/AM) *********************************************************************** * Documents acquired by ERIC include many informal unpublished * * materials not available from other sources. ERIC makes every effort * * to obtain the best copy available. nevertheless, items of marginal * * reproducibility are often encountered and this affects the quality * * of the microfiche and hardcopyreproductions ERIC makes available * * via the ERIC Document Reproduction Service (EDRS). EDRS is not * * responsible for the quality of the original document. Reproductions * * supplied by EDRS are the best that can be made from the original. * ***********************************************************************
Transcript of pilwaukee Public Schools, Wis. Dept. of Educationalfiles.eric.ed.gov/fulltext/ED111894.pdfportion of...

P
,,
ED 111 894
DOCUMENT RESUME
DD 015-427
AUTHOR Rowe, G. Dwight'TITLE),---- Educational Outcomes Associated With Ethnic Changes
in School Populations.-
INSTITUTION pilwaukee Public Schools, Wis. Dept. of EducationalResearch and Program Assessment'.
PUB DATE 1 Apr 75NOTE 27p.; Paper presented at the Annual Meeting of the
Al. , American Education Research Association (Washington,D.C., April 1, 1975)
EDRS PRICE MF-$0.76 HC-$1.95.Plus PostageDESCRIPTORS *Academic Achievement; Demography; *Ethnic
Distribution; Indians; Mathematics; Migration;(
*Minority Group Children; Negroes; Open Enrollment;Reading.Achievement; School Integration; spanish.Americans; *Student Distribution
IDENTIFIERS Wisconsin ('Milwaukee)
ABSTRACT ..
This document examines the data on changes in theethnic coaliosition of the schaoirtr-talwaukee, and relates them tostudent achievement. A consideration of the relationship of ethnicityand academic achievement is said to entail six questions as follows:how ethnic proportions of pupilS'have changed over a ten-year period;their patterng of achievement in reading and math during aneight-year period; the relationship between percent of minority inschool and reading/math achievement; whether the strength of therelationship changes with an increase in proportion of minoritypupils; whether the rate of change in ethnicity affects thepropoktion of the relationship; and the extent to which openenrollment serves as voluntary desegregation or resegregation.Minority subgroups. included American Indian, black, Asian, andSpanish-surnamed children. Findings of the study noted an increase, inthe number of minority pupils with a decrease of non-minority pupilsin the -n-year period. Open enrollment is said to have had a slighteffect in increasing segregation. Although achievement in reading andmath are said to have decreased, a- reduced rate of decrease had beenfound. A double proportion of minority students in the eight-ylarperiod had not been found to increase the strength of therelationship between proportion of minority students and achievement,and rate of change in ethnicity not found to Show a stablerelationship with the variable of student achievement. (Author/AM)
************************************************************************ Documents acquired by ERIC include many informal unpublished ** materials not available from other sources. ERIC makes every effort ** to obtain the best copy available. nevertheless, items of marginal ** reproducibility are often encountered and this affects the quality ** of the microfiche and hardcopyreproductions ERIC makes available ** via the ERIC Document Reproduction Service (EDRS). EDRS is not ** responsible for the quality of the original document. Reproductions ** supplied by EDRS are the best that can be made from the original. ************************************************************************

I
thilwaukee public schools
EDUCATIONAL OUTCOMES ASSOCIATED WITH
ETHNIC CHANGES IN SCHOOL' POPULATIO,NS
4
(To be presented at the 1 April 1975 meeting of theAmerican Educational Research Association in Washington, D.C.)
U S DEPARTMENT OF HEALTHEDUCATION & WELFARENATIONAL INSTITUTE Of
EDUCATIONTills DOCUMENT HAS !SEEN PEER°DUCED4E7,A( Tk,v AS RECE,,,E0 FPOMTHE PERSON OP OROANI2ATION OP, CONAT,Nr, IT PO)NTS 0, 1,F N OP OPINIONSSTA TED po NOT NAcr',SAPH. T REPELSENT OF NATONAL INST1 TOTE OFec,,r4r401130`,,T ON OF POL Y
G. Dwight -Rowe
Department of Educational ResearchMilwaukee Public Schools
r. As fat ,N. 411

iDUCATIONAL OUTCOMES ASSOCIATED WITH ETHNI6 CHANGESIN SCHOOL POPULATIONS
In this discussion of different aspects of research information
needed for policy decisions in relation to minority- majority school
populations, I would like to focus upon7the situation in one school
district that has already been identified, that is, Milwaukee. This
-approach may help to avoid some of the difficulties Which are ex-
perienced when one attempts to relate research findings that are
developed elsewhere to a local situation. Some of the difficulties
of this approach have been pointed out by previous panelists. There is
a plethora of racially oriented studies that produce a minimum of use
ful information. Among other factors the very variety of reasons
for and conditions of particular studies of desegregation such as
bussing, re-districting, pairing, and establishment of special schools
may tend to confuse persons, including lay persons interested in
education. Milwaukee, on the other hand does not have bussing to
achieve racial balance, and does not have a court mandate for desegre-
gation action. There is, however, one that has bpen pending for about
-ten years. On the other hand there has been significant movement of
,a)
pupils from school to school within the system because of the open
enrollment policy.
This movement has changed ethnic proportions within separate
schools. It is expected that information presented in this section
of the symposium can serveas a data base for our considerations, and
explorations. These data may highlight some of the pupil, school,
and system characteristics with which we will be concerned.

We abAll examine data on changes in the ethnic composition of
the schools in Milwaukee and relate this to both the immigretion.of
.minority elements fram outside the city and to the mobility of ethnic
compbmints within the city; movement which is sanctioned and encour-
aged by the open enrollment policy.. The question as to how this
nobility maylhe dedegregating certain schools or resegregating others
will be raised. Data on academic achievement will be presented and
relationships between these two variables, ethnic proportions and
achievement will be explored.
The patterns of ethnic composition of the schools over a ten-'
year period reflect the movement of racial minorities into the large
cities of the Northern pert of the,United States. Since research has
shown that the academic achievement levels of minority pupils are'usually
1&4er than those of the non-minority segment, an increase in the pro-.
portion of minority pupils. should tend to reduce the measured achievement
levels of the total school population. There are, however, some balancing
factors which might attenuate this trend of lower achievement levels
accompening increasing proportion ofmio;ity pupils. One factor is
the massive program of 'support for education by the Federal Government.
This has been described by Goodlad as "perhaps the zenith in our history
of.faith in education." The trend of achievement in Milwaukee will beIJ
considered in light of these influences, some of which tend to raise
pupil achievement levels and others to lower them.
In0our consideration of ethnicity and academic achievement, we
FthAll be concerned with question:fetich as the following:

-3-
1. How have the ethnic proportions of, thepupil population of the Milwaukee PublicSchools changed over a ten-year period?
2. To what extent does the open enrollmentpolicy of the Milwaukee Public Schools'serve as a voluntary desegregation plan?-- To what extent does it result in re-segregation?
3. Mhat are the patterns of achievement forthis population in reading and math dur-ing an eight-year period?
'et
4. What is the relationship in the Milwaukeepupil population between the percent ofminority pupils in a school and the achieve-ment level of the students in reading andmath?
5. Did the strength of that relationship be-tween ethnicity and achievement change duringa period of time in which the proportion ofminority pupils has approximately doubled?
6. Does the rate of change in ethnicity affectthe strength of relationship between pra-portion of ethnic minority and achievement?
The ethnic data are in terms of proportions of minority and non-.
minority elements. The four minority categariesOf Indian, Black,
Asian, and Spanish Surnamed ate caMbined into the total minority
Classification, School means for the years 1964,1969 and from
1971-1974 will be used. Ethnic data were not available for the year
1970.
We turn to the first question, "How have the ethnic character-__
NA\.
istics of the pupil popluation'of the MiIMaukee Public Schools changed
over a ten-year period?"

During the period 1964-1974, 'the proportion of an identified
ethailminority in the Milwaukee Public Schools increased.fram
20 percent to 38 percent, as ShoWn in Table ,1 and Figure, page 14.
However, in the general population Of the City of Milwaukee census
data show that during ti 9 ten-yparperiod 1960-1770,the.proportion
of ethnic minority increased:fram bine percent t6 16 percent. It
is obvious that the proportion of mineiity elements in the school
population is ver twice the proporation.Of minority, elements in the
gener4city population. Itwill be noted from either the table or
the figure that the annual increase is fairly even across grade
levels and over time. The overall annual increase approximates two
percent at each of the grdde levels. The evenness of this spread
over time can be assumed to have facilitated assimilation of the
minority immigrants into the general population through this ten-year
period.
It is of interest to note while the increase from year to year I
in the 'Percent of minority pupils has been fairly even, the population
segments have changed markedly during this ten-year period. That
is, during the early years of the period there was an increase in
numbers of both the minority and non-minority populations with the
rate of increase of the minority being greater. There was an annual
increase, in the total population until 1970. Since then there has
been an annual decrease in the total population, a circumstance that
is due entirely to the decrease in the number in the non-minority
group. The minority group has continued the pattern of annual increase,
though at a slower rate.

The decrease in non -ninority pupil population began in 1968 and has
continued since and at a generally increasing pace. The decrease in
the total pupil population began in 1971, and has continued at an
increasing pace to this time.
It should be remembered that the overall data are means of
school means that reflect but do not specifically show rate of change
within separate schools. It has often been informally observed that
a significant increase in the rate of change may be associated with an
increase in tension in a separate school and in a separate school
community. Changes,from year to year in the total population .and the
minority-majority segments of it are shown in Figure 2. It will be noted
that the increase in the number of minority pupils from year to year
shownon the bottom line of the figure levels off during the ten-year
period. ActoAlly.the percent of increase in nubbers for the year from
.1964 to 1965 was about eight percent but was less than one percent for
the year from 1973 to 1974. When the city as a whole is considered,
this moderation in the rate of increase from year to year seems to be
a stabilizing factor allowing for more regular assimilation of the in-
coming minority population.
A second question was: "To what extent does the open enrollment
policy of the Milwaukee Public Schools serve as a voluntary desegre-
gation plan? Also to what extent does it result in resegregation?"
The overall magnitude of mobility of pupils among schools as
allowed by the open enrollment plan is shown in Table 3, "Number Of
Students On Transfer On March 4, 1975." These are simply overall
transfers listed by ethnic category and do not indicate origin or

-6-
destination of movement. The table does indicate that approximately
111Ir9.5 zerCent of the total population attends a schoo tis Jot the
neighborhood school to which a pupil is assigned. Thii will vary
from 5.5 percent at the elementary level to 15.8 percent at the
junior high level and to 13.4 percent at the senior high school level.
These figures indicate that transfers are more prevalent at the
vsecondary levels and at that level have the greatest potential for
effect on ethnic balance within schools.
4t will be noted from Table 3 that in the total number of students
transferring the largest movement is by the non- minority group, i:e., the
so-called white group, except at the junior high level. However, the
white group is also the group that has the greatest enrollment. In terms
of percent of within ethnic group transfers; the Blacks show the largest
.percemt, 11.2; followed by Ameriean'Indians, 10.8; Spanish Surnamed, 10.3;
Aites, 8.6; and Asian, 7.1.
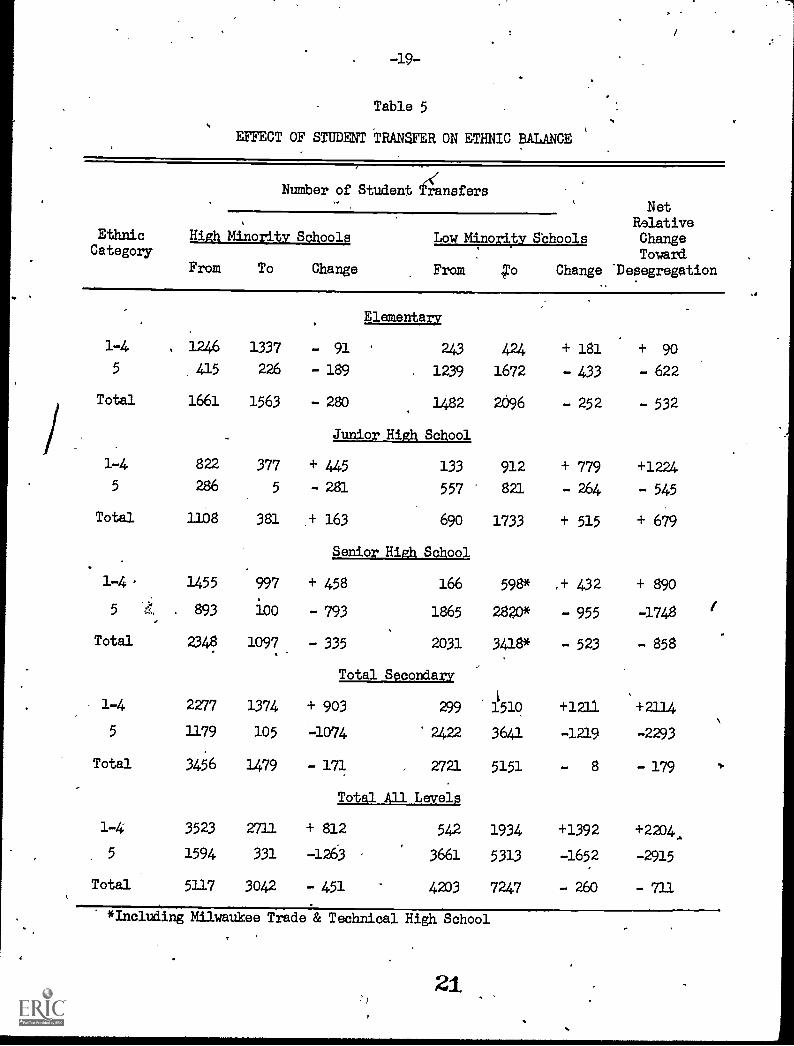
The extent to which students of the ethnic groups tend to move
into or out of schools having high minority student populations or low
ininord.ty student populations are imixated in Table 4. The summary of
the net city-wide effect of the eleven thousand student transfers is
shown in Table 5to be a differential of 356, a difference that is in
the direction of increasing segregation. However, when an adjustment
is made for the fact that all students at Milwaukee Trade and Technical
High School ars on transfer, the net result of the open enrollment policy
on the city-wide Student populatilm is to establish an approximate balitnce
between desegregation and segregation. It might also be of interest to
note that the most intensive movement toward desegregation is at the
junior high school level.

The,next question was: "What are the patterns of achievement
for this population in'reading and math during an eight-year period,
1966 - 1974?"
Achietement data are reading and mathematics test scores ob-
tained annmally in the City -Wide Testing Program. Data for grades
6, 8, and 10 are presented for the elementary schools, junior high
schools, and senior high schools. At the tenth grade level, the mean
standard score for each senior high school is used. Mean grade equiv-
alents for each school are at the sixth grade level for the elementaky
schools, and /at the eighth grade level for the junior high schools.
It should be noted that while ethnic data are presented for a1.
ten-year period, 1964 -1974, (with the exception of 1970) Achievement
data are limited to an eight-year period, 1966-1974. This is because
of changes in tests used in the City -Wide Testing Program. The'achieve-
ment data are shown in Table 6, "Achievement Scores Grades 6,-8, and 10,
1966 -1974" and in Figure 3, and in Figure 4.
The first general observation with regard to the;e'data is the
general declirie in both reading and math over this total, time span,
(see Figure 3 and Figure 4). Closer examination will reveal a signi-
ficant change in rate of decrease. The slopes of the curves from year
to year are steeper during the fitst years in this time span than in the
later years. As the curves tend to flatten and turn upward there is at
least one instance of positive. change in each column of the table, and
in one'column there are three. It was suggested earlier that while
there has been an increase in percent ethnic minority over this time span
the combination .of this factor with the massive Federal Support Programs
9

'Ar
-8-
might, in,Milwaukee as in other places, 15b associated with some improve-
ment in achievement test scores, so that the scores at least show a,s
red tion in the rate of decline over time. The MilWaukee data do show
an initial decline followed by curve stabilization and now what appeari7
to be a smAll but gradual increase in measured achievement. This change
has occurred despite the ethnic minority increase.
Now that some baseline datl on ,ethnicity and student achieve-
ment have been presented we will consider the next question: "What
is the, relationship in this population between the percent of minority
pupils in a school and the achievement level of the students in reading
and math ?"
illThis relationship is presented the form of correlations between
two factors, ethnicity and achievehe t over time. Percent of minority
population in each school at
high school, and senior hi
each of three levels, elementary, junior
school, over the eight year period was
correlated first with readi4 and then with math for each year. The
oorrelation matrixes were exaAtined to see if there was any pattern of
change in these correlation cgOticients during a period in which (1)
the pgcent of'minority student$ approximately doubled, and (2) the
pattern of achievement showed "iMprovement"; improvement, at least to
the extent that the rate.of decline was reduced./The' sequence of corre-
lation coefficients is shown in Table 7.
It was hypothesized that a significant change in the relationship
between ethnicity and.measured student achievement in a school commulV.tY
over time would be reflected in change in the magnitude of the corre-
lation coefficient between the percent of minority students and obtained
10

-9-
test scores over time. The obtained correlations within each year
were substantial. However, the differences, either from year to year, ,
or from the beginning of the eight-year period to the end of the eight-
year period were small. This is indicative of a relatively stable
relationship. I would wish to point out that these data do not say
that there is no actual change in the influence of the variable, pro-,
/portion of minority, on the achievedent-variable over time; the data
only show that the relationsh4ps we, have obtained from the measures w1 . ,
have used have not been_saffidiently sensitive to detect whatever change
might exist.
Another hypothesis had been suggested-. It is that the rate of
change of ethnic proportion within a school would have a greater impact
on achievement than the magnitude of the proportion itself.. The question
was also raised as to' whether the rate of change in achievement might
show effects that the level of achievement might not. In order to deal
with these questions three change variables were generated. They were:
change in ethnicity from year to year, &ange in measured reading achieve-.
ment from year to year, and change in math achievement from year to year.
Correlation matrixes using each pair of variables in turn were obtained
for each of the grade levelsp elementary, junior high school, and senior
-high school. Data on two sets of correlations, ethnic change from year
to year with reading and ethnic change from year to year with math are
shown in Table B. The contrast of these correlations with those in
Table 7 completely refutes the hypothesis that the measured rate of change
from year` t) year would provide' additional useful information. It is
apparent that the changes from one year to the next are so small as to be
unreliable in direction as well as magnitude. .This is a limitation of the
11.
-10-
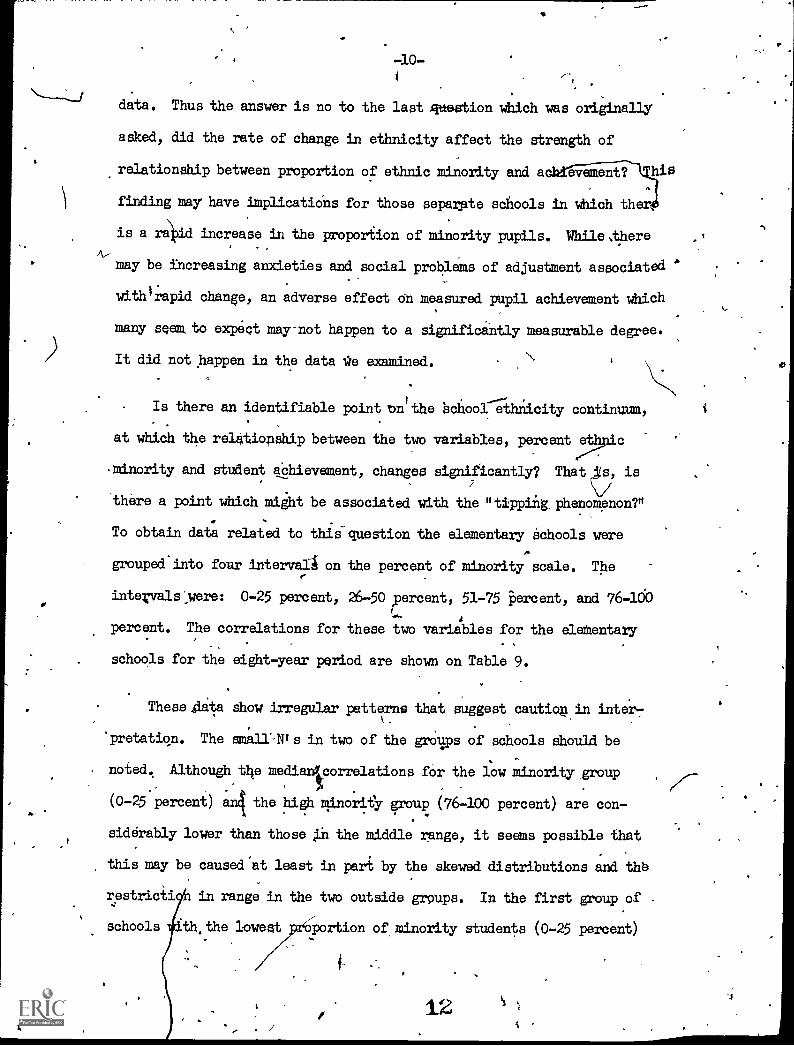
data. Thus the answer is no to the last qpostion which was originally
asked, did the rate of change in ethnicity affect the strength of
relationship between proportion of ethnic minority and eminent? hia
finding may have implicatiOns for those separate schools in which ther,
is a raid increase in the proportion of minority pupils. While,thereA
may be increasing anxieties and social problems of adjustment associated
with/rapid change, an adverse effect on measured pupil achievement which
many seam to expect may-not happen to a significdntly measurable degree.
/) It did not happen in the data tae examined.
Is there an identifiable point lonthe bcool-ahriicity continuum,
at which the relationship between the two variables, percent ethic
minority and student achievement, changes significantly? That is
there a point which might be associated with the ntipping,phenomenon?"
To obtain data related to this-question the elementary Schools were
groupedinto four interval[ on the percent of minority scale. The
intevals'yere: 0-25 percent, 26-50 percent, 51-75 percent, and 76-100
percent. The correlations for these two variables for the eleiientary
schools for the eight-year period are shown on Table 9.
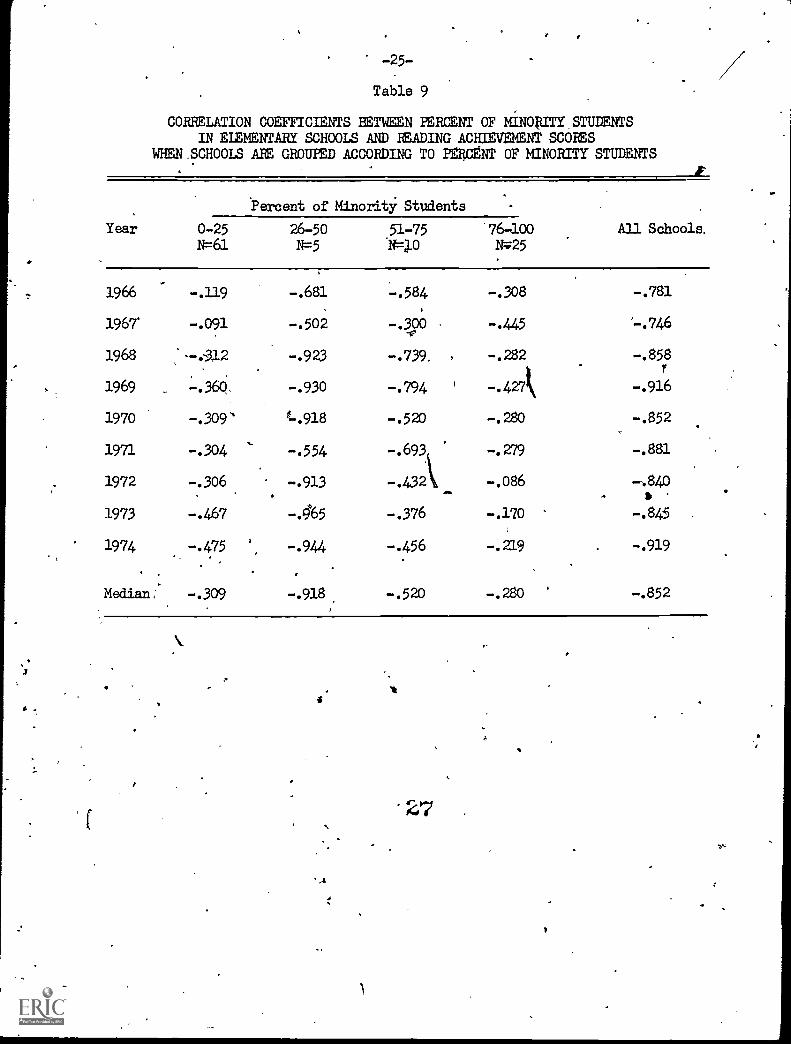
These sidyt show irregular patterns that suggest caution in inter,.
'pretatiqn. The sinalI-N' s in two of the groups of schools should be
noted. Although the medianjcorrelations fOr the low minority,group
(0-25 percent) an4 the high minority group (76-100 percent) are con-
siderably lower than those the middle range, it seams possible that
this may be caused'at least in part by the skewed distribUtions and the
restricti in range in the two outside groups. In the first group of
schools th the lowest yoportion of minority students (0-25 percent)

it is of interest to 'iote the rather consistent increase in the cor-
relations during the eight-year period. If there was, according to
these data, a tipping point it would seem most likely to be in the range
of 25-50 percent minority papils.
The question of association between proportion of ethnic minority
pupils in a school and measured achievement was examined using re-.
cession on junior high school data. When the standardized residuals
of regression of achievement on percent minority across Schools and
within years were plotted by the computer, those schools which were far
above or far below the total group were easily identified. The fact
that data from this approach corroborate the relationships already found
is indicated by a rank order correlation of .67 between,the standardized
residuals from regression and proportion of ethnic minority. The rank
order correlation between these residuals and the rate of change in
ethnicity as measured by change in percent from year to year (rate of
change) was .5/..
4
a 13
0
-g12-
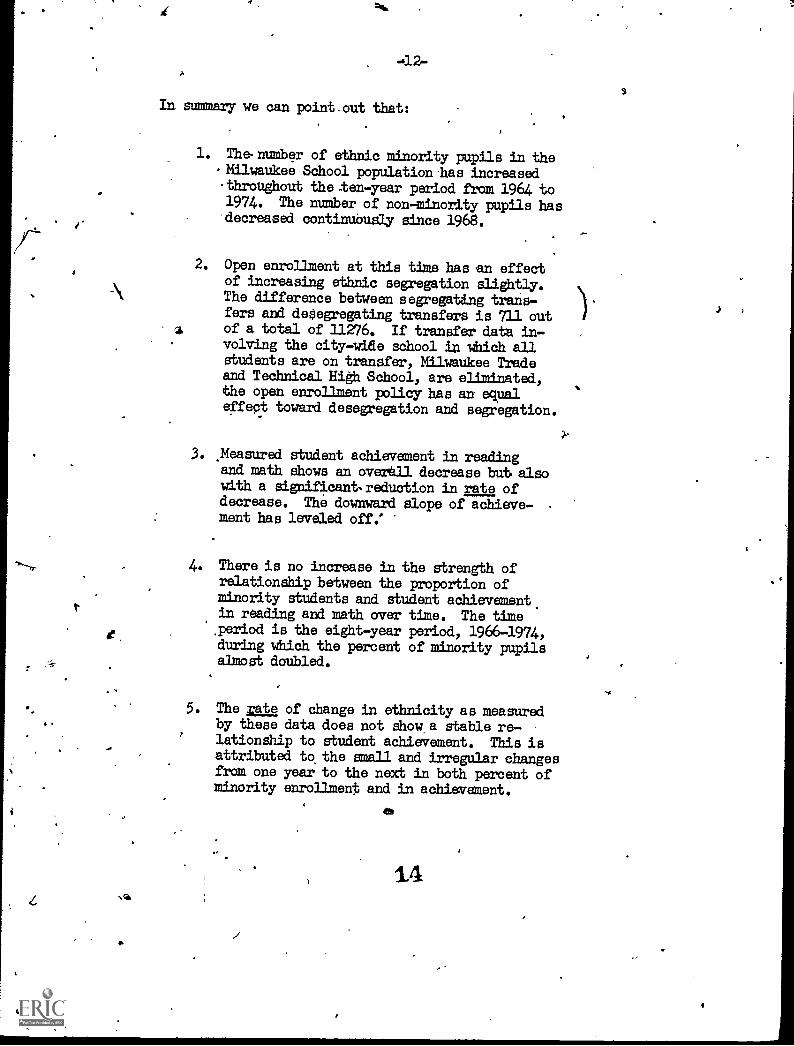
In summary we can point.out that:
1. The number of ethnic minority pupils in theMilwaukee School population has increasedthroughout the ten -year period from 1964 to1974. The number of non-minority pupils hasdecreased continuously since 1968.J'
2. Open enrollment at this time has an effectof increasing ethnic segregation slightly.The difference between segregating trans-
fers and desegregating transfers is 711 out4 of a total of 11276. If transfer data in-
volving the city-wide school in which allstudents are on transfer, Milwaukee Tradeand Technical High School, are elirerRted,the open enrollment policy has an equaleffect toward desegregation and segregation.
3. Measured student achievement in readingand math shows an overall decrease hut. also
with a significant-reduction in rate ofdecrease. The downward slope of achieve-ment has leveled off.'
4. There is no increase in the strength ofrelationship between the proportion ofminority students and student achievementin reading and math over time. The timeperiod is the eight-year period, 1966-1974,during which the percent of minority pupilsalmost doubled.
5. The vke of change in ethnicity as measuredby these data does not shwa stable re-lationship to student achievement. This isattributed to the small and irregular changesfrom one year to the next in both percent ofminority enrollment and in achievement.
ah
14
4

-13-
These sammarystatements may be considered for policy impli-
cations. It may be important for persons to recognize the fact
that an influx of minority children into a school system does not
necessarily result in academic disaster. In the case of Milmallkee,
the immigration of minority pupils at the system level has been
slow enough city-wide so that the initial decline in city-wide aca-
demicperformance has tended to level off. In fact, there are now
same pockets of reversals, i.e., improvement. This suggests that the
minority students were assimilated on a city-wide basis in a 'aatis-
factory manner. It seems possible'tbiat this overall adjustment and
assimilation has been facilitated by theassive Federal support
directed toward the education of disadvantaged children.
At the separate school level, however, the high rate of increase
in minority populations may preclude satisfactory assimilation. This
situation raises the question of the appropriateness and wisdom of
some form of control over the movement of students from school to
school when the effect in a given school is a rapid increase in ethnic
minority proportions.
It seams important to note that the patterns of relationships
between ethnic minority proportion and academic performance during
an eight-year period did not, on a city-wide basis, show an increase
in the influence Of the ethnic factor on achievement, even though
the number of minority pupils approximately doubled during a ten-
year'period. This fact might tend to allay some of the fears of some
professional as well as lay people concerning interactl.on between
minority and non-minority pupil populations.
15

Table 1
ETHNIC CHARACTERISTICS OF MILWAUKEE PUBLIC SCHOOL POPULATION 1964 -1974
Percent.Minoritv Students
Year ElementaryJunior Senior
High School Hi SchoolTotal
All Levels
1964 24.4 16.7 \12.7 20.51965 24.8 17.1 ;14.9 21.31966 25.8 17.4 ;7.7 22.61967 27.8 18.0 18.7 24.2 .1968 31.2 24.0 21.8 27.7
1969 32.3 28.6 23.0 29.41971 35.2
, 30.8 26.4 32.21972 37.1 ( 32.3 27.9 33.81973
N 40.3 34.1 292 36.31974 42.6 36.7 39. 38.3
Pigure 1
Percent of Minority Students'in Milwaukee Public Schools 1964-1974
50
45
40
35
30
25
ing../WpaNtry,..0....10.4.41/.71411.
.
MIRO .4171.1111.WMPI.1111411..V4.4..PROYAMPOt - -
I .
t
/
Y.
l
/ //..
A.
1.7....r After.... .1.1..~,- ..- . .vis.4
..10IIMANIIIii.l../ ...114.11a7.
4 65 66 . 67 69 70
YEARS
16
71 72 73 74

-15 -
Table 2
ETHNIC AND TOTAL POPULATIONS 1964-1965
Year f Minority Non-Minority Total
1964 23014 89475 1124891965 24972 92439 1174111966 27128 92857 1199851967 30881 96761 1275821968 36154 94269 . 130423
1969 38989 93834 1328231970 1334561971 42386 8949 1316651972 43496 85042 1285381973 45013 78983 123996
1974 45312 72858 118170
140
120
100
80
60
40
2O
Figure 2
Ethnic and Total Populations, Milwaukee Public Schools 1964-1974 ,
5* Wli-M1/..,r -.Ar ....14-
I:
ar........0. ...
Is
.. ,Urn-a-rt.,......
0
.-
4
II II
C4
I
11111 I!I; le, la
.... till13
I.
........
A,
e
LIAml.s......64.WAKCIIIIP.Mahollfr
it
, ......-.".
1.1."..01114..10014b411100,..1041...11110...I.A.140
A-------
64 65 66 67 68 69 70 71:
0 Total population 118170O 0 'Non - Minority population 72858LS A Minority population 45312
72 73 74
17

-16-
Table 3
NUMBER OF STUDENTS ON TRANSFER vaLwAingo PUBLIC SCHOOLSMARCH 3, 1975
Ethnic Category Elementary Junior High Senior High Total
1- American Tai an 52 18 41 111
2-Black 1365 877 1.334 3576
3 -Asian 12 3 11 26
4,Spanish Surnamed 198 46 222= 466
1-4 Minority Total 1627 944 . 1608 4339
5-White and Other 1776 834 2839 5449
Total 1-5 3403 1778 4447 9628
18

-17-
rl Table 4
NUMBER OF STUDENT TRANSFERS IN MILWAUKEE PUBLIC SCHOOLS/ MARCH 3, 1975
EthnicCategory
Greater T Less Than50% Minori 50% Minority(High Minn yi (Low Minority)
TO SCHOOLS
Greater Than Less Than50%. Minority 50% Minority(High Minority) (Low Minority)
1
Elementary Schools
1-American Indian
2-Black
3-Asian
4Spanish Surnamed
1-4 Milority Total
5-White and Other
1-5 Total
31
1080
7
128
1246
415
1661.
19
/ 164
4
56
243
1239
1482
28
1168
5
136
1337
226
1563
25
/317
7
75
424
1672
2096
Junior High Schools
1-American Indian 5 15 16
2-Black 795 100 357 859
3-Asian 1 2 3
4-Spanish Surnamed 21 16 20 34
1-4 Minority Total 822 133' 377 912
5-White and Other 286 557.45
821
1-5 Total 1108 690 381 1733
Senior High Schools
1-American Indian 23 16 4 39
2-Black 1327 25 943 373
3-Asian 7 3
r4- Spanish Surnamed 98 122 50 175
1-4 Minority Total' 1455 166 997 598
5-White and Other 893 1865 100 2820
1-5 Total 2348 2031 1097 3418
19

-18-
Table 4 Continued
FRaM SCHOOLS TO SCHOOLSGreater
E luoic 50%Than Less Than
Minority .50% 'Minority
Minority) (Low Minority)
Greater Than Less Than50% Minority 50% Minority(Higii Minority) (Low Minority)CategoTy (High
All Secondary Schools
1,- American Indian 28 31 4 55
2-Black 2122 125 1300 1232
3-Asian 8 5 20 14
4- Spanish Surnamed 119 138 70 209
1-4 Minority Total 2277 299 1374 1510
,5 -White and Other 1179 2422 105 3641
1-5 Total 3456 2721 1479 5151
Totals - All Levels
1 -'American Indian 59 50 32 80
2-Black 3202 289 2468 1549
3-Asian 15 9 25 21
4- Spanish Surnamed 247 194 206 284
1-4 Minority Total 3523 542 2711 19314
541hite.and Other .1594. A661 331 5313
1-5 Total 5117 4203 3042 '7247
20
-19-
Table 5
EFFECT OF STUDENT TRANSFER ON ETHNIC BALANCE
EthnicCategory
Number of Student 4ansfers
High Minority Schools
From To Change
NetRelative
Low Minority Sbhoole ChangeToward.
From Change "Desegregation
Elementary
1-4 , 1246 1337 - 91 243 424 + 181 + 90
5 415 226 - 189 , 1239 1672 - 433 - 622
Total 1661 1563 - 280 1482 2696 - 252 - 532
Junior High School
1-4 822 377 + 445 133 912 + 779 +1224
5 286 5 - 28]. 557 821 - 264 - 545
Total 1108 381 + 163 690 1733 + 515 + 679
Senior High School
1-4- 1455 997 + 458 166 598* .+ 432 + 890
5 893 100 - 793 1865 2820* - 955 -1748
Total 2348 1097 - 335 2031 3418* - 523 - 858
Total Secondary
1-4 2277 1374 + 903 299 1510 +1211 +2114
5 1179 105 -1074 2422 3641 -1219 -2293
Total 3456 1479 - 171 2721 5151 - 8 - 179
Total All Levers
1-4 3523 2711 + 812 542 1934 +1392 +2204.
5 1594 331 -1263 3661 5313 -1652 -2915
Total 5117 3042 - 451 4203 7247 - 260 - 711
*Including Milwaukee Trade & Technical High School
21 . .

2
-20-
Table 6
AgiiihvhMENT SCORES, GRADES 6, 8, and' 10. FROM 1966 Through 1974
Grade 6 Grade 8 . Grade 10
Year Grade Equivalent Grade Equivalent Standard ScoreReading Math Reading Math Reading Math
1966 5.60 5.42 7.36. 7.28
1967 5.52 5.38- 7.26. 7.21 .45.9 45.0
1968 5.34 5.27 7.08 7.01 44.9 44.2
1969 5.36 5.36 7.03 6.96 44.5 43.8
1970 5.35 5.33 6.93 7.00 44.1 43.1
1971 5.28 5.30 6.87 6.87 ^43.1 43.2
1972 5.29 5.31 6.91 7.03 43.7 42.6
1973,t 5.20. j 5.27 6.77 7.01 43.2 42.4
1974 5.15 5.19 6.81 7.04
22
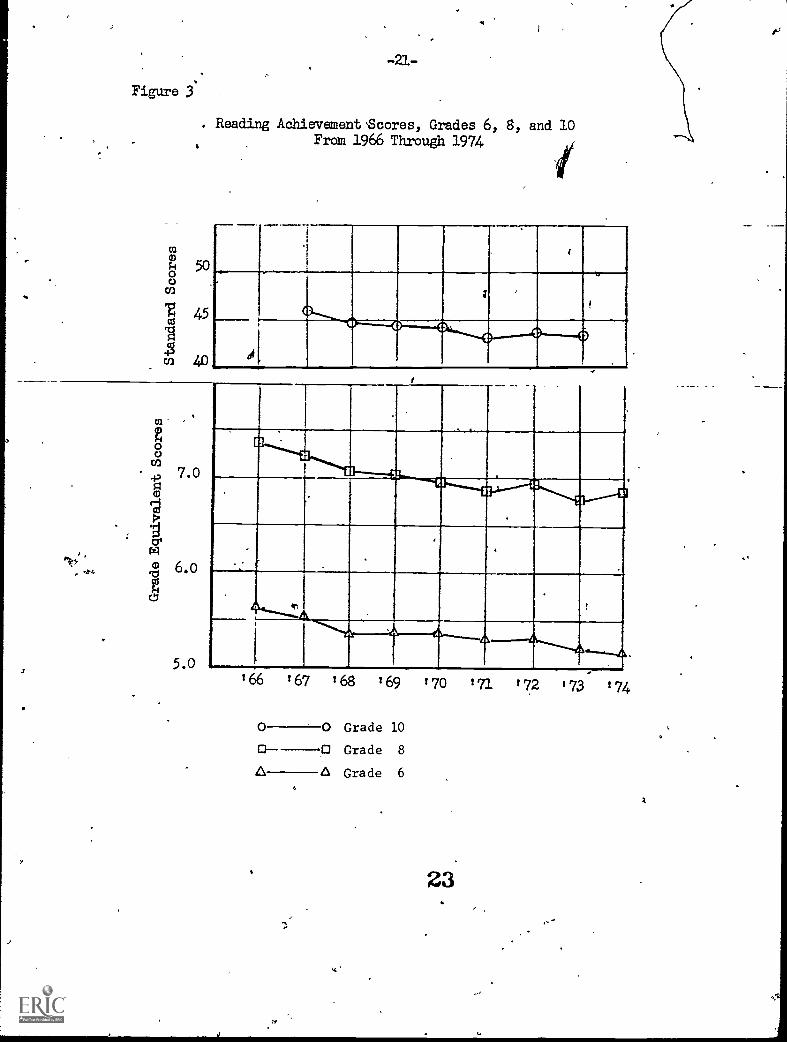
Figure 3*
1
-21-
. Reading Achievement Scores, Grades 6, 8, and 10From 1966 Through 1974 i
f2V", 4.4
02
400
Crl
4, 7.0gcp
...,'
0r4
0 6.0Tr4
5.0
C3
A...,......,
' 66 ' 67 ' 68 169 ' 70 '71 172 173- 174
0 0 Grade 100 0 Grade 8
A A Grade 6
234

Figtire 4
0)0O 50
En0
45zci
40
7.0
6.0
5.0
Math Achievement Scores, Grades 6, 8, and 10From 1966 Through 1974
1
40
.1
9
r.
1 A.
166 '67
0 C 00 06 6
'68. '69 '70 171 '72 '73.
Grade 10Grade 8
Gr ,ade 6
24
J

I -23 -
Table 7
'CORRELATION COEFFICIENTS BETWEEN PERCENT OF MINORITY STUDENTSIN A SCHOOL POPULATION AND ACHIEVEMENT TEST SCORES
DURING AN EIGHT YEAR PERIOD, 1966-1974
Elementary Level Junior High Level Senior High Level
Year Correlation BetweenEthnic Proportion and:
Correlation BetweenEthnic Proportion and:
1Correlation BetweenEthnic Proportion and:
Reading Math Reading Math Readirig Math
.
1966 -.720 -.726 - '.87]. - -.851
1967 -.810 -.780 -.890-1 -.836 -.794 -.798
1968 -.814 -.819 -.899 -.878 -.894 -.911
1969 -.854 -.849 -.937 -.888- -.948 -.910. i
1970 -.871 -.850 -.941 -.910 -.949 -.909
1971 -.856 -.801 -.938 -.913 -.943 -.896
1972 -.840 -.825 -.8 -.920 -.927 -.915
1973 -.833 -.847 -.900 -.933 -.920 -.896
1974 -;725 -.529 -.951 -.937
a
25
7
G

Table 8
CORRELATION CO INS BETWEEN CHANGE IN PERCENT OF MINORITYSTUDENTS FM YEAR TO YEAR AND ACHIEVEMENT TEST SCORES
DURING AN EIGHT -YEAR PE1IOD, 1966-1974
Elementary Level Junior'High Level Senior High Level
Ethnic ChangeYear to' Year
Correlation BetweenEthnic Change And:
-Correlation BetweenEthnic Change and:
Correlation BetweenEthnic Change and:
Reading Math Reading -Math Reading Math
1966-1967 -.241 -.260 1-..004 +.188 -.252 -.261
1967-1968 -.228 -.254 -.535, -.564 -.356 -.425a.
1968-1969 -.280 -.249 -.389 -.445 -.438 -.456,
1969-1970 +.057 +.042 -.362 -.317. -433 -.159
1970-1971 -.004 -.013 -.445 -.399 -.179 -.232
1971-1972 -.164 -.140 -.348 -.254 -.173 -.253
'1972-1973 -.150 -.188 +.113 +.131 -.016. +.045
1973 -1974 +.028 +.077 -.050 -.005 -.282 -.282
26
O
as4'
-25-
Table 9
CORRELATION COEFFICIENTS BETWEEN PERCENT OF MINORITY STUDENTSIN ELEMENTARY SCHOOLS AND READING ACHIEVEMENT SCORES
WHENSCHOOLS ARE GROUPED ACCORDING TO MINT OF MINORITY STUDENTS
Year
Percent of Minority Students
All Schools.0-25N=61
26-50N=5
51-75 '76-100N-725
-
1966 -.119 -.681 -.584 -.308 -.781
1967 -.091 -.502 -.300 -.445 -.746
1968 '--012 -.923 -.739. t -.282 -.858r
1969 -.360, -.930 -.794 1 -.427k -.916
1970 -.309' L.918 -.520 -.280 -.852
1971 -.304,
-.554 -.693 -.279 -.881
1972 -.306 -.913 -.432, -.086 -4840. b
1973 -.467 -.465 -.376 -.170 -.845
1974 -.475,
,-.944 -.456
-.219 -.919
Median -.309 -.918 -.520 -.280 -.852
1
27


![[Quick guide]sataid for-wis](https://static.fdocuments.in/doc/165x107/55c31c8cbb61eba5458b4628/quick-guidesataid-for-wis.jpg)