
Pilot-scale modeling of colloidal silica delivery to …HOSTED BY Pilot-scale modeling of colloidal...
11
HOSTED BY Pilot-scale modeling of colloidal silica delivery to liquefiable sands Murat Hamderi a,n , Patricia M. Gallagher b a Royal Haskoning DHV-ELC, Istanbul, Turkey b Dept. of Civil, Architectural and Environmental Engineering, Drexel University, Philadelphia, PA, USA Received 2 June 2013; received in revised form 9 October 2014; accepted 21 October 2014 Available online 29 January 2015 Abstract Passive site stabilization is a developing technology for the in situ mitigation of the risk of liquefaction without surface disruption. It involves the injection of stabilizing materials into liquefiable saturated sand. In this study, a pilot-scale facility (243 cm by 366 cm in plan 122 cm deep) was used to inject a dilute colloidal silica stabilizer into liquefiable sand specimens. The grout advancement was monitored in real time using electrical conductivity cells embedded in the specimens. Injection rates ranging from 65 to 9000 ml/min/well were used to investigate the optimal rate of grout delivery. In tests with low injection rates, the delivery performance was low due to sinking, while at higher injection rates, sinking was less noticeable. After the treatment, the degree of grout penetration was evaluated by excavating the model. The in situ unconfined compressive strength was measured using a pocket penetrometer, and soil blocks were excavated for additional unconfined compressive testing. Moreover, the 3-D flood simulator, UTCHEM, was utilized to simulate the experimental results and to predict the injection rates for adequate stabilizer delivery. The results of the strength testing demonstrated that as little as 1% by weight of the colloidal silica provides a significant improvement in strength after a month of curing. The study also revealed the feasibility of delivering colloidal silica to liquefiable sands by implementing a large-scale treatment. & 2015 The Japanese Geotechnical Society. Production and hosting by Elsevier B.V. All rights reserved. Keywords: Chemical grouting; Soil liquefaction; UTCHEM; Colloidal silica; Chemical transport; Groundwater 1. Introduction Passive site stabilization is a technique for the non-disruptive mitigation of the risk of liquefaction at developed sites susceptible to liquefaction. The stabilization is performed by slowly by injecting a stabilizing material at the up gradient edge of a site and delivering the stabilizer to the liquefiable area using the groundwater flow augmented by injection and extraction wells (Fig. 1). The stabilizer used for this technique is colloidal silica (CS), which is an aqueous dispersion of microscopic silica particles that can be made to gel by adjusting the pH or ionic strength of the dispersion. Laboratory, bench scale, centrifuge and field tests have all demonstrated the effectiveness of the CS treatment against liquefaction and liquefaction-induced damage (e.g., Gallagher and Mitchell, 2002; Gallagher et al., 2007; Conlee et al., 2012). One feasibility issue remaining is the ability to deliver the CS uniformly over long distances. Gallagher and Lin (2009) demonstrated the ability to transport CS in adequate concentrations in 1-m, 3-m and 10-m-long one-dimensional column tests. Gallagher et al. (2007) successfully delivered CS to a 2-m-thick liquefiable zone over a 9- m-diameter test area. The most difficult feasibility issue to address for passive site stabilization is whether the grout can be delivered uniformly to the liquefiable formation. In this research, we developed a pilot-scale box model to investigate the ability to deliver dilute The Japanese Geotechnical Society www.sciencedirect.com journal homepage: www.elsevier.com/locate/sandf Soils and Foundations http://dx.doi.org/10.1016/j.sandf.2014.12.011 0038-0806/& 2015 The Japanese Geotechnical Society. Production and hosting by Elsevier B.V. All rights reserved. n Corresponding author. E-mail addresses: [email protected] (M. Hamderi), [email protected] (P.M. Gallagher). Peer review under responsibility of The Japanese Geotechnical Society. Soils and Foundations 2015;55(1):143–153
Transcript of Pilot-scale modeling of colloidal silica delivery to …HOSTED BY Pilot-scale modeling of colloidal...

H O S T E D B Y The Japanese Geotechnical Society
Soils and Foundations
Soils and Foundations 2015;55(1):143–153
http://d0038-0
nCorE-m
pmg24@Peer
x.doi.org/806/& 201
respondinail addredrexel.e
review un
.sciencedirect.come: www.elsevier.com/locate/sandf
wwwjournal homepag
Pilot-scale modeling of colloidal silica delivery to liquefiable sands
Murat Hamderia,n, Patricia M. Gallagherb
aRoyal Haskoning DHV-ELC, Istanbul, TurkeybDept. of Civil, Architectural and Environmental Engineering, Drexel University, Philadelphia, PA, USA
Received 2 June 2013; received in revised form 9 October 2014; accepted 21 October 2014Available online 29 January 2015
Abstract
Passive site stabilization is a developing technology for the in situ mitigation of the risk of liquefaction without surface disruption. It involvesthe injection of stabilizing materials into liquefiable saturated sand. In this study, a pilot-scale facility (243 cm by 366 cm in plan� 122 cm deep)was used to inject a dilute colloidal silica stabilizer into liquefiable sand specimens. The grout advancement was monitored in real time usingelectrical conductivity cells embedded in the specimens. Injection rates ranging from 65 to 9000 ml/min/well were used to investigate the optimalrate of grout delivery. In tests with low injection rates, the delivery performance was low due to sinking, while at higher injection rates, sinkingwas less noticeable. After the treatment, the degree of grout penetration was evaluated by excavating the model. The in situ unconfinedcompressive strength was measured using a pocket penetrometer, and soil blocks were excavated for additional unconfined compressive testing.Moreover, the 3-D flood simulator, UTCHEM, was utilized to simulate the experimental results and to predict the injection rates for adequatestabilizer delivery. The results of the strength testing demonstrated that as little as 1% by weight of the colloidal silica provides a significantimprovement in strength after a month of curing. The study also revealed the feasibility of delivering colloidal silica to liquefiable sands byimplementing a large-scale treatment.& 2015 The Japanese Geotechnical Society. Production and hosting by Elsevier B.V. All rights reserved.
Keywords: Chemical grouting; Soil liquefaction; UTCHEM; Colloidal silica; Chemical transport; Groundwater
1. Introduction
Passive site stabilization is a technique for the non-disruptivemitigation of the risk of liquefaction at developed sites susceptibleto liquefaction. The stabilization is performed by slowly byinjecting a stabilizing material at the up gradient edge of a siteand delivering the stabilizer to the liquefiable area using thegroundwater flow augmented by injection and extraction wells(Fig. 1). The stabilizer used for this technique is colloidal silica(CS), which is an aqueous dispersion of microscopic silica particles
10.1016/j.sandf.2014.12.0115 The Japanese Geotechnical Society. Production and hosting by
g author.sses: [email protected] (M. Hamderi),du (P.M. Gallagher).der responsibility of The Japanese Geotechnical Society.
that can be made to gel by adjusting the pH or ionic strength of thedispersion. Laboratory, bench scale, centrifuge and field tests haveall demonstrated the effectiveness of the CS treatment againstliquefaction and liquefaction-induced damage (e.g., Gallagher andMitchell, 2002; Gallagher et al., 2007; Conlee et al., 2012). Onefeasibility issue remaining is the ability to deliver the CS uniformlyover long distances. Gallagher and Lin (2009) demonstrated theability to transport CS in adequate concentrations in 1-m, 3-m and10-m-long one-dimensional column tests. Gallagher et al. (2007)successfully delivered CS to a 2-m-thick liquefiable zone over a 9-m-diameter test area.The most difficult feasibility issue to address for passive site
stabilization is whether the grout can be delivered uniformly tothe liquefiable formation. In this research, we developed apilot-scale box model to investigate the ability to deliver dilute
Elsevier B.V. All rights reserved.

Fig. 1. Passive site stabilization concept.
Fig. 2. Gel time curves of CS solutions used in this research.
Fig. 3. Cyclic stress–strain behavior of untreated Monterey sand, relativedensity¼22%, CSR¼0.27 (Gallagher and Mitchell, 2002).
M. Hamderi, P.M. Gallagher / Soils and Foundations 55 (2015) 143–153144
CS in a large-scale laboratory model. This paper reports theresults of pilot-scale injections in a 10-m3 pilot-scale facility.In addition, we used UTCHEM, a finite difference numericalsimulator that can account for various densities and viscosities,to model the results of experiments and to predict the optimalinjection rates for adequate stabilizer delivery.
2. Colloidal silica properties and use in liquefactionmitigation
Colloidal silica (CS) is an aqueous dispersion of fine-sized,amorphous, nonporous and typically spherical silica particlesin the liquid phase ranging from 5 to 100 nm in diameter(DuPont, 1997). During their manufacturing, CS solutions arestabilized with alkali solutions against gelation. Alkalinesolutions make the nano particles ionize and repel each other.Gelation can be initiated by weakening the repulsive forces.This can be achieved by adjusting the pH level or the saltconcentration. In most cases, adjusting the pH is cumbersome;therefore, the gelling time can usually be adjusted by onlyadding salt. In this study, Ludox-SM was selected from amongthe several types of CS available. Ludox-SM CS is a highlystable dispersion of 7-nm size SiO2 particles. The dispersionhas 30% SiO2 by weight and a viscosity of about 5.5 mPa s at20 1C. When CS is diluted to 6% with water, the density of theCS is about 1.035 g/cm3 at 23 1C (density of tap water¼0.995g/cm3 at 23 1C) and the initial viscosity is between 1.05 and1.6 mPa s (viscosity of tap water¼0.92 mPa s at 23 1C). Thetime to gelation can range from a few minutes to a few months(Gallagher and Mitchell, 2002). The general shape of the geltime curve is the same regardless of the gel time, as shown inFig. 2, which presents the gel time curves for the experimentsdescribed later in this paper. The viscosity of the diluted CSremains low until just before gelation begins; this allows thegrout to be injected for most of the induction period.
3. Previous studies on CS
3.1. Performance of CS in liquefaction mitigation
In the past fifteen years, numerous researchers have reportedon significant improvements in the deformation resistance of
loose sands treated with CS in percentages from 2% by weightto 20% by weight (e.g., Kabashima and Towhata, 2000;Towhata and Kabashima, 2001; Gallagher and Mitchell,2002). Loose sand treated with CS typically behaves similarlyto dense sand and shows significant damping and cyclicmobility upon continued loading. Gallagher and Mitchell(2002) evaluated the performance of CS-treated and untreatedsamples by comparing their cyclic deformation resistance.The cylindrical Monterey sand samples were treated with 5%to 20% CS by weight. The samples were 7.5 cm in diameter by15.9 cm in height. The Monterey sand had a d50 of 0.44 mm(d50 is the grain size corresponding to 50% passing). The voidratio of the samples was 0.70 which corresponded to a relativedensity value of 22%. The samples were compared in terms ofstrain development at a given CSR which is defined as the ratioof the maximum cyclic shear stress to the initial effectiveconfining stress. A sinusoidal function with a period of 2 s wasused for all tests. During the cyclic loading, untreated samplescollapsed in 10–12 cycles (Fig. 3), whereas samples treatedwith 5% and 10% CS by weight could withstand at least 100cycles, and they remained intact (Fig. 4a and b).Conlee (2010) conducted a series of CS silica field injection
tests to treat a 0.5-m-thick layer of poorly graded sand with siltagainst liquefaction. The injection was performed in a 9 m2 areawith an average injection rate of 5.7 l/min. Following thetreatment, some dynamic shaking was introduced with dynamicshaker TRex. The induced accelerations ranged from 0.05 g to

Fig. 4. Axial deformation during cyclic loading for treated sand: (a) 5% CS and (b) 10% CS (Gallagher and Mitchell, 2002).
Fig. 5. Cross-plane shear strains (gxy, gxz and gyz) calculated for CS-treated anduntreated zones (by data from Conlee, 2010).
0.00
0.10
0.20
0.30
0.40
0.50
0.60
0.70
0.80
Pore
pre
ssur
e ra
tio (r
u)0 1 2 3 4 5 6 7
Distance from source (m)
UntreatedCS-Treated
Fig. 6. Pore pressure ratios (ru) of CS-treated and untreated zones (by datafrom Conlee, 2010).
M. Hamderi, P.M. Gallagher / Soils and Foundations 55 (2015) 143–153 145
0.4 g. A comparison was made between the treated and untreatedtest areas in terms of the measured shear strains and the porepressure ratio, ru. Cross-plane shear strains were calculated inhorizontal (xy), vertical (xz) and (yz) planes (Fig. 5). The treatedarea demonstrated a clear reduction in shear strains compared tothe untreated area. Similar to the shear strain values, porepressure ratios (ru) were considerably reduced in the treated area(Fig. 6). It was also reported by Conlee (2010) that if the CSinjection is less than about 3700 ml/min/well, the CS had atendency to sink downwards, due to its greater density comparedto water.
Soil improvement by grouting is not restricted to CS. Otherchemicals, such as acrylate liquid and calcium phosphatecompounds, have recently been reported for the improvementof loose soils (Fattah et al., 2014; Kawasaki and Akiyama,2013). Besides permeation grouting, compaction grouting isanother option in which the injected liquid expands andcompacts the surrounding soils rather than infiltrating throughthem. Wang et al. (2013) reported that when vibrations areapplied along with compacting grouting, the improvementbecomes about 4 times that of static compaction.
3.2. Delivery performance of CS
Early examples of CS injection include mainly permeabilitybarriers. One of the early efforts for forming permeabilitybarriers with CS was made by Moridis et al. (1996). It is
reported that fairly uniform barriers from CS bulbs could beestablished using conventional grouting equipment.Noll et al. (1992) formed a 0.9-m-wide permeability barrier
with CS (Ludox-SM) in a 3.6 m� 1.8 m� 1.2 m sand con-tainer. The delivery was performed by three injection wellslocated in the middle of the sand container surrounded by threeextraction wells on two opposite sides. After the injection, thebox was opened and excavated to check the CS coverage.Ludox CS was also used for the in-situ stabilization of a
chemically contaminated area by Noll et al. (1993). The in-situstabilization was accomplished by using an injection well inthe center and six extraction wells aligned at a 6-m radius.During the test, the injection rate of the center well and thetotal extraction rate of the outer wells were set to 11.35 l/min.According to the prediction made with the MODFLOWprogram, the grout would travel towards the extraction wells.In contrast, Ground Penetration Radar (GPR) results indicatedthat the grout sank. This study provides one of the few examplesdemonstrating that CS grout is vulnerable to sinking.Gallagher and Finsterle (2004) delivered Ludox-SM CS in a
0.31 m� 0.76 m� 0.27 m box with low head injection andextraction wells located on the upstream and downstream sidesof the box, respectively. The model was later simulated byTOUGH2 (Pruess, 1991). The measured concentration andviscosity of the grout were compared with those calculatedby TOUGH2. Generally, the predicted concentrations near theinjection wells were similar to those observed during the actual test,

Fig. 7. Testing facility prior to low injection rate Test 2.
Fig. 8. Various types of wells and sampling ports.
M. Hamderi, P.M. Gallagher / Soils and Foundations 55 (2015) 143–153146
whereas some deviations in concentration predictions occurred atremote locations. One of the shortcomings of this study is that thedistance between the injection and the extraction wells was toosmall to observe any sinking potential. Hamderi and Gallagher(2013) investigated the sinking potential of CS using numericalmethods, and they reported that the maximum feasible injectiondistance for CS lies in the range of 2.5 and 4 m.
4. Testing
The tests were grouped into two categories: low rate andhigh rate. The injection rates for the low rate and high rate testswere 65–130 ml/min/well and 2100–9600 ml/min/well, respec-tively. In addition to the laboratory tests, numerical simulationswere performed using the flood simulator “UTCHEM”.
4.1. Setup of low rate tests
Prior to placing the sand, the sampling ports and fiftyelectrical conductivity probes (Elmetron) were set in the pilotscale facility. For the low rate tests, 55 sampling ports werespaced at 50 cm and 30 cm intervals along the length and thewidth of the container, respectively. The sampling ports arelabeled in Fig. 7 and details are shown in Fig. 8. A total of 60hopper lifts were used to place 15 t of filter sand, whichproduced a loose sand layer with a relative density andhydraulic conductivity of 22% and 1.8� 10�1 cm/s, respec-tively. The minimum and maximum void ratios for the filtersand were 0.48 and 0.81, respectively. The sand placementmethod was inspired by Vaid and Negussey (1998), whoreported that when sand is freely poured onto water, it is

Fig. 9. General setup of the facility.
M. Hamderi, P.M. Gallagher / Soils and Foundations 55 (2015) 143–153 147
uniformly deposited regardless of the drop height. After thespecimen preparation, an overall water flow through thespecimen was established using constant head tanks. Theoverall flow through the specimen was established approxi-mately 7 days prior to the first test in order to saturate thespecimen as fully as possible and to simulate a baselinegroundwater flow regime.
4.2. Execution of low rate tests
The main purpose of the low rate tests was to investigate thepossibility of delivering CS at a total injection range of 260 ml/min. Grout was injected through 4 injection wells which werelocated about 130 cm away from the upstream side (Fig. 9).Additionally, 4 extraction wells were located on the down-stream side to augment the grout flow. The details of thesewells are given in Fig. 8. The continuity of the medium duringthe testing period was maintained by constant head reservoirswhich fed the system continuously through Inlet A and OutletA (Fig. 9). Aggregate layers were located at both extremes ofthe container in order distribute the flow over the entiresection.
In total, two low rate tests were performed. In low rate test1, grout was injected at a rate of 65 ml/min/well, whereasthe same amount was extracted through the extraction wellsfrom the downstream side. In total, a 0.4 pore volume ofgrout (about 1500 l) was prepared and planned for injectionin 4 days. The gelation time for the test was about 12 days,which would allow extra time for the gelation in case somedifficulties were encountered in the running test. The CScontent of the solution was 6% by weight. The density of theCS solution was 1.04 g/cm3.
Conlee (2010) reported that CS could easily be injectedon site when the viscosity was below 4 mPa s. Accordingly,before each test, CS solutions containing various NaCl concen-trations were prepared in order to determine the required NaClconcentration at which the viscosity during the injection phasewould remain below 4 mPa s.During low rate test 1, after 680 l of grout were injected, the
sampling data indicated that the grout was sinking rather thanmoving horizontally. Consequently, the injection was stoppedand the grout was flushed out of the sand for two days so that asecond test could be performed on the same specimen.The authors hypothesized that the sinking occurred due to
the relatively higher density of the dilute CS compared to water,sand with high permeability (0.18 cm/s), the low injection rate,the low relative density, the long injection wells and leakagearound the well annulus.In order to address the hypothesized reasons, some mod-
ifications were made in low rate test 2, such as increasing therelative density from 22% to 48%, using shorter wells anddoubling the injection rate.During low rate test 2, about 1000 l of 6% CS (by weight)—
0.175 N NaCl solution were injected in four and a half days.The concentration of CS, interpreted from the conductivity celldata tests, is plotted in Fig. 10. Despite the improvements, theCS sank in a similar manner to that which was observed in lowrate test 1. After the excavation, it was also observed that silicawas present in the bottom of the model, which agreed with thesampling and electrical conductivity cell results.
5. UTCHEM numerical tests
After sinking behavior was observed in the low injectionrate experiments, numerical experiments were performed to
M. Hamderi, P.M. Gallagher / Soils and Foundations 55 (2015) 143–153148
determine the optimal rates and pressures for injecting the CSthat would result in a horizontal, rather than vertical, delivery.UTCHEM 9.2, which is a three-dimensional finite differencechemical flood simulator developed by the University of Texasat Austin, was used to model the CS injection (CPGE, 2000).In addition, the applicability of UTCHEM to 1-dimensional CSflow simulations was reported by Hamderi et al. (2014).
5.1. UTCHEM modeling parameters
Low rate test 2, with an injection rate of 130 ml/min/well,was used as a baseline model for the predictive UTCHEMruns. Numerical tests were run at the injection rates of 130,378, 946, 1893, 3785, 5678 and 7570 ml/min/well. A constantpressure boundary (atmospheric pressure) was assigned to thedownstream side, whereas the right boundary on the upstreamside was impermeable.
CS was incorporated in UTCHEM by assigning viscosity,density and full solubility parameters to the oleic componentpresent in UTCHEM. The assigned viscosity and density were1.4 mPa s and 1.039 g/cm3, respectively. During the low rateexperiments, the viscosity was stable around 1.4 cP at 23 1C(0.92 mPa s for tap water) and increased by less than 5% during
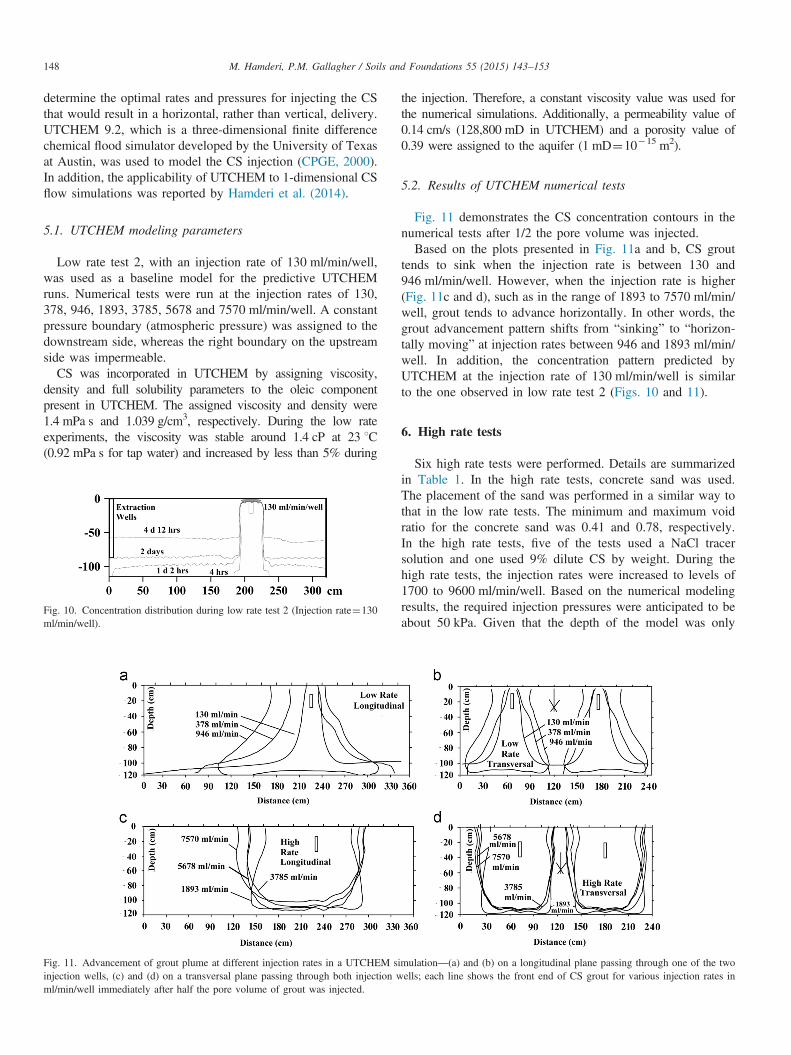
Fig. 11. Advancement of grout plume at different injection rates in a UTCHEM siinjection wells, (c) and (d) on a transversal plane passing through both injection wml/min/well immediately after half the pore volume of grout was injected.
Fig. 10. Concentration distribution during low rate test 2 (Injection rate¼130ml/min/well).
the injection. Therefore, a constant viscosity value was used forthe numerical simulations. Additionally, a permeability value of0.14 cm/s (128,800 mD in UTCHEM) and a porosity value of0.39 were assigned to the aquifer (1 mD¼10�15 m2).
5.2. Results of UTCHEM numerical tests
Fig. 11 demonstrates the CS concentration contours in thenumerical tests after 1/2 the pore volume was injected.Based on the plots presented in Fig. 11a and b, CS grout
tends to sink when the injection rate is between 130 and946 ml/min/well. However, when the injection rate is higher(Fig. 11c and d), such as in the range of 1893 to 7570 ml/min/well, grout tends to advance horizontally. In other words, thegrout advancement pattern shifts from “sinking” to “horizon-tally moving” at injection rates between 946 and 1893 ml/min/well. In addition, the concentration pattern predicted byUTCHEM at the injection rate of 130 ml/min/well is similarto the one observed in low rate test 2 (Figs. 10 and 11).
6. High rate tests
Six high rate tests were performed. Details are summarizedin Table 1. In the high rate tests, concrete sand was used.The placement of the sand was performed in a similar way tothat in the low rate tests. The minimum and maximum voidratio for the concrete sand was 0.41 and 0.78, respectively.In the high rate tests, five of the tests used a NaCl tracersolution and one used 9% dilute CS by weight. During thehigh rate tests, the injection rates were increased to levels of1700 to 9600 ml/min/well. Based on the numerical modelingresults, the required injection pressures were anticipated to beabout 50 kPa. Given that the depth of the model was only
mulation—(a) and (b) on a longitudinal plane passing through one of the twoells; each line shows the front end of CS grout for various injection rates in

Table 1Injection rates for high rate tests
Test 1 Test 2 Test 3 Test 4 Test 5 Test 6
Avg. Inj. Rate (ml/min/well) 5800 4400 5600 2100 9600 6800Volume Injected (l) 1752 3842 4133 4133 4088 4182Volume Injected (pore volume) 0.4 1.0 1.1 1.1 1.0 1.1Injection Duration (min) 150 442 366 975 213 308Max. Inject. Press. per Well (kPa) 1.3 1.2 13.1 7.9 22.1 49.6Grout Type/Density (g/cc) salt/1.02 salt/1.063 salt/1.063 salt/1.063 salt/1.063 CS/1.063Concentration (g/l) 26.5 82 82 82 82 9 wt% CS þ
0.295N NaClPump Type 1/2 Hp
Centrifugal1/2 HpCentrifugal
Air DoubleDiaphragm
Air DoubleDiaphragm
Air DoubleDiaphragm
Air DoubleDiaphragm
Fig. 12. Testing facility prior to high rate test 1.
M. Hamderi, P.M. Gallagher / Soils and Foundations 55 (2015) 143–153 149
about 1.2 m, it was necessary to fabricate a pressure cover sothat higher injection pressures could be used. The steel cover,constructed of a 1.25-cm steel plate, was affixed to thespecimen box using side clamps (Figs. 9 and 12). To preventleakage through the cover, a 7-cm-thick C/S bentonite layerwas placed on top of the sand layer. C/S bentonite is a granularbentonite product composed of polymer-free dried bentoniteclay in various mesh sizes. In our tests, it swelled when it wasexposed to water, creating a seal that was generally effective atpreventing leakage.
Some grout return was detected around the annulus of theinjection wells despite sealing around them with bentonite.
During the tests, injection pressures and tail water NaClconcentrations were measured. Due to the presence of thecover, the manual sampling ports could not be used; however,the electrical conductivity probes that were affixed to thesampling ports were used to monitor the electrical conductivity.Due to the corrosive nature of the NaCl tracer, many of theelectrical conductivity cells stopped functioning as the testsprogressed. While measurements in the remaining cells con-tinued to be recorded, the best conductivity results wereobtained in high rate test 1. By the time high rate test 6 wasstarted, only three of the electrical conductivity cells wereoperational.
After the CS injection was completed (high rate test 6), thespecimen was allowed to cure for 25 days prior to excavation.The model was excavated in vertical slices. A vertical surface
was excavated every 0.3 m. At each vertical sampling surface,approximately 200 pocket penetrometer readings were taken ina grid pattern using a Geotests soil penetrometer. A pocketpenetrometer is a spring-operated device used to measurecompressive strength in kg/cm2. Since the electrical conduc-tivity cells malfunctioned, the penetrometer readings weresubsequently used to estimate the final concentration distribu-tion in this experiment. In addition, at each vertical samplingsurface, four soil blocks (0.30 m� 0.30 m� 0.15 m) wereexcavated and sealed in plastic wrap and aluminum foil forsubsequent testing. Unconfined compression testing was doneon 24 cylindrical specimens cut from the block samples. Redfood coloring also assisted in assessing the coverage achievedby the CS.
6.1. Results of high rate test 1
As each high rate test was completed, it was simulated usingUTCHEM to compare the results. Major aspects of the tests,such as the simulation of outlets and the aggregate layer on thedownstream side, the injection and extraction wells and theleakage, were included in the model to improve the simulationaccuracy.A constant pressure boundary with permeable properties was
assigned to the downstream side (Fig. 13), whereas the rightboundary on the upstream side was set to be impermeable.In UTCHEM, an intrinsic permeability value of 31,280 mD
(1 mD¼10�15 m2), which corresponds to a hydraulic con-ductivity value of 0.0034 cm/s, was assigned to the sand layer.The 5-cm-diameter outlet in the actual test was simulated witha 5 cm� 20 cm� 20 cm cell which had a comparatively highintrinsic permeability of 2500,000 mD.Before the experiment, it was expected that the tracer
solution would travel from the injection well to the extractionwell and the outlet. These routes are marked as “2” and “1” inFig. 13. About 20 min into the experiment, the bentonite sealaround the extraction wells failed, resulting in the clogging ofthe wells. The broken seal around the top of the well providedan additional pathway for the tracer travel, which is marked“3” in Fig. 13a. This phenomenon was modeled in UTCHEMby replacing the extraction wells with point wells at the

Fig. 13. Distribution of grout concentration in high rate test 1—(a) measured @ t¼80 min, (b) simulated @ t¼80 min, (c) measured @ t¼150 min and(d) simulated @ t¼150 min.
Fig. 14. Penetrometer dial reading and CS% relation.
M. Hamderi, P.M. Gallagher / Soils and Foundations 55 (2015) 143–153150
surface, which are labeled in Fig. 13b and d as “simulatedoutlet”. Nevertheless, the measured and simulated distributionsof NaCl at t¼80 min and t¼150 min were in fairly goodagreement (Fig. 13). The remainder of the NaCl tracer testsshowed similar results and are not reported here.
6.2. High rate test 6 (with colloidal silica)
In the final high injection rate experiment, most of theelectrical conductivity cells had already stopped working, sothe delivery performance of CS had to be evaluated in terms ofthe final CS distribution. The final concentrations were inferredin the following ways: (1) from pocket penetrometer readingstaken as previously described; (2) from electrical conductivitymeasurements at the three functional electrical conductivitycells in the specimen and at the tail water outlet; and, (3) bycorrelating the penetrometer readings and unconfined compres-sion test results performed on CS grouted sand samples.
The results of the laboratory pocket penetrometer testsresulted in a linear relationship between the penetrometer dialreadings and the percentage of CS (Fig. 14).
This relationship was used to estimate the CS concentrationat the penetrometer sampling points in the treated specimenusing the following formula:
CS%¼ Ppoint
Pwell� 9 % ð1Þ
where Ppoint¼pocket penetrometer reading at a point, Pwell¼pocket penetrometer reading around the well and “9%” is thebatch or well concentration of CS. Then, the final CS distri-bution in the specimen was calculated by inserting the measuredvalues into Eq. (1).
6.3. Interpretation of CS concentration plot
Fig. 15a demonstrates the CS concentration plots on alongitudinal plane that were calculated using the values
obtained from the penetrometer method. Additionally, CSpercentages predicted by the electrical conductivity methodwere marked on the same plot. The results of the two methodsare in a good agreement.During the delivery, it is hypothesized that CS grout
traveled in a dispersed form along three different routes, asshown in Fig. 15a. In the vicinity of the wells, the measuredCS concentrations are in the order of 9% by weight. Down-stream from the wells, travel is through the sand layer (Route 1)or by leakage through the steel cover-bentonite interface (Route2). The combination of these two travel paths resulted in asignificant variation in concentration throughout the downstreamsection of the model. There is also some travel up gradient of thewells (Route 3) as a result of the injection pressures, even thoughthere is no outlet on the up gradient edge of the model. Upstreamfrom the injection well, the concentration decreases to about 1–2% by weight CS, as expected.The extent of the grout penetration along Route 1 is shown
in Fig. 16a with red color. The leaky route is also shown inFig. 16b. The existence of CS gel on the top of the bentonitelayer indicates that the leakage occurred between the siliconwell gasket and the steel cover. It is hypothesized that thecontact between the cover and the silicon gasket was lost due

Fig. 15. Distribution of colloidal silica concentration in high rate test 6—(a) calculated from Eq. (1) and (b) simulated with UTCHEM.
Fig. 16. (a) Grout penetration around injection wells and (b) leaked gel between the cover and the bentonite layer.
Fig. 17. Unconfined compression strength and penetrometer dial reading.
M. Hamderi, P.M. Gallagher / Soils and Foundations 55 (2015) 143–153 151
to the uplift force acting on the steel cover as a result of thebentonite swelling as it hydrated.
The results of the unconfined compressive tests from both thelaboratory and the excavated model specimens are presented inFig. 17. The laboratory specimens were cured for three days andplotted to the right of the excavated model specimens, whichwere cured for 25 days. The unconfined strength of the sandspecimens treated with different CS concentrations fell in therange of 10 and 120 kPa. Based on Gallagher and Mitchell(2002), this level of improvement would be expected to be ableto adequately mitigate the liquefaction risk for loose sandssusceptible to earthquake loading.
6.4. UTCHEM simulation of the CS injection
In order to correctly model the experiment in UTCHEM, theamount of grout that leaked had to be estimated. There was no
way to directly measure the percentage of grout that leakedthrough the steel–bentonite interface (Fig. 15a). As an alter-native method, therefore, the percentage of leaked grout wasestimated using the tail-water concentration measured in theoutlet. In principle, the amount of grout travelling to theoutlet is the sum of the amounts from Route 1 and Route 2.In UTCHEM, a parametric study was performed, in whichdifferent percentages of the injected fluid were sent along thedifferent routes. This was achieved by setting up two injectionwells and supplying each one with part of the total flowthrough the model. Route 2 was modeled by assigning high-permeability properties to the interface layer (10,000,000 mD)(Fig. 15b). Applying the law of conservation of mass, the totalCS % was taken to be
Total CS%¼ leaked CS%þ injected CS% ð2ÞBy applying different combinations of flow to Routes 1 and
2 in each UTCHEM run, different tail water concentrationswere obtained. They are shown in Fig. 18 along with theobserved tail-water CS concentration. The closest matchbetween the measured and the simulated data was achievedat “70% leaked—30% injected case”. The final CS concentra-tion in the “70% leaked—30% injected” case is also plotted inFig. 15b and shows a fairly good match with the calculatedconcentrations.
6.5. Viscosity and injection pressure prediction by UTCHEM
The viscosity of the CS in the mixing tank was measuredduring the 277 min of injection (Fig. 19). We used this curve

Fig. 18. Tailwater concentrations for different combinations of leak andinjection rates in high rate test 6.
Fig. 19. Viscosity of colloidal silica in the mixing tank.
Fig. 20. Measured and simulated injection pressures (kPa).
M. Hamderi, P.M. Gallagher / Soils and Foundations 55 (2015) 143–153152
in UTCHEM to predict the injection pressures during theinjection. The area below the curve was divided into 10 equaltime periods of 27.7 min. During the injection, the viscosityvaried between 1.9 mPa s and 7 mPa s. For the UTCHEManalysis, an average viscosity value of 2.85 mPa s in 10 equaltime periods was used. In UTCHEM, assuming that water andCS are fully miscible in the liquid phase, the viscosity at apoint “μp” was estimated with the following formula:
μp ¼ μwVwþμcsVcs ð3Þ
where μw¼viscosity of water at 23 1C¼0.92 mPa s, μw¼aver-age viscosity of the batch¼2.85 mPa s, Vw¼volumetric ratioof water in the liquid phase, Vcs¼volumetric ratio of CS in the
liquid phase and VwþVcs¼1. This analysis resulted in asimilar injection pressure trend between the simulated andthe measured data (Fig. 20).
7. Conclusions
We developed a 10-m3 pilot-scale box model to investigatethe ability to inject dilute CS at a large-scale laboratoryfacility. In low concentrations, colloidal silica can adequatelymitigate the liquefaction risk in loose sands by cementingindividual grains together and immobilizing the pore fluid. Inaddition, it has a low initial viscosity and a wide range ofcontrollable gel times, so that it can potentially be injected overlonger distances than conventional grouts, resulting in thelarger spacing of delivery wells.One of the challenges associated with delivery over long
distances is to prevent sinking of the colloidal silica prior to itsreaching the desired location. Colloidal silica has a densityslightly higher than water; consequently, it will always have atendency to settle due to gravity. Therefore, it is necessary toselect an injection method such that the horizontal travelcomponent exceeds the vertical travel component. In addition,the gel time must be selected so that the viscosity remains lowuntil the colloidal silica reaches the desired location and thenincreases in time to prevent gravitational settling. Our experi-ments show that low injection rates (o1900 ml/min/well)result in gravitational settling, but increasing the injection ratesto between 1900 and 7600 ml/min/well result in sufficienthorizontal pressures to adequately deliver an appropriateconcentration of dilute CS to mitigate the risk of liquefaction.The viscosity only needs to increase to about 4 cP to preventadditional stabilizer movement once the target location isreached (Gallagher and Lin, 2009).Based on our findings, the pocket penetrometer provided a
good correlation for the percentage of CS in the treated sand.Although we did not do cyclic testing on the treated specimen,Gallagher and Lin (2009) established that the unconfinedcompression strength could be used as an index test todetermine if adequate treatment has been achieved. In thisresearch, we show that the pocket penetrometer can also serveas an index test. We also found that concentrations as low as1% by weight CS provided sufficient cohesion to bind thesand after a relatively long curing time. Future research willinvestigate if the minimum concentration of 5% by weightsuggested by Gallagher and Mitchell (2002) could be reduced.The incorporation of viscosity and density effects in
UTCHEM provides fairly successful numerical simulationresults. The grout concentrations and the required injectionpressures can be estimated at every calculation interval. Therequired injection pressure is important for predicting the limitsof grout injection without exceeding the allowable groutingpressures in various sands.Experimentally, we found that it was difficult to model the
stabilizer delivery without having the ability to increase theconfining pressure on the specimen. We modified the facilityto include a cover that would permit higher levels injectionpressure; it worked with moderate success, but leakage was

M. Hamderi, P.M. Gallagher / Soils and Foundations 55 (2015) 143–153 153
still experienced around the wells and through the granularbentonite layer.
The CS stabilizer is a viable option for the passive stabili-zation of soils that underlay existing structures and are difficultto treat by conventional ground improvement methods. Theresults of these pilot-scale experiments support the findingsfrom prior research by demonstrating the ability to deliverdilute CS in adequate concentrations to improve the soil’sresistance to seismic deformations.
In the high rate experiments, one pore volume of CS was notsufficient for establishing full concentrations in the treatedvolume. This was attributed to the high dispersion mechanismwhich was triggered by high injection rates.
Acknowledgements
Financial support for this research was provided by theNational Science Foundation under Grant no. CMS-0238614.Any opinions, findings, conclusions and/or recommendationsexpressed in this material are those of the writer(s) and do notnecessarily reflect the views of the project sponsors.
References
Center for Petroleum and Geosystems Engineering, 2000. Technical Docu-mentation for UTCHEM-9.0: A Three-dimensional Chemical FloodSimulator. CPGE, University of Texas at Austin, Texas.
Conlee, C., 2010. Dynamic Properties of Colloidal Silica Soils UsingCentrifuge Model Tests and a Full-Scale Field Test. Drexel Univ.,Philadelphia, PA (Ph.D. Thesis).
Conlee, C., Gallagher, P.M., Boulanger, R.W., Kamai, R., 2012. Centrifugemodeling for liquefaction mitigation using colloidal silica stabilizer. J.Geotech. Geoenviron. Eng. 138 (11), 1334–1345.
DuPont, 1997. Ludox CS: Properties, Uses, Storage, Handling and ProductInformation. Delaware, Wilmington.
Fattah, M.Y., Al-Ani, M.M., Al-Lamy, M.T.A., 2014. Studying collapsepotential of gypseous soil treated by grouting. Soils Found. 54-3, 396–404.
Gallagher, P.M., Mitchell, J.K., 2002. Influence of colloidal silica grout onliquefaction potential and cyclic undrained behavior of loose sand. SoilDyn. Earthquake Eng 22, 1017–1026.
Gallagher, P.M., Finsterle, S., 2004. Physical and numerical model of CSinjection for passive site stabilization. Vadose Zone J. 3, 917–925.
Gallagher, P.M., Conlee, C.T., Rollins, K.M., 2007. Full-scale field testing ofcolloidal silica grouting for mitigation of liquefaction risk. J. Geotech.Geoenviron. Eng. 133 (2), 186–196.
Gallagher, P.M., Lin, Y., 2009. Colloidal silica transport through liquefiableporous media. J. Geotech. Geoenviron. Eng. 135 (11), 1702–1712.
Hamderi, M., Gallagher, P.M., 2013. An optimization study on the deliverydistance of colloidal silica. Sci. Res. Essays 8 (27), 1314–1323.
Hamderi, M., Gallagher, P.M., Lin, Y., 2014. Numerical model for colloidalsilica injected column tests. Vadose Zone J.http://dxdoi.org/10.2136/vzj2013.07.0138.
Kabashima, Y., Towhata, I., 2000. Improvement of dynamic strength of sandby means of infiltration grouting. In: Proc. Third International Conferenceon Ground Improvement Techniques—2000. Singapore, pp. 203–208.
Kawasaki, S., Akiyama, M., 2013. Enhancement of unconfined compressivestrength of sand test pieces cemented with calcium phosphate compoundby addition of various powders. Soils Found. 53-6, 966–976.
Moridis, G.J., Apps, J., Persoff, P., 1996. A Field Test of a Waste ContainmentTechnology Using a New Generation of Injectable Barrier Liquids. 18–23.Spectrum ’96, Seattle, WA (August).
Noll, M.R., Bartlett, C., Dochat, T.M., 1992 In situ permeability reduction andchemical fixation using CS. In: Proceedings of the Sixth National OutdoorAction Conference on Aquifer Restoration. National Groundwater Asso-ciation, Las Vegas, pp. 443–457.
Noll, M.R., Epps, D.E., Bartlett, C.L., Chen, P.J., (1993) Pilot field applicationof a CS gel technology for in situ hot spot stabilization and horizontalgrouting. In: Proceedings of the Seventh National Outdoor ActionConference, National Ground Water Association, Las Vegas, pp. 207–219.
Pruess, K., 1991. TOUGH2—A General Numerical Simulator for MultiphaseFluid and Heat Flow. Lawrence Berkeley Laboratory, Berkeley, CA(Report LBL-29400).
Towhata, I., Kabashima Y., 2001. Mitigation of seismically-induced deforma-tion of loose sandy foundation by uniform permeation grouting. In: Proc.Earthquake Geotechnical Engineering Satellite Conference, 15th Interna-tional Conference on Soil Mechanics and Geotechnical Engineering,Istanbul, Turkey, pp. 313–318.
Vaid, Y.P., Negussey, D., 1998. Preparation of reconstituted sand specimens.In: Donaghe, R.T., Changey, R.C., Silver, M.L. (Eds.), Advanced TriaxialTesting of Soil and Rock, ASTM 977. American Society for Testing andMaterials, Philadelphia, pp. 405–417.
Wang, S.Y., Chan, D.H., Lam, K.C., Au, S.K.A., 2013. A new laboratoryapparatus for studying dynamic compaction grouting into granular soils.Soils Found. 53-3, 462–468.