Pilot experience and performance in an airline environment · PDF filePilot experience and...
43
ATSB Transport Safety Report Investigation Pilot experience and performance in an airline environment Researcn ATSB Transport Safety Report Aviation Research Investigation AR-2012-023 Final – 17 July 2013
Transcript of Pilot experience and performance in an airline environment · PDF filePilot experience and...

Insert document title
Location | Date
ATSB Transport Safety Report[Insert Mode] Occurrence InvestigationXX-YYYY-####Final
Investigation
Pilot experience and performance in an airline environment
Researcn ATSB Transport Safety ReportAviation Research InvestigationAR-2012-023Final – 17 July 2013
Authors: Melanie A. Todd, ATSB & University of South Australia
Dr Matthew J.W. Thomas, Central Queensland University & University of South Australia
Released in accordance with section 25 of the Transport Safety Investigation Act 2003
Publishing information
Published by: Australian Transport Safety Bureau Postal address: PO Box 967, Civic Square ACT 2608 Office: 62 Northbourne Avenue Canberra, Australian Capital Territory 2601 Telephone: 1800 020 616, from overseas +61 2 6257 4150 (24 hours) Accident and incident notification: 1800 011 034 (24 hours) Facsimile: 02 6247 3117, from overseas +61 2 6247 3117 Email: [email protected] Internet: www.atsb.gov.au
© Commonwealth of Australia 2013
Ownership of intellectual property rights in this publication Unless otherwise noted, copyright (and any other intellectual property rights, if any) in this publication is owned by the Commonwealth of Australia.
Creative Commons licence With the exception of the Coat of Arms, ATSB logo, and photos and graphics in which a third party holds copyright, this publication is licensed under a Creative Commons Attribution 3.0 Australia licence.
Creative Commons Attribution 3.0 Australia Licence is a standard form license agreement that allows you to copy, distribute, transmit and adapt this publication provided that you attribute the work.
The ATSB’s preference is that you attribute this publication (and any material sourced from it) using the following wording: Source: Australian Transport Safety Bureau
Copyright in material obtained from other agencies, private individuals or organisations, belongs to those agencies, individuals or organisations. Where you want to use their material you will need to contact them directly. Addendum
Page Change Date
Safety summary
Why have we done this report Significant debate has occurred within the aviation industry regarding the issues of pilot training and experience, particularly with regard to the introduction of new pilot training programs that are focused on training cadet pilots. The main concern being presented by some sectors of the industry that are not in favour of these concepts is that these low-hour co-pilots are not as competent as their high-hour peers.
The ATSB gathered data from three airlines to explore the issue of pilot performance as a function of both flight hour experience, and entry pathway. Entry pathway analysis compared cadet pilots (who generally had not accumulated prior flight hours or experience) to those pilots who entered an airline after accumulating flight hours in other areas of the aviation industry.
Data were collected on a number of metrics from simulator check flights, which covered non-normal operations, and line checks, which covered normal day-to-day flight operations.
What the ATSB found The overall performance of cadets and low-hour pilots matched that of their direct entry and high-hour peers. All pilots were marked as proficient at the completion of the check flights, with the only differences between the groups being a function of how many exceeded the required standard.
The differences between the low and high-hour pilots in ‘meeting’ and ‘exceeding’ the standard across all metrics were variable within airlines and inconsistent across all three airlines. This suggests that the differences between the groups were not of a systemic nature that would highlight an area of concern for industry. While the metric normal landing showed a difference across two of the three airlines, none of the other required regulatory manoeuvres or technical metrics were significantly different in more than one airline. For non-technical metrics, both leadership and situation awareness were significantly different in all three airlines. Although this is understandable given the low experience of cadet and low-hour pilots, focused exposure to those metrics during initial airline training may reduce this difference as was seen in the data for cadets collected at the 5-year mark in one airline.
Safety message The evidence in this report indicates that the cadet pathway for low-hour pilots is a valid option for airlines. There was no evidence to indicate that cadets or low-hour pilots within the airlines studied were any less competent or proficient than their direct entry and high-hour peers.
Contents
Context ......................................................................................................................................1
Literature review ......................................................................................................................3 General Aviation pilots 3 Airline pilots 4
Methodology ............................................................................................................................6 Data sources 6 Design and procedure 6
Data sources 6 Independent variables 7 Dependent variables 8
Statistical analysis 10
Results ................................................................................................................................... 11 Airline A 11
Simulator proficiency check 11 Line check 14
Airline B 16 Simulator proficiency check 16 Line check 20
Airline C 22 Simulator proficiency check 22 Line check 24
Discussion ............................................................................................................................. 27 Simulator proficiency check results 28 Line check results 29 Limitations 30
Conclusion ............................................................................................................................ 32
References............................................................................................................................. 33
Sources and submissions .................................................................................................. 35 Submissions 35
Australian Transport Safety Bureau .................................................................................. 36 Purpose of safety investigations 36 Developing safety action 36
Glossary ................................................................................................................................. 37
› 1 ‹
ATSB – AR-2012-023
Context Significant debate has occurred within the aviation industry regarding the issues of pilot training and experience, particularly with regard to the introduction of the Multi-crew Pilot Licence (MPL) by the International Civil Aviation Organisation (ICAO).1 The main concern being presented by sectors of the industry that are not in favour of the MPL concept is the possibility that low-hour pilots are not as competent as their high-hour peers.
As part of this debate, two main issues are currently attracting attention and discussion. The first is a focus on the hours a pilot has accumulated, generally with an inherent assumption that these hours ensure a level of individual skill. The second is a focus on competency, both as an assumed result of flight hour accumulation and because competency-based training is quoted as the cornerstone of aviation training, in particular with regard to MPL. These issues and assumptions have received considerable attention following two high profile international aviation accidents in 2009, one involving a Bombardier DHC-8 at Buffalo, New York, and the other an Airbus A330, operating as Air France flight 447 (AF447), en-route from Rio de Janeiro, Brazil to Paris, France.2
The AF447 accident highlighted the issue of competency and, in particular, the relevance of current simulator and non-normal operations training for pilots, as well as raising issues around automation use and systems knowledge, both of which are subsets of pilot competency. Of interest is the fact that the flight crew of AF447 had a high number of flight hours, which appears at odds with the assumption that high flight hours will ensure adequate performance in a non-normal event.
In response to the DHC-8 accident, which was viewed in part as being the result of an hours/skill issue, the United States Congress enacted legislation to increase the amount of flying experience that first officers would need, in order to enter an airline, to 1,500 hours.
The Australian Senate held an inquiry into pilot training3 at the end of 2010 to explore the need to enact similar legislation in Australia. In response to the Australian inquiry, submissions from flight training organisations and airlines highlighted the importance of cadets as a recruitment option for the airlines, a system that has been in place around the world for a number of years. Cadets are pilots who, generally, have limited or no prior flight training prior to starting their cadetship, and are trained specifically for an airline at a flight training organisation. After training, these pilots enter the airline as a second or first officer, depending on the airline and its requirements.
Those supportive of cadet schemes emphasise the ability of the airlines to ‘mould’ the pilots to the airline environment, thereby shaping their behaviours and instilling the required performance from the start of their training. Part of the justification from ICAO in relation to the introduction of MPL also highlighted these benefits, along with the use of competency-based training as a mitigator of the risks associated with changes in the training program, and the introduction of multi-crew cooperation techniques such as crew resource management (CRM) and threat and error management (TEM) as strong benefits of the changed program.
Those who are not supportive of cadet schemes are of the view that in order to be a successful airline pilot, an individual needs to have accumulated flight hours either with the military, in general aviation or other (often smaller) airlines, prior to entering a major airline as a second or first officer.
1 ICAO (2006). Annex 1 – Personnel Licensing (10th edition). Montreal, Canada 2 NTSB (2012). Loss of Control on Approach Colgan Air, Inc. Operating as Continental Connection Flight 3407,
Bombardier DHC-8-400, N200WQ, Clarence Center, New York, February 12, 2009. National Transportation Safety Board, Washington, US. BEA (2012). Final Report on accident on 1st June 2009 to the Airbus A330-203 registered F-GZCP operated by Air France flight AF447 Rio de Janeiro – Paris. Bureau d’Enquêtes et d’Analyses pour la sécurité de l’aviation civile. Paris, France.
3 Parliament of Australia Senate. (2010). Pilot training and airline safety. Canberra, Australia.
› 2 ‹
ATSB – AR-2012-023
Despite the on-going debate and regulatory guidance on pilot training, which outlines the minimum hours required and the areas that must be covered, there is very little research on the differences, if any, between pilots in airlines who have entered from these various pathways, including as a cadet. While there are some studies which have examined the effect of flight hours on accident risk; judgement; ability to interpret weather and one on the effect of flight hours on performance in normal flight operations, there is very little looking at performance in non-normal scenarios, specifically as a function of both flight hours and entry pathway. In this report, ‘entry pathway’ refers to the difference between cadets and direct entry pilots. Direct entry pilots enter an airline having already been licensed and have generally accumulated a number of flight hours. Direct entry pilots typically build up these hours in the military, general aviation (non-airline flying) or other airlines.
This report differentiates between normal events, which are routine, expected events that do not require additional training or specific targeted intervention by a pilot; and non-normal events, which involve a non-routine event or problem with the aircraft, its systems, other crew, or the environment, which is not routine and is outside of what is expected in a ‘normal’ flight.
The aims of this study are to:
(1) test for a difference in performance in the simulator proficiency check for normal and non-normal operations, based on the entry pathway to the airline
(2) test for a difference in performance in the simulator proficiency check for normal and non-normal operations, based on the hours experience of the pilots
(3) compare the results with the authors’ previous study (Todd & Thomas, 2012), in examining if there are differences in pilot performance in the line checks based on entry pathway or hours.
This study will also address some of the limitations of the previous study, which did not consider simulator proficiency data and entry pathway.
It can be expected that if the concerns of sectors of the industry relating to low-hour/cadet pilots are valid, that high-hour/direct entry pilots will perform better. If ICAO’s stance on MPL and the airlines’ defence of cadets is valid, there will be no difference in performance or cadets will perform better than their direct entry peers.

› 3 ‹
ATSB – AR-2012-023
Literature review There have been a number of studies into the effect of experience on performance of pilots, including the non-technical areas such as decision-making (Wiegmann et al, 2002; Wiggins & Bollwerk, 2006; Wiggins & O’Hare, 2003; Todd & Thomas, 2012), with many studying the link between experience and accident rates (Goh &Wiegmann, 2002; Groff & Price, 2006; Bazargan & Guzhva, 2011; Li et al, 2003; O’Hare & Chalmers, 1999). It is important to note that most of these studies use pilot populations that are quite different to airline pilots. In particular, most of the low experience groups in the following studies did not receive the same standard of training as airline cadets who, after initial accelerated competency based training, are transitioned to multi-crew operations in large, complex aircraft.
One area of interest to researchers in the experience/performance debate is accidents involving flight into instrument meteorological conditions (IMC) by visual flight rules (VFR) rated pilots. That is, pilots who are not qualified to fly in instrument conditions, which require them to fly with sole reference to instruments such as when in cloud, instead of conducting the flight with reference to visual cues outside the aircraft. The focus of this research has typically centred on the aspects of decision making and pilot experience, with some studies finding an effect of low experience on accident risk (Goh & Wiegmann, 2002; Wiegmann et al, 2002).
General Aviation pilots The propensity for pilots of different experience levels to be involved in accidents has been studied with a number of different pilot cohorts. In general aviation, a review of 72 accidents which occurred in degraded visibility found no effect of total flight hours, nor years of experience, although they did find that pilots in the younger age group were involved in a smaller proportion of these kinds of accidents (Groff & Price, 2006). In a similar type of study, the effect of low experience on accident risk for New Zealand pilots in general aviation was reviewed with a particular focus on the concept that pilots with around 100-200 hours total time had a ‘special vulnerability’ compared to their colleagues with more than 200 hours total time (O’Hare & Chalmers, 1999). The same comparison was conducted for pilots with about 100-300 hours total time compared to the rest of the pilot population. Both studies found no evidence of increased accident involvement of low-hour pilots (O’Hare & Chalmers, 1999).
Another study of general aviation pilots examined the effect of age, experience and gender on accident causation and found that lower experience pilots were more likely to make errors that resulted in an accident than their more experienced peers (Bazargan & Guzhva, 2011). However, they found that while lower experience pilots were more likely to be in an accident, the more experienced pilots were more likely to be involved in a fatal accident. The sample used by the authors included pilots with less than 100 hours and less than 100-300 hours, meaning while it may cover some commercial pilots, the sample is not representative of air transport operations. The authors also defined air transport pilots with 300-2000 hours of total time as ‘...newly licensed airline transport pilots’; 2000-5000 hours of total time as ‘...moderately experienced airline transport pilots’; and 5000 hours or more total time as ‘the most experienced pilots’ (Bazargan & Guzhva, 2011).
Also in general aviation, a beneficial effect of experience on performance was found, particularly in the performance of older pilots (Causse et al, 2010). It was found that older, more experienced pilots outperformed older low-hour pilots who had around 90 hours total flight time. A similar study also found a ‘protective’ effect of experience against age related deteriorations in performance (Kennedy et al, 2001). However, contrary to their hypothesis, they did not find improved decision-making with increased expertise, although the results of their study may have been influenced by the expertise groups being very close (moderate versus high expertise, all with instrument ratings with VFR pilots excluded from the study entirely) (Kennedy et al, 2001).

› 4 ‹
ATSB – AR-2012-023
One study examining both retrospective and prospective indicators of accident risk also used flight hours as a metric, grouping them into hours flown in the last 6 months, 12 months and a pilot’s entire career. The author found that single-engine time in the last 12 months; piston-powered time for all three hours measures; and landings in the last 6-12 months were all significantly related to accident involvement (Hunter, 2001). However, an important caveat issued for this study was that the outcomes may well have been an effect of exposure and in particular ‘a pilot cannot gain the experience that is usually regarded as a protective factor’ without this exposure (Hunter, 2001).
A significant effect for expertise was found when differences in perception of weather images as a function of expertise was examined (Wiggins & O’Hare, 2002). To differentiate between experts and novices, they classified experts as pilots who had accumulated greater than 1,000 hours cross-country flying (mean cross country experience 5,520 hours, mean total experience 6,873 hours) and novices as pilots who had accumulated less than 1,000 hours (mean cross country experience 281 hours, mean total experience 801 hours).
In a later study examining heuristic-based approaches to in-flight decision making, it was noted that ‘greater levels of experience tend to be associated with the selection of more optimal alternatives, irrespective of the information acquisition strategy employed, but that this experience is defined by the hours accumulated as pilot in command rather than by the number of flight hours in total’ (Wiggins & Bollwerk, 2006). The authors also found a significant effect of the hours accumulated in the 90 days preceding the testing resulted in an increased likelihood the optimal alternative would be selected, thereby concluding that ‘...recent experience, rather than total experience, the license held, or performance during the familiarization scenarios, is most predictive of the selection of the optimal alternative’ (Wiggins & Bollwerk, 2006). This is an interesting finding in relation to the on-going perception within the aviation industry that total flight hours alone can accurately predict performance and mirrors an earlier study which also noted that task specific experience was more of a predictor of performance than total experience (Wiggins & O’Hare, 1995).
Airline pilots Interestingly, in a study of air transport pilot involvement in general aviation accidents, one study found that in general, air transport pilots (ATP) were safer than private pilots (Salvatore et al, 1986). The two groups had comparable exposure, that is, time in general aviation aircraft, but the ATP group were involved in fewer fatal accidents and fewer ‘pilot-induced’ accidents, indicating that the majority of ATP accidents were from factors not related to pilot skill (e.g. aircraft maintenance). One exception to this appears to be that ATP accidents more often involved aerobatic flight and for the ATP fatal accidents, nearly 50 per cent occurred during aerobatics. The authors note that ATPs tended to have less experience in the aircraft type for the fatal aerobatic accidents, pointing to a consistent finding in terms of experience (Salvatore et al, 1986). The authors also caution that with an increase in pilot experience ‘...comes the pilot’s willingness to encounter more challenging flight regimes and, perhaps consequently, to accept increased risk’ (Salvatore et al, 1986). This note is important to remember during any debate on flight experience and the performance of more experienced pilots. This concept is highlighted from a different perspective in another study examining the influence of flight experience on mid-air collision risk perception, which found that mid-air collisions typically involved highly experienced pilots and that high-hour pilots were less likely to scan properly for traffic and had become somewhat complacent given the low perception of risk their experience had provided, and the amount of successful flights they had completed (Shuch, 1992).
There have been studies in the air transport or airline sector of aviation that examine accident rates and experience, including one which examined professional pilots’ risk of an accident as a function of age and flight experience. This study found that pilots with less than 5,000 hours were almost twice as likely to be involved in an accident as their more experience colleagues (Li et al, 2003). The authors found a stabilising effect once a total flight time of 10,000 hours had been accumulated. However, it should be noted that these pilots were all operating in the commuter or
› 5 ‹
ATSB – AR-2012-023
air taxi sectors of aviation (that is, not a major airline), which the authors note carries a 10 – 45 times higher fatal crash rate per pilot flight hour than major airlines.
As part of a gender study examining accident risk for airline pilots, it was found that ‘airline pilots had less pilot-error accidents as experience (total flying hours) increases’. An effect of major airlines was also found, with pilots who flew for major airlines being less likely to have a pilot-error accident than those who flew for a non-major airline (McFadden, 1996). Of interest in relation to airline training, she also commented that ‘once pilots accumulate additional flying hours and training within the airline business, their pilot-error accident rates decrease markedly’ (McFadden, 1996). This statement appears to give some support to the idea that cadet training and development in a wholly airline environment will aid performance, with respect to a lower involvement in pilot-error accidents. This was also reflected in the findings of Salvatore et al (1986) above.
A study of pilot performance as a function of flight hours in normal line operations found no statistically significant differences between low- and high-hour first officers or captains against a series of technical measures, although there were minor differences in non-technical measures as a function of crew composition (Todd & Thomas, 2012). There was a difference in the use of automation by low-hour first officers, who kept the autopilot engaged until a significantly lower altitude. For this study, low-hour first officers were classified as those with less than 1,500 hours, and high-hour first officers as those with more than 1,500 hours. For captains, low-hour was classified as less than 5,000 hours, and high-hour above 5,000 hours (Todd & Thomas, 2012).
Despite the topic of pilot hours and performance attracting significant debate, there is little in the literature exploring this issue in relation to airline operations.

› 6 ‹
ATSB – AR-2012-023
Methodology Data sources Data were collected from three airlines, one of which (Airline A) supplied data for one aircraft type, and two of which (Airline B and Airline C) supplied data for two aircraft types. All aircraft types are classified as large passenger carrying jet aircraft capable of conducting high-capacity regular public transport (RPT) operations.
Performance measures were from simulator checks and line checks from each airline. De-identified demographic information, which included entry pathway and hours at entry, was also obtained.
For Airline A, the performance of second officers was measured. For Airlines B and C, the performance of first officers was measured. All pilots held at least a commercial pilot licence and none were trained under the multi-crew pilot licence system.
Design and procedure Data sources Airline A
Data were collected from proficiency check forms for all second officers who had entered the airline in the previous 13 years. The data were collected by the operator’s check and training captains during the pilot’s proficiency check in the simulator, which covered non-normal operations.
A total of 473 records considered complete and suitable for analysis were received from the airline, covering simulator sessions (cadets n=78, direct entry n=395; low-hour n=69, high-hour n=404) and line checks (cadet n=22, direct entry n=175; low-hour n=23, high-hour n=174) conducted by the airline’s check and training captains. The airline’s flight training department oversees the calibration of check and training captains to ensure a consistent application of their rating system in both the simulator and line check environment.
The check and training captains and pilots were blind to the specific hypothesis regarding entry pathway, flight hours and performance.
Airline B
Data were collected from proficiency check forms for a selection of first officers on two aircraft types operated by the airline. The data were collected by the operator’s check and training captains during the pilot’s proficiency check in the simulator, which covered non-normal operations, and during the pilot’s line check, which covers normal operations.
Inter-rater reliability and calibration was established by the airline and on-going calibration of the check and training captains by the flight training department occurs yearly. In addition, the check and training captains are provided with word pictures of performance at each of the five levels of rating (1=unsatisfactory, 5=excellent) for each measure being tested.
When the data were grouped into entry pathway to test the effect of pathway on performance, a total of 116 records (cadet n=35, direct entry n=81) were completed and considered suitable for analysis for the simulator sessions (non-normal events) and 151 records (cadet n=45, direct entry n=106) were considered suitable for the line check data.
When the data were grouped into hours below and above our thresholds to test the effect of hours on performance, a total of 169 records (low-hour n=19, high-hour n= 150) were complete and considered suitable for analysis for the simulator sessions (non-normal events). For the line check data, 168 records (low-hour n=10, high-hour n=158) were complete and suitable for analysis.

› 7 ‹
ATSB – AR-2012-023
The check and training captains and pilots were blind to the specific hypothesis regarding flight hours and performance.
Airline C
Data were collected from proficiency check forms for a selection of first officers on one aircraft type operated by the airline. The data were collected by the operator’s check and training captains during the pilot’s proficiency check in the simulator, which covered non-normal operations, and during the pilot’s line check, which covers normal operations.
Inter-rater reliability and calibration was established by the airline and on-going calibration of the check and training captains by the flight training department occurs yearly. In addition, the check and training captains are provided with word pictures of performance at each of the five levels of rating (1=unsatisfactory, 5=excellent) for each measure being tested.
When the data were grouped into entry pathway to test the effect of pathway on performance, a total of 167 records (cadet n=33, direct entry =134) were completed and considered suitable for analysis for the simulator sessions (non-normal events) and 251 records (cadet n=56, direct entry n=195) were considered suitable for the line check data.
When the data were grouped into hours below and above our thresholds to test the effect of hours on performance, a total of 167 records (low-hour n=26, high-hour n=141) were complete and considered suitable for analysis for the simulator sessions (non-normal events). For the line check data, 251 records (low-hour n=51; high-hour n=200) were complete and suitable for analysis.
The check and training captains and pilots were blind to the specific hypothesis regarding flight hours and performance.
Independent variables Airline entry pathway
For each airline, to test the effect of training pathway on performance, two groups were created, one for cadet pilots and one for direct entry.
For Airline A, the measure used to test the effect of pathway on performance was a proficiency simulator session, which contained a number of metrics listed below under dependent variables, conducted at the time the pilot entered the airline, and the check to line flight test. Cadet second officers entered the airline with an average of 246 hours (S.D. 94 h), which they built up during training, while direct entry second officers had, on average, 3,826 hours (S.D. 1,344 h). Data about the type of previous flying experience for direct entry pilots into Airline A (airline, general aviation, military) was not provided, however, the airline reported that the majority of the direct entry second officers were from a general aviation (or similar) environment. At testing, direct entry SOs had, on average, 4,729 hours (S.D. 1,427 h) and cadets had, on average, 1,042 hours, (S.D. 431 h).
For Airline B, the measure used to test the effect of pathway was a proficiency simulator session conducted 5 years after the first officers had joined the airline, and the most recent line check for these pilots. This time period was chosen to overcome any learning effect as a possible confound. Cadet first officers entered the airline with, on average 278 hours (S.D. 42 h) predominately built up during training, while direct entry first officers had, on average, 6734 hours (S.D. 2,853 h). Of the 81 direct entry first officers, 76 had previous airline experience, 3 were from general aviation and 2 were from the military. At testing, cadet first officers had, on average, 3,984 hours (S.D. 836 h), and direct entry first officers had, on average, 11,158 hours (S.D. 3,172 h).
For Airline C, the measure used to test the effect of pathway on performance was a proficiency simulator session, which contained a number of metrics listed below under dependent variables, conducted during the first five years after entering the airline, and the check to line flight test. Cadet pilots typically entered the airline with, on average 561 hours (S.D. 457 h) predominately acquired during training, while direct entry pilots entered with, on average, 5,291 hours (S.D.
› 8 ‹
ATSB – AR-2012-023
3,110 h). Of the 134 direct entry pilots, 32 had previous airline experience, 99 were from general aviation and 3 were from the military. At testing, cadet pilots had, on average, 1,185 hours (S.D. 511 h) and direct entry pilots had, on average, 6,923 hours (S.D. 3,471 h).
Total flight hours
The effect of flight hours on performance were examined against the same metrics used in the previous study (Todd & Thomas, 2012). Second officers from Airline A were grouped into those with below 1,500 hours and those above; and first officers from Airlines B and C into below 1,500 hours and those above. The divide of 1,500 hours was chosen based upon the current legislative changes in the United States, and the fact that 1,500 hours total time is necessary for pilots to hold an Air Transport Pilot Licence (ATPL).
Due to the grouping, some high-hour pilots at the time of testing had entered the airline as cadets. For Airline A, 93 per cent of low-hour second officers had entered the airline as cadets and 3 per cent of high-hour second officers had entered as cadets. For Airline B, 100 per cent of low-hour first officers entered as cadets, and 29 per cent of high-hour first officers entered as cadets. For Airline C proficiency simulator check, 79 per cent low-hour first officers entered as cadets and 5 per cent of high-hour first officers entered as cadets. For the line check data, 91 per cent of low-hour first officers entered as cadets and 2 per cent of high-hour first officers entered as cadets.
Dependent variables Technical Performance
For each airline, pilots were rated against technical measures during the simulator proficiency check designed to test technical knowledge and handling, with various normal and non-normal technical scenarios (Tables 1 to 3). They were assessed using a score range of 1 (unsatisfactory) to 5 (excellent). In addition, they were also required to demonstrate proficiency in various regulatory required manoeuvres.
In addition to be above, for Airline B, proficiency was measured by a rating of pass (P), pass with repeat (1P) or fail (F) for each manoeuvre.
Non-Technical Performance
For each airline, pilots were rated against various non-technical markers and again, pilots were rated on the 5 point ordinal scale (Tables 1 to 3).
Checks included both normal events, which are routine, expected events that do not require additional training or specific targeted intervention by a pilot; and non-normal events, which involve a non-routine event or problem with the aircraft, its systems, other crew, or the environment, which is not routine and is outside of what is expected in a ‘normal’ flight (such as an engine failure).

› 9 ‹
ATSB – AR-2012-023
Table 1: Airline A - Technical (T), Non-technical (N) and required regulatory manoeuvres (M)
Simulator proficiency check metrics Line check metrics
Approach and Landing (T) Checklist usage (T)
Pilot Flying duties (T) Automation use (T)
Pilot Monitoring duties (T) Operational knowledge (T)
Technical knowledge (T) Technical knowledge (T)
Adherence to standard operating procedures (T) Adherence to standard operating procedures (T)
Situation awareness (N) Error recovery (T)
Communication (N) Communication (N)
Assertion (N) Conflict resolution (N)
Missed Approach (M) Environmental awareness (N)
ILS approach (M) Weather assessment (N)
Holding (M) Leadership (N)
Departure (M) Handover (N)
Normal Landing (M) Traffic awareness (N)
Emergency descent (M) Teamwork (N)
Stall (M)
Engine failure during cruise (M)
Normal takeoff (M)
Table 2: Airline B - Technical (T), Non-technical (N) and required regulatory manoeuvres (M)
Simulator proficiency check metrics Line check metrics
Non precision approach (M) Approach (M)
ILS approach and missed approach (MAP) (M) Landing (M)
Holding (M) Technical (T)
En route NDB_VOR (M) Teamwork (N)
Engine inoperative landing (M) Descent (T)
Engine inoperative ILS and MAP (M) Configuration (T)
V1 cut (engine failure during takeoff) (M) Takeoff (M)
Preparation (T) Flight management (T)
Automation (T) Automation (T)
Handling (T) Handling (T)
Procedure (T) Adherence to SOPs (T)
Systems knowledge (T) Operational (T)
Situation awareness (N) Conflict resolution (N)
Crew Resource Management (CRM) (N) Communication (N)
Command (N) Airmanship (N)
Briefings (N)
Aircraft (T)
Traffic awareness (T)
Weather assessment (T)
Terrain awareness (T)
Threat awareness (T)
› 10 ‹
ATSB – AR-2012-023
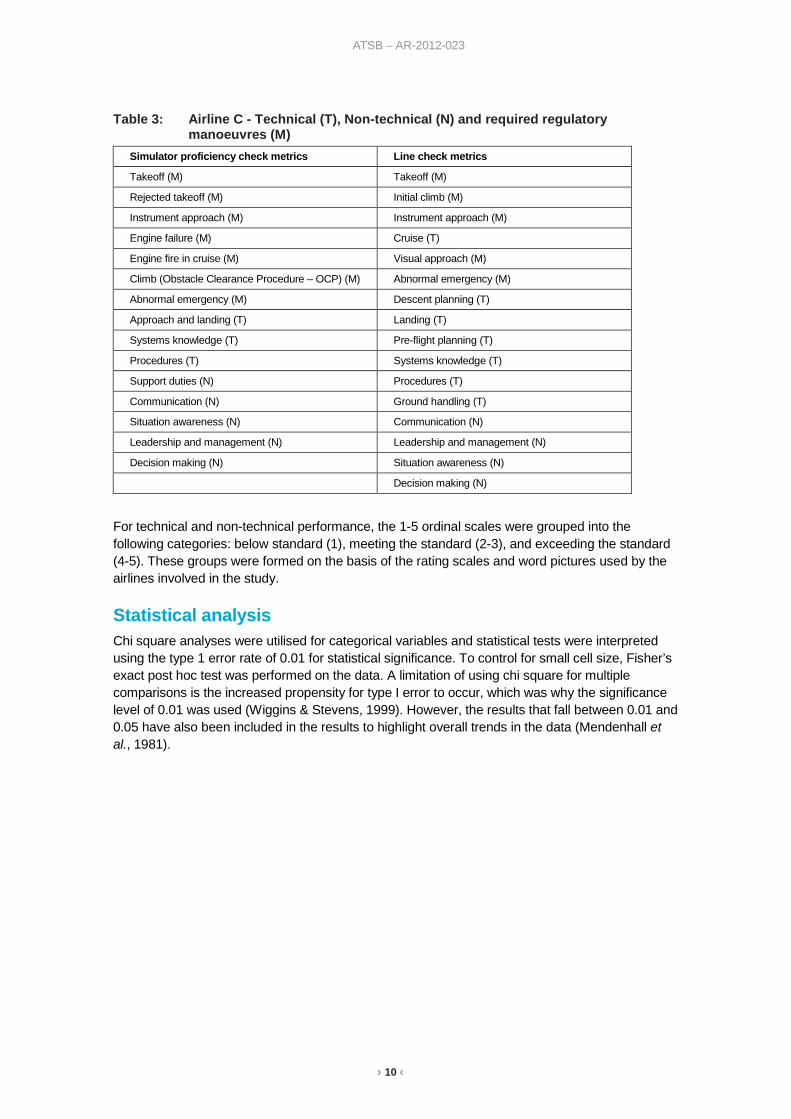
Table 3: Airline C - Technical (T), Non-technical (N) and required regulatory manoeuvres (M)
Simulator proficiency check metrics Line check metrics
Takeoff (M) Takeoff (M)
Rejected takeoff (M) Initial climb (M)
Instrument approach (M) Instrument approach (M)
Engine failure (M) Cruise (T)
Engine fire in cruise (M) Visual approach (M)
Climb (Obstacle Clearance Procedure – OCP) (M) Abnormal emergency (M)
Abnormal emergency (M) Descent planning (T)
Approach and landing (T) Landing (T)
Systems knowledge (T) Pre-flight planning (T)
Procedures (T) Systems knowledge (T)
Support duties (N) Procedures (T)
Communication (N) Ground handling (T)
Situation awareness (N) Communication (N)
Leadership and management (N) Leadership and management (N)
Decision making (N) Situation awareness (N)
Decision making (N)
For technical and non-technical performance, the 1-5 ordinal scales were grouped into the following categories: below standard (1), meeting the standard (2-3), and exceeding the standard (4-5). These groups were formed on the basis of the rating scales and word pictures used by the airlines involved in the study.
Statistical analysis Chi square analyses were utilised for categorical variables and statistical tests were interpreted using the type 1 error rate of 0.01 for statistical significance. To control for small cell size, Fisher’s exact post hoc test was performed on the data. A limitation of using chi square for multiple comparisons is the increased propensity for type I error to occur, which was why the significance level of 0.01 was used (Wiggins & Stevens, 1999). However, the results that fall between 0.01 and 0.05 have also been included in the results to highlight overall trends in the data (Mendenhall et al., 1981).

› 11 ‹
ATSB – AR-2012-023
Results Overall there were no significant differences between the groups for any dependent variable in relation to meeting the standard required in any of the three airlines. The results below show the differences in each group exceeding the standard. That is, they all passed, however, performance varied between the groups within the ‘pass’ standard. While the line check data from Airline C did contain some fail items for some pilots, these pilots successfully completed the subsequent check flight. Significant results are labelled with an asterisk (*) in the figures.
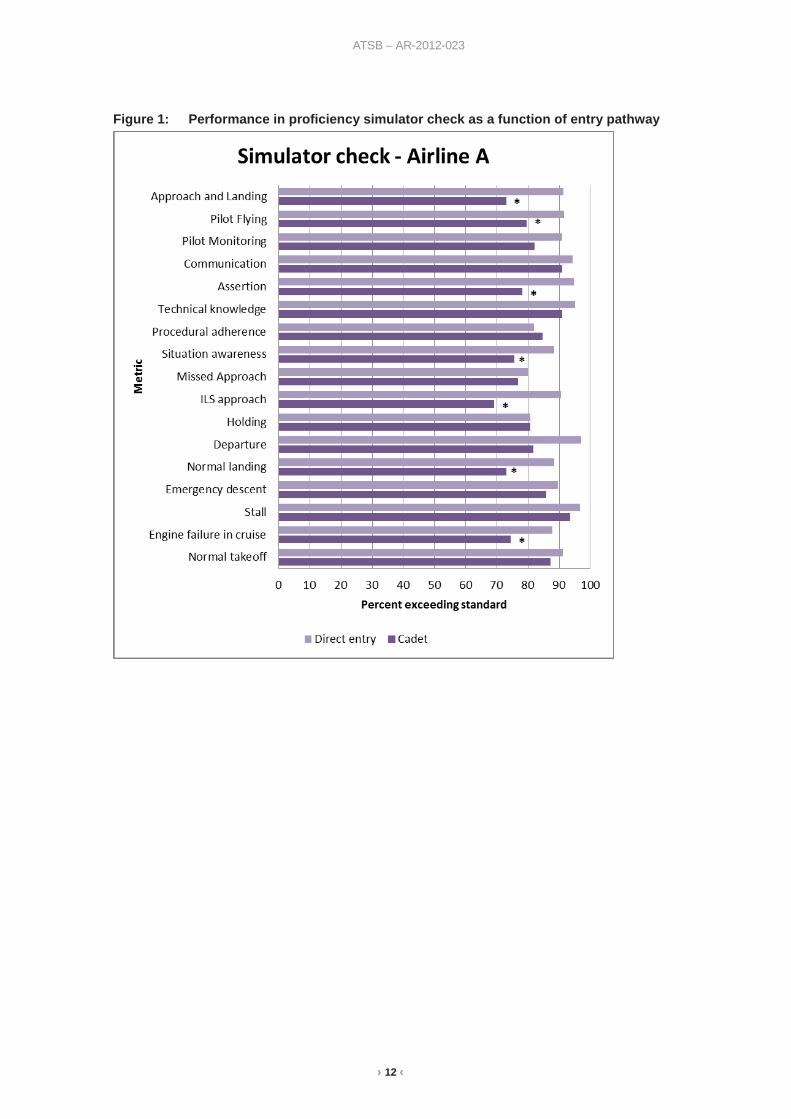
Airline A Simulator proficiency check Entry pathway study
Of the seventeen metrics, the performance of cadets differed to the direct entry second officers with respect to seven of the 17 metrics. The difference was measured as a percentage of pilots exceeding the standard, with a higher number of direct entry second officers exceeding the standard compared to cadets (Figure 1). The metrics the groups differed on were engine failure in the cruise, normal landing, ILS approach, situation awareness, assertion, pilot flying and approach and landing (Table 4).
Table 4: Differences in performance between cadets and direct entry second officers Metric Cadet (%) Direct entry (%) χ2 (1, n=473) p (2-tailed)
Engine failure in the cruise 74.4 87.8 9.63 0.004
Normal landing 73.1 88.4 12.50 0.001
ILS approach 69.2 90.6 26.56 <0.001
Situation awareness 75.6 88.4 8.88 0.006
Assertion 78.2 94.7 23.94 <0.001
Pilot flying 79.5 91.6 10.37 0.003
Approach and landing 73.1 91.4 21.26 <0.001
For the metric pilot monitoring, the difference was not significant at 0.01, but was within the range of 0.01-0.05 (cadets = 82.1%, direct entry = 90.9%, χ2
(1, n = 473) = 5.38 p=0.027, 2-tailed).
› 12 ‹
ATSB – AR-2012-023
Figure 1: Performance in proficiency simulator check as a function of entry pathway

› 13 ‹
ATSB – AR-2012-023
Flight hour study
The results for the comparison of hours versus performance mirror those for entry pathway for this cohort of pilots. Of the seventeen metrics, the performance of the low-hour pilots differed to the high-hour group with respect to seven metrics. The difference was measured as a percentage of pilots exceeding the standard, with a higher number of high-hour second officers exceeding the standard compared to low-hour second officers (Figure 2). The metrics the groups differed on were engine failure in the cruise, normal landing ILS approach, situation awareness, assertion, pilot monitoring, pilot flying and approach and landing (Table 5).
Table 5: Differences in performance between low- and high-hour second officers Metric Low-hour (%) High-hour (%) χ2 (1, n=473) p (2-tailed)
Engine failure in the cruise 73.9 87.6 9.00 0.005
Normal landing 71 88.4 14.59 0.001
ILS approach 68.1 90.3 25.93 <0.001
Situation awareness 73.9 88.4 10.39 0.004
Assertion 78.3 94.3 20.54 <0.001
Pilot flying 78.3 91.6 11.27 0.002
Approach and landing 73.9 90.8 16.44 <0.001
As above, the metric Pilot monitoring was significant when tested at 0.05 significance (low-hour = 81.2%, high-hour = 90.8%, χ2
(1, n = 473) = 5.84 p=0.031, 2-tailed).

› 14 ‹
ATSB – AR-2012-023
Figure 2: Performance in simulator proficiency check as a function of flight hours
Line check Entry pathway study
For the line check data, the only significant difference between cadets and direct entry second officers was with respect to the one non-technical metric of leadership (cadets = 72.7%, direct entry = 95.4% , χ2
(1, n = 197) = 15.26 p=0.002, 2-tailed). The other thirteen metrics showed no significant difference (Figure 3).

› 15 ‹
ATSB – AR-2012-023
Figure 3: Performance in line check as a function of entry pathway
Flight hour study
For the line check data, the only significant difference between low- and high-hour second officers, were with respect to the non-technical measure of leadership (low-hour = 78.3%, high-hour = 94.8%, χ2
(1, n = 197) = 8.45 p=0.014, 2-tailed) (Figure 4).
Figure 4: Performance in line check as a function of flight hours
› 16 ‹
ATSB – AR-2012-023
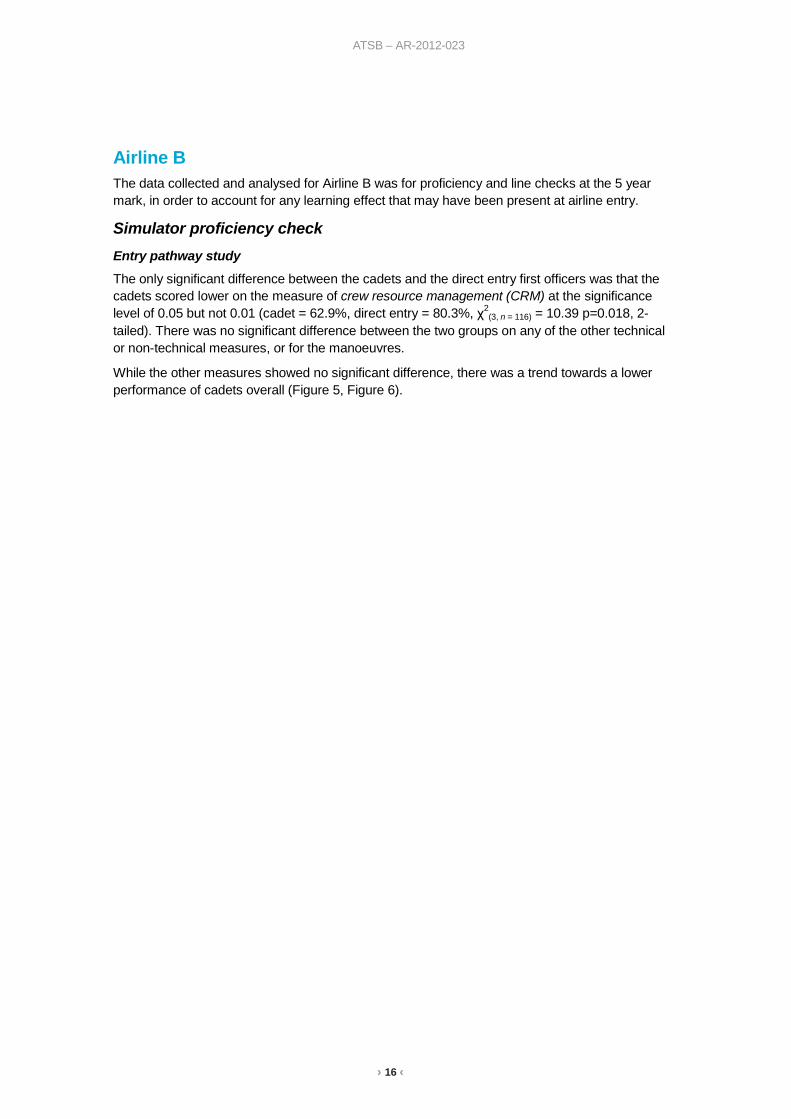
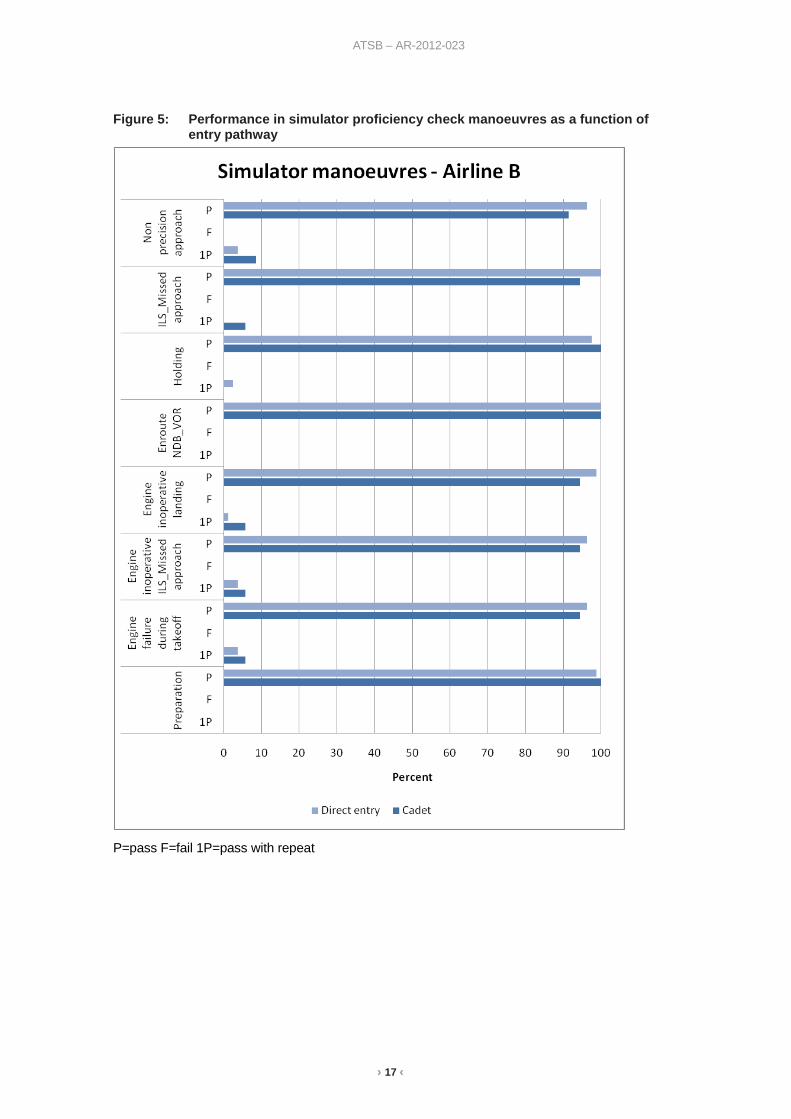
Airline B The data collected and analysed for Airline B was for proficiency and line checks at the 5 year mark, in order to account for any learning effect that may have been present at airline entry.
Simulator proficiency check Entry pathway study
The only significant difference between the cadets and the direct entry first officers was that the cadets scored lower on the measure of crew resource management (CRM) at the significance level of 0.05 but not 0.01 (cadet = 62.9%, direct entry = 80.3%, χ2
(3, n = 116) = 10.39 p=0.018, 2-tailed). There was no significant difference between the two groups on any of the other technical or non-technical measures, or for the manoeuvres.
While the other measures showed no significant difference, there was a trend towards a lower performance of cadets overall (Figure 5, Figure 6).
› 17 ‹
ATSB – AR-2012-023
Figure 5: Performance in simulator proficiency check manoeuvres as a function of entry pathway
P=pass F=fail 1P=pass with repeat

› 18 ‹
ATSB – AR-2012-023
Figure 6: Performance in simulator proficiency check as a function of entry pathway
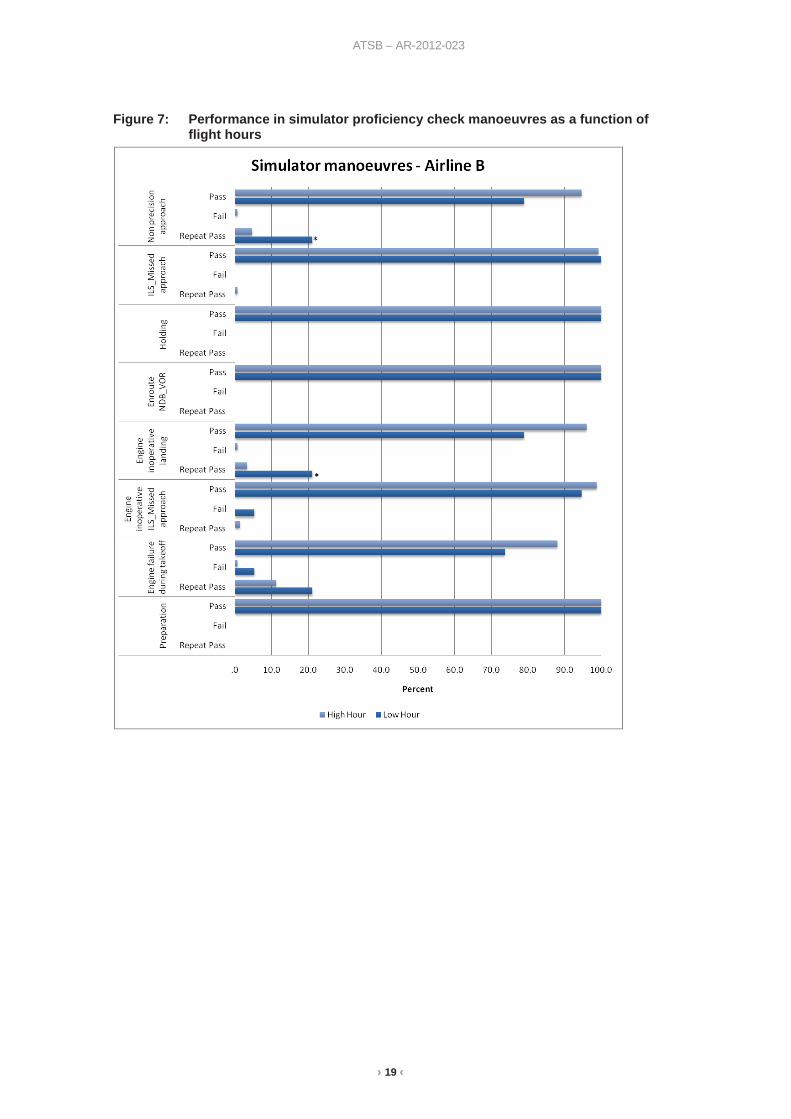
Flight hour study
For the four technical and three non-technical metrics, the pilots in the low-hour group had a significant difference with respect to all metrics (Figure 7, Figure 8 and Table 6). High-hour pilots scored significantly higher in these areas against their low-hour colleagues, with a greater number of these pilots exceeding the standard. The low-hour pilots, on the other hand, had a higher repeat rate for the required regulatory manoeuvres: engine inoperative landing (low-hour = 21.1%, high-hour = 3.3%, χ2
(2, n = 169) = 10.59 p=0.016, 2-tailed) and non-precision approach (low-hour = 21.1%, high-hour = 4.7%, χ2
(2, n = 169) = 7.53 p=0.032, 2-tailed).
Table 6: Differences in performance between low- and high-hour first officers Metric Low-hour (%) High-hour (%) χ2 df (n=169) p (2-tailed)
Command 10.5 66 27.15 3 <0.001
CRM 36.8 73.4 12.28 3 0.003
Situation awareness 26.3 68 22.63 3 <0.001
System knowledge 63.2 85.3 6.98 2 0.042
Procedure 10.5 54.6 28.55 4 <0.001
Handling 15.8 69.3 28.64 3 <0.001
Automation 63.2 81.3 6.77 2 0.021
› 19 ‹
ATSB – AR-2012-023
Figure 7: Performance in simulator proficiency check manoeuvres as a function of flight hours

› 20 ‹
ATSB – AR-2012-023
Figure 8: Performance in simulator proficiency check as a function of flight hours
Line check Entry pathway study The only significant difference was with respect to the metric of communication, measured by a higher percentage of cadets exceeding the standard at the 0.05 level (cadets = 95.5%, direct entry = 84.9%, χ2
(1, n = 151) = 7.48 p=0.036, 2-tailed) (Figure 9).

› 21 ‹
ATSB – AR-2012-023
Figure 9: Line check at 5 year mark as a function of entry pathway
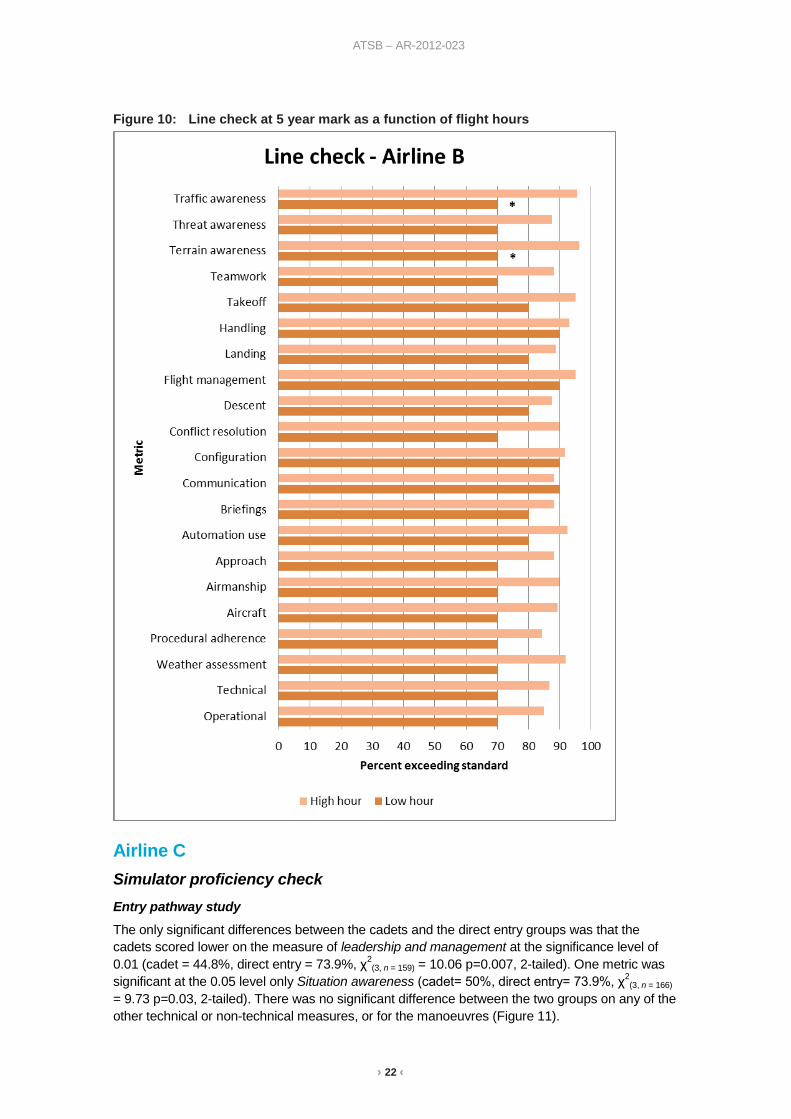
Flight hour study
For the line check data, the only significant differences between low- and high-hour first officers, were with respect to four technical metrics, measured by a higher percentage of high-hour pilots exceeding the standard (terrain awareness, low-hour = 70% high-hour = 96.2%, χ2
(2, n = 168) = 13.45 p=0.010, 2-tailed; and traffic awareness, low-hour = 70% high-hour = 95.6%, χ2
(3, n = 168) = 23.16 p=0.002, 2-tailed). It should be noted that for terrain awareness, neither group scored lower than a 3 (Figure 10). Two metrics were significant at 0.05 level - SOP adherence, low-hour = 70%, high-hour = 84.2, χ2
(3, n = 168) = 14.43 p=0.037, 2-tailed and approach, (low-hour = 70%, high-hour = 88%, χ2
(3, n = 168) = 17.15 p=0.044, 2-tailed).
› 22 ‹
ATSB – AR-2012-023
Figure 10: Line check at 5 year mark as a function of flight hours
Airline C Simulator proficiency check Entry pathway study
The only significant differences between the cadets and the direct entry groups was that the cadets scored lower on the measure of leadership and management at the significance level of 0.01 (cadet = 44.8%, direct entry = 73.9%, χ2
(3, n = 159) = 10.06 p=0.007, 2-tailed). One metric was significant at the 0.05 level only Situation awareness (cadet= 50%, direct entry= 73.9%, χ2
(3, n = 166) = 9.73 p=0.03, 2-tailed). There was no significant difference between the two groups on any of the other technical or non-technical measures, or for the manoeuvres (Figure 11).

› 23 ‹
ATSB – AR-2012-023
Figure 11: Performance in simulator proficiency check as a function of entry pathway
Flight hour study
The only significant differences between the low- and high-hour groups was that the low-hour pilots scored lower on the measures of leadership and management at the significance level of 0.01 (low-hour= 39.1%, high-hour= 75.2%, χ2
(3, n = 159) = 11.50 p=0.004, 2-tailed) and situation awareness at the significance level of 0.01 (low-hour= 36%, high-hour= 75.2%, χ2
(3, n = 166) = 18.07 p=0.001, 2-tailed). One metric was significant at the 0.05 level only – Abnormal emergency (low-hour= 64%, high-hour= 84.6%, χ2
(2, n = 155) = 6.60 p=0.03, 2-tailed). There was no significant difference between the two groups on any of the other technical or non-technical measures, or for the manoeuvres (Figure 12).

› 24 ‹
ATSB – AR-2012-023
Figure 12: Performance in simulator proficiency check as a function of flight hours
Line check Entry pathway study
The only significant differences between the cadets and the direct entry first officers was that the cadets scored lower on the measures of landing (cadet=33.9%, direct entry = 58%, χ2
(4, n = 251) = 10.74 p=0.01, 2-tailed) and leadership and management at the significance level of 0.01 (cadet = 26.4%, direct entry = 52.6%, χ2
(3, n = 169) = 11.17 p=0.003, 2-tailed). There was no significant difference between the two groups on any of the other technical or non-technical measures, or for the manoeuvres (Figure 13).
› 25 ‹
ATSB – AR-2012-023
Figure 13: Line check as a function of entry pathway
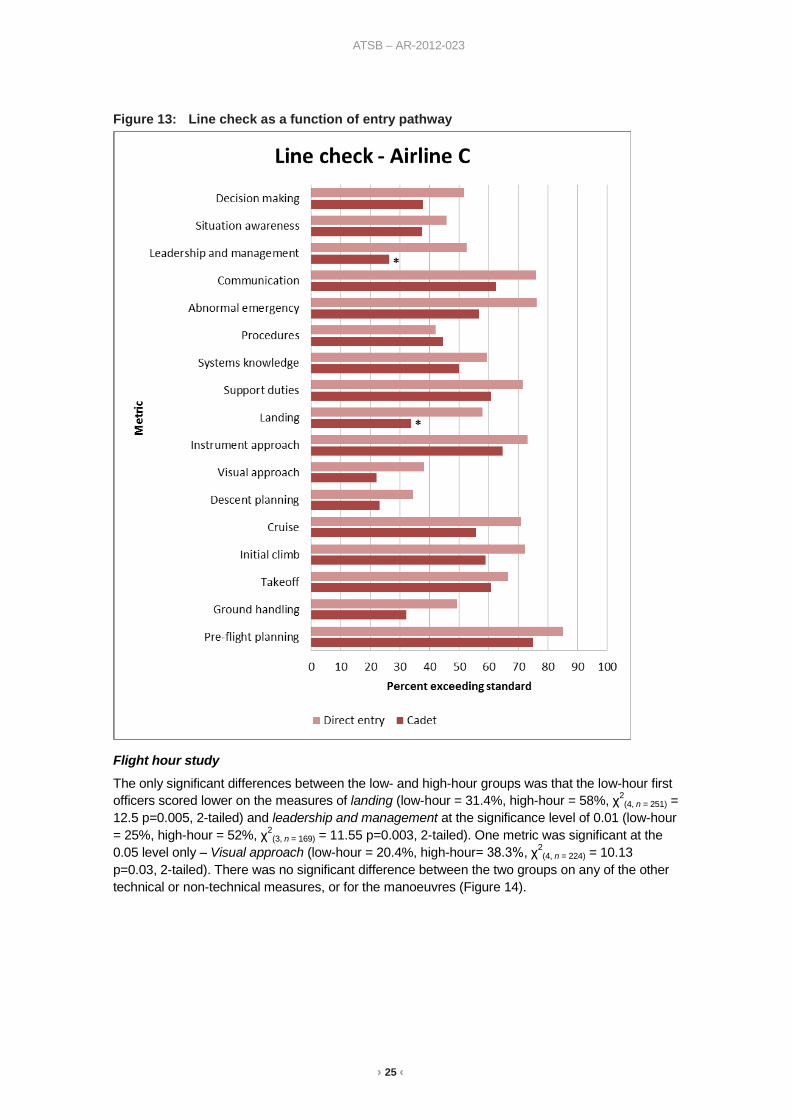
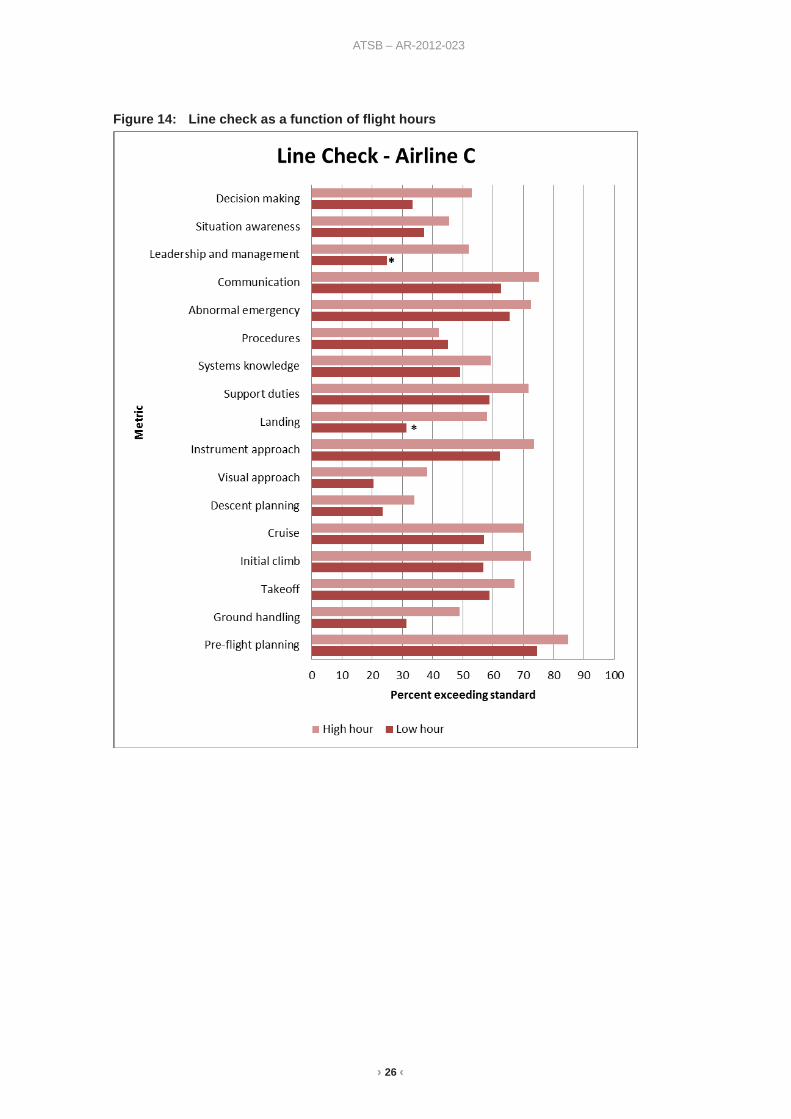
Flight hour study
The only significant differences between the low- and high-hour groups was that the low-hour first officers scored lower on the measures of landing (low-hour = 31.4%, high-hour = 58%, χ2
(4, n = 251) = 12.5 p=0.005, 2-tailed) and leadership and management at the significance level of 0.01 (low-hour = 25%, high-hour = 52%, χ2
(3, n = 169) = 11.55 p=0.003, 2-tailed). One metric was significant at the 0.05 level only – Visual approach (low-hour = 20.4%, high-hour= 38.3%, χ2
(4, n = 224) = 10.13 p=0.03, 2-tailed). There was no significant difference between the two groups on any of the other technical or non-technical measures, or for the manoeuvres (Figure 14).
› 26 ‹
ATSB – AR-2012-023
Figure 14: Line check as a function of flight hours
› 27 ‹
ATSB – AR-2012-023
Discussion The subject of pilot performance is one that often draws heated debate and entrenched positions amongst the aviation industry. Often these positions have been formed and debates have occurred without scientific data to support or oppose the various stances. Despite this, the concept that the performance of low-hour and cadets pilots would be fundamentally different to their high-hour direct entry colleagues has not previously been explored to any great extent.
While the results of this study indicated some significant differences between the pilot groups for each airline, it is worth noting that there are a significant number of similarities in their performance (Table 7 and Table 8). In the line check environment, all three airlines showed very few differences between the performance of cadets and direct entry pilots, and between low- and high-hour pilots. This finding is largely consistent with the authors’ previous study examining the effect of flight hours on performance in the line operational environment (Todd & Thomas, 2012).
Table 7: Overview of significant differences in performance across all three airlines for simulator (S) and line (L) checks as a function of entry pathway (- indicates not tested)
Metric Airline A Airline B Airline C
Engine failure in the cruise (M) S -
Normal landing (M) S L
ILS approach (M) S
Pilot flying (T) S -
Approach and landing (T) S
Leadership/ command (N) L S L
Situation awareness (N) S
Assertion (N) S - -
Table 8: Overview of significant differences in performance across all three airlines for simulator (S) and line (L) checks as a function of flight hours (- indicates not tested)
Metric Airline A Airline B Airline C
Engine failure in the cruise (M) S -
Normal landing (M) S L
ILS approach (M) S
Non precision approach (M) - S
Engine inoperative landing (M) - S -
Pilot flying (T) S -
Approach and landing (T) S
System knowledge (T) S
Procedure (T) S
Handling (T) - S -
Automation (T) S -
Terrain awareness (T) L -
Traffic awareness (T) L -
Leadership/ command (N) L S S L
CRM/ Communication (N) S
Situation awareness (N) S S S
Assertion (N) S - -

› 28 ‹
ATSB – AR-2012-023
Simulator proficiency check results In the simulator proficiency checks, there was a difference between the cadet and direct entry second officers and low- and high-hour second officers for Airline A. The differences in performance were fairly consistent between the entry pathway and flight hour groups. Since this data was collected at airline entry, data from Airline B was examined at the 5 year mark to account for any learning effect that may have been present at airline entry. Very few significant differences between the cadets and direct entry first officers in this simulator proficiency check were found. However when the data were analysed for flight hour experience, there were a few more differences between the low- and high-hour first officers. For Airline C, whose simulator proficiency checks were conducted within the first 5 years of joining the airline, a consistent difference on one metric only was found, between cadets and direct entry pilots and low- and high-hour first officers, with one other significant difference in the flight hour data.
For Airline A, the differences in performance against the six technical and two non-technical metrics are worthy of further exploration. The technical metrics include the regulatory required manoeuvres, such as an ILS approach, and the main difference between the groups appears to occur during the approach and landing phase of flight. Given the role of the second officer is to act as a relief pilot in cruise flight it is not particularly surprising to see a difference in performance between cadet and direct entry second officers against this metric. While both groups are now limited to a non-control seat outside of the cruise phase of flight, it is conceivable that prior to their direct entry as a second officer, these pilots had flown either as first officers in other airlines, in the military, or in general aviation. They are therefore more likely to have had a higher exposure to the approach and landing phase of flight, and experience in a control seat during this phase.
For the non-normal metric of engine failure, it is also possible that previous exposure to an airline environment, and therefore simulator sessions, has aided these second officers in their understanding of what the simulator session will involve, and the necessary actions on their part. However, irrespective of this, it is important for second officers, who will occupy a control seat during cruise, to be proficient at handling an engine failure in this phase of flight. While each pilot met the standard for this metric, the number of cadets and low-hour pilots were over-represented in this marking group, pointing to a potential need for future training to target this difference. The other technical metrics relate to flying role, which again, is something that a direct entry second officer with previous airline experience will have some familiarity with, compared to a cadet.
The non-technical metrics covered areas such as situation awareness and assertion. It is possible that the prior exposure to, and familiarity with, airline operations has aided direct entry second officers in performance against this metric. It is also possible that the direct entry pilots have developed greater familiarity with the need for, and technique of, good situation awareness through the flying they conducted prior to entry into the airline. The metric of assertion may also be explained in the same way, especially if these pilots had operated in a team environment previously.
The potential confounds of exposure and familiarity are also likely of pilots with more than 1,500 hours, which may well explain the similarity in the results between the entry pathway and flight hour groups for Airline A and Airline C.
For the results from the simulator proficiency check for Airline B, the differences in performance against the metrics are quite interesting even in the bigger picture of the trend towards lower performance against all metrics for cadets. The significant difference against the CRM metric at the 0.05 level is not too surprising given it typically covers communication and workload management. Direct entry first officers are more likely to have had higher exposure to, and familiarity with, these concepts prior to entry to this airline and it is not surprising that their communication would be stronger, given the necessity of operating in a team environment for longer than the 5 years in this airline alone. This also applies to the results from Airline C, which showed that direct entry pilots were scoring higher in both situation awareness and leadership and management.
› 29 ‹
ATSB – AR-2012-023
The overall trend in performance of low-hour first officers may well be due to a similar effect. As many of the direct entry first officers had previous experience flying in an airline, it is likely they have had to fly the required manoeuvres a number of times before entry to this airline, as well as having to demonstrate technical and non-technical proficiency in the simulated environment. It is worth noting that the low-hour pilots were all cadets (n=19), and 96 of the high-hour pilots (n=150) had previous airline experience, although the high-hour group also included 43 cadets. It is therefore possible that the previous airline experience of the high-hour first officers has allowed these pilots to develop a more in-depth understanding of airline operations and the requirements of proficiency checks in an airline environment, the inexperience of which may be influencing the performance of the low-hour pilots.
The difference in performance between the low- and high-hour pilots against all technical and non-technical metrics is surprising, given there was a lack of significant variation when the effect of entry pathway was considered on the same dataset. It seems from these results that the effect of low hours on performance is stronger than any effect of entry pathway, despite all of the low-hour pilots being cadets.
The difference in performance against the two manoeuvres is quite interesting, given that the performance of the low-hour pilots was not significantly different against the non-normal manoeuvres that are generally perceived as being more challenging – such as the V1 cut (engine failure during takeoff) and the one engine inoperative Instrument Landing System Missed Approach (ILS MAP). This result is also not consistent with the results from the airline entry pathway study, despite all low-hour pilots being cadets.
For Airline C the only differences in the simulator proficiency checks for technical metrics was at the 0.05 level of significance and were on the metrics of cruise engine fire (for entry pathway only) and abnormal emergency (for both groups). Given the number of comparisons and that this result was at the 0.05 level, it is possible the difference was due to chance only. However, it is also worth exploring these differences with a view to appropriate training intervention.
Line check results An interesting outcome from the line check data for entry pathway for Airline B was that the only metric showing a difference was communication at the 0.05 level. For our purposes, it is worth considering that there is a difference in communication in the line environment as a function of entry pathway and to treat the result as valid. That is, if a pilot entered the airline as a cadet, they appear not to communicate as effectively in the line check environment as their direct entry peers. As mentioned above, this may be a function of the previous exposure to an airline environment providing the direct entry pilots with a greater knowledge of what communication strategies are required in the line environment, and the skills to implement these effectively.
The significant differences in the line check data for Airline B as a function of flight hours was also interesting. Given these metrics - SOP adherence and approach at 0.05; and terrain awareness and traffic awareness at 0.01 are high-level categories it is possible that the performance of the pilots differed on a subset of these metrics and not the overarching metric itself, per se. It may be that a low-hour pilot can fly an approach adequately, however, they may be receiving a lower rating because they did not fly a certain segment to a high standard, or did not follow a procedure exactly and as such this difference is being captured under the heading of ‘approach’.
However for metrics such as terrain and traffic awareness, the finding is not exactly surprising. It is reasonable that a pilot will develop a greater ability to plan and operate adequately within their environment once they build up exposure to, and experience in, that environment. Issues such as terrain awareness in particular will require strong local knowledge and this may take time to adequately acquire. It should be noted that neither group scored lower than a 3 for terrain awareness, indicating they were both sitting at the high end of ‘meeting the standard’. The issue of exposure aiding performance may also be true of SOP adherence, which is another area where it is reasonable to anticipate that performance will improve with both exposure and practice. Low-
› 30 ‹
ATSB – AR-2012-023
hour pilots will be limited in the exposure they have to operating with, and following, SOPs in the line environment.
For the line check data from Airline A, the difference in performance between the cadets and direct entry second officers for the metric of leadership could be a function of the role of a second officer not requiring leadership on the line. Therefore, cadets who have only ever flown as second officers will not be as familiar with the principles underpinning this metric as pilots who have had previous exposure to the concept and who have implemented it in previous roles, and/or airline operations prior to entry into this airline.
That the same difference exists for low-hour pilots from Airline A, with the inclusion of communication, is not a particularly surprising finding. It is reasonable that low-hour pilots will not have had great exposure to the line operating environment, unlike many of their high-hour colleagues and it is probable that this lack of previous exposure is impacting their ability to communicate effectively. As is the case with leadership, it is possible the influence of role is a factor here also, specifically that second officers are typically not required to communicate to the same extent as first officers and captains.
The line check data for Airline C was very similar, with cadets and low-hour pilots scoring lower on leadership and management and landing metrics. Once again, the prior exposure of direct entry pilots to the landing phase of flight and to the concept of leadership may be influencing the results. The only difference in technical metric for line check data was at the 0.05 significance level and indicated low-hour pilots were scored lower on the visual approach metric. However, given both groups had a low percentage exceeding the standard (20% low-hour v 38% high-hour), it is possible there is a difficulty within this metric that is influencing the performance of both groups. These results are close to those of Airlines A and B, indicating a consistent effect of prior experience being beneficial.
Overall however, the results from Airline C showed very little difference in performance in both simulator proficiency checks and line checks for each of the entryway and flight hour groups, indicating that cadets and low-hour pilots were performing to an acceptable level.
Limitations It is important that the various figures throughout the results section are interpreted correctly. They show the percentage of each pilot group for each airline that exceeded the standard. As outlined previously, the ratings were divided into: below standard (unsatisfactory), meeting the standard and exceeding the standard. As such, the figures show the percentage of pilots who exceeded the standard, however, it should be noted that all pilots passed the simulator proficiency or line check (and therefore at least met the standard) and were suitable to continue flying. It should also be noted that the idea of a simulator proficiency check is to ensure that a pilot is proficient in a number of manoeuvres, as well as technical and non-technical skills and knowledge. It is reasonable to assume there will be an individual variation in performance within this environment that may well occur due to issues unrelated to individual skill, such as stress or the physical fitness/wellbeing of the pilot, both of which are beyond the scope of this study to consider.
The other potential influencing factor is that the metrics pilots are rated against are the overarching areas of proficiency and as such, any sub-element of that metric may influence performance. For example, if a procedure has recently changed or is not often used, it may be the execution of the procedure rather than the approach which is causing the pilot to repeat the manoeuvre, or receive a lower rating. It is therefore possible that the variation in performance that is being seen is not a function of pilot proficiency or ability, but rather the subtleties of an underlying procedure and/or other training issues.
Another factor that must be acknowledged is the possibility that one or more of the differences might be to chance alone, due to the limitation that multiple comparisons were required. However,

› 31 ‹
ATSB – AR-2012-023
this was addressed by using the lower significance level of 0.01 with exploration of results that were significant at 0.05 to ensure overall trends in performance were identified.
The other possible influence on the data, which should be considered, is that of marking bias. Marking bias by check captains is reported to be an inherent problem in the recurrent measure of flight crew proficiency checks and generally involves the pilots under check receiving a mark consistent with their performance for their rank and/or experience. That is, a cadet or low-hour pilot performing well may only receive a 3, whereas the same performance from a more experienced first officer or captain may attract a 4. Interestingly the data for Airline B showed a potential bias of a low-hour ‘stop’ at 3, with high-hour pilots receiving marks clustered around 3-4. Therefore the reader should be mindful of the possibility that what the data is showing is a difference in marking and not in performance.

› 32 ‹
ATSB – AR-2012-023
Conclusion This study has provided an overview of pilot performance as a function of both airline entry pathway, and flight hours within three high-capacity regular public transport airlines.
There is a level of unease within the wider aviation industry regarding the concept of low-hour pilots in general, and cadets and MPL pilots in particular. Despite the prevalent existence of cadet training schemes for a number of airlines around the world for a number of years, there remains a level of opposition within Australia to such a concept. With the development of training innovations such as the MPL, this opposition has certainly not abated.
The results indicate that while there are differences in performance between the various groups, the performance of the cadets and low-hour pilots against their direct entry and more experienced brethren is remarkably similar. All pilots within the cadet entry and low-hours groups passed the simulator and line checks required of them, meaning they are proficient to be operating as second and first officers within the respective airlines, as rated by the airlines’ check and training staff. The differences in performance were between ‘meeting the standard’ and exceeding it, and are subject to the caveats listed in the discussion. However given that the cadets met the standard and are therefore proficient, the evidence is demonstrating that the cadet pathway for low-hour pilots is a valid option for airlines. Contrary to the expressed concerns of some sectors of the industry, there was no evidence indicating that cadets or low-hour pilots within these airlines were any less competent or proficient than their direct entry and high-hour peers.
The inclusion of simulator proficiency data and airline entry pathway in this study was to address some of the limitations from a previous study, which occurred within the line operating environment only, and without the data to study entry pathway. By studying simulator proficiency checks, this study was able to examine the performance of cadet and low-hour pilots in non-normal scenarios, which is not possible during line operations. Aircraft accidents such as AF447 and the DHC-8 accident at Buffalo, New York, highlight the importance of appropriate training for non-normal events and the need for competent, proficient performance of all flight crew to successfully handle non-normal events that occur in the operational environment.
The differences in the performance of pilots against all metrics were variable within airlines and inconsistent across all three airlines. This suggests that the differences between the groups were not of a systemic nature that would highlight an area of concern for industry. While the metric normal landing showed a difference across two of the three airlines, none of the rest of the required regulatory manoeuvres or technical metrics were significantly different in more than one airline. For non-technical metrics, both leadership and situation awareness were significantly different in all three airlines. Although this is understandable given the low experience of cadet and low-hour pilots, focused exposure to those metrics during initial airline training may reduce this difference as was seen with cadets at the 5-year mark in Airline B.
While differences in performance were discovered as a function of flight hours in some non-normal scenarios, the fact remains that these differences did not result in the low-hour pilots being marked as unsatisfactory. Nevertheless, the data from these comparisons may well further inform future training within high-capacity RPT airline operations to ensure that low-hour pilots are receiving suitable training interventions for the areas they are not performing as well on.
While the subject of low-hour and cadet pilots have received significant international attention recently (e.g. the Australian senate inquiry and American legislative changes), it is important to ensure that any on-going debate is informed by relevant studies and science. With the advancement of aircraft technology and a growing shortage of pilots; regulators, airlines and industry bodies need to ensure that the underpinning training aids pilots by providing targeted training to prepare them for any non-normal events during flight.

› 33 ‹
ATSB – AR-2012-023
References Air Line Pilots Association. (2009) ALPA White Paper: Producing a Professional Airline Pilot. Washington DC, US: Air line Pilots Association, International.
Bazargan, M., & Guzhva, V.S. (2011). Impact of gender, age and experience of pilots on general aviation accidents. Accident Analysis and Prevention, 43:962-970.
BEA (2012). Final Report on accident on 1st June 2009 to the Airbus A330-203 registered F-GZCP operated by Air France flight AF447 Rio de Janeiro – Paris. Bureau d’Enquêtes et d’Analyses pour la sécurité de l’aviation civile. Paris, France.
Causse, M., Dehais, F. & Pastor, J. (2010). Flight experience and executive functions predict flight simulator performance in general aviation pilots. In: 4th International Conference on Research in Air Transportation – ICRAT 2010, 04 June 2010, Budapest, Hungary.
Clarke, D.D., Ward, P., Bartle, C. & Truman, W. (2006). Young driver accidents in the UK: The influence of age, experience, and time of day. Accident Analysis and Prevention; 38:871-8.
Dinges, T.A., Hulse, M.C., Mollenhauer, M.A., Fleishman, R.N., McGehee, D.V. & Manakkal, N. (1997). Effects of Age, System Experience, and Navigation Technique on Driving with an Advanced Traveler Information System. Human Factors 39(2):177-99.
Dismukes, R.K., Berman, B.J. & Loukopoulos, L.D. (2007). The Limits of Expertise: Rethinking pilot error and the causes of airline accidents. Ashgate, Aldershot, UK.
Fisher, D.L., Laurie, N.E., Glaser, R., Connerney, K., Pollatsek, A., Duffy, S.A. & Brock, J. (2002). Use of a Fixed-Based Driving Simulator to Evaluate the Effects of Experience and PC-Based Risk Awareness Training on Drivers’ Decisions. Human Factors, 44(2): 287-302.
Goh, J. & Wiegmann, D. (2002). Human Factors Analysis of Accidents Involving Visual Flight Rules Flight into Adverse Weather. Aviation, Space, and Environmental Medicine, 73:817-22.
Groff, L.S. & Price, J.M. (2006). General Aviation Accidents in Degraded Visibility: A Case Control Study of 72 Accidents. Aviation, Space, Environmental Medicine, 77:1062-7.
Hunter, D.R. (2001). Retrospective and Prospective Validity of Aircraft Accident Risk Indicators. Human Factors, 43(4), 509-518.
ICAO (2006). Annex 1 – Personnel Licensing (10th edition). International Civil Aviation Organization, Montreal, Canada
Kennedy, Q., Taylor, J.L, Reade, G. & Yesavage, J.A. (2010). Age and Expertise Effects in Aviation Decision Making and Flight Control in a Flight Simulator. Aviation, Space, and Environmental Medicine, 81(5), 489-497.
Li, G., Baker, S.P., Grabowski, J.G., Qiang, Y., McCarthy, M.L. & Rebok, G.W. (2003). Age, Flight Experience, and Risk of Crash Involvement in a Cohort of Professional Pilots. American Journal of Epidemiology, 157:874-880.
McFadden, K.L. (1996). Comparing Pilot-error Accident Rates of Male and Female Airline Pilots. Omega, International Journal of Management Science, 24(4), 443-450.
Mendenhall, W., Scheaffer, R.L. & Wackerly, D.D (1981). Mathematical Statistics with Applications (second edition). PWS Publishers, Boston, United States.
NTSB (2012). Loss of Control on Approach Colgan Air, Inc. Operating as Continental Connection Flight 3407, Bombardier DHC-8-400, N200WQ, Clarence Center, New York, February 12, 2009. National Transportation Safety Board, Washington, United States of America.
› 34 ‹
ATSB – AR-2012-023
O’Hare, D. & Chalmers, D. (1999). The Incidence of Incidents: A Nationwide Study of Flight Experience and Exposure to Accidents and Incidents. International Journal of Aviation Psychology, 9:1-18
Parliament of Australia Senate. (2010). Pilot training and airline safety. Retrieved 20 October 2010 from http://www.aph.gov.au/senate/committee/rat_ctte/pilots_2010/info.htm
Salvatore, S., Stearns, M.D., Huntley Jr, M.S. & Mengert, P. (1986). Air transport pilot involvement in general aviation accidents. Ergonomics, 29(11), 1455-1467.
Shuch, H.P. (1992). The Influence of Flight Experience on Midair Collision Risk Perception. Accident Analysis and Prevention, 24(6), 655-660.
Sutton O. (2005). Shortcut or Fast Track? Air Transport World, 2005. Retrieved 24 April 2008 from http://www.atwonline.com/channels/safetySecurity/article.html?articleID=1428
Todd, M.A. & Thomas, M.J.W. (2012). Flight Hours and Flight Crew Performance in Commercial Aviation. Aviation, Space, and Environmental Medicine, 83(8), 776-782.
United States of America Congress. (2010). Airline Safety and Federal Aviation Administration Extension Act of 2010. Washington, DC: United States Government Printing Office.
Wiegmann, D.A., Goh, J. & O’Hare, D. (2002). The Role of Situation Assessment and Flight Experience in Pilots’ Decisions to Continue Visual Flight Rules Flight into Adverse Weather. Human Factors, 44(2), 189-97.
Wiggins, M.W. & Bollwerk, S. (2006). Heuristic-Based Information Acquisition and Decision Making Among Pilots. Human Factors, 48(4), 734-46.
Wiggins, M.W. & O’Hare, D. (2003). Expert and Novice Pilot Perceptions of Static In-Flight Images of Weather. International Journal of Aviation Psychology, 13:173-87.
Wiggins, M.W. & Stevens, C. (1999). Aviation Social Science: Research Methods in Practice. Ashgate, Aldershot, England.

› 35 ‹
ATSB – AR-2012-023
Sources and submissions Submissions Under Part 4, Division 2 (Investigation Reports), Section 26 of the Transport Safety Investigation Act 2003, the ATSB may provide a draft report, on a confidential basis, to any person whom the ATSB considers appropriate. Section 26 (1) (a) of the Act allows a person receiving a draft report to make submissions to the ATSB about the draft report.
A draft of this report was provided to the airlines involved in the study, the Civil Aviation Safety Authority (CASA) and the International Civil Aviation Organization. Submissions were received from CASA and two of the airlines involved in the study, and where considered appropriate, the text of the draft report was amended accordingly.
› 36 ‹
ATSB – AR-2012-023
Australian Transport Safety Bureau The Australian Transport Safety Bureau (ATSB) is an independent Commonwealth Government statutory agency. The ATSB is governed by a Commission and is entirely separate from transport regulators, policy makers and service providers. The ATSB’s function is to improve safety and public confidence in the aviation, marine and rail modes of transport through excellence in: independent investigation of transport accidents and other safety occurrences; safety data recording, analysis and research; fostering safety awareness, knowledge and action.
The ATSB is responsible for investigating accidents and other transport safety matters involving civil aviation, marine and rail operations in Australia that fall within Commonwealth jurisdiction, as well as participating in overseas investigations involving Australian registered aircraft and ships. A primary concern is the safety of commercial transport, with particular regard to fare-paying passenger operations.
The ATSB performs its functions in accordance with the provisions of the Transport Safety Investigation Act 2003 and Regulations and, where applicable, relevant international agreements.
Purpose of safety investigations The object of a safety investigation is to identify and reduce safety-related risk. ATSB investigations determine and communicate the factors related to the transport safety matter being investigated.
It is not a function of the ATSB to apportion blame or determine liability. At the same time, an investigation report must include factual material of sufficient weight to support the analysis and findings. At all times the ATSB endeavours to balance the use of material that could imply adverse comment with the need to properly explain what happened, and why, in a fair and unbiased manner.
Developing safety action Central to the ATSB’s investigation of transport safety matters is the early identification of safety issues in the transport environment. The ATSB prefers to encourage the relevant organisation(s) to initiate proactive safety action that addresses safety issues. Nevertheless, the ATSB may use its power to make a formal safety recommendation either during or at the end of an investigation, depending on the level of risk associated with a safety issue and the extent of corrective action undertaken by the relevant organisation.
When safety recommendations are issued, they focus on clearly describing the safety issue of concern, rather than providing instructions or opinions on a preferred method of corrective action. As with equivalent overseas organisations, the ATSB has no power to enforce the implementation of its recommendations. It is a matter for the body to which an ATSB recommendation is directed to assess the costs and benefits of any particular means of addressing a safety issue.
When the ATSB issues a safety recommendation to a person, organisation or agency, they must provide a written response within 90 days. That response must indicate whether they accept the recommendation, any reasons for not accepting part or all of the recommendation, and details of any proposed safety action to give effect to the recommendation.
The ATSB can also issue safety advisory notices suggesting that an organisation or an industry sector consider a safety issue and take action where it believes it appropriate. There is no requirement for a formal response to an advisory notice, although the ATSB will publish any response it receives.

› 37 ‹
ATSB – AR-2012-023
Glossary AF447 Air France Flight 447
ATP Air Transport Pilot
ATPL Air Transport Pilot Licence
CRM Crew Resource Management
GA General Aviation
ICAO International Civil Aviation Organization
ILS Instrument Landing System
ILS MAP Instrument Landing System Missed Approach
IMC Instrument Meteorological Conditions
MPL Multi-Crew Pilot Licence
RPT Regular Public Transport
S.D. Standard Deviation
SOP Standard Operating Procedure
TEM Threat and Error Management
VFR Visual Flight Rules

AT
SB
Transp
ort S
afety Rep
ort
Aviation R
esearch Investigation
Pilot experience and perform
ance in an airline environment
AR
-2012-023 Final – 17 July 2013
Research
Australian Transport Safety Bureau
24 Hours 1800 020 616 Web www.atsb.gov.auTwitter @ATSBinfoEmail [email protected]