Pillar 3 Report 2017 exposures for banking and trading book 136 Article 449(p) CRR–Impaired assets...
148
Pillar 3 Report 2017 Deutsche Bank
Transcript of Pillar 3 Report 2017 exposures for banking and trading book 136 Article 449(p) CRR–Impaired assets...

Pillar 3 Report 2017
Deutsche Bank
Contents4 Regulatory Framework
4 Introduction4 Basel 3 and CRR / CRD 4
6 General requirements for disclosures
6 Article 431 (1) CRR – Pillar 3 disclosure concept 7 Article 431 (2) CRR – Information on operational risk
methodologies7 Article 431 (3) CRR – Disclosure policy7 Article 431 (4) CRR – Explanation of rating decisions7 Article 432 CRR – Non-material, proprietary or
confidential information7 Article 433 CRR – Frequency of disclosure8 Article 434 CRR – Means of disclosure
9 Risk Management objectives and policies
9 Article 435 (1)(a) CRR – Risk Management strategies and processes
9 Article 435 (1)(b) CRR – Risk Management structure and organization
10 Article 435 (1)(c) CRR – Scope and nature of risk reporting and measurement systems
11 Article 435 (1)(d) CRR – Policies for hedging and mitigating risk
11 Article 435 (1)(e) CRR – Declaration on the adequacy of risk management arrangements
12 Article 435 (1)(f) CRR – Concise risk statement approved by the Board
12 Article 435 (2)(a) CRR – Number of directorships held by Board members
13 Article 435 (2)(b) CRR – Recruitment policy for Board members
13 Article 435 (2)(c) CRR – Policy on diversity for Board members
13 Article 435 (2)(d-e) CRR – Risk Committee and information flow
14 Scope of application of the regulatory framework
14 Article 436 (a) CRR – Name of the institution14 Article 436 (b) CRR – Difference in basis of consolidation
for accounting and prudential purposes17 Article 436 (c) CRR – Impediments to fund transfers17 Article 436 (d) CRR – Potential capital shortfalls in
unconsolidated subsidiaries17 Article 436 (e) CRR – Derogations from prudential or
liquidity requirements for subsidiaries
19 Own funds
19 Capital Adequacy20 Article 437 (1)(a) CRR – Regulatory capital composition25 Article 437 (1)(b-c) CRR – Main features of capital
instruments25 Article 437 (1)(d-e) CRR – Prudential filters and
deduction items27 Article 437 (1)(f) CRR – Capital ratios different to CRR
27 Capital requirements
27 Article 438 (a) CRR – Summary of Deutsche Bank’s ICAAP approach
31 Article 438 (b) CRR – SREP requirements32 Article 438 (c-f) CRR – Overview of capital requirements33 Article 438 CRR – Specialised lending and equity
exposures in the banking book34 Article 438 CRR – Other non-credit obligation assets in
the banking book34 Article 441 CRR – Indicators of global systemic
importance 34 Article 440 CRR – Capital buffers
39 Credit risk and credit risk mitigation
39 General qualitative information on credit risk 39 Article 442 (a) CRR – Definitions of past due and
impairment 39 Article 442 (b) CRR – Credit risk adjustments39 General quantitative information on credit risk 39 Article 442 (c) CRR – Total and average amount of
credit exposure by exposure classes 40 Article 442 (d) CRR – Geographic distribution of
credit exposure 45 Article 442 (e) CRR – Distribution of credit exposure
by industry type 47 Article 442 (f) CRR – Residual maturity breakdown
of credit exposure 48 Article 442 (g) CRR – Defaulted exposures by
regulatory exposure class and industry 50 Article 442 (h) CRR – Defaulted exposures by
geographical area, past due, non-performing and forborne exposures
52 Article 442 (i) CRR – Development of credit risk adjustments and defaulted loans and debt securities
53 General qualitative information on credit risk mitigation 53 Article 453 (a) CRR – Use of on- and off-balance
sheet netting 53 Article 453 (b) CRR – Collateral valuation and
management 53 Article 453 (c) CRR – Main types of collateral 53 Article 453 (d) CRR – Main types of guarantor and
credit derivative counterparties 53 Article 453 (e) CRR – Risk concentrations within
credit risk mitigation53 General quantitative information on credit risk mitigation 53 Article 453 (f-g) CRR – Overview of credit risk
mitigation techniques
56 Credit risk exposure in the standardized approach
56 Standardized Approach56 Article 444 (a-b) CRR – External ratings in the
standardized approach56 Article 444 (c) CRR – Usage of issue ratings56 Article 444 (d) CRR – Mapping of external rating to
credit quality steps57 Article 444 (e) CRR – Credit risk exposure and credit risk
mitigation in the standardized approach

119 Exposures in equities in the banking book
119 Article 447 (a) CRR – Accounting and valuation of equity investments
119 Article 447 (b) CRR – Equity investment exposure120 Article 447 (c) CRR – Types and nature of equity
exposures120 Article 447 (d-e) CRR – Gains and losses from equity
investments
120 Exposure to interest rate risk in the banking book (Article 448 CRR)
121 Exposure to securitization positions
121 Article 449 (a) CRR – Objectives in relation to securitization activity
121 Article 449 (b) CRR – Nature of other risks in securitized assets
121 Article 449 (d-e) CRR – The roles played in the securitization process
122 Article 449 (f) and (c) CRR – Management of securitiza-tion positions, and risks in re-securitization activities
124 Article 449 (g) CRR – Policies with respect to hedging and unfunded protection
124 Article 449 (h) CRR – RWA calculation approaches for securitization positions
126 Article 449 (i) CRR – SSPEs in sponsoring activities126 Article 449 (j) CRR – Accounting policies for
securitizations127 Article 449 (k) CRR – External rating agencies used for
securitizations127 Article 449 (l) CRR – Internal Assessment Approach127 Article 449 (m) CRR – Explanation of changes in
quantitative disclosures127 Article 449 (n) CRR – Banking and trading book
securitization exposures133 Article 449 (o)(i) CRR – Retained or purchased banking
and trading book securitizations broken down by risk-weight bands
135 Article 449 (o)(ii) CRR – Retained or purchased re-securitization exposures for banking and trading book
136 Article 449 (p) CRR – Impaired assets and recognised losses related to banking book securitizations
136 Article 449 (q) CRR – Trading book securitization positions
136 Article 449 (r) CRR – Financial support to securitization vehicles
137 Remuneration policy (Article 450 CRR)
137 Leverage (Article 451 CRR)
137 Leverage Ratio according to revised CRR / CRD 4 framework
139 Process used to manage the risk of excessive leverage
140 Factors that had an impact on the leverage ratio in 2017
141 Unencumbered Assets (Article 443 CRR)
143 Liquidity
145 Business Risk
59 Credit risk exposure and credit risk mitigation in the internal-rating- based approach
59 Qualitative information on the use of the IRB approach
59 Article 452 (a) CRR – Approval status for IRB approaches
60 Article 452 (b)(i) CRR – Mapping of internal rating scales to external ratings
60 Article 452 (b)(ii) CRR – Use of internal ratings 60 Article 452 (b)(iii) CRR – Management and
recognition of credit risk mitigation 60 Article 452 (b)(iv) CRR – Controls around ratings
systems 61 Article 452 (c) – Internal rating-based approaches63 Quantitative information on the use of the IRB
approach 63 Article 452 (d-g) CRR – Advanced IRB exposure 71 Article 452 (d-g) CRR – Foundation IRB exposure 76 Article 453 (g) CRR – Total IRB exposure covered
by credit derivatives 77 Article 438 (d) CRR – Development of Credit Risk
RWA 77 Article 452 (h-i) CRR – Model validation results
and expected versus actual losses 84 Article 452 (j) CRR – IRB exposure by country
where Deutsche Bank operates
91 Counterparty credit risk (CCR)
91 Article 439 (a) CRR – Internal capital and credit limits for counterparty credit risk exposures
92 Article 439 (b) CRR – Collateral and credit reserves for counterparty credit risk
92 Article 439 (c) CRR – Management of wrong-way risk exposures
92 Article 439 (d) CRR – Collateral in the event of a rating downgrade
92 Article 439 (f) CRR – Counterparty credit risk exposu-res by model approach
94 Article 444 (e) CRR – CCR exposures in the standardized approach
95 Article 452 (e) CRR – CCR exposures within the advanced IRBA
98 Article 452 (e) CRR – CCR exposures within the foundation IRBA
100 Article 438 (d) CRR – Development of Counterparty Credit Risk RWA
101 Article 439 (e) CRR – CCR exposures after credit risk mitigation
101 Article 439 (g-h) CRR – Credit derivatives exposures102 Article 439 (i) CRR – Estimate of alpha factor
102 Economic capital usage for credit risk
103 Market risk
103 Article 445 CRR – Exposure to market risk105 Article 455 CRR – Use of Internal Market Risk Models
115 Operational Risk
115 Article 446 CRR – Operational Risk Measurement116 Article 446 CRR – Operational Risk Exposure117 Article 454 CRR – Use of the Advanced Measurement
Approaches to operational risk

4
Deutsche Bank Regulatory FrameworkPillar 3 Report 2017 Basel 3 and CRR/CRD 4
Regulatory Framework
IntroductionThis Report provides Pillar 3 disclosures on the consolidated level of Deutsche Bank Group as required by the global regulatoryframework for capital and liquidity, established by the Basel Committee on Banking Supervision, also known as Basel 3. OnEuropean level these are implemented in the disclosure requirements as laid down in Part Eight of the “Regulation (EU) No575/2013 on prudential requirements for credit institutions and investment firms” (Capital Requirements Regulation, or “CRR”)and the “Directive 2013/36/EU on access to the activity of credit institutions and the prudential supervision of credit institutionsand investment firms” (Capital Requirements Directive 4, or “CRD 4”). Germany implemented these CRD 4 requirements intonational law in Section 26a of the German Banking Act (“Kreditwesengesetz” or “KWG”). Per regulation it is not required to havePillar 3 disclosures audited. As such the information provided in this Pillar 3 Report is unaudited.
Basel 3 and CRR/CRD 4In the European Union, the Basel 3 capital framework was implemented by the “Regulation (EU) No 575/2013 on prudentialrequirements for credit institutions and investment firms” (Capital Requirements Regulation, or “CRR”) published onJune 26, 2013, and the “Directive 2013/36/EU on access to the activity of credit institutions and the prudential supervision ofcredit institutions and investment firms” (Capital Requirements Directive 4, or “CRD 4”) published on June 26, 2013. As a single“rulebook”, the CRR is directly applicable to credit institutions and investment firms in the European Union and provides thegrounds for the determination of regulatory own funds, regulatory capital requirements, leverage and liquidity as well as otherrelevant regulations. In addition, the CRD 4 was implemented into German law by means of further amendments to the GermanBanking Act (KWG) and the German Solvency Regulation (SolvV) and accompanying regulations. Jointly, these laws and regu-lations represent the new regulatory framework applicable in Germany.
The new regulatory framework became effective on January 1, 2014, subject to transitional rules. When referring to DeutscheBank results according to transitional rules we use the term “CRR/CRD 4”. When referring to results according to full applicationof the final CRR/CRD 4 framework (without consideration of applicable transitional methodology) we use the term “CRR/CRD 4fully loaded”. In some cases, CRR/CRD 4 maintains transitional rules that had been adopted in earlier capital adequacy frame-works through Basel 2 or Basel 2.5. These relate, e.g., to the risk weighting of certain categories of assets and include rulespermitting the grandfathering of equity investments at a risk-weight of 100 %. In this regard, we assumed in our CRR/CRD 4fully loaded methodology for a limited subset of equity positions that the impact of the expiration of these transitional rules willbe mitigated through sales of the underlying assets or other measures prior to the expiration of the grandfathering provisions bythe end of 2017. Since the fourth quarter 2017 we have not applied this grandfathering rule anymore, but instead applied a riskweight between 190 % and 370 % determined based on Article 155 CRR under the CRR/CRD 4 fully loaded rules to all ourequity positions. Consequently, no transitional arrangements are considered in our fully loaded RWA numbers for December 31,2017. Only for the comparative period, yearend 2016, are these transitional rules within the risk weighting still applied.
Since 2015 the Common Equity Tier 1 minimum capital requirement applicable to the Group is 4.5 % of risk weighted assets.The development and maintenance of a high quality capital base which should primarily consist of Common Equity Tier 1 re-flects one of the core elements of the CRR/CRD 4 framework. Specific regulatory adjustments are also subject to transitionalrules. For instance, deductions for deferred tax assets that rely on future profitability or deductions for indirect and syntheticholdings of own instruments and capital instruments issued by financial sector entities are phased in. The phase in percentagewas in general 80 % in 2017 compared to 60 % in 2016. It will increase to 100 % in 2018.
In addition to these minimum capital requirements, various capital buffer requirements were phased-in starting 2016 and willbecome fully effective from 2019 onwards.
Additionally, the leverage ratio has been introduced as a non-risk based capital requirement to complement the risk-basedcapital requirements. The CRR/CRD 4 requires banks to calculate and disclose a regulatory leverage ratio that is generallybased on the accounting value as the relevant exposure measure for assets. Specific regulatory exposure measures apply toderivatives and securities financing transactions and off-balance sheet exposures must be added to determine the total lever-age exposure.

5
Deutsche Bank Regulatory FrameworkPillar 3 Report 2017 Basel 3 and CRR/CRD 4
The CRR/CRD 4 framework further introduced new liquidity standards. The Liquidity Coverage Ratio (LCR) aims to measure abank’s short-term resilience to a severe liquidity stress scenario during a stress period of 30 calendar days. Detailed rules forthe calculation of the LCR are set out in the delegated act adopted in October 2014. The LCR became a binding minimumrequirement as of October 1, 2015 and is phased in progressively: 60 % from October 1, 2015, 70 % from 2016, 80 % from2017 and 100 % from 2018, respectively.
The Net Stable Funding Ratio (NSFR) requires banks to maintain a stable funding profile in relation to their on- and off-balancesheet exposures. On November 23, 2016, the European Commission proposed a revision of the Capital Requirement Regula-tion (“CRR”) to implement the NSFR into EU legislation. It is expected that a binding minimum ratio for the NSFR will apply fromend of 2020.
There are still some interpretation uncertainties with regard to CRR/CRD 4 rules and some of the related binding TechnicalStandards are not yet available in their final version. Thus, we will continue to refine our assumptions and models in line withevolution of our as well as the industry’s understanding and interpretation of the rules. Against this background, currentCRR/CRD 4 measures may not be comparable to previous expectations. Also, our CRR/CRD 4 measures may not be compa-rable with similarly labeled measures used by our competitors as our competitors’ assumptions and estimates regarding suchimplementation may differ from ours.
ICAAP, ILAAP and SREP
The lnternal Capital Adequacy Assessment Process (“ICAAP”) as stipulated in Pillar 2 of Basel 3 requires banks to identify andassess risks, maintain sufficient capital to face these risks and apply appropriate risk management techniques to maintain ade-quate capitalization. The Internal Liquidity Adequacy Assessment Process (“ILAAP”) focuses on maintaining sufficient liquidityrisk management. The Supervisory Review and Evaluation Process (“SREP”) refers to the common methodology and stand-ards used by the European Central Bank (ECB) in its role under the Single Supervisory Mechanism (SSM). In accordance withArticle 97 of the Capital Requirements Directive (CRD 4), supervisors regularly review the arrangement, strategies, process andmechanisms implemented by banks and evaluate: (a) the risks to which the institution might be exposed; (b) the risks the insti-tution might pose to the financial system in general; and (c) the risks revealed by stress testing.
MREL and TLAC
Under the Single Resolution Mechanism (“SRM”) Regulation, the Bank Recovery and Resolution Directive (“BRRD”) and theGerman Recovery and Resolution Act (Sanierungs- und Abwicklungsgesetz, “SAG”) banks in the European Union (“EU”) arerequired to meet at all times a robust Minimum Requirement for own funds and Eligible Liabilities (“MREL”) which is determinedon a case-by-case basis by the competent resolution authority.
The Single Resolution Board (“SRB”) intends to set binding MREL targets for the majority of the largest and most complexbanking groups in its remit as part of the 2017 resolution planning cycle and to communicate the MREL decision to them (viaNational Resolution Authrorities) in the first quarter 2018.
In addition, on November 9, 2015, the Financial Stability Board (“FSB”) published a standard that will require, when implement-ed as law, Global Systemically Important Banks (“G-SIBs”) to meet a new firm-specific minimum requirement for Total Loss-Absorbing Capacity (“TLAC”) starting on January 1, 2019.
On July 6, 2017, the FSB published guiding principles on internal TLAC, i.e., the loss absorbing capacity that a resolution entityhas committed to material sub-groups so that losses and recapitalization needs of material sub-groups may be passed withlegal certainty to the resolution entity of a G-SIB resolution group without subsidiaries within the material sub-groups enteringinto resolution.
Both the TLAC and MREL requirements are specifically designed to require banks to maintain a sufficient amount of instru-ments which are eligible to absorb losses in resolution with the aim of ensuring that failing banks can be resolved without re-course to taxpayers’ money.
On November 23, 2016, the European Commission proposed a revision of the Capital Requirement Regulation (“CRR”) toimplement TLAC into EU legislation. In addition, it proposed amendments to the BRRD and the SRM Regulation. Under theCommission’s CRR revision proposal, the loss absorbency regime for EU global systemically important institutions (“G-SIIs”)would be closely aligned with the international TLAC term sheet. It introduces a minimum requirement of 16 % of Risk WeightedAssets (“RWA”) or 6 % of leverage exposure by January 1, 2019; and 18 % of RWAs and 6.75 % of leverage exposure by 2022.The resolution authority would be able to request a firm-specific add-on if deemed necessary. For non-G-SIIs banks, the MRELwould still be set on a case-by-case basis.
6
Deutsche Bank General requirements for disclosuresPillar 3 Report 2017 Article 431 (1) CRR - Pillar 3 disclosure concept
Furthermore, under the German Banking Act, as amended by the German Resolution Mechanism Act, which was published inNovember 2015, senior bonds rank junior to other senior liabilities, without constituting subordinated debt, in insolvency pro-ceedings opened on or after January 1, 2017. On December 27, 2017, an EU Directive amending the ranking of unsecureddebt instruments in the insolvency hierarchy for the purpose of banks’ resolution and insolvency proceedings has been pub-lished which introduces a common EU approach to banks’ creditor hierarchy, thereby enhancing legal certainty in the event ofresolution. The Directive introduces non-preferred senior debt instruments as a separate category of senior debt. These newinstruments will rank junior to all other senior liabilities but will be senior to sub-ordinated debt provided they have an originalcontractual maturity of at least one year, do not contain embedded derivatives or be derivatives themselves and the contractualdocumentation explicitly refers to their lower ranking under normal insolvency proceedings. Member States are required totranspose the amending Directive into national law by December 29, 2018. The new provisions will apply to unsecured debtinstruments issued on or after the date of when the respective national law enters into force. Any senior bonds that rank juniorto other senior liabilities in accordance with the German Banking Act provisions published in November 2015 will be grandfa-thered and represent non-preferred senior debt instruments according to the EU Directive published on December 27, 2017.
General requirements for disclosures
Article 431 (1) CRR - Pillar 3 disclosure conceptWe provide our Pillar 3 disclosures in line with the disclosure requirements as laid down in Part Eight of the “Regulation (EU) No575/2013 on prudential requirements for credit institutions and investment firms” (CRR). This report provides the respectivePillar 3 disclosures to the extent that these Pillar 3 disclosures are not included in the Deutsche Bank Annual Report 2017.Where Pillar 3 disclosure elements are located in the Annual Report of Deutsche Bank, they are generally referenced from thePillar 3 Report to the Annual Report accordingly. Further down in this Report we provide an overview of the references into theDeutsche Bank Annual Report 2017.
In December 2016 the European Banking Authority (“EBA”) provided a “Final Report on the Guidelines on Disclosure Require-ments under Part Eight of Regulation (EU) No 575/2013” (“EBA Guideline”, EBA/GL/2016/11, version 2*), subsequently to theBasel Committee on Banking Supervision releasing a revised version of the Basel 3 Pillar 3 framework. The EBA Guidelineconstitutes an own-initiative guideline to ensure the harmonized and timely implementation of the new Basel framework in theEuropean Union. In this regard, these Guidelines do not supersede or change the substance of the regulatory disclosures re-garding the requirements defined in Part Eight of the CRR. However, they provide guidance on these disclosures from apresentational aspect, in particular by introducing more specific guidance and formats through the use of tables and templates.This means that certain Pillar 3 disclosures follow a fixed format defined by EBA, including column or row labeling, whereasother disclosures are flexible and may be modified to a certain degree to present the most relevant information.
Against this background, we have decided to re-structure the content flow of the Pillar 3 Report to allow easier identification ofthe respective disclosure elements against its specific Pillar 3 disclosure requirements. Within the broad risk sections “creditrisk”, “counterparty credit risk”, “market risk”, “operational risk”, “liquidity risk” and “remuneration” we re-designed the Pillar 3Report to follow in principle the order of the CRR-Articles in Part Eight (relevant numberings are now also reflected in the head-ings of the sections). In some instances within these sections we follow the structure as provided by the EBA Guideline where ithelps to present specific topics even more comprehensively at one place. The quantitative Pillar 3 requirements are presentedunder the relevant EBA template with respective references (e.g., EU OV1, EU CR6), also including the EBA column or rowlabeling. In instances where additional lines or columns have been added to certain templates for better disclosure presentationa new numbering was introduced as specified in the EBA Guideline. Please note that we still use mainly our own naming con-ventions within the EBA templates for the description of rows and columns which allows us to stay aligned and consistent in ourdisclosure presentation over time. For this year’s Pillar 3 disclosures per yearend 2017 we principally make use of the transi-tional arrangements provided in the EBA Guideline in section 4.1, No. 20 in relation to comparative information for prior periods,where these can be omitted in their first year of adoption.
In 2012 the Enhanced Disclosure Task Force (“EDTF”) was established as a private sector initiative under the auspice of theFinancial Stability Board, with the primary objective to develop fundamental principles for enhanced risk disclosures and torecommend improvements to existing risk disclosures. As a member of the EDTF we adhered to the disclosure recommenda-tions in this Pillar 3 Report to the extent applicable.

7
Deutsche Bank General requirements for disclosuresPillar 3 Report 2017 Article 433 CRR - Frequency of disclosure
Article 431 (2) CRR - Information on operational risk methodol-ogiesDeutsche Bank uses the Advanced Measurement Approach (AMA) to measure Operational Risk capital requirements as out-lined in section “Article 446 CRR - Operational Risk Measurement” in this report on page 115.
Article 431 (3) CRR - Disclosure policyFor purposes of Article 431 CRR, we have adopted a formal Risk Disclosure Policy aiming to support a conclusion that our riskdisclosures are in compliance with applicable legal, regulatory and accounting risk disclosure standards and are compiledbased upon a set of internally defined principles and related processes. The Risk Disclosure Policy defines overall roles andresponsibilities, sets up the disclosure production process and establishes the verification and sign off procedures. Principallysenior representatives and subject matter experts from Finance and Risk assume responsibility for our risk disclosures andgovern our respective risk disclosure processes. Based upon our assessment and verification we believe that our risk disclo-sures presented throughout this Pillar 3 Report in conjunction with the Annual Report 2017 appropriately and comprehensivelyconvey our overall risk profile.
Article 431 (4) CRR - Explanation of rating decisionsDeutsche Bank Group provides explanations of rating decisions to small and medium entities and other corporates whose loanapplications were declined.
Article 432 CRR - Non-material, proprietary or confidential in-formationIn line with the Group’s internal Risk Disclosure Policy a dedicated process has to be followed in case the Group considers toomit certain disclosures due to these disclosures being immaterial, proprietary or confidential. In the rare cases where theGroup classifies information as non-material in this report this has been stated accordingly in the related disclosures.
Article 433 CRR - Frequency of disclosureIn line with the internal Risk Disclosure Policy the Group regularly assesses the need to disclose some or all information re-quired by Titles II and III in Part Eight of Regulation (EU) No 575/2013 more frequently than annually. In accordance with Article433 CRR the Group bases its assessment mainly on the relevant characteristics of its business such as scale of operations,range of activities, presence in different countries, involvement in different financial sectors, activity in international financialmarkets and considers participation in payment, settlement and clearing systems. In this regard, specific attention is laid oninformation on capital, capital requirements, risk and other elements that can change rapidly and therefore lead to a more fre-quent disclosure.
There is a formal process set up for the identification of the frequency of all Pillar 3 disclosures which is compatible with the size,the scope and the range of activities of the Group. It also considers external factors like market developments or investors andanalysts’ expectations as well as internal aspects like expert judgments from areas effected, process of disclosure implementa-tion and quality assurance in the production process with the overall aim to deliver appropriate disclosures which provide atimely, complete and correct view of the Group’s risk profile and risk position.
Subsequently the Group concludes, which parts of the information required under Part 8 CRR are to be disclosed more fre-quently than once a year. In this regard the Group principally follows the recommendations regarding frequency of disclosuresas prejudiced in the CRR and the EBA Guidelines on disclosure requirements under Part Eight of Regulation (EU) No 575/2013as of December 14, 2016, for those items specified in there, but also reaches respective conclusions for all remaining disclo-sure items.
The internal Risk Disclosure Policy also states that Pillar 3 disclosures have to be published in conjunction with the date ofpublication of the financial statements unless specified and agreed differently e.g. publication of standalone Pillar 3 Report forsignificant subsidiaries according to Article 13 CRR.

8
Deutsche Bank General requirements for disclosuresPillar 3 Report 2017 Article 434 CRR - Means of disclosure
Article 434 CRR - Means of disclosureThe Pillar 3 Report is provided on the bank’s website at www.db.com/ir/en/documents.htm
Starting yearend 2017, the Pillar 3 Report has been restructured. It now follows the structure as defined by the EBA guideline(“Final Report on the Guidelines on Disclosure Requirements under Part Eight of Regulation (EU) No 575/2013”EBA/GL/2016/11, version 2*, from 14 December 2016) and underlying Capital Requirement Regulation (CRR) related articles.
This report provides the Basel III Pillar 3 disclosures to the extent that these required Pillar 3 disclosures are not included in theDeutsche Bank Annual Report 2017. Where Pillar 3 disclosure elements are located in the Annual Report of Deutsche Bank,they are generally referenced from the Pillar 3 Report to the Annual Report accordingly. The following table provides an over-view of the references into the Deutsche Bank Annual Report 2017.
Main Pillar 3 disclosures in our Annual Report
Pillar 3 disclosure topic with reference to CRR-Article
Primary location in our Annual Report
Risk management objectives and policies(Article 435)
Report of the Supervisory Board, Our business strategy, Deutsche Bank Group, Risks andOpportunitiesKey Risk Metrics, Overall Risk Assessment, Risk Profile, Risk and Capital Framework, RiskManagement Principles, Risk Governance, Risk Appetite and Capacity, Strategic and CapitalPlan, Risk Reporting and Measurement Systems, Capital Management, Resource Limit Setting,Risk Identification and Assessment, Credit Risk Management, Market Risk Management, Opera-tional Risk Management, Liquidity Risk Management, Business (Strategic) Risk Management,Model Risk Management, Reputational Risk Management, Risk Concentration & Diversification,Capital and Leverage Ratio, Credit Risk Exposure, Asset Quality, Trading Market Risk Expo-sures, Nontrading Market Risk Exposures, Operational Risk Exposure, Liquidity Risk ExposureResponsibility Statement by the Management Board, Management Board, Supervisory Board,Compliance with the German Corporate Governance Code, Targets for the proportion of womenin management positions/gender quota, Diversity Concept
Scope of application of the regulatory framework(Article 436)
Introduction, Shareholdings
Own Funds (Article 437) Regulatory Capital, Capital Instruments, Minimum capital requirements and additional capitalbuffers, Development of regulatory capital
Capital requirements (Article 438) Key Risk Metrics, Risk Profile, Risk Appetite and Capacity, Risk and Capital Plan, Risk andCapital Plan, Stress Testing, Risk Identification and Assessment, Capital and Leverage Ratio
Counterparty credit risk (Article 439) Credit Risk Management, Credit Risk Exposure, Asset Quality, Liquidity Risk Exposure
Capital buffers (Article 440) Capital and Leverage Ratio
Indicators of global systemic importance(Article 441)
Disclosed on our webpage
Credit risk (Article 442) Asset Quality, Note 1 - Significant Accounting Policies and Critical Accounting Estimates, Note 13- Financial Instruments carried at Fair Value, Note 14 - Fair Value of Financial Instruments notcarried at Fair Value, Note 20 - Allowance for Credit Losses
Unencumbered assets (Article 443) Liquidity Risk Exposure, Note 22 - Assets Pledged and Received as Collateral, Note 39 - Infor-mation on Subsidiaries
Exposure to market risk (Article 445) Capital and Leverage Ratio, Trading Market Risk Exposures
Operational risk (Article 446) Operational Risk Management, Operational Risk Exposure, Capital and Leverage Ratio, Note 29- Provisions
Exposures in equities not included in the tradingbook (Article 447)
Market Risk Management, Credit Risk Exposure, Note 1 - Significant Accounting Policies andCritical Accounting Estimates, Note 13 - Financial Instruments carried at Fair Value, Note 17 -Equity Method Investments, Note 45 - Shareholdings
Exposure to interest rate risk on positions notincluded in the trading book (Article 448)
Nontrading Market Risk, Nontrading Market Risk Exposures
Securitization (Article 449) Credit Risk Management, Market Risk Management, Note 1 - Significant Accounting Policies andCritical Accounting Estimates, Note 13 - Financial Instruments carried at Fair Value
Remuneration policy (Article 450) Compensation Report
Leverage (Article 451) Risk Management Principles, Risk Governance, Capital Management, Leverage Ratio
Use of the IRB Approach to credit risk (Article 452) Credit Risk Management, Credit Risk Exposure
Use of credit risk mitigation techniques (Article 453) Credit Risk Management, Credit Risk Exposure
Use of the Advanced Measurement Approaches tooperational Risk (Article 454)
Operational Risk Management, Operational Risk Exposure
Use of Internal Market Risk Models (Article 455) Market Risk Management, Trading Market Risk Exposures, Note 13 - Financial Instrumentscarried at Fair Value
Liquidity Liquidity Risk Management, Liquidity Risk Exposure
Business Risk Business (Strategic) Risk Management
9
Deutsche Bank Risk Management objectives and policiesPillar 3 Report 2017 Article 435 (1)(b) CRR - Risk Management structure and organization
Disclosure requirements according to Article 26aGerman Banking Act (KWG)
Note 41 – Current and Non-Current Assets and LiabilitiesNote 42 – Events after the Reporting PeriodNote 43 – Supplementary Information to the Consolidated Financial Statements according toSections 297 (1a) / 315a HGB
Risk Management objectives and policies
Article 435 (1)(a) CRR - Risk Management strategies and pro-cessesDeutsche Bank Group discloses the Risk Management strategies and process in the Annual Report 2017 under sections “RiskManagement Principles” on page 46 and “Risk Governance” on page 47.
Credit risk management strategies and processes
The management of Credit Risk is described in section “Credit Risk Management” on page 58 in the 2017 Annual Report.
Market risk management strategies and processes
The management of Market Risk is described in section “Market Risk Management” on page 65 in the 2017 Annual Report.
Liquidity risk management strategies and processes
The management of Liquidity is described in section “Liquidity Risk Management” on page 76 in the 2017 Annual Report, cover-ing topics around the liquidity risk framework within Deutsche Bank, mitigation of long-term and short-term liquidity risk, struc-tural funding risk, allocation of liquidity across the firm, external and internal stress testing and scenario analysis, liquidityreserves and asset encumbrance.
Business risk management strategies and processes
The management of business risk is described in sections “Risk Identification and Assessment” and “Business (Strategic) RiskManagement” on pages 58 and 80 respectively in the 2017 Annual Report.
Operational risk management strategies and processes
The management of Operational Risk is described in section “Operational Risk Management” on page 71 in the 2017 AnnualReport.
Reputational risk management strategies and processes
The management of reputational risk is described in section “Reputational Risk Management” on page 81 of the 2017 AnnualReport.
Article 435 (1)(b) CRR - Risk Management structure and or-ganizationDeutsche Bank discloses the overall risk management structure and organization in the 2017 Annual Report, chapter “Risk andCapital Framework”, section “Risk Governance” on page 47.
More detailed descriptions are provided in the following specific chapters.
10
Deutsche Bank Risk Management objectives and policiesPillar 3 Report 2017 Article 435 (1)(c) CRR - Scope and nature of risk reporting and measurement systems
Credit risk management structure and organization
The structure and organization of Credit Risk Management is described in section “Credit Risk Management” on pages 58 to 65in the 2017 Annual Report.
Market risk management structure and organization
The structure and organization of Market Risk Management is described in section “Market Risk Management”, in the 2017Annual Report, specifically in the chapter “Market Risk Framework” on page 65, “Trading Market Risk” on page 66 and “Non-trading Market Risk” on page 69.
Liquidity risk management structure and organization
The structure and organization of Liquidity Risk Management is described in section “Liquidity Risk Management”, in the 2017Annual Report, specifically in the chapter “Liquidity Risk Management Framework” on page 76, “Capital Markets Issuance” onpage 76 and “Short Term Liquidity and Wholesale Funding” on page 76.
Business risk management structure and organization
Business risk is managed by the Risk Strategy team within Enterprise Risk Management. Further detail is provided in section“Business (Strategic) Risk Management” on page 80 in the 2017 Annual Report.
Operational risk management structure and organization
The structure and organization is described in section “Operational Risk Management” on page 71 in the 2017 Annual Report.
Reputational risk management structure and organization
The structure and organization of Reputational Risk Management is described in the section “Reputational Risk Management”on page 81 in the 2017 Annual Report.
Article 435 (1)(c) CRR - Scope and nature of risk reporting andmeasurement systemsThe nature of our Risk Reporting and Measurement Systems are described in the section “Risk Reporting and MeasurementSystems” on page 54 of the Annual Report 2017.
Scope and nature of credit risk reporting and measurement systems
The scope and nature of our credit risk reporting and measurement systems are described in the section “Risk Reporting andMeasurement Systems” on page 54 of the Annual Report 2017.
Scope and nature of market risk reporting and measurement systems
The scope and nature of our market risk reporting and measurement systems are described in the section “Risk Reporting andMeasurement Systems” on page 54 of the Annual Report 2017.
Scope and nature of liquidity risk reporting and measurement systems
The scope and nature of our liquidity risk reporting and measurement systems are described in the section “Liquidity Risk Man-agement” on page 76 and onwards of the Annual Report 2017. Specifically, the chapter “Liquidity Stress Testing and Scenarioanalysis” on page 77 covers the reporting of our internal liquidity stress tests, performed by the Liquidity Treasury Reporting andAnalysis (LTRA) department in Group Treasury, in conjunction with the Liquidity Management (LM) team in Group Treasuryand the Liquidity Risk Management (LRM) function within the Risk division. The chapter “Liquidity Risk Management Frame-work” on page 76 includes limit and risk appetite setting in accordance with Management Board approval, and also covers theannual review of risk appetite and Management Board reporting. The chapter “Capital Markets Issuance” on page 76 covers thereporting of planned and executed funding activities to the Management Board. The chapter “Liquidity Coverage Ratio” on page
11
Deutsche Bank Risk Management objectives and policiesPillar 3 Report 2017 Article 435 (1)(e) CRR - Declaration on the adequacy of risk management arrangements
78 covers external stress testing and the chapter “Structural Funding” on page 78 covers the funding matrix as DeutscheBank’s tool for management structural funding risk.
Scope and nature of business risk reporting and measurement systems
Please refer to the section “Capital Requirements”, chapter “Business Risk Economic Capital Model” on page 30 of the Pillar 3report.
Scope and nature of operational risk reporting and measurement systems
The risk reporting and measurement methodology are described in section “Operational Risk Management” on page 71 in the2017 Annual Report.
Scope and nature of reputational risk reporting and measurement systems
The scope and nature of our reputational risk reporting and measurement systems are described in the section “Risk Reportingand Measurement Systems” on page 54 of the Annual Report 2017.
Article 435 (1)(d) CRR - Policies for hedging and mitigating riskPolicies for hedging and mitigating credit risk
The section "Managing and mitigation of credit risk" on pages 61 to 65 in the Annual Report 2017 provides information on howour credit risk is hedged/mitigated on both counterparty and portfolio levels and exposures are disclosed in corporate credit riskand CPSG risk mitigation under pages 105 to 107 in the same report.
Policies for hedging and mitigating market risk
The approach to hedging and managing market risk is governed by policies explicitly designed to ensure that all hedging activi-ties are risk reducing, not proprietary in nature and are documented prior to trade execution. Hedging activities are reviewed bythe relevant business control forum. For a further description of the hedging approach for specific areas in the banking book,please refer to the section “Nontrading Market Risk” of the 2017 Annual Report on page 69.
Policies for hedging and mitigating liquidity risk
The policies for mitigating risk, and the strategies and processes for monitoring the continuing effectiveness of mitigants regard-ing liquidity risk are described in the section ‘Liquidity Risk Management’ on page 76 and onwards of the Annual Report 2017.Specifically this section covers Management Board risk appetite setting and approval, stable long-term funding from CapitalMarkets Issuances, the mitigation of short-term Liquidity and Wholesale Funding risks, daily internal liquidity stress testing andscenario analyses, external stress tests (i.e. the Liquidity Coverage Ratio) in order to promote short-term resilience, the mitiga-tion of structural funding risks by aligning liquidity supply and demand, Funding Diversification to mitigate concentration risks,Funds Transfer Pricing to promote the efficient allocation of liquidity across the Firm, Liquidity Reserves as a stress mitigant andthe level of Asset Encumbrance to prevent an over-reliance on secured funding.
Policies for hedging and mitigating operational risk
The risk mitigating processes regarding operational risk are described in section “Operational Risk Management” on page 71 inthe 2017 Annual Report. The hedging of operational risk is described in “Article 454 CRR - Use of the Advanced MeasurementApproaches to operational risk” on page 117 in this report.
Article 435 (1)(e) CRR - Declaration on the adequacy of riskmanagement arrangementsOur Management Board confirms, for the purpose of Article 435 CRR, that our risk management systems are adequate withregard to our risk profile and strategy.

12
Deutsche Bank Risk Management objectives and policiesPillar 3 Report 2017 Article 435 (2)(a) CRR - Number of directorships held by Board members
Article 435 (1)(f) CRR - Concise risk statement approved bythe BoardAll individual information aspects of the article are addressed in the 2017 Annual Report e.g. in the following combined set ofsections
Article 435 (1)(f) CRR requirements Reference sections from Deutsche Bank’s Annual Report 2017Risk Profile Overall Risk Assessment (page 44)
Risk Profile (page 44)Risk Reporting and Measurement Systems (page 54)
Business Strategy Our business strategy (page XV)Deutsche Bank Group (page 4)Risks and Opportunities (page 38)Strategic and Capital Plan (page 51)
Management of Risk Risk Management Principles and Governance (pages 46 to 50)Risk Reporting and Measurement Systems (page 54)Capital Management (page 57)Resource Limit Setting (page 57)Risk Identification and Assessment (page 58)Credit Risk Management (page 58)Market Risk Management (page 65)Operational Risk Management (page 81)Liquidity Risk Management (page 76)Strategic Risk Management (page 80)Reputational Risk Management (page 81)Model Risk Management (page 80)Risk Concentration & Diversification (page 81)
Risk Tolerances Risk Appetite and Capacity (page 50)
Key Ratios and Figures Risk Profile (page 44)Key Risk Metrics (page 43)Regulatory Capital (page 82)Economic Capital (page 92)Leverage Ratio (page 93)Credit Risk Exposure (page 95)Asset Quality (page 111)Trading Market Risk Exposures (page 119)Nontrading Market Risk Exposures (page 123)Operational Risk Exposure (page 125)Liquidity Risk Exposure (page 126)
The “concise statement” is fulfilled by Deutsche Bank’s Management Board signatures in section “Responsibility Statement bythe Management Board” in the Annual Report 2017 on page 352.
“To the best of our knowledge, and in accordance with the applicable reporting principles, the consolidated financial statementsgive a true and fair view of the assets, liabilities, financial position and profit or loss of the Group, and the Group managementreport includes a fair review of the development and performance of the business and the position of the Group, together with adescription of the principal opportunities and risks associated with the expected development of the Group.”
Article 435 (2)(a) CRR - Number of directorships held by BoardmembersThe number of directorships held by members of the management board is published in the section “Management Board” frompage 354 onwards in the Annual Report 2017.
13
Deutsche Bank Risk Management objectives and policiesPillar 3 Report 2017 Article 435 (2)(d-e) CRR - Risk Committee and information flow
Article 435 (2)(b) CRR - Recruitment policy for Board membersPlease refer to the section “Report of the supervisory board” and the sub-section therein “Nomination Committee” on page 365in our Annual Report 2017.
Article 435 (2)(c) CRR - Policy on diversity for Board membersPlease refer to the section "Diversity Concept" on Deutsche Bank's approach and processes to support diversity, includingdiversity objectives, targets and achievements in relation to the management bodies on page 374 in our Annual Report 2017.
Page 373 in our Annual Report 2017 refers in “Targets for the proportion of women in management positions/gender quota” toDeutsche Bank’s approach to the proportion of women in Supervisory Board as well as Management Board. It also showstargets for the first and second level reporting to the Management Board.
On page 354 in our Annual Report 2017, we provide information on duties and responsibilities and procedures of the Manage-ment Board including a reference to the respective Terms of Reference (ToR) link.
The Management Board ToR §5 (9) states inter alia: "In appointing people to management functions in the Group, the Man-agement Board takes diversity into account and strives, in particular, to achieve an appropriate representation of women".Pages 359 to 364 in our Annual Report 2017 provide similar information for the Supervisory Board with specific information onpage 362 on “Objectives for the composition of the Supervisory Board and status of implementation”.
Article 435 (2)(d-e) CRR - Risk Committee and information flowDedicated risk committees are in place both on Supervisory Board level (the Risk Committee of the Supervisory Board) as wellas on Management Board level (the Group Risk Committee, “GRC”).
Please refer to our Annual Report 2017, page VII, chapter “Report of the Supervisory Board”, section “The Committees of theSupervisory Board”, paragraph “Risk Committee” for the number of meetings the Risk Committee of the Supervisory Board heldin 2017.
Please refer to the “Risk Report” in our Annual Report 2017, page 41, chapter “Risk and Capital Framework”, section “RiskGovernance” for the regular meeting schedule of the Group Risk Committee in 2017.
Please refer to the “Risk Report” in our Annual Report 2017, page 41, chapter “Risk and Capital Framework”, section “RiskReporting and Measurement Systems” for a description of the information flow.

14
Deutsche Bank Scope of application of the regulatory frameworkPillar 3 Report 2017 Article 436 (b) CRR - Difference in basis of consolidation for accounting and prudential purposes
Scope of application of the regulatory framework
Article 436 (a) CRR - Name of the institutionDeutsche Bank Aktiengesellschaft (“Deutsche Bank AG”), headquartered in Frankfurt am Main, Germany, is the parent institu-tion of the Deutsche Bank Group of institutions (the “regulatory group”), which is subject to the supervisory provisions of theKWG and the SolvV, including the references to the CRR and CRD 4. Under Section 10a KWG in conjunction with Articles 11and 18 CRR, a regulatory group of institutions consists of an institution (meaning a credit institution or an investment firm) asthe parent company, and all other institutions and financial institutions (comprising inter alia financial holding companies, pay-ment institutions, asset management companies) that are its subsidiaries within the meaning of Article 4 (16) CRR or are jointlymanaged together with other parties within the meaning of Article 18 (4) CRR or are included. Subsidiaries are fully consolidat-ed, while companies which are not subsidiaries are consolidated on a pro-rata basis.
Insurance companies and companies outside the banking and financial sector are not consolidated in the regulatory group ofinstitutions. We were designated by the BaFin as a financial conglomerate in November 2007. However, subsequent to our saleof our most material insurance entity Abbey Life Assurance Company Limited effective December 30, 2016, the ECB confirmedto us in April 2017 that we do not qualify as a financial conglomerate anymore and are no longer subject to the respective sup-plementary supervisions.
Article 436 (b) CRR - Difference in basis of consolidation foraccounting and prudential purposesThe principles of consolidation for our regulatory group are not identical to those applied for our financial statements. Nonethe-less, the majority of our subsidiaries in the regulatory group are also fully consolidated in accordance with IFRS in our consoli-dated financial statements.
The main differences between regulatory and accounting consolidation are:
‒ Subsidiaries outside the banking and financial sector are not consolidated within the regulatory group of institutions, but areincluded in the consolidated financial statements according to IFRS.
‒ Most of our Special Purpose Entities (“SPEs”) consolidated under IFRS do not meet the regulatory subsidiary definitionpursuant to Article 4 (1) (16) CRR and were consequently not consolidated within our regulatory group. However, the risksresulting from our exposures to such entities are reflected in the regulatory capital requirements.
‒ Only a few entities included in the regulatory group are not consolidated as subsidiaries for accounting purposes but aretreated differently: four, mostly immaterial subsidiaries which were not consolidated for accounting purposes were consoli-dated within the regulatory group; one further entity was jointly managed by us and other owners and was consolidated on apro-rata basis within the regulatory group while for financial accounting purposes it was treated as an available-for-sale-asset.
As of year-end 2017, our regulatory group comprised 535 entities (excluding the parent Deutsche Bank AG), of which one wasconsolidated on a pro-rata basis. The regulatory group comprised 92 credit institutions, one payment institution, 52 financialservices institutions, 262 financial enterprises, seven asset management companies and 121 ancillary services undertakings.
As of year-end 2016, our regulatory group comprised 580 entities (excluding the parent Deutsche Bank AG), of which four wereconsolidated on a pro-rata basis. The regulatory group comprised 95 credit institutions, one payment institution, 56 financialservices institutions, 287 financial enterprises, seven asset management companies and 134 ancillary services undertakings.
74 entities were exempted from regulatory consolidation pursuant to Section 31 (3) KWG in conjunction with Article 19 CRR asper year end 2017 (year end 2016: 85 entities). These regulations allow the exclusion of small entities in the regulatory scope ofapplication from consolidated regulatory reporting if either their total assets (including off-balance sheet items) are below€ 10 million or below 1 % of our Group’s total assets. None of these entities needed to be consolidated in our financial state-ments in accordance with IFRS.

15
Deutsche Bank Scope of application of the regulatory frameworkPillar 3 Report 2017 Article 436 (b) CRR - Difference in basis of consolidation for accounting and prudential purposes
These regulatory unconsolidated entities have to be included in the deduction treatment for significant investments in financialsector entities pursuant to Article 36 (1) (i) CRR in conjunction with Article 43 (c) CRR. The book values of our participations intheir equity included in the deduction treatment amounted to in total € 10 million as per year end 2017 (year end 2016:€ 12 million). We further have applied the deduction treatment to 208 regulatory unconsolidated entities in the financial sector(including three insurance entities) where we have an investment of more than 10 % of the capital of these entities as per yearend 2017 (year end 2016: 220 entities). Pursuant to Article 36 (1) (i) CRR and in conjunction with Article 48 CRR, investmentsin the capital of financial sector entities have to be deducted from CET 1 capital if they exceed in sum 10 % of the institution’sown CET 1 capital or if they exceed in aggregate with deferred tax assets that rely on future profitability and arise from tempo-rary differences 15 % of the relevant CET 1 capital.
The table EU LI1 below provides an outline of the difference in the basis of consolidation for accounting and prudential purpos-es and also breaks down how the amounts reported in our financial statements, once the regulatory scope of consolidation isapplied, are to be allocated to the different risk frameworks laid out in Part Three of the CRR. Consequently we split our regula-tory balance sheet into the parts subject to credit risk, counterparty credit risk, securitization positions in the regulatory bankingbook, market risk as well as the part which is not subject to capital requirements or deduction from capital. The market riskframework in column (f) includes our trading book exposure, our banking book exposure which is booked in a currency differentfrom Euro as well as securitization positions in the regulatory trading book. Specific assets and liabilities may be subject to morethan one regulatory risk framework, therefore the sum of values in in column (c) to (g) may not equal to that in column (b).Moreover the allocation of positions to the regulatory trading or banking book as well as the product definition impacts the allo-cation to and treatment within a regulatory framework and might be different to the product definition or trading classificationunder the accounting framework.
Differences between carrying values on the regulatory balance sheet in column (b) and amounts deducted from CRR/CRD 4capital are explained further in the footnotes of the “Transitional template for regulatory capital, RWA and capital ratios” asreferenced in the last column of this table.
EU LI1 – Differences between accounting and regulatory scopes of consolidation and the mapping of financial statement categorieswith regulatory risk categories
Dec 31, 2017a b c d e f g
Carrying values of items:
in € m.
Carrying values asreported in published financialstatements
Carrying valuesunder scopeof regulatory consoli-
dation
Subject to the credit
risk framework
Subject tothe
counterparty credit risk framework
Subject to the securi- tization framework
Subject tothe market
risk framework
Not subjectto capital re-quirements or subjectto deductionfrom capital
References1
Assets:Cash and central bank balances 225,655 225,579 225,363 0 0 97,549 0Interbank balances (w/o central banks) 9,266 8,244 7,564 0 0 6,782 0Central bank funds sold and securities purchasedunder resale agreements 9,972 9,972 74 9,897 0 4,338 0Securities borrowed 16,732 16,732 0 16,718 0 16,258 0Financial assets at fair value through profit or loss
Thereof:Trading assets 184,661 183,942 11,359 0 211 183,683 50Positive market values from derivative financialinstruments 361,033 363,010 299 360,731 371 361,865 0Financial assets designated at fair value throughprofit or loss 91,276 90,259 11,936 78,138 0 85,737 0
Total financial assets at fair value through profit orloss 636,970 637,213 23,594 438,869 582 631,286 50Financial assets available for sale 49,397 53,055 51,836 0 143 25,216 0Equity method investments 866 854 854 0 0 853 64
Thereof: Goodwill 64 64 0 0 0 0 64 ELoans 401,699 403,271 376,164 10,896 15,459 138,596 5Securities held to maturity 3,170 3,170 3,170 0 0 0 0Property and equipment 2,662 2,612 2,612 0 0 373 0Goodwill and other intangible assets 8,839 8,635 0 0 0 0 8,635 EOther assets 101,491 102,859 8,429 61,222 56 44,946 20,377
Thereof: Defined benefit pension fund assets 1,124 1,125 0 0 0 0 1,125 GAssets for current tax 1,215 1,203 1,203 0 0 0 0Deferred tax assets 6,799 6,777 3,846 0 0 0 2,931 FTotal assets 1,474,732 1,480,174 704,708 537,603 16,241 966,198 32,063

16
Deutsche Bank Scope of application of the regulatory frameworkPillar 3 Report 2017 Article 436 (b) CRR - Difference in basis of consolidation for accounting and prudential purposes
Dec 31, 2017a b c d e f g
Carrying values of items:
in € m.
Carrying values asreported in published financialstatements
Carrying valuesunder scopeof regulatory consoli-
dation
Subject to the credit
risk framework
Subject tothe
counterparty credit risk framework
Subject to the securi- tization framework
Subject tothe market
risk framework
Not subjectto capital re-quirements or subjectto deductionfrom capital
References1
Liabilities and equity:Deposits 580,812 584,998 0 9,674 48 87,637 487,639Central bank funds purchased and securities soldunder repurchase agreements 18,105 18,105 0 18,106 0 16,465 0Securities loaned 6,689 6,689 0 6,689 0 6,581 0Financial liabilities at fair value through profit or loss
Thereof:Trading liabilities 71,463 71,448 0 493 0 70,885 69Negative market values from derivative financialinstruments 342,726 344,487 0 343,960 138 343,591 88Financial liabilities designated at fair valuethrough profit or loss 63,874 63,463 0 63,030 0 63,462 0Investment contract liabilities 574 0 0 0 0 0 0
Total financial liabilities at fair value through profit orloss 478,636 479,398 0 408,009 138 477,939 158Other short-term borrowings 18,411 18,169 0 0 0 1,549 16,620Other liabilities 132,207 132,102 0 84,043 0 46,526 19,950Provisions 5,219 5,178 0 0 0 1,105 4,074Liabilities for current tax 1,000 986 0 0 0 857 128Deferred tax liabilities 346 280 0 0 0 0 280Long-term debt 159,715 160,818 0 0 0 12,713 148,105
Thereof: Subordinated long-term debt2 8,100 8,100 0 0 0 828 7,272 I.JTrust preferred securities2 5,492 5,492 0 0 0 4,577 915 I.JObligation to purchase common shares 0 0 0 0 0 0 0Total liabilities 1,406,633 1,412,216 0 525,995 186 655,949 677,869Common shares, no par value, nominal value of €2.56 5,291 5,291 0 0 0 0 5,291 AAdditional paid-in capital 39,918 39,913 0 0 0 0 39,913 ARetained earnings 17,454 17,226 0 0 0 0 17,226 BCommon shares in treasury, at cost (8) (8) 0 0 0 0 (8) AEquity classified as obligation to purchase commonshares 0 0 0 0 0 0 0 AAccumulated other comprehensive income, net oftax 519 696 0 0 0 0 696 CTotal shareholders’ equity 63,174 63,117 0 0 0 0 63,117Additional equity components 4,675 4,675 0 0 0 0 4,675 HNoncontrolling interests 250 167 0 0 0 0 167 DTotal equity 68,099 67,959 0 0 0 0 67,959Total liabilities and equity 1,474,732 1,480,174 0 525,995 186 655,949 745,8281 References provide the mapping of regulatory balance sheet items used to calculate regulatory capital as reflected in the column “References” in “Transitional template forRegulatory Capital, RWA and Capital Ratios”. Where applicable, more detailed information are provided in the respective reference footnote section.2 Eligible Additional Tier 1 and Tier 2 instruments are reflected in these balance sheet positions with their values according to IFRS.

17
Deutsche Bank Scope of application of the regulatory frameworkPillar 3 Report 2017 Article 436 (e) CRR - Derogations from prudential or liquidity requirements for subsidiaries
Table EU LI2 presents description of the differences between the financial statements’ carrying value amounts under the regu-latory scope of consolidation and the exposure amounts used for regulatory purposes.
EU LI2 – Main sources of differences between regulatory exposure amounts and carrying values in financial statementsDec 31, 2017
a b c d eItems subject to:
in € m. TotalCredit risk
framework
Counterpartycredit risk
framework Securitization framework
Market risk framework
1 Asset carrying value amount under the regulatory scopeof consolidation (as per template EU LI1) 1,480,174 704,708 537,603 16,241 966,198
2 Liabilities carrying value amount under the regulatory scopeof consolidation (as per template EU LI1) 1,412,215 0 525,995 186 655,949
3 Total net amount under the regulatory scope of consolidation 67,959 704,708 11,608 16,056 310,2485
4 Off-balance-sheet amounts 250,252 234,145 4,362 10,228 0
5a Differences in valuations for derivatives and SFT (incl.impact from different netting rules)1 – 0 190,148 337 0
5b Differences in valuations for securitization positions2 – (20,507) (2,193) 36,182 2,0285c Differences in valuations for off-balance sheet amounts – (131,833) 0 0 0
6 Differences due to financial collateral considered instandardized approach – (2,490) (708) 0 0
7 Differences due to consideration of provisions3 – 4,521 0 0 08 Differences due to dilution risk – 6,066 0 0 09 Other differences4 – 7,205 3,282 0 010 Exposure amounts considered for regulatory purposes 1,077,058 801,815 206,499 62,802 5,9426
1 Includes effects due to differences in exposure modelling applying the effective expected positive exposure (EEPE) as well as the mark to market method for derivatives andfinancial collateral comprehensive method for SFT respectively; that also reflects differences as a result of the application of credit risk mitigation and regulatory netting rules.
2 Included in the sum of € 36.2 billion are € 14.3 billion resulting from synthetic securitizations where CCF are set to a level of 1 and FX mismatches have to be consideredamounting to € 1.3 billion. The amount represents the retained synthetic tranches after consideration of bought credit protection.
3 Includes credit-risk related purchase price adjustments arising in the context of asset purchases as well as business combinations.4 Primarily reflects valuation differences as a result of regulatory product definition being different from the accounting product definition; moreover under the counterparty credit
risk framework funded default fund contribution in form of securities are considered in the exposure amounts for regulatory purposes.5 Included in the sum of € 310.3 bn are € 3.9 bn net carrying amount attributable to securitization positions in the regulatory trading book covered under the market risk
standardized approach.6 Exposure at default is only considered for securitization positions in the regulatory trading book as the remaining exposure is considered within the internally developed market
risk models.
For table EU LI3 which provides an outline of the differences in the scopes of consolidation on an entity-by-entity-basis pleaserefer to Note 45 “Shareholdings” in our Annual Report 2017 on the pages 322 to 343.
Article 436 (c) CRR - Impediments to fund transfersThe Group entities within the scope of prudential consolidation are subject to local regulatory and tax requirements as well aspotentially exchange controls. We are not aware of any material impediments existing for capital distribution within the Group.
Article 436 (d) CRR - Potential capital shortfalls in unconsoli-dated subsidiariesOur subsidiaries which were not included in our regulatory consolidation due to their immateriality did not have to comply withown minimum capital standards in 2017.
Article 436 (e) CRR - Derogations from prudential or liquidityrequirements for subsidiariesAs of December 31, 2017, Deutsche Bank AG fully applied the exemptions pursuant to Section 2a (1) KWG in conjunction withArticle 7 (3) CRR, Art. 6 (5) CRR and Section 2a (2) KWG in conjunction with Section 25a (1) sentence 3 KWG (so-called “par-ent waiver”) pursuant to which it may waive the application of provisions on own funds (Part II CRR), capital requirements(Part III CRR), large exposures (Part IV CRR), exposures to transferred credit risks (Part V CRR), leverage (Part VII CRR) anddisclosure by institutions (Part VIII CRR) as well as certain risk management requirements (Section 25a (1) sentence 3 KWG)on a stand-alone basis.

18
Deutsche Bank Scope of application of the regulatory frameworkPillar 3 Report 2017 Article 436 (e) CRR - Derogations from prudential or liquidity requirements for subsidiaries
Deutsche Bank AG’s subsidiaries Deutsche Bank Privat- und Geschäftskunden AG, norisbank GmbH, Deutsche Bank EuropeGmbH and Sal. Oppenheim jr. & Cie. AG & Co. KGaA, which all were consolidated within the Deutsche Bank regulatory group,fully applied the exemptions pursuant to Section 2a (1) KWG in conjunction with Article 7 (1) CRR, Art. 6 (5) CRR and Sec-tion 2a (2) KWG in conjunction with Section 25a (1) sentence 3 KWG (so-called “subsidiary waiver”) pursuant to which theymay waive certain regulatory requirements to the same extent as Deutsche Bank AG (see preceding paragraph) on a stand-alone basis. In addition, Deutsche Bank AG’s subsidiaries Deutsche Immobilien Leasing GmbH and Leasing Ver-waltungsgesellschaft Waltersdorf mbH, also consolidated within the Deutsche Bank regulatory group, applied the “subsidiarywaiver” rules to the extent applicable to them, i.e. with regard to certain risk management requirements pursuant to Section 25a(1) sentence 3 KWG.
These exemptions are available only for group companies in Germany and can only be applied if, amongst others, the riskstrategies and risk management processes of Deutsche Bank AG or the Group also include the companies that apply the“waiver” rules and there is no material practical or legal impediment to the prompt transfer of own funds or repayment of liabili-ties from Deutsche Bank AG to the respective subsidiaries or from subsidiaries in the Group to Deutsche Bank AG.
The application of the aforementioned exemptions and the fulfillment of the respective requirements were notified to the BaFinand Deutsche Bundesbank on the basis of Section 2a (1) or (6) KWG in its version applicable until December 31, 2013. Pursu-ant to Section 2a (5) KWG the exemptions based on these notifications are grandfathered, i.e. the “waivers” are deemed to begranted under the current CRR and KWG rules.
Article 18 CRR Additional Disclosure Requirements for Significant Subsidiaries
In line with Article 13 (1) CRR our significant subsidiaries and those subsidiaries which are of significance for their local marketare required to disclose information to the extent applicable in respect of own funds, capital requirements, capital buffers, creditrisk adjustments, remuneration policy, leverage and use of credit risk mitigation techniques on an individual or sub-consolidatedbasis.
For some of our subsidiaries located in Germany it is not mandatory to calculate or report regulatory capital or leverage ratioson a stand-alone basis if they qualify for the exemptions codified in the waiver rule pursuant to Section 2a KWG in conjunctionwith Article 7 CRR. In these cases, the above-mentioned disclosure requirements are also not applicable for those subsidiaries.
In order to identify significant subsidiaries a catalogue of criteria has been developed, applied to all subsidiaries classified as“credit institution” or “investment firm” under the CRR and not qualifying for a waiver status pursuant to Section 2a KWG inconjunction with Article 7 CRR. A subsidiary is required to comply with the requirements in Article 13 CRR (as described above)if at least one criterion mentioned in the list below has been met. The criteria have been defined in relation to our businessactivities as well as the complexity and risk profile of the respective subsidiary. All figures referenced below are calculated on anIFRS basis as of December 31, 2016:
‒ Total Assets of € 30 billion or more (on individual or sub-consolidated basis)‒ Five percent or more of our risk-weighted assets on group level‒ 20 percent or more of the gross domestic product in its respective country, in which the subsidiary is located, but at least
total assets of € five billion (on individual or sub-consolidated basis)‒ Institutions directly supported by the European Stability Mechanism (ESM), European Financial Stability Facility (EFSF) or
similar mechanisms‒ Institutions belonging to the three largest institutions in their respective countries, in which the subsidiary is located (referring
to the amount of total assets)‒ Classification as “local systemically important institution” by the local competent authority
None of our subsidiaries have received support from any kind of stability mechanism.
As a result of the selection process described above, we identified three subsidiaries as “significant” for the Group and hencerequired to provide additional disclosure requirements as laid down in Article 13 CRR:
‒ Deutsche Postbank AG, Germany‒ Deutsche Bank Luxembourg S.A., Luxembourg‒ DB USA Corporation, United States of America
The additional disclosures for our significant subsidiaries in relation to Article 13 CRR can be found either within the Pillar 3Reports of the respective subsidiary as published on its website or on the Group’s website for DB USA Corporation.

19
Deutsche Bank Own fundsPillar 3 Report 2017 Capital Adequacy
Own funds
Capital AdequacyThe calculation of our regulatory capital incorporates the capital requirements following the “Regulation (EU) No 575/2013 onprudential requirements for credit institutions and investment firms” (Capital Requirements Regulation or “CRR”) and the “Di-rective 2013/36/EU on access to the activity of credit institutions and the prudential supervision of credit institutions and invest-ment firms” (Capital Requirements Directive 4 or “CRD 4”) as implemented into German law. The information in this section aswell as in the section “Article 438 (c-f) CRR - Overview of capital requirements” is based on the regulatory principles of consoli-dation.
This section refers to the capital adequacy of the group of institutions consolidated for banking regulatory purposes pursuant tothe CRR and the German Banking Act (“Kreditwesengesetz” or “KWG”). Therein not included are insurance companies orcompanies outside the finance sector.
The total regulatory capital pursuant to the effective regulations as of year-end 2017 comprises Tier 1 and Tier 2 (T2) capital.Tier 1 capital is subdivided into Common Equity Tier 1 (CET 1) capital and Additional Tier 1 (AT1) capital.
Common Equity Tier 1 (CET 1) capital consists primarily of common share capital (reduced by own holdings) including relatedshare premium accounts, retained earnings (including losses for the financial year, if any) and accumulated other comprehen-sive income, subject to regulatory adjustments (i.e. prudential filters and deductions). Prudential filters for CET 1 capital, accord-ing to Articles 32 to 35 CRR, include (i) securitization gain on sale, (ii) cash flow hedges and changes in the value of ownliabilities, and (iii) additional value adjustments. CET 1 capital deductions comprise (i) intangible assets, (ii) deferred tax assetsthat rely on future profitability, (iii) negative amounts resulting from the calculation of expected loss amounts, (iv) net definedbenefit pension fund assets, (v) reciprocal cross holdings in the capital of financial sector entities and, (vi) significant and non-significant investments in the capital (CET 1, AT1, T2) of financial sector entities above certain thresholds. All items not deduct-ed (i.e., amounts below the threshold) are subject to risk-weighting.
Additional Tier 1 (AT1) capital consists of AT1 capital instruments and related share premium accounts as well as noncontrol-ling interests qualifying for inclusion in consolidated AT1 capital, and during the transitional period grandfathered instrumentseligible under earlier frameworks. To qualify as AT1 capital under CRR/CRD 4, instruments must have principal loss absorptionthrough a conversion to common shares or a write-down mechanism allocating losses at a trigger point and must also meetfurther requirements (perpetual with no incentive to redeem; institution must have full dividend/coupon discretion at all times,etc.).
Tier 2 (T2) capital comprises eligible capital instruments, the related share premium accounts and subordinated long-term debt,certain loan loss provisions and noncontrolling interests that qualify for inclusion in consolidated T2 capital. To qualify as T2capital, capital instruments or subordinated debt must have an original maturity of at least five years. Moreover, eligible capitalinstruments may inter alia not contain an incentive to redeem, a right of investors to accelerate repayment, or a credit sensitivedividend feature.
Capital instruments that no longer qualify as AT1 or T2 capital under the CRR/CRD 4 fully loaded rules are subject to grandfa-thering rules during transitional period and are phased out from 2013 to 2022 with their recognition cappedat 50 % in 2017 and the cap decreasing by 10 % every year.

20
Deutsche Bank Own fundsPillar 3 Report 2017 Article 437 (1)(a) CRR - Regulatory capital composition
Article 437 (1)(a) CRR - Regulatory capital compositionTransitional template for regulatory capital, RWA and capital ratios
Dec 31, 2017 Dec 31, 2016
in € m. CRR/CRD 4 fully-loaded CRR/CRD 4
CRR/CRD 4 fully loaded CRR/CRD 4
Refe- rences1
Common Equity Tier 1 (CET 1) capital: instruments and reservesCapital instruments and the related share premium accounts 45,195 45,195 37,290 37,290 A
Thereof: Ordinary shares2 45,195 45,195 37,290 37,290 ARetained earnings 17,977 17,977 20,113 20,113 BAccumulated other comprehensive income (loss), net of tax 696 660 3,708 3,645 CFunds for general banking risk 0 0 0 0Amount of qualifying items referred to in Art. 484 (3) CRR and the relatedshare premium accounts subject to phase-out from CET 1 N/M 0 N/M 0Public sector capital injections grandfathered until January 1, 2018 N/M N/M N/M N/MNoncontrolling Interests (amount allowed in consolidated CET 1) 0 33 0 79 DIndependently reviewed interim profits net of any foreseeable charge ordividend3 (751) (751) (2,023) (2,023) B
Common Equity Tier 1 (CET 1) capital before regulatory adjustments 63,116 63,114 59,088 59,104
Common Equity Tier 1 (CET 1) capital: regulatory adjustmentsAdditional value adjustments (negative amount)4 (1,204) (1,204) (1,398) (1,398)Goodwill and other intangible assets (net of related tax liabilities) (nega-tive amount) (8,394) (6,715) (8,436) (5,062) EDeferred tax assets that rely on future profitability excluding those arisingfrom temporary differences (net of related tax liabilities where the condi-tions in Art. 38 (3) CRR are met) (negative amount) (3,004) (2,403) (3,854) (2,312) FFair value reserves related to gains or losses on cash flow hedges (28) (28) (195) (195)Negative amounts resulting from the calculation of expected loss amounts (502) (408) (297) (188)Any increase in equity that results from securitized assets (negativeamount) (2) (2) (5) (5)Gains or losses on liabilities designated at fair value resulting fromchanges in own credit standing5 (73) (45) (440) (228)Defined benefit pension fund assets (negative amount) (1,125) (900) (945) (567) GDirect, indirect and synthetic holdings by an institution of own CET 1 in-struments (negative amount)6 (144) (117) (59) (41)Direct, indirect and synthetic holdings of the CET 1 instruments of finan-cial sector entities where those entities have reciprocal cross holdingswith the institution designed to inflate artificially the own funds of the insti-tution (negative amount) 0 0 0 0Direct, indirect and synthetic holdings by the institution of the CET 1 in-struments of financial sector entities where the institution does not have asignificant investment in those entities (amount above the 10 % thresholdand net of eligible short positions) (negative amount)7 0 0 0 0Direct, indirect and synthetic holdings by the institution of the CET 1 in-struments of financial sector entities where the institution has a significantinvestment in those entities (amount above 10 % threshold and net ofeligible short positions) (negative amount) 0 0 0 0Exposure amount of the following items which qualify for a risk weight of1250 %, where the institution opts for the deduction alternative 0 0 0 0
Thereof:Qualifying holdings outside the financial sector (negative amount) 0 0 0 0Securitization positions (negative amount) 0 0 0 0Free deliveries (negative amount) 0 0 0 0
Deferred tax assets arising from temporary differences (amount above10 % threshold, net of related tax liabilities where the conditions in Art. 38(3) CRR are met) (negative amount) 0 0 (590) (354) F
Amount exceeding the 15 % threshold (negative amount) 0 0 0 0Thereof:Direct, indirect and synthetic holdings by the institution of the CET 1 in-struments of financial sector entities where the institution has a signifi-cant investment in those entities 0 0 0 0Deferred tax assets arising from temporary differences 0 0 0 0 F
Losses for the current financial year (negative amount) 0 0 0 0Regulatory adjustments applied to CET 1 capital in respect of amountssubject to pre-CRR treatment: N/M 0 N/M 0Regulatory adjustments relating to unrealized gains and losses pursuantto Art. 467 and 468 CRR N/M (144) N/M (380)Amount to be deducted from or added to CET 1 capital with regard toadditional filters and deductions required pre CRR8 (19) (19) (231) (231)Qualifying AT1 deductions that exceed the AT1 capital of the institution(negative amount) 0 0 0 0Other regulatory adjustments (322) (322) (360) (360)

21
Deutsche Bank Own fundsPillar 3 Report 2017 Article 437 (1)(a) CRR - Regulatory capital composition
Dec 31, 2017 Dec 31, 2016
in € m. CRR/CRD 4 fully-loaded CRR/CRD 4
CRR/CRD 4 fully loaded CRR/CRD 4
Refe- rences1
Total regulatory adjustments to Common Equity Tier 1 (CET 1) capital (14,816) (12,306) (16,810) (11,321)Common Equity Tier 1 (CET 1) capital 48,300 50,808 42,279 47,782
Additional Tier 1 (AT1) capital: instrumentsCapital instruments and the related share premium accounts 4,676 4,676 4,676 4,676 H
Thereof:Classified as equity under applicable accounting standards 4,676 4,676 4,676 4,676 HClassified as liabilities under applicable accounting standards 0 0 0 0
Amount of qualifying items referred to in Art. 484 (4) CRR and the relatedshare premium accounts subject to phase out from AT1 N/M 3,904 N/M 6,516 IPublic sector capital injections grandfathered until January 1, 2018 N/M N/M N/M N/MTier 1 capital included in consolidated AT1 capital issued by subsidiariesand held by third parties 0 0 0 0
Thereof: instruments issued by subsidiaries subject to phase out N/M 0 N/M 0Additional Tier 1 (AT1) capital before regulatory adjustments 4,676 8,579 4,676 11,191
Additional Tier 1 (AT1) capital: regulatory adjustmentsDirect, indirect and synthetic holdings by an institution of own AT1 instru-ments (negative amount) (55) (26) (125) (51) HDirect, indirect and synthetic holdings of the AT1 instruments of financialsector entities where those entities have reciprocal cross holdings with theinstitution designed to inflate artificially the own funds of the institution(negative amount) 0 0 0 0Direct, indirect and synthetic holdings of the AT1 instruments of financialsector entities where the institution does not have a significant investmentin those entities (amount above the 10 % threshold and net of eligibleshort positions) (negative amount)7 0 0 0 0Direct, indirect and synthetic holdings by the institution of the AT1 instru-ments of financial sector entities where the institution has a significantinvestment in those entities (amount above the 10 % threshold net of eli-gible short positions) (negative amount) 0 0 0 0Regulatory adjustments applied to AT1 capital in respect of amounts sub-ject to pre-CRR treatment and transitional treatments subject to phase outas prescribed in CRR (i.e., residual amounts) N/M 0 N/M 0Residual amounts deducted from AT1 capital with regard to deductionfrom CET 1 capital during the transitional period pursuant to Art. 472 CRR N/M (1,730) N/M (3,437)
Thereof:Goodwill and other intangible assets (net of related tax liabilities) N/M (1,679) N/M (3,375) ENegative amounts resulting from the calculation of expected lossamounts N/M (51) N/M (63)Direct, indirect and synthetic holdings by the institution of the CET 1 in-struments of financial sector entities where the institution has a signifi-cant investment in those entities N/M 0 N/M 0
Residual amounts deducted from AT1 capital with regard to deductionfrom Tier 2 (T2) capital during the transitional period pursuant to Art. 475CRR N/M 0 N/M 0Amount to be deducted from or added to AT1 capital with regard to addi-tional filters and deductions required pre CRR N/M 0 N/M 0Qualifying T2 deductions that exceed the T2 capital of the institution(negative amount) 0 0 0 0
Total regulatory adjustments to Additional Tier 1 (AT1) capital (55) (1,756) (125) (3,488)Additional Tier 1 (AT1) capital 4,621 6,823 4,551 7,703Tier 1 capital (T1 = CET 1 + AT1) 52,921 57,631 46,829 55,486
Tier 2 (T2) capital: instruments and provisionsCapital instruments and the related share premium accounts9 10,272 6,348 12,492 6,464 JAmount of qualifying items referred to in Art. 484 (5) CRR and the relatedshare premium accounts subject to phase out from T2 N/M 0 N/M 0 JPublic sector capital injections grandfathered until January 1, 2018 N/M N/M N/M N/MQualifying own funds instruments included in consolidated T2 capital is-sued by subsidiaries and held by third parties 159 187 435 524 J
Thereof: instruments issued by subsidiaries subject to phase out N/M 0 N/M 0Credit risk adjustments 0 0 0 0
Tier 2 (T2) capital before regulatory adjustments 10,432 6,536 12,927 6,988

22
Deutsche Bank Own fundsPillar 3 Report 2017 Article 437 (1)(a) CRR - Regulatory capital composition
Dec 31, 2017 Dec 31, 2016
in € m. CRR/CRD 4 fully-loaded CRR/CRD 4
CRR/CRD 4 fully loaded CRR/CRD 4
Refe- rences1
Tier 2 (T2) capital: regulatory adjustmentsDirect, indirect and synthetic holdings by an institution of own T2 instru-ments and subordinated loans (negative amount) (102) (100) (254) (253) JDirect, indirect and synthetic holdings of the T2 instruments and subordi-nated loans of financial sector entities where those entities have recipro-cal cross holdings with the institution designed to inflate artificially the ownfunds of the institution (negative amount) 0 0 0 0Direct, indirect and synthetic holdings of the T2 instruments and subordi-nated loans of financial sector entities where the institution does not havea significant investment in those entities (amount above 10 % thresholdand net of eligible short positions) (negative amount)7 0 0 0 0
Thereof:New holdings not subject to transitional arrangements N/M N/M N/M N/MHoldings existing before January 1, 2013 and subject to transitional ar-rangements N/M N/M N/M N/M
Direct, indirect and synthetic holdings by the institution of the T2 instru-ments and subordinated loans of financial sector entities where the institu-tion has a significant investment in those entities (net of eligible shortpositions) (negative amount) 0 0 0 0Regulatory adjustments applied to Tier 2 in respect of amounts subject topre-CRR treatment and transitional treatments subject to phase-out asprescribed in CRR (i.e., residual amounts) N/M 0 N/M 0Residual amounts deducted from Tier 2 capital with regard to deductionfrom Common Equity Tier 1capital during the transitional period pursuant to Art. 472 CRR N/M (51) N/M (63)
Thereof:Negative amounts resulting from the calculation of expected lossamounts N/M (51) N/M (63)Direct, indirect and synthetic holdings by the institution of the CET 1 in-struments of financial sector entities where the institution has a signifi-cant investment in those entities N/M 0 N/M 0
Residual amounts deducted from Tier 2 capital with regard to deductionfrom Additional Tier 1 capital during the transitional period pursuant to Art.475 CRR N/M 0 N/M 0
Thereof:Reciprocal cross holdings in AT1 instruments N/M 0 N/M 0Direct holdings of nonsignificant investments in the capital of other fi-nancial sector entities N/M 0 N/M 0
Amount to be deducted from or added to Tier 2 capital with regard to addi-tional filters and deductions required pre-CRR 0 0 0 0
Total regulatory adjustments to Tier 2 (T2) capital (102) (151) (254) (316)Tier 2 (T2) capital 10,329 6,384 12,673 6,672Total capital (TC = T1 + T2) 63,250 64,016 59,502 62,158
Risk-weighted assets in respect of amounts subject to pre-CRR treatmentand transitional treatments subject to phase-out as prescribed in CRR(i.e., residual amounts)10 N/M 0 N/M 0
Thereof:Items not deducted from CET 1 (CRR residual amounts) N/M 0 N/M 0Items not deducted from AT1 items (CRR residual amounts) N/M 0 N/M 0Items not deducted from T2 items (CRR residual amounts) N/M 0 N/M 0
Thereof:Indirect and synthetic holdings of own T2 instruments N/M 0 N/M 0Indirect and synthetic holdings of nonsignificant investments in thecapital of other financial sector entities N/M 0 N/M 0Indirect and synthetic holdings of significant investments in the capitalof other financial sector entities N/M 0 N/M 0
Total risk-weighted assets 344,212 343,316 357,518 356,235Thereof:Credit Risk (including Settlement Risk) 215,184 214,288 221,665 220,381Credit Valuation Adjustment (CVA) 6,451 6,451 9,416 9,416Market Risk 30,966 30,966 33,762 33,762Operational Risk 91,610 91,610 92,675 92,675
Capital ratios and buffersCommon Equity Tier 1 capital ratio (as a percentage of risk-weighted as-sets) 14.0 14.8 11.8 13.4Tier 1 capital ratio (as a percentage of risk-weighted assets) 15.4 16.8 13.1 15.6Total capital ratio (as a percentage of risk-weighted assets) 18.4 18.6 16.6 17.4

23
Deutsche Bank Own fundsPillar 3 Report 2017 Article 437 (1)(a) CRR - Regulatory capital composition
Dec 31, 2017 Dec 31, 2016
in € m. CRR/CRD 4 fully-loaded CRR/CRD 4
CRR/CRD 4 fully loaded CRR/CRD 4
Refe- rences1
Institution specific buffer requirement (CET 1 requirement in accordancewith Art. 92 (1) (a) CRR plus capital conservation and countercyclicalbuffer requirements, plus systemic risk buffer, plus the systemically im-portant institution buffer (G-SII or O-SII buffer), expressed as a percent-age of risk-weighted assets) 9.0 6.75 9.0 5.625
Thereof:Capital conservation buffer requirement 2.5 1.25 2.5 0.625Countercyclical buffer requirement N/M 0.02 N/M 0.01Systemic risk buffer requirement 0.0 0.0 0.0 0.0Global Systemically Important Institution (G-SII) or Other SystemicallyImportant Institution (O-SII) buffer 2.0 1.0 2.0 0.5
Common Equity Tier 1 capital available to meet buffers (as a percentageof risk-weighted assets)11 9.4 10.2 7.1 8.8
Amounts below the thresholds for deduction (before risk weighting)Direct, indirect and synthetic holdings of the capital of financial sectorentities where the institution does not have a significant investment inthose entities (amount below 10 % threshold and net of eligible short posi-tions)7 3,893 3,893 3,613 3,613Direct, indirect and synthetic holdings by the institution of the CET 1 in-struments of financial sector entities where the institution has a significantinvestment in those entities (amount below 10 % threshold and net ofeligible short positions) 710 710 866 866Deferred tax assets arising from temporary differences (amount below10 % threshold, net of related tax liability where the conditions in Art. 38(3) CRR are met) 3,846 3,846 4,323 4,323
Applicable caps on the inclusion of provisions in Tier 2 capitalCredit risk adjustments included in T2 in respect of exposures subject tostandardized approach (prior to the application of the cap) 0 0 0 0Cap on inclusion of credit risk adjustments in T2 under standardized ap-proach 263 263 217 217Credit risk adjustments included in T2 in respect of exposures subject tointernal ratings-based approach (prior to the application of the cap) 0 0 0 0Cap for inclusion of credit risk adjustments in T2 under internal ratings-based approach 1,029 1,029 1,069 1,069
Capital instruments subject to phase-out arrangementsCurrent cap on CET 1 instruments subject to phase out arrangements N/M 0 N/M 0Amount excluded from CET 1 due to cap (excess over cap after redemp-tions and maturities) N/M 0 N/M 0Current cap on AT1 instruments subject to phase out arrangements N/M 6,263 N/M 7,516Amount excluded from AT1 due to cap (excess over cap after redemp-tions and maturities) N/M 0 N/M 0Current cap on T2 instruments subject to phase out arrangements N/M 1,688 N/M 2,026Amount excluded from T2 due to cap (excess over cap after redemptionsand maturities) N/M 0 N/M 0
N/M – Not meaningful1 References provide the mapping of regulatory balance sheet items used to calculate regulatory capital as reflected in the column “References" in “Reconciliation of
shareholders’ equity to regulatory capital”. Where applicable, more detailed information are provided in the respective reference footnote section.2 Based on EBA list as referred to in Article 26 (3) CRR.3 As we do not include an interim profit in our CET 1 capital as a consequence of the negative net income in the financial year 2017, neither AT 1 coupon nor shareholder
dividends are accrued in CET 1 capital in accordance with Art 26 (2) CRR.4 The € 1.2 billion additional value adjustments were derived from the EBA Regulatory Technical Standard on prudent valuation and are before consideration of a benefit from
the related reduction of the shortfall of provisions to expected losses of € 0.3 billion.5 Gains and losses on liabilities of the institution that are valued at fair value that result from changes in the own credit standing of the institution according to Article 33 (1) (b)
CRR as well as all fair value gains and losses arising from the institution’s own credit risk related to derivative liabilities according to Article 33 (1) (c) CRR.6 Excludes holdings that are already considered in the accounting base of Common Equity.7 Based on our current interpretation no deduction amount expected.8 Prudential filter for fund for home loans and savings protection (“Fonds zur bauspartechnischen Absicherung”).9 Amortization is taken into account.10 Excludes risk-weighted assets for positions in the trading book which are subject to phase out as prescribed in CRR (i.e. CRR residual amounts) as attributed risk-weighted
assets are calculated on a portfolio basis.11 Calculated as the CET 1 capital less any CET 1 items used to meet Tier 1 and Total capital requirements; this is before consideration of Pillar 2 SREP requirements.
A Common shares, additional paid-in capital and common shares in treasury reflect regulatory eligible CET 1 capital instruments.B The position retained earnings in the regulatory balance sheet includes net income (loss) attributable to Deutsche Bank shareholders and additional equity components of €
(751) million (2016: € (1,402) million). This item is excluded from the position retained earnings in the transitional template for regulatory capital and shown separately alongwith accrual for dividend and AT1 coupons of € 0 (2016: € 621 million) in the position independently reviewed interim profits net of any foreseeable charge or dividend.
C Difference to regulatory balance sheet position driven by prudential filters for unrealized gains and losses.D Phase-out of noncontrolling interests at a rate of 20 % in 2017 (40 % in 2016).E Regulatory applicable amount is goodwill and other intangible assets of € 8,635 million (2016: € 8,745 million) plus goodwill from equity method investments of € 64 million
(2016: € 66 million) as per regulatory balance sheet reduced by deferred tax liabilities on other intangibles of € 305 million (2016: € 374 million). Total CET 1 deduction amountis phased-in at a rate of 80 % in 2017 (2016: 60 %). Residual amount is deducted from AT1 capital.
F Differences to balance sheet position mainly driven by adjustments as set out in Article 38 (2) to (5) CRR (e.g. regulatory offsetting requirements).G Phase-in at a rate of 80 % in 2017 (60 % in 2016).H Additional equity components reflects regulatory eligible AT1 capital instruments.I Difference to regulatory balance sheet driven by regulatory adjustments as set out in Articles 51 to 61 CRR (e.g. current cap on AT1 instruments subject to phase-out
arrangements).J Difference to regulatory balance sheet driven by regulatory adjustments as set out in Articles 62 to 71 CRR (e.g. maturity deduction, noncontrolling interests).

24
Deutsche Bank Own fundsPillar 3 Report 2017 Article 437 (1)(a) CRR - Regulatory capital composition
Reconciliation of shareholders’ equity to regulatory capital Dec 31, 2017 Dec 31, 2016
in € m. CRR/CRD 4 CRR/CRD 4Total shareholders’ equity per accounting balance sheet 63,174 59,833Deconsolidation/Consolidation of entities (58) (123)
Thereof:Additional paid-in capital (6) (6)Retained earnings (228) (276)Accumulated other comprehensive income (loss), net of tax 176 159
Total shareholders' equity per regulatory balance sheet 63,116 59,710Noncontrolling interest based on transitional rules 33 79Accrual for dividend and AT1 coupons1 0 (621)Reversal of deconsolidation/consolidation of the position Accumulated other comprehensive income (loss), net oftax, during transitional period (35) (63)Common Equity Tier 1 (CET 1) capital before regulatory adjustments 63,114 59,104Prudential filters (1,422) (2,206)
Thereof:Additional value adjustments (1,204) (1,398)Any increase in equity that results from securitized assets (2) (5)Fair value reserves related to gains or losses on cash flow hedges and gains or losses on liabilities designated atfair value resulting from changes in own credit standing (72) (423)Regulatory adjustments relating to unrealized gains and losses pursuant to Art. 467 and 468 CRR (144) (380)
Regulatory adjustments (10,884) (9,115)Thereof:Goodwill and other intangible assets (net of related tax liabilities) (6,715) (5,062)Deferred tax assets that rely on future profitability (2,403) (2,666)Negative amounts resulting of the calculation of expected loss amounts (408) (188)Defined benefit pension fund assets (900) (567)Direct, indirect and synthetic holdings by the institution of the CET 1 instruments of financial sector entities wherethe institution has a significant investment in those entities 0 0Securitization positions not included in risk-weighted assets 0 0Other (458) (632)
Common Equity Tier 1 capital 50,808 47,782
Additional Tier 1 capital 6,823 7,703Additional Tier 1 Notes (AT1 Notes) 4,649 4,625
Per balance sheet 4,675 4,669Deconsolidation/Consolidation of entities 0 0Regulatory adjustments to balance sheet position (25) (45)
Hybrid capital securities 3,891 6,500Per balance sheet 5,491 6,373Deconsolidation/Consolidation of entities 0 301Regulatory adjustments to balance sheet position (1,601) (174)
Thereof:Amount excluded from Additional Tier 1 due to cap 0 0Other (1,601) (174)
Other regulatory adjustments 13 16Deductions from Additional Tier 1 capital (1,730) (3,437)
Tier 1 capital 57,631 55,486
Tier 2 capital 6,384 6,672Subordinated debt 6,155 6,447
Per balance sheet 8,100 7,762Deconsolidation/Consolidation of entities 0 0Regulatory adjustments to balance sheet position (1,944) (1,315)
Thereof:Amortization according to Art. 64 CRR (1,065) (1,027)Other (880) (288)
Other regulatory adjustments 280 288Thereof:Inclusion of amount excluded from Additional Tier 1 due to cap 0 0Other 280 288
Deductions from Tier 2 capital (51) (63)
Total capital 64,016 62,1581 As we do not include an interim profit in our CET 1 capital as a consequence of the negative net income in the financial year 2017, neither AT1 coupon nor shareholder
dividends are accrued in CET 1 capital in accordance with Art 26 (2) CRR.

25
Deutsche Bank Own fundsPillar 3 Report 2017 Article 437 (1)(d-e) CRR - Prudential filters and deduction items
Article 437 (1)(b-c) CRR - Main features of capital instrumentsA description of the main features of the Common Equity Tier 1, Additional Tier 1 and Tier 2 capital instruments issued byDeutsche Bank is published on Deutsche Bank’s website (www.db.com/ir/capital-instruments). In addition, this website providesfull terms and conditions of all Common Equity Tier 1, Additional Tier 1 and Tier 2 capital instruments.
Article 437 (1)(d-e) CRR - Prudential filters and deductionitemsDevelopment of regulatory capital
Our CRR/CRD 4 Tier 1 capital as of December 31, 2017 amounted to € 57.6 billion, consisting of CET 1 capital of € 50.8 billionand AT1 capital of € 6.8 billion. The CRR/CRD 4 Tier 1 capital was € 2.1 billion higher than at the end of 2016, primarily drivenby an increase in CET 1 capital of € 3.0 billion since year end 2016 while AT1 capital decreased by € 0.9 billion in the sameperiod.
The € 3.0 billion increase of CRR/CRD 4 CET 1 capital was largely the result of the capital issuance completed in early April2017 with net proceeds of € 7.9 billion and the reversal of 10 % threshold-related deductions of € 0.4 billion due to the highercapital base. These positive effects were then reduced by increased regulatory adjustments due to the higher phase-in rate of80 % in 2017 compared to 60 % in 2016 and negative effects from Currency Translation Adjustments of € 2.6 billion with partial-ly positive foreign exchange counter-effects in capital deduction items. Further reductions were due to the net loss attributableto Deutsche Bank shareholders and additional equity components of € 0.8 billion in 2017. Since we do not include an interimprofit in our CET 1 capital as a consequence of the negative net income in the financial year 2017, neither AT1 coupon norshareholder dividends are accrued in CET 1 capital in accordance with Art 26 (2).
The € 0.9 billion decrease in CRR/CRD 4 AT1 capital was mainly the result of reduced Legacy Hybrid Tier 1 instruments, rec-ognizable as AT1 capital during the transition period, which were € 2.6 billion lower compared to year end 2016 largely due tothe call of instruments (€ 2.4 billion) and foreign exchange effects. A positive counter-effect resulted from reduced transitionaladjustments (€ 1.7 billion lower than at year end 2016) that were phased out from AT1 capital. These deductions reflect theresidual amount of certain CET 1 deductions that are subtracted from CET 1 capital under fully loaded rules, but are allowed toreduce AT1 capital during the transitional period. The phase-in rate for these deductions on the level of CET 1 capital increasedto 80 % in 2017 (60 % in 2016) and decreased correspondingly on the level of AT1 capital to 20 % in 2017 (40 % in 2016).
Our fully loaded CRR/CRD 4 Tier 1 capital as of December 31, 2017 was € 52.9 billion, compared to € 46.8 billion at the end of2016. Our fully loaded CRR/CRD 4 CET 1 capital amounted to € 48.3 billion as of December 31, 2017, compared to € 42.3billion as of December 31, 2016. Our fully loaded CRR/CRD 4 AT1 capital amounted to € 4.6 billion as of December 31, 2017,unchanged compared to year end 2016.
The increase of our fully loaded CET 1 capital of € 6.0 billion compared to year end 2016 capital was largely the result of the €7.9 billion net proceeds from our capital issuance and the reversal of 10 % threshold-related deductions of € 0.6 billion due tothe higher capital base. Further positive effects of € 0.4 billion resulted from regulatory adjustments from prudential filters (DebtValuation Adjustments). These positive effects were partially reduced by our negative net income of € 0.8 billion and negativeeffects from Currency Translation Adjustments of € 2.6 billion with partially positive foreign exchange counter-effects in capitaldeduction items.
Based on ECB guidance and following the EBA Guidelines on payment commitments, Deutsche Bank will treat irrevocablepayment commitments related to the Deposit Guarantee Scheme and the Single Resolution Fund as an additional CET 1 capi-tal deduction instead of risk weighted assets, effective from January 2018 onwards. If these were treated as a capital deductionitem for the financial year 2017, then our pro-forma fully loaded CET 1 capital would have been € 0.4 billion lower along with anRWA relief of € 1.0 billion resulting in a pro-forma fully loaded CET 1 capital ratio decrease of 8 basis points.

26
Deutsche Bank Own fundsPillar 3 Report 2017 Article 437 (1)(d-e) CRR - Prudential filters and deduction items
Development of regulatory capitalin € m. Dec 31, 2017 Dec 31, 2016
CRR/CRD 4 CRR/CRD 4Common Equity Tier 1 (CET 1) capital - opening amount 47,782 52,429
Common shares, net effect 1,760 0Thereof:New shares issued (+) 1,760 0Shares retired (–) 0 0
Additional paid-in capital 6,153 192Retained earnings (795) (1,826)
Thereof:Actuarial gains (losses) rel. to defined benefit plans, net of tax/CTA (91) (517)Net income attributable to Deutsche Bank Shareholders (751) (1,402)
Common shares in treasury, net effect/(+) sales (–) purchase (9) 10Movements in accumulated other comprehensive income (2,748) 231
Thereof:Foreign currency translation, net of tax (2,646) 223Unrealized gains and losses 6 (261)Other (108) 269
Accrual for dividend and Additional Tier 1 (AT1) coupons1 0 (621)Thereof:Gross dividends (deduction) 0 (393)Shares issued in lieu of dividends (add back) 0 0Gross AT1 coupons (deduction) 0 (229)
Additional value adjustments 194 479Goodwill and other intangible assets (net of related tax liabilities) (1,653) (1,686)Deferred tax assets that rely on future profitability (excluding those arising from temporary differences) (91) (988)Negative amounts resulting from the calculation of expected loss amounts (219) (130)Removal of gains/losses resulting from changes in own credit standing in liabilitiesdesignated at fair value (net of tax) 183 (114)Defined benefit pension fund assets (333) (97)Direct, indirect and synthetic holdings by the institution of the CET 1 instruments of financial sector entitieswhere the institution has a significant investment in those entities 0 278Securitization positions not included in risk-weighted assets 0 0Deferred tax assets arising from temporary differences (amount above 10 % and 15 % threshold,net of related tax liabilities where the conditions in Art. 38 (3) CRR are met) 354 (30)Other, including regulatory adjustments 230 (343)
Common Equity Tier 1 (CET 1) capital - closing amount 50,808 47,782
Additional Tier 1 (AT1) capital - opening amount 7,703 5,793New Additional Tier 1 eligible capital issues 0 0Matured and called instruments (2,376) (76)Transitional arrangements 1,708 1,879
Thereof:Amount excluded from Additional Tier 1 capital due to cap 0 0Goodwill and other intangible assets (net of related tax liabilities) 1,696 1,689Negative amounts resulting from the calculation of expected loss amounts 12 (19)Direct, indirect and synthetic holdings by the institution of the CET 1 instruments of financial sector entitieswhere the institution has a significant investment in those entities 0 209
Other, including regulatory adjustments (212) 108Additional Tier 1 (AT1) capital - closing amount 6,823 7,703Tier 1 capital (T1 = CET 1 + AT1) 57,631 55,486
Tier 2 (T2) capital - opening amount 6,672 6,299New Tier 2 eligible capital issues 801 764Matured and called instruments (198) (64)Amortization adjustments (317) (344)Transitional arrangements 12 190
Thereof:Inclusion of amount excluded from Additional Tier 1 capital due to cap 0 0Amount to be deducted from or added to Additional Tier 2 capital with regard toadditional filters and deductions required pre-CRR 0 0Negative amounts resulting from the calculation of expected loss amounts 12 (19)Direct, indirect and synthetic holdings by the institution of the CET 1 instruments of financial sector entitieswhere the institution has a significant investment in those entities 0 209
Other, including regulatory adjustments (586) (173)Tier 2 (T2) capital - closing amount 6,384 6,672Total regulatory capital (TC = T1 + T2) 64,016 62,1581 As we do not include an interim profit in our CET 1 capital as a consequence of the negative net income in the financial year 2017, neither AT1 coupon nor shareholder
dividends are accrued in CET 1 capital in accordance with Art 26 (2) CRR.

27
Deutsche Bank Capital requirementsPillar 3 Report 2017 Article 438 (a) CRR - Summary of Deutsche Bank’s ICAAP approach
Article 437 (1)(f) CRR - Capital ratios different to CRRThe own funds capital ratios provided for Deutsche Bank Group are built upon the CRR regulations.
Capital requirements
Article 438 (a) CRR - Summary of Deutsche Bank’s ICAAP ap-proachDeutsche Bank’s internal capital adequacy assessment process (“ICAAP”) consists of several well established componentswhich ensure that the Group maintains sufficient capital to cover the risks to which the bank is exposed on an ongoing basis:
‒ Risk identification and assessment: The risk identification process forms the basis of the ICAAP and results in an inventoryof risks for the Group. All risks identified are assessed for their materiality.
‒ Capital demand/risk measurement: Risk measurement methodologies and models are applied to quantify the capital de-mand which is required to cover all material risks except for those which cannot be adequately limited by capital e.g. liquidityrisk.
‒ Capital supply: Capital supply quantification refers to the definition of available capital resources to absorb unexpected loss-es quantified as part of the capital demand.
‒ Risk appetite: Deutsche Bank has established Group risk appetite thresholds which express the level of risk that we arewilling to assume to achieve our strategic objectives. Threshold breaches are subject to a dedicated governance frameworktriggering management actions aimed to safeguard capital adequacy.
‒ Capital planning: The Group risk appetite thresholds for capital adequacy metrics constitute boundaries which have to bemet to safeguard capital adequacy on a forward-looking basis.
‒ Stress testing: Capital plan figures are also considered under various stress test scenarios to prove resilience and overallviability of the bank. Capital adequacy metrics are also subject to regular stress tests throughout the year to constantly eval-uate Deutsche Bank’s capital position in hypothetical stress scenarios and to detect any vulnerabilities under stress.
‒ Capital adequacy assessment: Although capital adequacy is constantly monitored throughout the year, the ICAAP concludeswith a dedicated annual capital adequacy assessment (CAS). The assessment consists of a Management Board statementabout Deutsche Bank’s capital adequacy, which is linked to specific conclusions and management actions to be taken tosafeguard capital adequacy on a forward-looking basis.
As part of its ICAAP, Deutsche Bank distinguishes between a normative and economic internal perspective. The normativeinternal perspective refers to an internal process aimed at the fulfilment of all capital-related legal requirements and supervisorydemands on an ongoing basis (primarily measured via the CET1 and leverage ratio). The economic internal perspective(measured via the internal capital adequacy ratio) refers to an internal process aimed at capital adequacy using internal eco-nomic capital demand models and an internal economic capital supply definition. Both perspectives focus on maintaining theviability of Deutsche Bank on an ongoing basis.
For a further description of the above ICAAP components, please refer to the Annual Report under sections “Risk Identificationand Assessment” on page 58, “Risk Profile” on page 44, “Capital and Leverage Ratio” on page 82, “Risk Appetite and Capacity”on page 50, “Key Risk Metrics” on page 43, “Strategic and Capital Plan” on pages 51 to 52, and “Stress Testing” on pages 53 to55. Additionally, the following sections below on pages 27 to 31 describe the risk measurement methodologies (economic capi-tal models) applied by Deutsche Bank to quantify capital demand required to cover all material risks.
Credit Risk Economic Capital Model
We calculate economic capital for counterparty risk, transfer risk and settlement risk as elements of credit risk. In line with oureconomic capital framework, economic capital for credit risk is set at a level to absorb with a probability of 99.9 % very severeaggregate unexpected losses within one year.

28
Deutsche Bank Capital requirementsPillar 3 Report 2017 Article 438 (a) CRR - Summary of Deutsche Bank’s ICAAP approach
Our economic capital for credit risk is derived from the loss distribution of a portfolio via Monte Carlo Simulation of correlatedrating migrations. The portfolio loss distribution is calculated as follows: in a first step, potential credit losses are quantified ontransactional level based on available exposure and loss-given-default information. In a second step, the probability of jointdefaults is modeled stochastically in terms of risk factors representing the relevant countries and industries that the counterpar-ties are linked to. The simulation of portfolio losses is then performed by an internally developed model, which takes ratingmigration and maturity effects into account. Effects due to wrong-way derivatives risk (i.e., the credit exposure of a derivative inthe default case is higher than in nondefault scenarios) are modeled by applying our own alpha factor when deriving the expo-sure at default for derivatives and securities financing transactions under the Basel 3 Internal Models Method (“IMM”).We allo-cate expected losses and economic capital derived from loss distributions down to transaction level to enable management ontransaction, customer and business level.
Our asset value credit portfolio model is based on the assumption that an obligor firm defaults when its value is no longer highenough to cover its liabilities. The obligor’s asset value or "ability to pay" is modeled as a random process, the Ability to PayProcess (APP). An obligor is taken to default when its asset value or ability to pay falls below a given default point. Changes inthe value of systematic and specific factors are simulated in terms of multivariate distributions. The weight assigned to system-atic and specific components and the covariance of systematic factors are estimated using equity and rating time series or arebased on standard settings for particular portfolio segments.
Modeling correlations via a factor model: A factor model describes the dynamics of a large number of random variables bymaking use of a reduced and fixed number of other random variables, called factors. The approach has the advantage of reduc-ing computing time: fewer correlations need to be evaluated, and the factor correlation matrix does not change when new obli-gors are introduced. The parameters that specify the factor model are:
‒ The factor model characteristics for the different borrowers, i.e., the weights for the systematic country and industry factors(our model uses 37 systematic factors) and the R2, which determines the weight for the specific factor
‒ The covariance matrix between the country and industry factors
Modeling rating migration: The rating migration methodology requires additional information, namely yield curves and transitionmatrices describing the probabilities of migrating between different credit ratings.
‒ Migration matrix: For K non-default credit rating grades and 1 default credit rating, a migration matrix is a (K + 1) × (K + 1)matrix with entries πij. It expresses in percentage terms the probability πij that any borrower with the credit rating i moves tothe credit rating j in the next time step.
‒ Risk-free curve: The risk-free curve required as an input for different points in time is used to derive the corresponding risk-free discount factors.
Economic capital is derived from Value-at-Risk (VaR) with confidence level α = 99.9 %. The economic capital is allocated toindividual transactions using expected shortfall allocation. Portfolio information includes exposure, loss given default, one-yeardefault probability and maturity. The parameters are consistent with the parameters used for the regulatory reporting, with theexception of those from the exposure for derivatives.
Market Risk Economic Capital Model
Economic capital for market risk measures the amount of capital needed to absorb very severe, unexpected losses arising fromour exposures over the period of one year. “Very severe” in this context means that the underlying economic capital is set at alevel which covers, with a probability of 99.9 %, all unexpected losses over a one year time horizon. Market Risk EconomicCapital consists of the following three components:
‒ Traded Market Risk, capturing the risk due to valuation changes from market price movements‒ Traded Default Risk, capturing the risk due to valuation changes caused by issuer default and migration risk‒ Non-traded Market Risk, market risk arising outside of the core trading activities
Traded Market Risk Economic Capital (“TMR EC”)
Our traded market risk economic capital model - scaled Stressed VaR based EC (SVaR based EC) - comprises two core com-ponents, the “common risk” component covering risk drivers across all businesses and the “business-specific risk” component,which enriches the Common Risk via a suite of Business Specific Stress Tests (BSSTs). Both components are calibrated tohistorically-observed severe market shocks.

29
Deutsche Bank Capital requirementsPillar 3 Report 2017 Article 438 (a) CRR - Summary of Deutsche Bank’s ICAAP approach
Common risk is calculated using a scaled version of the Regulatory SVaR framework. The SVaR measure itself replicates theValue-at-Risk calculation that would be generated on the bank’s current portfolio if the relevant market factors were experienc-ing a period of stress. In particular, the model inputs are calibrated to historical data from a continuous 12-month period ofsignificant financial stress relevant to the bank’s portfolio. The Regulatory SVaR model is then scaled-up to cover a differentliquidity horizon (up to 1 year) and confidence level (99.9 %). The liquidity horizon framework that is utilized in the SVaR basedEC model accounts for different levels of market liquidity as well as risk concentrations in the bank’s portfolios. In terms of cov-erage, the “common risk” captures outright linear and some non-linear risks (e.g. Gamma, Vega) to systematic and idiosyncraticrisk drivers. The model incorporates the following risk factors: interest rates, credit spreads, equity prices, foreign exchangerates, commodity prices, volatilities and correlations.
The “business-specific risk” captures more product/business-related bespoke risks (e.g. complex basis risks) as well as higherorder risks (e.g. for equity options) not captured in the common risk component. The concept of business-specific risk is inparticular important in areas where the lack of meaningful market data prevents direct use of the common risk model. BSSTsare in general calibrated to available historical data to obtain a stress scenario. Where appropriate, risk managers use theirexpert judgment to define severe market shocks, based upon the knowledge of past extreme market conditions. In addition tothe BSSTs the business specific risk component of the SVaR based EC model also contains placeholders which carry an esti-mated EC component on a temporary basis, while efforts are being made to cover those risks with a proper business-specificstress test or integrate it in the common risk framework.
We also continuously assess and refine our market risk EC model to ensure the capture of new material risks as well as theappropriateness of the shocks applied. The calculation of the Traded Market Risk EC is performed weekly.
Traded Default Risk Economic Capital (“TDR EC”)
TDR refers to changes in the value of instruments caused by default or rating changes of the issuer. For credit derivatives likecredit default swaps (CDS), the rating of the issuer of the reference asset is modeled. TDR covers the following positions:
‒ Fair value assets in the banking book;‒ Unsecuritized credit products in the trading book excluding the correlation trading portfolio;‒ Securitized products in the trading book excluding the correlation trading portfolio;‒ Correlation trading portfolio.
The traded default risk EC for the correlation trading portfolio is calculated using the comprehensive risk measure model. For allother positions the TDR methodology risk is similar to the credit risk methodology. An important difference between the ECcalculation for traded default risk and credit risk is the capital horizon of 6 months which is used for most TDR positions com-pared to 12 months used for credit risk. Recognizing traded default risk EC for unsecuritized credit products corresponds to thecalculation of the incremental risk charge for the trading book for regulatory purposes. EC for TDR represents an estimate of thedefault and migration risks of credit products at a 99.9 % confidence level, taking into account the liquidity horizons of the re-spective sub-portfolios.
TDR EC captures the relevant credit exposures across our trading and banking books. Trading book exposures are monitoredby market risk management via single name concentration and portfolio thresholds which are set based upon rating, size andliquidity. Single name concentration risk thresholds are set for two key metrics: Default Exposure, i.e., the P&L impact of aninstantaneous default at the current recovery rate (RR), and bond equivalent Market Value (MV), i.e. default exposure at 0 %recovery. In order to capture diversification and concentration effects we perform a joint calculation for traded default risk eco-nomic capital and credit risk economic capital. Important parameters for the calculation of traded default risk are exposures,recovery rates and default probabilities as well as maturities. Exposures, recovery rates and default probabilities are derivedfrom market information and external ratings for trading book positions or from internal assessments for the banking book posi-tions as for credit risk economic capital. Rating migrations are governed by issuer type specific migration matrices, which areobtained from historical rating time series from rating agencies and internal observations. The probability of joint rating down-grades and defaults is determined by the default and rating correlations of the portfolio model. These correlations are specifiedthrough systematic factors that represent countries, geographical regions and industries.

30
Deutsche Bank Capital requirementsPillar 3 Report 2017 Article 438 (a) CRR - Summary of Deutsche Bank’s ICAAP approach
Non-traded market risk Economic Capital (“NTMR EC”)
Non-traded market risk arises from market movements, primarily outside the activities of our trading units, in our banking bookand from off-balance sheet items. Significant market risk factors which the bank is exposed to and are overseen by risk man-agement groups in that area are:
‒ Interest rate risk (including risk from embedded optionality and changes in behavioral patterns for relevant product types),credit spread risk, foreign exchange risk, equity risk (including investments in public and private equity as well as real estate,infrastructure and fund assets); and
‒ Market risks from off-balance sheet items such as pension schemes and guarantees as well as structural foreign exchangerisk and equity compensation risk.
Non-traded market risk economic capital is being calculated either by applying the standard traded market risk EC methodology(SVaR based EC model) or through the use of non-traded market risk models that are specific to each risk class and whichconsider, among other factors, large historically observed market moves, the liquidity of each asset class, and changes in cli-ent’s behavior in relation to products with behavioral optionalities. The calculation of EC for non-traded market risk is performedmonthly.
An independent model validation team reviews all quantitative aspects of our MR EC model on a regular basis. The reviewcovers, but is not limited to, model assumptions and calibration approaches for risk parameters.
Operational Risk Economic Capital Model
For the quantification of economic capital requirements the Group uses the Advanced Measurement Approach (“AMA”). Theeconomic capital is set at a 99.9 % percentile to absorb very severe unexpected losses within one year. Since Q4 2017 weapply the same confidence levels for the calculation of regulatory and economic capital requirements as described in chapter“Capital and Leverage Ratio”, section “Internal Capital Adequacy” in the 2017 Annual Report on page 92.
For detailed information on our Operational risk measurement approaches refer to our Pillar 3 report section “Article 446 CRR -Operational Risk Measurement” on page 115.
Business Risk Economic Capital Model
We measure economic capital for business risk, which includes strategic risk and tax risk.
The economic capital for strategic risk is based on a model calculating an earnings distribution on Deutsche Bank group level.Important input parameters of the EC model are planned revenues and costs from the Group strategic plan and monthly fore-cast process on business unit level. This ensures that the model includes strategic decisions or changes to the business envi-ronment in a timely manner. These forecasts determine the mean values of the revenue and cost distributions. The volatilities ofthe revenue distributions are derived from historical revenue time series of our business units. Risk concentrations within andacross businesses are specified by revenue drivers for individual business units. The correlations of revenue drivers, e.g. mar-ket or macroeconomic factors, are calibrated with historical time series. Revenues are then simulated together with costs toallow for a partial offset of revenue decreases by cost reductions, e.g. by reduced bonus payments. Revenues and costs arecombined to an earnings distribution for the Group, which is used for deriving the economic capital for strategic risk. Strategicrisk EC is held to protect against operating income losses covering a twelve months time-horizon and is calculated with a confi-dence of 99.9 %, in line with our general economic capital definition.
Tax risk is determined by reference to corporate income tax re-determination risk with respect to transactions undertaken by theBank. Tax re-determination risk is the risk that the eventual tax treatment of a transaction differs from that initially determined bythe Bank because of a judicial determination or a compromise by the Bank with a tax authority. Examples of tax re-determination risk include a tax ceasing to be creditable, taxable income being treated as arising, a tax deduction not beinggranted, a tax consolidated group not being respected, or an anti avoidance rule being determined to apply. Tax related inputsof the process are under the direction and control of tax professionals of the Bank who are independent of business units. Thecalculation of tax risk EC is performed in a portfolio model which incorporates issues with a one year time horizon. The notionalexposure for each “tax issue” is determined and is then modified for reserves and a settlement adjustment. A probability isassigned to each “tax issue”. Tax risk EC is computed at the 99.9 % confidence level of the portfolio loss distribution, which isobtained through Monte Carlo simulation.

31
Deutsche Bank Capital requirementsPillar 3 Report 2017 Article 438 (b) CRR - SREP requirements
Risk Type Diversification
The risk type diversification benefit quantifies diversification effects between credit, market, operational and strategic risk in theeconomic capital calculation caused by non-perfect correlations between these risk types. The calculation of the risk type diver-sification benefit is intended to ensure that the standalone economic capital figures for the individual risk types are aggregatedin an economically meaningful way. Please refer to section “Risk Profile” on page 44 in our Annual Report 2017 for the diversifi-cation amount across credit risk, market risk, operational risk and business risk.
Stress Testing
We have a strong commitment to stress testing performed on a regular basis in order to assess the impact of a severe econom-ic downturn on our risk profile and financial position. These exercises complement traditional risk measures and represent anintegral part of our strategic and capital planning process. Our stress testing framework comprises regular Group-wide stresstests based on internally defined “Downside Planning” and more severe macroeconomic global downturn scenarios. We includeall material risk types into our stress testing exercises. The time-horizon of internal stress tests is generally one year and can beextended to multi-year, if required by the scenario assumptions. Our methodologies undergo regular scrutiny from DeutscheBank’s internal validation team (Global Model Validation and Governance - GMVG) whether they correctly capture the impact ofa given stress scenario. These analyses are complemented by portfolio- and country-specific stress tests as well as regulatoryrequirements, such as annual reverse stress tests and additional stress tests requested by our regulators on group or legalentity level. Examples of regulatory stress tests performed in 2017 is the CCAR stress test for the US entity. In 2018, DeutscheBank will take part in the biannual EBA stress test. Moreover, capital plan stress testing is performed to assess the viability ofour capital plan in adverse circumstances and to demonstrate a clear link between risk appetite, business strategy, capital planand stress testing. An integrated procedure allows us to assess the impact of ad-hoc scenarios that simulate potential imminentfinancial or geopolitical shocks.
The initial phase of our internal stress tests consists of defining a macroeconomic downturn scenario by ERM Risk Research incooperation with business specialists. ERM Risk Research monitors the political and economic development around the worldand maintains a macro-economic heat map that identifies potentially harmful scenarios. Based on quantitative models andexpert judgments, economic parameters such as foreign exchange rates, interest rates, GDP growth or unemployment ratesare set accordingly to reflect the impact on our business. The scenario parameters are translated into specific risk drivers bysubject matter experts in the risk units. Based on our internal models framework for stress testing, the following major metricsare calculated under stress: risk-weighted assets, impacts on profit and loss and economic capital by risk type. These resultsare aggregated at the Group level, and key metrics such as the Net Liquidity Position (NLP), the CET 1 ratio, ECA ratio andLeverage Ratio under stress are derived. Prior to the impact assessment the more scenarios are discussed and approved bythe Enterprise Risk Committee (ERC) which also reviews the final stress results. After comparing these results against ourdefined risk appetite, the ERC also discusses specific mitigation actions to remediate the stress impact in alignment with theoverall strategic and capital plan if certain limits are breached. The results also feed into the recovery planning which is crucialfor the recoverability of the Bank in times of crisis. The outcome is presented to senior management up to the ManagementBoard to raise awareness on the highest level as it provides key insights into specific business vulnerabilities and contributes tothe overall risk profile assessment of the bank. The group wide stress tests performed in 2017 indicated that the bank’s capitali-zation together with available mitigation measures allow it to reach the internally set stress exit level being well above regulatoryearly intervention levels. A reverse stress test is performed annually in order to challenge our business model to determine theseverity of scenarios that would cause us to become unviable. Such a reverse stress test is based on a hypothetical macroeco-nomic scenario and idiosyncratic events and takes into account severe impacts of major risks on our results. Comparing thehypothetical scenario that would be necessary to result in our non-viability according to the reverse stress, to the current eco-nomic environment, we consider the probability of occurrence of such a hypothetical macroeconomic scenario as extremely low.Given the extremely low probability of the reverse stress test scenario, we do not believe that our business continuity is at risk.
Article 438 (b) CRR - SREP requirementsThe SREP requirements are described further below in this Report in section “Article 440 CCR - Capital buffers” on page 34 aswell as in the Annual Report 2017 under chapter “Capital and Leverage Ratio”, section “Minimum capital requirements andadditional capital buffers” on page 84.

32
Deutsche Bank Capital requirementsPillar 3 Report 2017 Article 438 (c-f) CRR - Overview of capital requirements
Article 438 (c-f) CRR - Overview of capital requirementsThe table below shows RWA and regulatory capital requirements broken down by risk types and model approaches comparedto the previous year-end and the previous quarter-end.
EU OV1 – Overview of RWADec 31, 2017 Dec 31, 2016 Sep 30, 2017
a1 b1 a2 b2 a3 b3
in € m. RWA
Minimumcapital
requirements RWA
Minimumcapital
requirements RWA
Minimumcapital
requirements 1 Credit risk (excluding CCR) 159,864 12,789 160,763 12,861 158,930 12,714 thereof:
Art 438(c)(d) 2 The standardized approach 18,534 1,483 13,128 1,050 17,453 1,396Art 438(c)(d) 3 The foundation IRB (FIRB)
approach 3,271 262 2,015 161 3,243 259Art 438(c)(d) 4 The advanced IRB (AIRB)
approach 131,679 10,534 139,094 11,128 132,373 10,590Art 438(d) 5 Equity IRB under the simple risk-weighted
approach or the IMA 6,380 510 6,526 522 5,861 469Article 107Art.438(c)(d)
6 Counterparty credit risk (CCR) 40,065 3,205 43,335 3,467 37,693 3,015
thereof:Art 438(c)(d) 7 Mark to market 6,607 529 8,669 694 7,283 583Art 438(c)(d) 8 Original exposure 0 0 0 0 0 0
9 The standardized approach 0 0 0 0 0 0 10 Internal model method (IMM) 23,887 1,911 22,314 1,785 20,988 1,679
Art 438(c)(d) 11 Risk exposure amount for contributions tothe default fund of a CCP 419 34 308 25 253 20
Art 438(c)(d) 12 Credit Valuation Adjustment (CVA) 6,451 516 9,416 753 6,887 551Art 438(e) 13 Settlement risk 147 12 36 3 11 1Art 449(o)(i) 14 Securitization exposures in the banking
book (after the cap) 10,170 814 13,876 1,110 10,846 868 thereof: 15 IRB approach 9,204 736 12,388 991 9,715 777
thereof: 16 IRB supervisory formula approach
(SFA) 7,422 594 9,403 752 7,736 619 17 Internal assessment approach (IAA) 0 0 0 0 0 0 18 Standardized approach 966 77 1,488 119 1,131 90 19 Market risk 30,966 2,477 33,762 2,701 35,781 2,862 thereof: 20 Standardized approach 5,763 461 4,599 368 5,753 460 21 IMA 25,203 2,016 29,163 2,333 30,028 2,402
Article 438(e) 22 Large exposures 0 0 0 0 0 0Article 438(f) 23 Operational risk 91,610 7,329 92,675 7,414 99,643 7,971
thereof: 24 Basic indicator approach 0 0 0 0 0 0 25 Standardized approach 0 0 0 0 0 0 26 Advanced measurement approach 91,610 7,329 92,675 7,414 99,643 7,971
Art 437(2),48,60
27 Amounts below the thresholds for deduction(subject to 250 % risk weight) 11,389 911 13,071 1,046 12,209 977
Art 500 28 Floor adjustment 0 0 0 0 0 0 29 Total1 344,212 27,537 357,518 28,601 355,113 28,409
1 The table reflects the fully loaded RWA amounts and does not include the transitional adjustment due to the grandfathering of equity investments (Dec 2017 and Sep 2017:(0.9) billion € RWA, Dec 2016 (1.3) billion € RWA) and the respective shift of exposure from the advanced IRB to the standard approach.
The RWA according to CRR/CRD 4 fully loaded were € 344.2 billion as of December 31, 2017, compared to € 357.5 billion asof December 31, 2016. The overall decrease of € 13.3 billion mainly reflects decreases in credit risk RWA. Credit risk RWA are€ 6.6 billion lower mainly resulting from foreign exchange reductions of € 10.2 billion which is partly offset by business drivenincrease in our Corporate & Investment Bank and Private & Commercial Bank segments. In addition book quality changes dueto improved portfolio quality have contributed to the overall decrease in credit risk RWA. The decrease in RWA for market risksince December 31, 2016 was primarily driven by value-at-risk and stressed value-at-risk components, which was partly offsetby an increase in the incremental risk charge and market risk standardized approach for securitizations. The € 2.9 billion reduc-tion in RWA for CVA was mainly driven by de-risking of the portfolio. The slight decrease in operational risk RWA was mainlydriven by our internal and external loss profile.

33
Deutsche Bank Capital requirementsPillar 3 Report 2017 Article 438 CRR - Specialized lending and equity exposures in the banking book
RWA calculated on CRR/CRD 4 transitional rules were € 343.3 billion as of December 31, 2017 compared to € 356.2 billion atthe end of 2016. The decrease was driven by the same movements as outlined for the fully loaded rules. The transitional RWAwere € 0.9 billion lower than the risk-weighted assets under the fully loaded rules due to the application of the equity investmentgrandfathering regulation according to Article 495 CRR, pursuant to which certain equity investments receive a 100 % riskweight instead of a risk weight between 190 % and 370 % determined based on Article 155 CRR that would apply on theCRR/CRD 4 fully loaded basis.
As of December 31, 2017, we have not applied this grandfathering rule anymore, but instead applied a risk weight between190 % and 370 % determined based on Article 155 CRR under the CRR/CRD 4 fully loaded rules to all our equity positions.Consequently, in this regard, there are no transitional arrangements any longer considered in our fully loaded RWA numbers forDecember 31, 2017. Only for the comparative periods these transitional rules still have been applied within the risk weighting.
As of December 31, 2016, our portfolio of transactions for which we applied the equity investment grandfathering rule in calcu-lating our fully loaded RWA consisted of 15 transactions amounting to € 220 million in exposures. Had we not applied thegrandfathering rule for these transactions, their fully loaded RWA would have been no more than € 816 million, and thus ourGroup fully loaded RWA would have been no more than € 358.1 billion as of December 31, 2016, rather than the Group fullyloaded RWA of € 357.5 billion that we reported on a fully loaded basis with application of the grandfathering rule. Also, had wecalculated our fully loaded CET 1 capital ratio, Tier 1 capital ratio and Total capital ratio as of December 31, 2016 using fullyloaded RWAs without application of the grandfathering rule, such capital ratios would have remained unchanged (due to round-ing) at the 11.8 %, 13.1 % and 16.6 %, respectively, that we reported on a fully loaded basis with application of the grandfather-ing rule.
The movements of RWA for the specific risk types are discussed further down in this report for credit risk in section “Article 438(d) CRR - Development of Credit Risk RWA” on page 77, for counterparty credit risk in section “Article 438 (d) CRR - Develop-ment of Counterparty Credit Risk RWA” on page 100 and for market risk in section “Article 445 CRR - Exposure to market risk”on page 103.
Article 438 CRR - Specialized lending and equity exposures inthe banking bookThe table below summarizes our foundation approach exposure for specialized lending on an EAD basis. For the calculation ofminimum capital requirements regulatory risk weights are applied where potential risk mitigating factors are already consideredin the assignment of a risk weight to a specific structure. Additional credit risk mitigation techniques have not been applied.
For specific exposures in the advanced IRBA we are required to apply regulatory defined risk weights. In the following sectionwe summarize our IRBA exposures for equities and other non-credit obligation assets falling under this requirement. Credit riskmitigation techniques have not been applied.
EU CR10 – IRB (specialized lending and equities)in € m.(unless stated otherwise) Dec 31, 2017Specialized lending
Regulatory catego-ries Remaining maturity
On-balance sheet amount
Off-balance sheet amount Risk weight
Exposureamount RWA
Expectedlosses
Category 1 Less than 2.5 years 105 37 50 % 134 67 0Equal to or more than 2.5 years 853 93 70 % 926 648 4
Category 2 Less than 2.5 years 17 18 70 % 28 20 0Equal to or more than 2.5 years 117 99 90 % 192 173 2
Category 3 Less than 2.5 years 2 0 115 % 3 4 0Equal to or more than 2.5 years 36 1 115 % 38 43 1
Category 4 Less than 2.5 years 8 0 250 % 7 19 1Equal to or more than 2.5 years 5 0 250 % 6 15 0
Category 5 Less than 2.5 years 22 0 – 42 0 21Equal to or more than 2.5 years 0 0 – 0 0 0
Total Less than 2.5 years 153 55 – 215 109 22Equal to or more than 2.5 years 1,012 194 – 1,162 879 7
Equities under the simple risk-weighted approach
Categories On-balance sheet amount
Off-balance sheet amount Risk weight
Exposureamount RWA
Capital requirements
Private equity exposures sufficiently diversified 355 7 190 % 362 687 55Exchange-traded equity exposures 7 261 290 % 268 776 62All other equity exposures 1,060 91 370 % 1,329 4,916 393Total1 1,422 359 – 388 6,380 5101 The table reflects the fully loaded RWA amounts and does not include the (0.9) billion € RWA transitional adjustment due to the grandfathering of equity investments and the
respective shift of exposure from the advanced IRB to the standard approach.

34
Deutsche Bank Capital requirementsPillar 3 Report 2017 Article 440 CRR - Capital buffers
Article 438 CRR - Other non-credit obligation assets in thebanking bookThe table below presents the exposures assigned to the exposure class “other non-credit obligation assets” as outlined in Arti-cle 156 CRR. We split the table into cash positions in accordance with Article 156 (a) CRR, which receive a risk weight of 0 %as well as other positions receiving a risk weight of 100 %. Additional credit risk mitigation techniques have not been applied.
Credit risk exposures of other non-credit obligation assetsDec 31, 2017
in € m. Risk Weight EAD RWARisk PositionOther non-credit obligation assets - cash 0 % 2,363 0Other non-credit obligation assets - other 100 % 4,109 4,109Total EAD other non-credit obligation assets – 6,471 4,109
Article 441 CRR - Indicators of global systemic importanceIn March 2015, Deutsche Bank was designated as a Global Systemically Important Financial Institutions (G-SII) by the GermanFederal Financial Supervisory Authority (BaFin) in agreement with Deutsche Bundesbank resulting in a G-SII buffer require-ment of 2.00 % CET 1 capital of RWA in 2019. This is in line with the Financial Stability Board (FSB) assessment of systemicimportance based on the indicators as published in 2015. The additional buffer requirement of 2.00 % for G-SIIs was phased inwith 0.50 % in 2016 and in 2017 amounts to 1.00 %. We will continue to publish our indicators on our website:
https://www.db.com/ir/en/regulatory-reporting.htm
Article 440 CRR - Capital buffersMinimum capital requirements and additional capital buffers
The Pillar 1 CET 1 minimum capital requirement applicable to the Group is 4.50 % of risk-weighted assets (RWA). The Pillar 1total capital requirement of 8.00 % demands further resources that may be met with up to 1.50 % Additional Tier 1 capital andup to 2.00 % Tier 2 capital.
Failure to meet minimum capital requirements can result in supervisory measures such as restrictions of profit distributions orlimitations on certain businesses such as lending. We complied with the regulatory capital adequacy requirements in 2017.
In addition to these minimum capital requirements, the following combined capital buffer requirements have been phased insince 2016 (other than the systemic risk buffer, if any, which is not subject to any phase-in) and will become fully effective from2019 onwards. The buffer requirements must be met in addition to the Pillar 1 minimum capital requirements, but can be drawndown in times of economic stress.
Deutsche Bank continues to be designated as a global systemically important institution (G-SII) by the German Federal Finan-cial Supervisory Authority (BaFin) in agreement with Deutsche Bundesbank, resulting in a G-SII buffer requirement of 2.00 %CET 1 capital of RWA in 2019. This is in line with the Financial Stability Board (FSB) assessment of systemic importance basedon the indicators as published in 2017. The additional buffer requirement of 2.00 % for G-SIIs was phased in with 0.5% in 2016,1.00 % in 2017 and in 2018 amounts to 1.50 %. We will continue to publish our indicators on our website.
The capital conservation buffer is implemented in Section 10c German Banking Act based on Article 129 CRD 4 and equals arequirement of 2.50 % CET 1 capital of RWA. The additional buffer requirement of 2.50 % was phased in with 0.625% in 2016,1.25 % in 2017 and in 2018 amounts to 1.875 %.
The countercyclical capital buffer is deployed in a jurisdiction when excess credit growth is associated with an increase in sys-tem-wide risk. It may vary between 0 % and 2.50 % CET 1 capital of RWA by 2019. In exceptional cases, it could also be higherthan 2.50 %. The institution specific countercyclical buffer that applies to Deutsche Bank is the weighted average of the coun-tercyclical capital buffers that apply in the jurisdictions where our relevant credit exposures are located. As per December 31,2017 (and currently), the institution-specific countercyclical capital buffer was at 0.02 %.

35
Deutsche Bank Capital requirementsPillar 3 Report 2017 Article 440 CRR - Capital buffers
In addition to the aforementioned buffers, national authorities, such as the BaFin, may require a systemic risk buffer to preventand mitigate long-term non-cyclical systemic or macro-prudential risks that are not covered by the CRR. They can require anadditional buffer of up to 5.00 % CET 1 capital of RWA. As of the year-end 2017 (and currently), no systemic risk buffer appliedto Deutsche Bank.
Additionally, Deutsche Bank AG has been classified by BaFin as other systemically important institution (O-SII) with an addi-tional buffer requirement of 2.00 % that has to be met on a consolidated level. For Deutsche Bank, the O-SII buffer was intro-duced in first steps of 0.66 % in 2017 and in 2018 amounts to 1.32 %. Unless certain exceptions apply, only the higher of thesystemic risk buffer, G-SII buffer and O-SII buffer must be applied. Accordingly, the O-SII buffer is not applicable as of Decem-ber 31, 2017.
In addition, pursuant to the Pillar 2 Supervisory Review and Evaluation Process (SREP), the European Central Bank (ECB)may impose capital requirements on individual banks which are more stringent than statutory requirements (so-called Pillar 2requirement). On December 8, 2016, following the results of the 2016 SREP, the ECB informed Deutsche Bank that it mustmaintain a phase-in CET 1 ratio of at least 9.52 % on a consolidated basis under applicable transitional rules under CRR/CRD4 at all times, beginning on January 1, 2017. This CET 1 capital requirement comprises the Pillar 1 minimum capital require-ment of 4.50 %, the Pillar 2 requirement (SREP Add-on) of 2.75 %, the phase-in capital conservation buffer of 1.25 %, thecountercyclical buffer (currently 0.02 %) and the phase-in G-SII buffer of 1.00 %. Correspondingly the requirements forDeutsche Bank's Tier 1 capital ratio were at 11.02 % and total capital ratio at 13.02 % as of December 31, 2017.
On December 19, 2017, Deutsche Bank was informed by the ECB of its decision regarding prudential minimum capital re-quirements for 2018, following the results of the 2017 SREP. The decision requires Deutsche Bank to maintain a phase-inCET 1 ratio of at least 10.65 % on a consolidated basis, beginning on January 1, 2018. This CET 1 capital requirement com-prises the Pillar 1 minimum capital requirement of 4.50 %, the Pillar 2 requirement (SREP Add-on) of 2.75 %, the phase-incapital conservation buffer of 1.875 %, the countercyclical buffer (currently 0.02 %) and the phase-in G-SII buffer of 1.50 %. Thenew CET 1 capital requirement of 10.65 % for 2018 is higher than the CET 1 capital requirement of 9.52 %, which was applica-ble to Deutsche Bank in 2017, reflecting the further phase-in of the capital conservation buffer and the G-SII buffer. Correspond-ingly, 2018 requirements for Deutsche Bank's Tier 1 capital ratio are at 12.15 % and for its total capital ratio at 14.15 %. Also,following the results of the 2017 SREP, the ECB communicated to us an individual expectation to hold a further “Pillar 2” CET 1capital add-on, commonly referred to as the ‘“Pillar 2” guidance’. The capital add-on pursuant to the “Pillar 2” guidance is sepa-rate from and in addition to the Pillar 2 requirement. The ECB has stated that it expects banks to meet the “Pillar 2” guidancealthough it is not legally binding, and failure to meet the “Pillar 2” guidance does not automatically trigger legal action.
The following table gives an overview of the different Pillar 1 and Pillar 2 minimum capital requirements (but excluding the “Pil-lar 2” guidance) as well as capital buffer requirements applicable to Deutsche Bank in the years 2017 and 2018 (articulated on aphase-in basis):
Overview total capital requirements and capital buffers2017 2018
Pillar 1Minimum CET 1 requirement 4.50 % 4.50 %Capital Conservation Buffer 1.25 % 1.875 %Countercyclical Buffer 0.02 % 0.02 %1
G-SII Buffer3 1.00 % 1.50 %O-SII Buffer3 0.66 % 1.32 %Systemic Risk Buffer3 0.00 % 0.00 %2
Pillar 2Pillar 2 SREP Add-on of CET 1 capital 2.75 % 2.75 %SREP CET 1 Requirement 8.50 % 9.125 %Total CET 1 requirement from Pillar 1 and 24 9.52 % 10.65 %Total Tier 1 requirement from Pillar 1 and 2 11.02 % 12.15 %Total capital requirement from Pillar 1 and 2 13.02 % 14.15 %1 Deutsche Bank’s countercyclical buffer requirement is subject to country-specific buffer rates decreed by EBA and the Basel Committee of Banking Supervision (BCBS) as
well as Deutsche Bank’s relevant credit exposures as per respective reporting date. The countercyclical buffer rate for 2018 has been assumed to be 0.02 % due tounavailability of 2018 data.
2 The systemic risk buffer has been assumed to remain at 0 % for the projected year 2018, subject to changes based on further directives.3 Unless certain exceptions apply only the higher of the systemic risk buffer, G-SII and O-SII buffer must be applied.4 The total Pillar 1 and Pillar 2 CET 1 requirement (excluding the “Pillar 2” guidance) is calculated as the sum of the SREP requirement, the higher of the G-SII, O-SII and
systemic risk buffer requirement as well as the countercyclical buffer requirement.
Article 440 (a) CRR - Geographical distribution of credit exposures
The following tables disclose the amount of the institution’s specific countercyclical buffer as well as the geographical distribu-tion of credit exposures relevant for its calculation in the standard format as set out in Commission Delegated Regulation (EU)2015/1555. The geographical split table shows countries on an individual basis if they impose a countercyclical capital bufferrate or their total own funds requirements exceed € 20 million. The values for the remaining countries are shown as Other.

36
Deutsche Bank Capital requirementsPillar 3 Report 2017 Article 440 CRR - Capital buffers
Countercyclical capital buffer rates are determined by Basel Committee member jurisdictions. Countercyclical capital buffervaries according to a percentage of risk weighted assets. The “General credit exposures” include only credit exposures to theprivate sector. Exposures to the public sector and to institutions are not in scope. The “Trading book exposures” contain marketrisk standardized approach non-securitization and trading book securitization positions as well as IRC (“Incremental RiskCharge”) and CTP (“Correlation Trading Portfolio”) related positions.
Geographical distribution of credit exposures relevant for the calculation of the countercyclical capital bufferDec 31, 2017
General credit exposures Trading book exposures Securitization exposures
in € m. Exposure value
for SA Exposure value
for IRB
Sum of long andshort positions of
trading bookexposures for SA
Value of trading book exposures
for Internalmodels
Exposure valuefor SA
Exposure valuefor IRB
Argentina 17 181 0 147 0 0Australia 184 2,988 1,044 149 104 279Austria 37 1,607 44 365 0 0Belgium 150 1,726 0 0 0 0Bermuda 26 1,145 16 49 0 31Brazil 11 889 0 252 0 0British Virgin Islands 68 7,554 0 31 0 0Canada 118 3,874 1 42 0 249Cayman Islands 395 6,642 20 26 0 960China 29 4,719 217 1,264 0 0Cyprus 28 308 0 123 0 0Czech Republic 4 379 0 0 0 0Denmark 1 1,730 0 176 0 0Egypt 0 850 0 48 0 0France 6 6,500 187 123 0 307Germany 8,219 234,859 94 1,899 0 7,392Greece 3 981 0 96 0 0Hong Kong 76 5,725 0 165 0 0Iceland 0 72 0 42 0 0India 1,917 6,494 0 1,048 0 0Indonesia 24 1,657 0 198 0 0Ireland 624 7,068 259 3 15 2,020Isle of Man 0 448 0 3 0 0Israel 33 634 0 8 0 0Italy (incl. San Marino) 1,739 22,565 94 799 10 78Japan 148 3,804 172 0 0 142Jersey 186 1,665 0 17 169 3Luxembourg 2,366 14,067 2 393 0 1,749Malaysia 67 814 0 441 0 0Mauritius 103 339 0 0 0 0Mexico 6 1,866 0 110 0 0Netherlands 1,144 14,662 122 0 0 322Norway 12 990 0 105 0 0Pakistan 26 297 0 8 0 0Philippines 6 529 0 144 0 0Poland 666 7,821 0 7 0 0Portugal 78 2,523 68 0 18 0Russian Federation 21 1,032 0 0 0 0Saudi Arabia 10 8,371 0 0 0 0Singapore 91 6,611 46 455 0 87Slovakia 0 52 0 0 0 0South Africa 7 4,895 0 968 0 0South Korea 33 782 0 0 0 0Spain 393 15,126 98 1,158 2 128Sweden 0 1,540 1 70 0 0Switzerland 46 11,090 0 290 0 0Taiwan 3 1,943 0 253 0 0Thailand 19 1,587 0 150 0 0Turkey 29 940 0 0 0 0United Arab Emirates 33 1,185 67 66 0 0United Kingdom 819 25,060 1,585 0 74 460United States of America(incl. Puerto Rico) 3,029 136,099 3,313 5,592 1,206 43,479Venezuela 0 42 0 58 0 0Other 314 12,087 29 402 196 3,321Total 23,363 599,408 7,478 17,740 1,794 61,008
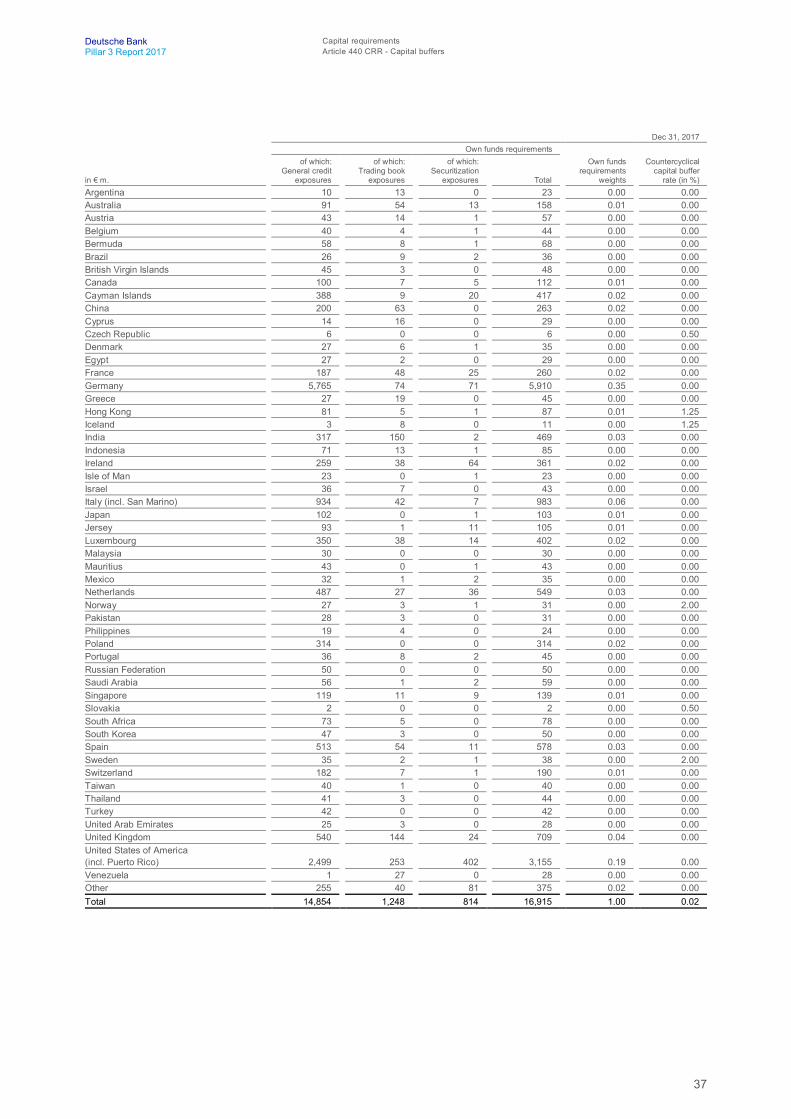
37
Deutsche Bank Capital requirementsPillar 3 Report 2017 Article 440 CRR - Capital buffers
Dec 31, 2017Own funds requirements
in € m.
of which: General credit
exposures
of which: Trading book
exposures
of which: Securitization
exposures Total
Own funds requirements
weights
Countercyclical capital buffer
rate (in %)Argentina 10 13 0 23 0.00 0.00Australia 91 54 13 158 0.01 0.00Austria 43 14 1 57 0.00 0.00Belgium 40 4 1 44 0.00 0.00Bermuda 58 8 1 68 0.00 0.00Brazil 26 9 2 36 0.00 0.00British Virgin Islands 45 3 0 48 0.00 0.00Canada 100 7 5 112 0.01 0.00Cayman Islands 388 9 20 417 0.02 0.00China 200 63 0 263 0.02 0.00Cyprus 14 16 0 29 0.00 0.00Czech Republic 6 0 0 6 0.00 0.50Denmark 27 6 1 35 0.00 0.00Egypt 27 2 0 29 0.00 0.00France 187 48 25 260 0.02 0.00Germany 5,765 74 71 5,910 0.35 0.00Greece 27 19 0 45 0.00 0.00Hong Kong 81 5 1 87 0.01 1.25Iceland 3 8 0 11 0.00 1.25India 317 150 2 469 0.03 0.00Indonesia 71 13 1 85 0.00 0.00Ireland 259 38 64 361 0.02 0.00Isle of Man 23 0 1 23 0.00 0.00Israel 36 7 0 43 0.00 0.00Italy (incl. San Marino) 934 42 7 983 0.06 0.00Japan 102 0 1 103 0.01 0.00Jersey 93 1 11 105 0.01 0.00Luxembourg 350 38 14 402 0.02 0.00Malaysia 30 0 0 30 0.00 0.00Mauritius 43 0 1 43 0.00 0.00Mexico 32 1 2 35 0.00 0.00Netherlands 487 27 36 549 0.03 0.00Norway 27 3 1 31 0.00 2.00Pakistan 28 3 0 31 0.00 0.00Philippines 19 4 0 24 0.00 0.00Poland 314 0 0 314 0.02 0.00Portugal 36 8 2 45 0.00 0.00Russian Federation 50 0 0 50 0.00 0.00Saudi Arabia 56 1 2 59 0.00 0.00Singapore 119 11 9 139 0.01 0.00Slovakia 2 0 0 2 0.00 0.50South Africa 73 5 0 78 0.00 0.00South Korea 47 3 0 50 0.00 0.00Spain 513 54 11 578 0.03 0.00Sweden 35 2 1 38 0.00 2.00Switzerland 182 7 1 190 0.01 0.00Taiwan 40 1 0 40 0.00 0.00Thailand 41 3 0 44 0.00 0.00Turkey 42 0 0 42 0.00 0.00United Arab Emirates 25 3 0 28 0.00 0.00United Kingdom 540 144 24 709 0.04 0.00United States of America(incl. Puerto Rico) 2,499 253 402 3,155 0.19 0.00Venezuela 1 27 0 28 0.00 0.00Other 255 40 81 375 0.02 0.00Total 14,854 1,248 814 16,915 1.00 0.02

38
Deutsche Bank Capital requirementsPillar 3 Report 2017 Article 440 CRR - Capital buffers
Article 440 (b) CRR - Institution specific countercyclical capital buffer
The following table shows an overview of our countercyclical exposure and buffer requirements.
Institution-specific countercyclical capital buffer Dec 31, 2017 Dec 31, 2016
Total risk exposure amount (in € m.)1 343,316 356,235Institution specific countercyclical buffer rate 0.02 % 0.01 %Institution specific countercyclical buffer requirement (in € m.) 53 401 To calculate the institution specific countercyclical buffer requirement the phase-in value of the total risk exposure amount is used.

39
Deutsche Bank Credit risk and credit risk mitigationPillar 3 Report 2017 General quantitative information on credit risk
Credit risk and credit risk mitigation
General qualitative information on credit riskArticle 442 (a) CRR - Definitions of past due and impairment
For details please refer to the section “Asset Quality” in our Annual Report 2017 on page 111 as well as to the section “Article452 (c) - Internal rating-based approaches” further down in the Pillar 3 Report on the pages 61 to 63.
Article 442 (b) CRR - Credit risk adjustments
For details please refer to the section “Asset Quality” in our Annual Report 2017 on the pages 111 to 119.
General quantitative information on credit riskArticle 442 (c) CRR - Total and average amount of credit exposure by exposureclasses
The table EU CRB-B below shows the total and average net credit risk exposures based on IFRS accounting values accordingto the regulatory scope of consolidation. For on-balance sheet items the "Net value of exposure" is calculated by deductingcredit risk adjustments from the gross amount and for off-balance sheet respective provisions have been deducted. Thebreakout into the exposure classes follows those as defined for the IRBA (i.e. combining the advanced and foundation IRB) aswell as the for the standardized approach. The line item “central governments or central banks” includes exposures to regionalgovernments or local authorities, public sector entities, multilateral developments banks and international organizations. Theexposure class “Other Items” within the standardized approach includes all exposures not covered in the other categories. Theaverage credit exposure is calculated as on December 31, 2017 taking the averages of all four quarters of the fiscal year.
EU CRB-B – Total and average net amount of exposuresDec 31, 2017
a b
in € m.Net exposure
at the end of the period Average net exposure
over the period1 Central governments and central banks 116,542 113,6942 Institutions 26,817 25,0923 Corporates 362,630 339,094
thereof:5 SMEs 16,693 14,8504 Specialized lending 32,345 30,2674a Other 313,593 293,9766 Retail 217,727 212,197
thereof:8 Secured by real estate property SMEs 9,861 9,4249 Secured by real estate property non-SMEs 156,716 155,42910 Qualifying revolving 16,941 11,44212 Other retail SMEs 5,739 6,45413 Other retail non-SMEs 28,469 29,44914 Equity 1,476 1,87214a Other non-credit obligation asset 7,882 6,79215 Total IRB approach 733,073 698,74116 Central governments or central banks 153,171 149,37317 Regional governments or local authorities 12,208 12,58418 Public sector entities 6,505 6,75219 Multilateral development banks 5,234 5,54320 International organizations 2,125 1,97621 Institutions 1,796 1,49622 Corporates 14,445 14,68924 Retail 4,817 10,64026 Secured by mortgages on immovable property 3,948 3,98428 Exposures in default 1,014 1,31229 Items associated with particularly high risk 254 18530 Covered bonds 0 031 Claims on institutions and corporates with a short-term credit assessment 0 0

40
Deutsche Bank Credit risk and credit risk mitigationPillar 3 Report 2017 General quantitative information on credit risk
Dec 31, 2017a b
in € m.Net exposure
at the end of the period Average net exposure
over the period32 Collective investments undertakings (CIU) 0 033 Equity exposures 140 17234 Other items 124 9435 Total standardized approach 205,781 208,79936 Total1 938,854 907,5401 The table reflects the fully loaded exposure view and therefore does not include the exposure shift from the advanced IRB to the standard approach of grandfathered equityinvestments.
Article 442 (d) CRR - Geographic distribution of credit exposure
The table EU CRB-C below shows exposures broken down by significant geographical areas and exposure classes. For on-balance sheet items the "Net value of exposure" is calculated by deducting credit risk adjustments from the gross amount andfor off-balance sheet respective provisions have been deducted. Hence, credit risk exposures values are shown after account-ing offsets but before credit risk mitigation. They are based on IFRS accounting values according to the regulatory scope ofconsolidation.
We consider a country as being significant, if it contributes to an aggregate of 90 % of our total exposure. An area is consideredsignificant if it contains at least one significant country. The geographical distribution is based on the legal domicile of the coun-terparty or issuer. Exposures to geographical areas or countries that are not deemed significant are aggregated and reported inthe residual column ‘other geographical areas’ or (within each significant area) ‘other countries’.

41
Deutsche Bank Credit risk and credit risk mitigationPillar 3 Report 2017 General quantitative information on credit risk
The breakdown into the exposure classes follows those as defined for the IRBA (i.e. combining the advanced and foundationIRB) as well as for the standardized approach. The line item “central governments or central banks” includes exposures toregional governments or local authorities, public sector entities, multilateral developments banks and international organizations.The exposure class “Other items” within the standardized approach includes all exposures not covered in the other categories.
EU CRB-C – Geographical breakdown of exposuresDec 31, 2017
a b c d e f gEurope
in € m. Europe GermanyUnited
Kingdom France Luxembourg Italy Netherlands1 Central governments and central banks 12,061 3,835 0 0 441 215 02 Institutions 10,729 2,146 1,512 1,264 745 159 6463 Corporates 179,873 77,046 11,698 12,333 8,711 9,839 15,536
thereof:3a SMEs 14,554 10,012 97 119 20 1,800 4353b Specialized lending 14,909 3,337 968 861 1,704 632 1,1373c Other 150,656 63,697 10,633 11,352 6,987 7,407 13,9654 Retail 217,147 182,872 507 174 44 15,240 163
thereof:4a Secured by real estate property SMEs 9,855 9,406 1 3 15 139 3
4b Secured by real estate property non-SMEs 156,475 134,495 165 65 25 8,040 88
4c Qualifying revolving 16,903 16,768 6 13 1 47 64d Other retail SMEs 5,711 3,226 5 7 0 877 74e Other retail non-SMEs 28,203 18,977 330 86 2 6,138 595 Equity 687 106 192 1 52 43 15a Other non-credit obligation asset 5,110 4,743 224 0 63 0 56 Total IRB approach 425,852 270,749 14,134 13,772 10,056 25,496 16,3517 Central governments or central banks 152,792 119,895 10,877 2,251 7,359 3,965 2,0848 Regional governments or local authorities 12,135 11,846 0 0 0 0 169 Public sector entities 6,408 6,290 84 0 0 0 010 Multilateral development banks 1,067 0 0 470 597 0 011 International organizations 923 0 0 0 603 0 012 Institutions 1,382 1,230 95 3 0 9 313 Corporates 7,755 4,158 1 56 1,361 522 57414 Retail 4,127 1,492 39 1 67 1,743 107
15 Secured by mortgages on immovableproperty 2,638 230 4 10 1,014 397 610
16 Exposures in default 830 327 10 0 5 112 11617 Items associated with particularly high risk 235 1 1 0 0 177 918 Covered bonds 0 0 0 0 0 0 0
19 Claims on institutions and corporates with ashort-term credit assessment 0 0 0 0 0 0 0
20 Collective investments undertakings (CIU) 0 0 0 0 0 0 021 Equity exposures 1 1 0 0 0 0 022 Other items 124 124 0 0 0 0 023 Total standardized approach 190,419 145,594 11,112 2,791 11,006 6,925 3,51924 Total 616,271 416,343 25,245 16,564 21,062 32,420 19,869

42
Deutsche Bank Credit risk and credit risk mitigationPillar 3 Report 2017 General quantitative information on credit risk
Dec 31, 2017h i j k l m n
Europein € m. Spain Ireland Switzerland Poland Belgium Other Europe North America
1 Central governments and central banks 193 0 3,299 2,056 12 2,009 87,3542 Institutions 463 129 534 1 1,273 1,856 5,5783 Corporates 7,333 4,909 13,114 2,597 2,566 14,192 135,609
thereof:3a SMEs 840 209 219 437 43 323 1,3783b Specialized lending 694 1,756 85 289 249 3,196 15,2193c Other 5,798 2,944 12,809 1,870 2,275 10,918 119,0134 Retail 9,914 29 263 5,583 51 2,306 112
thereof:4a Secured by real estate property SMEs 132 0 6 101 1 49 1
4b Secured by real estate property non-SMEs 7,072 26 186 4,883 33 1,396 76
4c Qualifying revolving 6 0 21 2 5 25 94d Other retail SMEs 1,361 1 4 135 2 87 94e Other retail non-SMEs 1,342 2 48 461 9 750 165 Equity 4 0 56 0 13 219 5835a Other non-credit obligation asset 1 0 2 32 0 41 1,9816 Total IRB approach 17,909 5,066 17,268 10,270 3,915 20,866 231,2187 Central governments or central banks 1,925 559 0 72 1,163 2,642 2378 Regional governments or local authorities 273 0 0 0 0 0 729 Public sector entities 34 0 0 0 0 0 9710 Multilateral development banks 0 0 0 0 0 0 011 International organizations 0 0 0 0 320 0 012 Institutions 1 1 26 0 3 11 18813 Corporates 141 531 71 55 19 267 5,26614 Retail 60 0 6 603 1 8 0
15 Secured by mortgages on immovableproperty 213 1 6 0 83 69 25
16 Exposures in default 9 210 0 9 4 29 017 Items associated with particularly high risk 0 0 0 11 0 37 018 Covered bonds 0 0 0 0 0 0 0
19 Claims on institutions and corporates with ashort-term credit assessment 0 0 0 0 0 0 0
20 Collective investments undertakings (CIU) 0 0 0 0 0 0 021 Equity exposures 0 0 0 0 0 0 12422 Other items 0 0 0 0 0 0 023 Total standardized approach 2,656 1,301 110 749 1,594 3,063 6,01024 Total 20,565 6,368 17,378 11,019 5,508 23,929 237,228
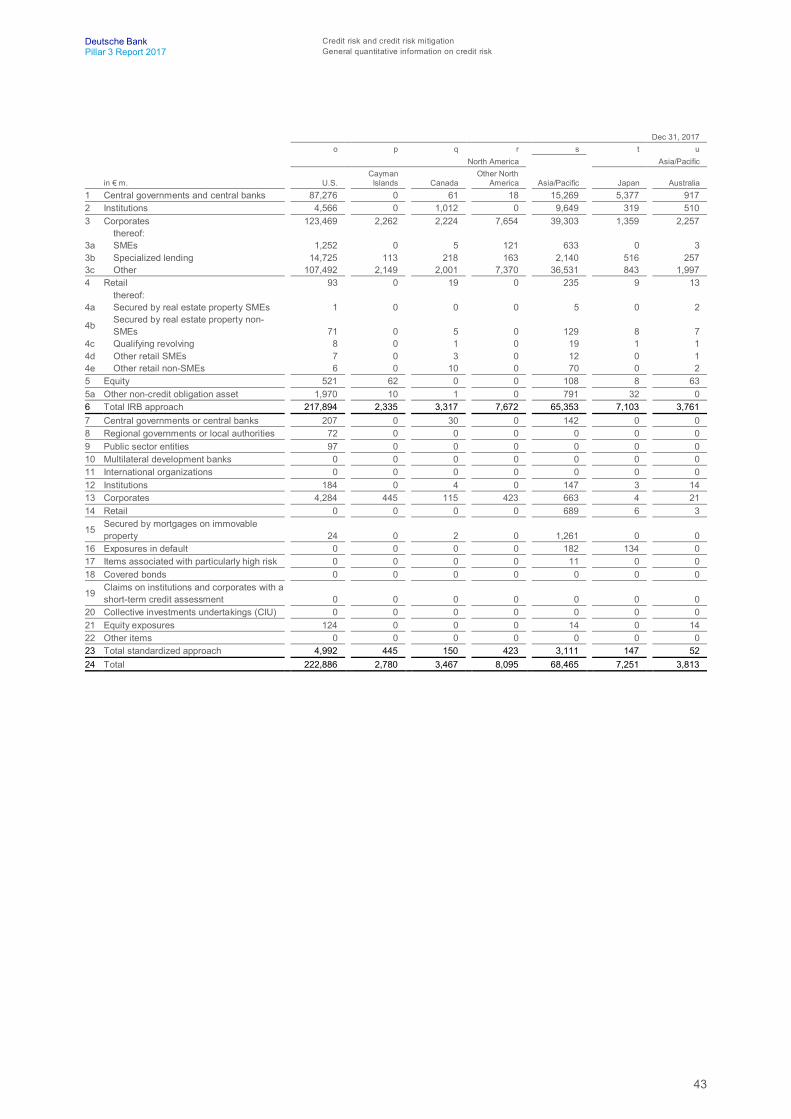
43
Deutsche Bank Credit risk and credit risk mitigationPillar 3 Report 2017 General quantitative information on credit risk
Dec 31, 2017o p q r s t u
North America Asia/Pacific
in € m. U.S.Cayman
Islands Canada Other North
America Asia/Pacific Japan Australia1 Central governments and central banks 87,276 0 61 18 15,269 5,377 9172 Institutions 4,566 0 1,012 0 9,649 319 5103 Corporates 123,469 2,262 2,224 7,654 39,303 1,359 2,257
thereof:3a SMEs 1,252 0 5 121 633 0 33b Specialized lending 14,725 113 218 163 2,140 516 2573c Other 107,492 2,149 2,001 7,370 36,531 843 1,9974 Retail 93 0 19 0 235 9 13
thereof:4a Secured by real estate property SMEs 1 0 0 0 5 0 2
4b Secured by real estate property non-SMEs 71 0 5 0 129 8 7
4c Qualifying revolving 8 0 1 0 19 1 14d Other retail SMEs 7 0 3 0 12 0 14e Other retail non-SMEs 6 0 10 0 70 0 25 Equity 521 62 0 0 108 8 635a Other non-credit obligation asset 1,970 10 1 0 791 32 06 Total IRB approach 217,894 2,335 3,317 7,672 65,353 7,103 3,7617 Central governments or central banks 207 0 30 0 142 0 08 Regional governments or local authorities 72 0 0 0 0 0 09 Public sector entities 97 0 0 0 0 0 010 Multilateral development banks 0 0 0 0 0 0 011 International organizations 0 0 0 0 0 0 012 Institutions 184 0 4 0 147 3 1413 Corporates 4,284 445 115 423 663 4 2114 Retail 0 0 0 0 689 6 3
15 Secured by mortgages on immovableproperty 24 0 2 0 1,261 0 0
16 Exposures in default 0 0 0 0 182 134 017 Items associated with particularly high risk 0 0 0 0 11 0 018 Covered bonds 0 0 0 0 0 0 0
19 Claims on institutions and corporates with ashort-term credit assessment 0 0 0 0 0 0 0
20 Collective investments undertakings (CIU) 0 0 0 0 0 0 021 Equity exposures 124 0 0 0 14 0 1422 Other items 0 0 0 0 0 0 023 Total standardized approach 4,992 445 150 423 3,111 147 5224 Total 222,886 2,780 3,467 8,095 68,465 7,251 3,813

44
Deutsche Bank Credit risk and credit risk mitigationPillar 3 Report 2017 General quantitative information on credit risk
Dec 31, 2017v w x y z aa ab
Asia/Pacific
in € m. India China Singapore Hong KongOther
Asia/Pacific
Other geographical
areas Total1 Central governments and central banks 1,869 1,088 1,426 303 4,288 1,858 116,5422 Institutions 2,081 3,311 180 326 2,921 861 26,8173 Corporates 6,835 3,415 5,593 5,332 14,512 7,845 362,630
thereof:3a SMEs 58 2 8 126 436 129 16,6933b Specialized lending 319 0 202 173 672 78 32,3453c Other 6,458 3,414 5,383 5,033 13,403 7,394 313,5934 Retail 19 31 21 12 129 233 217,727
thereof:4a Secured by real estate property SMEs 0 0 0 0 3 0 9,861
4b Secured by real estate property non-SMEs 2 21 17 10 65 36 156,716
4c Qualifying revolving 2 3 1 1 10 10 16,9414d Other retail SMEs 1 3 1 1 5 7 5,7394e Other retail non-SMEs 13 5 3 1 46 180 28,4695 Equity 16 10 2 8 1 98 1,4765a Other non-credit obligation asset 38 508 99 21 93 0 7,8826 Total IRB approach 10,858 8,363 7,321 6,003 21,943 10,650 733,0737 Central governments or central banks 2 23 2 3 112 0 153,1718 Regional governments or local authorities 0 0 0 0 0 0 12,2089 Public sector entities 0 0 0 0 0 0 6,50510 Multilateral development banks 0 0 0 0 0 4,166 5,23411 International organizations 0 0 0 0 0 1,202 2,12512 Institutions 9 16 10 26 70 79 1,79613 Corporates 171 30 1 70 364 760 14,44514 Retail 601 0 46 0 34 0 4,817
15 Secured by mortgages on immovableproperty 1,251 7 0 1 1 23 3,948
16 Exposures in default 46 0 2 1 0 2 1,01417 Items associated with particularly high risk 0 0 0 0 11 8 25418 Covered bonds 0 0 0 0 0 0 0
19 Claims on institutions and corporates with ashort-term credit assessment 0 0 0 0 0 0 0
20 Collective investments undertakings (CIU) 0 0 0 0 0 0 021 Equity exposures 0 0 0 0 0 0 14022 Other items 0 0 0 0 0 0 12423 Total standardized approach 2,080 76 61 101 593 6,240 205,78124 Total1 12,938 8,439 7,382 6,105 22,537 16,890 938,8541 The table reflects the fully loaded exposure view and therefore does not include the exposure shift from the advanced IRB to the standard approach of grandfathered equity
investments.

45
Deutsche Bank Credit risk and credit risk mitigationPillar 3 Report 2017 General quantitative information on credit risk
Article 442 (e) CRR - Distribution of credit exposure by industry type
The table EU CRB-D below shows net credit exposures by industry and exposure classes. The industry sector breakdown inthe columns below is consistent with table EU CR1-B. For on-balance sheet items the "net value of exposure" is calculated bydeducting credit risk adjustments from the gross amount and for off-balance sheet respective provisions have been deducted.The amounts shown are based on IFRS accounting values according to the regulatory scope of consolidation. The industrysector is defined using the first level of NACE (Nomenclature des Activités Économiques dans la Communauté Européenne)codes per the descriptive headings.
The breakdown into the exposure classes follows those as defined for the IRBA (i.e. combining the advanced and foundationIRB) as well as for the standardized approach. The line item “central governments or central banks” includes exposures toregional governments or local authorities, public sector entities, multilateral developments banks and international organizations.The exposure class “Other item” within the standardized approach includes all exposures not covered in the other categories.
EU CRB-D – Concentration of exposures by industry or counterparty typesDec 31, 2017
a b c d e f g
in € m.
Agriculture, forestry and
fishing Mining and
quarrying Manufacturing
Electricity, gas, steam and air conditioning
supply
Water supply, sewerage, waste mana- gement and remediation
activities Construction
Wholesale and retail trade,repair of motor vehicles and motorcycles
1 Central governments and central banks 0 0 0 0 0 0 02 Institutions 0 0 38 0 0 0 303 Corporates 1,163 9,059 78,701 4,916 1,079 9,497 28,213
thereof:3a SMEs 182 97 4,248 33 113 689 1,8973b Specialized lending 1 13 341 223 0 940 1213c Other 980 8,950 74,112 4,659 966 7,868 26,1954 Retail 230 16 1,883 14 52 1,166 2,440
thereof:
4a Secured by real estate propertySMEs 112 1 396 3 15 485 655
4b Secured by real estate property non-SMEs 32 4 292 2 5 242 436
4c Qualifying revolving 0 0 0 0 0 0 04d Other retail SMEs 67 8 994 7 28 294 1,0454e Other retail non-SMEs 19 3 201 2 5 144 3035 Equity 0 4 18 0 0 1 05a Other non-credit obligation asset 0 0 0 0 0 0 06 Total IRB approach 1,393 9,079 80,640 4,930 1,131 10,664 30,6827 Central governments or central banks 0 0 0 0 0 0 0
8 Regional governmentsor local authorities 0 0 0 0 0 0 0
9 Public sector entities 0 0 0 4 19 0 010 Multilateral development banks 0 0 0 0 0 0 011 International organizations 0 0 0 0 0 0 012 Institutions 0 0 0 0 0 0 013 Corporates 7 20 785 2 39 167 56614 Retail 3 2 187 1 3 28 122
15 Secured by mortgages on immovableproperty 71 3 384 3 2 47 320
16 Exposures in default 19 0 129 0 1 4 25
17 Items associated with particularly highrisk 0 0 9 0 0 92 15
18 Covered bonds 0 0 0 0 0 0 0
19 Claims on institutions and corporateswith a short-term credit assessment 0 0 0 0 0 0 0
20 Collective investments undertakings(CIU) 0 0 0 0 0 0 0
21 Equity exposures 0 0 0 0 0 1 022 Other items 0 0 0 0 0 0 023 Total standardized approach 100 26 1,494 10 63 338 1,04924 Total 1,493 9,105 82,134 4,940 1,194 11,002 31,731

46
Deutsche Bank Credit risk and credit risk mitigationPillar 3 Report 2017 General quantitative information on credit risk
Dec 31, 2017h i j l m n o p
in € m.Transportation and storage
Accommoda-tion and
food serviceactivities
Information andcommunication
Financial and insurance
activities Real estate
activities
Professional, scientific and
technicalactivities
Administrative and support
serviceactivities
Publicadministration and defense, compulsorysocial security
1 Central governmentsand central banks 0 0 0 92,074 0 0 0 24,026
2 Institutions 0 0 0 24,747 0 0 0 2,0023 Corporates 12,792 3,645 21,512 85,037 32,376 9,226 7,213 1,447
thereof:3a SMEs 346 512 281 2,227 2,254 1,095 510 693b Specialized lending 3,363 728 0 2,680 19,542 158 710 1913c Other 9,082 2,405 21,231 80,130 10,579 7,973 5,994 1,1864 Retail 393 500 489 1,053 876 4,505 1,155 2
thereof:
4a Secured by real es-tate property SMEs 79 195 152 490 485 1,151 448 0
4bSecured by real es-tate property non-SMEs 81 123 142 183 367 2,404 353 0
4c Qualifying revolving 0 0 0 0 0 0 0 04d Other retail SMEs 179 114 136 66 13 557 208 14e Other retail non-SMEs 53 69 59 313 10 393 146 15 Equity 0 0 21 896 201 14 37 3
5a Other non-credit obliga-tion asset 0 0 1 1,737 0 0 2,052 0
6 Total IRB approach 13,185 4,146 22,022 205,544 33,453 13,746 10,457 27,481
7 Central governments orcentral banks 0 0 0 132,852 0 0 0 20,319
8 Regional governmentsor local authorities 0 0 0 0 12 0 0 12,194
9 Public sector entities 0 0 0 6,143 0 4 0 286
10 Multilateral developmentbanks 0 0 0 4,637 0 0 0 0
11 Internationalorganizations 0 0 0 603 0 0 0 1,522
12 Institutions 0 0 0 1,796 0 0 0 013 Corporates 215 34 379 4,661 526 253 1,228 014 Retail 37 14 22 20 0 48 199 1
15 Secured by mortgageson immovable property 45 36 29 193 152 38 26 3
16 Exposures in default 14 2 2 69 102 160 60 3
17 Items associated withparticularly high risk 0 4 1 41 12 8 1 0
18 Covered bonds 0 0 0 0 0 0 0 0
19
Claims on institutionsand corporates with ashort-term credit as-sessment 0 0 0 0 0 0 0 0
20 Collective investmentsundertakings (CIU) 0 0 0 0 0 0 0 0
21 Equity exposures 0 0 0 55 6 0 5 022 Other items 0 0 0 0 0 0 0 0
23 Total standardizedapproach 312 89 432 151,069 810 511 1,518 34,329
24 Total 13,497 4,234 22,455 356,613 34,263 14,256 11,975 61,810
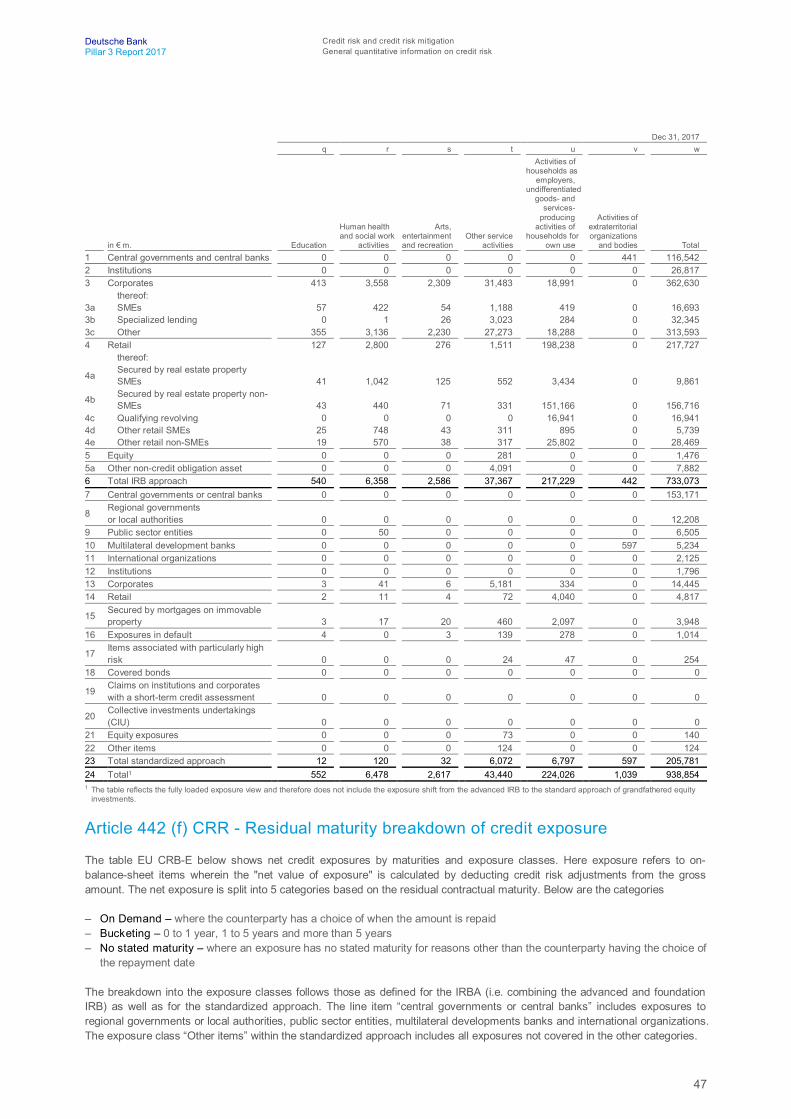
47
Deutsche Bank Credit risk and credit risk mitigationPillar 3 Report 2017 General quantitative information on credit risk
Dec 31, 2017q r s t u v w
in € m. Education
Human healthand social work
activities
Arts, entertainmentand recreation
Other serviceactivities
Activities ofhouseholds as employers,undifferentiated goods- and
services- producing activities ofhouseholds for
own use
Activities of extraterritorial organizations and bodies Total
1 Central governments and central banks 0 0 0 0 0 441 116,5422 Institutions 0 0 0 0 0 0 26,8173 Corporates 413 3,558 2,309 31,483 18,991 0 362,630
thereof:3a SMEs 57 422 54 1,188 419 0 16,6933b Specialized lending 0 1 26 3,023 284 0 32,3453c Other 355 3,136 2,230 27,273 18,288 0 313,5934 Retail 127 2,800 276 1,511 198,238 0 217,727
thereof:
4a Secured by real estate propertySMEs 41 1,042 125 552 3,434 0 9,861
4b Secured by real estate property non-SMEs 43 440 71 331 151,166 0 156,716
4c Qualifying revolving 0 0 0 0 16,941 0 16,9414d Other retail SMEs 25 748 43 311 895 0 5,7394e Other retail non-SMEs 19 570 38 317 25,802 0 28,4695 Equity 0 0 0 281 0 0 1,4765a Other non-credit obligation asset 0 0 0 4,091 0 0 7,8826 Total IRB approach 540 6,358 2,586 37,367 217,229 442 733,0737 Central governments or central banks 0 0 0 0 0 0 153,171
8 Regional governmentsor local authorities 0 0 0 0 0 0 12,208
9 Public sector entities 0 50 0 0 0 0 6,50510 Multilateral development banks 0 0 0 0 0 597 5,23411 International organizations 0 0 0 0 0 0 2,12512 Institutions 0 0 0 0 0 0 1,79613 Corporates 3 41 6 5,181 334 0 14,44514 Retail 2 11 4 72 4,040 0 4,817
15 Secured by mortgages on immovableproperty 3 17 20 460 2,097 0 3,948
16 Exposures in default 4 0 3 139 278 0 1,014
17 Items associated with particularly highrisk 0 0 0 24 47 0 254
18 Covered bonds 0 0 0 0 0 0 0
19 Claims on institutions and corporateswith a short-term credit assessment 0 0 0 0 0 0 0
20 Collective investments undertakings(CIU) 0 0 0 0 0 0 0
21 Equity exposures 0 0 0 73 0 0 14022 Other items 0 0 0 124 0 0 12423 Total standardized approach 12 120 32 6,072 6,797 597 205,78124 Total1 552 6,478 2,617 43,440 224,026 1,039 938,8541 The table reflects the fully loaded exposure view and therefore does not include the exposure shift from the advanced IRB to the standard approach of grandfathered equity
investments.
Article 442 (f) CRR - Residual maturity breakdown of credit exposure
The table EU CRB-E below shows net credit exposures by maturities and exposure classes. Here exposure refers to on-balance-sheet items wherein the "net value of exposure" is calculated by deducting credit risk adjustments from the grossamount. The net exposure is split into 5 categories based on the residual contractual maturity. Below are the categories
‒ On Demand – where the counterparty has a choice of when the amount is repaid‒ Bucketing – 0 to 1 year, 1 to 5 years and more than 5 years‒ No stated maturity – where an exposure has no stated maturity for reasons other than the counterparty having the choice of
the repayment date
The breakdown into the exposure classes follows those as defined for the IRBA (i.e. combining the advanced and foundationIRB) as well as for the standardized approach. The line item “central governments or central banks” includes exposures toregional governments or local authorities, public sector entities, multilateral developments banks and international organizations.The exposure class “Other items” within the standardized approach includes all exposures not covered in the other categories.
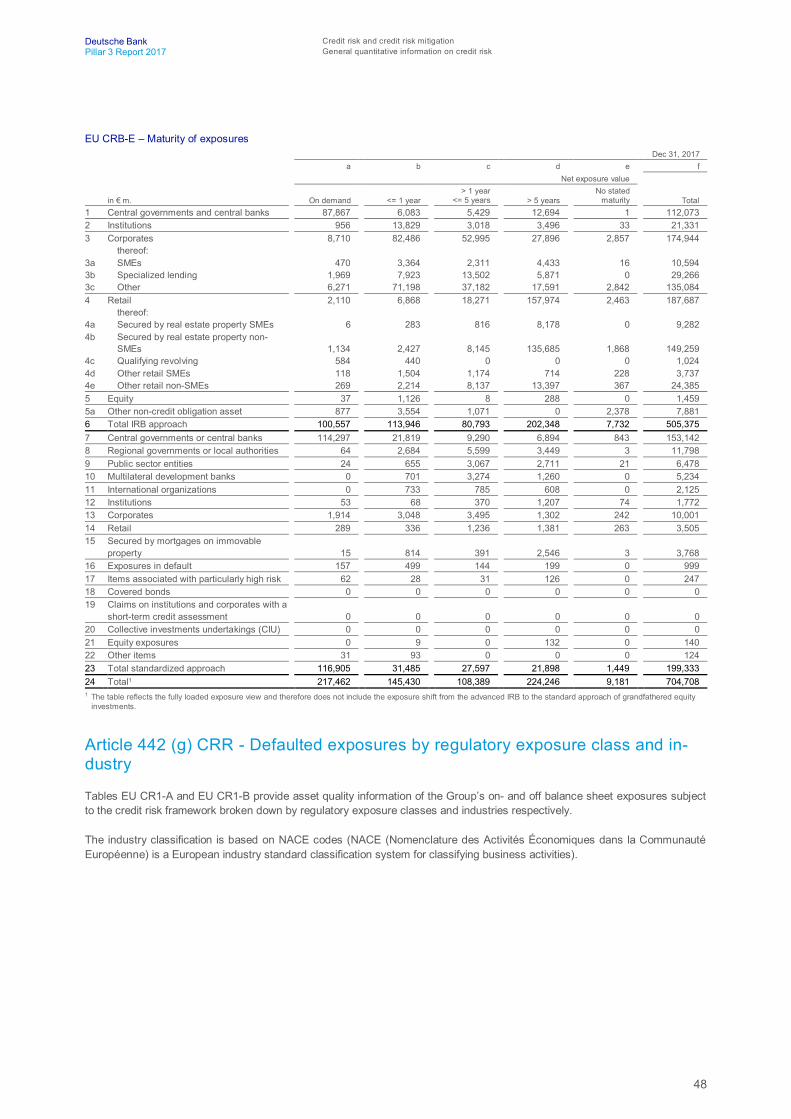
48
Deutsche Bank Credit risk and credit risk mitigationPillar 3 Report 2017 General quantitative information on credit risk
EU CRB-E – Maturity of exposuresDec 31, 2017
a b c d e fNet exposure value
in € m. On demand <= 1 year> 1 year
<= 5 years > 5 yearsNo stated
maturity Total1 Central governments and central banks 87,867 6,083 5,429 12,694 1 112,0732 Institutions 956 13,829 3,018 3,496 33 21,3313 Corporates 8,710 82,486 52,995 27,896 2,857 174,944
thereof:3a SMEs 470 3,364 2,311 4,433 16 10,5943b Specialized lending 1,969 7,923 13,502 5,871 0 29,2663c Other 6,271 71,198 37,182 17,591 2,842 135,0844 Retail 2,110 6,868 18,271 157,974 2,463 187,687
thereof:4a Secured by real estate property SMEs 6 283 816 8,178 0 9,2824b Secured by real estate property non-
SMEs 1,134 2,427 8,145 135,685 1,868 149,2594c Qualifying revolving 584 440 0 0 0 1,0244d Other retail SMEs 118 1,504 1,174 714 228 3,7374e Other retail non-SMEs 269 2,214 8,137 13,397 367 24,3855 Equity 37 1,126 8 288 0 1,4595a Other non-credit obligation asset 877 3,554 1,071 0 2,378 7,8816 Total IRB approach 100,557 113,946 80,793 202,348 7,732 505,3757 Central governments or central banks 114,297 21,819 9,290 6,894 843 153,1428 Regional governments or local authorities 64 2,684 5,599 3,449 3 11,7989 Public sector entities 24 655 3,067 2,711 21 6,47810 Multilateral development banks 0 701 3,274 1,260 0 5,23411 International organizations 0 733 785 608 0 2,12512 Institutions 53 68 370 1,207 74 1,77213 Corporates 1,914 3,048 3,495 1,302 242 10,00114 Retail 289 336 1,236 1,381 263 3,50515 Secured by mortgages on immovable
property 15 814 391 2,546 3 3,76816 Exposures in default 157 499 144 199 0 99917 Items associated with particularly high risk 62 28 31 126 0 24718 Covered bonds 0 0 0 0 0 019 Claims on institutions and corporates with a
short-term credit assessment 0 0 0 0 0 020 Collective investments undertakings (CIU) 0 0 0 0 0 021 Equity exposures 0 9 0 132 0 14022 Other items 31 93 0 0 0 12423 Total standardized approach 116,905 31,485 27,597 21,898 1,449 199,33324 Total1 217,462 145,430 108,389 224,246 9,181 704,7081 The table reflects the fully loaded exposure view and therefore does not include the exposure shift from the advanced IRB to the standard approach of grandfathered equity
investments.
Article 442 (g) CRR - Defaulted exposures by regulatory exposure class and in-dustry
Tables EU CR1-A and EU CR1-B provide asset quality information of the Group’s on- and off balance sheet exposures subjectto the credit risk framework broken down by regulatory exposure classes and industries respectively.
The industry classification is based on NACE codes (NACE (Nomenclature des Activités Économiques dans la CommunautéEuropéenne) is a European industry standard classification system for classifying business activities).
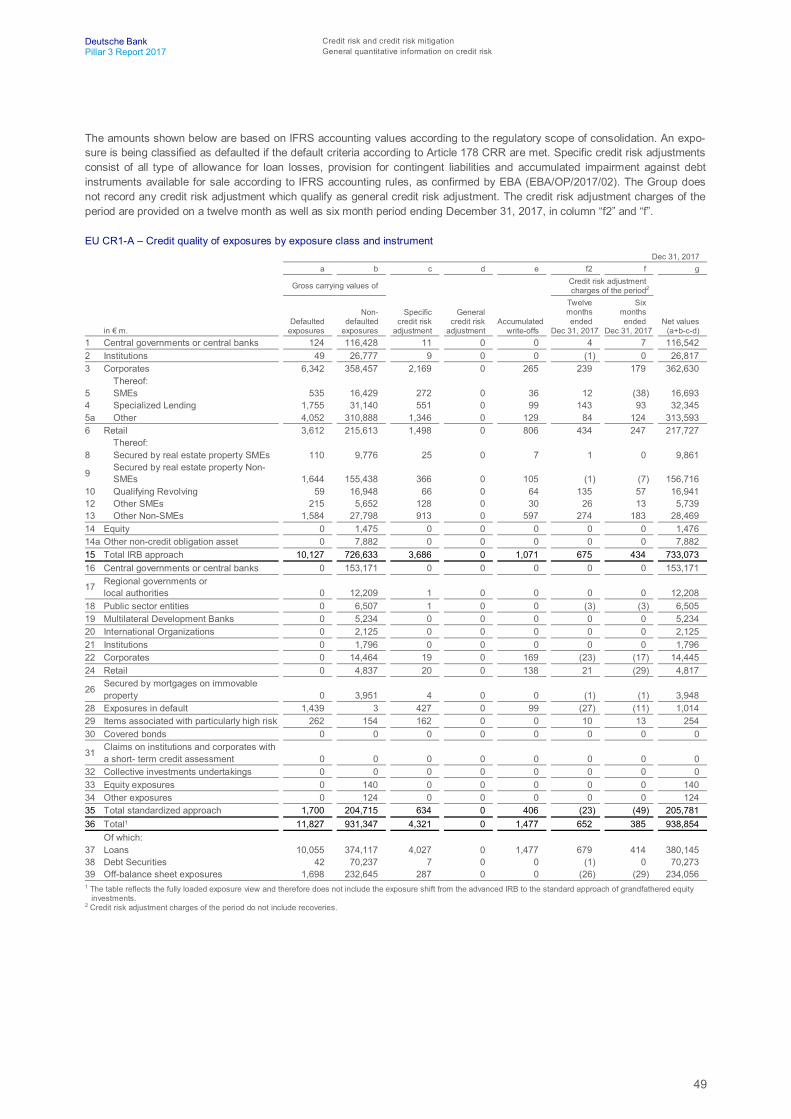
49
Deutsche Bank Credit risk and credit risk mitigationPillar 3 Report 2017 General quantitative information on credit risk
The amounts shown below are based on IFRS accounting values according to the regulatory scope of consolidation. An expo-sure is being classified as defaulted if the default criteria according to Article 178 CRR are met. Specific credit risk adjustmentsconsist of all type of allowance for loan losses, provision for contingent liabilities and accumulated impairment against debtinstruments available for sale according to IFRS accounting rules, as confirmed by EBA (EBA/OP/2017/02). The Group doesnot record any credit risk adjustment which qualify as general credit risk adjustment. The credit risk adjustment charges of theperiod are provided on a twelve month as well as six month period ending December 31, 2017, in column “f2” and “f”.
EU CR1-A – Credit quality of exposures by exposure class and instrumentDec 31, 2017
a b c d e f2 f g
Gross carrying values of Credit risk adjustmentcharges of the period2
in € m. Defaulted exposures
Non- defaulted exposures
Specific credit risk adjustment
General credit risk adjustment
Accumulated write-offs
Twelve months
endedDec 31, 2017
Six months
endedDec 31, 2017
Net values (a+b-c-d)
1 Central governments or central banks 124 116,428 11 0 0 4 7 116,5422 Institutions 49 26,777 9 0 0 (1) 0 26,8173 Corporates 6,342 358,457 2,169 0 265 239 179 362,630
Thereof:5 SMEs 535 16,429 272 0 36 12 (38) 16,6934 Specialized Lending 1,755 31,140 551 0 99 143 93 32,3455a Other 4,052 310,888 1,346 0 129 84 124 313,5936 Retail 3,612 215,613 1,498 0 806 434 247 217,727
Thereof:8 Secured by real estate property SMEs 110 9,776 25 0 7 1 0 9,861
9 Secured by real estate property Non-SMEs 1,644 155,438 366 0 105 (1) (7) 156,716
10 Qualifying Revolving 59 16,948 66 0 64 135 57 16,94112 Other SMEs 215 5,652 128 0 30 26 13 5,73913 Other Non-SMEs 1,584 27,798 913 0 597 274 183 28,46914 Equity 0 1,475 0 0 0 0 0 1,47614a Other non-credit obligation asset 0 7,882 0 0 0 0 0 7,88215 Total IRB approach 10,127 726,633 3,686 0 1,071 675 434 733,07316 Central governments or central banks 0 153,171 0 0 0 0 0 153,171
17 Regional governments orlocal authorities 0 12,209 1 0 0 0 0 12,208
18 Public sector entities 0 6,507 1 0 0 (3) (3) 6,50519 Multilateral Development Banks 0 5,234 0 0 0 0 0 5,23420 International Organizations 0 2,125 0 0 0 0 0 2,12521 Institutions 0 1,796 0 0 0 0 0 1,79622 Corporates 0 14,464 19 0 169 (23) (17) 14,44524 Retail 0 4,837 20 0 138 21 (29) 4,817
26 Secured by mortgages on immovableproperty 0 3,951 4 0 0 (1) (1) 3,948
28 Exposures in default 1,439 3 427 0 99 (27) (11) 1,01429 Items associated with particularly high risk 262 154 162 0 0 10 13 25430 Covered bonds 0 0 0 0 0 0 0 0
31 Claims on institutions and corporates witha short- term credit assessment 0 0 0 0 0 0 0 0
32 Collective investments undertakings 0 0 0 0 0 0 0 033 Equity exposures 0 140 0 0 0 0 0 14034 Other exposures 0 124 0 0 0 0 0 12435 Total standardized approach 1,700 204,715 634 0 406 (23) (49) 205,78136 Total1 11,827 931,347 4,321 0 1,477 652 385 938,854
Of which:37 Loans 10,055 374,117 4,027 0 1,477 679 414 380,14538 Debt Securities 42 70,237 7 0 0 (1) 0 70,27339 Off-balance sheet exposures 1,698 232,645 287 0 0 (26) (29) 234,0561 The table reflects the fully loaded exposure view and therefore does not include the exposure shift from the advanced IRB to the standard approach of grandfathered equity
investments.2 Credit risk adjustment charges of the period do not include recoveries.

50
Deutsche Bank Credit risk and credit risk mitigationPillar 3 Report 2017 General quantitative information on credit risk
EU CR1-B – Credit quality of exposures by industryDec 31, 2017
a b c d e f2 f g
Gross carrying values of Credit risk adjustmentcharges of the period1
in € m. Defaulted exposures
Non- defaulted exposures
Specific credit risk adjustment
General credit risk adjustment
Accumulated write-offs
Twelve months
endedDec 31, 2017
Six months
endedDec 31, 2017
Net values (a+b-c-d)
1 Agriculture, forestry and fishing 79 1,439 25 0 11 5 6 1,4932 Mining and quarrying 719 8,468 82 0 2 34 34 9,1053 Manufacturing 1,124 81,564 554 0 209 89 52 82,1344 Electricity, gas, steam and
air conditioning supply 17 4,929 5 0 1 1 0 4,9405 Water supply, sewerage, waste manage-
ment and remediation activities 11 1,190 8 0 2 (2) (1) 1,1946 Construction 545 10,787 330 0 64 11 10 11,0027 Wholesale and retail trade, repair of
motor vehicles and motorcycles 645 31,461 375 0 162 64 30 31,7318 Transport and storage 1,048 12,891 443 0 260 100 56 13,4979 Accommodation and food service
activities 55 4,199 20 0 5 3 1 4,23410 Information and communication 175 22,353 73 0 28 16 9 22,45510a Financial and insurance activities 1,369 355,552 307 0 35 20 2 356,61311 Real estate activities 1,019 33,418 174 0 82 (51) 1 34,26312 Professional, scientific and technical
activities 456 13,922 122 0 25 2 12 14,25613 Administrative and support service
activities 180 11,828 34 0 38 7 1 11,97514 Public administration and defense,
compulsory social security 129 61,694 13 0 0 0 4 61,81015 Education 12 547 8 0 5 1 0 55216 Human health services and social work
activities 57 6,450 30 0 4 9 4 6,47817 Arts, entertainment and recreation 173 2,464 19 0 1 0 0 2,61718 Other service activities 462 43,137 159 0 62 18 (21) 43,44018a Activities of households as employers,
undifferentiated goods- and services-producing activities of households forown use 3,551 222,015 1,539 0 483 326 185 224,026
18b Activities of extraterritorial organizationsand bodies 0 1,039 0 0 0 0 0 1,039
19 Total 11,827 931,347 4,321 0 1,477 652 385 938,8541 Credit risk adjustment charges of the period do not include recoveries.
Article 442 (h) CRR - Defaulted exposures by geographical area, past due, non-performing and forborne exposures
Table EU CR1-C provides asset quality information of the Group’s on- and off balance sheet exposures subject to the credit riskframework broken down by significant geographical regions as well as countries.
We consider a country as being significant, if it contributes to an aggregate of 90 % of our total exposure. An area is consideredsignificant if it contains at least one significant country. The geographical distribution is based on the legal domicile of the coun-terparty or issuer.
The amounts shown are based on IFRS accounting values according to the regulatory scope of consolidation. An exposure isbeing classified as defaulted if the default criteria according to Article 178 CRR are met. Specific credit risk adjustments consistof all type of allowance for loan losses, provision for contingent liabilities and accumulated impairment against debt instrumentsavailable for sale according to IFRS accounting rules, as confirmed by EBA (EBA/OP/2017/02). The Group does not book anycredit risk adjustment which qualify as general credit risk adjustment. The credit risk adjustment charges of the period are pro-vided on a twelve month as well as six month period ending December 31, 2017, in column “f2” and “f”.

51
Deutsche Bank Credit risk and credit risk mitigationPillar 3 Report 2017 General quantitative information on credit risk
EU CR1-C – Credit quality of exposures by geographyDec 31, 2017
a b c d e f2 f g
Gross carrying values ofCredit risk adjustmentcharges of the period1
in € m. Defaulted exposures
Non- defaulted exposures
Specific credit risk adjustment
General credit risk adjustment
Accumulated write-offs
Twelvemonthsended
Dec 31, 2017
Sixmonthsended
Dec 31, 2017 Net values (a+b-c-d)
1 Europe 9,139 610,808 3,675 0 1,338 558 328 616,271Thereof:
2 Germany 3,638 414,301 1,596 0 578 398 1,107 416,3433 United Kingdom 521 24,764 39 0 10 15 15 25,2454 France 7 16,565 9 0 0 1 3 16,5645 Luxembourg 134 20,969 41 0 0 22 18 21,0626 Italy 1,662 31,710 952 0 3 108 119 32,4207 Netherlands 901 19,272 304 0 1 (36) 18 19,8698 Spain 747 20,102 284 0 672 24 2 20,5659 Ireland 561 5,822 15 0 1 (2) (1) 6,36810 Switzerland 90 17,328 40 0 20 (7) (4) 17,37811 Poland 202 10,958 141 0 37 20 11 11,01912 Belgium 20 5,495 7 0 0 0 1 5,50813 Other Europe 655 23,520 246 0 54 27 18 23,92914 North America 1,774 235,782 329 0 71 56 19 237,228
Thereof:15 U.S. 1,460 221,682 256 0 47 (1) 12 222,88616 Cayman Islands 39 2,744 3 0 0 1 (3) 2,78017 Canada 54 3,433 20 0 24 13 3 3,46718 Other North America 221 7,924 50 0 0 43 7 8,09519 Asia/Pacific 650 68,102 288 0 26 35 34 68,465
Thereof:20 Japan 134 7,119 2 0 0 0 0 7,25121 Australia 56 3,770 12 0 0 1 0 3,81322 India 319 12,771 152 0 0 20 19 12,93823 China 23 8,446 30 0 0 6 6 8,43924 Singapore 26 7,364 8 0 25 1 (1) 7,38225 Hong Kong 2 6,107 5 0 0 0 (1) 6,10526 Other Asia/Pacific 90 22,525 78 0 0 8 10 22,53727 Other geographical areas 264 16,655 29 0 43 3 3 16,89028 Total 11,827 931,347 4,321 0 1,477 652 385 938,8541 Credit risk adjustment charges of the period do not include recoveries.
Table EU CR1-D provides a breakdown of the Group’s loans and debt securities, where contractually agreed payments ofprincipal or interest remain unpaid by the borrower by ageing of the overdue amounts irrespective of the impairment status ofthe borrower. The amounts shown are based on IFRS accounting values gross of credit risk adjustments according to the regu-latory scope of consolidation.
EU CR1-D – Ageing of past-due exposuresDec 31, 2017
1 2 3 in € m. Loans Debt Securities Total exposuresa ≤ 30 days 3,299 0 3,299b > 30 days ≤ 60 days 550 0 550c > 60 days ≤ 90 days 311 0 311d > 90 days ≤ 180 days 874 0 875e > 180 days ≤ 1 year 635 0 635f > 1 year 2,544 0 2,544
Table EU CR1-E provides an overview of the Group’s non-performing and forborne exposures as per EBA definitions (Imple-menting Technical Standards (ITS) on Supervisory reporting on forbearance and non-performing exposures under article 99(4)of Regulation (EU) No 575/2013) as well as of the impairments booked against and collaterals/guarantees received for theseexposures. Amounts in the table below reflect accounting values according to the regulatory scope of consolidation and includeall debt instruments other than held for trading as per our IFRS balance sheet as well as off balance sheet exposures. Forfurther information on the Group’s treatment of forbearances, please refer to the “Asset quality” section of our Annual Report2017 on page 111.

52
Deutsche Bank Credit risk and credit risk mitigationPillar 3 Report 2017 General quantitative information on credit risk
EU CR1-E – Non-performing and forborne exposuresDec 31, 2017
010 020 030
in € m. Debt securitiesLoans
and advancesOff-balance-sheet
exposuresa Gross carrying amount of performing and non-performing exposures 59,952 806,091 251,464
thereof:b Performing but past due >30 days and <=90 days 0 600 0c Performing forborne 0 1,558 103d Non-performing: 107 10,206 1,706
thereof:e Defaulted 107 9,892 1,706f Impaired 36 6,354 0g Forborne 14 3,085 82
Accumulated impairment and provisions and negative fair value adjustments due to creditrisk
h On performing exposures 14 376 159i thereof: Forborne 0 19 0j On non-performing exposures 20 3,601 150k thereof: Forborne 0 1,083 7
Collaterals and financial guarantees receivedl On non- performing exposures 0 3,838 482m thereof: Forborne exposures 0 1,974 43
Article 442 (i) CRR - Development of credit risk adjustments and defaulted loansand debt securities
Table EU CR2-A provides information on the development of the Group’s stock of specific credit risk adjustments held againstloans and debt securities subject to the credit risk framework that are defaulted or impaired in the second half of 2017. Amountsare based on IFRS accounting values according to the regulatory scope of consolidation.
EU CR2-A – Changes in the stock of general and specific credit risk adjustmentsDec 31, 2017
a b
in € m.
Accumulatedspecific credit risk
adjustment
Accumulatedgeneral credit risk
adjustment1 Opening balance 3,647 02 Increases due to amounts set aside for estimated loan losses during the period 677 03 Decreases due to amounts reversed for estimated loan losses during the period (254) 04 Decreases due to amounts taken against accumulated credit risk adjustments (407) 05 Transfers between credit risk adjustments 0 06 Impact of exchange rate differences (11) 07 Business combinations, including acquisitions and disposals of subsidiaries 0 08 Other adjustments (32) 09 Closing balance 3,621 010 Recoveries on credit risk adjustments recorded directly to the statement of profit or loss (73) 011 Specific credit risk adjustments recorded directly to the statement of profit or loss (12) 0
Accumulated specific credit risk adjustments held against defaulted or impaired loans and debt securities slightly decreased inthe second half of 2017, driven by a reduction in CIB among others related to charge offs in the shipping portfolio and partlyoffset by an increase in PCB driven by Postbank.
Table EU CR2-B provides information on the development of the Group’s defaulted or impaired loans and debt securities sub-ject to the credit risk framework for the second half of 2017. Amounts are based on IFRS accounting values according to theregulatory scope of consolidation.
EU CR2-B – Changes in the stock of defaulted and impaired loans and debt securities Dec 31, 2017
a
in € m.
Gross carrying value defaulted
exposures1 Opening balance 11,0712 Loans and debt securities that have defaulted or impaired since the last reporting period 1,9153 Returned to non-defaulted status (2,356)4 Amounts written off (407)5 Other changes (126)6 Closing balance 10,097

53
Deutsche Bank Credit risk and credit risk mitigationPillar 3 Report 2017 General quantitative information on credit risk mitigation
Defaulted or impaired loans and debt securities subject to the credit risk framework decreased by € 977 million or 9 % in thesecond half of the year 2017. This reduction was driven by charge offs in our portfolio of impaired loans driven by the shippingportfolio in CIB and PCC International along with a reduction in our defaulted but not impaired portfolio of loans available forsale held within CIB.
For IFRS-based asset quality information please refer to the section “Asset quality” in our Annual Report 2017 on page 111.
General qualitative information on credit risk mitigationArticle 453 (a) CRR - Use of on- and off-balance sheet netting
Please refer to the Annual Report 2017 section “Managing and Mitigation of Credit Risk” on page 61.
Article 453 (b) CRR - Collateral valuation and management
Please refer to the Annual Report 2017 section “Managing and Mitigation of Credit Risk” on page 61.
Article 453 (c) CRR - Main types of collateral
Please refer to the Annual Report 2017 section “Managing and Mitigation of Credit Risk” on page 61.
Article 453 (d) CRR - Main types of guarantor and credit derivative counterparties
Please refer to the Annual Report 2017 section “Managing and Mitigation of Credit Risk” on page 61.
Article 453 (e) CRR - Risk concentrations within credit risk mitigation
Please refer to the Annual Report 2017 section “Managing and Mitigation of Credit Risk” subsection “Concentrations withinCredit Risk Mitigation” on page 64.
General quantitative information on credit risk mitigationArticle 453 (f-g) CRR - Overview of credit risk mitigation techniques
The table EU CR3 below shows a breakdown of unsecured and secured credit risk exposures and credit risk exposures se-cured by various credit risk mitigants for all loans and debt securities including the carrying amounts of the total populationwhich are in default. Exposures unsecured (column a) represent the carrying amount of credit risk exposures (net of credit riskadjustments) that do not benefit from a credit risk mitigation (CRM) technique, regardless of whether this technique is recog-nized in the CRR. Exposures secured (column b) represent the carrying amount of exposures that have at least one CRMmechanism (collateral, financial guarantees, credit derivatives) associated with them. Exposure secured by various credit riskmitigants (column c-e) are the carrying amount of exposures (net of credit risk adjustments) partly or totally secured by collateral,financial guarantees and credit derivatives, whereby only the secured portion of the overall exposure is presented. The alloca-tion of the carrying amount of multisecured exposures to their different CRM mechanisms is made by order of priority, startingwith the CRM mechanism expected to be called first in the event of a loss, and within the limits of the carrying amount of thesecured exposures. Moreover, no overcollateralization is considered.
EU CR3 – CRM techniques – OverviewDec 31, 2017
a b c d e
in € m.
Exposuresunsecured:
Carrying amount
Exposuressecured:
Carrying amount
Exposuressecured by
collateral
Exposuressecured by
financialguarantees
Exposuressecured by credit
derivatives1 Total Loans 111,374 268,771 224,938 18,610 8152 Total Debt securities 70,259 14 0 0 03 Total exposures 181,633 268,784 224,938 18,610 8154 thereof defaulted 2,406 4,070 3,160 474 0

54
Deutsche Bank Credit risk and credit risk mitigationPillar 3 Report 2017 General quantitative information on credit risk mitigation
Risk-weighted assets and regulatory capital requirements can be managed actively by credit risk mitigation techniques. As aprerequisite for recognition in regulatory calculations, we must adhere to certain minimum requirements as stipulated in theCRR regarding collateral management, monitoring processes and legal enforceability.
The range of collateral being eligible for regulatory recognition is dependent predominantly on the regulatory capital calculationmethod used for a specific risk position. The principle is that a higher degree of sophistication with regard to the underlyingmethodology generally leads to a wider range of admissible collateral and options to recognize protection via guarantees andcredit derivatives. However, also the minimum requirements to be adhered to and the mechanism available to reflect the riskmitigation benefits are predominantly a function of the regulatory calculation method applied.
The advanced IRBA generally accepts all types of financial collateral, as well as real estate, collateral assignments and otherphysical collateral. In our application of the advanced IRBA, there is basically no limitation to the range of accepted collateral aslong as we can demonstrate to the competent authorities that reliable estimates of the collateral values can be generated andthat basic requirements are fulfilled.
The same principle holds true for taking benefits from guarantee and credit derivative arrangements. Within the advanced IRBA,again there are generally no limitations with regard to the range of eligible collateral providers as long as some basic minimumrequirements are met. However, collateral providers’ credit quality and other relevant factors are incorporated through our inter-nal models.
In our advanced IRBA calculations financial and other collateral is generally considered through an adjustment to the applicableLGD as the input parameter for determining the risk weight. For recognizing protection from guarantees and credit derivatives,generally a PD substitution approach is applied, i.e., within the advanced IRBA risk-weight calculation the PD of the borrower isreplaced by the protection seller’s or guarantor’s PD. However, for certain guaranteed exposures and certain protection provid-ers the so-called double default treatment is applicable. The double default effect implies that for a guaranteed exposure a lossonly occurs if the originator and the guarantor fail to meet their obligations at the same time.
The foundation IRBA sets stricter limitations with regard to the eligibility of credit risk mitigation compared to the advanced IRBAbut allows for consideration of financial collateral, guarantees and credit derivatives as well as other foundation IRBA-eligiblecollateral like mortgages and security assignments.
The financial collateral recognized in the foundation IRBA essentially comprises cash, bonds and other securities related torepo lending.
In the standardized approach, collateral recognition is limited to eligible financial collateral, such as cash, gold bullion, certaindebt securities, equities and CIUs, in many cases only with their volatility-adjusted collateral value. In its general structure, thestandardized approach provides a preferred (lower) risk-weight for “claims secured by real estate property” while real estateasset is not considered as an explicit collateral item under the standardized approach. Further limitations must be consideredwith regard to eligible guarantee and credit derivative providers.
In order to reflect risk mitigation techniques in the calculation of capital requirements we apply the financial collateral compre-hensive method since the higher sophistication of that method allows a broader range of eligible collateral. Within this approach,financial collateral is reflected through a reduction in the exposure value of the respective risk position, while protection taken inthe form of guarantees and credit derivatives is considered by means of a substitution, i.e., the borrower’s risk weight is re-placed by the risk weight of the protection provider.
The table CRM techniques by exposure class below shows a breakdown of unsecured and secured credit risk exposures andcredit risk exposures secured by various credit risk mitigants broken down by exposure class. Exposures unsecured (column a)represent the carrying amount of credit risk exposures (net of credit risk adjustments) that do not benefit from a credit risk miti-gation (CRM) technique, regardless of whether this technique is recognized in the CRR. Exposures secured (column b) repre-sent the carrying amount of exposures that have at least one CRM mechanism (collateral, financial guarantees, creditderivatives) associated with them. Exposure secured by various credit risk mitigants (column c-e) are the carrying amount ofexposures (net of credit risk adjustments) partly or totally secured by collateral, financial guarantees and credit derivatives,whereby only the secured portion of the overall exposure is presented. The breakdown into the exposure classes follows thoseas defined for the IRBA (i.e. combining the advanced and foundation IRB) as well as the standardized approach. The line item“central governments or central banks” includes exposures to regional governments or local authorities, public sector entities,multilateral developments banks and international organizations. The exposure class “Other Items” within the standardizedapproach includes all exposures not covered in the other categories.
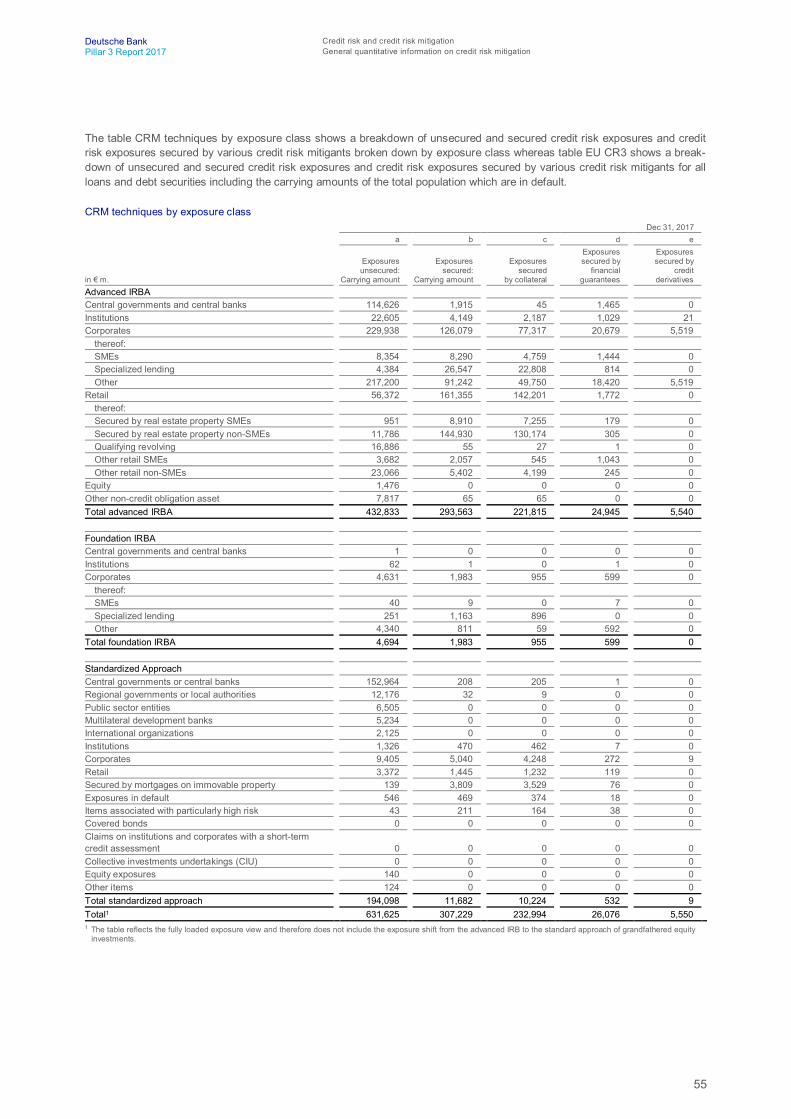
55
Deutsche Bank Credit risk and credit risk mitigationPillar 3 Report 2017 General quantitative information on credit risk mitigation
The table CRM techniques by exposure class shows a breakdown of unsecured and secured credit risk exposures and creditrisk exposures secured by various credit risk mitigants broken down by exposure class whereas table EU CR3 shows a break-down of unsecured and secured credit risk exposures and credit risk exposures secured by various credit risk mitigants for allloans and debt securities including the carrying amounts of the total population which are in default.
CRM techniques by exposure classDec 31, 2017
a b c d e
in € m.
Exposuresunsecured:
Carrying amount
Exposuressecured:
Carrying amount
Exposuressecured
by collateral
Exposuressecured by
financialguarantees
Exposuressecured by
creditderivatives
Advanced IRBACentral governments and central banks 114,626 1,915 45 1,465 0Institutions 22,605 4,149 2,187 1,029 21Corporates 229,938 126,079 77,317 20,679 5,519
thereof:SMEs 8,354 8,290 4,759 1,444 0Specialized lending 4,384 26,547 22,808 814 0Other 217,200 91,242 49,750 18,420 5,519
Retail 56,372 161,355 142,201 1,772 0thereof:Secured by real estate property SMEs 951 8,910 7,255 179 0Secured by real estate property non-SMEs 11,786 144,930 130,174 305 0Qualifying revolving 16,886 55 27 1 0Other retail SMEs 3,682 2,057 545 1,043 0Other retail non-SMEs 23,066 5,402 4,199 245 0
Equity 1,476 0 0 0 0Other non-credit obligation asset 7,817 65 65 0 0Total advanced IRBA 432,833 293,563 221,815 24,945 5,540
Foundation IRBACentral governments and central banks 1 0 0 0 0Institutions 62 1 0 1 0Corporates 4,631 1,983 955 599 0
thereof:SMEs 40 9 0 7 0Specialized lending 251 1,163 896 0 0Other 4,340 811 59 592 0
Total foundation IRBA 4,694 1,983 955 599 0
Standardized ApproachCentral governments or central banks 152,964 208 205 1 0Regional governments or local authorities 12,176 32 9 0 0Public sector entities 6,505 0 0 0 0Multilateral development banks 5,234 0 0 0 0International organizations 2,125 0 0 0 0Institutions 1,326 470 462 7 0Corporates 9,405 5,040 4,248 272 9Retail 3,372 1,445 1,232 119 0Secured by mortgages on immovable property 139 3,809 3,529 76 0Exposures in default 546 469 374 18 0Items associated with particularly high risk 43 211 164 38 0Covered bonds 0 0 0 0 0Claims on institutions and corporates with a short-termcredit assessment 0 0 0 0 0Collective investments undertakings (CIU) 0 0 0 0 0Equity exposures 140 0 0 0 0Other items 124 0 0 0 0Total standardized approach 194,098 11,682 10,224 532 9Total1 631,625 307,229 232,994 26,076 5,5501 The table reflects the fully loaded exposure view and therefore does not include the exposure shift from the advanced IRB to the standard approach of grandfathered equity
investments.
56
Deutsche Bank Credit risk exposure in the standardized approachPillar 3 Report 2017 Article 444 (d) CRR - Mapping of external rating to credit quality steps
Credit risk exposure in the standardized approach
Standardized ApproachWe treat a subset of our credit risk exposures within the standardized approach. The standardized approach measures creditrisk either pursuant to fixed risk weights, which are predefined by the regulator, or through the application of external ratings.
We assign certain credit exposures permanently to the standardized approach in accordance with Article 150 CRR. These arepredominantly exposures to the Federal Republic of Germany and other German public sector entities as well as exposures tocentral governments of other European Member States that meet the required conditions. These exposures make up the major-ity of the exposures carried in the standardized approach and receive predominantly a risk weight of zero percent. For internalpurposes, however, these exposures are subject to an internal credit assessment and fully integrated in the risk managementand economic capital processes.
In line with Article 150 CRR and Section 10 SolvV, we assign further – generally IRBA eligible – exposures permanently to thestandardized approach. This population comprises several small-sized portfolios, which are considered to be immaterial on astand-alone basis for inclusion in the IRBA.
Other credit exposures which are small in size are temporarily assigned to the standardized approach and we plan to transferthem to the IRBA over time. The prioritization and the corresponding transition plan is discussed and agreed with the competentauthorities, the Bundesbank, the BaFin and the ECB.
Article 444 (a-b) CRR - External ratings in the standardizedapproachIn order to calculate the regulatory capital requirements under the standardized approach, we use eligible external ratings fromStandard & Poor’s, Moody’s, Fitch Ratings and in some cases from DBRS. Ratings are applied to all relevant exposure classesin the standardized approach. If more than one rating is available for a specific counterparty, the selection criteria as set out inArticle 138 CRR are applied in order to determine the relevant risk weight for the capital calculation.
Article 444 (c) CRR - Usage of issue ratingsGiven the low volume of exposures covered under the standardized approach and the high percentage of (externally rated)central government exposures therein, we principally do not consider impacts from inferring issue ratings from issuer ratings.
Article 444 (d) CRR - Mapping of external rating to credit quali-ty stepsThis information does not need to be disclosed separately as Deutsche Bank Group complies with the standard associationpublished by EBA.
Please refer to section “Article 452 (b)(i) CRR – Mapping of internal rating scales to external ratings” in this Pillar 3 report onpage 60 for a mapping of internal ratings and probability of defaults.
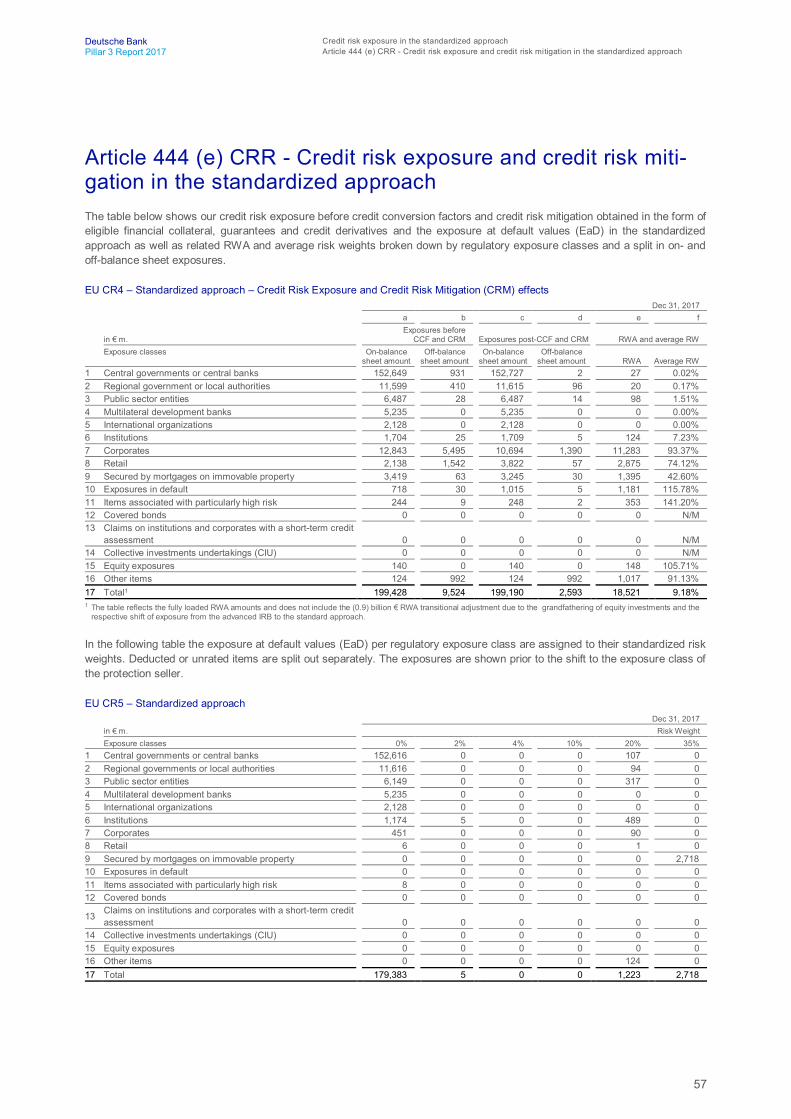
57
Deutsche Bank Credit risk exposure in the standardized approachPillar 3 Report 2017 Article 444 (e) CRR - Credit risk exposure and credit risk mitigation in the standardized approach
Article 444 (e) CRR - Credit risk exposure and credit risk miti-gation in the standardized approachThe table below shows our credit risk exposure before credit conversion factors and credit risk mitigation obtained in the form ofeligible financial collateral, guarantees and credit derivatives and the exposure at default values (EaD) in the standardizedapproach as well as related RWA and average risk weights broken down by regulatory exposure classes and a split in on- andoff-balance sheet exposures.
EU CR4 – Standardized approach – Credit Risk Exposure and Credit Risk Mitigation (CRM) effectsDec 31, 2017
a b c d e f
in € m.Exposures before
CCF and CRM Exposures post-CCF and CRM RWA and average RWExposure classes On-balance
sheet amount Off-balancesheet amount
On-balancesheet amount
Off-balancesheet amount RWA Average RW
1 Central governments or central banks 152,649 931 152,727 2 27 0.02%2 Regional government or local authorities 11,599 410 11,615 96 20 0.17%3 Public sector entities 6,487 28 6,487 14 98 1.51%4 Multilateral development banks 5,235 0 5,235 0 0 0.00%5 International organizations 2,128 0 2,128 0 0 0.00%6 Institutions 1,704 25 1,709 5 124 7.23%7 Corporates 12,843 5,495 10,694 1,390 11,283 93.37%8 Retail 2,138 1,542 3,822 57 2,875 74.12%9 Secured by mortgages on immovable property 3,419 63 3,245 30 1,395 42.60%10 Exposures in default 718 30 1,015 5 1,181 115.78%11 Items associated with particularly high risk 244 9 248 2 353 141.20%12 Covered bonds 0 0 0 0 0 N/M13 Claims on institutions and corporates with a short-term credit
assessment 0 0 0 0 0 N/M14 Collective investments undertakings (CIU) 0 0 0 0 0 N/M15 Equity exposures 140 0 140 0 148 105.71%16 Other items 124 992 124 992 1,017 91.13%17 Total1 199,428 9,524 199,190 2,593 18,521 9.18%1 The table reflects the fully loaded RWA amounts and does not include the (0.9) billion € RWA transitional adjustment due to the grandfathering of equity investments and the
respective shift of exposure from the advanced IRB to the standard approach.
In the following table the exposure at default values (EaD) per regulatory exposure class are assigned to their standardized riskweights. Deducted or unrated items are split out separately. The exposures are shown prior to the shift to the exposure class ofthe protection seller.
EU CR5 – Standardized approachDec 31, 2017
in € m. Risk WeightExposure classes 0% 2% 4% 10% 20% 35%
1 Central governments or central banks 152,616 0 0 0 107 02 Regional governments or local authorities 11,616 0 0 0 94 03 Public sector entities 6,149 0 0 0 317 04 Multilateral development banks 5,235 0 0 0 0 05 International organizations 2,128 0 0 0 0 06 Institutions 1,174 5 0 0 489 07 Corporates 451 0 0 0 90 08 Retail 6 0 0 0 1 09 Secured by mortgages on immovable property 0 0 0 0 0 2,71810 Exposures in default 0 0 0 0 0 011 Items associated with particularly high risk 8 0 0 0 0 012 Covered bonds 0 0 0 0 0 0
13 Claims on institutions and corporates with a short-term creditassessment 0 0 0 0 0 0
14 Collective investments undertakings (CIU) 0 0 0 0 0 015 Equity exposures 0 0 0 0 0 016 Other items 0 0 0 0 124 017 Total 179,383 5 0 0 1,223 2,718

58
Deutsche Bank Credit risk exposure in the standardized approachPillar 3 Report 2017 Article 444 (e) CRR - Credit risk exposure and credit risk mitigation in the standardized approach
Dec 31, 2017in € m. Risk WeightExposure classes 50% 70% 75% 100% 150% 250%
1 Central governments or central banks 0 0 0 5 1 02 Regional governments or local authorities 0 0 0 1 0 03 Public sector entities 0 0 0 34 0 04 Multilateral development banks 0 0 0 0 0 05 International organizations 0 0 0 0 0 06 Institutions 40 0 0 6 0 07 Corporates 66 0 0 11,420 56 08 Retail 0 0 3,873 0 0 09 Secured by mortgages on immovable property 557 0 0 0 0 010 Exposures in default 0 0 0 155 865 011 Items associated with particularly high risk 0 0 0 0 242 012 Covered bonds 0 0 0 0 0 0
13 Claims on institutions and corporates with a short-term creditassessment 0 0 0 0 0 0
14 Collective investments undertakings (CIU) 0 0 0 0 0 015 Equity exposures 0 0 0 132 0 016 Other items 0 0 0 992 0 017 Total 662 0 3,873 12,746 1,164 0
Dec 31, 2017in € m. Risk WeightExposure classes
370% 1250% Others Deducted Total Of which:
unrated1 Central governments or central banks 0 0 0 0 152,729 143,2902 Regional governments or local authorities 0 0 0 0 11,711 4,9283 Public sector entities 0 0 0 0 6,500 5,4654 Multilateral development banks 0 0 0 0 5,235 4,6325 International organizations 0 0 0 0 2,128 1,5206 Institutions 0 0 0 0 1,714 1,6707 Corporates 0 0 0 0 12,084 11,2998 Retail 0 0 0 0 3,880 3,8809 Secured by mortgages on immovable property 0 0 0 0 3,275 3,27510 Exposures in default 0 0 0 0 1,020 1,02011 Items associated with particularly high risk 0 0 0 0 250 25012 Covered bonds 0 0 0 0 0 0
13 Claims on institutions and corporates with a short-term creditassessment 0 0 0 0 0 0
14 Collective investments undertakings (CIU) 0 0 0 0 0 015 Equity exposures 0 0 9 0 140 14016 Other items 0 0 0 0 1,116 1,11617 Total1 0 0 9 0 201,783 182,4861 The table reflects the fully loaded RWA amounts and does not include the (0.9) billion € RWA transitional adjustment due to the grandfathering of equity investments and the
respective shift of exposure from the advanced IRB to the standard approach.

59
Deutsche Bank Credit risk exposure and credit risk mitigation in the internal-rating-based approachPillar 3 Report 2017 Qualitative information on the use of the IRB approach
Credit risk exposure and credit risk mitigation in theinternal-rating-based approach
Qualitative information on the use of the IRB approachArticle 452 (a) CRR - Approval status for IRB approaches
For the majority of our credit portfolios, we are applying the advanced IRBA to calculate the regulatory capital requirementsaccording to the CRR/CRD 4 framework, based on respective approvals received from BaFin and ECB. The regulatory approv-als obtained as a result of the advanced IRBA audit processes for our regulatory credit exposures allow the usage of currently63 internally developed rating systems for regulatory capital calculation purposes excluding for exposures in Postbank. Thereof,37 rating systems were authorized in December 2007. Overall they cover all of our material exposures in the advanced IRBAeligible exposure classes “central governments and central banks”, “institutions”, “corporates”, and “retail”.
As an IRBA institution, we are required to treat specific equity positions and other non-credit obligation assets generally withinthe IRBA. For these exposure types typically regulatory defined IRBA risk weights are applied.
Our exposures reported under foundation IRBA include parts of Postbank’s corporate portfolios, which receive regulatory riskweights using the so-called ‘supervisory slotting criteria’ approach. Further details of the Foundation Approach are provided inthe section “Foundation Internal Ratings Based Approach”.
At Group level, we assign a few remaining advanced IRBA eligible portfolios of small size temporarily to the standardized ap-proach. With regard to these, an implementation plan and approval schedule have been set up and agreed with the Bundes-bank, the BaFin and the ECB. A portion of Postbank’s IRBA eligible portfolios is also still temporarily assigned to thestandardized approach. Implementation plans for the Group excluding Postbank and for Postbank have been agreed with theBaFin, Bundesbank and the ECB. During 2017, the Integrated Roadmap with an overall Group Level implementation planremained on hold as a consequence of the Strategy 2020 / Postbank deconsolidation, but will be reactivated in the course of2018.
Details of the standardized approach and the standardized approach exposures are discussed in the Section “StandardizedApproach” on page 56 within this report.
Our advanced IRBA coverage ratio, excluding Postbank, amounted to 96.8 % by exposure value (“EAD”) and 90.7 % by RWAas of December 31, 2017, using applicable measures according to Section 11 SolvV. It decreased from the levels at Decem-ber 31, 2016, which amounted to 97.3 % by EAD and 93.4 % by RWA. In this regard, our RWA-based coverage ratio has fallenslightly below 92 %, the regulatory minimum requirements with regard to the coverage ratio thresholds. ECB as our competentauthority is informed about the coverage ratio development on a continual basis and required actions (if any) will be discussedjointly; also considering potential changes in regulations. Prior to June 30, 2017, regulatory minimum requirements with regardto the respective coverage ratio thresholds have been met at all times. These ratios excluded the exposures permanently as-signed to the standardized approach (according to Article 150 CRR), other IRBA exposure as well as securitization positions.
The table below shows the Group-related EAD covered by the standardized, advanced and foundation IRB and split them outinto the major regulatory exposure classes. Please note: The below EAD constitutes the EAD as reported for the Group in thisreport and does not reflect the specific requirements for the coverage ratio calculation stipulated in Section 11 SolvV as outlinedin the paragraph above.
EAD within the group covered by the standardized, FIRB and AIRB approaches by exposure classDec 31, 2017
in %Advanced
IRBAFoundation
IRBA Standardized
Approach TotalSovereign related exposure 13 0 18 32Institutions 6 0 2 8Corporates 35 1 1 37Retail 21 0 0 21Other items 1 0 1 2Total 76 1 23 100
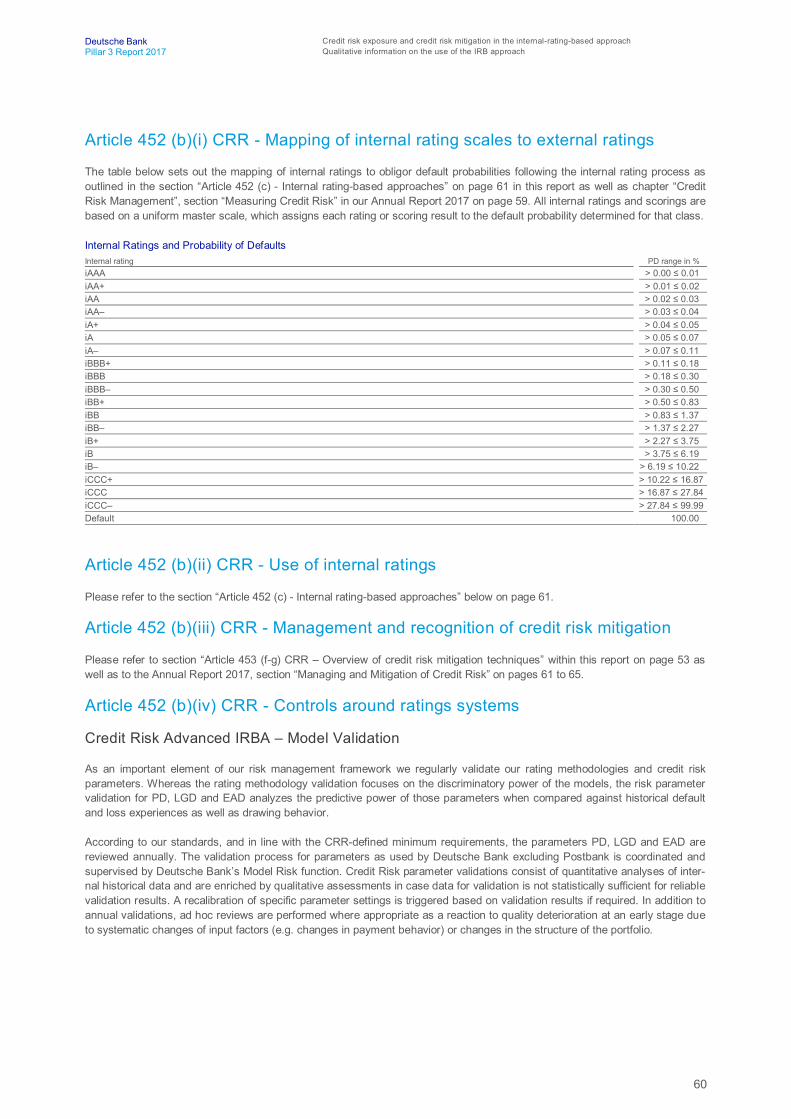
60
Deutsche Bank Credit risk exposure and credit risk mitigation in the internal-rating-based approachPillar 3 Report 2017 Qualitative information on the use of the IRB approach
Article 452 (b)(i) CRR - Mapping of internal rating scales to external ratings
The table below sets out the mapping of internal ratings to obligor default probabilities following the internal rating process asoutlined in the section “Article 452 (c) - Internal rating-based approaches” on page 61 in this report as well as chapter “CreditRisk Management”, section “Measuring Credit Risk” in our Annual Report 2017 on page 59. All internal ratings and scorings arebased on a uniform master scale, which assigns each rating or scoring result to the default probability determined for that class.
Internal Ratings and Probability of DefaultsInternal rating PD range in %iAAA > 0.00 ≤ 0.01iAA+ > 0.01 ≤ 0.02iAA > 0.02 ≤ 0.03iAA– > 0.03 ≤ 0.04iA+ > 0.04 ≤ 0.05iA > 0.05 ≤ 0.07iA– > 0.07 ≤ 0.11iBBB+ > 0.11 ≤ 0.18iBBB > 0.18 ≤ 0.30iBBB– > 0.30 ≤ 0.50iBB+ > 0.50 ≤ 0.83iBB > 0.83 ≤ 1.37iBB– > 1.37 ≤ 2.27iB+ > 2.27 ≤ 3.75iB > 3.75 ≤ 6.19iB– > 6.19 ≤ 10.22iCCC+ > 10.22 ≤ 16.87iCCC > 16.87 ≤ 27.84iCCC– > 27.84 ≤ 99.99Default 100.00
Article 452 (b)(ii) CRR - Use of internal ratings
Please refer to the section “Article 452 (c) - Internal rating-based approaches” below on page 61.
Article 452 (b)(iii) CRR - Management and recognition of credit risk mitigation
Please refer to section “Article 453 (f-g) CRR – Overview of credit risk mitigation techniques” within this report on page 53 aswell as to the Annual Report 2017, section “Managing and Mitigation of Credit Risk” on pages 61 to 65.
Article 452 (b)(iv) CRR - Controls around ratings systems
Credit Risk Advanced IRBA – Model Validation
As an important element of our risk management framework we regularly validate our rating methodologies and credit riskparameters. Whereas the rating methodology validation focuses on the discriminatory power of the models, the risk parametervalidation for PD, LGD and EAD analyzes the predictive power of those parameters when compared against historical defaultand loss experiences as well as drawing behavior.
According to our standards, and in line with the CRR-defined minimum requirements, the parameters PD, LGD and EAD arereviewed annually. The validation process for parameters as used by Deutsche Bank excluding Postbank is coordinated andsupervised by Deutsche Bank’s Model Risk function. Credit Risk parameter validations consist of quantitative analyses of inter-nal historical data and are enriched by qualitative assessments in case data for validation is not statistically sufficient for reliablevalidation results. A recalibration of specific parameter settings is triggered based on validation results if required. In addition toannual validations, ad hoc reviews are performed where appropriate as a reaction to quality deterioration at an early stage dueto systematic changes of input factors (e.g. changes in payment behavior) or changes in the structure of the portfolio.

61
Deutsche Bank Credit risk exposure and credit risk mitigation in the internal-rating-based approachPillar 3 Report 2017 Qualitative information on the use of the IRB approach
Within Postbank, overall responsibility for validation of IRBA models as well as corresponding model governance lies at PBGroups Model Risk and Validation function. Analogously to Deutsche Bank the results of the estimations of the input parame-ters PD, CCF and LGD are reviewed annually. Postbank’s model validation committee is responsible for supervising the annualvalidation process of all models. Via a cross committee membership Deutsche Bank senior managers join Postbank commit-tees and vice versa, to promote joint governance.
For quantitative details of our validation results please refer to section “Article 452 (h-i) CRR - Model validation results andexpected versus actual losses” of this Pillar 3 Report on the pages 77 to 84.
Article 452 (c) - Internal rating-based approaches
Advanced Internal Ratings Based Approach
The advanced IRBA is the most sophisticated approach available under the regulatory framework for credit risk and allows us tomake use of our internal rating methodologies as well as internal estimates of specific other risk parameters. These methodsand parameters represent long-used key components of the internal risk measurement and management process supportingthe credit approval process, the economic capital and expected loss calculation and the internal monitoring and reporting ofcredit risk. The relevant parameters include the probability of default (“PD”), the loss given default (“LGD”) and the maturity (“M”)driving the regulatory risk-weight and the credit conversion factor (“CCF”) as part of the regulatory exposure at default (“EAD”)estimation. For most of our internal rating systems more than seven years of historical information is available to assess theseparameters. Our internal rating methodologies aim at point-in-time rather than a through-the-cycle rating.
The probability of default for customers is derived from our internal rating systems. We assign a probability of default to eachrelevant counterparty credit exposure as a function of a transparent and consistent 21-grade master rating scale for all of ourexposure (excluding parts of Postbank).
A prerequisite for the development of rating methodologies and the determination of risk parameters is a proper definition,identification and recording of the default event of a customer. We apply a default definition in accordance with the requirementsof Article 178 CRR as confirmed by the BaFin and ECB as part of the IRBA approval process. There are differences betweenthe default concept for regulatory purposes and the accounting related impaired definition according to IAS39. We only classifydefaulted loans as being impaired once we expect an economic loss and a credit risk adjustment has been recorded. As aconsequence, fully collateralized defaulted loans where we do not expect an economic loss would not result in an impairmentclassification. Moreover, the default concept is applied to a broader range of assets.
The borrower ratings assigned are derived on the grounds of internally developed rating models which specify consistent anddistinct customer-relevant criteria and assign a rating grade based on a specific set of criteria as given for a certain customer.The set of criteria is generated from information sets relevant for the respective customer segments like general customer be-havior, financial and external data. The methods in use range from statistical scoring models to expert-based models taking intoaccount the relevant available quantitative and qualitative information. Expert-based models are usually applied for counterpartsin the exposure classes “Central governments and central banks”, “Institutions” and “Corporates” with the exception of “Corpo-rates” segments for which sufficient data basis is available for statistical scoring models. For the latter as well as for the retailsegment statistical scoring or hybrid models combining both approaches are commonly used. Quantitative rating methodologiesare developed based on applicable statistical modeling techniques, such as logistic regression. In line with Article 174 CRR,these models are complemented by human judgment and oversight to review model-based assignments and are intended toensure that the models are used appropriately. When we assign our internal risk ratings, it allows us to compare them withexternal risk ratings assigned to our counterparties by the major international rating agencies, where possible, as our internalrating scale has been designed to principally correspond to the external rating scales from rating agencies.
Ratings for central governments and central banks take into account economic, political and sociodemographic indicators, e.g.the political dynamics in a country. The model incorporates relevant aspects covered in the fields of empirical country risk anal-ysis and early warning crisis models to arrive at an overall risk evaluation.
The majority of ratings for corporate and institutions combine quantitative analysis of financial information with qualitative as-sessments of, inter alia, industry trends, market position and management experience. Financial analysis has a specific focuson cash flow generation and the counterparty’s capability to service its debts, also in comparison to peers. We supplement theanalysis of financials by an internal forecast of the counterparty’s financial profile where deemed to be necessary. For pur-chased corporate receivables the corporate rating approach is applied.

62
Deutsche Bank Credit risk exposure and credit risk mitigation in the internal-rating-based approachPillar 3 Report 2017 Qualitative information on the use of the IRB approach
Ratings for SME clients are based on automated sub-ratings for e.g. financial aspects and conduct of bank account. Special-ized lending is managed by specific credit risk management teams, e.g. for real estate, ship finance or leveraged transactions.Following the individual characteristic of the underlying credit transactions we have developed bespoke scorecards whereappropriate to derive credit ratings.
In our retail business, creditworthiness checks and counterparty ratings are generally derived by utilizing an automated decisionengine. The decision engine incorporates quantitative aspects (i.e., financial figures), behavioral aspects, credit bureau infor-mation (such as SCHUFA in Germany) and general customer data. These input factors are used by the decision engine todetermine the creditworthiness of the borrower and, after consideration of collateral, the expected loss. The established ratingprocedures we have implemented in our retail business are based on multivariate statistical methods.
They are used to support our individual credit decisions for the retail portfolio as well as to continuously monitor it in an auto-mated fashion. In case elevated risks are identified as part to this monitoring process or new regulatory requirements apply,credit ratings are reviewed on an individual basis for these affected counterparties
Although different rating methodologies are applied to the various customer segments in order to properly reflect customer-specific characteristics, they all adhere to the same risk management principles. Credit process policies provide guidance onthe classification of customers into the various rating systems.
We apply internally estimated LGD factors as part of the advanced IRBA capital requirement calculation as approved by theBaFin and ECB. LGD is defined as the likely loss intensity in case of a counterparty default. It provides an estimation of theexposure that cannot be recovered in a default event and therefore captures the severity of a loss. Conceptually, LGD esti-mates are independent of a customer’s probability of default. The LGD models ensure that the main drivers for losses (i.e.,different levels and quality of collateralization and customer or product types or seniority of facility) are reflected in specific LGDfactors. In our LGD models, except Postbank, we assign collateral type specific LGD parameters to the collateralized exposure(collateral value after application of haircuts). Moreover, the LGD for uncollateralized exposure cannot be below the LGD as-signed to collateralized exposure and regulatory floors (e.g.10 % for residential mortgage loans) are applied.
As part of the application of the advanced IRBA we apply specific CCFs in order to calculate an EAD value. Conceptually theEAD is defined as the expected amount of the credit exposure to a counterparty at the time of its default. For advanced IRBAcalculation purposes we apply the general principles as defined in Article 166 CRR to determine the EAD of a transaction. Ininstances, however, where a transaction involves an unused limit, a percentage share of this unused limit is added to the out-standing amount in order to appropriately reflect the expected outstanding amount in case of a counterparty default. This re-flects the assumption that for commitments the utilization at the time of default might be higher than the current utilization. Whena transaction involves an additional contingent component (i.e., guarantees) a further percentage share (usage factor) is appliedas part of the CCF model in order to estimate the amount of guarantees drawn in case of default. Where allowed under theadvanced IRBA, the CCFs are internally estimated. The calibrations of such parameters are based on statistical experience aswell as internal historical data and consider customer and product type specifics. As part of the approval process, the BaFin andECB assessed our CCF models and stated their appropriateness for use in the process of regulatory capital requirement calcu-lations.
The EAD for our derivatives and securities financing transactions (“SFT”) portfolios are primarily calculated based on the IMMapproach as described in the section “Counterparty credit risk” of this report on the pages 91 to 102.
Foundation Internal Ratings Based Approach
The foundation IRBA is an approach available under the regulatory framework for credit risk allowing institutions to make use oftheir internal rating methodologies while using pre-defined regulatory values for all other risk parameters. Parameters subject tointernal estimates include the probability of default (“PD”) while the loss given default (“LGD”) and the credit conversion factor(“CCF”) are defined in the regulatory framework.
A probability of default is assigned to each relevant counterparty credit exposure as a function of a transparent and consistentrating master scale. The borrower ratings assigned are derived on the grounds of internally developed rating models whichspecify consistent and distinct customer-relevant criteria and assign a rating grade based on a specific set of criteria as givenfor a certain customer following the approaches as outlined for our Advanced IRBA rating systems. Our Project Finance expo-sure (Specialized Lending) is reported under the foundation IRBA, but regulatory risk weights are applied using the so-called‘supervisory slotting criteria’ approach as defined by Article 153 CRR.
For the foundation IRBA we apply the same default definition as for Advanced IRBA in accordance with the requirements ofArticle 178 CRR as confirmed by the BaFin as part of its IRBA approval process.
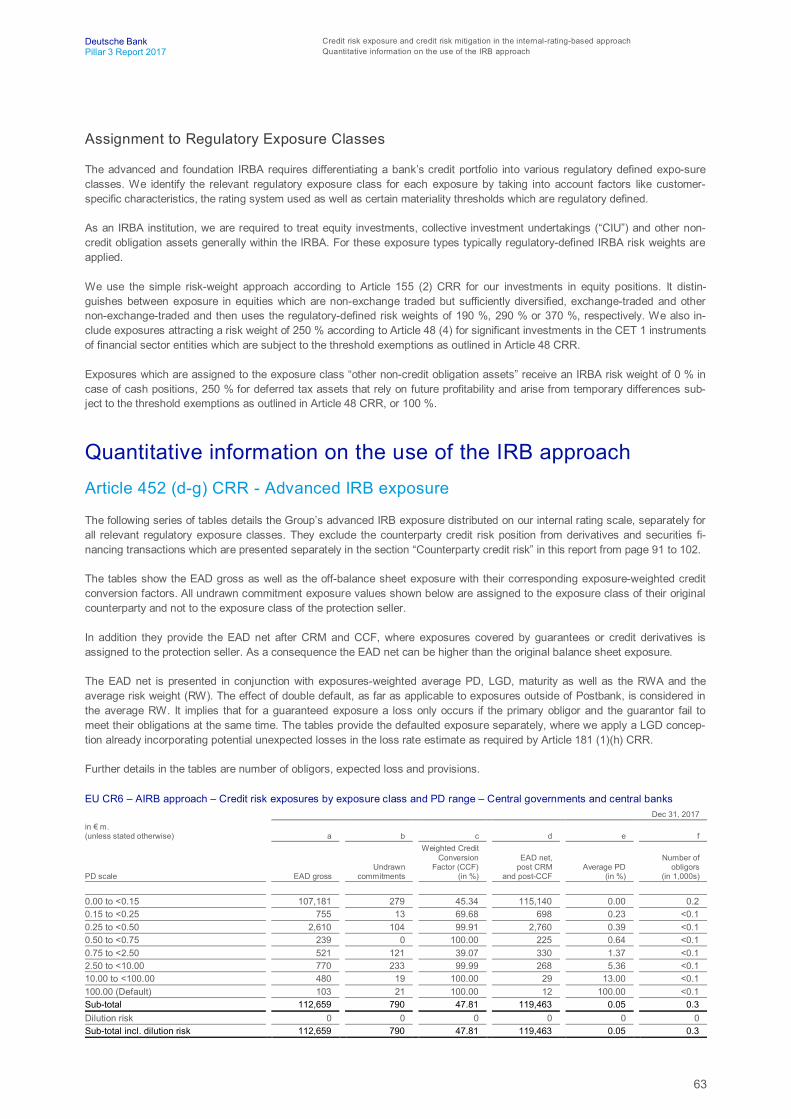
63
Deutsche Bank Credit risk exposure and credit risk mitigation in the internal-rating-based approachPillar 3 Report 2017 Quantitative information on the use of the IRB approach
Assignment to Regulatory Exposure Classes
The advanced and foundation IRBA requires differentiating a bank’s credit portfolio into various regulatory defined expo-sureclasses. We identify the relevant regulatory exposure class for each exposure by taking into account factors like customer-specific characteristics, the rating system used as well as certain materiality thresholds which are regulatory defined.
As an IRBA institution, we are required to treat equity investments, collective investment undertakings (“CIU”) and other non-credit obligation assets generally within the IRBA. For these exposure types typically regulatory-defined IRBA risk weights areapplied.
We use the simple risk-weight approach according to Article 155 (2) CRR for our investments in equity positions. It distin-guishes between exposure in equities which are non-exchange traded but sufficiently diversified, exchange-traded and othernon-exchange-traded and then uses the regulatory-defined risk weights of 190 %, 290 % or 370 %, respectively. We also in-clude exposures attracting a risk weight of 250 % according to Article 48 (4) for significant investments in the CET 1 instrumentsof financial sector entities which are subject to the threshold exemptions as outlined in Article 48 CRR.
Exposures which are assigned to the exposure class “other non-credit obligation assets” receive an IRBA risk weight of 0 % incase of cash positions, 250 % for deferred tax assets that rely on future profitability and arise from temporary differences sub-ject to the threshold exemptions as outlined in Article 48 CRR, or 100 %.
Quantitative information on the use of the IRB approachArticle 452 (d-g) CRR - Advanced IRB exposure
The following series of tables details the Group’s advanced IRB exposure distributed on our internal rating scale, separately forall relevant regulatory exposure classes. They exclude the counterparty credit risk position from derivatives and securities fi-nancing transactions which are presented separately in the section “Counterparty credit risk” in this report from page 91 to 102.
The tables show the EAD gross as well as the off-balance sheet exposure with their corresponding exposure-weighted creditconversion factors. All undrawn commitment exposure values shown below are assigned to the exposure class of their originalcounterparty and not to the exposure class of the protection seller.
In addition they provide the EAD net after CRM and CCF, where exposures covered by guarantees or credit derivatives isassigned to the protection seller. As a consequence the EAD net can be higher than the original balance sheet exposure.
The EAD net is presented in conjunction with exposures-weighted average PD, LGD, maturity as well as the RWA and theaverage risk weight (RW). The effect of double default, as far as applicable to exposures outside of Postbank, is considered inthe average RW. It implies that for a guaranteed exposure a loss only occurs if the primary obligor and the guarantor fail tomeet their obligations at the same time. The tables provide the defaulted exposure separately, where we apply a LGD concep-tion already incorporating potential unexpected losses in the loss rate estimate as required by Article 181 (1)(h) CRR.
Further details in the tables are number of obligors, expected loss and provisions.
EU CR6 – AIRB approach – Credit risk exposures by exposure class and PD range – Central governments and central banksDec 31, 2017
in € m.(unless stated otherwise) a b c d e f
PD scale EAD grossUndrawn
commitments
Weighted CreditConversion
Factor (CCF)(in %)
EAD net,post CRM
and post-CCFAverage PD
(in %)
Number ofobligors
(in 1,000s)
0.00 to <0.15 107,181 279 45.34 115,140 0.00 0.20.15 to <0.25 755 13 69.68 698 0.23 <0.10.25 to <0.50 2,610 104 99.91 2,760 0.39 <0.10.50 to <0.75 239 0 100.00 225 0.64 <0.10.75 to <2.50 521 121 39.07 330 1.37 <0.12.50 to <10.00 770 233 99.99 268 5.36 <0.110.00 to <100.00 480 19 100.00 29 13.00 <0.1100.00 (Default) 103 21 100.00 12 100.00 <0.1Sub-total 112,659 790 47.81 119,463 0.05 0.3Dilution risk 0 0 0 0 0 0Sub-total incl. dilution risk 112,659 790 47.81 119,463 0.05 0.3

64
Deutsche Bank Credit risk exposure and credit risk mitigation in the internal-rating-based approachPillar 3 Report 2017 Quantitative information on the use of the IRB approach
Dec 31, 2017in € m.(unless stated otherwise) g h i j k l
PD scale Average LGD
(in %)
Averagematurity
(in years) RWA Average RW
(in %)Expected
Loss
Valueadjustments
and Provisions
0.00 to <0.15 49.51 1.1 1,718 1.49 2 –0.15 to <0.25 47.42 1.3 262 37.48 1 –0.25 to <0.50 50.00 1.6 1,660 60.16 5 –0.50 to <0.75 49.80 1.4 183 81.02 1 –0.75 to <2.50 57.90 1.7 298 90.27 3 –2.50 to <10.00 48.70 1.9 374 139.47 5 –10.00 to <100.00 49.82 2.2 78 269.54 2 –100.00 (Default) 48.71 3.6 4 29.49 7 –Sub-total 52.70 1.1 4,577 3.83 26 17Dilution risk 0 0 0 0 0 0Sub-total incl. dilution risk 52.70 1.1 4,577 3.83 26 17
EU CR6 – AIRB approach – Credit risk exposures by exposure class and PD range – InstitutionsDec 31, 2017
in € m.(unless stated otherwise) a b c d e f
PD scale EAD grossUndrawn
commitments
Weighted CreditConversion
Factor (CCF)(in %)
EAD net,post CRM
and post-CCFAverage PD
(in %)
Number ofobligors
(in 1,000s)
0.00 to <0.15 13,594 3,701 39.82 19,933 0.05 0.50.15 to <0.25 644 230 37.51 751 0.23 0.10.25 to <0.50 3,996 831 54.13 4,047 0.39 0.10.50 to <0.75 403 241 36.73 519 0.64 <0.10.75 to <2.50 1,211 231 52.39 1,234 1.53 0.12.50 to <10.00 290 541 88.22 708 4.56 <0.110.00 to <100.00 64 121 28.96 92 14.69 <0.1100.00 (Default) 110 30 33.30 120 100.00 <0.1Sub-total 20,313 5,926 41.92 27,405 0.79 0.9Dilution risk 69 0 37.00 47 15.85 <0.1Sub-total incl. dilution risk 20,382 5,926 41.92 27,452 0.82 0.9
Dec 31, 2017in € m.(unless stated otherwise) g h i j k l
PD scale Average LGD
(in %)
Averagematurity
(in years) RWA Average RW
(in %)Expected
Loss
Valueadjustments
and Provisions
0.00 to <0.15 46.01 2.0 2,210 11.09 3 –0.15 to <0.25 32.21 1.7 216 28.75 1 –0.25 to <0.50 21.17 2.3 1,489 36.80 5 –0.50 to <0.75 44.67 1.5 394 75.84 2 –0.75 to <2.50 14.78 1.5 371 30.02 2 –2.50 to <10.00 32.12 3.6 1,043 147.21 11 –10.00 to <100.00 4.99 1.2 23 24.76 1 –100.00 (Default) 2.60 3.5 33 27.79 0 –Sub-total 39.84 2.0 5,778 21.08 25 12Dilution risk 3.84 1.0 9 18.89 0 0Sub-total incl. dilution risk 39.78 2.0 5,787 21.08 25 12

65
Deutsche Bank Credit risk exposure and credit risk mitigation in the internal-rating-based approachPillar 3 Report 2017 Quantitative information on the use of the IRB approach
EU CR6 – AIRB approach – Credit risk exposures by exposure class and PD range – Corporates, totalDec 31, 2017
in € m.(unless stated otherwise) a b c d e f
PD scale EAD grossUndrawn
commitments
Weighted CreditConversion
Factor (CCF)(in %)
EAD net,post CRM
and post-CCFAverage PD
(in %)
Number ofobligors
(in 1,000s)
0.00 to <0.15 57,232 122,822 29.64 93,466 0.08 19.00.15 to <0.25 15,545 23,725 29.89 22,109 0.23 6.00.25 to <0.50 14,406 16,363 30.91 18,423 0.39 5.80.50 to <0.75 10,874 10,790 31.34 13,608 0.65 4.80.75 to <2.50 20,994 19,628 31.60 24,616 1.40 6.82.50 to <10.00 22,591 22,927 33.15 26,116 4.91 4.010.00 to <100.00 8,617 3,557 33.12 8,905 17.87 1.1100.00 (Default) 6,891 1,515 36.13 6,743 100.00 1.3Sub-total 157,150 221,327 30.48 213,985 4.79 48.7Dilution risk 2,682 176 28.49 2,854 15.85 0.3Sub-total incl. dilution risk 159,831 221,503 30.48 216,839 4.93 49.0
Dec 31, 2017in € m.(unless stated otherwise) g h i j k l
PD scale Average LGD
(in %)
Averagematurity
(in years) RWA Average RW
(in %)Expected
Loss
Valueadjustments
and Provisions
0.00 to <0.15 30.72 2.2 17,060 18.25 27 –0.15 to <0.25 33.25 2.3 7,551 34.15 17 –0.25 to <0.50 29.01 2.5 7,693 41.76 21 –0.50 to <0.75 27.67 2.4 6,186 45.46 23 –0.75 to <2.50 23.11 2.6 13,170 53.50 78 –2.50 to <10.00 18.12 2.7 16,444 62.97 226 –10.00 to <100.00 7.85 1.8 3,796 42.63 147 –100.00 (Default) 27.45 2.3 1,946 28.87 1,707 –Sub-total 27.17 2.3 73,847 34.51 2,246 2,456Dilution risk 3.86 1.0 542 18.98 17 0Sub-total incl. dilution risk 26.87 2.3 74,389 34.31 2,263 2,456
EU CR6 – AIRB-approach – Credit risk exposures by exposure class and PD range – Corporates, SMEsDec 31, 2017
in € m.(unless stated otherwise) a b c d e f
PD scale EAD grossUndrawn
commitments
Weighted CreditConversion
Factor (CCF)(in %)
EAD net,post CRM
and post-CCFAverage PD
(in %)
Number ofobligors
(in 1,000s)
0.00 to <0.15 2,514 2,855 30.04 3,416 0.08 5.70.15 to <0.25 1,307 1,030 38.31 1,665 0.23 2.30.25 to <0.50 1,267 1,045 31.78 1,571 0.39 2.40.50 to <0.75 1,161 636 35.18 1,291 0.65 2.10.75 to <2.50 1,921 877 32.12 2,062 1.40 2.82.50 to <10.00 1,739 647 29.80 1,666 4.79 1.510.00 to <100.00 325 73 33.17 274 20.63 0.4100.00 (Default) 465 86 31.60 455 100.00 0.3Sub-total 10,699 7,249 32.19 12,400 5.17 17.4Dilution risk 26 0 0 27 15.85 <0.1Sub-total incl. dilution risk 10,725 7,249 32.19 12,427 5.19 17.4

66
Deutsche Bank Credit risk exposure and credit risk mitigation in the internal-rating-based approachPillar 3 Report 2017 Quantitative information on the use of the IRB approach
Dec 31, 2017in € m.(unless stated otherwise) g h i j k l
PD scale Average LGD
(in %)
Averagematurity
(in years) RWA Average RW
(in %)Expected
Loss
Valueadjustments
and Provisions
0.00 to <0.15 31.19 2.7 511 14.97 1 –0.15 to <0.25 36.07 3.3 552 33.13 1 –0.25 to <0.50 35.60 3.1 649 41.34 2 –0.50 to <0.75 37.74 3.0 722 55.90 3 –0.75 to <2.50 33.85 2.9 1,295 62.83 10 –2.50 to <10.00 27.74 2.5 1,182 70.97 20 –10.00 to <100.00 37.20 2.7 432 157.72 21 –100.00 (Default) 48.44 2.4 171 37.68 207 –Sub-total 33.83 2.8 5,515 44.48 266 258Dilution risk 3.81 1.0 5 18.73 0 0Sub-total incl. dilution risk 33.76 2.8 5,520 44.42 266 258
EU CR6 – AIRB approach – Credit risk exposures by exposure class and PD range – Corporates, specialized lendingDec 31, 2017
in € m.(unless stated otherwise) a b c d e f
PD scale EAD grossUndrawn
commitments
Weighted CreditConversion
Factor (CCF)(in %)
EAD net,post CRM
and post-CCFAverage PD
(in %)
Number ofobligors
(in 1,000s)
0.00 to <0.15 1,404 24 36.93 1,347 0.10 0.10.15 to <0.25 1,528 127 35.15 1,531 0.22 0.10.25 to <0.50 2,099 39 93.54 1,931 0.39 0.10.50 to <0.75 1,916 108 43.65 1,963 0.67 0.10.75 to <2.50 5,152 449 72.42 5,195 1.39 0.22.50 to <10.00 8,417 922 28.85 8,369 5.25 0.310.00 to <100.00 6,526 989 25.01 6,716 17.48 0.2100.00 (Default) 2,454 98 25.47 2,437 100.00 0.1Sub-total 29,497 2,756 36.12 29,488 14.06 1.2Dilution risk 2 0 0 2 15.85 <0.1Sub-total incl. dilution risk 29,499 2,756 36.12 29,490 14.06 1.2
Dec 31, 2017in € m.(unless stated otherwise) g h i j k l
PD scale Average LGD
(in %)
Averagematurity
(in years) RWA Average RW
(in %)Expected
Loss
Valueadjustments
and Provisions
0.00 to <0.15 8.67 3.1 118 8.76 0 –0.15 to <0.25 8.65 3.0 174 11.34 0 –0.25 to <0.50 15.14 3.7 529 27.40 1 –0.50 to <0.75 10.95 2.9 444 22.62 1 –0.75 to <2.50 10.96 2.3 1,474 28.38 8 –2.50 to <10.00 8.56 2.4 2,669 31.89 40 –10.00 to <100.00 5.07 1.7 1,800 26.80 64 –100.00 (Default) 16.99 2.2 715 29.35 365 –Sub-total 9.49 2.4 7,923 26.87 481 470Dilution risk 4.03 1.0 0 19.83 0 0Sub-total incl. dilution risk 9.49 2.4 7,923 26.87 481 470
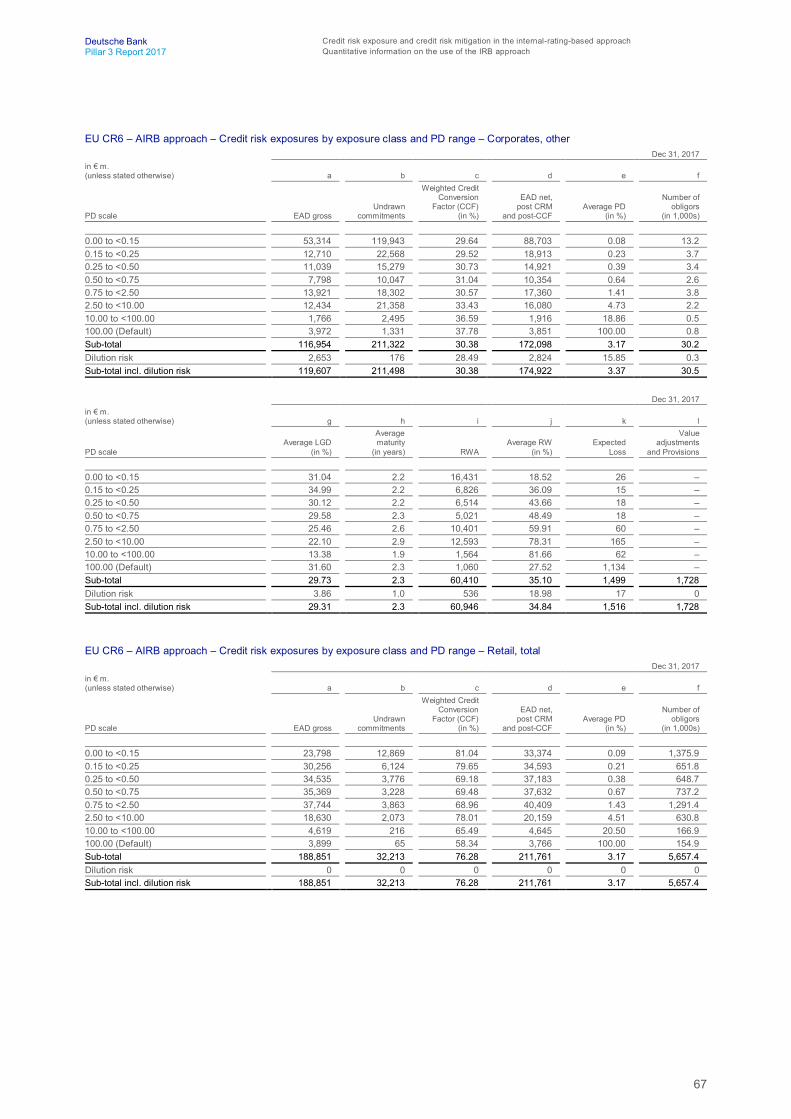
67
Deutsche Bank Credit risk exposure and credit risk mitigation in the internal-rating-based approachPillar 3 Report 2017 Quantitative information on the use of the IRB approach
EU CR6 – AIRB approach – Credit risk exposures by exposure class and PD range – Corporates, otherDec 31, 2017
in € m.(unless stated otherwise) a b c d e f
PD scale EAD grossUndrawn
commitments
Weighted CreditConversion
Factor (CCF)(in %)
EAD net,post CRM
and post-CCFAverage PD
(in %)
Number ofobligors
(in 1,000s)
0.00 to <0.15 53,314 119,943 29.64 88,703 0.08 13.20.15 to <0.25 12,710 22,568 29.52 18,913 0.23 3.70.25 to <0.50 11,039 15,279 30.73 14,921 0.39 3.40.50 to <0.75 7,798 10,047 31.04 10,354 0.64 2.60.75 to <2.50 13,921 18,302 30.57 17,360 1.41 3.82.50 to <10.00 12,434 21,358 33.43 16,080 4.73 2.210.00 to <100.00 1,766 2,495 36.59 1,916 18.86 0.5100.00 (Default) 3,972 1,331 37.78 3,851 100.00 0.8Sub-total 116,954 211,322 30.38 172,098 3.17 30.2Dilution risk 2,653 176 28.49 2,824 15.85 0.3Sub-total incl. dilution risk 119,607 211,498 30.38 174,922 3.37 30.5
Dec 31, 2017in € m.(unless stated otherwise) g h i j k l
PD scale Average LGD
(in %)
Averagematurity
(in years) RWA Average RW
(in %)Expected
Loss
Valueadjustments
and Provisions
0.00 to <0.15 31.04 2.2 16,431 18.52 26 –0.15 to <0.25 34.99 2.2 6,826 36.09 15 –0.25 to <0.50 30.12 2.2 6,514 43.66 18 –0.50 to <0.75 29.58 2.3 5,021 48.49 18 –0.75 to <2.50 25.46 2.6 10,401 59.91 60 –2.50 to <10.00 22.10 2.9 12,593 78.31 165 –10.00 to <100.00 13.38 1.9 1,564 81.66 62 –100.00 (Default) 31.60 2.3 1,060 27.52 1,134 –Sub-total 29.73 2.3 60,410 35.10 1,499 1,728Dilution risk 3.86 1.0 536 18.98 17 0Sub-total incl. dilution risk 29.31 2.3 60,946 34.84 1,516 1,728
EU CR6 – AIRB approach – Credit risk exposures by exposure class and PD range – Retail, totalDec 31, 2017
in € m.(unless stated otherwise) a b c d e f
PD scale EAD grossUndrawn
commitments
Weighted CreditConversion
Factor (CCF)(in %)
EAD net,post CRM
and post-CCFAverage PD
(in %)
Number ofobligors
(in 1,000s)
0.00 to <0.15 23,798 12,869 81.04 33,374 0.09 1,375.90.15 to <0.25 30,256 6,124 79.65 34,593 0.21 651.80.25 to <0.50 34,535 3,776 69.18 37,183 0.38 648.70.50 to <0.75 35,369 3,228 69.48 37,632 0.67 737.20.75 to <2.50 37,744 3,863 68.96 40,409 1.43 1,291.42.50 to <10.00 18,630 2,073 78.01 20,159 4.51 630.810.00 to <100.00 4,619 216 65.49 4,645 20.50 166.9100.00 (Default) 3,899 65 58.34 3,766 100.00 154.9Sub-total 188,851 32,213 76.28 211,761 3.17 5,657.4Dilution risk 0 0 0 0 0 0Sub-total incl. dilution risk 188,851 32,213 76.28 211,761 3.17 5,657.4

68
Deutsche Bank Credit risk exposure and credit risk mitigation in the internal-rating-based approachPillar 3 Report 2017 Quantitative information on the use of the IRB approach
Dec 31, 2017in € m.(unless stated otherwise) g h i j k l
PD scale Average LGD
(in %)
Averagematurity
(in years) RWA Average RW
(in %)Expected
Loss
Valueadjustments
and Provisions
0.00 to <0.15 14.45 9.9 1,227 3.68 8 –0.15 to <0.25 14.91 6.6 2,430 7.02 14 –0.25 to <0.50 15.96 8.1 4,035 10.85 24 –0.50 to <0.75 17.70 8.0 6,510 17.30 46 –0.75 to <2.50 22.14 9.4 12,704 31.44 133 –2.50 to <10.00 23.78 7.7 10,304 51.12 223 –10.00 to <100.00 26.59 7.2 4,246 91.40 260 –100.00 (Default) 37.74 4.7 724 19.23 1,409 –Sub-total 18.40 8.2 42,181 19.92 2,118 1,759Dilution risk 0 0 0 0 0 0Sub-total incl. dilution risk 18.40 8.2 42,181 19.92 2,118 1,759
EU CR6 – AIRB approach – Credit risk exposures by exposure class and PD range – Retail, secured by real estate property SMEsDec 31, 2017
in € m.(unless stated otherwise) a b c d e f
PD scale EAD grossUndrawn
commitments
Weighted CreditConversion
Factor (CCF)(in %)
EAD net,post CRM
and post-CCFAverage PD
(in %)
Number ofobligors
(in 1,000s)
0.00 to <0.15 826 116 58.10 893 0.12 5.00.15 to <0.25 1,333 112 59.86 1,398 0.23 7.00.25 to <0.50 1,841 116 57.55 1,900 0.39 9.00.50 to <0.75 1,680 91 55.21 1,715 0.64 8.30.75 to <2.50 2,184 100 52.65 2,216 1.34 11.12.50 to <10.00 1,102 37 51.48 1,102 4.31 5.510.00 to <100.00 220 6 52.16 216 19.94 1.3100.00 (Default) 109 1 21.83 97 100.00 0.4Sub-total 9,296 579 56.42 9,538 2.52 47.5Dilution risk 0 0 0 0 0 0Sub-total incl. dilution risk 9,296 579 56.42 9,538 2.52 47.5
Dec 31, 2017in € m.(unless stated otherwise) g h i j k l
PD scale Average LGD
(in %)
Averagematurity
(in years) RWA Average RW
(in %)Expected
Loss
Valueadjustments
and Provisions
0.00 to <0.15 11.22 14.4 26 2.86 0 –0.15 to <0.25 10.78 14.9 62 4.44 0 –0.25 to <0.50 10.53 15.8 120 6.30 1 –0.50 to <0.75 10.63 15.7 154 8.96 1 –0.75 to <2.50 10.64 15.8 323 14.59 3 –2.50 to <10.00 10.39 15.4 307 27.86 5 –10.00 to <100.00 11.61 14.9 121 56.18 5 –100.00 (Default) 24.92 10.3 16 16.72 24 –Sub-total 10.83 15.4 1,129 11.83 39 24Dilution risk 0 0 0 0 0 0Sub-total incl. dilution risk 10.83 15.4 1,129 11.83 39 24

69
Deutsche Bank Credit risk exposure and credit risk mitigation in the internal-rating-based approachPillar 3 Report 2017 Quantitative information on the use of the IRB approach
EU CR6 – AIRB approach – Credit risk exposures by exposure class and PD range – Retail, secured by real estate property non-SMEs
Dec 31, 2017in € m.(unless stated otherwise) a b c d e f
PD scale EAD grossUndrawn
commitments
Weighted CreditConversion
Factor (CCF)(in %)
EAD net,post CRM
and post-CCFAverage PD
(in %)
Number ofobligors
(in 1,000s)
0.00 to <0.15 21,069 450 72.96 21,393 0.10 245.70.15 to <0.25 26,841 1,049 87.31 27,751 0.22 254.90.25 to <0.50 29,990 1,166 82.91 30,942 0.38 256.70.50 to <0.75 29,827 1,353 83.45 30,931 0.67 235.20.75 to <2.50 26,064 2,020 86.10 27,764 1.42 216.22.50 to <10.00 11,132 1,315 93.79 12,342 4.51 101.110.00 to <100.00 2,662 88 90.43 2,720 21.03 21.5100.00 (Default) 1,699 20 83.12 1,691 100.00 15.2Sub-total 149,283 7,459 85.90 155,533 2.33 1,346.6Dilution risk 0 0 0 0 0 0Sub-total incl. dilution risk 149,283 7,459 85.90 155,533 2.33 1,346.6
Dec 31, 2017in € m.(unless stated otherwise) g h i j k l
PD scale Average LGD
(in %)
Averagematurity
(in years) RWA Average RW
(in %)Expected
Loss
Valueadjustments
and Provisions
0.00 to <0.15 12.10 14.2 674 3.15 3 –0.15 to <0.25 13.53 7.0 1,707 6.15 8 –0.25 to <0.50 13.48 8.2 2,916 9.42 16 –0.50 to <0.75 14.29 8.3 4,582 14.81 30 –0.75 to <2.50 13.15 11.0 6,222 22.41 52 –2.50 to <10.00 12.40 9.5 5,106 41.37 70 –10.00 to <100.00 14.37 9.6 2,239 82.33 87 –100.00 (Default) 19.63 6.0 255 15.08 330 –Sub-total 13.40 9.4 23,702 15.24 595 378Dilution risk 0 0 0 0 0 0Sub-total incl. dilution risk 13.40 9.4 23,702 15.24 595 378
EU CR6 – AIRB approach – Credit risk exposures by exposure class and PD range – Retail, qualifying revolvingDec 31, 2017
in € m.(unless stated otherwise) a b c d e f
PD scale EAD grossUndrawn
commitments
Weighted CreditConversion
Factor (CCF)(in %)
EAD net,post CRM
and post-CCFAverage PD
(in %)
Number ofobligors
(in 1,000s)
0.00 to <0.15 37 10,102 89.18 7,157 0.08 881.20.15 to <0.25 98 3,461 92.32 2,595 0.19 181.50.25 to <0.50 143 1,135 80.16 917 0.38 164.00.50 to <0.75 179 726 74.47 654 0.67 191.00.75 to <2.50 301 599 71.13 684 1.48 298.72.50 to <10.00 210 214 74.75 351 4.67 132.610.00 to <100.00 59 20 77.56 72 19.75 26.1100.00 (Default) 57 2 61.45 58 100.00 28.2Sub-total 1,084 16,260 87.48 12,489 0.94 1,903.2Dilution risk 0 0 0 0 0 0Sub-total incl. dilution risk 1,084 16,260 87.48 12,489 0.94 1,903.2

70
Deutsche Bank Credit risk exposure and credit risk mitigation in the internal-rating-based approachPillar 3 Report 2017 Quantitative information on the use of the IRB approach
Dec 31, 2017in € m.(unless stated otherwise) g h i j k l
PD scale Average LGD
(in %)
Averagematurity
(in years) RWA Average RW
(in %)Expected
Loss
Valueadjustments
and Provisions
0.00 to <0.15 10.63 0.0 219 3.05 4 –0.15 to <0.25 6.13 0.0 178 6.87 3 –0.25 to <0.50 14.77 0.0 99 10.77 2 –0.50 to <0.75 17.91 0.0 111 16.95 2 –0.75 to <2.50 21.59 0.0 206 30.11 6 –2.50 to <10.00 21.07 0.0 238 67.85 9 –10.00 to <100.00 24.33 0.0 103 143.81 8 –100.00 (Default) 59.12 0.0 39 66.41 34 –Sub-total 11.58 0.0 1,193 9.55 68 66Dilution risk 0 0 0 0 0 0Sub-total incl. dilution risk 11.58 0.0 1,193 9.55 68 66
EU CR6 – AIRB approach – Credit risk exposures by exposure class and PD range – Other retail SMEsDec 31, 2017
in € m.(unless stated otherwise) a b c d e f
PD scale EAD grossUndrawn
commitments
Weighted CreditConversion
Factor (CCF)(in %)
EAD net,post CRM
and post-CCFAverage PD
(in %)
Number ofobligors
(in 1,000s)
0.00 to <0.15 282 566 43.48 690 0.11 27.80.15 to <0.25 361 749 35.28 711 0.23 33.90.25 to <0.50 522 660 33.72 877 0.39 33.60.50 to <0.75 570 500 33.21 835 0.64 24.70.75 to <2.50 939 567 33.93 1,206 1.38 25.62.50 to <10.00 733 309 33.56 794 4.49 15.910.00 to <100.00 243 60 32.15 172 21.36 4.9100.00 (Default) 209 13 42.47 133 100.00 2.9Sub-total 3,858 3,423 35.83 5,417 4.30 169.3Dilution risk 0 0 0 0 0 0Sub-total incl. dilution risk 3,858 3,423 35.83 5,417 4.30 169.3
Dec 31, 2017in € m.(unless stated otherwise) g h i j k l
PD scale Average LGD
(in %)
Averagematurity
(in years) RWA Average RW
(in %)Expected
Loss
Valueadjustments
and Provisions
0.00 to <0.15 42.49 4.6 67 9.65 0 –0.15 to <0.25 41.68 4.2 110 15.45 1 –0.25 to <0.50 46.24 3.8 214 24.33 2 –0.50 to <0.75 52.46 3.3 300 35.99 3 –0.75 to <2.50 54.61 3.2 624 51.73 9 –2.50 to <10.00 56.63 2.8 542 68.34 20 –10.00 to <100.00 55.51 2.9 171 99.49 21 –100.00 (Default) 60.47 3.1 52 39.46 80 –Sub-total 50.15 3.6 2,080 38.39 135 128Dilution risk 0 0 0 0 0 0Sub-total incl. dilution risk 50.15 3.6 2,080 38.39 135 128

71
Deutsche Bank Credit risk exposure and credit risk mitigation in the internal-rating-based approachPillar 3 Report 2017 Quantitative information on the use of the IRB approach
EU CR6 – AIRB approach – Credit risk exposures by exposure class and PD range – Other retail non-SMEsDec 31, 2017
in € m.(unless stated otherwise) a b c d e f
PD scale EAD grossUndrawn
commitments
Weighted CreditConversion
Factor (CCF)(in %)
EAD net,post CRM
and post-CCFAverage PD
(in %)
Number ofobligors
(in 1,000s)
0.00 to <0.15 1,583 1,635 49.84 3,240 0.08 391.20.15 to <0.25 1,624 753 63.55 2,138 0.22 255.30.25 to <0.50 2,038 699 64.55 2,547 0.39 271.50.50 to <0.75 3,113 559 62.77 3,498 0.66 359.50.75 to <2.50 8,255 577 42.06 8,539 1.48 849.62.50 to <10.00 5,452 197 47.27 5,571 4.55 430.210.00 to <100.00 1,437 42 53.25 1,466 19.54 125.6100.00 (Default) 1,826 29 49.65 1,786 100.00 116.6Sub-total 25,329 4,491 55.13 28,784 8.66 2,799.6Dilution risk 0 0 0 0 0 0Sub-total incl. dilution risk 25,329 4,491 55.13 28,784 8.66 2,799.6
Dec 31, 2017in € m.(unless stated otherwise) g h i j k l
PD scale Average LGD
(in %)
Averagematurity
(in years) RWA Average RW
(in %)Expected
Loss
Valueadjustments
and Provisions
0.00 to <0.15 33.35 2.7 242 7.48 1 –0.15 to <0.25 37.39 4.1 372 17.42 2 –0.25 to <0.50 40.04 4.9 687 26.99 4 –0.50 to <0.75 43.05 4.5 1,363 38.98 10 –0.75 to <2.50 49.82 4.2 5,329 62.41 63 –2.50 to <10.00 47.13 3.6 4,110 73.79 118 –10.00 to <100.00 48.19 2.6 1,611 109.91 140 –100.00 (Default) 53.20 3.5 362 20.26 942 –Sub-total 44.96 3.9 14,078 48.91 1,280 1,163Dilution risk 0 0 0 0 0 0Sub-total incl. dilution risk 44.96 3.9 14,078 48.91 1,280 1,163
EU CR6 – AIRB approach – Credit risk exposures by exposure class and PD range – Total Dec 31, 2017
in € m.(unless stated otherwise) a b c d e f
EAD grossUndrawn
commitments
Weighted CreditConversion
Factor (CCF)(in %)
EAD net,post CRM
and post-CCFAverage PD
(in %)
Number ofobligors
(in 1,000s)Dilution risk 2,751 176 28.49 2,901 15.85 0.3Total (all portfolios), incl. dilution risk 481,723 260,432 36.51 575,515 3.07 5,752.0
Dec 31, 2017in € m.(unless stated otherwise) g h i j k l
Average LGD(in %)
Averagematurity
(in years) RWA Average RW
(in %)Expected
Loss
Valueadjustments
and ProvisionsDilution risk 3.86 1.0 550 18.97 18 0Total (all portfolios), incl. dilution risk 29.58 4.2 126,933 22.06 4,432 4,243
Article 452 (d-g) CRR - Foundation IRB exposure
The following series of tables details the Group’s foundation IRB exposure distributed on our internal rating scale, separately forall relevant regulatory exposure classes. They exclude the counterparty credit risk position from derivatives and securities fi-nancing transactions which are presented separately in the section “Counterparty credit risk” in this report from page 91 to 102.
The tables show the EAD gross as well as the off-balance sheet exposure. All undrawn commitment exposure values shownbelow are assigned to the exposure class of their original counterparty and not to the exposure class of the protection seller.

72
Deutsche Bank Credit risk exposure and credit risk mitigation in the internal-rating-based approachPillar 3 Report 2017 Quantitative information on the use of the IRB approach
In addition they provide the EAD net after CRM, where exposures covered by guarantees or credit derivatives is assigned to theprotection seller. As a consequence the EAD net can be higher than the original balance sheet exposure.
The EAD net is presented in conjunction with exposures-weighted average PD, maturity as well as the RWA and the averagerisk weight (RW). In addition it provides the average LGD and average maturity, which is regulatory pre-defined in the founda-tion IRB. Further details in the tables are number of obligors, expected loss and provisions.
EU CR6 – FIRB approach – Credit risk exposures by exposure class and PD range – Central governments and central banksDec 31, 2017
in € m.(unless stated otherwise) a b c d e f
PD scale EAD grossUndrawn
commitments
Weighted CreditConversion
Factor (CCF)(in %)
EAD net,post CRM
and post-CCFAverage PD
(in %)
Number ofobligors
(in 1,000s)
0.00 to <0.15 0 0 0 0 0 00.15 to <0.25 0 0 0 0 0 00.25 to <0.50 0 0 0 0 0 00.50 to <0.75 0 0 0 0 0 00.75 to <2.50 0 0 0 0 0 02.50 to <10.00 0 0 0 0 0 010.00 to <100.00 0 0 0 0 0 0100.00 (Default) 0 0 0 0 0 0Sub-total 0 0 0 0 0 0Dilution risk 0 0 0 0 0 0Sub-total incl. dilution risk 0 0 0 0 0 0
Dec 31, 2017in € m.(unless stated otherwise) g h i j k l
PD scale Average LGD
(in %)
Averagematurity
(in years) RWA Average RW
(in %)Expected
Loss
Valueadjustments
and Provisions
0.00 to <0.15 0 0 0 0 0 –0.15 to <0.25 0 0 0 0 0 –0.25 to <0.50 0 0 0 0 0 –0.50 to <0.75 0 0 0 0 0 –0.75 to <2.50 0 0 0 0 0 –2.50 to <10.00 0 0 0 0 0 –10.00 to <100.00 0 0 0 0 0 –100.00 (Default) 0 0 0 0 0 –Sub-total 0 0 0 0 0 0Dilution risk 0 0 0 0 0 0Sub-total incl. dilution risk 0 0 0 0 0 0
EU CR6 – FIRB approach – Credit risk exposures by exposure class and PD range – InstitutionsDec 31, 2017
in € m.(unless stated otherwise) a b c d e f
PD scale EAD grossUndrawn
commitments
Weighted CreditConversion
Factor (CCF)(in %)
EAD net,post CRM
and post-CCFAverage PD
(in %)
Number ofobligors
(in 1,000s)
0.00 to <0.15 0 0 0 0 0.11 <0.10.15 to <0.25 2 0 0 1 0.20 <0.10.25 to <0.50 0 0 0 0 0.38 <0.10.50 to <0.75 0 0 0 0 0.68 <0.10.75 to <2.50 0 0 0 0 0 02.50 to <10.00 0 0 0 0 0 010.00 to <100.00 0 0 0 0 20.00 <0.1100.00 (Default) 0 0 0 0 0 0Sub-total 2 0 0 1 0.20 <0.1Dilution risk 0 0 0 0 0 0Sub-total incl. dilution risk 2 0 0 1 0.20 <0.1

73
Deutsche Bank Credit risk exposure and credit risk mitigation in the internal-rating-based approachPillar 3 Report 2017 Quantitative information on the use of the IRB approach
Dec 31, 2017in € m.(unless stated otherwise) g h i j k l
PD scale Average LGD
(in %)
Averagematurity
(in years) RWA Average RW
(in %)Expected
Loss
Valueadjustments
and Provisions
0.00 to <0.15 42.69 2.5 0 40.79 0 –0.15 to <0.25 42.69 2.5 1 59.23 0 –0.25 to <0.50 42.69 2.5 0 61.52 0 –0.50 to <0.75 42.68 2.5 0 80.53 0 –0.75 to <2.50 0 0 0 0 0 –2.50 to <10.00 0 0 0 0 0 –10.00 to <100.00 45.00 2.5 0 286.59 0 –100.00 (Default) 0 0 0 0 0 –Sub-total 42.69 2.5 1 58.07 0 0Dilution risk 0 0 0 0 0 0Sub-total incl. dilution risk 42.69 2.5 1 58.07 0 0
EU CR6 – FIRB approach – Credit risk exposures by exposure class and PD range – Corporates, totalDec 31, 2017
in € m.(unless stated otherwise) a b c d e f
PD scale EAD grossUndrawn
commitments
Weighted CreditConversion
Factor (CCF)(in %)
EAD net,post CRM
and post-CCFAverage PD
(in %)
Number ofobligors
(in 1,000s)
0.00 to <0.15 258 74 0 864 0.05 7.80.15 to <0.25 1,850 1,034 74.76 1,949 0.19 2.10.25 to <0.50 1,027 531 75.00 888 0.38 2.40.50 to <0.75 849 320 73.36 677 0.69 1.40.75 to <2.50 408 160 75.00 298 1.38 0.62.50 to <10.00 54 31 75.00 57 5.48 <0.110.00 to <100.00 29 8 69.27 24 19.84 0.1100.00 (Default) 43 1 76.11 44 100.00 0.1Sub-total 4,519 2,159 74.75 4,800 1.43 14.5Dilution risk 3,143 1,811 7.52 3,165 0.09 46.3Sub-total incl. dilution risk 7,662 3,971 43.26 7,965 0.90 55.6
Dec 31, 2017in € m.(unless stated otherwise) g h i j k l
PD scale Average LGD
(in %)
Averagematurity
(in years) RWA Average RW
(in %)Expected
Loss
Valueadjustments
and Provisions
0.00 to <0.15 21.17 2.5 89 10.36 0 –0.15 to <0.25 33.72 2.5 665 34.10 1 –0.25 to <0.50 31.23 2.5 402 45.32 1 –0.50 to <0.75 21.32 2.5 274 40.53 1 –0.75 to <2.50 20.94 2.5 148 49.65 1 –2.50 to <10.00 32.81 2.5 69 121.34 1 –10.00 to <100.00 40.50 2.5 54 226.51 2 –100.00 (Default) 41.17 2.5 0 0 18 –Sub-total 28.55 2.5 1,701 35.45 26 32Dilution risk 59.69 1.0 496 15.67 2 0Sub-total incl. dilution risk 40.92 1.9 2,197 27.59 27 32

74
Deutsche Bank Credit risk exposure and credit risk mitigation in the internal-rating-based approachPillar 3 Report 2017 Quantitative information on the use of the IRB approach
EU CR6 – FIRB approach – Credit risk exposures by exposure class and PD range – Corporates, SMEsDec 31, 2017
in € m.(unless stated otherwise) a b c d e f
PD scale EAD grossUndrawn
commitments
Weighted CreditConversion
Factor (CCF)(in %)
EAD net,post CRM
and post-CCFAverage PD
(in %)
Number ofobligors
(in 1,000s)
0.00 to <0.15 0 0 0 0 0 00.15 to <0.25 21 8 0 17 0.23 <0.10.25 to <0.50 8 3 75.00 7 0.38 <0.10.50 to <0.75 3 5 0 3 0.69 <0.10.75 to <2.50 6 1 0 6 1.28 <0.12.50 to <10.00 1 0 0 0 3.79 <0.110.00 to <100.00 0 1 0 0 19.14 <0.1100.00 (Default) 0 0 0 0 100.00 <0.1Sub-total 40 18 75.00 34 0.70 0.1Dilution risk 242 301 7.53 264 0.11 34.3Sub-total incl. dilution risk 282 320 7.69 298 0.18 34.7
Dec 31, 2017in € m.(unless stated otherwise) g h i j k l
PD scale Average LGD
(in %)
Averagematurity
(in years) RWA Average RW
(in %)Expected
Loss
Valueadjustments
and Provisions
0.00 to <0.15 0 0 0 0 0 –0.15 to <0.25 42.87 2.5 8 47.11 0 –0.25 to <0.50 21.50 2.5 1 21.26 0 –0.50 to <0.75 25.29 2.5 1 32.59 0 –0.75 to <2.50 41.17 2.5 5 81.99 0 –2.50 to <10.00 19.33 2.5 0 39.32 0 –10.00 to <100.00 39.60 2.5 0 165.56 0 –100.00 (Default) 12.33 2.5 0 0 0 –Sub-total 36.49 2.5 16 48.00 0 0Dilution risk 59.69 1.0 36 13.82 0 0Sub-total incl. dilution risk 57.04 1.2 53 17.72 0 0
EU CR6 – FIRB approach – Credit risk exposures by exposure class and PD range – Corporates, specialized lendingDec 31, 2017
in € m.(unless stated otherwise) a b c d e f
PD scale EAD grossUndrawn
commitments
Weighted CreditConversion
Factor (CCF)(in %)
EAD net,post CRM
and post-CCFAverage PD
(in %)
Number ofobligors
(in 1,000s)
0.00 to <0.15 0 0 0 0 0 00.15 to <0.25 0 0 0 0 0 00.25 to <0.50 0 0 0 0 0 00.50 to <0.75 0 0 0 0 0 00.75 to <2.50 0 0 0 0 0 02.50 to <10.00 0 0 0 0 0 010.00 to <100.00 0 0 0 0 0 0100.00 (Default) 0 0 0 0 0 0Sub-total 0 0 0 0 0 0Dilution risk 0 0 0 0 0 0Sub-total incl. dilution risk 0 0 0 0 0 0

75
Deutsche Bank Credit risk exposure and credit risk mitigation in the internal-rating-based approachPillar 3 Report 2017 Quantitative information on the use of the IRB approach
Dec 31, 2017in € m.(unless stated otherwise) g h i j k l
PD scale Average LGD
(in %)
Averagematurity
(in years) RWA Average RW
(in %)Expected
Loss
Valueadjustments
and Provisions
0.00 to <0.15 0 0 0 0 0 –0.15 to <0.25 0 0 0 0 0 –0.25 to <0.50 0 0 0 0 0 –0.50 to <0.75 0 0 0 0 0 –0.75 to <2.50 0 0 0 0 0 –2.50 to <10.00 0 0 0 0 0 –10.00 to <100.00 0 0 0 0 0 –100.00 (Default) 0 0 0 0 0 –Sub-total 0 0 0 0 0 0Dilution risk 0 0 0 0 0 0Sub-total incl. dilution risk 0 0 0 0 0 0
EU CR6 – FIRB approach – Credit risk exposures by exposure class and PD range – Corporates, otherDec 31, 2017
in € m.(unless stated otherwise) a b c d e f
PD scale EAD grossUndrawn
commitments
Weighted CreditConversion
Factor (CCF)(in %)
EAD net,post CRM
and post-CCFAverage PD
(in %)
Number ofobligors
(in 1,000s)
0.00 to <0.15 258 74 0 864 0.05 7.80.15 to <0.25 1,830 1,026 74.76 1,931 0.19 2.10.25 to <0.50 1,019 528 75.00 881 0.38 2.40.50 to <0.75 846 315 73.36 674 0.69 1.40.75 to <2.50 402 158 75.00 292 1.39 0.62.50 to <10.00 52 31 75.00 56 5.50 <0.110.00 to <100.00 29 7 69.27 24 19.84 0.1100.00 (Default) 43 1 76.11 44 100.00 0.1Sub-total 4,479 2,141 74.75 4,766 1.43 14.4Dilution risk 2,901 1,510 7.37 2,901 0.09 12.0Sub-total incl. dilution risk 7,380 3,651 73.69 7,667 0.93 24.1
Dec 31, 2017in € m.(unless stated otherwise) g h i j k l
PD scale Average LGD
(in %)
Averagematurity
(in years) RWA Average RW
(in %)Expected
Loss
Valueadjustments
and Provisions
0.00 to <0.15 21.17 2.5 89 10.36 0 –0.15 to <0.25 33.64 2.5 656 33.99 1 –0.25 to <0.50 31.30 2.5 401 45.51 1 –0.50 to <0.75 21.30 2.5 273 40.57 1 –0.75 to <2.50 20.50 2.5 143 48.95 1 –2.50 to <10.00 32.90 2.5 69 121.90 1 –10.00 to <100.00 40.51 2.5 54 227.17 2 –100.00 (Default) 41.17 2.5 0 0 18 –Sub-total 28.49 2.5 1,685 35.36 25 32Dilution risk 59.69 1.0 459 15.84 2 0Sub-total incl. dilution risk 40.30 1.9 2,145 27.97 27 32
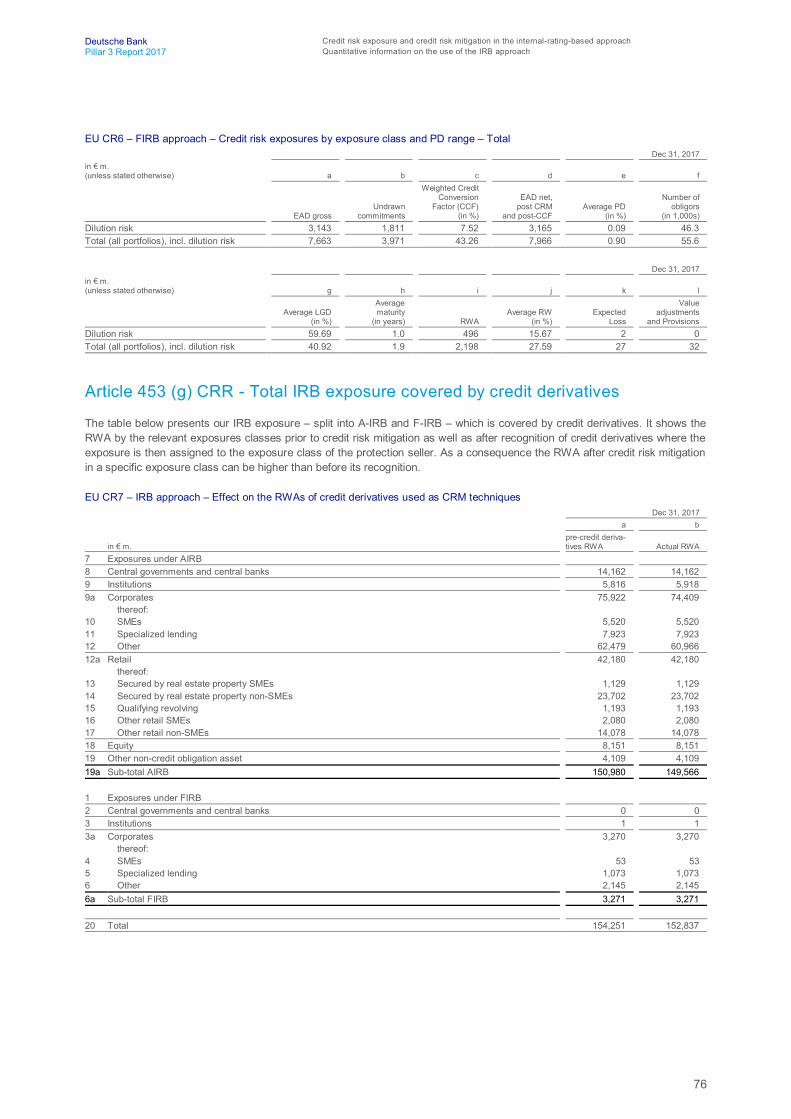
76
Deutsche Bank Credit risk exposure and credit risk mitigation in the internal-rating-based approachPillar 3 Report 2017 Quantitative information on the use of the IRB approach
EU CR6 – FIRB approach – Credit risk exposures by exposure class and PD range – Total Dec 31, 2017
in € m.(unless stated otherwise) a b c d e f
EAD grossUndrawn
commitments
Weighted CreditConversion
Factor (CCF)(in %)
EAD net,post CRM
and post-CCFAverage PD
(in %)
Number ofobligors
(in 1,000s)Dilution risk 3,143 1,811 7.52 3,165 0.09 46.3Total (all portfolios), incl. dilution risk 7,663 3,971 43.26 7,966 0.90 55.6
Dec 31, 2017in € m.(unless stated otherwise) g h i j k l
Average LGD(in %)
Averagematurity
(in years) RWA Average RW
(in %)Expected
Loss
Valueadjustments
and ProvisionsDilution risk 59.69 1.0 496 15.67 2 0Total (all portfolios), incl. dilution risk 40.92 1.9 2,198 27.59 27 32
Article 453 (g) CRR - Total IRB exposure covered by credit derivatives
The table below presents our IRB exposure – split into A-IRB and F-IRB – which is covered by credit derivatives. It shows theRWA by the relevant exposures classes prior to credit risk mitigation as well as after recognition of credit derivatives where theexposure is then assigned to the exposure class of the protection seller. As a consequence the RWA after credit risk mitigationin a specific exposure class can be higher than before its recognition.
EU CR7 – IRB approach – Effect on the RWAs of credit derivatives used as CRM techniquesDec 31, 2017
a b
in € m.pre-credit deriva-tives RWA Actual RWA
7 Exposures under AIRB8 Central governments and central banks 14,162 14,1629 Institutions 5,816 5,9189a Corporates 75,922 74,409
thereof:10 SMEs 5,520 5,52011 Specialized lending 7,923 7,92312 Other 62,479 60,96612a Retail 42,180 42,180
thereof:13 Secured by real estate property SMEs 1,129 1,12914 Secured by real estate property non-SMEs 23,702 23,70215 Qualifying revolving 1,193 1,19316 Other retail SMEs 2,080 2,08017 Other retail non-SMEs 14,078 14,07818 Equity 8,151 8,15119 Other non-credit obligation asset 4,109 4,10919a Sub-total AIRB 150,980 149,566
1 Exposures under FIRB2 Central governments and central banks 0 03 Institutions 1 13a Corporates 3,270 3,270
thereof:4 SMEs 53 535 Specialized lending 1,073 1,0736 Other 2,145 2,1456a Sub-total FIRB 3,271 3,271
20 Total 154,251 152,837

77
Deutsche Bank Credit risk exposure and credit risk mitigation in the internal-rating-based approachPillar 3 Report 2017 Quantitative information on the use of the IRB approach
Article 438 (d) CRR - Development of Credit Risk RWA
The following table provides an analysis of key drivers for RWA movements observed for credit risk, excluding counterpartycredit risk, to the extent covered in IRB approaches in the fourth quarter of 2017.
EU CR8 – RWA flow statement of credit risk exposures under the IRB approach Three months ended Dec 31, 2017
a b
in € m. RWACapital
requirements1 Credit risk RWA opening balance 135,616 10,8492 Book size 0 03 Book quality (38) (3)4 Model updates 0 05 Methodology and Policy 0 06 Acquisitions and Disposals 0 07 Foreign exchange movements (629) (50)8 Other 0 09 Credit risk RWA closing balance 134,950 10,796
Organic changes in our portfolio size and composition are considered in the category “Book size”. The category “Book quality”mainly represents the effects from portfolio rating migrations, loss given default, model parameter recalibrations as well ascollateral coverage and netting activities. “Model updates” include model refinements and advanced model roll out. RWAmovements resulting from externally, regulatory-driven changes, e.g. applying new regulations, are considered in the “Method-ology and Policy” section. “Acquisition and Disposals” is reserved to show significant exposure movements which can be clearlyassigned to new businesses or disposal-related activities. Changes that cannot be attributed to the above categories are re-flected in the category “Other”.
The decrease in RWA for credit risk exposures under the IRB approach by 0.5 % or € 0.7 billion since September 2017 is pre-dominantly driven by reductions in “Foreign exchange movements” and “Book Quality”. “Book Quality” largely reflects the im-pact from recalibrations of our risk parameters as well as process enhancements.
Article 452 (h-i) CRR - Model validation results and expected versus actual loss-es
Advanced IRBA – Model validation results
The validation reviews conducted in 2017 for advanced IRBA rating systems (including Postbank) triggered recalibrations asshown in the table below. Changes in overall counts of parameters compared to previous year are due to changes in granularityin existing risk parameter assignment. For PD parameters, the counting in 2017 was amended now covering parameters cali-brated jointly only once. This leads to a reduction in overall count compared to 2016. None of the triggered recalibrations indi-vidually nor the impact of all recalibrations in the aggregate impacted or are indicated to impact our regulatory capitalrequirements materially.
Validation results for risk parameters used in our advanced IRBA2017
PD LGD EADCount EAD in % Count EAD in % Count EAD in %
Appropriate 95 87.1 107 86.1 74 92.2Overly conservative 10 7.5 34 3.9 7 2.6Progressive 17 5.5 45 10.1 9 5.2Total 122 100.0 186 100.0 90 100.0
Thereof already recalibrated and introduced in 2017
Overly conservative 0 0.0 3 1.2 0 0.0Progressive 2 0.6 0 0.0 1 0.3Total 2 0.6 3 1.2 1 0.3

78
Deutsche Bank Credit risk exposure and credit risk mitigation in the internal-rating-based approachPillar 3 Report 2017 Quantitative information on the use of the IRB approach
2016PD LGD EAD
Count EAD in % Count EAD in % Count EAD in %Appropriate 124 85.8 115 79.3 67 95.2Overly conservative 11 2.8 27 7.9 16 4.2Progressive 56 11.5 36 12.8 6 0.5Total 191 100.0 178 100.0 89 100.0
Thereof already recalibrated and introduced in 2016
Overly conservative 2 0.1 1 4.0 10 3.9Progressive 41 9.6 4 1.0 0 0.0Total 43 9.7 5 5.0 10 3.9
Individual risk parameter settings are classified as appropriate if no recalibration was triggered by the validation and thus theapplication of the current parameter setting is continued since still sufficiently conservative. A parameter classifies as overlyconservative or progressive if the validation triggers a recalibration analysis leading to a potential downward or upward changeof the current setting, respectively. The breakdown for PD, LGD and EAD is presented by number as well as by the relativeEAD attached to the respective parameter as of December 31, 2017 and December 31, 2016.
The validations during 2017 largely confirmed our parameter settings. Negatively validated PD parameters with high materialitywere caused by four rating systems. For one Deutsche Bank rating system contributing around 2.0 % of EAD and one Post-bank rating system contributing around 5.1 % of EAD the PD parameter was classified as overly conservative and the recalibra-tion is scheduled for 2018. The PD parameter of one Deutsche Bank rating system contributing around 1.1 % of EAD wasclassified as too progressive and the recalibration will get introduced in Q1 2018. For one additional Deutsche Bank ratingsystem which contributed to 2.6 % EAD and for which the PD was classified as too progressive, reratings were already per-formed in 2017 based on sharpened rating guidelines to remediate the underestimation. Validations furthermore classified eightLGD parameters of Deutsche Bank contributing around 5.9 % of EAD as too progressive. The recalibrations were alreadyperformed and are scheduled for implementation in Q1 2018. Two LGD parameters of Deutsche Bank contributing around1.3 % of EAD were classified as overly conservative and recalibration is scheduled for Q2 2018 pending regulatory approval.Recalibrations of 26 negatively validated LGD parameters of Deutsche Bank will be introduced with a single LGD methodologyoverhaul for the common underlying portfolio. On portfolio level, current settings of these parameters are evenly classified aseither too progressive or overly conservative, thereby cancelling out the impact of the estimation error. Three LGD parametersof Postbank which contribute around 1.2 % of EAD and which have been classified as overly conservative have already beenamended in 2017. Eight inappropriate EAD parameters contributing 1.3 % of EAD were either already amended in 2017 (oneparameter) or are scheduled for implementation in Q1 2018 (seven parameters). One EAD parameter of Postbank contributing4.0 % of EAD was classified as too progressive and recalibration is scheduled for 2018. All other negatively validated parame-ters are only applied to smaller portfolios. Overall, out of the 122 risk parameters, where a recalibration was triggered during2017 validation, six were already amended in 2017.
The below table EU CR9 aims at providing backtesting information for probabilities of default (“PD”). It compares the PD used inthe advanced IRB capital calculations with the effective obligors’ default rates presented on a five year average by regulatoryexposure classes. It has to be noted that the below table reflects credit risk as well as counterparty credit risk information simul-taneously in line with our internal rating model validation practice where ratings are validated on a counterparty level across allexposure types. Moreover, some limitations have to be considered when comparing the below backtesting results with theabove presented PD model validation results: Whilst in line with our internal procedures model validation is conducted on thelevel of the rating model and the model validation results provided above reflect this practice, for the below presentation byregulatory exposure classes the underlying ratings models have been assigned subsequently to the relevant regulatory expo-sure class. This different way of aggregation applied for the below backtesting information may result in some bias for the belowbacktesting results in contrast to the above model validation results.

79
Deutsche Bank Credit risk exposure and credit risk mitigation in the internal-rating-based approachPillar 3 Report 2017 Quantitative information on the use of the IRB approach
EU CR9 IRB backtesting of PD per exposure class for Advanced IRBA Dec 31, 2017
a/b c d e f g h iNumber of obligors
Exposure class/PD Range
Externalratingequivalent
Weightedaverage
PD(in %)
Arithmeticaverage
PD byobligors
(in %)
End ofprevious
year (in 1,000s)
End ofthe year
(in 1,000s)
Defaultedobligors
in the year
thereofnew
obligors in the year
Averagehistorical
annualdefault
rate(in %)
Central governmentsand central banks0.00 to <0.15 AAA to BBB+ 0.00 0.03 0.2 0.3 0 0 0.000.15 to <0.25 BBB+ to BBB 0.23 0.23 <0.1 <0.1 0 0 0.000.25 to <0.50 BBB to BBB- 0.39 0.39 <0.1 <0.1 0 0 0.610.50 to <0.75 BBB- to BB+ 0.64 0.64 <0.1 <0.1 0 0 0.710.75 to <2.50 BB+ to BB- 1.49 1.37 <0.1 <0.1 0 0 0.822.50 to <10.00 BB- to B- 3.99 4.18 <0.1 <0.1 0 0 0.4910.00 to <100.00 B- to CCC- 13.00 13.00 <0.1 <0.1 3 0 11.04100.00 (Default) CCC- to D 100.00 N/M 0 0 0 0 N/MSub-total N/M 0.08 1.64 0.4 0.4 3 0 0.46
Institutions0.00 to <0.15 AAA to BBB+ 0.05 0.07 0.8 0.8 0 0 0.000.15 to <0.25 BBB+ to BBB 0.23 0.23 0.1 0.1 0 0 0.000.25 to <0.50 BBB to BBB- 0.39 0.39 0.1 0.1 0 0 0.000.50 to <0.75 BBB- to BB+ 0.64 0.64 0.1 0.1 0 0 0.000.75 to <2.50 BB+ to BB- 1.53 1.34 0.1 0.1 0 0 0.462.50 to <10.00 BB- to B- 4.14 4.54 0.1 <0.1 2 1 1.7710.00 to <100.00 B- to CCC- 15.23 22.19 <0.1 <0.1 2 0 7.55100.00 (Default) CCC- to D 100.00 N/M 0 0 0 0 0.00Sub-total N/M 0.61 1.78 1.3 1.2 4 1 0.35
Corporates0.00 to <0.15 AAA to BBB+ 0.06 0.06 28.4 28.5 8 0 0.030.15 to <0.25 BBB+ to BBB 0.23 0.23 6.1 6.1 4 0 0.100.25 to <0.50 BBB to BBB- 0.39 0.39 6.1 6.1 19 0 0.230.50 to <0.75 BBB- to BB+ 0.64 0.64 5.2 5.3 19 2 0.380.75 to <2.50 BB+ to BB- 1.39 1.37 7.8 7.5 141 62 0.862.50 to <10.00 BB- to B- 4.87 4.65 4.1 3.9 83 3 2.5110.00 to <100.00 B- to CCC- 18.15 20.74 1.0 0.9 91 6 10.29100.00 (Default) CCC- to D 100.00 100.00 0.1 0.1 0 0 18.29Sub-total N/M 3.06 3.12 58.7 58.3 365 73 0.53
thereof:SMEs0.00 to <0.15 AAA to BBB+ 0.08 0.08 4.3 5.4 2 0 0.110.15 to <0.25 BBB+ to BBB 0.23 0.23 1.8 2.0 4 0 0.170.25 to <0.50 BBB to BBB- 0.39 0.39 1.9 2.1 8 0 0.430.50 to <0.75 BBB- to BB+ 0.65 0.65 1.6 1.8 10 0 0.660.75 to <2.50 BB+ to BB- 1.41 1.38 2.1 2.4 34 0 1.152.50 to <10.00 BB- to B- 4.80 4.54 1.1 1.3 30 0 3.2010.00 to <100.00 B- to CCC- 20.74 21.50 0.3 0.3 30 1 12.01100.00 (Default) CCC- to D 100.00 100.00 <0.1 <0.1 0 0 50.00Sub-total N/M 4.72 2.91 13.0 15.3 118 1 1.37
Specialized lending0.00 to <0.15 AAA to BBB+ 0.07 0.06 0.1 <0.1 0 0 0.000.15 to <0.25 BBB+ to BBB 0.20 0.20 0.1 0.1 0 0 0.420.25 to <0.50 BBB to BBB- 0.39 0.38 0.1 0.1 0 0 0.000.50 to <0.75 BBB- to BB+ 0.66 0.67 <0.1 <0.1 0 0 0.000.75 to <2.50 BB+ to BB- 1.39 1.53 0.1 0.1 0 0 1.212.50 to <10.00 BB- to B- 5.19 4.99 <0.1 <0.1 0 0 3.3310.00 to <100.00 B- to CCC- 17.52 17.68 <0.1 <0.1 1 0 11.11100.00 (Default) CCC- to D 100.00 100.00 <0.1 <0.1 0 0 N/MSub-total N/M 12.97 7.21 0.4 0.3 1 0 0.72

80
Deutsche Bank Credit risk exposure and credit risk mitigation in the internal-rating-based approachPillar 3 Report 2017 Quantitative information on the use of the IRB approach
Dec 31, 2017a/b c d e f g h i
Number of obligors
Exposure class/PD Range
Externalratingequivalent
Weightedaverage
PD(in %)
Arithmeticaverage
PD byobligors
(in %)
End ofprevious
year (in 1,000s)
End ofthe year
(in 1,000s)
Defaultedobligors
in the year
thereofnew
obligors in the year
Averagehistorical
annualdefault
rate(in %)
Other0.00 to <0.15 AAA to BBB+ 0.05 0.06 24.1 23.1 6 0 0.030.15 to <0.25 BBB+ to BBB 0.23 0.23 4.2 4.0 0 0 0.070.25 to <0.50 BBB to BBB- 0.39 0.39 4.2 3.9 11 0 0.210.50 to <0.75 BBB- to BB+ 0.64 0.64 3.5 3.4 9 2 0.330.75 to <2.50 BB+ to BB- 1.39 1.36 5.6 5.0 107 62 0.792.50 to <10.00 BB- to B- 4.72 4.65 3.0 2.6 53 3 2.4110.00 to <100.00 B- to CCC- 19.56 20.86 0.7 0.6 60 5 10.09100.00 (Default) CCC- to D 100.00 100.00 0.1 0.1 0 0 10.67Sub-total N/M 1.93 2.83 45.3 42.7 246 72 0.47
Retail0.00 to <0.15 AAA to BBB+ 0.10 0.09 1,352.3 1,338.1 649 30 0.040.15 to <0.25 BBB+ to BBB 0.22 0.22 666.8 651.2 799 49 0.120.25 to <0.50 BBB to BBB- 0.39 0.39 664.5 645.0 1,609 271 0.220.50 to <0.75 BBB- to BB+ 0.66 0.66 711.4 741.1 3,141 529 0.380.75 to <2.50 BB+ to BB- 1.42 1.41 1,263.6 1,290.3 13,278 2,150 1.002.50 to <10.00 BB- to B- 4.53 4.51 642.7 629.0 20,969 2,598 2.7710.00 to <100.00 B- to CCC- 20.49 20.59 156.1 159.1 29,846 965 17.58100.00 (Default) CCC- to D 100.00 100.00 39.1 70.6 4,799 575 23.87Sub-total N/M 3.33 3.71 5,496.3 5,524.3 75,090 7,167 1.31
thereof:Secured by real estateproperty0.00 to <0.15 AAA to BBB+ 0.10 0.09 236.8 205.7 76 0 0.060.15 to <0.25 BBB+ to BBB 0.22 0.21 268.8 255.5 131 1 0.120.25 to <0.50 BBB to BBB- 0.38 0.38 270.5 262.4 279 1 0.200.50 to <0.75 BBB- to BB+ 0.67 0.67 248.8 242.2 423 8 0.290.75 to <2.50 BB+ to BB- 1.41 1.42 229.2 226.5 784 11 0.442.50 to <10.00 BB- to B- 4.51 4.48 107.1 105.6 1,046 7 1.5410.00 to <100.00 B- to CCC- 20.86 21.08 25.2 20.5 2,708 8 12.41100.00 (Default) CCC- to D 100.00 100.00 10.8 9.7 551 0 35.49Sub-total N/M 2.46 2.37 1,397.2 1,328.0 5,998 36 0.65
Qualifying revolving0.00 to <0.15 AAA to BBB+ 0.08 0.08 848.8 849.8 282 17 0.020.15 to <0.25 BBB+ to BBB 0.23 0.23 149.5 146.6 252 13 0.090.25 to <0.50 BBB to BBB- 0.39 0.39 119.7 121.0 418 31 0.180.50 to <0.75 BBB- to BB+ 0.65 0.65 108.7 148.8 705 101 0.350.75 to <2.50 BB+ to BB- 1.39 1.31 156.6 230.3 2,047 419 1.222.50 to <10.00 BB- to B- 4.45 4.50 88.7 94.7 3,573 433 2.9910.00 to <100.00 B- to CCC- 20.73 19.65 16.6 18.2 3,070 159 15.03100.00 (Default) CCC- to D 100.00 100.00 0.8 19.2 58 0 0.00Sub-total N/M 1.16 1.47 1,489.3 1,628.7 10,405 1,173 0.68
Other0.00 to <0.15 AAA to BBB+ 0.08 0.09 266.7 282.7 291 13 0.090.15 to <0.25 BBB+ to BBB 0.22 0.22 248.5 249.1 416 35 0.150.25 to <0.50 BBB to BBB- 0.39 0.39 274.2 261.6 912 239 0.250.50 to <0.75 BBB- to BB+ 0.65 0.65 353.9 350.1 2,013 420 0.440.75 to <2.50 BB+ to BB- 1.47 1.43 877.8 833.5 10,447 1,720 1.152.50 to <10.00 BB- to B- 4.57 4.50 446.8 428.7 16,350 2,158 3.0110.00 to <100.00 B- to CCC- 19.74 20.78 114.3 120.4 24,068 798 19.47100.00 (Default) CCC- to D 100.00 100.00 27.5 41.6 4,190 575 20.58Sub-total N/M 7.80 5.77 2,609.8 2,567.6 58,687 5,958 2.01

81
Deutsche Bank Credit risk exposure and credit risk mitigation in the internal-rating-based approachPillar 3 Report 2017 Quantitative information on the use of the IRB approach
Foundation IRBA – Model validation resultsThe below table summarizes the outcome of the model validations for the risk parameter PD used in our foundation IRBA forPostbank. If individual risk parameter settings are classified as appropriate, no recalibration was triggered by the validation. Thebreakdown is presented by number as well as by the relative EAD attached to the respective parameter as of December 31,2017 and as of December 31, 2016.
Validation results of risk parameters used in our Foundation IRBA at PostbankPD
2017 2016Count EAD in % Count EAD in %
Appropriate 1 100.0 1 100.0Overly conservative 0 0.0 0 0.0Progressive 0 0.0 0 0.0Total 1 100.0 1 100.0
Thereof already recalibrated and introduced in 2017 in 2016Overly conservative 0 0.0 0 0.0Progressive 0 0.0 0 0.0Total 0 0.0 0 0.0
The validation classifies the PD parameter settings for the foundation IRBA relevant rating system of Postbank as appropriate.
The below table EU CR9 aims at providing backtesting information for probabilities of default (“PD”) in comparing the PD usedin the foundation IRB capital calculations with the effective obligors’ default rates presented on a five year average by regulatoryexposure classes. The conceptual design as well as the structural limitations to be considered are the same as describedabove for the advanced IRB backtesting table.
EU CR9 IRB backtesting of PD per exposure class for Foundation IRBADec 31, 2017
a/b c d e f g h iNumber of obligors
Exposure class/PD Range
Externalratingequivalent
Weightedaverage
PD(in %)
Arithmeticaverage
PD byobligors
(in %)
End ofprevious
year (in 1,000s)
End ofthe year
(in 1,000s)
Defaultedobligors
in the year
thereofnew
obligors in the year
Averagehistorical
annualdefault
rate(in %)
Central governmentsand central banks0.00 to <0.15 AAA to BBB+ 0.00 0.00 0 0 0 0 0.000.15 to <0.25 BBB+ to BBB 0.00 0.00 0 0 0 0 0.000.25 to <0.50 BBB to BBB- 0.00 0.00 0 0 0 0 0.000.50 to <0.75 BBB- to BB+ 0.00 0.00 0 0 0 0 0.000.75 to <2.50 BB+ to BB- 0.00 0.00 0 0 0 0 0.002.50 to <10.00 BB- to B- 0.00 0.00 0 0 0 0 0.0010.00 to <100.00 B- to CCC- 0.00 0.00 0 0 0 0 0.00100.00 (Default) CCC- to D 100.00 100.00 <0.1 <0.1 0 0 0.00Sub-total N/M 100.00 100.00 <0.1 <0.1 0 0 0.00
Institutions0.00 to <0.15 AAA to BBB+ 0.06 0.06 <0.1 <0.1 0 0 0.000.15 to <0.25 BBB+ to BBB 0.14 0.22 <0.1 <0.1 0 0 0.000.25 to <0.50 BBB to BBB- 0.39 0.38 <0.1 <0.1 0 0 0.000.50 to <0.75 BBB- to BB+ 0.55 0.69 <0.1 <0.1 0 0 0.000.75 to <2.50 BB+ to BB- 2.17 2.17 <0.1 0 0 0 0.002.50 to <10.00 BB- to B- 3.14 4.83 <0.1 0 0 0 0.0010.00 to <100.00 B- to CCC- 11.53 18.31 <0.1 <0.1 0 0 0.00100.00 (Default) CCC- to D 0.00 0.00 0 0 0 0 0.00Sub-total N/M 3.83 4.46 0.1 <0.1 0 0 0.00
Corporates0.00 to <0.15 AAA to BBB+ 0.09 0.10 0.3 0.4 0 0 0.730.15 to <0.25 BBB+ to BBB 0.18 0.21 1.9 2.2 2 0 0.260.25 to <0.50 BBB to BBB- 0.32 0.38 2.2 2.5 0 0 0.230.50 to <0.75 BBB- to BB+ 0.56 0.69 1.4 1.5 1 0 0.270.75 to <2.50 BB+ to BB- 0.96 1.37 0.6 0.6 6 0 1.222.50 to <10.00 BB- to B- 5.45 6.01 <0.1 <0.1 2 0 3.0110.00 to <100.00 B- to CCC- 19.03 19.07 0.1 0.1 1 0 2.11100.00 (Default) CCC- to D 100.00 100.00 0.1 0.1 0 0 0.00Sub-total N/M 1.70 2.42 6.6 7.4 12 0 0.64

82
Deutsche Bank Credit risk exposure and credit risk mitigation in the internal-rating-based approachPillar 3 Report 2017 Quantitative information on the use of the IRB approach
Dec 31, 2017a/b c d e f g h i
Number of obligors
Exposure class/PD Range
Externalratingequivalent
Weightedaverage
PD(in %)
Arithmeticaverage
PD byobligors
(in %)
End ofprevious
year (in 1,000s)
End ofthe year
(in 1,000s)
Defaultedobligors
in the year
thereofnew
obligors in the year
Averagehistorical
annualdefault
rate(in %)
thereof:SMEs0.00 to <0.15 AAA to BBB+ 0.00 0.00 0 0 0 0 0.000.15 to <0.25 BBB+ to BBB 0.21 0.22 <0.1 0.1 0 0 0.080.25 to <0.50 BBB to BBB- 0.38 0.38 <0.1 <0.1 0 0 0.620.50 to <0.75 BBB- to BB+ 0.58 0.69 <0.1 <0.1 1 0 0.850.75 to <2.50 BB+ to BB- 1.75 1.60 <0.1 <0.1 3 0 4.072.50 to <10.00 BB- to B- 3.87 5.27 <0.1 <0.1 1 0 8.6810.00 to <100.00 B- to CCC- 14.44 18.89 <0.1 <0.1 0 0 7.38100.00 (Default) CCC- to D 100.00 100.00 <0.1 <0.1 0 0 0.00Sub-total N/M 2.11 5.84 0.2 0.2 5 0 1.82
Specialized lending0.00 to <0.15 AAA to BBB+ 0.00 0.00 0 0 0 0 0.000.15 to <0.25 BBB+ to BBB 0.00 0.00 0 0 0 0 0.000.25 to <0.50 BBB to BBB- 0.00 0.00 0 0 0 0 0.000.50 to <0.75 BBB- to BB+ 0.00 0.00 0 0 0 0 0.000.75 to <2.50 BB+ to BB- 0.00 0.00 0 0 0 0 0.002.50 to <10.00 BB- to B- 0.00 0.00 0 0 0 0 0.0010.00 to <100.00 B- to CCC- 0.00 0.00 0 0 0 0 0.00100.00 (Default) CCC- to D 0.00 0.00 0 0 0 0 0.00Sub-total N/M 0.00 0.00 0 0 0 0 0.00
Other0.00 to <0.15 AAA to BBB+ 0.09 0.10 0.3 0.4 0 0 0.730.15 to <0.25 BBB+ to BBB 0.18 0.21 1.8 2.2 2 0 0.250.25 to <0.50 BBB to BBB- 0.32 0.38 2.1 2.4 0 0 0.150.50 to <0.75 BBB- to BB+ 0.56 0.69 1.4 1.5 0 0 0.150.75 to <2.50 BB+ to BB- 0.95 1.36 0.5 0.6 3 0 0.902.50 to <10.00 BB- to B- 5.47 6.22 <0.1 <0.1 1 0 1.6810.00 to <100.00 B- to CCC- 19.03 18.95 0.1 0.1 1 0 0.87100.00 (Default) CCC- to D 100.00 100.00 0.1 0.1 0 0 0.00Sub-total N/M 1.70 2.30 6.4 7.2 7 0 0.42
Comparison of expected loss estimates with actual losses
In addition to the above, the comparison of regulatory expected loss (“EL”) estimates with actual losses recorded also providessome insight into the predictive power of our parameter estimations and, therefore, EL calculations.
The EL used in this comparison is the forecast credit loss from counterparty defaults of our exposures over a one year periodand is computed as the product of PD, LGD and EAD for performing exposures as of December 31 of the preceding year. Theactual loss measure is defined by us as new provisions on newly impaired exposures recorded in our financial statementsthrough profit and loss during the respective reported years.
While we believe that this approach provides some insight, the comparison has limitations as the two measures are not directlycomparable. In particular, the parameter LGD underlying the EL calculation represents the loss expectation until finalization ofthe workout period while the actual loss as defined above represents the accounting information recorded for one particularfinancial year. Furthermore, EL is a measure of expected credit losses for a snapshot of our credit exposure at a certain bal-ance sheet date while the actual loss is recorded for a fluctuating credit portfolio over the course of a financial year, i.e., includ-ing losses in relation to new loans entered into during the year.
According to the methodology described above, the following table provides a comparison of EL estimates for loans, commit-ments and contingent liabilities as of year-end 2016 through 2012, with actual losses recorded for the financial years 2017through 2013, by regulatory exposure class for advanced IRBA exposures.

83
Deutsche Bank Credit risk exposure and credit risk mitigation in the internal-rating-based approachPillar 3 Report 2017 Quantitative information on the use of the IRB approach
Comparison of expected loss estimates for loans, commitments and contingent liabilities with actual losses recorded by regulatoryexposure class for advanced IRBA exposures
Dec 31,2016 2017
Dec 31,2015 2016
Dec 31, 2014 2015
Dec 31,2013 2014
Dec 31, 2012 2013
in € m. Expected
lossActual
loss Expected
loss1Actual
loss Expected
lossActual
loss Expected
lossActual
loss Expected
lossActual
lossCentral governmentsand central banks 3 4 2 3 3 0 3 0 3 18Institutions 16 0 12 0 12 0 13 4 10 1Corporates 512 198 369 697 300 334 355 229 351 717Retail exposuressecuredby real estate property 285 98 305 177 306 207 324 212 284 223Qualifying revolvingretailexposures 14 15 13 4 17 4 21 8 23 7Other retail exposures 405 349 339 704 334 354 378 355 404 370Total expected lossand actual loss in theadvanced IRBA 1,236 665 1,041 1,584 971 900 1,095 808 1,075 1,336
Actual loss in 2017 was lower than expected, driven by Corporates as well as Retail exposures, mainly reflecting the strongreduction in actual loss compared to prior year in the respective exposure classes, as further discussed below.
The actual loss in 2016 exceeded the expected loss by € 543 million or 52 % mainly driven by exposures in Corporates as wellas in Other Retail, where we faced higher than expected increases in actual loss, as discussed below.
Actual loss in 2015 was lower than expected, mainly driven by Retail exposures secured by real estate property.
Actual loss in 2014 was below expectations mainly driven by a significant outperformance in corporate exposures as well as inRetail exposures secured by real estate property.
The actual loss in 2013 exceeded the expected loss by € 261 million or 24 %. This was primarily due to higher than expectedlevel of provisions in our corporate portfolio driven by a large single client credit event in a usually low risk portfolio of GTB aswell as one large charge within NCOU. Additionally, actual loss for central governments was higher than expected driven byone single client. Better than expected performance in all retail exposure classes as well as in institutions partly offset the over-all excess of actual compared to expected loss.
The decrease in expected loss as of December 31, 2014 in comparison to December 31, 2013 is mainly driven by lower vol-umes and to less extent by partially lower LGD parameters.
The following table provides a year-to-year comparison of the actual loss by regulatory exposure class.
Year-to-year comparison of the actual loss by IRBA exposure classin € m. 2017 2016 2015 2014 2013Central governments and central banks 4 3 0 0 18Institutions 0 0 0 4 1Corporates 198 697 334 229 717Retail exposures secured by real estate property 98 177 207 212 223Qualifying revolving retail exposures 15 4 4 8 7Other retail exposures 349 704 354 355 370Total actual loss by IRBA in the advanced IRBA 665 1,584 900 808 1,336
The strong reduction in actual loss in fiscal year 2017 was driven by both, CIB and PCB. The decline in CIB resulted from loweractual losses amount others against shipping companies, while the reduction in PCB was mainly caused by our retail portfoliosin Italy and Spain.
In 2016 the actual loss increased by € 684 million or 76 % driven by our corporate and other retail portfolios. The increase incorporates was caused by higher actual losses for shipping- and metals & mining companies recorded in CIB, while the in-crease in other retail was caused by higher charges for our retail portfolios in Italy and Spain among others related to the sale ofnon-performing loans.

84
Deutsche Bank Credit risk exposure and credit risk mitigation in the internal-rating-based approachPillar 3 Report 2017 Quantitative information on the use of the IRB approach
Actual loss increased by € 92 million or 11 % in 2015 compared to prior year driven by our shipping and leveraged financeportfolios recorded in CIB.
Actual loss materially declined in 2014 compared to prior year due to the low level of new impairments across all businesses.
Article 452 (j) CRR - IRB exposure by country where Deutsche Bank operates
Advanced IRBA
The table below shows our Advanced IRBA exposure for credit risk distributed based on the corresponding exposure classesfor each relevant geographical location. As geographical location we show countries where the Group maintains a branch orsubsidiary. Exposure which does not meet these criteria is shown in “Other”, which also comprises exposure to internationalorganizations. Exposures are assigned to the specific geographical location based on the country of domicile of the respectivecounterparty. The EAD net is presented in conjunction with exposures-weighted average LGD and PD in percentage. It ex-cludes the following exposure classes: securitization positions in the regulatory banking book, specific equity positions and non-credit obligation assets.
EAD net, average LGD and average PD of Advanced IRBA credit exposures by geographical locationDec 31, 2017
in € m.(unless stated otherwise)
Centralgovern-
ments and central
banks Institutions Corporates
Retail secured by real estate
SME
Retail secured by real estate non-SME
Retail qualifying revolving
RetailotherSME
Retailother
non-SME TotalAustralia
EAD net 782 353 1,633 2 7 1 0 2 2,778Average LGD in % 35.78 45.83 28.13 29.89 17.24 22.48 N/M 25.84 32.50Average PD in % 0.02 0.05 16.63 0.39 3.76 0.45 N/M 3.95 9.80
AustriaEAD net 118 105 689 7 44 8 3 9 983Average LGD in % 50.00 16.13 33.66 8.59 12.88 12.35 42.62 25.25 32.43Average PD in % 0.00 0.11 2.44 0.61 2.12 0.74 0.65 5.34 1.88
BelgiumEAD net 632 938 1,397 1 33 4 2 8 3,015Average LGD in % 50.53 47.89 28.37 10.90 16.78 12.45 42.53 30.06 38.95Average PD in % 0.00 0.04 11.47 1.47 3.50 0.83 0.59 3.88 5.38
BrazilEAD net 223 396 530 0 7 1 1 11 1,168Average LGD in % 50.00 30.18 41.74 N/M 14.43 25.12 42.04 7.48 38.90Average PD in % 0.64 1.16 5.38 N/M 2.35 0.75 0.61 1.09 2.98
CanadaEAD net 35 1,028 1,150 0 5 1 2 10 2,229Average LGD in % 41.07 35.29 34.21 N/M 13.50 23.17 42.68 10.37 34.66Average PD in % 0.02 0.09 5.85 N/M 2.26 0.95 0.46 11.44 3.11
ChinaEAD net 1,921 3,005 3,688 0 20 2 3 5 8,643Average LGD in % 50.90 39.89 39.99 N/M 14.36 23.35 46.51 36.24 42.32Average PD in % 0.00 0.16 1.01 N/M 1.21 0.62 0.54 2.98 0.50
Czech RepublicEAD net 687 194 113 0 4 1 2 3 1,005Average LGD in % 50.00 44.60 45.89 N/M 18.18 12.93 42.69 50.05 48.30Average PD in % 0.00 0.08 0.43 N/M 0.72 1.64 0.51 22.02 0.13
FranceEAD net 815 921 4,845 3 65 10 6 80 6,745Average LGD in % 50.76 31.71 37.75 7.17 14.35 14.82 42.89 16.34 37.97Average PD in % 0.00 0.21 0.90 1.82 4.90 1.29 0.63 6.11 0.80
GermanyEAD net 5,818 2,624 38,107 9,131 133,460 12,341 2,618 18,751 222,849Average LGD in % 82.85 23.40 35.81 10.33 13.27 11.29 31.63 41.29 21.54Average PD in % 1.16 1.01 3.59 2.07 2.10 0.92 2.02 6.22 2.60
GreeceEAD net 0 4 893 0 4 1 0 3 905Average LGD in % N/M 20.87 11.20 N/M 15.93 22.57 25.72 21.15 11.31Average PD in % N/M 31.00 34.25 N/M 1.15 2.59 0.24 2.86 33.93
Hong KongEAD net 304 317 5,179 0 10 1 0 1 5,811Average LGD in % 30.00 40.95 33.50 3.66 27.12 27.77 31.90 21.86 33.71Average PD in % 0.02 0.06 1.04 0.39 1.02 0.27 0.39 0.43 0.93

85
Deutsche Bank Credit risk exposure and credit risk mitigation in the internal-rating-based approachPillar 3 Report 2017 Quantitative information on the use of the IRB approach
Dec 31, 2017
in € m.(unless stated otherwise)
Centralgovern-
ments and central
banks Institutions Corporates
Retail secured by real estate
SME
Retail secured by real estate non-SME
Retail qualifying revolving
RetailotherSME
Retailother
non-SME TotalHungary
EAD net 197 2 84 0 3 1 0 3 290Average LGD in % 50.00 0.84 47.62 N/M 20.92 14.82 31.90 45.28 48.43Average PD in % 0.14 0.39 0.18 N/M 1.31 4.71 0.23 13.74 0.31
IndiaEAD net 1,977 1,833 5,472 0 2 1 0 13 9,299Average LGD in % 49.37 31.66 41.09 N/M 18.04 31.17 1.27 38.83 40.98Average PD in % 0.40 0.51 5.14 N/M 0.44 1.80 0.63 1.97 3.21
IndonesiaEAD net 718 0 1,303 0 0 0 0 1 2,023Average LGD in % 56.86 N/M 41.12 N/M 15.22 25.70 N/M 48.68 46.70Average PD in % 0.44 N/M 2.79 N/M 0.87 2.47 N/M 1.63 1.95
IrelandEAD net 0 154 4,188 0 26 0 0 2 4,369Average LGD in % N/M 27.72 15.60 N/M 17.41 24.44 32.93 13.86 16.03Average PD in % N/M 42.38 21.72 N/M 8.06 1.82 2.16 3.86 22.36
IsraelEAD net 0 0 214 3 13 1 0 0 231Average LGD in % N/M N/M 38.71 42.00 27.38 24.31 31.90 17.80 38.05Average PD in % N/M N/M 1.15 0.23 8.56 1.12 0.23 3.60 1.56
Italy (incl. San Marino)EAD net 732 192 6,418 107 7,987 51 1,201 6,062 22,750Average LGD in % 50.06 28.90 40.52 26.62 12.14 66.65 62.12 57.84 36.52Average PD in % 0.09 5.95 9.56 18.62 4.57 4.86 7.38 12.16 8.08
JapanEAD net 5,728 251 1,018 0 8 1 0 0 7,006Average LGD in % 50.00 38.62 26.24 N/M 18.54 22.01 42.69 35.16 46.10Average PD in % 0.00 0.29 1.35 N/M 0.58 0.22 0.81 2.27 0.21
JerseyEAD net 0 0 1,096 0 0 0 0 0 1,096Average LGD in % N/M N/M 18.63 N/M N/M N/M N/M 23.62 18.63Average PD in % N/M N/M 6.79 N/M N/M N/M N/M 57.12 6.79
LuxembourgEAD net 467 700 6,243 15 25 1 0 2 7,453Average LGD in % 50.00 49.37 18.04 17.80 13.66 16.16 48.51 36.29 22.97Average PD in % 0.00 0.04 3.83 0.84 3.39 0.20 0.34 3.49 3.22
MalaysiaEAD net 656 0 712 0 1 0 0 1 1,370Average LGD in % 50.00 N/M 44.92 N/M 19.15 23.15 N/M 47.12 47.33Average PD in % 0.07 N/M 0.35 N/M 0.55 0.25 N/M 1.15 0.22
MaltaEAD net 4 13 139 0 1 0 0 0 157Average LGD in % 50.00 33.89 5.32 N/M 26.14 25.30 N/M 70.82 8.94Average PD in % 0.05 0.33 4.25 N/M 2.32 1.59 N/M 45.28 3.84
MauritiusEAD net 0 0 274 0 1 0 0 0 274Average LGD in % N/M N/M 44.53 N/M 17.42 29.86 N/M 47.26 44.47Average PD in % N/M N/M 18.02 N/M 2.57 2.04 N/M 1.20 17.98
MexicoEAD net 151 43 509 0 4 1 0 8 716Average LGD in % 50.00 25.29 43.26 N/M 14.54 27.34 42.73 19.34 43.18Average PD in % 0.09 0.28 0.73 N/M 1.95 0.64 3.64 1.15 0.58
NetherlandsEAD net 90 563 10,358 3 88 4 6 38 11,151Average LGD in % 49.94 36.05 23.43 9.01 14.96 17.24 40.96 7.72 24.16Average PD in % 0.00 0.15 6.36 1.24 2.50 1.40 3.96 1.51 5.94
New ZealandEAD net 0 8 87 0 2 0 0 0 97Average LGD in % N/M 45.00 43.81 N/M 10.48 23.29 31.90 23.36 43.22Average PD in % N/M 0.04 0.92 N/M 0.37 0.14 98.21 0.50 0.85
PakistanEAD net 43 0 104 0 1 0 0 1 149Average LGD in % 50.00 N/M 39.11 N/M 12.70 32.86 N/M 46.77 42.19Average PD in % 7.95 N/M 2.68 N/M 0.45 3.32 N/M 3.26 4.20
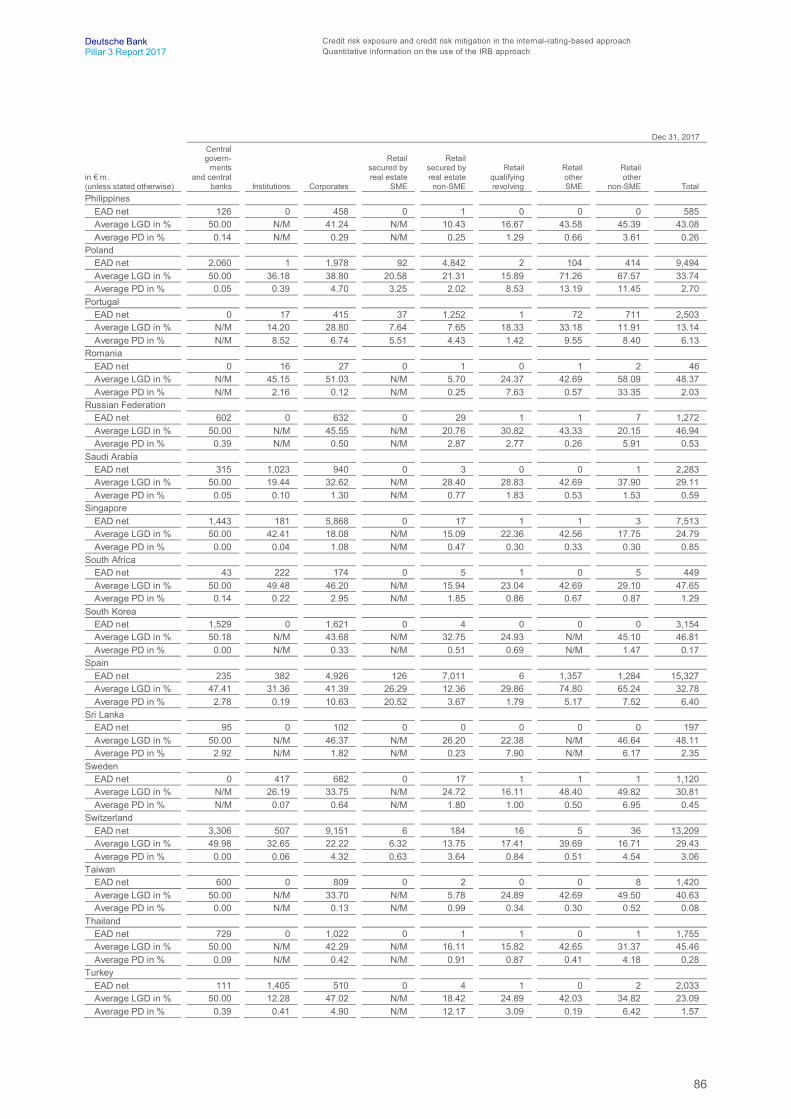
86
Deutsche Bank Credit risk exposure and credit risk mitigation in the internal-rating-based approachPillar 3 Report 2017 Quantitative information on the use of the IRB approach
Dec 31, 2017
in € m.(unless stated otherwise)
Centralgovern-
ments and central
banks Institutions Corporates
Retail secured by real estate
SME
Retail secured by real estate non-SME
Retail qualifying revolving
RetailotherSME
Retailother
non-SME TotalPhilippines
EAD net 126 0 458 0 1 0 0 0 585Average LGD in % 50.00 N/M 41.24 N/M 10.43 16.67 43.58 45.39 43.08Average PD in % 0.14 N/M 0.29 N/M 0.25 1.29 0.66 3.61 0.26
PolandEAD net 2,060 1 1,978 92 4,842 2 104 414 9,494Average LGD in % 50.00 36.18 38.80 20.58 21.31 15.89 71.26 67.57 33.74Average PD in % 0.05 0.39 4.70 3.25 2.02 8.53 13.19 11.45 2.70
PortugalEAD net 0 17 415 37 1,252 1 72 711 2,503Average LGD in % N/M 14.20 28.80 7.64 7.65 18.33 33.18 11.91 13.14Average PD in % N/M 8.52 6.74 5.51 4.43 1.42 9.55 8.40 6.13
RomaniaEAD net 0 16 27 0 1 0 1 2 46Average LGD in % N/M 45.15 51.03 N/M 5.70 24.37 42.69 58.09 48.37Average PD in % N/M 2.16 0.12 N/M 0.25 7.63 0.57 33.35 2.03
Russian FederationEAD net 602 0 632 0 29 1 1 7 1,272Average LGD in % 50.00 N/M 45.55 N/M 20.76 30.82 43.33 20.15 46.94Average PD in % 0.39 N/M 0.50 N/M 2.87 2.77 0.26 5.91 0.53
Saudi ArabiaEAD net 315 1,023 940 0 3 0 0 1 2,283Average LGD in % 50.00 19.44 32.62 N/M 28.40 28.83 42.69 37.90 29.11Average PD in % 0.05 0.10 1.30 N/M 0.77 1.83 0.53 1.53 0.59
SingaporeEAD net 1,443 181 5,868 0 17 1 1 3 7,513Average LGD in % 50.00 42.41 18.08 N/M 15.09 22.36 42.56 17.75 24.79Average PD in % 0.00 0.04 1.08 N/M 0.47 0.30 0.33 0.30 0.85
South AfricaEAD net 43 222 174 0 5 1 0 5 449Average LGD in % 50.00 49.48 46.20 N/M 15.94 23.04 42.69 29.10 47.65Average PD in % 0.14 0.22 2.95 N/M 1.85 0.86 0.67 0.87 1.29
South KoreaEAD net 1,529 0 1,621 0 4 0 0 0 3,154Average LGD in % 50.18 N/M 43.68 N/M 32.75 24.93 N/M 45.10 46.81Average PD in % 0.00 N/M 0.33 N/M 0.51 0.69 N/M 1.47 0.17
SpainEAD net 235 382 4,926 126 7,011 6 1,357 1,284 15,327Average LGD in % 47.41 31.36 41.39 26.29 12.36 29.86 74.80 65.24 32.78Average PD in % 2.78 0.19 10.63 20.52 3.67 1.79 5.17 7.52 6.40
Sri LankaEAD net 95 0 102 0 0 0 0 0 197Average LGD in % 50.00 N/M 46.37 N/M 26.20 22.38 N/M 46.64 48.11Average PD in % 2.92 N/M 1.82 N/M 0.23 7.90 N/M 6.17 2.35
SwedenEAD net 0 417 682 0 17 1 1 1 1,120Average LGD in % N/M 26.19 33.75 N/M 24.72 16.11 48.40 49.82 30.81Average PD in % N/M 0.07 0.64 N/M 1.80 1.00 0.50 6.95 0.45
SwitzerlandEAD net 3,306 507 9,151 6 184 16 5 36 13,209Average LGD in % 49.98 32.65 22.22 6.32 13.75 17.41 39.69 16.71 29.43Average PD in % 0.00 0.06 4.32 0.63 3.64 0.84 0.51 4.54 3.06
TaiwanEAD net 600 0 809 0 2 0 0 8 1,420Average LGD in % 50.00 N/M 33.70 N/M 5.78 24.89 42.69 49.50 40.63Average PD in % 0.00 N/M 0.13 N/M 0.99 0.34 0.30 0.52 0.08
ThailandEAD net 729 0 1,022 0 1 1 0 1 1,755Average LGD in % 50.00 N/M 42.29 N/M 16.11 15.82 42.65 31.37 45.46Average PD in % 0.09 N/M 0.42 N/M 0.91 0.87 0.41 4.18 0.28
TurkeyEAD net 111 1,405 510 0 4 1 0 2 2,033Average LGD in % 50.00 12.28 47.02 N/M 18.42 24.89 42.03 34.82 23.09Average PD in % 0.39 0.41 4.90 N/M 12.17 3.09 0.19 6.42 1.57
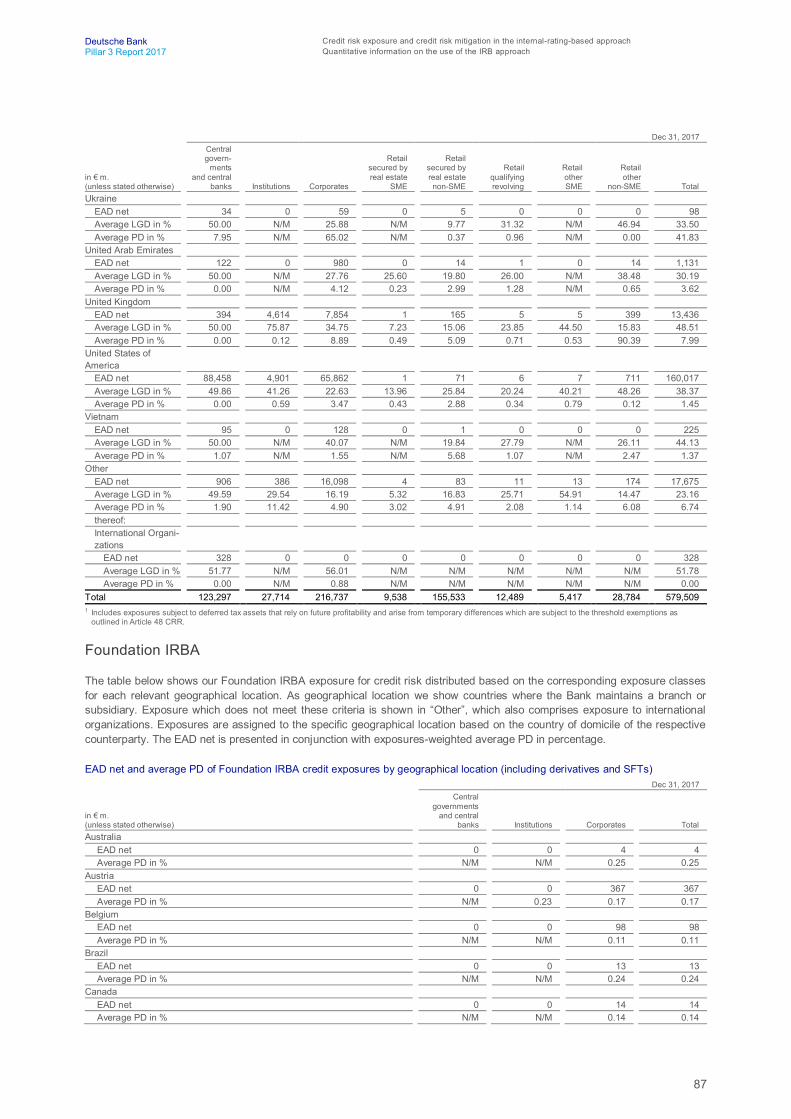
87
Deutsche Bank Credit risk exposure and credit risk mitigation in the internal-rating-based approachPillar 3 Report 2017 Quantitative information on the use of the IRB approach
Dec 31, 2017
in € m.(unless stated otherwise)
Centralgovern-
ments and central
banks Institutions Corporates
Retail secured by real estate
SME
Retail secured by real estate non-SME
Retail qualifying revolving
RetailotherSME
Retailother
non-SME TotalUkraine
EAD net 34 0 59 0 5 0 0 0 98Average LGD in % 50.00 N/M 25.88 N/M 9.77 31.32 N/M 46.94 33.50Average PD in % 7.95 N/M 65.02 N/M 0.37 0.96 N/M 0.00 41.83
United Arab EmiratesEAD net 122 0 980 0 14 1 0 14 1,131Average LGD in % 50.00 N/M 27.76 25.60 19.80 26.00 N/M 38.48 30.19Average PD in % 0.00 N/M 4.12 0.23 2.99 1.28 N/M 0.65 3.62
United KingdomEAD net 394 4,614 7,854 1 165 5 5 399 13,436Average LGD in % 50.00 75.87 34.75 7.23 15.06 23.85 44.50 15.83 48.51Average PD in % 0.00 0.12 8.89 0.49 5.09 0.71 0.53 90.39 7.99
United States ofAmerica
EAD net 88,458 4,901 65,862 1 71 6 7 711 160,017Average LGD in % 49.86 41.26 22.63 13.96 25.84 20.24 40.21 48.26 38.37Average PD in % 0.00 0.59 3.47 0.43 2.88 0.34 0.79 0.12 1.45
VietnamEAD net 95 0 128 0 1 0 0 0 225Average LGD in % 50.00 N/M 40.07 N/M 19.84 27.79 N/M 26.11 44.13Average PD in % 1.07 N/M 1.55 N/M 5.68 1.07 N/M 2.47 1.37
OtherEAD net 906 386 16,098 4 83 11 13 174 17,675Average LGD in % 49.59 29.54 16.19 5.32 16.83 25.71 54.91 14.47 23.16Average PD in % 1.90 11.42 4.90 3.02 4.91 2.08 1.14 6.08 6.74thereof:International Organi-zations
EAD net 328 0 0 0 0 0 0 0 328Average LGD in % 51.77 N/M 56.01 N/M N/M N/M N/M N/M 51.78Average PD in % 0.00 N/M 0.88 N/M N/M N/M N/M N/M 0.00
Total 123,297 27,714 216,737 9,538 155,533 12,489 5,417 28,784 579,5091 Includes exposures subject to deferred tax assets that rely on future profitability and arise from temporary differences which are subject to the threshold exemptions as
outlined in Article 48 CRR.
Foundation IRBA
The table below shows our Foundation IRBA exposure for credit risk distributed based on the corresponding exposure classesfor each relevant geographical location. As geographical location we show countries where the Bank maintains a branch orsubsidiary. Exposure which does not meet these criteria is shown in “Other”, which also comprises exposure to internationalorganizations. Exposures are assigned to the specific geographical location based on the country of domicile of the respectivecounterparty. The EAD net is presented in conjunction with exposures-weighted average PD in percentage.
EAD net and average PD of Foundation IRBA credit exposures by geographical location (including derivatives and SFTs)Dec 31, 2017
in € m.(unless stated otherwise)
Central governments
and centralbanks Institutions Corporates Total
Australia EAD net 0 0 4 4 Average PD in % N/M N/M 0.25 0.25
Austria EAD net 0 0 367 367 Average PD in % N/M 0.23 0.17 0.17
Belgium EAD net 0 0 98 98 Average PD in % N/M N/M 0.11 0.11
Brazil EAD net 0 0 13 13 Average PD in % N/M N/M 0.24 0.24
Canada EAD net 0 0 14 14 Average PD in % N/M N/M 0.14 0.14

88
Deutsche Bank Credit risk exposure and credit risk mitigation in the internal-rating-based approachPillar 3 Report 2017 Quantitative information on the use of the IRB approach
Dec 31, 2017
in € m.(unless stated otherwise)
Central governments
and centralbanks Institutions Corporates Total
China EAD net 0 0 12 12 Average PD in % N/M N/M 0.19 0.19
Czech Republic EAD net 0 0 36 36 Average PD in % N/M N/M 0.19 0.19
France EAD net 0 0 225 225 Average PD in % N/M N/M 0.20 0.20
Germany EAD net 0 1 5,878 5,879 Average PD in % N/M 0.20 1.05 1.05
Greece EAD net 0 0 0 0 Average PD in % N/M N/M N/M N/M
Hong Kong EAD net 0 0 4 4 Average PD in % N/M N/M 0.15 0.15
Hungary EAD net 0 0 46 46 Average PD in % N/M N/M 0.14 0.14
India EAD net 0 0 21 21 Average PD in % N/M N/M 5.14 5.14
IndonesiaEAD net 0 0 1 1Average PD in % N/M N/M 0.42 0.42
IrelandEAD net 0 0 16 16Average PD in % N/M N/M 0.53 0.53
IsraelEAD net 0 0 2 2Average PD in % N/M N/M 0.14 0.14
ItalyEAD net 0 0 186 186Average PD in % N/M N/M 0.24 0.24
JapanEAD net 0 0 8 8Average PD in % N/M N/M 0.39 0.39
JerseyEAD net 0 0 0 0Average PD in % N/M N/M N/M N/M
LuxembourgEAD net 0 0 46 46Average PD in % N/M N/M 0.20 0.20
MalaysiaEAD net 0 0 5 5Average PD in % N/M N/M 0.24 0.24
MaltaEAD net 0 0 0 0Average PD in % N/M N/M 0.10 0.10
MauritiusEAD net 0 0 0 0Average PD in % N/M N/M N/M N/M
MexicoEAD net 0 0 5 5Average PD in % N/M N/M 0.14 0.14
NetherlandsEAD net 0 0 174 174Average PD in % N/M N/M 0.27 0.27
New ZealandEAD net 0 0 2 2Average PD in % N/M N/M 0.21 0.21
PakistanEAD net 0 0 0 0Average PD in % N/M N/M N/M N/M

89
Deutsche Bank Credit risk exposure and credit risk mitigation in the internal-rating-based approachPillar 3 Report 2017 Quantitative information on the use of the IRB approach
Dec 31, 2017
in € m.(unless stated otherwise)
Central governments
and centralbanks Institutions Corporates Total
PhilippinesEAD net 0 0 0 0Average PD in % N/M N/M 0.03 0.03
PolandEAD net 0 0 55 55Average PD in % N/M N/M 0.15 0.15
PortugalEAD net 0 0 17 17Average PD in % N/M N/M 0.17 0.17
RomaniaEAD net 0 0 11 11Average PD in % N/M N/M 0.20 0.20
Russian FederationEAD net 0 0 8 8Average PD in % N/M N/M 2.68 2.68
Saudi ArabiaEAD net 0 0 0 0Average PD in % N/M N/M 0.12 0.12
SingaporeEAD net 0 0 4 4Average PD in % N/M N/M 0.18 0.18
South Africa EAD net 0 0 4 4 Average PD in % N/M N/M 0.16 0.16
South Korea EAD net 0 0 5 5 Average PD in % N/M N/M 0.31 0.31
Spain EAD net 0 0 115 115 Average PD in % N/M N/M 0.19 0.19
Sri-Lanka EAD net 0 0 0 0 Average PD in % N/M N/M N/M N/M
Sweden EAD net 0 0 28 28 Average PD in % N/M N/M 0.14 0.14
Switzerland EAD net 0 0 159 159 Average PD in % N/M N/M 0.50 0.50
Taiwan EAD net 0 0 5 5 Average PD in % N/M N/M 0.17 0.17
Thailand EAD net 0 0 3 3 Average PD in % N/M N/M 0.16 0.16
Turkey EAD net 0 0 10 10 Average PD in % N/M N/M 0.26 0.26
Ukraine EAD net 0 0 3 3 Average PD in % N/M N/M 5.88 5.88
United Arab Emirates EAD net 0 0 3 3 Average PD in % N/M N/M 0.27 0.27
United Kingdom EAD net 0 0 253 253 Average PD in % N/M N/M 0.52 0.52
United Statesof America
EAD net 0 0 104 104 Average PD in % N/M N/M 0.42 0.42
Vietnam EAD net 0 0 0 0 Average PD in % N/M N/M 0.36 0.36

90
Deutsche Bank Credit risk exposure and credit risk mitigation in the internal-rating-based approachPillar 3 Report 2017 Quantitative information on the use of the IRB approach
Dec 31, 2017
in € m.(unless stated otherwise)
Central governments
and centralbanks Institutions Corporates Total
OtherEAD 0 0 146 146Average PD in % N/M N/M 2.32 2.32thereof:InternationalOrganizations
EAD 0 0 0 0Average PD in % N/M N/M N/M N/M
Total 0 1 8,095 8,096

91
Deutsche Bank Counterparty credit risk (CCR)Pillar 3 Report 2017 Article 439 (a) CRR - Internal capital and credit limits for counterparty credit risk exposures
Counterparty credit risk (CCR)
Article 439 (a) CRR - Internal capital and credit limits for coun-terparty credit risk exposuresCounterparty credit exposure (“CCR”) arises from our business activities in derivatives and securities financing transactions(“SFT”), it is the risk that the counterparty to a transaction may default before completing the satisfactory settlement of thetransaction. We calculate the exposure to CCR using the internal model method (“IMM”) and the mark-to-market method(“CEM”) for derivatives and the financial collateral comprehensive method for SFT respectively.
As the replacement values of derivatives portfolios fluctuate with movements in market rates and with changes in the transac-tions in the portfolios, we estimate the potential future replacement costs of the portfolios over their lifetimes or, in case of col-lateralized portfolios, over appropriate unwind periods. We measure the potential future exposure against a limit set for thecounterparty for this type of transactions.
Limits for CCR exposures are established on the basis of the principles for assigning credit limits as described in the sections"Credit Risk Framework" and “Measuring Credit Risk” in the Annual Report 2017 on pages 58 to 60. For the purpose of limitsetting, CCR exposures are also considered in the context of the overall credit exposure to the obligor and the group of borrow-ers under the one obligor principle.
We supplement the potential future exposure analysis with stress tests to estimate the immediate impact of extreme marketevents on our exposures (such as event risk in our Emerging Markets portfolio).
For the majority of derivative counterparty exposures as well as for SFT, we (without Postbank) make use of the internal modelmethod in accordance with Article 283 et seq. CRR. In this respect SFT encompass repurchase transactions, securities orcommodities lending and borrowing as well as margin lending transactions (including prime brokerage). By applying this ap-proach, we build our EAD calculations on a Monte Carlo simulation of the transactions’ future market values. Within this simula-tion process, interest and foreign exchange rates, credit spreads, equity and commodity prices are modeled by stochasticprocesses and each derivative and securities financing transaction is revalued at each point of a pre-defined time grid. As aresult of this process, a distribution of future market values for each transaction at each time grid point is generated. From thesedistributions, by considering the appropriate netting and collateral agreements, we derive the exposure measures potentialfuture exposure (“PFE”), average expected exposure (“AEE”), expected positive exposure (“EPE”) and effective expected posi-tive exposure (“EEPE”).
The potential future exposure measure which we use is generally given by a time profile of simulated positive market values ofeach counterparty’s derivatives portfolio, for which netting and collateralization are considered. For limit monitoring we employthe 95th quantile of the resulting distribution of market values, internally referred to as potential future exposure. The averageexposure profiles generated by the same calculation process are used to derive the so-called average expected exposuremeasure, which we use to reflect expected future replacement costs within our credit risk economic capital, and the expectedpositive exposure measure driving our regulatory capital requirements. While AEE and EPE are generally calculated with re-spect to a time horizon of one year, the PFE is measured over the entire lifetime of a transaction or netting set for uncollateral-ized portfolios and over an appropriate unwind period for collateralized portfolios, respectively. We also employ theaforementioned calculation process to derive stressed exposure results for input into our credit portfolio stress testing.
The PFE profile of each counterparty is compared daily to the PFE limit profile set by the respective credit officer. PFE limits arean integral part of the overall counterparty credit exposure management in line with other limit types. Breaches of PFE limits atany one profile time point are highlighted for action within our credit risk management process. The EPE is an input to the Pillar1 capital requirement (“Risk Weighted Assets”), whereas AEE feeds as a loan equivalent into the Group’s credit portfolio model(Economic Capital, applied under Pillar 2) where it is combined with all other credit exposure to a counterparty.
For our derivative counterparty credit risk resulting from Postbank we also apply the Mark-to-Market method according to Arti-cle 274 CRR, i.e., we calculate the EAD as the sum of the net positive fair value of the derivative transactions and the regulato-ry add-ons. As the EAD derivative position resulting from Postbank is less than 2 % in relation to our overall counterparty creditrisk position from derivatives we consider Postbank’s derivative position to be immaterial.
For further details on our counterparty credit risk, please refer to the Annual Report 2017 under sections: “Netting and CollateralArrangements for Derivatives and Securities Financing Transactions”, pages 62 to 64, “Derivatives - Credit Valuation Adjust-ment”, and “Treatment of Default Situations under Derivatives”, on pages 118 to 119 as well as “Credit Exposure from Deriva-tives”, on page 108.

92
Deutsche Bank Counterparty credit risk (CCR)Pillar 3 Report 2017 Article 439 (f) CRR - Counterparty credit risk exposures by model approach
Article 439 (b) CRR - Collateral and credit reserves for coun-terparty credit riskFor details regarding collateral and reserve for counterparty credit risk please refer to our Annual Report 2017 section “Manag-ing and Mitigation of Credit Risk” in the sub-section “Netting and Collateral Arrangements for Derivatives and Securities Financ-ing Transactions”, on page 62, “Derivatives – Credit Valuation Adjustment”, page 118 as well as “Credit Exposure fromDerivatives”, on page 108.
Article 439 (c) CRR - Management of wrong-way risk expo-suresFor information regarding the management of wrong-way risk exposures please refer to the Annual Report 2017, section “Miti-gation of Credit Risk on Counterparty Level” on page 61, “Treatment of Default Situations under Derivatives” on page 118 and“Country Risk Management” on page 64.
Article 439 (d) CRR - Collateral in the event of a rating down-gradeFor details please refer to the Annual Report 2017, section “Managing and Mitigation of Credit Risk” in the sub-section “Nettingand Collateral Arrangements for Derivatives and Securities Financing Transactions” on page 62. Additionally please refer to ourAnnual Report 2017 to the section “Liquidity Risk Exposure”, sub-section “Stress Testing and Scenario Analysis” on page 130.
Article 439 (f) CRR - Counterparty credit risk exposures bymodel approachThe following table shows the methods used for calculating the regulatory requirements for CCR exposure including the mainparameters for each method. Exposures relevant for credit valuation adjustment (CVA) charges and exposures cleared througha central counterparty (CCP) are presented separately in table CCR2 and CCR 8, respectively. Deutsche Bank does not makeuse of the original exposure method or the standardized approach for derivatives nor the financial collateral simple method forSFTs. Under the mark to market method the positive market values before netting and collateral, the potential future exposureand the exposure at default for derivatives are shown, taking credit risk mitigation techniques into account. Under the internalmodel method (IMM) only the effective expected positive exposure (EEPE) and the exposure at default are presented. Giventhe nature of the internal model the simulation process of futures market values across all asset classes also includes the im-pact from regulatory netting and collateralization. For details regarding the calculation method under IMM including the estima-tion of the alpha factor please refer to introductory section on Counterparty Credit Risk.

93
Deutsche Bank Counterparty credit risk (CCR)Pillar 3 Report 2017 Article 439 (f) CRR - Counterparty credit risk exposures by model approach
EU CCR1 – Analysis of CCR exposure by approachDec 31, 2017
a b c d e f g
in € mn Notional
Replacement cost/ Current market value
Potential futurecredit exposure EEPE Multiplier EAD post CRM RWA
1 Mark to market – 2,809 11,328 – – 14,132 5,9512 Original exposure 0 – – – – 0 03 Standardized approach – 0 – – 0 0 04 IMM (for derivatives and SFTs) – – – 121,389 1.2 151,434 23,887
thereof: – – –5 Securities Financing Transac-
tions – – – 89,386 1.2 109,085 7,5316 Derivatives & Long Settlement
Transactions – – – 32,003 1.2 42,349 16,3567 from Contractual Cross Product
Netting – – – 0 0 0 08 Financial collateral simple method
(for SFTs) – – – – – 0 09 Financial collateral comprehen-
sive method (for SFTs) – – – – – 20,637 2,81810 VaR for SFTs – – – – – 0 011 Total – – – – – – 32,656
The table below provides a breakdown of the credit valuation adjustment (CVA) RWA into advanced and standardized ap-proaches. Furthermore the incremental contributions from the VaR and stressed VaR components are highlighted. We calcu-late the majority of the CVA based on our own internal model as approved by the BaFin, which is consistent with the advancedmethod, driving the reported CVA RWA of € 6.4 billion (99 %), whilst the standardized method covers only € 52 million (1 %) ofthe total CVA RWA. Stressed VaR component is the main driver of advanced CVA RWA, which results from the stressed periodvolatilities considered.
EU CCR2 – CVA capital chargeDec 31, 2017
a bin € m. Exposure value RWA
1 Total portfolios subject to the Advanced Method 26,064 6,3992 (i) VaR component (including the 3× multiplier) – 4233 (ii) Stressed VaR component (including the 3× multiplier) – 5,9754 All portfolios subject to the Standardized Method 173 52EU4 Based on Original Exposure Method 0 05 Total subject to the CVA capital charge 26,237 6,451
The table below presents an overview of our exposures and capital requirements to central counterparties arising from transac-tions, margins and contributions to default funds. As of December 31, 2017 we only report exposures to qualifying central coun-terparties (QCCP) as defined in Article 4 (88) CRR.
EU CCR8 – Exposures to CCPsDec 31, 2017
a bin € m. EAD post CRM RWA
1 Exposures to QCCPs (total) – 8282 Exposures for trades at QCCPs (excluding initial margin and default fund contributions) 11,481 230
thereof:3 (i) OTC derivatives 2,872 574 (ii) Exchange-traded derivatives 4,085 825 (iii) Securities financing transactions 4,524 906 (iv) Netting sets where cross-product netting has been approved 0 07 Segregated initial margin 5,261 –8 Non-segregated initial margin 8,932 1799 Pre-funded default fund contributions 1,169 41910 Alternative calculation of own funds requirements for exposures – 011 Exposures to non-QCCPs (total) – 012 Exposures for trades at non-QCCPs (excluding initial margin and default fund contributions) 0 0
thereof:13 (i) OTC derivatives 0 014 (ii) Exchange-traded derivatives 0 015 (iii) Securities financing transactions 0 016 (iv) Netting sets where cross-product netting has been approved 0 017 Segregated initial margin 0 –18 Non-segregated initial margin 0 019 Prefunded default fund contributions 0 020 Unfunded default fund contributions 0 0
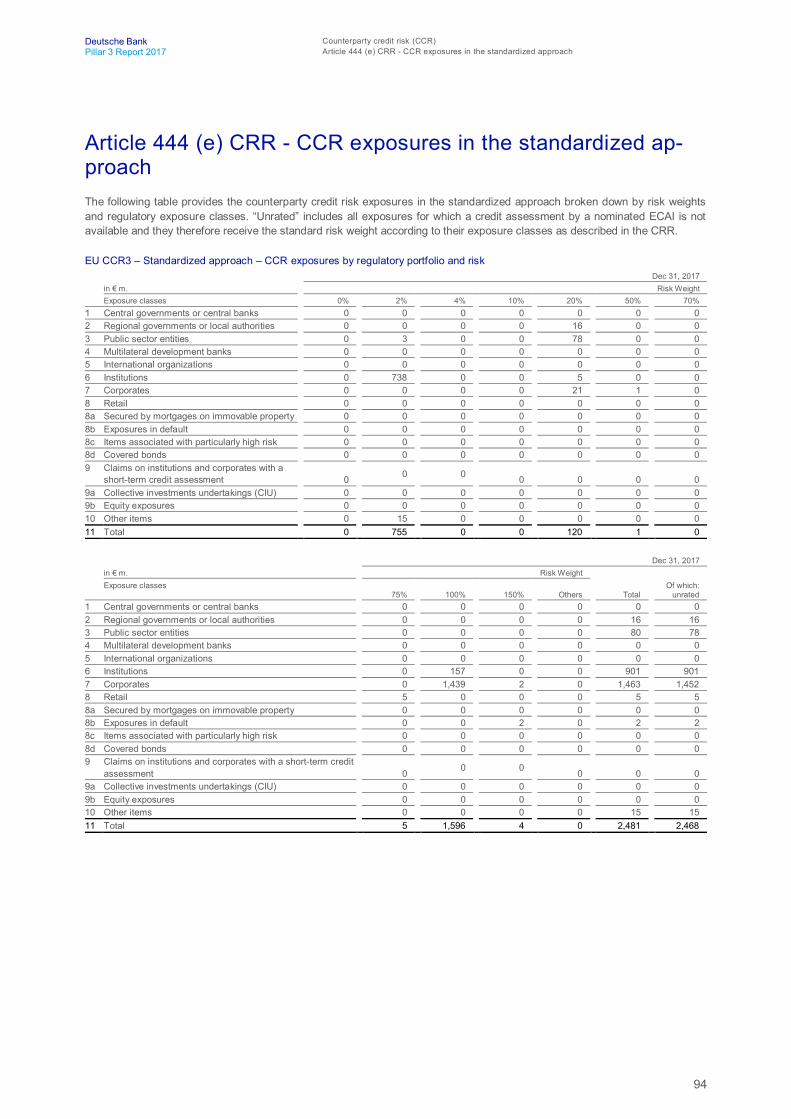
94
Deutsche Bank Counterparty credit risk (CCR)Pillar 3 Report 2017 Article 444 (e) CRR - CCR exposures in the standardized approach
Article 444 (e) CRR - CCR exposures in the standardized ap-proachThe following table provides the counterparty credit risk exposures in the standardized approach broken down by risk weightsand regulatory exposure classes. “Unrated” includes all exposures for which a credit assessment by a nominated ECAI is notavailable and they therefore receive the standard risk weight according to their exposure classes as described in the CRR.
EU CCR3 – Standardized approach – CCR exposures by regulatory portfolio and riskDec 31, 2017
in € m. Risk WeightExposure classes 0% 2% 4% 10% 20% 50% 70%
1 Central governments or central banks 0 0 0 0 0 0 02 Regional governments or local authorities 0 0 0 0 16 0 03 Public sector entities 0 3 0 0 78 0 04 Multilateral development banks 0 0 0 0 0 0 05 International organizations 0 0 0 0 0 0 06 Institutions 0 738 0 0 5 0 07 Corporates 0 0 0 0 21 1 08 Retail 0 0 0 0 0 0 08a Secured by mortgages on immovable property 0 0 0 0 0 0 08b Exposures in default 0 0 0 0 0 0 08c Items associated with particularly high risk 0 0 0 0 0 0 08d Covered bonds 0 0 0 0 0 0 09 Claims on institutions and corporates with a
short-term credit assessment 0 0 0 0 0 0 09a Collective investments undertakings (CIU) 0 0 0 0 0 0 09b Equity exposures 0 0 0 0 0 0 010 Other items 0 15 0 0 0 0 011 Total 0 755 0 0 120 1 0
Dec 31, 2017in € m. Risk WeightExposure classes
75% 100% 150% Others Total Of which:
unrated1 Central governments or central banks 0 0 0 0 0 02 Regional governments or local authorities 0 0 0 0 16 163 Public sector entities 0 0 0 0 80 784 Multilateral development banks 0 0 0 0 0 05 International organizations 0 0 0 0 0 06 Institutions 0 157 0 0 901 9017 Corporates 0 1,439 2 0 1,463 1,4528 Retail 5 0 0 0 5 58a Secured by mortgages on immovable property 0 0 0 0 0 08b Exposures in default 0 0 2 0 2 28c Items associated with particularly high risk 0 0 0 0 0 08d Covered bonds 0 0 0 0 0 09 Claims on institutions and corporates with a short-term credit
assessment 0 0 0 0 0 09a Collective investments undertakings (CIU) 0 0 0 0 0 09b Equity exposures 0 0 0 0 0 010 Other items 0 0 0 0 15 1511 Total 5 1,596 4 0 2,481 2,468

95
Deutsche Bank Counterparty credit risk (CCR)Pillar 3 Report 2017 Article 452 (e) CRR - CCR exposures within the advanced IRBA
Article 452 (e) CRR - CCR exposures within the advancedIRBAIn the following tables we show our advanced IRBA counterparty credit risk exposures, i.e. derivatives and securities financingtransactions, distributed on our internal rating scale for exposure classes central governments and central banks, institutions aswell as corporates and retail with their relevant subcategories. CVA charges or exposures cleared through a CCP are excluded.
We show the EAD after CRM and CCF (“EAD net”), where exposures covered by guarantees or credit derivatives are assignedto the protection seller. As a consequence the EAD net can be higher than the original balance sheet exposure.
The EAD net is presented in conjunction with exposure-weighted average PD, LGD, and maturity as well as the RWA and theaverage risk weight (RW). The effect of double default, as far as applicable to exposures outside of Postbank, is considered inthe average RW. It implies that for a guaranteed exposure a loss only occurs if the primary obligor and the guarantor fail tomeet their obligations at the same time. The tables provide the defaulted exposure separately, where we apply a LGD modelalready incorporating potential unexpected losses in the loss rate estimate as required by Article 181 (1)(h) CRR.
EU CCR4 – AIRB approach – CCR exposures by portfolio and PD scale – Central governments and central banksDec 31, 2017
in € m.(unless stated otherwise) a b c d e f g
PD scale EAD netAverage PD
(in %)
Number ofobligors
(in 1,000) Average LGD
(in %)Average maturity
(in years) RWA Average RW
(in %)0.00 to <0.15 8,484 0.02 0.1 44.18 0.9 475 5.600.15 to <0.25 68 0.23 <0.1 21.34 5.0 24 35.660.25 to <0.50 492 0.39 <0.1 49.66 0.7 239 48.510.50 to <0.75 9 0.64 <0.1 30.00 5.0 7 76.210.75 to <2.50 26 1.73 <0.1 30.23 4.9 25 99.482.50 to <10.00 884 3.57 <0.1 15.85 1.1 428 48.4310.00 to <100.00 0 0 0 0 0 0 0100.00 (Default) 20 100.00 <0.1 4.40 5.0 13 62.50Sub-total 9,983 0.56 0.1 41.66 1.0 1,211 12.14
EU CCR4 – AIRB approach – CCR exposures by portfolio and PD scale – InstitutionsDec 31, 2017
in € m.(unless stated otherwise) a b c d e f g
PD scale EAD netAverage PD
(in %)
Number ofobligors
(in 1,000) Average LGD
(in %)Average maturity
(in years) RWA Average RW
(in %)0.00 to <0.15 27,045 0.05 0.5 40.72 1.5 4,881 18.050.15 to <0.25 310 0.23 <0.1 44.82 3.7 234 75.740.25 to <0.50 1,300 0.39 0.1 42.76 0.9 794 61.080.50 to <0.75 1,175 0.64 <0.1 27.24 0.8 548 46.650.75 to <2.50 464 1.51 0.1 49.77 1.3 578 124.372.50 to <10.00 299 3.13 <0.1 6.51 1.3 72 23.9710.00 to <100.00 20 30.13 <0.1 49.71 3.8 65 319.58100.00 (Default) 85 100.00 <0.1 2.00 4.4 21 25.00Sub-total 30,698 0.44 0.7 40.04 1.5 7,193 23.43
EU CCR4 – AIRB approach – CCR exposures by portfolio and PD scale – Corporates, totalDec 31, 2017
in € m.(unless stated otherwise) a b c d e f g
PD scale EAD netAverage PD
(in %)
Number ofobligors
(in 1,000) Average LGD
(in %)Average maturity
(in years) RWA Average RW
(in %)0.00 to <0.15 115,996 0.04 11.6 32.57 0.6 8,626 7.440.15 to <0.25 3,453 0.23 0.7 30.89 2.5 1,268 36.730.25 to <0.50 4,702 0.39 0.9 37.28 1.2 2,175 46.250.50 to <0.75 4,984 0.64 0.9 35.60 1.2 3,021 60.610.75 to <2.50 4,076 1.30 1.3 50.27 2.4 4,563 111.962.50 to <10.00 2,324 4.71 0.6 28.18 2.6 2,380 102.4210.00 to <100.00 633 21.70 0.1 12.17 0.6 433 68.41100.00 (Default) 27 100.00 <0.1 11.90 2.3 25 92.60Sub-total 136,194 0.31 16.1 33.15 0.8 22,491 16.51

96
Deutsche Bank Counterparty credit risk (CCR)Pillar 3 Report 2017 Article 452 (e) CRR - CCR exposures within the advanced IRBA
EU CCR4 – AIRB approach – CCR exposures by portfolio and PD scale – Corporates, SMEDec 31, 2017
in € m.(unless stated otherwise) a b c d e f g
PD scale EAD netAverage PD
(in %)
Number ofobligors
(in 1,000) Average LGD
(in %)Average maturity
(in years) RWA Average RW
(in %)0.00 to <0.15 533 0.06 0.2 52.58 2.5 148 27.800.15 to <0.25 199 0.23 0.1 62.12 1.0 86 43.260.25 to <0.50 306 0.39 0.1 49.59 0.3 132 43.320.50 to <0.75 108 0.64 0.1 50.17 0.9 59 54.240.75 to <2.50 50 1.47 0.1 52.50 2.1 51 100.692.50 to <10.00 91 4.97 0.1 52.53 1.6 96 104.9510.00 to <100.00 1 23.85 <0.1 42.00 3.9 2 181.88100.00 (Default) 0 100.00 <0.1 97.91 2.0 0 0.41Sub-total 1,290 0.68 0.7 53.14 1.5 574 44.53
EU CCR4 – AIRB approach – CCR exposures by portfolio and PD scale – Corporates, specialized lendingDec 31, 2017
in € m.(unless stated otherwise) a b c d e f g
PD scale EAD netAverage PD
(in %)
Number ofobligors
(in 1,000) Average LGD
(in %)Average maturity
(in years) RWA Average RW
(in %)0.00 to <0.15 92 0.09 <0.1 56.08 3.4 38 40.700.15 to <0.25 38 0.23 <0.1 45.39 4.6 28 72.920.25 to <0.50 52 0.39 <0.1 41.19 4.5 42 80.340.50 to <0.75 23 0.64 <0.1 34.35 4.3 17 74.090.75 to <2.50 96 1.29 0.1 48.15 3.7 127 132.722.50 to <10.00 476 4.77 0.1 17.27 4.0 316 66.4710.00 to <100.00 9 19.16 <0.1 48.83 2.5 24 263.40100.00 (Default) 0 100.00 <0.1 5.00 1.1 0 62.50Sub-total 788 3.34 0.2 29.40 3.9 593 75.26
EU CCR4 – AIRB approach – CCR exposures by portfolio and PD scale – Corporates, otherDec 31, 2017
in € m.(unless stated otherwise) a b c d e f g
PD scale EAD netAverage PD
(in %)
Number ofobligors
(in 1,000) Average LGD
(in %)Average maturity
(in years) RWA Average RW
(in %)0.00 to <0.15 115,371 0.04 11.4 32.46 0.6 8,441 7.320.15 to <0.25 3,215 0.23 0.6 28.78 2.6 1,154 35.890.25 to <0.50 4,344 0.39 0.8 36.36 1.2 2,000 46.050.50 to <0.75 4,853 0.64 0.8 35.28 1.2 2,945 60.680.75 to <2.50 3,930 1.30 1.1 50.29 2.4 4,385 111.592.50 to <10.00 1,756 4.67 0.4 29.87 2.2 1,967 112.0410.00 to <100.00 623 21.73 <0.1 11.58 0.5 407 65.35100.00 (Default) 26 100.00 <0.1 10.31 2.3 25 94.45Sub-total 134,117 0.29 15.3 32.98 0.7 21,324 15.90
EU CCR4 – AIRB approach – CCR exposures by portfolio and PD scale – Retail, totalDec 31, 2017
in € m.(unless stated otherwise) a b c d e f g
PD scale EAD netAverage PD
(in %)
Number ofobligors
(in 1,000) Average LGD
(in %)Average maturity
(in years) RWA Average RW
(in %)0.00 to <0.15 16 0.06 0.2 55.75 1.7 2 10.650.15 to <0.25 3 0.23 <0.1 55.27 1.1 1 22.260.25 to <0.50 8 0.39 0.1 56.55 1.3 3 32.150.50 to <0.75 12 0.64 0.1 55.68 1.2 5 42.470.75 to <2.50 16 1.39 0.2 55.04 1.2 10 59.322.50 to <10.00 25 4.53 0.2 56.01 1.1 20 78.7610.00 to <100.00 3 17.05 <0.1 56.17 1.2 3 102.25100.00 (Default) 0 100.00 <0.1 5.00 5.0 0 62.50Sub-total 84 2.48 0.8 55.73 1.3 43 51.13
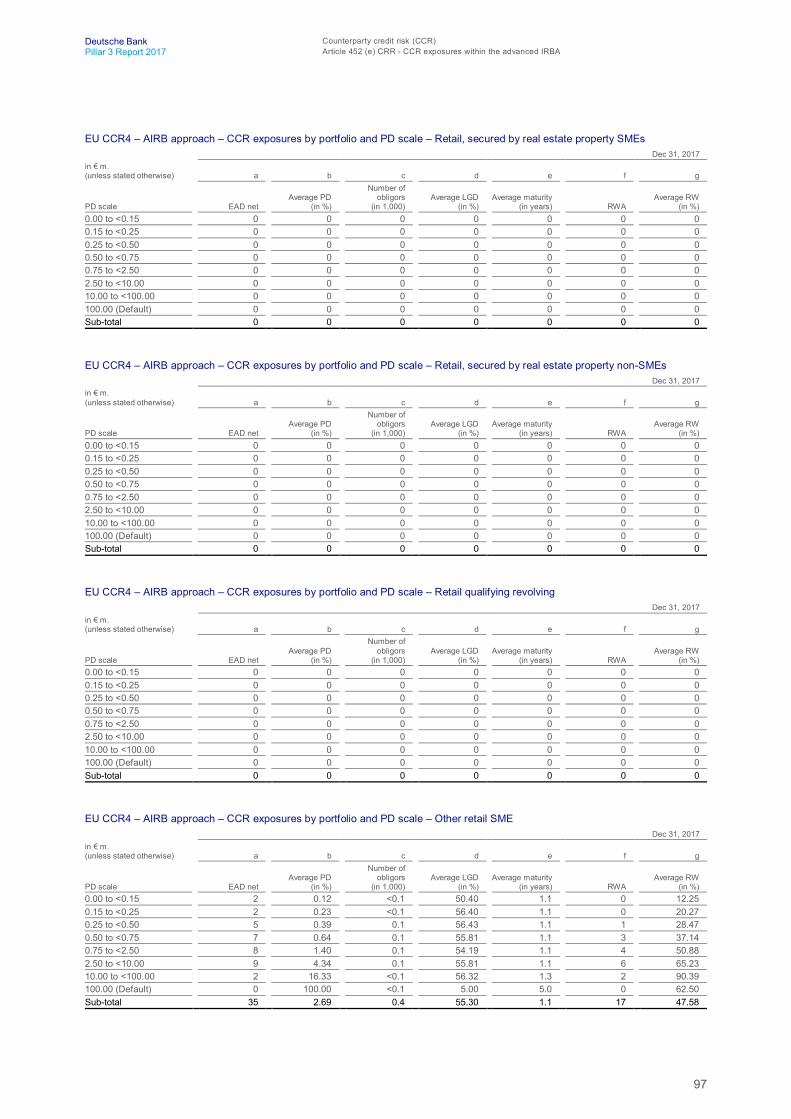
97
Deutsche Bank Counterparty credit risk (CCR)Pillar 3 Report 2017 Article 452 (e) CRR - CCR exposures within the advanced IRBA
EU CCR4 – AIRB approach – CCR exposures by portfolio and PD scale – Retail, secured by real estate property SMEsDec 31, 2017
in € m.(unless stated otherwise) a b c d e f g
PD scale EAD netAverage PD
(in %)
Number ofobligors
(in 1,000) Average LGD
(in %)Average maturity
(in years) RWA Average RW
(in %)0.00 to <0.15 0 0 0 0 0 0 00.15 to <0.25 0 0 0 0 0 0 00.25 to <0.50 0 0 0 0 0 0 00.50 to <0.75 0 0 0 0 0 0 00.75 to <2.50 0 0 0 0 0 0 02.50 to <10.00 0 0 0 0 0 0 010.00 to <100.00 0 0 0 0 0 0 0100.00 (Default) 0 0 0 0 0 0 0Sub-total 0 0 0 0 0 0 0
EU CCR4 – AIRB approach – CCR exposures by portfolio and PD scale – Retail, secured by real estate property non-SMEsDec 31, 2017
in € m.(unless stated otherwise) a b c d e f g
PD scale EAD netAverage PD
(in %)
Number ofobligors
(in 1,000) Average LGD
(in %)Average maturity
(in years) RWA Average RW
(in %)0.00 to <0.15 0 0 0 0 0 0 00.15 to <0.25 0 0 0 0 0 0 00.25 to <0.50 0 0 0 0 0 0 00.50 to <0.75 0 0 0 0 0 0 00.75 to <2.50 0 0 0 0 0 0 02.50 to <10.00 0 0 0 0 0 0 010.00 to <100.00 0 0 0 0 0 0 0100.00 (Default) 0 0 0 0 0 0 0Sub-total 0 0 0 0 0 0 0
EU CCR4 – AIRB approach – CCR exposures by portfolio and PD scale – Retail qualifying revolvingDec 31, 2017
in € m.(unless stated otherwise) a b c d e f g
PD scale EAD netAverage PD
(in %)
Number ofobligors
(in 1,000) Average LGD
(in %)Average maturity
(in years) RWA Average RW
(in %)0.00 to <0.15 0 0 0 0 0 0 00.15 to <0.25 0 0 0 0 0 0 00.25 to <0.50 0 0 0 0 0 0 00.50 to <0.75 0 0 0 0 0 0 00.75 to <2.50 0 0 0 0 0 0 02.50 to <10.00 0 0 0 0 0 0 010.00 to <100.00 0 0 0 0 0 0 0100.00 (Default) 0 0 0 0 0 0 0Sub-total 0 0 0 0 0 0 0
EU CCR4 – AIRB approach – CCR exposures by portfolio and PD scale – Other retail SMEDec 31, 2017
in € m.(unless stated otherwise) a b c d e f g
PD scale EAD netAverage PD
(in %)
Number ofobligors
(in 1,000) Average LGD
(in %)Average maturity
(in years) RWA Average RW
(in %)0.00 to <0.15 2 0.12 <0.1 50.40 1.1 0 12.250.15 to <0.25 2 0.23 <0.1 56.40 1.1 0 20.270.25 to <0.50 5 0.39 0.1 56.43 1.1 1 28.470.50 to <0.75 7 0.64 0.1 55.81 1.1 3 37.140.75 to <2.50 8 1.40 0.1 54.19 1.1 4 50.882.50 to <10.00 9 4.34 0.1 55.81 1.1 6 65.2310.00 to <100.00 2 16.33 <0.1 56.32 1.3 2 90.39100.00 (Default) 0 100.00 <0.1 5.00 5.0 0 62.50Sub-total 35 2.69 0.4 55.30 1.1 17 47.58
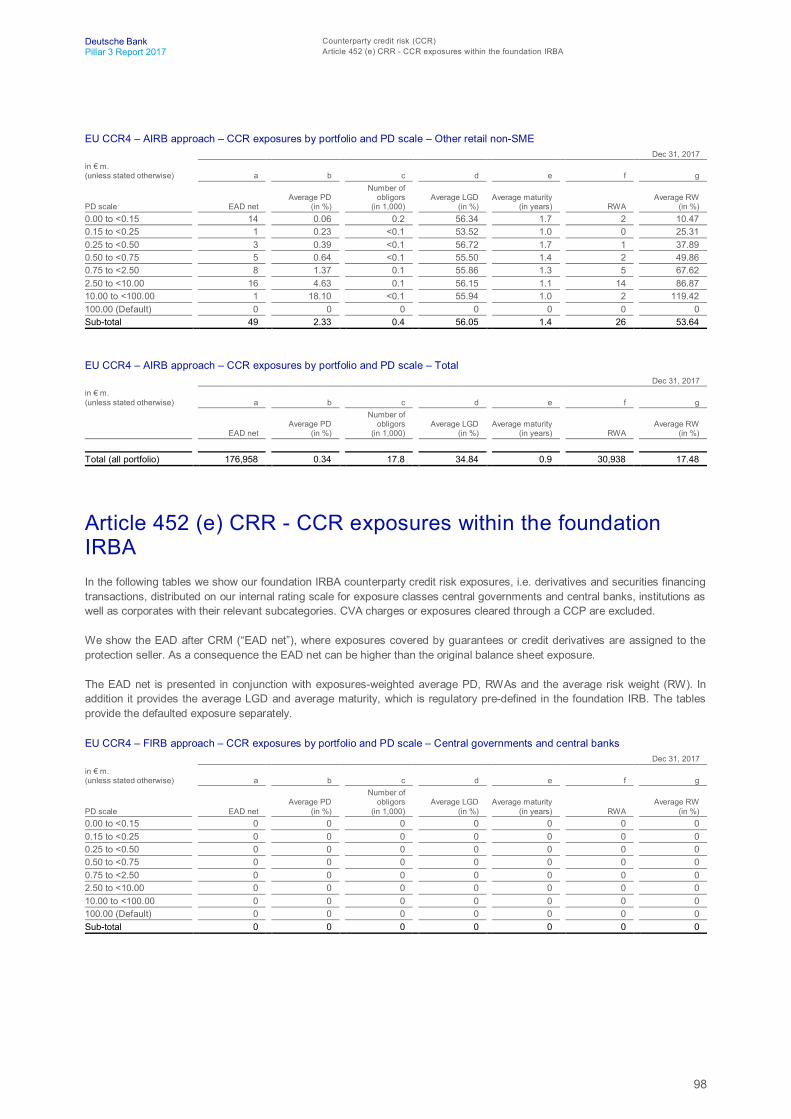
98
Deutsche Bank Counterparty credit risk (CCR)Pillar 3 Report 2017 Article 452 (e) CRR - CCR exposures within the foundation IRBA
EU CCR4 – AIRB approach – CCR exposures by portfolio and PD scale – Other retail non-SMEDec 31, 2017
in € m.(unless stated otherwise) a b c d e f g
PD scale EAD netAverage PD
(in %)
Number ofobligors
(in 1,000) Average LGD
(in %)Average maturity
(in years) RWA Average RW
(in %)0.00 to <0.15 14 0.06 0.2 56.34 1.7 2 10.470.15 to <0.25 1 0.23 <0.1 53.52 1.0 0 25.310.25 to <0.50 3 0.39 <0.1 56.72 1.7 1 37.890.50 to <0.75 5 0.64 <0.1 55.50 1.4 2 49.860.75 to <2.50 8 1.37 0.1 55.86 1.3 5 67.622.50 to <10.00 16 4.63 0.1 56.15 1.1 14 86.8710.00 to <100.00 1 18.10 <0.1 55.94 1.0 2 119.42100.00 (Default) 0 0 0 0 0 0 0Sub-total 49 2.33 0.4 56.05 1.4 26 53.64
EU CCR4 – AIRB approach – CCR exposures by portfolio and PD scale – TotalDec 31, 2017
in € m.(unless stated otherwise) a b c d e f g
EAD netAverage PD
(in %)
Number ofobligors
(in 1,000) Average LGD
(in %)Average maturity
(in years) RWA Average RW
(in %)
Total (all portfolio) 176,958 0.34 17.8 34.84 0.9 30,938 17.48
Article 452 (e) CRR - CCR exposures within the foundationIRBAIn the following tables we show our foundation IRBA counterparty credit risk exposures, i.e. derivatives and securities financingtransactions, distributed on our internal rating scale for exposure classes central governments and central banks, institutions aswell as corporates with their relevant subcategories. CVA charges or exposures cleared through a CCP are excluded.
We show the EAD after CRM (“EAD net”), where exposures covered by guarantees or credit derivatives are assigned to theprotection seller. As a consequence the EAD net can be higher than the original balance sheet exposure.
The EAD net is presented in conjunction with exposures-weighted average PD, RWAs and the average risk weight (RW). Inaddition it provides the average LGD and average maturity, which is regulatory pre-defined in the foundation IRB. The tablesprovide the defaulted exposure separately.
EU CCR4 – FIRB approach – CCR exposures by portfolio and PD scale – Central governments and central banksDec 31, 2017
in € m.(unless stated otherwise) a b c d e f g
PD scale EAD netAverage PD
(in %)
Number ofobligors
(in 1,000) Average LGD
(in %)Average maturity
(in years) RWA Average RW
(in %)0.00 to <0.15 0 0 0 0 0 0 00.15 to <0.25 0 0 0 0 0 0 00.25 to <0.50 0 0 0 0 0 0 00.50 to <0.75 0 0 0 0 0 0 00.75 to <2.50 0 0 0 0 0 0 02.50 to <10.00 0 0 0 0 0 0 010.00 to <100.00 0 0 0 0 0 0 0100.00 (Default) 0 0 0 0 0 0 0Sub-total 0 0 0 0 0 0 0

99
Deutsche Bank Counterparty credit risk (CCR)Pillar 3 Report 2017 Article 452 (e) CRR - CCR exposures within the foundation IRBA
EU CCR4 – FIRB approach – CCR exposures by portfolio and PD scale – InstitutionsDec 31, 2017
in € m.(unless stated otherwise) a b c d e f g
PD scale EAD netAverage PD
(in %)
Number ofobligors
(in 1,000) Average LGD
(in %)Average maturity
(in years) RWA Average RW
(in %)0.00 to <0.15 0 0 0 0 0 0 00.15 to <0.25 0 0 0 0 0 0 00.25 to <0.50 0 0 0 0 0 0 00.50 to <0.75 0 0 0 0 0 0 00.75 to <2.50 0 0 0 0 0 0 02.50 to <10.00 0 0 0 0 0 0 010.00 to <100.00 0 0 0 0 0 0 0100.00 (Default) 0 0 0 0 0 0 0Sub-total 0 0 0 0 0 0 0
EU CCR4 – FIRB approach – CCR exposures by portfolio and PD scale – Corporates, totalDec 31, 2017
in € m.(unless stated otherwise) a b c d e f g
PD scale EAD netAverage PD
(in %)
Number ofobligors
(in 1,000) Average LGD
(in %)Average maturity
(in years) RWA Average RW
(in %)0.00 to <0.15 2 0.09 <0.1 45.00 2.5 1 30.820.15 to <0.25 75 0.21 0.1 45.00 2.5 35 47.130.25 to <0.50 41 0.38 0.1 45.00 2.5 26 63.670.50 to <0.75 10 0.69 <0.1 45.00 2.5 8 82.490.75 to <2.50 2 1.53 <0.1 45.00 2.5 2 92.962.50 to <10.00 2 4.93 <0.1 45.00 2.5 2 143.8310.00 to <100.00 1 20.00 <0.1 45.00 2.5 2 252.53100.00 (Default) 0 100.00 <0.1 45.00 2.5 0 0Sub-total 133 0.66 0.3 45.00 2.5 76 57.56
EU CCR4 – FIRB approach – CCR exposures by portfolio and PD scale – Corporates, SMEDec 31, 2017
in € m.(unless stated otherwise) a b c d e f g
PD scale EAD netAverage PD
(in %)
Number ofobligors
(in 1,000) Average LGD
(in %)Average maturity
(in years) RWA Average RW
(in %)0.00 to <0.15 0 0 0 0 0 0 00.15 to <0.25 3 0.22 <0.1 45.00 2.5 1 33.870.25 to <0.50 3 0.38 <0.1 45.00 2.5 2 50.530.50 to <0.75 2 0.69 <0.1 45.00 2.5 1 70.800.75 to <2.50 1 1.67 <0.1 45.00 2.5 1 81.492.50 to <10.00 0 4.53 <0.1 45.00 2.5 0 99.7110.00 to <100.00 0 0 0 0 0 0 0100.00 (Default) 0 0 0 0 0 0 0Sub-total 10 0.69 0.1 45.00 2.5 5 53.67
EU CCR4 – FIRB approach – CCR exposures by portfolio and PD scale – Corporates, specialized lendingDec 31, 2017
in € m.(unless stated otherwise) a b c d e f g
PD scale EAD netAverage PD
(in %)
Number ofobligors
(in 1,000) Average LGD
(in %)Average maturity
(in years) RWA Average RW
(in %)0.00 to <0.15 0 0 0 0 0 0 00.15 to <0.25 0 0 0 0 0 0 00.25 to <0.50 0 0 0 0 0 0 00.50 to <0.75 0 0 0 0 0 0 00.75 to <2.50 0 0 0 0 0 0 02.50 to <10.00 0 0 0 0 0 0 010.00 to <100.00 0 0 0 0 0 0 0100.00 (Default) 0 0 0 0 0 0 0Sub-total 0 0 0 0 0 0 0

100
Deutsche Bank Counterparty credit risk (CCR)Pillar 3 Report 2017 Article 438 (d) CRR - Development of Counterparty Credit Risk RWA
EU CCR4 – FIRB approach – CCR exposures by portfolio and PD scale – Corporates, otherDec 31, 2017
in € m.(unless stated otherwise) a b c d e f g
PD scale EAD netAverage PD
(in %)
Number ofobligors
(in 1,000) Average LGD
(in %)Average maturity
(in years) RWA Average RW
(in %)0.00 to <0.15 2 0.09 <0.1 45.00 2.5 1 30.820.15 to <0.25 72 0.21 0.1 45.00 2.5 34 47.750.25 to <0.50 38 0.38 <0.1 45.00 2.5 24 64.850.50 to <0.75 8 0.69 <0.1 45.00 2.5 7 84.830.75 to <2.50 1 1.34 <0.1 45.00 2.5 1 107.992.50 to <10.00 1 5.06 <0.1 45.00 2.5 2 158.6610.00 to <100.00 1 20.00 <0.1 45.00 2.5 2 252.53100.00 (Default) 0 100.00 <0.1 45.00 2.5 0 0Sub-total 123 0.66 0.2 45.00 2.5 71 57.87
EU CCR4 – FIRB approach – CCR exposures by portfolio and PD scale – TotalDec 31, 2017
in € m.(unless stated otherwise) a b c d e f g
EAD netAverage PD
(in %)
Number ofobligors
(in 1,000) Average LGD
(in %)Average maturity
(in years) RWA Average RW
(in %)
Total (all portfolio) 133 0.66 0.3 45.00 2.5 76 57.56
Article 438 (d) CRR - Development of Counterparty Credit RiskRWAThe following tables provide an analysis of key drivers for RWA movements observed for counterparty credit risk exposurescalculated under the internal model method (IMM) in the fourth quarter of 2017.
EU CCR7 – RWA flow statement of counterparty credit risk exposures under the internal model method Three months ended Dec 31, 2017
a b
in € m. RWACapital
requirements1 Counterparty credit risk RWA under the IMM opening balance 20,988 1,6792 Book size 1,732 1393 Book quality 1,630 1304 Model updates (215) (17)5 Methodology and Policy 0 06 Acquisitions and Disposals 0 07 Foreign exchange movements (248) (20)8 Other 0 09 Counterparty credit risk RWA under the IMM closing balance 23,887 1,911
Organic changes in our portfolio size and composition are considered in the category “Book size”. The category “Book quality”mainly represents the effects from portfolio rating migrations, loss given default, model parameter recalibrations as well ascollateral coverage and netting activities. “Model updates” include model refinements and model roll out. RWA movementsresulting from externally, regulatory-driven changes, e.g. applying new regulations, are considered in the “Methodology andPolicy” section. “Acquisition and disposals” shows significant exposure movements which can be clearly assigned to new busi-nesses or disposal-related activities. Changes that cannot be attributed to the above categories are reflected in the category“Other”.
The increase in RWA for counterparty credit risk exposures under the IMM by 13.8 % or € 2.9 billion since September 2017 ispredominantly driven by growth in “Book size” and changes in “Book Quality”. The increase in “Book size” is predominantlydriven by business growth in securities financing products. The increase in “Book quality” is predominantly driven by the revisedtreatment of netting application of our security financing products which is partly offset by reductions from recalibrations of ourrisk parameters as well as process enhancements. Foreign exchange movements had minor impacts to the RWA movements.

101
Deutsche Bank Counterparty credit risk (CCR)Pillar 3 Report 2017 Article 439 (g-h) CRR - Credit derivatives exposures
Article 439 (e) CRR - CCR exposures after credit risk mitigationThe following tables present information on our counterparty credit risk (CCR) exposure and the impact of netting and collateralheld as well as the composition of collateral used in both derivatives transactions and securities financing transactions (SFT).
Table EU CCR5-A below provides the gross positive fair values before any credit risk mitigation, the impact of legally enforcea-ble master netting agreements as well as further reduction of our CCR exposure due to eligible collateral we have received.Given the nature of the internal model method (IMM) that we use for the measurement of the majority of our derivatives andSFT, the simulation process of future market values across all asset classes includes, if applicable, the impact from regulatorynetting and collateralization. Therefore the net credit exposure disclosed below differs from the regulatory exposure value atdefault (EaD).
EU CCR5-A – Impact of netting and collateral held on exposure valuesDec 31, 2017
a b c d e
in € m.
Gross positive fair value or net carrying amount Netting benefits
Netted current credit exposure Collateral held
Net creditexposure
1 Derivatives 490,611 402,084 88,590 81,312 7,2782 Securities Financing Transactions 589,621 479,088 110,533 7,534 102,9993 Cross-product netting 0 0 0 0 04 Total 1,080,232 881,172 199,123 88,846 110,277
Table EU CCR5-B discloses a breakdown of all types of collateral posted or received to support or reduce CCR exposuresrelated to derivatives and SFT. For SFT collateral refers to both legs of the transaction as collateral received and collateralposted.
EU CCR5-B – Composition of collateral for exposures to CCRDec 31, 2017
a b c d e fCollateral used in derivative transactions Collateral used in SFTs
Fair value of collateral received Fair value of posted collateral
in € m. Segregated Unsegregated Segregated Unsegregated
Fair value ofcollateralreceived
Fair value of posted collateral
Cash 0 106,092 0 59,511 186,088 229,726Bonds 0 32,039 4,250 19,035 177,739 173,498Equity securities 0 14,516 1,011 11 201,108 179,642Other collateral 0 5,413 0 4,108 10,263 6,754Total 0 158,060 5,261 82,665 575,198 589,621
For further details on derivative exposure please also refer to our Annual Report 2017 table “Maximum Exposure to Credit Risk”and chapter “Credit Exposure from Derivatives” on pages 96 and 109 .
Article 439 (g-h) CRR - Credit derivatives exposuresThe table below discloses the exposure of the credit derivative transactions split into the part held in the regulatory bankingbook, which is shown under the heading “credit derivative hedges” and the part held in the regulatory trading book, referred toas “other credit derivatives” as well as a split into product types.

102
Deutsche Bank Economic capital usage for credit riskPillar 3 Report 2017 Article 439 (i) CRR - Estimate of alpha factor
EU CCR6 – Credit derivatives exposuresDec 31, 2017
a b cCredit derivative hedges
in € m.Protection
boughtProtection
soldOther creditderivatives
NotionalsSingle-name credit default swaps 10,085 344 407,841Index credit default swaps 0 0 1,229,299Total return swaps 0 37 5,982Credit options 0 0 28,898
Total notionals 10,085 381 1,672,021Fair values (162) (67) 808
Positive fair value (asset) 109 38 28,365Negative fair value (liability) 272 105 27,558
Article 439 (i) CRR - Estimate of alpha factorUnder the internal model method (IMM) approach EAD is then finally calculated as the product of EPE and a multiplier ‘Alpha’(α). The scaling factor alpha is applied in order to correct for amongst others correlations between parties, concentration riskand to account for the level of volatility/correlation that might coincide with a downturn. Deutsche Bank received regulatoryapproval to use its own calibrated alpha factor, however, for our regulatory capital calculation the regulatory minimum level of1.2 has to be applied. For the small population of transactions for which a simulation cannot be computed or is subject to regu-latory restrictions (such as for those with risk factors not approved by BaFin or for specific wrong-way risk), the EAD used isderived from the Mark-to-Market method according to Article 274 CRR.
Economic capital usage for credit risk
The table below provides the economic capital usage for credit risk based on a quantile of 99.9 % broken down by businessareas.
Economic Capital Usage for Credit Risk per Business Area 2017 increase (decrease) from 2016
in € m. Dec 31, 2017 Dec 31, 2016 in € m. in %Corporate & Investment Bank 6,519 8,185 (1,666) (20)Private & Commercial Bank 3,596 4,308 (712) (17)Deutsche Asset Management 62 62 0 0Non-Core Operations Unit 0 108 (108) (100)Consolidation & Adjustments and Other 591 442 149 34Total 10,769 13,105 (2,336) (18)
The economic capital usage for credit risk decreased to € 13.1 billion as of December 31, 2017, € 2.34 billion or 18 % lowercompared to year-end 2016. The decrease was mainly driven by the change in the quantile from 99.98 % to 99.9 %.

103
Deutsche Bank Market riskPillar 3 Report 2017 Article 445 CRR - Exposure to market risk
Market risk
Article 445 CRR - Exposure to market riskMarket Risk Standardized Approach
As of December 31, 2017, the securitization positions, for which the specific interest rate risk is calculated using the market riskstandardized approach, generated capital requirements of € 379.5 million corresponding to risk weighted-assets of € 4.7 billion.As of December 31, 2016 these positions generated capital requirements of € 278.4 million corresponding to risk weighted-assets of € 3.5 billion.
For nth-to-default credit default swaps the capital requirement decreased to € 2.8 million corresponding to risk weighted-assetsof € 35 million compared with € 6.4 million and € 80 million as of December 31, 2016.
The capital requirement for collective investment undertakings under the market risk standardized approach was € 45 millioncorresponding to risk weighted-assets of € 556 million as of December 31, 2017, compared with € 39 million and € 487 millionas of December 31, 2016.
The capital requirement for longevity risk under the market risk standardized approach was € 32 million corresponding to risk-weighted assets of € 395 million as of December 31, 2017, compared with € 46 million and € 570 million as of Decem-ber 31, 2016.
EU MR1 – Market risk under the standardized approachDec 31, 2017
a b
in € m. RWACapital
requirements Outright products1 Interest rate risk (general and specific) 0 02 Equity risk (general and specific)1 537 433 Foreign exchange risk2 87 74 Commodity risk 0 04a Longevity risk 395 32 Options5 Simplified approach 0 06 Delta-plus method 0 07 Scenario approach 0 08 Securitization (specific risk)3 4,744 3809 Total 5,763 4621 Equity risk RWA of € 537 million is from collective investment undertakings2 Foreign Exchange risk RWA includes € 68 million from Postbank and € 19 million from collective investment undertakings3 Securitization RWA of € 4,744 million includes the nth to default component

104
Deutsche Bank Market riskPillar 3 Report 2017 Article 445 CRR - Exposure to market risk
Market Risk internal models approach (IMA)
The table below presents all internal model-related components relevant for the capital requirement calculation for market risk.
EU MR2-A – Market Risk under the internal models approach (IMA)Dec 31, 2017
a b
in € m. RWACapital
requirements1 VaR (higher of values a and b) 4,378 350a) Previous day's VaR (Article 365(1) (VaRt-1)) – 101
b) Average of the daily VaR (Article 365(1)) on each of the preceding sixty business days (VaRavg) x multiplica-tion factor ((mc) in accordance with Article 366) – 350
2 SVaR (higher of values a and b) 10,896 872a) Latest SVaR (Article 365(2) (sVaRt-1)) – 253
b) Average of the SVaR (Article 365(2) during the preceding sixty business days (sVaRavg) x multiplication factor(ms) (Article 366) – 872
3 Incremental risk charge -IRC (higher of values a and b) 9,871 790
a) Most recent IRC value (incremental default and migration risks calculated in accordance with Article 370 andArticle 371 of the CRR) – 631
b) Average of the IRC number over the preceding 12 weeks – 7904 Comprehensive Risk Measure – CRM (higher of values a, b and c) 56 5a) Most recent risk number for the correlation trading portfolio (article 377 of the CRR) – 4b) Average of the risk number for the correlation trading portfolio over the preceding 12-weeks – 5
c) 8 % of the own funds requirement in SA on most recent risk number for the correlation trading portfolio (Article338(4) of the CRR) – 1
5 Other 0 06 Total 25,203 2,016
The following table EU MR2-B provides an analysis of key drivers for movements observed for market risk RWA covered byinternal models (i.e. value-at-risk, stressed value-at-risk, incremental risk charge and comprehensive risk measure) in the fourthquarter of 2017.
EU MR2-B – RWA flow statements of market risk exposures under the IMADec 31, 2017
a b c d e f g
in € m. VaR SVaR IRCComprehensive risk measure Other Total RWAs
Total capital requirements
1 Market Risk RWA at previous quarterend1 5,678 13,833 10,431 86 0 30,028 2,402
1a Regulatory adjustment2 (4,242) (11,244) 0 (27) 0 (15,512) (1,241)1b RWAs at the previous quarter-end (end
of the day)3 1,437 2,589 10,431 59 0 14,515 1,1612 Movement in risk levels (55) 579 (2,545) (4) 0 (2,025) (162)3 Model updates/changes 0 0 0 0 0 0 04 Methodology and policy 0 0 0 0 0 0 05 Acquisitions and disposals 0 0 0 0 0 0 06 Foreign exchange movements 0 0 0 0 0 0 06a Market data changes and recalibrations (113) 0 0 0 0 (113) (9)7 Other 0 0 0 0 0 0 08a RWAs at the end of the reporting period
(end of the day)3 1,268 3,168 7,886 55 0 12,378 9908b Regulatory adjustment2 3,112 7,728 1,984 1 0 12,825 1,0268 Market Risk RWAs at end of reporting
period1 4,380 10,896 9,871 56 0 25,203 2,0161 Represents RWA at previous and current reporting period quarter end.2 Indicates the difference between RWA and RWA (end of day) at the beginning and end of period.3 For a given component (e.g. VaR) it refers to the RWA that would be computed if the previous or current quarter end snapshot figure of the component determines the quarter
end RWA, as opposed to a 60-day average for regulatory.
105
Deutsche Bank Market riskPillar 3 Report 2017 Article 455 CRR - Use of Internal Market Risk Models
The market risk RWA movements due to position changes are represented in line “Movement in risk levels”. Changes to ourmarket risk RWA internal models, such as methodology enhancements or risk scope extensions, are included in the category of“Model updates/changes”. In the “Methodology and policy” category we reflect regulatory driven changes to our market riskRWA models and calculations. Significant new businesses and disposals would be assigned to the line item “Acquisition anddisposals”. The impacts of “Foreign exchange movements” are only calculated for comprehensive risk measure. For the othermeasures this is captured in “Movements in risk levels”. Changes in market data levels, volatilities, correlations, liquidity andratings are included under the “Market data changes and recalibrations” category.
As of December 31, 2017 the RWA for market risk was € 31.0 billion. The IMA (Internal Models Approach) components of thistotaled € 25.2 billion.
Economic Capital Usage for our Trading Market Risk
The economic capital usage for trading market risk decreased to € 3.8 billion as of December 31, 2017, compared to€ 4.2 billion at year-end 2016. The decrease was primarily driven by the change of the quantile, which led to a reduction intrading market risk by € 600 million, partially offset by increase in traded default risk component exposure.
Postbank’s contribution to the economic capital usage for our trading market risk was minimal.
Economic Capital Usage for our Nontrading Market Risk Portfolios per BusinessArea
Economic Capital Usage of Nontrading Portfolios by Business Division 2017 increase (decrease) from 2016
in € m. Dec 31, 2017 Dec 31, 2016 in € m. in %Corporate & Investment Bank 828 1,035 (207) (20)Private & Commercial Bank 1,430 1,852 (422) (23)Deutsche Asset Management 309 2,005 (1,696) (85)Non-Core Operations Unit 0 148 (148) N/MConsolidation & Adjustments and Other 4,061 5,324 (1,263) (24)Total 6,628 10,364 (3,736) (36)
Nontrading market risk economic capital usage totaled € 6.6 billion as of December 31, 2017, which is € 3.7 billion, or 36 %,below our economic capital usage at year-end 2016. The quantile change led to a decrease in nontrading market risk EC as ofNovember 2017 by € 1.8 billion.
The decrease in economic capital usage in Deutsche Asset Management was largely driven by a considerable decrease in theGuaranteed Funds risk from the application of a new methodology. The decrease in economic capital usage in Consolidation &Adjustments and Other was mainly driven by lower structural foreign exchange risk exposure resulting from the new capitalrequirement “Going-Concern” and the quantile change from 99.98 % to 99.9 %. The decrease of economic capital usage forCorporate & Investment Bank and Private & Commercial Bank was mainly driven by the quantile change.
Article 455 CRR - Use of Internal Market Risk ModelsArticle 455 (a)(i) CRR - Characteristics of the market risk models
Market Risk Measurement
Market Risk Management aims to accurately measure all types of market risks by a comprehensive set of risk metrics reflectingeconomic and regulatory requirements.
In accordance with economic and regulatory requirements, we measure market and related risks using several key risk metrics:
Internally developed market risk models‒ Value-at-risk (“VaR”) and stressed value-at-risk (“SVaR”), including CVA VaR and SVaR‒ Incremental risk charge‒ Comprehensive risk measure
106
Deutsche Bank Market riskPillar 3 Report 2017 Article 455 CRR - Use of Internal Market Risk Models
Market Risk Standardized approaches‒ Market risk standardized approach (“MRSA”), applied to investment funds with no look through, MRSA-eligible securitiza-
tions and positions subject to longevity risk
Stress Testing Measures‒ Portfolio stress testing‒ Business-level stress testing‒ Event risk scenarios
Economic Capital Measures‒ Market Risk economic capital, including traded default risk
Other model derived and market observable metrics‒ Sensitivities‒ Market value/notional (concentration risk)‒ Loss given default
These measures are viewed as complementary to each other and in aggregate define the market risk framework, by which allbusinesses can be measured and monitored.
Internally developed market risk models
Value-at-Risk (VaR) at Deutsche Bank GroupVaR is a quantitative measure of the potential loss (in value) of Fair Value positions due to market movements that will not beexceeded in a defined period of time and with a defined confidence level.
We calculate VaR using a 99 % confidence level and a one day holding period. This means we estimate there isa 1 in 100 chance that a mark-to-market loss from our trading positions will be at least as large as the reported VaR. For regula-tory purposes, which include the calculation of our risk-weighted assets, the holding period is ten days.
We use one year of historical market data as input to calculate VaR. The calculation employs a Monte Carlo Simulation tech-nique, and we assume that changes in risk factors follow a well-defined distribution, e.g. normal or non-normal(t, skew-t, Skew-Normal). To determine our aggregated VaR, we use observed correlations between the risk factors during thisone year period.
Our VaR model is designed to take into account a comprehensive set of risk factors across all asset classes. Key risk factorsare swap/government curves, index and issuer-specific credit curves, funding spreads, single equity and index prices, foreignexchange rates, commodity prices as well as their implied volatilities. To help ensure completeness in the risk coverage, secondorder risk factors, e.g. CDS index vs. constituent basis, money market basis, implied dividends, option-adjusted spreads andprecious metals lease rates are considered in the VaR calculation.
For each business unit a separate VaR is calculated for each risk type, e.g. interest rate risk, credit spread risk, equity risk,foreign exchange risk and commodity risk. For each risk type this is achieved by deriving the sensitivities to the relevant risktype and then simulating changes in the associated risk drivers. “Diversification effect” reflects the fact that the total VaR on agiven day will be lower than the sum of the VaR relating to the individual risk types. Simply adding the VaR figures of the indi-vidual risk types to arrive at an aggregate VaR would imply the assumption that the losses in all risk types occur simultaneously.
The model incorporates both linear and, especially for derivatives, nonlinear effects through a combination of sensitivity-basedand revaluation approaches.
The VaR measure enables us to apply a consistent measure across all of our fair value businesses and products. It allows acomparison of risk in different businesses, and also provides a means of aggregating and netting positions within a portfolio toreflect correlations and offsets between different asset classes. Furthermore, it facilitates comparisons of our market risk bothover time and against our daily trading results.

107
Deutsche Bank Market riskPillar 3 Report 2017 Article 455 CRR - Use of Internal Market Risk Models
When using VaR estimates a number of considerations should be taken into account. These include:
‒ The use of historical market data may not be a good indicator of potential future events, particularly those that are extreme innature. This “backward-looking” limitation can cause VaR to understate future potential losses (as in 2008), but can alsocause it to be overstated.
‒ Assumptions concerning the distribution of changes in risk factors, and the correlation between different risk factors, may nothold true, particularly during market events that are extreme in nature. The one day holding period does not fully capture themarket risk arising during periods of illiquidity, when positions cannot be closed out or hedged within one day.
‒ VaR does not indicate the potential loss beyond the 99th quantile.‒ Intra-day risk is not captured.‒ There may be risks in the trading or banking book that are partially or not captured by the VaR model.
We are committed to the ongoing development of our internal risk models, and we allocate substantial resources to reviewing,validating and improving them. Additionally, we have further developed and improved our process of systematically capturingand evaluating risks currently not captured in our value-at-risk model. An assessment is made to determine the level of materi-ality of these risks and material risks are prioritized for inclusion in our internal model. Risks not in value-at-risk are monitoredand assessed on a regular basis through our Risk Not In VaR (RNIV) framework.
Stressed Value-at-Risk (SvaR)We calculate a stressed value-at-risk measure using a 99 % confidence level and a holding period of one day. For regulatorypurposes, the holding period is ten days.
Our stressed value-at-risk calculation utilizes the same systems, trade information and processes as those used for the calcula-tion of value-at-risk. The only difference is that historical market data from a period of significant financial stress (i.e., character-ized by high volatilities) is used as an input for the Monte Carlo Simulation. The time window selection process for the stressedvalue-at-risk calculation is based on the identification of a time window characterized by high levels of volatility in the top value-at-risk contributors. The identified window is then further validated by comparing the SVaR results to neighboring windows usingthe complete DB Group portfolio.
CVA Value-at-Risk/ Stressed Value-at-RiskThe advanced approach CVA risk capital charge is determined by applying the VaR model. First, the exposure profiles aredetermined based on the internal model method (IMM) or the Mark-to-Market method. The next step consists in determining thesynthetic CVA position based on the exposure profile and other risk parameters such as credit spreads. Based on this infor-mation the credit spread sensitivity is then calculated. Eligible CVA hedges are also incorporated and the CVA risk capitalcharge is determined based on the internal market risk models VaR and Stressed VaR using a 99 % confidence level and a 10-day holding period.
Article 455 (a)(ii) CRR - Incremental risk charge and comprehensive risk measure
Incremental Risk Charge
The incremental risk charge is based on our own internal model and is intended to complement the value-at-risk modelingframework. It represents an estimate of the default and rating migration risks of unsecuritized credit products over a one-yearcapital horizon at a 99.9 % confidence level, employing a constant position approach. We use a Monte Carlo Simulation forcalculating incremental risk charge as the 99.9 % quantile of the portfolio loss distribution and for allocating contributory incre-mental risk charge to individual positions. The model captures the default and migration risk in an accurate and consistentquantitative approach for all portfolios. Important parameters for the incremental risk charge calculation are exposures, recoveryrates, maturity, ratings with corresponding default and migration probabilities and parameters specifying issuer correlations.
We calculate the incremental risk charge on a weekly basis. For regulatory reporting purposes, the charge is determined as thehigher of the most recent 12 week average of incremental risk charge and the most recent incremental risk charge.
The contributory incremental risk charge of individual positions, which is calculated by expected shortfall allocation, provides thebasis for identifying risk concentrations in the portfolio.
Default and rating migration probabilities are defined by rating migration matrices which are calibrated on historical externalrating data. Taking into account the trade-off between granularity of matrices and their stability we apply a global corporatematrix and a sovereign matrix comprising the seven main rating non-default states and one default state. Accordingly, issue orissuer ratings from the rating agencies Moody’s, S&P and Fitch are assigned to each position.

108
Deutsche Bank Market riskPillar 3 Report 2017 Article 455 CRR - Use of Internal Market Risk Models
To quantify a loss due to rating migration, a revaluation of a position is performed under the new rating. The probability of jointrating downgrades and defaults is determined by the migration and rating correlations of the incremental risk charge model.These correlations are specified through systematic factors that represent geographical regions and industries and are calibrat-ed on historical rating migration and equity time series. The simulation is based on the assumption of a constant position ap-proach where differences in maturities of long and short positions are taken into account.
The revaluation approach was further improved in 2016 by employing refined valuation methodologies for a large set of prod-ucts, in particular covering trades with non-linear features.
As the default state is absorbing, defaulted positions do not generate any further losses from rating migrations. The price risk ofdefaulted debt is modeled by stochastic recoveries.
Direct validation of the incremental risk charge through back-testing methods is not possible. The charge is subject to validationprinciples such as the evaluation of conceptual soundness, ongoing monitoring and process and outcome analysis. Modelvalidation relies more on indirect methods including stress tests and sensitivity analyses. Relevant parameters are included inthe annual validation cycle established in the current regulatory framework. The incremental risk charge is part of the regulargroup-wide stress test using the stress testing functionality within our credit engine. Stressed incremental risk charge figures arereported on group level and submitted to the Stress Test Council (STC) and the Enterprise Risk Committee (ERC).
Comprehensive Risk Measure
The comprehensive risk measure for the corporate correlation trading portfolio is based on our own internal model. We calcu-late the comprehensive risk measure based on a Monte Carlo Simulation technique to a 99.9 % confidence level and a capitalhorizon of one year. Our model is applied to the eligible correlation trading positions where typical products include collateral-ized debt obligations, nth-to-default credit default swaps, and commonly traded index- and single-name credit default swaps.Re-securitizations or products which reference retail claims or real estate exposures are not eligible. Furthermore, trades sub-ject to the comprehensive risk measure have to meet minimum liquidity standards to be eligible. The model incorporates con-centrations of the portfolio and nonlinear effects via a full revaluation approach.
Comprehensive risk measure is designed to capture defaults as well as the following risk drivers: interest rates, credit spreads,recovery rates, foreign exchange rates and base correlations, index-to-constituent and base correlation basis risks.
Comprehensive risk measure is calculated on a weekly basis. Initially, the eligible trade population within the correlation tradingportfolio is identified. Secondly, the risk drivers of the P&L are simulated over a one year time horizon. The trade population isthen re-valued under the various Monte Carlo Simulation scenarios and the 99.9 % quantile of the loss distribution is extracted.
The market and position data are collected from front office systems and are subject to quality control. The comprehensive riskmeasure figures are closely monitored and play a significant role in the management of the correlation trading portfolio. We usethree years of historical market data to estimate the risk drivers to the comprehensive risk measure.
In our comprehensive risk measure model the liquidity horizon is set to 12 months, which equals the capital horizon.
In order to maintain the quality of our comprehensive risk measure model we continually monitor the potential weaknesses ofthis model. Backtesting of the trade valuations and the propagation of single risk factors are carried out on a monthly basis anda quarterly recalibration of parameters is performed. In addition, a series of stress tests have been defined on the correlationtrading portfolio where the shock sizes link into historical distressed market conditions.
An independent model validation team reviews all quantitative aspects of our CRM model on a regular basis. The review covers,but is not limited to, model assumptions, calibration approaches for risk parameters, and model performance.
For regulatory reporting purposes, the comprehensive risk measure represents the higher of the internal model spot value atthe reporting dates, their preceding 12-week average calculation, and the floor, where the floor is equal to 8 % of the equivalentcapital charge under the standardized approach securitization framework. Since the first quarter of 2016, the CRM RWA calcu-lations include two regulatory-prescribed add-ons which cater for: (a) stressing the implied correlation within nth-to-default bas-kets and (b) any stress test loss in excess of the internal model spot value.
We have received approval for the use in the calculation of regulatory capital, of all internally-developed modelsdescribed above; VaR, SvaR (including CVA VaR and SvaR), Incremental Risk Charge and Comprehensive Risk Measure.

109
Deutsche Bank Market riskPillar 3 Report 2017 Article 455 CRR - Use of Internal Market Risk Models
Market Risk Standardized ApproachMarket Risk Management monitors exposures and addresses risk issues and concentrations for certain exposures under thespecific Market Risk Standardized Approach (“MRSA”). We use the MRSA to determine the regulatory capital charge for thespecific market risk of trading book securitizations (see section “Article 449 (h) CRR - RWA calculation approaches for securiti-zation positions” and therein section “Calculation of Regulatory Capital Requirements for Trading Book Securitizations” on page125).
We also use the MRSA to determine the regulatory capital charge for longevity risk as set out in CRR/CRD 4 regulations. Lon-gevity risk is the risk of adverse changes in life expectancies resulting in a loss in value on longevity linked policies and transac-tions. For risk management purposes, stress testing and economic capital allocations are also used to monitor and managelongevity risk.
Furthermore, certain types of investment funds require a capital charge under the MRSA. For risk management purposes, thesepositions are also included in our internal reporting framework.
Article 455 (a)(iii) CRR - Market risk stress testing
Stress testing is a key risk management technique, which evaluates the potential effects of extreme market events and extrememovements in individual risk factors. It is one of the core quantitative tools used to assess the market risk of Deutsche Bank’spositions and complements VaR and Economic Capital. Market Risk Management performs several types of stress testing tocapture the variety of risks: Portfolio Stress Testing, individual specific stress tests, Event Risk Scenarios, and also contributesto Group-wide stress testing. These are also set at varying severities ranging from extreme for capital adequacy assessment tomild for earning stability purposes.
Portfolio Stress Testing measures the profit and loss impact of potential market events based on a broad range of historical orhypothetical macroeconomic scenarios considered to be severe and plausible. It is used to manage systemic tail risk and in-forms on earnings stability and capital resilience. Ad hoc stress tests are regularly designed to manage risk in advance of andduring key events or to focus on a particular area of interest.
For individual specific stress tests, market risk managers identify relevant risk factors and develop stress scenarios relatingeither to macro-economic or business-specific developments. Specific stress tests capture idiosyncratic and basis risks.
Event risk scenario measures the profit and loss impact of historically observable events or hypothetical situations on tradingpositions for specific emerging market countries and regions. The bank’s trading book exposure to an individual country isstressed under a single scenario, which replicates market movements across that country in times of significant market crisisand reduced liquidity.
In addition, Market Risk Management participates in the Group-wide stress test process, where macro-economic scenarios aredefined by ERM Risk Research and each risk department translates that same scenario to the relevant shocks required toapply to their portfolio. This includes credit, market and operational risks.
Tail risk or the potential for extreme loss events beyond reported value-at risk is captured via stress testing, stressed value-at-risk, economic capital, incremental risk charge and comprehensive risk measure.
Article 455 (a)(iv) CRR - Methodology for backtesting and model validation
Regulatory Backtesting of Trading Market Risk
We continually analyze potential weaknesses of our value-at-risk model using statistical techniques, such as backtesting, andalso rely on risk management experience.

110
Deutsche Bank Market riskPillar 3 Report 2017 Article 455 CRR - Use of Internal Market Risk Models
Backtesting is a procedure used to assess the predictive accuracy of the value-at-risk calculations involving the comparison ofhypothetical daily profits and losses under the buy-and-hold assumption (‘daily buy-and hold income’) to the daily value-at-risk.Under this assumption we estimate the P&L impact that would have resulted on a portfolio for a trading day valued with currentmarket prices and parameters assuming it had been left untouched for that day and compare it with the estimates from thevalue-at-risk model from the preceding day. Our calculation of hypothetical daily profits and losses (buy & hold income) ex-cludes gains and losses from intraday trading, fees and commissions, carry (including net interest margins), reserves and othermiscellaneous revenues. An outlier is a hypothetical buy-and-hold trading loss that exceeds our value-at-risk from the precedingday. On average, we would expect a 99 % confidence level to give rise to two to three outliers representing 1 % of approximate-ly 260 trading days in any one year. We analyze and document underlying reasons for outliers and classify them either as dueto market movements, risks not included in our value-at-risk model, model or process shortcomings. We use the results forfurther enhancement of our value-at-risk methodology. Formal communications explaining the reasons behind any outlier onGroup level are provided to the BaFin and the ECB.
In addition to the standard backtesting analysis at the value-at-risk quantile, the value-at-risk model performance is furtherverified by analyzing the distributional fit across the whole of the distribution (full distribution backtesting). Regular backtesting isalso undertaken on hypothetical portfolios to test value-at-risk performance of particular products and their hedges.
There are various Backtesting forums, with participation from Market Risk Management, Market Risk Analysis, Model Validation,and Finance, that regularly review backtesting results as a whole and of individual businesses. They analyze performancefluctuations and assess the predictive power of our value-at-risk model, which allows us to improve and adjust the risk estima-tion process accordingly.
An independent model validation team reviews all quantitative aspects of our Value-at-Risk model on a regular basis. Thereview covers, but is not limited to, model assumptions, calibration approaches for risk parameters, and model performance.
Holistic Validation process
The Holistic Validation (“HV”) process provides a comprehensive assessment of the market risk management frameworkacross four key control areas: Backtesting, Process, Model Validation, and Risks not in Model (e.g. Risks not in VaR). The HVprocess is run on a quarterly basis and consists of preparing detailed reports (HV Control Packs & Dashboards) that includeboth quantitative and qualitative Key Performance Indicator (“KPI”) based assessments across these four key control areas.Reports are produced for VaR, EC and PST across asset classes / global business areas (e.g. Core Rates, Global Credit Trad-ing, Global Markets-Equities), capital & risk measures (CRM, CVA, IMM and IRC) and as regional cuts (APAC, Americas / US-IHC). The associated formal quarterly HV governance framework is as follows:
‒ Level 1: A series of asset-class level HV Control Pack Review meetings (chaired by the respective Market Risk ManagementAsset Class Head or delegate), at which the respective HV Control Pack is reviewed and the HV Dashboard KPI status andassociated commentary / “path-to-green” agreed across all key control areas.
‒ Level 2: The HV Governance Council (HVGC) chaired by the Global Head of Market Risk Management (with the MRM ExCoin attendance) at which HV dashboards and key themes are presented by the respective Market Risk Management AssetClass Heads. Key decisions and outputs from the HVGC include finalizing the overall HV Dashboard status, executive sum-maries and overall themes, and prioritizing issues for remediation and agreeing escalations, if any.
‒ Level 3: Top-level HV governance is achieved via the Global Head of MRM summarizing key themes to the Group RiskCommittee (GRC) on a case-by-case basis. The CRO may optionally present to the Management Board themes and resultsdeemed of sufficient importance. The Supervisory Board may also be kept informed by Office of the Chief Risk Officer(OCRO) via summarized briefings.
At yearend 2017, our value-at-risk and stressed value-at-risk multiplier was at 4.0 versus the regulatory floor of three.
Article 455 (b) CRR - Regulatory approval for market risk models
Our value-at-risk for the trading businesses is based on our own internal model. In October 1998, the German Banking Super-visory Authority (now the BaFin) approved our internal model for calculating the regulatory market risk capital for our generaland specific market risks. Since then the model has been continually refined and approval has been maintained.
111
Deutsche Bank Market riskPillar 3 Report 2017 Article 455 CRR - Use of Internal Market Risk Models
Article 455 (c) CRR - Trading book allocation and prudent valuation
Allocation of Positions to the Regulatory Trading book
For European regulatory purposes all our positions must be assigned to either the trading book or the banking book. This classi-fication of a position impacts its regulatory treatment, in particular the calculation of the regulatory capital charges for the posi-tion. We define the criteria for the allocation of positions to either the trading book or banking book in internal policy documents,which were based on the respective requirements applicable to the Group contained in Articles 102 to 106 of the CRR.
A central function in Finance is responsible for the policy guidance and is the center of competence with regard to questionsconcerning its application. The Finance functions for the individual business areas are responsible for the classification of posi-tions in line with the policy requirements.
We include positions in the trading book that are financial instruments or commodities which are held with trading intent orwhich are held for the purpose of hedging other trading book positions.
Positions included in the trading book must be free of any restrictive covenants regarding their transferability or able to behedged.
Moreover, positions assigned to the trading book must be valued daily. Further information on the valuation methodology thatwe used is provided in our Annual Report 2017, Note 13 “Financial Instruments carried at Fair Value”, page 235.
As part of the ongoing procedures to confirm that the inclusion of positions in the trading book continues to be in line with theabove referenced internal policy guidance, the Finance functions for our trading businesses carry out a global review of theclassification of positions on a quarterly basis. The results of the review are documented and presented to the Trading BookReview Forum with representatives from Finance and Legal.
Re-allocations of positions between the trading book and the banking book may only be carried out in line with the internalpolicy guidance. They must be documented and are subject to approval by the heads of the Finance functions for the respectivebusiness areas.
Regulatory prudent valuation of assets carried at fair value
Pursuant to Article 34 CRR institutions shall apply the prudent valuation requirements of Article 105 CRR to all assets meas-ured at fair value and shall deduct from CET 1 capital the amount of any additional value adjustments necessary.
We determined the amount of the additional value adjustments based on the methodology defined in the Commission Delegat-ed Regulation (EU) 2016/101.
At December 31, 2017 the amount of the additional value adjustments was € 1.2 billion.
Based on Article 159 CRR the total amount of general and specific credit risk adjustments and additional value adjustments forexposures that are treated under the Internal Ratings Based Approach for credit risk and that are in scope of the expected losscalculation may be subtracted from the total expected loss amount related to these exposures. Any remaining positive differ-ence must be deducted from CET 1 capital pursuant to Article 36 (1) lit. d. CRR.
At December 31, 2017 the reduction of the expected loss from subtracting the additional value adjustments was € 0.3 billion,which partly mitigated the negative impact of the additional value adjustments on our CET 1 capital.
112
Deutsche Bank Market riskPillar 3 Report 2017 Article 455 CRR - Use of Internal Market Risk Models
Article 455 (d) CRR - Overview of Value-at-Risk Metrics
Value-at-Risk Metrics of Trading Units of Deutsche Bank Group (excluding Postbank)
The table below presents the value-at-risk metrics calculated with a 99 % confidence level and a one-day holding period for ourtrading units. They exclude contributions from Postbank trading book which are calculated on a stand-alone basis.
Value-at-Risk of our Trading Units by Risk Type
Total Diversification
effectInterest rate
risk Credit spread
riskEquity price
riskForeign exchange
risk1 Commodity price
riskin € m. 2017 2016 2017 2016 2017 2016 2017 2016 2017 2016 2017 2016 2017 2016Average 29.8 32.0 (28.1) (35.0) 20.2 19.7 19.7 26.6 8.7 9.3 8.4 10.7 0.8 0.7Maximum 38.4 59.4 (37.6) (57.6) 26.0 29.5 25.1 32.5 12.5 52.4 16.5 16.7 3.0 3.3Minimum 20.1 20.4 (21.4) (25.6) 13.5 14.8 13.5 22.3 4.4 4.4 4.2 3.6 0.1 0.2Period-end 29.1 30.1 (22.5) (36.9) 21.4 19.9 14.4 24.3 10.1 10.0 4.9 12.6 0.7 0.21 Includes value-at-risk from gold and other precious metal positions.
The average value-at-risk over 2017 was € 29.8 million, which is a decrease of € 2.2 million compared with the full year 2016.The average credit spread value-at-risk decreased due to a reduction in idiosyncratic risk.
The period end value-at-risk reduction was driven by reductions across the credit spread and foreign exchange asset classes.
Regulatory Trading Market Risk Measures (excluding Postbank)
The table below presents the stressed value-at-risk metrics calculated with a 99 % confidence level and a one-day holdingperiod for our trading units. It excludes contributions from Postbank’s trading book which are calculated on a stand-alone basis
Average, Maximum and Minimum Stressed Value-at-Risk by Risk Type
Total Diversification
effectInterest rate
risk Credit spread
riskEquity price
riskForeign exchange
risk1 Commodity price
riskin € m. 2017 2016 2017 2016 2017 2016 2017 2016 2017 2016 2017 2016 2017 2016Average 76.7 85.2 (88.4) (78.2) 69.8 51.9 62.1 74.9 18.8 20.6 12.6 14.8 1.8 1.3Maximum 125.0 143.7 (115.8) (150.0) 92.0 82.5 73.2 99.3 66.8 144.5 28.0 30.4 6.1 3.9Minimum 42.0 60.4 (73.0) (53.4) 48.3 37.4 54.3 59.0 1.5 2.4 6.9 3.4 0.3 0.4Period-end 85.6 75.8 (81.0) (91.3) 67.8 51.9 64.3 63.0 19.9 29.6 12.6 22.1 1.9 0.51 Includes value-at-risk from gold and other precious metal positions.
The average stressed value-at-risk was € 76.7 million over 2017, a decrease of € 8.5 million compared with the full year 2016.The reduction in the average was driven by a decrease in credit spread stressed value-at-risk due to a reduction in idiosyncraticrisk as well as a small reduction coming from a model enhancement to the credit spread component. This has been partly offsetby an increase in interest rate stressed value-at-risk due to a change in directional exposure on average over 2017.
For regulatory reporting purposes, the incremental risk charge for the respective reporting dates represents the higher of thespot value at the reporting dates, and their preceding 12-week average calculation. The incremental risk charge presented forthe reporting dates below is the spot value and the average, maximum and minimum values calculated for the 12-week periodpreceding these reporting dates.
Average, Maximum and Minimum Incremental Risk Charge of Trading Units (with a 99.9 % confidence level and one-year capitalhorizon)1,2,3,
TotalNon-Core
Operations Unit Global Credit
Trading Core Rates Fixed Income &Currencies APAC
Emerging Markets - Debt Other
in € m. 2017 2016 2017 2016 2017 2016 2017 2016 2017 2016 2017 2016 2017 2016Average 802.1 840.2 0.0 52.0 544.6 393.0 107.1 200.4 168.1 188.6 37.2 116.8 (54.8) (110.5)Maximum 899.3 944.4 0.0 57.3 597.4 405.8 172.5 229.6 229.0 243.0 62.9 128.0 (20.4) (65.6)Minimum 754.8 693.0 0.0 44.5 503.7 368.0 48.7 173.7 92.4 119.6 (1.4) 111.6 (90.0) (141.8)Period-end 789.6 693.0 0.0 51.8 540.1 368.0 133.2 173.7 142.3 119.6 19.9 121.8 (45.9) (141.8)1 Amounts show the bands within which the values fluctuated during the 12-weeks preceding December 31, 2017 and December 31, 2016, respectively.2 Business line breakdowns have been updated for 2017 reporting to better reflect the current business structure.3 All liquidity horizons are set to 12 months.
The incremental risk charge as at the end of 2017 was € 790 million an increase of € 97 million (14 %) compared with year end2016. The 12-week average of the incremental risk charge as at the end of 2017 was € 802 million and thus € 38 million (5 %)lower compared with the average for the 12-week period ended December 31, 2016. The decreased average incremental riskcharge is driven by a decrease in credit exposures in the Core Rates and Emerging Markets Debt business areas when com-pared to the full year 2016.

113
Deutsche Bank Market riskPillar 3 Report 2017 Article 455 CRR - Use of Internal Market Risk Models
For regulatory reporting purposes, the comprehensive risk measure for the respective reporting dates represents the higher ofthe internal spot value at the reporting dates, their preceding 12-week average calculation, and the floor, where the floor isequal to 8 % of the equivalent capital charge under the standardized approach securitization framework.
Average, Maximum and Minimum Comprehensive Risk Measure of Trading Units (with a 99.9 % confidence level and one-yearcapital horizon)1,2,3
in € m. 2017 2016Average 5.4 31.3Maximum 6.3 39.8Minimum 4.5 21.9Period-end 4.4 17.91 Regulatory Comprehensive Risk Measure calculated for the 12-week period ending December 29.2 Period end is based on the internal model spot value.3 All liquidity horizons are set to 12 months.
The internal model comprehensive risk measure as at the end 2017 was € 4.4 million a decrease of € 13.5 million (-75 %) com-pared with year end 2016. The 12-week average of our regulatory comprehensive risk measure as at the end of 2017 was€ 5.4 million and thus € 25.8 million (83 %) lower compared with the average for the 12-week period ending December 31, 2016.The reduction was due to continued de-risking on this portfolio.
The following table, EU MR3, displays the maximum, minimum, average and the ending for the reporting period values resultingfrom the different types of models. This table is based on the spot values of the metrics as opposed to the regulatory definedcalculation (e.g. not considering any comparisons between spot and average values used in the actual RWA calculations). TheVaR and SVaR are both ten day values and this has been calculated using a square root of ten conversion from the one dayvalue.
EU MR3 – IMA values for trading portfolios Dec 31, 2017 Jun 30, 2017
in € m. a aVaR (10 day 99%)1 Maximum value 111.9 121.52 Average value 88.1 100.53 Minimum value 63.7 76.64 Period end 92.1 105.4SVaR (10 day 99%)5 Maximum value 348.3 395.26 Average value 233.5 251.67 Minimum value 132.7 159.68 Period end 270.7 254.4IRC (99.9%)9 Maximum value 899.3 768.210 Average value 750.6 643.211 Minimum value 630.9 535.112 Period end 630.9 715.8Comprehensive risk capital charge (99.9%)13 Maximum value 9.0 23.314 Average value 5.7 14.915 Minimum value 3.0 5.816 Period end 4.4 6.1
Article 455 (e) CRR - Regulatory capital requirements for market risk
For details on the capital requirements for market risk please refer to section “Article 438 (c-f) CRR - Overview of capital re-quirements” on page 32 and section “Article 445 CRR- Exposure to market risk” on page 103 of this Pillar 3 report.

114
Deutsche Bank Market riskPillar 3 Report 2017 Article 455 CRR - Use of Internal Market Risk Models
Article 455 (f) CRR - Weighted average liquidity horizons in market risk models
For information on the weighted average liquidity/capital horizons within our internal market risk models please refer to thesection “Article 455 (a)(ii) CRR - Incremental risk charge and comprehensive risk measure” in this report on the pages 107 to109.
Article 455 (g) CRR - Comparison of end-of-day VaR measures with one-daychanges in portfolio's value
Please refer to our Annual Report 2017, section “Results of Regulatory Backtesting of Trading Market Risk” on page 122 forfurther insights into Deutsche Bank’s market risk backtesting results – in particular explanations and background on the ob-served outliers and the related graph EU MR4 – Comparison of VaR estimates with gains/losses.

115
Deutsche Bank Operational RiskPillar 3 Report 2017 Article 446 CRR - Operational Risk Measurement
Operational Risk
Article 446 CRR - Operational Risk MeasurementWe calculate and measure the regulatory and economic capital requirements for operational risk using the advanced meas-urement approach (“AMA”) methodology. Our AMA capital calculation is based upon the loss distribution approach. Grosslosses from historical internal and external loss data (Operational Riskdata eXchange Association consortium data) and exter-nal scenarios from a public database (IBM OpData) complemented by internal scenario data are used to estimate the risk pro-file (i.e., a loss frequency and a loss severity distribution). Our loss distribution approach model includes conservatism byrecognizing losses on events that arise over multiple years as single events in our historical loss profile.
Within the Loss Distribution Approach (LDA) model, the frequency and severity distributions are combined in a monte carlosimulation to generate potential losses over a one year time horizon. Finally, the risk mitigating benefits of insurance are appliedto each loss generated in the monte carlo simulation. Correlation and diversification benefits are applied to the net losses in amanner compatible with regulatory requirements to arrive at a net loss distribution at Group level, covering expected and unex-pected losses. Capital is then allocated to each of the business divisions after considering qualitative adjustments and expectedloss.
The regulatory capital requirement for operational risk is derived from the 99.9 % percentile. Since Q4 2017, the economiccapital is also set at 99.9 % percentile, see the section “Internal Capital Adequacy” of the Annual Report on page 92. Bothregulatory and economic capital requirements are calculated for a time horizon of one year.
The regulatory and economic capital demand calculations are performed on a quarterly basis. Non-Financial risk management(NFRM) aims to ensure that for the approach for capital demand quantification appropriate development, validation and changegovernance processes are in place, whereby the validation is performed by an independent validation function and in line withthe Group’s model risk management process.
Drivers for Operational Risk Capital Development
In 2017, our operational risk losses have been predominantly driven by losses and provisions arising from civil litigation andregulatory enforcement. Such losses account for 70 % of operational risk losses and account for the majority of operational riskregulatory and economic capital demand. For a description of our current legal and regulatory proceedings, please see section“Current Individual Proceedings” in Note 29 “Provisions” to our consolidated financial statements on page 276. The operationalrisk losses from civil litigation and regulatory enforcement decreased by € 2.5 billion or 85 % while our non-legal operational risklosses were € 29 million or 19% higher compared to 2016.
In view of the relevance of legal risks within our operational risk profile, we dedicate specific attention to the management andmeasurement of our open civil litigation and regulatory enforcement matters where the Group relies both on information frominternal as well as external data sources to consider developments in legal matters that affect the Group specifically but also thebanking industry as a whole. Reflecting the multi-year nature of legal proceedings the measurement of these risks furthermoretakes into account changing levels of certainty by capturing the risks at various stages throughout the lifecycle of a legal matter.
Conceptually, the Group measures operational risk including legal risk by determining the maximum loss that will not be ex-ceeded with a given probability. This maximum loss amount includes a component that due to the IFRS criteria is reflected inour financial statements and a component that is expressed as regulatory or economic capital demand that is above the amountreflected as provisions within our financial statements.
The legal losses which the Group expects with a likelihood of more than 50 % are already reflected in our IFRS group financialstatements. These losses include net changes in provisions for existing and new cases in a specific period where the loss isdeemed probable and is reliably measurable in accordance with IAS 37. The development of our legal provisions for civil litiga-tions and regulatory enforcement is outlined in detail in Note 29 “Provisions” of the Annual Report 2017 on page 273.
Uncertain legal losses which are not reflected in our financial statements as provisions because they do not meet the recogni-tion criteria under IAS 37 are expressed as “regulatory or economic capital demand” reflecting our risk exposure that consumesregulatory and economic capital.
To quantify the litigation losses in the AMA model the Group takes into account historic losses, provisions, contingent liabilitiesand legal forecasts. Legal forecasts are generally comprised of ranges of potential losses from legal matters that are notdeemed probable but are reasonably possible. Reasonably possible losses may result from ongoing and new legal matterswhich are reviewed at least quarterly by the attorneys handling the legal matters.

116
Deutsche Bank Operational RiskPillar 3 Report 2017 Article 446 CRR - Operational Risk Exposure
We include the legal forecasts in the “Relevant Loss Data” used in our AMA model. Hereby the projection range of the legalforecasts is not restricted to the one year capital time horizon but goes beyond and conservatively assumes early settlement ofthe underlying losses in the reporting period - thus considering the multi-year nature of legal matters.
Our AMA Model Validation and Quality Assurance Review Concept
We independently validate all our AMA model components including but not limited to scenarios, Key Risk Indicators (KRI) andself-assessments, expected loss and relevant loss data individually. The results of the validation are summarized in validationreports and identified issues are followed up for resolution. For example, the validation activities in the past years detectedareas of improvement required in our AMA model regarding the estimation of the loss frequency and the use of legal forecasts;these are now included in our AMA model. Quality assurance reviews are performed for the AMA components requiring datainput provided by business divisions and result in capital impact. The AMA components and documentation are challenged andcompared across business divisions to help us maintain consistency and adequacy for our capital metrics.
Our Operational Risk Management Stress Testing Concept
We conduct stress testing on a regular basis to complement our AMA methodology, to analyze the impact of extreme macroscenarios on our capital and the profit-and-loss account. It also contains reputational impacts. In 2017, NFRM took part in allfirm-wide stress test scenarios and assessed and contributed the impact of operational risk to the various stress levels of thescenarios. The impact of operational risk on macro stress test scenarios has been moderate and remained in the expectedrange in regards to capital, which is due to the fact that our AMA model already applies a conservative multi-year view on losssizes (including legal forecasts) even in non-stress mode.
Article 446 CRR - Operational Risk ExposureOperational Risk – Risk Profile
Operational Risk Losses by Event Type (Profit and Loss view)in € m. 2017 20161
Clients, Products and Business Practices 309 2,512Internal Fraud 38 397External Fraud 15 18Execution, Delivery and Process Management 223 119Others 30 25Group 615 3,0721 Changed 2016 loss figures due to subsequent capture of losses and reclassification.
As of December 31, 2017, profit and loss based operational losses decreased by € 2.5 billion or 80 % compared to year-end2016. The decrease was driven by the event types “Clients, Products and Business Practices” and “Internal Fraud”, due tosettlements reached and increased litigation reserves for unsettled cases in 2016.
Operational Losses by Event Type occurred in the period 2017 (2012-2016)
1 Percentages in brackets correspond to loss frequency respectively to loss amount for losses occurred in 2012-2016 period. Frequency and amounts canchange subsequently.

117
Deutsche Bank Operational RiskPillar 3 Report 2017 Article 454 CRR - Use of the Advanced Measurement Approaches to operational risk
The above left chart “Frequency of Operational Losses” summarizes operational risk events which occurred in 2017 comparedto the five-year period 2012-2016 in brackets based on the period in which a loss was first recognized for that event. For exam-ple, for a loss event that was first recognized in 2010 with an additional profit/loss event recognized in 2017, the frequency chartwould not include the loss event, but the loss distribution chart would include the profit/loss recognized in the respective period.
Frequencies are driven by the event types “External Fraud” with a frequency of 48 % and the event type “Clients, Product andBusiness Practices” with 40 % of all observed loss events. “Execution, Delivery and Process Management” contributes 9 %.Others are stable at 2 %. The event type “Internal Fraud” has a low frequency, resulting in less than 1 % of the loss events inthe period 2017.
The above right chart “Distribution of Operational Losses” summarizes operational risk loss postings recognized in the prof-it/loss in 2017 compared to the five-year period 2012-2016. The event type “Clients, Product and Business Practices” domi-nates the operational loss distribution with a share of 50 % and is determined by outflows related to litigation, investigations andenforcement actions. “Execution, Delivery and Process Management” has the second highest share (36 %) which is related toone large event in 2017. The absolute loss amount of this event type only shows a small increase, but the relative increase ishigh, given the smaller basis of the total operational risk Losses. Finally, the event types “Internal Fraud” (6 %), “Others” (5 %)and “External Fraud” (2 %) are minor, compared to other event types.
Economic Capital usage for Operational Risks
Economic Capital Usage for Operational Risk by Business Division 2017 increase (decrease) from 2016
in € m. Dec 31, 2017 Dec 31, 2016 in € m. in %Corporate & Investment Bank 5,995 8,330 (2,335) (28)Private & Commercial Bank 932 1,437 (504) (35)Deutsche Asset Management 402 561 (159) (28)Non-Core Operations Unit 0 160 (160) (100)Consolidation & Adjustments and Other 0 0 0 N/MTotal economic capital usage for operational risk 7,329 10,488 (3,159) (30)
As mentioned in section “Internal Capital Adequacy” of our Annual Report 2017 on page 92, the Group has changed its refer-ence confidence level for its economic capital metric from 99.98 % to the 99.9 % from November 2017. The operational riskeconomic capital usage totaled € 7.3 billion, as of December 31, 2017, which is € 3.2 billion or 30 % lower than the € 10.5 billioneconomic capital usage as of December 31, 2016. The decrease was almost exclusively driven by the impact from the changein the reference confidence level, which was only marginally offset by the effects that also led to the small increase in regulatorycapital for operational risk as outlined in section “Operational Risk Management” on page 71 of our Annual Report 2017.
Article 454 CRR - Use of the Advanced Measurement Ap-proaches to operational riskDescription of the use of insurances and other risk transfer mechanisms for thepurpose of mitigation of this risk
The definition of our insurance strategy and supporting insurance policy and guidelines is the responsibility of our specializedunit Corporate Insurance/Deukona (“CI/D”). CI/D is responsible for our global corporate insurance policy which is approved byour Management Board.
CI/D is responsible for acquiring insurance coverage and for negotiating contract terms and premiums. CI/D also has a role inthe allocation of insurance premiums to the businesses. CI/D specialists assist in devising the method for reflecting insurance inthe capital calculations and in arriving at parameters to reflect the regulatory requirements. They validate the settings of insur-ance parameters used in the AMA model and provide respective updates. CI/D is actively involved in industry efforts to reflectthe effect of insurance in the results of the capital calculations.

118
Deutsche Bank Operational RiskPillar 3 Report 2017 Article 454 CRR - Use of the Advanced Measurement Approaches to operational risk
We buy insurance in order to protect ourselves against unexpected and substantial unforeseeable losses. The identification,definition of magnitude and estimation procedures used are based on the recognized insurance principles and methods. Themaximum limit per insured risk takes into account the reliability of the insurer and a cost/benefit ratio, especially in cases inwhich the insurance market tries to reduce coverage by restricted/limited policy wordings and specific exclusions.
We maintain two insurance companies. However, insurance contracts provided are only considered in the modeling/calculationof insurance-related reductions of operational risk capital requirements where the risk is re-insured in the external insurancemarket.
The regulatory capital figure includes a deduction for insurance coverage amounting to € 311 million as of December 31, 2017compared with € 330 million as of December 31, 2016. Currently, no other risk transfer techniques beyond insurance are rec-ognized in the AMA model.
CI/D selects insurance partners in strict compliance with the regulatory requirements specified in the CRR and based on rec-ommendations of the respective subject matter experts on the recognition of insurance in advanced measurement approaches.The insurance portfolio, as well as CI/D activities, is audited by Group Audit on a risk-based approach.
119
Deutsche Bank Exposures in equities in the banking bookPillar 3 Report 2017 Article 447 (b) CRR - Equity investment exposure
Exposures in equities in the banking book
Article 447 (a) CRR - Accounting and valuation of equity in-vestmentsOutside of trading, equity investments which are neither consolidated for regulatory purposes nor deducted from our regulatorycapital are held as equity positions in the regulatory banking book. In our consolidated balance sheet, these equity investmentsare classified as financial assets Available for Sale (AFS), Equity method investments or financial assets designated at fairvalue through profit or loss.
For details on our accounting and valuation policies related to AFS equity instruments and investments in associates and jointventures please refer to Note 1 “Significant Accounting Policies and Critical Accounting Estimates” on page 202,Note 13 “Financial Instruments carried at Fair Value” on page 235 and Note 17 “Equity Method Investments” on page 251 of ourAnnual Report 2017.
Article 447 (b) CRR - Equity investment exposureEquity Investments According to IFRS Classification
Carrying valuein € m. Dec 31, 2017 Dec 31, 2016Financial assets available for sale – equity instruments 1,019 1,405
Exchange-traded positions 83 405Non-exchange-traded positions 936 1,000
Equity method investments 865 1,026Exchange-traded positions 0 12Non-exchange-traded positions 865 1,014
Financial assets designated at fair value through profit or loss – equity instruments 0 0Exchange-traded positions 0 0Non-exchange-traded positions 0 0
Total equity investments 1,885 2,431
For AFS equity investments, the components considered are realized gains and losses from sales and liquidations as well asunrealized revaluation gains (losses) and impairments. For equity method investments, the gain and loss elements consist ofrealized gains and losses from sales and liquidations, pro-rata share of net income (loss), impairments and unrealized revalua-tion gains (losses) in form of the differences between carrying amounts and fair values. As of December 31, 2017 all investmentpositions with exchange-traded equity method investments were sold, a slight difference between the carrying value of theseinvestment positions and their fair value was only observed in the period of December 31, 2016, which had a carrying value of€ 12 million and a fair value of € 18 million as of December 31, 2016.

120
Deutsche Bank Exposure to interest rate risk in the banking book (Article 448 CRR)Pillar 3 Report 2017 Article 447 (d-e) CRR - Gains and losses from equity investments
Article 447 (c) CRR - Types and nature of equity exposuresEquity Investments Held
The tables above and below present IFRS classifications and the gains (losses) for equity investments held. These equity in-vestments principally constitute equity positions in the regulatory banking book or capital deductions according to CRR. Howev-er, the following aspects need to be considered when comparing the equity investments held – presented below – with theequity position in the regulatory banking book:
‒ Equity investments held by entities, which are consolidated for IFRS purposes but not consolidated for regulatory purposes,are included in the tables.
‒ Collective investment undertakings, which are shown as equity instruments under IFRS, are treated differently for regulatorypurposes and are not included in the tables.
‒ Entities holding equity investments which are considered for regulatory purposes but not consolidated according to IFRS, donot provide IFRS balance sheet and profit or loss information, and are excluded from these tables. The regulatory exposurevalue (“EAD”) of these excluded equity investments has been accounted as nil for December 31, 2017 similar to Decem-ber 31, 2016.
‒ Other positions like equity underlings’ resulting from derivative transactions or certain subordinated bonds which from aregulatory point of view are also assigned to the exposure class “Equity in the banking book” are excluded from the tables.Their EAD amounted to € 140 million as of December 31, 2017, and € 314 million as of December 31, 2016.
‒ The regulatory equity position includes € 435 million EAD as of December 31, 2017, and € 530 million EAD as of Decem-ber 31, 2016, in respect of equity investments which are Group-internal from an IFRS perspective.
‒ “Non-exchange-traded positions” combine private equity exposures in sufficiently diversified portfolios and other exposuresaccording to Article 447 (c) CRR.
For further information on types and nature of these equity investments please refer to our Annual Report 2017, chapter “Mar-ket Risk Management”, section “Equity and Investment Risk” on page 71.
Article 447 (d-e) CRR - Gains and losses from equity invest-mentsRealized Gains (Losses) in the Reporting Period and Unrealized Gains (Losses) at Year-end from Equity Investmentsin € m. 2017 2016Gains and losses on disposal 361 691Impairments (13) (2)Pro-rata share of net income (loss) 141 183Total realized gains (losses) from equity investments 489 873
Dec 31, 2017 Dec 31, 2016Unrealized revaluation gains (losses) 426 647Difference between carrying value and fair value 0 5Total unrealized gains (losses) from equity investments 426 652
The realized gains (losses) on disposals, the impairments and the pro-rata share of net income (loss) are referring to the report-ing period 2017 and 2016 whereas the unrealized revaluation gains (losses) as well as the difference between the carryingvalues and the fair values for the equity investments represent the amounts as of December 31, 2017, and December 31, 2016.
Exposure to interest rate risk in the banking book(Article 448 CRR)
Please refer to our Annual Report 2017 chapter “Risk and Capital Management”, section “Nontrading Market Risk” with its sub-section “Interest Rate Risk in the Banking Book” on page 69 as well as to the section “Nontrading Market Risk Exposures” andtherein the sub-section “Interest Rate Risk in the Banking Book” on page 124.

121
Deutsche Bank Exposure to securitization positionsPillar 3 Report 2017 Article 449 (d-e) CRR - The roles played in the securitization process
Exposure to securitization positions
Article 449 (a) CRR - Objectives in relation to securitization ac-tivityWe engage in various business activities that use securitization structures. The main purposes are to provide investor clientswith access to risk and returns related to specific portfolios of assets, to provide borrowing clients with access to funding and tomanage our own credit risk exposure. In order to achieve our business objectives, we act as originator, sponsor and investor onthe securitization markets.
Article 4(1)(61) CRR defines which types of transactions and positions must be classified as securitization transactions andsecuritization positions for regulatory reporting.
Securitization transactions are basically defined as transactions in which the credit risk of a securitized portfolio is divided into atleast two securitization tranches and where the payments to the holders of the tranches depend on the performance of thesecuritized portfolio. The different tranches are in a subordinate relationship that determines the order and the amount of pay-ments or losses assigned to the holders of the tranches (waterfall). Loss allocations to a junior tranche will not already lead to atermination of the entire securitization transaction, i.e., senior tranches survive loss allocations to subordinate tranches.
Securitization positions can be acquired in various forms including investments in securitization tranches, derivative transac-tions for hedging interest rate and currency risks included in the waterfall, liquidity facilities, credit enhancements, unfundedcredit protection or collateral for securitization tranches.
Assets originated or acquired with the intent to securitize follow the general approach for the assignment to the regulatory bank-ing or trading book. Further details are described in chapter “Article 455 (c) CRR - Trading book allocation and prudent valua-tion”, section “Allocation of Positions to the Regulatory Trading book” on page 111 in this report.
Article 449 (b) CRR - Nature of other risks in securitized assetsSimilar to other fixed income and credit assets, securitized trading volume is linked to global growth and geopolitical eventswhich affect liquidity and can lead to lower trading volumes, as observed during the crisis. Current changes to regulation anduncertainty over final implementation may lead to increased volatility and decreased liquidity/trading volumes across securitizedproducts. Other potential risks that exist in securitized assets are prepayment, default, loss severity and servicer performance.Note that trading book assets are marked to market and the previous mentioned risks are reflected in the position’s price.
Securitization activities have an impact on our liquidity activity. On the one hand, we have entered into securitization transac-tions as part of an active liquidity risk management strategy during 2008 and 2009, some of which we replaced in 2015 and2017 with new securitization transactions. On the other hand, we are exposed to potential drawdown under the revolving com-mitments provided under some of our securitization facilities. This liquidity risk is monitored by our Treasury department and isincluded in our liquidity planning and regular stress testing.
Article 449 (d-e) CRR - The roles played in the securitizationprocessIn the banking book positions, we act as originator, sponsor and investor. As an originator we use securitizations primarily as astrategy to reduce credit risk, mainly through the Credit Portfolio Strategies Group (“CPSG”). CPSG uses, among other means,synthetic securitizations to manage the credit risk of loans and lending-related commitments of the Institutional Corporate Creditportfolio (primarily unsecured, investment grade corporates), Leveraged Debt Capital Markets portfolio (primarily secured, non-investment grade corporates), and the German and Dutch MidCap portfolio within the corporate divisions of CIB. In addition CIB,through the Global Transaction Banking division, manages their trade finance exposures separately through synthetic securiti-zations. For all of the above portfolios, the credit risk is predominantly transferred to counterparties through synthetic securitiza-tions mainly through the issuance of Credit Linked Notes providing first loss protection.

122
Deutsche Bank Exposure to securitization positionsPillar 3 Report 2017 Article 449 (f) and (c) CRR - Management of securitization positions, and risks in re-securitization activities
On a limited basis we have entered into securitization transactions as part of an active liquidity risk management strategy during2008 and 2009, some of which we replaced in 2015 and 2017 with new securitization transactions. These transactions do nottransfer credit risk and are therefore not included in the quantitative part of this section
Within our existing role as sponsor, we continue to establish and manage securitization schemes in which special purposeentities purchase exposures from third-party entities on behalf of investors. In these transactions, we have substantial influenceon the selection of the purchased exposures and ultimate composition of the securitized portfolios.
Furthermore, we act as an investor in third party securitizations through the purchase of tranches from third party-issued secu-ritizations, or by providing liquidity, credit support or other form of financing. Additionally, we assist third party securitizations byproviding derivatives related to securitization structures. These include currency, interest rate, equity and credit derivatives.
Overall, the securitization positions are exposed to the performance of diverse asset classes, including primarily corporatesenior secured loans or unsecured debt, consumer debt such as auto loans or student loans, as well as residential or commer-cial first and second lien mortgages. We are active across the entire capital structure with an emphasis on the more seniortranches. The subset of re-securitization is predominantly backed by securitizations with corporate obligations in the underlyingpools.
In the trading book, we act as originator, sponsor and investor. In the role of investor, our main objective is to serve as a marketmaker in the secondary market. The market making function consists of providing liquidity for our customers and providing twoway markets (buy and sell) to generate flow trading revenues. In the role of originator, we finance loans to be securitized, pre-dominantly in the commercial real estate business. Trading book activities where we have the role of a sponsor (excludingactivities derived from multi-seller originator transactions) as described above are minimal.
Our securitization desks trade assets across all capital structures, from senior bonds with large subordination to first loss subor-dinate tranches, across both securitizations and re-securitizations. Securitization positions consist mostly of residential mort-gage backed securities (“RMBS”) and commercial mortgage backed securities (“CMBS”) backed by first and second lien loans,collateralized loan obligations (“CLOs”) backed by corporate senior loans and unsecured debt and consumer ABS backed bysecured and unsecured credit.
For further details about the extent of involvement in securitization roles, please also see section “Article 449 (n) CRR - Bankingand trading book securitization exposures” and tables from section “(i) - Amount of outstanding exposures securitized” on page127 of this Pillar 3 report.
Article 449 (f) and (c) CRR - Management of securitization po-sitions, and risks in re-securitization activitiesManagement of Banking Book Securitizations
Primary recourse for securitization exposures lies with the underlying assets. The related risk is mitigated by credit enhance-ment typically in the form of overcollateralization, subordination, reserve accounts, excess interest, or other support arrange-ments. Additional protection features include performance triggers, financial covenants and events of default stipulated in thelegal documentation which, when breached, provide for the acceleration of repayment, rights of foreclosure and/or other reme-diation.
The initial due diligence for new banking book exposures usually includes any or all of the following, depending on the specificsof the transaction: (a) the review of the relevant documents including term sheets, servicer reports or other historical perfor-mance data, third-party assessment reports such as rating agency analysis (if externally rated), etc., (b) modeling of base anddownside scenarios through asset-class specific cash-flow models, (c) servicer reviews to assess the robustness of the ser-vicer’s processes and financial strength. The result of this due diligence is summarized in a credit and rating review which re-quires approval by an appropriate level of credit authority, depending on the size of exposure and internal rating assigned.
Compliance with the regulatory requirements for risk retention, due diligence and monitoring according to the applicable regula-tory requirements is part of our credit review process and the relevant data is gathered for reporting purposes with the supportof the IT systems used for the credit review process and the process for financial reporting

123
Deutsche Bank Exposure to securitization positionsPillar 3 Report 2017 Article 449 (f) and (c) CRR - Management of securitization positions, and risks in re-securitization activities
Ongoing regular performance reviews include checks of the periodic servicer reports against any performance trig-gers/covenants in the loan documentation, as well as the overall performance trend in the context of economic, geographic,sector and servicer developments. Monitoring of the re-securitization subset takes into consideration the performance of thesecuritized tranches’ underlying assets, to the extent available.
For longer-term lending-related commitments an internal rating review is required at least annually. Significant negative orpositive changes in asset performance can trigger an earlier review date. Full credit reviews are also required annually, or, forhighly rated exposures, every other year. Furthermore, there is a separate, usually quarterly, watch list process for exposuresidentified to be at a higher risk of loss, which requires a separate assessment of asset and servicer performance. It includes areview of the exposure strategy and identifies next steps to be taken to mitigate loss potential. There is no difference in ap-proach for re-securitization transactions.
Evaluation of structural integrity is another important component of risk management for securitization, focusing on the structur-al protection of a securitization as defined in the legal documentation (i.e., perfection of security interest, segregation of pay-ment flows, and rights to audit). The evaluation for each securitization is performed by a dedicated team who engages third-party auditors, determines audit scopes, and reviews the results of such external audits. The results of these risk reviews andassessments complement the credit and rating review process performed by Credit Risk Management.
Management of Trading Book Securitizations
Our Market Risk Management Governance Framework applies to all securitization positions held within the trading book. TheRisk Governance Framework applied to securitization includes policies and procedures with respect to new product approvals,new transaction approvals, risk models and measurements, as well as inventory management systems and trade entry. Allsecuritization positions held within the trading book are captured, reported and limited within the Risk Governance Frameworkat the global, regional and product levels. Any changes in credit and market risks are also reported.
The limit structure includes value-at-risk and product specific thresholds. Asset class market value limits are based on seniori-ty/rating and liquidity, where lower rated positions or positions in less liquid asset class are given a lower trading threshold. Thelimit monitoring system captures exposures and flags any threshold breaches. Market Risk Management approval is requiredfor any trades over the limit or threshold.
The Market Risk Management Governance Framework also captures issuer (credit) risk for securitization positions in the trad-ing book. MRM’s process manages concentration risks and sets thresholds at the position level. The limit structure is based onasset class and rating where less liquid positions and those with lower ratings are assigned lower trading thresholds. When thelimit monitoring system captures positions that exceed their respective market value thresholds on a global basis, MRM ap-proval is required. Further due diligence is performed on positions that require trade approval; this includes analyzing the creditperformance of the security and evaluating risks of the trade. In addition collateral level stress testing and performance monitor-ing is incorporated into the risk management process. The process covers both securitizations and re-securitizations.
Compliance with the CRR rules, as applicable requires that pre-trade due diligence is performed on all relevant positions. It isthe responsibility of the respective trading desk to perform the pre-trade due diligence and then record the appropriate datarecords at trade execution to indicate whether relevant due diligence items have been performed. The pre-trade due diligenceitems include confirmations of deal structural features, performance monitoring of the underlying portfolio, and any related re-tention disclosures.
Product Control group within Finance then reviews trade inputs for errors or flag changes, distributes regulatory control reportsand serves as the subject matter escalation contact. Upon validation of flag changes or trading desk errors, the Product Controlgroup within Finance will then communicate and action the changes accordingly. Further pre-trade due diligence is performedby Market Risk Management for CRR, as applicable for relevant positions exceeding predefined limits (process as describedabove). Please refer to section “Market Risk Management” on page 65 in our Annual Report 2017 for detailed information onthe market risk management framework.

124
Deutsche Bank Exposure to securitization positionsPillar 3 Report 2017 Article 449 (h) CRR - RWA calculation approaches for securitization positions
Article 449 (g) CRR - Policies with respect to hedging and un-funded protectionManagement of Banking Book Securitizations
Management of credit risk for securitization exposures is conducted primarily through avoidance of undue risk concentration onborrower, servicer and asset class levels. Any higher initial underwritings are de-risked to a final hold mandated in the creditapproval mainly through syndication, or sales in the secondary market. Success of de-risking is monitored and reported regular-ly to senior management. Credit hedging requirements, if any, are mandated in the context of the individual credit approval.There is only very limited credit hedging activity in the banking book.
Furthermore, in the context of structuring securitization transactions, hedging usually takes place to insulate the SPE frominterest rate and cross-currency risk – as far as required depending on the assets being included. When this hedging is provid-ed by us, the related counterparty risk to the securitization structure is included in the Credit Risk Management review processand reported as part of the banking book exposure. If this hedging is not provided by us, it is largely conducted with large inter-national financial institutions with strong financial condition. Please refer to the section “Credit Risk Management” in our AnnualReport 2017 on pages 58 to 59 for detailed information on the credit risk management framework.
Management of Trading Book Securitizations
The securitization desks incorporate hedges to mitigate credit and interest rate risks on the entire securitization portfolio. Dura-tion and credit sensitivities (DV01s and CS01s) are the primary risk sensitivity measures used to calculate appropriate hedges.Some of the hedging products utilized include plain vanilla interest rate swaps, US Treasury bonds and product specific liquidindices. The market risks of the hedges (both funded and unfunded) are incorporated and managed within our Market RiskManagement Governance Framework as described above; and, the counterparty risks of the hedges (both funded and unfund-ed), which are comprised primarily of major global financial institutions, are managed and approved through a formalized riskmanagement process performed by Credit Risk Management.
For further details, please refer to section “Article 449 (f) and (c) CRR - Management of securitization positions, and risks in re-securitization activities” above in this Pillar 3 Report on page 122.
Article 449 (h) CRR - RWA calculation approaches for securiti-zation positionsThe approach for the calculation of the regulatory capital requirements for banking book and trading book securitization posi-tions is prescribed by the European Capital Requirements Regulation (“CRR”).
Calculation of Regulatory Capital Requirements for Banking Book Securitizations
The regulatory capital requirements for the credit risk of banking book securitizations are determined based on the securitizationframework pursuant to Articles 242 to 270 CRR, which distinguishes between credit risk standardized approach (“CRSA”)-securitization positions and internal ratings based approach (“IRBA”)-securitization positions. The classification of securitizationpositions as either CRSA- or IRBA-securitization positions depends on the nature of the securitized portfolio. Basically, CRSA-securitization positions are those where the securitized portfolio predominantly includes credit risk exposures, which wouldqualify as CRSA-exposures under the credit risk framework if they would be held by us directly. Otherwise, if the majority of thesecuritized portfolio would qualify as IRBA-exposures, the securitization positions qualify as IRBA-securitization positions.
The risk weights of CRSA-securitization positions are derived from their relevant external ratings, when applicable. Externalratings must satisfy certain eligibility criteria for being used in the risk weight calculation. Eligible external ratings are taken fromStandard & Poor’s, Moody’s, Fitch Ratings, DBRS and Kroll. If more than one eligible rating is available for a specific securitiza-tion position, the relevant external rating is determined as the second best eligible rating in accordance with the provisions setforth in Article 269 CRR.
125
Deutsche Bank Exposure to securitization positionsPillar 3 Report 2017 Article 449 (h) CRR - RWA calculation approaches for securitization positions
CRSA-securitization positions with no eligible external rating receive a risk weight of 1,250 % unless they qualify for the applica-tion of:
‒ the Internal Assessment Approach according to Article 109 (1) CRR in conjunction with Article 259 (3) and (4) CRR. TheInternal Assessment Approach applies to unrated IRBA-securitization positions related to ABCP programs. As we ceasedthe use of ABCP programs in 2015, there are no securitizations positions subject to the Internal Assessment Approach as ofDecember 31, 2017.
‒ the risk concentration approach pursuant to Article 253 CRR which might lead to a risk weight below 1,250 %. The risk con-centration approach is applied to a few CRSA-securitization exposures that are small compared with the total amount of ourbanking book securitization exposures.
The risk weight of IRBA-securitization positions is determined according to the following hierarchy:
‒ If one or more eligible external ratings exist for the IRBA-securitization position, or if an external rating can be inferred froman eligible external rating of a benchmark securitization position, the risk weight is derived from the relevant external rating(ratings based approach).
‒ Otherwise, if no eligible external rating exists or can be inferred, the risk weight of the IRBA-securitization position will gener-ally be determined based on the supervisory formula approach pursuant to Section 262 CRR or the internal assessment ap-proach pursuant to Article 259 (3) and (4) CRR.
‒ If neither of the aforementioned approaches can be applied, the position receives a risk weight of 1,250 %.
The ratings based approach applies to approximately 8 % of our IRBA- and CRSA-securitization exposure, largely in the lower(better) risk weight bands. The majority of securitization positions with an eligible external or inferred external credit assessmentare securitization positions held as investor.
Approximately 92 % of the total banking book securitization exposure is subject to the supervisory formula approach (“SFA”).This approach is predominantly used to rate positions backed by corporate loans, auto-related receivables and commercial realestate loans. The risk weight of securitization positions subject to the SFA is determined based on a formula which takes asinput the capital requirement of the securitized portfolio and the seniority of the securitization position in the waterfall, amongstothers. When applying the SFA, we estimate the risk parameters PD and LGD for the assets included in the securitized portfolio,by using internally developed rating systems approved for such assets. We continue to develop new rating systems for homog-enous pools of assets to be applied to assets that have not been originated by us. The rating systems are based on historicaldefault and loss information from comparable assets. The risk parameters PD and LGD are derived on risk pool level.
There is no securitization position for which we have applied the special provisions for originators of securitization transactionswhich include an investor’s interest to be recognized by the originator pursuant to Article 256 CRR respectively Article 265 CRR.
Calculation of Regulatory Capital Requirements for Trading Book Securitizations
The regulatory capital requirements for the market risk of trading book securitizations are determined based on a combination ofinternal models and regulatory standard approaches pursuant to Article 337 CRR.
The capital requirement for the general market risk of trading book securitization positions is determined as the sum of (i) thevalue-at-risk based capital requirement for market risk and (ii) the stressed value-at-risk based capital requirement for marketrisk.
The capital requirement for the specific market risk of trading book securitization positions depends on whether the positionsare assigned to the regulatory correlation trading portfolio (“CTP”) or not.
For securitization positions that are not assigned to the CTP, the capital requirement for specific market risk is calculated basedon the market risk standardized approach (“MRSA”). The MRSA risk weight for trading book securitization positions is generallycalculated by using the same methodologies which apply to banking book securitization positions. The only difference relates tothe use of the SFA for a small portion of trading book securitization positions, where the capital requirement of the securitizedportfolio is determined by making use of risk parameters (probability of default and loss given default) that are based on theincremental risk charge model. The MRSA based capital requirement for specific risk is determined as the sum of the capitalrequirements for all net long and all net short securitization positions outside of the CTP. The securitization positions included inthe MRSA calculations for specific risk are additionally included in the value-at-risk and stressed value-at-risk calculations forspecific risk.

126
Deutsche Bank Exposure to securitization positionsPillar 3 Report 2017 Article 449 (j) CRR - Accounting policies for securitizations
Trading book securitizations subject to MRSA treatment include various asset classes differentiated by the respective underly-ing collateral types:
‒ Residential mortgage backed securities (“RMBS”);‒ Commercial mortgage backed securities (“CMBS”);‒ Collateralized loan obligations (“CLO”);‒ Collateralized debt obligations (“CDO”); and‒ Asset backed securities (incl. credit cards, auto loans and leases, student loans, equipment loans and leases, dealer floor-
plan loans, etc.).
They also include synthetic credit derivatives and commonly-traded indices based on the above listed instruments.
Conversely, the capital requirement for the specific market risk of securitization positions which are assigned to the CTP isdetermined as the sum of (i) the value-at-risk based capital requirement for specific risk, (ii) the stressed value-at-risk basedcapital requirement for specific risk and (iii) the capital requirement for specific risk as derived fromthe comprehensive risk measurement (“CRM”) model. The CRM based capital requirement is subject to a floor equalto 8 % of the higher of the specific risk capital requirements for all net long and all net short CTP positions under the MRSA.
The CTP includes securitization positions and nth-to-default credit derivatives principally held for the purpose of trading correla-tion that satisfy the following requirements:
‒ all reference instruments are either single-name instruments, including single-name credit derivatives for which a liquid two-way market exists, or commonly-traded indices based on those reference entities;
‒ the positions are neither re-securitization positions, nor options on a securitization tranche, nor any other derivatives of secu-ritization exposures that do not provide a pro-rata share in the proceeds of a securitization tranche; and
‒ the positions do not reference a claim on a special purpose entity, claims or contingent claims on real estate property orretail.
‒ The CTP also comprises hedges to the securitization and nth-to-default positions in the portfolio, provided a liquid two-waymarket exists for the instrument or its underlying. Typical products assigned to the CTP are synthetic CDOs, nth-to-defaultcredit default swaps (“CDS”), and index and single name CDS.
Please refer to section “Article 455 (a)(i) CRR - Characteristics of the market risk models” on page 105 of this report for generalinformation on our market risk quantification approaches.
Article 449 (i) CRR - SSPEs in sponsoring activitiesWe occasionally use securitization SPEs to securitize third-party exposures in which we act as sponsor. In certain cases wealso retain some of the securitized exposure. The majority (79 %) of our € 1.3 billion sponsor positions consist of senior securiti-zation facilities backed by corporate loans.
When we act as originator or sponsor of a securitization transaction, we sell securitization tranches (or arrange for such salethrough mandated market making institutions) solely on an “execution only” basis and only to sophisticated operative corporateclients that rely on their own risk assessment. In the ordinary course of business, we do not offer such tranches to operativecorporate clients to which, at the same time, we offer investment advisory services.
Our division Deutsche Asset Management (“Deutsche AM”) provides asset management services to undertakings for collectiveinvestments, including mutual funds and alternative investment funds, and private individuals offering access to traditional andalternative investments across all major asset classes, including securitization positions. Less than 3 % of those positions con-sist of tranches in securitization transactions where Deutsche Bank acted as originator or sponsor.
Article 449 (j) CRR - Accounting policies for securitizationsOur accounting policies are included in our Annual Report 2017, specifically Note 1 “Significant Accounting Policies and CriticalAccounting Estimates” on page 202. The most relevant accounting policies for the securitization programs originated by us, andwhere we hold assets purchased with the intent to securitize, are “Principles of Consolidation” on page 203, “Financial Assetsand Financial Liabilities” on page 206 and “Derecognition of Financial Assets and Financial Liabilities” on page 214, see alsoNote 13 “Financial Instruments carried at Fair Value” on page 235. For measurement and quantification of both our banking andtrading book securitizations, please refer to section “Article 449 (n) CRR - Banking and trading book securitization exposure”further below in this report on page 127.
127
Deutsche Bank Exposure to securitization positionsPillar 3 Report 2017 Article 449 (n) CRR - Banking and trading book securitization exposures
Article 449 (k) CRR - External rating agencies used for securit-izationsPlease refer for all the used External rating agencies (ECAIs) to the section “Article 449 (h) CRR - RWA calculation approachesfor securitization positions” in this Pillar 3 report on page 124.
Article 449 (l) CRR - Internal Assessment ApproachPlease refer for a full description of the Internal Assessment Approach to the section “Article 449 (h) CRR - RWA calculationapproaches for securitization positions” on page 124 in this Pillar 3 report.
Article 449 (m) CRR - Explanation of changes in quantitativedisclosuresExplanations of changes in quantitative disclosures can be found above and below of every quantitative table in the securitiza-tion section.
Article 449 (n) CRR - Banking and trading book securitizationexposures(i) - Amount of outstanding exposures securitized
The amounts reported in the following tables provide details of our securitization exposures separately for the regulatory bank-ing and trading book. The details of our trading book securitization positions subject to the market risk standardized approach(MRSA) are included in this chapter, while details of the trading book securitization positions covered under the ComprehensiveRisk Measure (“CRM”) are described in the section “Article 455 (d) CRR - Overview of Value-at-Risk Metrics” on page 112 inthis report.
We are only exposed to credit or market risks related to the exposures securitized, as shown below, to the extent that we haveretained or purchased any of the related securitization positions. The risk of the retained or purchased positions depends on therelative position in the payment waterfall structure of the securitization transaction. For disclosure purposes, we are deemed tobe originator and additionally sponsor in case of multi-seller securitizations, which is reflected in the disclosure of the total out-standing exposures securitized in the sponsor column and our share of those exposures in the originator column.
The following table details the total banking book outstanding exposure split by exposure type, i.e., the overall pool size, wehave securitized in our capacity as either originator or sponsor through traditional or synthetic securitization transactions. Withinthe originator columns the table provides information of the underlying securitized asset pool which was either originated fromour balance sheet or acquired from third parties. The amounts reported are the principal notional amounts with the exception ofon-balance sheet synthetic securitizations for which the carrying values as reported in our consolidated financial statements areshown. Of the € 44.8 billion total outstanding securitized exposure reported as of December 31, 2017 in the table below asoriginator, the amount retained was € 36.1 billion reflecting a decrease in both outstanding securitized as well as retained expo-sures due to a positive FX impact and lower business volume in our synthetic banking book positions. For December 31, 2016these exposures amounted to € 59.3 billion and € 43.9 billion respectively.
For sponsor relationships, the total outstanding exposure securitized reported in the table below represents the principal notion-al amount of outstanding exposures of the entities issuing the securities and other receivables. As of December 31, 2017, ourretained or re-purchased exposure of the € 9.7 billion total outstanding exposure securitized shown in the sponsor columnsincluding multi-seller transactions was € 1.3 billion. The remaining exposure is held by third parties. As of December 31, 2016,our total outstanding exposure securitized resulting from sponsoring activities amounted to € 9.0 billion. This included the re-tained or re-purchased exposure from multi-seller transactions in the amount of € 910 million.
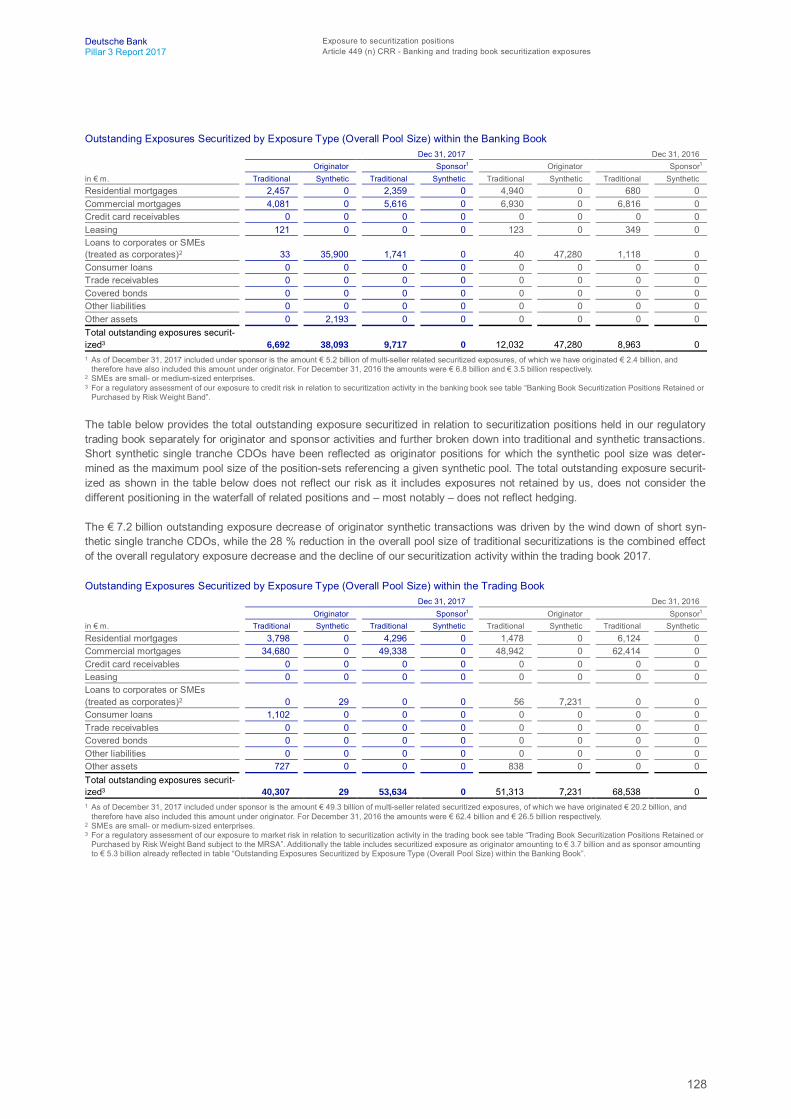
128
Deutsche Bank Exposure to securitization positionsPillar 3 Report 2017 Article 449 (n) CRR - Banking and trading book securitization exposures
Outstanding Exposures Securitized by Exposure Type (Overall Pool Size) within the Banking BookDec 31, 2017 Dec 31, 2016
Originator Sponsor1 Originator Sponsor1
in € m. Traditional Synthetic Traditional Synthetic Traditional Synthetic Traditional SyntheticResidential mortgages 2,457 0 2,359 0 4,940 0 680 0Commercial mortgages 4,081 0 5,616 0 6,930 0 6,816 0Credit card receivables 0 0 0 0 0 0 0 0Leasing 121 0 0 0 123 0 349 0Loans to corporates or SMEs(treated as corporates)2 33 35,900 1,741 0 40 47,280 1,118 0Consumer loans 0 0 0 0 0 0 0 0Trade receivables 0 0 0 0 0 0 0 0Covered bonds 0 0 0 0 0 0 0 0Other liabilities 0 0 0 0 0 0 0 0Other assets 0 2,193 0 0 0 0 0 0Total outstanding exposures securit-ized3 6,692 38,093 9,717 0 12,032 47,280 8,963 01 As of December 31, 2017 included under sponsor is the amount € 5.2 billion of multi-seller related securitized exposures, of which we have originated € 2.4 billion, and
therefore have also included this amount under originator. For December 31, 2016 the amounts were € 6.8 billion and € 3.5 billion respectively.2 SMEs are small- or medium-sized enterprises.3 For a regulatory assessment of our exposure to credit risk in relation to securitization activity in the banking book see table “Banking Book Securitization Positions Retained or
Purchased by Risk Weight Band”.
The table below provides the total outstanding exposure securitized in relation to securitization positions held in our regulatorytrading book separately for originator and sponsor activities and further broken down into traditional and synthetic transactions.Short synthetic single tranche CDOs have been reflected as originator positions for which the synthetic pool size was deter-mined as the maximum pool size of the position-sets referencing a given synthetic pool. The total outstanding exposure securit-ized as shown in the table below does not reflect our risk as it includes exposures not retained by us, does not consider thedifferent positioning in the waterfall of related positions and – most notably – does not reflect hedging.
The € 7.2 billion outstanding exposure decrease of originator synthetic transactions was driven by the wind down of short syn-thetic single tranche CDOs, while the 28 % reduction in the overall pool size of traditional securitizations is the combined effectof the overall regulatory exposure decrease and the decline of our securitization activity within the trading book 2017.
Outstanding Exposures Securitized by Exposure Type (Overall Pool Size) within the Trading BookDec 31, 2017 Dec 31, 2016
Originator Sponsor1 Originator Sponsor1
in € m. Traditional Synthetic Traditional Synthetic Traditional Synthetic Traditional SyntheticResidential mortgages 3,798 0 4,296 0 1,478 0 6,124 0Commercial mortgages 34,680 0 49,338 0 48,942 0 62,414 0Credit card receivables 0 0 0 0 0 0 0 0Leasing 0 0 0 0 0 0 0 0Loans to corporates or SMEs(treated as corporates)2 0 29 0 0 56 7,231 0 0Consumer loans 1,102 0 0 0 0 0 0 0Trade receivables 0 0 0 0 0 0 0 0Covered bonds 0 0 0 0 0 0 0 0Other liabilities 0 0 0 0 0 0 0 0Other assets 727 0 0 0 838 0 0 0Total outstanding exposures securit-ized3 40,307 29 53,634 0 51,313 7,231 68,538 01 As of December 31, 2017 included under sponsor is the amount € 49.3 billion of multi-seller related securitized exposures, of which we have originated € 20.2 billion, and
therefore have also included this amount under originator. For December 31, 2016 the amounts were € 62.4 billion and € 26.5 billion respectively.2 SMEs are small- or medium-sized enterprises.3 For a regulatory assessment of our exposure to market risk in relation to securitization activity in the trading book see table “Trading Book Securitization Positions Retained or
Purchased by Risk Weight Band subject to the MRSA”. Additionally the table includes securitized exposure as originator amounting to € 3.7 billion and as sponsor amountingto € 5.3 billion already reflected in table “Outstanding Exposures Securitized by Exposure Type (Overall Pool Size) within the Banking Book”.
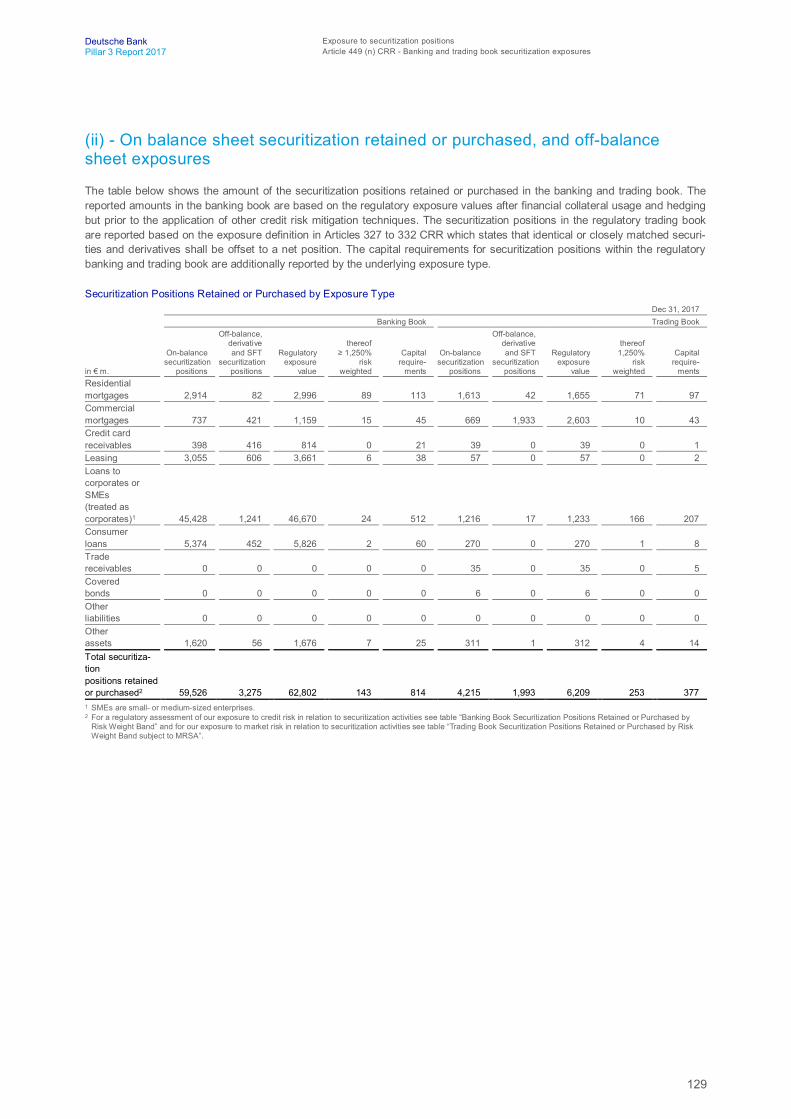
129
Deutsche Bank Exposure to securitization positionsPillar 3 Report 2017 Article 449 (n) CRR - Banking and trading book securitization exposures
(ii) - On balance sheet securitization retained or purchased, and off-balancesheet exposures
The table below shows the amount of the securitization positions retained or purchased in the banking and trading book. Thereported amounts in the banking book are based on the regulatory exposure values after financial collateral usage and hedgingbut prior to the application of other credit risk mitigation techniques. The securitization positions in the regulatory trading bookare reported based on the exposure definition in Articles 327 to 332 CRR which states that identical or closely matched securi-ties and derivatives shall be offset to a net position. The capital requirements for securitization positions within the regulatorybanking and trading book are additionally reported by the underlying exposure type.
Securitization Positions Retained or Purchased by Exposure TypeDec 31, 2017
Banking Book Trading Book
in € m.
On-balancesecuritization positions
Off-balance, derivative and SFTsecuritization positions
Regulatory exposure
value
thereof ≥ 1,250%
risk weighted
Capital require-
ments
On-balancesecuritization positions
Off-balance, derivative and SFTsecuritization positions
Regulatory exposure
value
thereof1,250%
risk weighted
Capital require-
mentsResidentialmortgages 2,914 82 2,996 89 113 1,613 42 1,655 71 97Commercialmortgages 737 421 1,159 15 45 669 1,933 2,603 10 43Credit cardreceivables 398 416 814 0 21 39 0 39 0 1Leasing 3,055 606 3,661 6 38 57 0 57 0 2Loans tocorporates orSMEs(treated ascorporates)1 45,428 1,241 46,670 24 512 1,216 17 1,233 166 207Consumerloans 5,374 452 5,826 2 60 270 0 270 1 8Tradereceivables 0 0 0 0 0 35 0 35 0 5Coveredbonds 0 0 0 0 0 6 0 6 0 0Otherliabilities 0 0 0 0 0 0 0 0 0 0Otherassets 1,620 56 1,676 7 25 311 1 312 4 14Total securitiza-tionpositions retainedor purchased2 59,526 3,275 62,802 143 814 4,215 1,993 6,209 253 3771 SMEs are small- or medium-sized enterprises.2 For a regulatory assessment of our exposure to credit risk in relation to securitization activities see table “Banking Book Securitization Positions Retained or Purchased by
Risk Weight Band” and for our exposure to market risk in relation to securitization activities see table “Trading Book Securitization Positions Retained or Purchased by RiskWeight Band subject to MRSA”.

130
Deutsche Bank Exposure to securitization positionsPillar 3 Report 2017 Article 449 (n) CRR - Banking and trading book securitization exposures
Dec 31, 2016Banking Book Trading Book
in € m.
On-balancesecuritization positions
Off-balance, derivative and SFTsecuritization positions
Regulatory exposure
value
thereof ≥ 1,250%
risk weighted
Capitalrequire-
ments
On-balancesecuritization positions
Off-balance, derivative and SFTsecuritization positions
Regulatory exposure
value
thereof1,250%
risk weighted
Capital require-
mentsResidentialmortgages 5,812 631 6,443 104 184 1,552 209 1,761 194 72Commercialmortgages 1,190 725 1,915 60 98 975 1,676 2,650 46 75Credit cardreceivables 175 662 838 0 18 51 44 95 0 1Leasing 3,994 692 4,687 7 54 21 0 21 0 1Loans tocorporates orSMEs(treated ascorporates)1 49,733 1,922 51,655 10 587 1,135 206 1,342 231 95Consumerloans 7,610 1,114 8,724 0 134 484 0 484 1 14Tradereceivables 0 0 0 0 0 7 0 7 0 0Coveredbonds 0 0 0 0 0 13 0 13 0 0Otherliabilities 0 0 0 0 0 0 0 0 0 0Otherassets 2,140 234 2,374 10 35 190 11 201 20 15Total securitiza-tionpositions retainedor purchased2 70,655 5,981 76,636 192 1,110 4,428 2,146 6,574 491 2721 SMEs are small- or medium-sized enterprises.2 For a regulatory assessment of our exposure to credit risk in relation to securitization activities see table “Banking Book Securitization Positions Retained or Purchased by
Risk Weight Band” and for our exposure to market risk in relation to securitization activities see table “Trading Book Securitization Positions Retained or Purchased by RiskWeight Band subject to MRSA”.
Total retained or purchased securitization positions in the banking book decreased by € 13.8 billion or 18 % throughout the year2017. The decrease was mainly driven by the positive FX effect of € 6.9 billion, affecting all exposures types. Additionally, thetermination of banking book securitization positions in the exposure class “Consumer Loans” and a lower business volume inour synthetic securitization positions related to the exposure class “Loans to corporates or SMEs” caused the decrease of bank-ing book securitization exposure.
Within the trading book, the securitization exposure decreased by € 365 million or 6 % mainly in the exposure type “ConsumerLoans” predominantly due to reduced book volume. Despite the overall exposure decrease the capital requirement increasedby € 105 million in 2017. This was mainly driven by the 120 % growth of long credit exposure within the exposure type “Loans tocorporates or SMEs”, which does not benefit from the cap on own funds requirement for specific risk according to Article 335CRR.
Securitization Positions Retained or Purchased by Region (Exposure Amount)Dec 31, 2017 Dec 31, 2016
in € m. Banking Book Trading Book Banking Book Trading BookEurope 21,464 1,048 25,492 1,438Americas 35,924 3,411 45,241 3,827Asia/Pacific 5,411 1,049 5,756 701Other 3 701 147 608Total securitization positions retained or purchased1 62,802 6,209 76,636 6,5741 For a regulatory assessment of our exposure to credit risk in relation to securitization activities see table “Banking Book Securitization Positions Retained or Purchased by
Risk Weight Band” and for our exposure to market risk in relation to securitization activities see table “Trading Book Securitization Positions Retained or Purchased by RiskWeight Band subject to MRSA”.
The amounts shown in the table above are based on the country of domicile of the obligors of the exposures securitized. Theexposure decrease in the banking book for the regions “Americas” was a result of the positive FX effect, disposals and lowerbusiness activities. The exposure reduction in the trading book within the regions “Europe” and “Americas” was driven by theaforementioned regulatory exposure decline in the exposure class “Consumer Loans”.

131
Deutsche Bank Exposure to securitization positionsPillar 3 Report 2017 Article 449 (n) CRR - Banking and trading book securitization exposures
(iii) - Amount of assets awaiting securitization
The following table provides details of existing banking and trading book outstanding exposures split by exposure type for whichthere is a management intention to securitize them in either an existing or new securitization transaction in the near future.Outstanding exposures awaiting securitization do not include assets due for securitization without risk transfer, e.g. those secu-ritizations where we will keep all tranches.
Outstanding Exposures Awaiting Securitization (Exposure Amount)Dec 31, 2017 Dec 31, 2016
in € m. Banking Book Trading Book Banking Book Trading BookResidential mortgages 0 0 0 0Commercial mortgages 0 1,551 76 1,273Credit card receivables 0 0 0 0Leasing 0 0 0 0Loans to corporates or SMEs (treated as corporates)1 2,498 0 0 0Consumer loans 0 0 0 0Trade receivables 0 0 0 0Covered bonds 0 0 0 0Other liabilities 0 0 0 0Other assets 0 0 0 2,500Outstanding exposures awaiting securitization 2,498 1,551 76 3,7731 SMEs are small- or medium-sized enterprises.
As of December 31, 2017 we held commercial mortgages in the amount of € 1.6 billion in the trading book and extended loansto corporates or SMEs amounting to € 2.5 billion in the banking book with the intention to securitize them.
(iv) - Early amortization treatment
There is no securitization position for which we have applied the special provisions for originators of securitization transactionswhich include an investor’s interest to be recognized by the originator pursuant to Article 256 CRR respectively Article 265 CRR.
(v) - Deducted or 1,250%-weighted securitization positions
Please refer for deducted or 1,250 % weighted securitization positions to the section “449 (n) (ii) – On balance sheet securitiza-tion retained or purchased, and off-balance sheet exposures” within this Pillar 3 report on pages 129 to 130.
(vi) - Amount of exposures securitized and recognized gains or losses on sales
The 2017 year-end amounts in the tables below show an increase of our securitization activity in the banking book comparedwith 2016. This increased activity predominately concerned the exposure type “Other assets” dominated by the synthetic trans-actions executed by the Corporate and Investment Bank. Securitization activities in the trading book declined by 10 % to€ 9.3 billion driven by the weakening demand for CMBS.
Securitization Activity – Total Outstanding Exposures Securitized (i.e., the underlying pools) by Exposure Type within the BankingBook
Originator SponsorDec 31, 2017 2017 Dec 31, 2017
in € m. Traditional Synthetic
Realized gains (losses)
from sales/liquidations Traditional Synthetic
Residential mortgages 0 0 0 362 0Commercial mortgages 310 0 0 0 0Credit card receivables 0 0 0 0 0Leasing 0 0 0 0 0Loans to corporates or SMEs (treated as corporates)1 0 7,970 0 450 0Consumer loans 0 0 0 0 0Trade receivables 0 0 0 0 0Covered Bonds 0 0 0 0 0Other liabilities 0 0 0 0 0Other assets 0 2,193 0 0 0Total Outstanding Exposures Securitized2 310 10,163 0 812 01 SMEs are small- or medium-sized enterprises.2 For a regulatory assessment of our exposure to credit risk in relation to securitization activity in the banking book see table “Banking Book Securitization Positions Retained or
Purchased by Risk Weight Band”.

132
Deutsche Bank Exposure to securitization positionsPillar 3 Report 2017 Article 449 (n) CRR - Banking and trading book securitization exposures
Originator SponsorDec 31, 2016 2016 Dec 31, 2016
in € m. Traditional Synthetic
Realized gains (losses)
from sales/liquidations Traditional Synthetic
Residential mortgages 0 0 0 0 0Commercial mortgages 0 0 0 0 0Credit card receivables 0 0 0 0 0Leasing 88 0 0 0 0Loans to corporates or SMEs (treated as corporates)1 0 7,610 0 95 0Consumer loans 0 0 0 0 0Trade receivables 0 0 0 0 0Covered Bonds 0 0 0 0 0Other liabilities 0 0 0 0 0Other assets 0 0 0 0 0Total Outstanding Exposures Securitized2 88 7,610 0 95 01 SMEs are small- or medium-sized enterprises.2 For a regulatory assessment of our exposure to credit risk in relation to securitization activity in the banking book see table “Banking Book Securitization Positions Retained or
Purchased by Risk Weight Band”.
The higher exposure originated via synthetic securitizations in 2017 compared to 2016 in the banking book was mainly drivenby a new synthetic securitization position with derivative exposures securitized.
Securitization Activity – Total Outstanding Exposures Securitized by Exposure Type within the Trading BookOriginator Sponsor1
Dec 31, 2017 2017 Dec 31, 2017
in € m. Traditional Synthetic
Realized gains (losses) from sales/ liquidations Traditional Synthetic
Residential mortgages 3,005 0 12 0 0Commercial mortgages 5,170 0 27 6,990 0Credit card receivables 0 0 0 0 0Leasing 0 0 0 0 0Loans to corporates or SMEs (treated as corporates)2 0 0 0 0 0Consumer loans 1,102 0 0 0 0Trade receivables 0 0 0 0 0Covered Bonds 0 0 0 0 0Other liabilities 0 0 0 0 0Other assets 0 0 0 0 0Total Outstanding Exposures Securitized3 9,277 0 39 6,990 01 Included under sponsor is the amount € 6.9 billion exposures securitized, of which we originated € 2.8 billion, also included under originator.2 SMEs are small- or medium-sized enterprises.3 For a regulatory assessment of our exposure to market risk in relation to securitization activity in the trading book see table “Trading Book Securitization Positions Retained or
Purchased by Risk Weight Band subject to the MRSA”.
Originator Sponsor1
Dec 31, 2016 2016 Dec 31, 2016
in € m. Traditional Synthetic
Realized gains (losses) from sales/ liquidations Traditional Synthetic
Residential mortgages 0 0 0 811 0Commercial mortgages 10,272 0 98 15,286 0Credit card receivables 0 0 0 0 0Leasing 0 0 0 0 0Loans to corporates or SMEs (treated as corporates)2 0 0 0 0 0Consumer loans 0 0 0 0 0Trade receivables 0 0 0 0 0Covered Bonds 0 0 0 0 0Other liabilities 0 0 0 0 0Other assets 0 0 0 0 0Total Outstanding Exposures Securitized3 10,272 0 98 16,097 01 Included under sponsor is the amount € 15.3 billion exposures securitized, of which we originated € 7.5 billion, also included under originator.2 SMEs are small- or medium-sized enterprises.3 For a regulatory assessment of our exposure to market risk in relation to securitization activity in the trading book see table “Trading Book Securitization Positions Retained or
Purchased by Risk Weight Band subject to the MRSA”.

133
Deutsche Bank Exposure to securitization positionsPillar 3 Report 2017 Article 449 (o)(i) CRR - Retained or purchased banking and trading book securitizations broken down by risk-weight
bands
Article 449 (o)(i) CRR - Retained or purchased banking andtrading book securitizations broken down by risk-weight bandsBanking Book Securitization Exposure
The following tables present the retained or purchased banking book securitizations by their regulatory calculation approachand further broken down by risk-weight bands.
Banking Book Securitization Positions Retained or Purchased by Risk Weight BandDec 31, 2017 Dec 31, 2016
in € m.Exposure
amount
Capital requirements
IRBA1
Capital requirements standardized
approachExposure
amount
Capital requirements
IRBA1
Capital requirements standardized
approach≤ 10 % 57,833 497 0 68,693 631 0> 10 ≤ 20 % 2,220 13 14 3,069 24 12> 20 ≤ 50 % 1,309 23 16 1,807 28 25> 50 ≤ 100 % 1,059 35 31 2,184 46 77> 100 ≤ 350 % 140 17 1 496 15 1> 350 ≤ 650 % 7 2 0 126 52 0> 650 < 1,250 % 91 66 0 68 54 0≥ 1,250% ≤ 1,325 % 143 83 16 192 141 4Total securitization positionsretained or purchased 62,802 736 77 76,636 991 1191 After considering value adjustments according to Article 266 (1,2) CRR. Including capital requirements for maturity mismatch of synthetic securitizations by risk weight band
defined as notional weighted average risk weight of the underlying pool.
Due to the overall banking book exposure decrease of 18 % to € 62.8 billion, the capital requirements decreased by 27 % to€ 0.8 billion. This was due to the fact that older synthetic securitization positions early terminated in 2017. These were fullyreplaced with new synthetic securitization positions, which received a lower risk weight. Additionally there was an overall de-crease of book values and termination of banking book securitization positions.
The largest portion (94 %) of IRBA eligible banking book securitization exposures were treated according to the SupervisoryFormula Approach (“SFA”). For the remaining IRBA eligible banking book exposures (6 %) we used the Ratings Based Ap-proach (“RBA”).
Banking Book Securitization Positions Retained or Purchased by Risk Weight Bands subject to the IRBA-Rating Based Approach(RBA)
Dec 31, 2017 Dec 31, 2016
Exposure amountCapital requirements,
IRBA-RBA1 Exposure amountCapital requirements,
IRBA-RBA1
in € m.Securiti-
zationRe-
SecuritizationSecuriti-
zationRe-
SecuritizationSecuri-tization
Re- Securitization
Securiti-zation
Re- Securitization
≤ 10 % 1,347 0 12 0 2,299 0 14 0> 10 ≤ 20 % 965 0 10 0 1,873 0 19 0> 20 ≤ 50 % 478 12 10 0 634 46 12 1> 50 ≤ 100 % 495 16 31 1 961 0 44 0> 100 ≤ 350 % 10 0 1 0 454 7 12 1> 350 ≤ 650 % 7 0 2 0 6 0 2 0> 650 < 1,250 % 2 0 2 0 7 0 4 0≥ 1,250% ≤ 1,325 % 110 9 65 9 180 6 132 6Total securitization positions retained or purchased 3,414 37 133 11 6,414 59 239 91 After considering value adjustments according to Article 266 (1,2) CRR.
Exposures subject to the securitization IRBA-RBA decreased by € 3.0 billion mainly driven by a decline of book values anddisposals of securitization positions. Due to value adjustments on securitization positions the capital requirement in the riskbucket ≥ 1,250% ≤ 1,325 % was significantly lower than the exposure amount. Our re-securitization exposure reduced by€ 22 million, predominantly due to sales of re-securitization positions.

134
Deutsche Bank Exposure to securitization positionsPillar 3 Report 2017 Article 449 (o)(i) CRR - Retained or purchased banking and trading book securitizations broken down by risk-weight
bands
Banking Book Securitization Positions Retained or Purchased by Risk Weight Band subject to the IRBA-Supervisory Formula Ap-proach (SFA)
Dec 31, 2017 Dec 31, 2016
Exposure amountCapital requirements,
IRBA-SFA1 Exposure amountCapital requirements,
IRBA-SFA1
in € m.Securiti-
zationRe-
SecuritizationSecuriti-
zation2Re-
SecuritizationSecuriti-
zationRe-
SecuritizationSecuriti-
zation2Re-
Securitization≤ 10 % 56,485 0 485 0 66,394 0 617 0> 10 ≤ 20 % 359 0 4 0 415 0 5 0> 20 ≤ 50 % 425 0 13 0 509 0 15 0> 50 ≤ 100 % 68 0 3 0 47 0 2 0> 100 ≤ 350 % 121 0 16 0 26 0 3 0> 350 ≤ 650 % 0 0 0 0 120 0 49 0> 650 < 1,250 % 89 0 64 0 61 0 50 01,250 % 8 0 8 0 2 0 2 0Total securitization positions retained or purchased 57,556 0 593 0 67,575 0 743 01 After considering value adjustments according to Article 266 (1,2) CRR.2 Including capital requirements for maturity mismatch of synthetic securitizations by risk weight band defined as notional weighted average risk weight of the underlying pool.
Banking Book exposure subject to the IRBA-Supervisory Formula Approach overall decreased to € 57.6 billion in 2017, mainlydriven by the positive FX effect and the termination of synthetic securitizations positions.
The Credit Risk Standardized Approach (“CRSA”) is used for securitization positions where the underlying portfolio predomi-nantly consists of credit risk exposures, which would qualify for application of the CRSA if these exposures would be directlyheld by us.
Banking Book Securitization Positions Retained or Purchased by Risk Weight Band subject to the Credit Risk Standardized Ap-proach (CRSA)
Dec 31, 2017 Dec 31, 2016Exposure amount Capital requirements, SA Exposure amount Capital requirements, SA
in € m.Securiti-
zationRe-
SecuritizationSecuriti-
zationRe-
SecuritizationSecuriti-
zationRe-
SecuritizationSecuriti-
zationRe-
Securitization≤ 10 % 0 0 0 0 0 0 0 0> 10 ≤ 20 % 896 0 14 0 781 0 12 0> 20 ≤ 50 % 394 0 16 0 619 0 25 0> 50 ≤ 100 % 479 0 31 0 1,176 0 77 0> 100 ≤ 350 % 9 0 1 0 9 0 1 0> 350 ≤ 650 % 0 0 0 0 0 0 0 0> 650 < 1,250 % 0 0 0 0 0 0 0 01,250 % 16 0 16 0 4 0 4 0Total securitization positionsretained or purchased 1,794 0 77 0 2,588 0 119 0
Exposure subject to CRSA decreased by € 794 million as a result of the termination of securitization positions.

135
Deutsche Bank Exposure to securitization positionsPillar 3 Report 2017 Article 449 (o)(ii) CRR - Retained or purchased re-securitization exposures for banking and trading book
Trading Book Securitization Exposure
The following table presents the retained or purchased trading book securitizations by their regulatory calculation approach andfurther broken down by risk-weight bands.
For trading book securitization positions not covered under the Comprehensive Risk Measure (“CRM”), the capital requirementfor specific market risk is calculated based on the MRSA. The MRSA risk weight calculation for trading book securitizationpositions is generally based on the same methodologies which apply to banking book securitization positions. More details onthe approaches are provided in section “Article 449 (h) CRR - RWA calculation approaches for securitization positions” on page124.
Trading Book Securitization Positions Retained or Purchased by Risk Weight Band subject to the Market RiskStandardized Approach (MRSA)
Dec 31, 2017 Dec 31, 2016Exposure amount Capital requirements, MRSA Exposure amount Capital requirements, MRSA
in € m.Securiti-
zationRe-
SecuritizationSecuriti-
zationRe-
SecuritizationSecuriti-
zationRe-
SecuritizationSecuriti-
zationRe-
Securitization≤ 10 % 501 0 3 0 618 0 3 0> 10 ≤ 20 % 4,413 0 43 0 3,977 0 40 0> 20 ≤ 50 % 397 28 13 1 651 155 20 5> 50 ≤ 100 % 443 24 33 2 480 31 33 2> 100 ≤ 350 % 56 12 11 2 45 26 7 5> 350 ≤ 650 % 82 0 17 0 92 6 23 3> 650 < 1,250 % 0 0 0 0 0 0 0 01,250 % 245 8 244 8 461 31 111 20Total securitization positionsretained or purchased 6,138 71 364 13 6,325 249 238 34
On a year to year comparison the capital requirement of trading book securitization positions increased mainly in the risk weightbucket 1,250 % due to the aforementioned elevated share of long credit regulatory exposure compared to short credit, which isnot benefiting from the own funds requirement cap of Article 335 CRR. Positions contributing to the exposure amount but sub-ject to this cap were present in all risk weight bands above 10 %.
Article 449 (o)(ii) CRR - Retained or purchased re-securitization exposures for banking and trading bookIn 2017 we reduced our activity in re-securitization positions.
Trading book re-securitization exposure was reduced by 16 % as a result of hedging being recognized according to Arti-cles 327-332 CRR. Banking book re-securitization exposure declined by 37 %, due to disposals.
Re-Securitization Positions Retained or Purchased (Exposure Amount)Dec 31, 2017 Dec 31, 2016
Banking Book Trading Book Banking Book Trading Book
in € m.
Beforehedging/
insurances
Afterhedging/
insurances
Beforehedging/
insurances
Afterhedging/
insurances
Beforehedging/
insurances
Afterhedging/
insurances
Beforehedging/
insurances
Afterhedging/
insurancesRe-SecuritizationPositions 37 37 84 71 59 59 356 249
Risk mitigation in the form of financial guarantees has not been applied to our re-securitization positions in neither the bankingnor the trading book.

136
Deutsche Bank Exposure to securitization positionsPillar 3 Report 2017 Article 449 (r) CRR - Financial support to securitization vehicles
Article 449 (p) CRR - Impaired assets and recognized lossesrelated to banking book securitizationsThe following table provides details of the quality of the underlying asset pool of outstanding exposures securitized for which weare an originator and hold positions in the regulatory banking book. An exposure is reported as past due when it has the statuspast due for 30 days or more and has not already been included as impaired. For our originated synthetic securitizations, im-paired and past due exposure amounts are determined through our internal administration, while for our originated traditionalsecuritizations, impaired and past due exposure amounts are primarily derived from investor reports of underlying exposures.
Separately, the table details losses we recognized in 2017 and 2016 for retained or purchased securitization positions as origi-nator by exposure type. The losses are those reported in the consolidated statement of income. The amounts are the actuallosses in the underlying asset pool to the extent that these losses are allocated to the retained or purchased securitizationpositions held by us after considering any eligible credit protection. This applies to both traditional and synthetic transactions.
Impaired and Past Due Exposures Securitized and Losses Recognized by Exposure Type (Overall Pool Size) as Originator Dec 31, 2017 2017 Dec 31, 2016 2016
in € m.Impaired/past due1 Losses
Impaired/past due1 Losses
Residential mortgages 0 0 1,085 3Commercial mortgages 0 0 5 10Credit card receivables 0 0 0 0Leasing 0 0 0 0Loans to corporates or SMEs (treated as corporates)2 33 2 46 0Consumer loans 0 0 0 0Trade receivables 0 0 0 0Covered bonds 0 0 0 0Other liabilities 0 0 0 0Other assets 0 0 0 0Total impaired and past due exposuressecuritized and losses recognized3 33 2 1,136 131 Includes the impaired and past due exposures in relation to the overall pool of multi-seller securitizations which could reflect more than our own originated portion.2 SMEs are small- or medium-sized entities.3 For a regulatory assessment of our exposure to credit risk in relation to securitization activity in the banking book see table “Banking Book Securitization Positions Retained or
Purchased by Risk Weight Band”.
The total impaired or past due exposure securitized decreased by € 1.1 billion in 2017. The reduction was mainly attributed tothe exposure types “Residential mortgages”. Losses recorded by us in 2017 decreased to € 2 million compared to € 13 millionin 2016.
Article 449 (q) CRR - Trading book securitization positionsPlease refer for details about the trading book exposures to the section “Article 449 (n) CRR - Banking and trading book securit-ization exposures” in this Pillar 3 report on page 127.
Article 449 (r) CRR - Financial support to securitization vehi-clesWe have not provided any implicit support to our securitization vehicles.

137
Deutsche Bank Leverage (Article 451 CRR)Pillar 3 Report 2017 Leverage Ratio according to revised CRR/CRD 4 framework
Remuneration policy (Article 450 CRR)
For details please refer to the section “Compensation Report” in our Annual Report 2017 on the pages 137-186.
Leverage (Article 451 CRR)
We manage our balance sheet on a Group level and, where applicable, locally in each region. In the allocation of financialresources we favor business portfolios with the highest positive impact on our profitability and shareholder value. We monitorand analyze balance sheet developments and track certain market-observed balance sheet ratios. Based on this we triggerdiscussion and management action by the Group Risk Committee (GRC). Following the publication of the CRR/CRD 4 frame-work, we established a leverage ratio calculation according to that framework.
Leverage Ratio according to revised CRR/CRD 4 frameworkThe CRR/CRD 4 framework introduced a non-risk based leverage ratio that is intended to act as a supplementary measure tothe risk based capital requirements. Its objectives are to constrain the build-up of leverage in the banking sector, helping avoiddestabilizing deleveraging processes which can damage the broader financial system and the economy, and to reinforce therisk based requirements with a simple, non-risk based “backstop” measure. While the CRR/CRD 4 framework currently doesnot provide for a mandatory minimum leverage ratio to be complied with by the relevant financial institutions, a legislative pro-posal published by the European Commission on November 23, 2016 suggests introducing a minimum leverage ratio of 3 %.The legislative proposal provides that the leverage ratio would apply two years after the proposal’s entry into force and remainssubject to political discussion among EU institutions.
We calculate our leverage ratio exposure on a fully loaded basis in accordance with Article 429 of the CRR as per DelegatedRegulation (EU) 2015/62 of October 10, 2014 published in the Official Journal of the European Union on January 17, 2015amending Regulation (EU) No 575/2013. In addition, we provide the leverage ratio on a phase-in basis as displayed below inthe tables.
Our total leverage ratio exposure includes derivatives, securities financing transactions (SFTs), off-balance sheet exposure andother on-balance sheet exposure (excluding derivatives and SFTs).
The leverage exposure for derivatives is calculated by using the regulatory mark-to-market method for derivatives comprisingthe current replacement cost plus a regulatory defined add-on for the potential future exposure. Variation margin received incash from counterparties is deducted from the current replacement cost portion of the leverage ratio exposure measure andvariation margin paid to counterparties is deducted from the leverage ratio exposure measure related to receivables recognizedas an asset on the balance sheet, provided certain conditions are met. Deductions of receivables for cash variation marginprovided in derivatives transactions are shown under derivative exposure in the table “Leverage ratio common disclosure”below. The effective notional amount of written credit derivatives, i.e., the notional reduced by any negative fair value changesthat have been incorporated in Tier 1 capital, is included in the leverage ratio exposure measure; the resulting exposure meas-ure is further reduced by the effective notional amount of a purchased credit derivative on the same reference name providedcertain conditions are met.
The securities financing transaction (SFT) component includes the gross receivables for SFTs, which are netted with SFT pay-ables if specific conditions are met. In addition to the gross exposure a regulatory add-on for the counterparty credit risk is in-cluded.
The off-balance sheet exposure component follows the credit risk conversion factors (CCF) of the standardized approach forcredit risk (0 %, 20 %, 50 %, or 100 %), which depend on the risk category subject to a floor of 10 %.
The other on-balance sheet exposure component (excluding derivatives and SFTs) reflects the accounting values of the assets(excluding derivatives and SFTs) as well as regulatory adjustments for asset amounts deducted in determining Tier 1 capital.
The following tables show the leverage ratio exposure and the leverage ratio, both on a fully loaded basis, in accordance withthe disclosure tables of the implementing technical standards (ITS) which were adopted by the European Commission viaCommission Implementing Regulation (EU) 2016/200 published in the Official Journal of the European Union on February 16,2016. For additional information, they also contain the phase-in figures.

138
Deutsche Bank Leverage (Article 451 CRR)Pillar 3 Report 2017 Leverage Ratio according to revised CRR/CRD 4 framework
Summary reconciliation of accounting assets and leverage ratio exposuresin € bn.(unless stated otherwise) Dec 31, 2017 Dec 31, 2016Total assets as per published financial statements 1,475 1,591
Adjustment for entities which are consolidated for accounting purposes but are outside the scopeof regulatory consolidation 5 0(Adjustment for fiduciary assets recognized on the balance sheet pursuant to the applicable accountingframework but excluded from the leverage ratio total exposure measure in accordance with Article 429(13) ofRegulation (EU) No 575/2013) N/M N/MAdjustments for derivative financial instruments (172) (276)Adjustment for securities financing transactions (SFTs) 41 20Adjustment for off-balance sheet items (i.e. conversion to credit equivalent amounts of off-balancesheet exposures) 95 102(Adjustment for intragroup exposures excluded from the leverage ratio total exposure measure in accordancewith Article 429(7) of Regulation (EU) No 575/2013) N/M N/M(Adjustment for exposures excluded from the leverage ratio total exposure measure in accordance withArticle 429(14) of Regulation (EU) No 575/2013) N/M N/MOther adjustments (50) (90)
Leverage ratio total exposure measure (fully loaded) 1,395 1,348
Leverage ratio total exposure measure (phase-in) 1,396 1,350N/M – Not meaningful
Leverage ratio common disclosurein € bn.(unless stated otherwise) Dec 31, 2017 Dec 31, 2016On-balance sheet exposures (excluding derivatives and SFTs)On-balance sheet items (excluding derivatives, SFTs and fiduciary assets, but including collateral) 990 948(Asset amounts deducted in determining Tier 1 capital)1 (14) (15)Total on-balance sheet exposures (excluding derivatives, SFTs and fiduciary assets) 976 933
Derivative exposuresReplacement cost associated with all derivatives transactions (i.e. net of eligible cash variation margin) 37 53Add-on amounts for PFE associated with all derivatives transactions (mark-to-market method) 154 154Exposure determined under Original Exposure Method N/M N/MGross-up for derivatives collateral provided where deducted from the balance sheet assets pursuant tothe applicable accounting framework 0 0(Deductions of receivables assets for cash variation margin provided in derivatives transactions) (29) (37)(Exempted CCP leg of client-cleared trade exposures) (13) (10)Adjusted effective notional amount of written credit derivatives 812 750(Adjusted effective notional offsets and add-on deductions for written credit derivatives) (795) (733)Total derivatives exposures 166 177
SFT exposuresGross SFT assets (with no recognition of netting), after adjusting for sales accounting transactions 183 159(Netted amounts of cash payables and cash receivables of gross SFT assets) (61) (42)Counterparty credit risk exposure for SFT assets 35 18Derogation for SFTs: Counterparty credit risk exposure in accordance with Articles 429b(4) and 222 ofRegulation (EU) No 575/2013 N/M N/MAgent transaction exposures 1 0(Exempted CCP leg of client-cleared SFT exposure) 0 0Total securities financing transaction exposures 158 135
Other off-balance sheet exposuresOff-balance sheet exposures at gross notional amount 265 277(Adjustments for conversion to credit equivalent amounts) (170) (174)Other off-balance sheet exposures 95 102
Exempted exposures in accordance with Article 429 (7) and (14) of Regulation (EU) No 575/2013 (onand off balance sheet)(Intragroup exposures (solo basis) exempted in accordance with Article 429(7) of Regulation (EU)No 575/2013 (on and off balance sheet)) N/M N/M(Exposures exempted in accordance with Article 429 (14) of Regulation (EU) No 575/2013 (on and offbalance sheet)) N/M N/M

139
Deutsche Bank Leverage (Article 451 CRR)Pillar 3 Report 2017 Process used to manage the risk of excessive leverage
in € bn.(unless stated otherwise) Dec 31, 2017 Dec 31, 2016Capital and total exposure measureTier 1 capital (fully loaded) 52.9 46.8Leverage ratio total exposure measure (fully loaded) 1,395 1,348Leverage ratio (fully loaded, in %) 3.8 3.5
Tier 1 capital (phase-in) 57.6 55.5Leverage ratio total exposure measure (phase-in) 1,396 1,350Leverage ratio (phase-in, in %) 4.1 4.1N/M – Not meaningful1 Using a fully loaded definition of Tier 1 capital. The amount using a transitional definition of Tier 1 capital is € (13) billion and € (13) billion as of December 31, 2017 and
December 31, 2016, respectively.
Breakdown of on-balance sheet exposures (excluding derivatives and SFTs)in € bn.(unless stated otherwise) Dec 31, 2017 Dec 31, 2016Total on-balance sheet exposures (excluding derivatives, SFTs, and exempted exposures) 990 948
thereof:Trading book exposures 231 225Banking book exposures 759 723thereof:Covered bonds 2 2Exposures treated as sovereigns 288 259Exposures to regional governments, MDB, international organizations and PSE not treated as sovereigns 2 2Institutions 18 16Secured by mortgages of immovable properties 186 164Retail exposures 34 35Corporate 156 179Exposures in default 7 9Other exposures (e.g. equity, securitizations, and other non-credit obligation assets) 66 57
Process used to manage the risk of excessive leverageAs described in the section “Risk Management Principles” and “Risk Governance” on pages 46-50 of our Annual Report 2017,the Group Risk Committee (GRC) is mandated to oversee, control and monitor integrated planning our risk profile and capitalcapacity. The GRC actively manages leverage exposure capacity via a limit setting process
‒ to allocate group leverage exposure capacity to businesses,‒ to support business achievement of strategic performance plans,‒ to provide a firm basis for achieving the target leverage ratio,‒ to incentivize businesses to make appropriate decisions on their portfolios, with consideration to asset maturity and encum-
brance amongst others, and‒ to maintain risk discipline.
In the case of limit excess the respective business is charged. The limit excess charges are calculated in accordance with theGroup-wide limit-setting framework for leverage.
For further details please also refer to the “Capital Management” section contained in chapter “Risk and Capital Management”on page 57 of our Annual Report 2017.

140
Deutsche Bank Leverage (Article 451 CRR)Pillar 3 Report 2017 Factors that had an impact on the leverage ratio in 2017
Factors that had an impact on the leverage ratio in 2017As of December 31, 2017, our fully loaded CRR/CRD 4 leverage ratio was 3.8 % compared to 3.5 % as of December 31, 2016,taking into account as of December 31, 2017 a fully loaded Tier 1 capital of € 52.9 billion over an applicable exposure measureof € 1,395 billion (€ 46.8 billion and € 1,348 billion as of December 31, 2016, respectively).
Our CRR/CRD 4 leverage ratio according to transitional provisions was 4.1 % as of December 31, 2017 (4.1 % as of December31, 2016), calculated as Tier 1 capital according to transitional rules of € 57.6 billion over an applicable exposure measure of€ 1,396 billion (€ 55.5 billion and € 1,350 billion as of December 31, 2016, respectively). The exposure measure under transi-tional rules is € 1 billion (€ 2 billion as of December 31, 2016) higher compared to the fully loaded exposure measure as theasset amounts deducted in determining Tier 1 capital are lower under transitional rules.
Based on recent ECB guidance, we have included pending settlements in the calculation of the leverage exposure since thesecond quarter 2017 based on the asset values as recorded for financial accounting purposes, i.e., for Deutsche Bank Groupunder IFRS, trade date accounting. The application of trade date accounting leads to a temporary increase of the leverageexposure between trade date and settlement date for regular way asset purchases. The size of the reported increase was€ 17 billion at December 31, 2017. It should be noted that under the proposed revision of the Capital Requirement Regulation(“CRR”) as currently drafted this increase would materially reverse out once the revision becomes effective given it allows forthe offsetting of pending settlement cash payables and cash receivables for regular way purchases and sales that are settledon a delivery-versus-payment basis.
Following a clarification by the EBA published on January 19, 2018 we have changed the treatment of sold options which formpart of a regulatory netting set starting with the fourth quarter 2017. We no longer apply a cap at the maximum possible expo-sure increase of the netting set that may result from the option and this leads to an increase of the add-ons for potential futureexposure for derivatives by € 15 billion.
Over the year 2017, our leverage ratio exposure increased by € 47 billion to € 1,395 billion. This is primarily driven by the € 41billion increase in Other Assets which in addition to the above mentioned pending settlements also reflects the development onour balance sheet, in particular increases in cash and central bank balances and non-derivative trading assets, partly offset by adecrease in loans. Furthermore, there was an increase of € 23 billion in SFT exposures reflecting higher add-ons for counter-party credit risk and the overall growth on the balance sheet in the SFT related items (securities purchased under resaleagreements and securities borrowed, under accrual and fair value accounting as well as receivables from prime brokerage).Derivative exposures decreased by € 11 billion mainly driven by lower replacement costs; the above-mentioned increase of thepotential future exposure add-ons for sold options was largely offset by the change from the previous collateral model to asettlement model for the interest rate swaps transacted with the London Clearing House and other reductions. In addition, off-balance sheet exposures decreased by € 7 billion corresponding to lower notional amounts for irrevocable lending commit-ments and contingent liabilities.
The increase of the leverage ratio exposure in 2017 includes a negative foreign exchange impact of € 82 billion mainly due tothe appreciation of the Euro against the U.S. dollar.
Our leverage ratio calculated as the ratio of total assets under IFRS to total equity under IFRS was 22 as of December 31, 2017compared to 25 as of December 31, 2016.
For main drivers of the Tier 1 capital development please refer to section “Own Funds” on page 19 in this report.

141
Deutsche BankPillar 3 Report 2017
Unencumbered Assets (Article 443 CRR)
Unencumbered Assets (Article 443 CRR)
On June 27, 2014 the EBA published guidelines on the disclosure of encumbered and unencumbered assets as mandated byArticle 443 CRR.
Year-end spot data values were used for the purpose of this disclosure instead of the median average of quarterly data pointsas a result of the unavailability of updated quarterly data points following implementation of a refined approach to determineassets pledged and collateral received and collateral re-pledged. This refined approach was used to restate 2016 year endresults and to calculate the 2017 year end disclosures.
Encumbered assets primarily comprise those on- and off-balance sheet assets that are pledged as collateral against securedfunding, collateral swaps, and other collateralized obligations. Additionally, in line with the EBA technical standards on regulato-ry asset encumbrance reporting, we consider assets placed with settlement systems, including default funds and initial marginsas encumbered, as well as other assets pledged which cannot be freely withdrawn such as mandatory minimum reserves atcentral banks. We also include derivative margin receivable assets as encumbered under these EBA guidelines.
This section refers to asset encumbrance in the group of institutions consolidated for banking regulatory purposes pursuant tothe German Banking Act. There under not included are insurance companies or companies outside the finance sector. Assetspledged by our insurance subsidiaries are included in the Annual Report 2017 in Note 22 “Assets Pledged and Received asCollateral” on page 258 of the Consolidated Financial Statements, and restricted assets held to satisfy obligations to insurancecompanies’ policy holders are included within Note 39 “Information on Subsidiaries” on page 311.
Encumbered and unencumbered assetsDec 31, 2017
Unencumbered assets
in € bn.On-balance sheet
Carrying amount of encumbered
assets
Fair value of encumbered
assets
Carrying amountof unencumbered
assets
Fair valueof unencumbered
assetsDebt securities 65.4 65.4 89.3 89.3Equity instruments 63.4 63.4 20.1 20.1Other assets: 122.2 1,182.7Total 251.0 1,292.0
Dec 31, 2016Unencumbered assets
in € bn.On-balance sheet
Carrying amount of encumbered
assets
Fair value of encumbered
assets
Carrying amountof unencumbered
assets
Fair valueof unencumbered
assetsDebt securities 76.9 76.9 74.1 74.1Equity instruments 54.4 54.4 20.6 20.6Other assets: 139.2 1,225.9Total 270.4 1,320.6
Collateral receivedDec 31, 2017
Fair value of collateral receivedin € bn.Off-balance sheet Encumbered
Available for encumbrance
Collateral received: 308.4 57.9Debt securities 191.0 40.8Equity instruments 117.3 16.9Other collateral received 0 0.2
Own debt securities issued other than covered bonds and asset backed securities 0 0
Dec 31, 2016Fair value of collateral received
in € bn.Off-balance sheet Encumbered
Available for encumbrance
Collateral received: 260.4 61.7Debt securities 168.1 50.1Equity instruments 92.1 11.6Other collateral received 0.1 0
Own debt securities issued other than covered bonds and asset backed securities 0 0

142
Deutsche BankPillar 3 Report 2017
Unencumbered Assets (Article 443 CRR)
The above tables set out a breakdown of on- and off-balance sheet items, broken down between encumbered and unencum-bered. Any securities borrowed or purchased under resale agreements are shown based on the fair value of collateral received.
For December 2017, € 251 billion of the Group's on-balance sheet assets were encumbered. These assets primarily related tofirm financing of trading inventory and other securities, to funding (i.e., Pfandbriefe and covered bonds) secured against loancollateral and to cash collateral for derivative margin requirements.
For December 2017, the Group had received securities as collateral with a fair value of € 557.7 billion, of which € 513,3 billionwere sold or on pledged. These pledges typically relate to trades to facilitate client activity, including prime brokerage, collateralposted in respect of Exchange Traded Funds and derivative margin requirements.
The above tables of encumbered assets include assets that are not encumbered at an individual entity level, but which may besubject to restrictions in terms of their transferability within the group. Such restrictions may be due to local connected lendingrequirements or similar regulatory restrictions.
‘Own debt securities issued other than covered bonds and asset backed securities’ refers to those own bond holdings that arenot derecognized from the balance sheet by a non-IFRS institution. This is not applicable for Deutsche Bank Group.
Encumbered assets/collateral received and associated liabilitiesDec 31, 2017
in € bn.
Matching liabilities,contingent liabilities,
securities lent
Carrying value ofencumbered assets,
fair value of encumbered collateral
received and owndebt securities issued
On-balance/off-balance sheet amount of selected financial liabilities and financial assets 513.3 557.7
Dec 31, 2016
in € bn.
Matching liabilities,contingent liabilities,
securities lent
Carrying value ofencumbered assets,
fair value of encumbered collateral
received and owndebt securities issued
On-balance/off-balance sheet amount of selected financial liabilities and financial assets 484.8 530.8
The above table shows the total amount of encumbered on- and off-balance sheet assets against the corresponding liabilities,contingent liabilities or securities lent that have given rise to the encumbrance.

143
Deutsche BankPillar 3 Report 2017
Liquidity
Liquidity
As part of the Basel 3 rules, the Basel Committee on Banking Supervision specified two minimum liquidity standards for banks:
The Liquidity Coverage Ratio (LCR):The LCR is intended to promote the short-term resilience of a bank’s liquidity risk profile over a 30 day stress scenario. The ratiois defined as the amount of High Quality Liquid Assets (“HQLA”) that could be used to raise liquidity, measured against the totalvolume of net cash outflows, arising from both actual and contingent exposures, in a stressed scenario.
This requirement has been implemented into European law, via the Commission Delegated Regulation (EU) 2015/61, adoptedin October 2014. Compliance with the LCR was required in the EU from October 1, 2015.
The final EBA guidelines on LCR disclosure released on the March 8, 2017 (EBA/GL/2017/01) requires us to disclose the aver-age of month-end observations over twelve months preceding the end of each quarter instead of the year-end LCR. Therefore,this year’s disclosed LCR for 2016 will slightly differ from the disclosed LCR in the previous year. For reference, we have addi-tionally included the year-end LCR numbers below.
Our average LCR of 144 % (twelve months average) has been calculated in accordance with the Commission Delegated Regu-lation (EU) 2015/61 and the EBA Guidelines on LCR disclosure to complement the disclosure of liquidity risk managementunder Article 435 CRR. Due to changes of the calculation method in October 2016, the December 2016 average LCR of 121 %includes 3 data points (October – December 2016) whereas the December 2017 LCR includes 12 data points (January – De-cember 2017).
The year-end LCR as of December 31, 2017 stands at 140 % compared to 128 % as of December 31, 2016.
Concentration of funding and liquidity sources:For an overview of the concentration of funding and liquidity sources please refer to the section “Liquidity Risk Exposure” in theAnnual Report 2017 on page 126. The information is outlined in the sub-section “Funding Diversification”, “Composition ofExternal Funding Sources”.
Derivative exposures and potential collateral calls:The majority of outflows related to derivative exposures and other collateral requirements shown in item 11 are in relation toderivative contractual cashflows that are offset by Other cash inflows shown in item 19.
Other significant outflows relate to the impact of an adverse market scenario on derivatives based on the 24 month historicallook back approach, and the posting of additional collateral as a result of a 3 notch downgrade of DB’s credit rating.
There are also some smaller outflows assumed in relation to callable excess margin collateral and to margin collateral postedthat might need to be upgraded to level 1 collateral under an LCR scenario.
Currency mismatch in the LCR:The LCR is calculated in all major currencies that make up at least 5% of the total Balance Sheet (EUR, USD, GBP and aggre-gated in EUR). No explicit LCR risk appetite is set for specific currencies, however, all results are monitored.
Approach to centralized group liquidity management and individual legal entity liquidity management:Please refer to the “Liquidity Risk Management” section on page 76 in the Annual Report 2017.
Other items in the LCR calculation that are not captured in the LCR disclosure template but that the institution considersrelevant for its liquidity profile:The Pillar 3 disclosure obligations require Banks to disclose the 12 months rolling averages for each quarter. Due to changes ofthe calculation method in October 2016, the March 2017 LCR in the below table includes six data points (October 2016 – March2017, the June 2017 LCR includes nine data points (October 2016 – June 2017) and the September 2017 and December 2017LCR calculation includes twelve data points respectively. We do not consider anything else relevant for disclosure.

144
Deutsche BankPillar 3 Report 2017
Liquidity
EU LIQ1 - LCR disclosure templatein € m. Total unweighted value (average) Total weighted value (average)Quarter ending on Dec 31,2017 Sep 30,2017 Jun 30,2017 Mar 31,2017 Dec 31,2017 Sep 30,2017 Jun 30,2017 Mar 31,2017Number of data points used in the calculation ofaverages 12 12 9 6 12 12 9 6High-quality liquid assets
1 Total high-quality liquid assets (HQLA) 247 229 219 202
Cash-outflows2 Retail deposits and deposits from small business
costumers 169 165 164 161 16 16 16 15thereof:
3 Stable deposits 90 89 89 89 5 4 4 44 Less stable deposits 78 75 74 72 12 11 11 115 Unsecured wholesale funding 224 219 219 216 92 88 86 84
thereof:6 Operational deposits (all counterparties) and
deposits in network of cooperative banks 111 115 121 125 27 29 30 317 Non-operational deposits (all counterparties) 112 102 96 90 63 57 54 518 Unsecured debt 2 2 2 2 2 2 2 29 Secured wholesale funding 51 51 49 4710 Additional requirements 208 210 215 216 89 89 91 91
thereof:11 Outflows related to derivative exposures and
other collateral requirements 49 48 49 50 48 47 48 4812 Outflows related to loss of funding on debt
products 0 0 0 0 0 0 0 013 Credit and liquidity facilities 159 162 165 166 41 41 42 4214 Other contractual funding obligations 105 109 105 101 7 5 4 115 Other contingent funding obligations 264 262 264 263 17 15 15 1416 Total cash outflows 273 264 260 253
Cash - inflows17 Secured lending (e.g. reverse repos) 299 295 290 281 50 51 50 4818 Inflows from fully performing exposures 42 42 43 43 31 31 32 3219 Other cash inflows 32 30 30 30 32 30 30 30EU19a
Difference between total weighted inflows andtotal weighted outflows arising from transactionsin third countries where there are transfer re-strictions or which are denominated in non-convertible currencies 11 12 12 12
EU19b
Excess inflows from a related specialized creditinstitution 0 0 0 0
20 Total cash inflows 372 367 364 354 101 100 100 98
thereof:EU20a
Fully exempt inflows0 0 0 0 0 0 0 0
EU20b
Inflows subject to 90 % cap0 0 0 0 0 0 0 0
EU20c
Inflows subject to 75 % cap328 327 325 354 101 100 100 98
Total adjusted value21 Liquidity buffer 247 229 219 202
22 Total net cash outflows 172 164 160 154
23 Liquidity coverage ratio (%) 144 140 137 131
The Net Stable Funding Ratio (NSFR):Basel 3 also contains a proposal to introduce a net stable funding ratio (NSFR) to reduce medium to long-term funding risks byrequiring banks to fund their activities with sufficiently stable sources of funding. The NSFR requires banks to maintain a stablefunding profile in relation to their on- and off-balance sheet activities. The ratio is defined as the amount of Available StableFunding (the portion of capital and liabilities expected to be a stable source of funding), relative to the amount of RequiredStable Funding (a function of the liquidity characteristics of various assets held).
In the EU, on November 23, 2016, the Commission published a legislative proposal to amend the CRR. The proposal defines,inter alia, a mandatory quantitative NSFR requirement and which would apply two years after the proposal comes into force.The proposal remains subject to change in the EU legislative process. Therefore, for banks domiciled in the EU, the final defini-tion of the ratio and associated implementation timeframe has not yet been confirmed.

145
Deutsche BankPillar 3 Report 2017
Business Risk
Business Risk
Business risk economic capital methodology captures a tax risk component, a capital charge for deferred tax on temporarydifferences and strategic risk, which also implicitly includes elements of non-standard risks including refinancing and reputation-al risk.
Economic Capital Usage for Business Risk by Business Division 2017 increase (decrease) from 2016
in € m. Dec 31, 2017 Dec 31, 2016 in € m. in %Corporate & Investment Bank 4,435 4,753 (318) (7)Private & Commercial Bank 10 32 (22) (70)Deutsche Asset Management 99 100 (1) (1)Non-Core Operations Unit 0 245 (245) (100)Consolidation & Adjustments and Other 1,140 (32) 1,172 N/MTotal 5,683 5,098 585 11
Economic capital usage for business risk as of December 31, 2017 was € 5.68 billion, representing a € 585 million(11 %) increase compared to December 31, 2016. This increase reflected a higher economic capital usage for the tax riskcomponent and the inclusion of a deferred tax capital charge, which were partially offset by the lower EC percentile (99.9 % vs99.98 %) used since November, 2017. Further details can be found in the section “Article 438 (a) CRR - Summary of DeutscheBank’s ICAAP approach” on page 27 of this report. As of December 31, 2017, the economic capital usage for the tax risk anddeferred tax components was € 512 million and € 685 million respectively. The strategic risk economic capital of € 4.48 billionwas down from € 4.85 billion in 2016, with the decrease being driven by the change to the EC definition, and was almost entire-ly allocated to Corporate & Investment Banking (€ 4.38 billion).
The strategic risk economic capital model calculates potential unexpected operating losses under extreme adverse scenariosdue to decreases in operating revenues that cannot be compensated by cost reductions. To avoid double-counting, revenue orcost fluctuations related to market risk, credit risk or operational risk are not considered. The model reflects business-specific,historical revenue volatilities as well as the business 12-month earnings forecasts. Key macro-economic or financial revenuedrivers are included to model dependencies between business units.
Strategic risk economic capital is managed via the Strategic and Capital plan, which is developed annually and presented to theManagement Board for discussion and approval. The final plan is then presented to the Supervisory Board. During the year,execution of business strategies is regularly monitored to assess the performance against strategic objectives and to ensure weremain on track to achieve targets.

146
Deutsche BankPillar 3 Report 2017
List of tables
List of tables
Main Pillar 3 disclosures in our Annual Report ................................................................................................................................................8EU LI1 – Differences between accounting and regulatory scopes of consolidation and the mapping of financial statement categories withregulatory risk categories .............................................................................................................................................................................15EU LI2 – Main sources of differences between regulatory exposure amounts and carrying values in financial statements .............................17Transitional template for regulatory capital, RWA and capital ratios ..............................................................................................................20Reconciliation of shareholders’ equity to regulatory capital ...........................................................................................................................24Development of regulatory capital ................................................................................................................................................................26EU OV1 – Overview of RWA ........................................................................................................................................................................32EU CR10 – IRB (specialized lending and equities) .......................................................................................................................................33Credit risk exposures of other non-credit obligation assets ...........................................................................................................................34Overview total capital requirements and capital buffers ................................................................................................................................35Geographical distribution of credit exposures relevant for the calculation of the countercyclical capital buffer................................................36Institution-specific countercyclical capital buffer ............................................................................................................................................38EU CRB-B – Total and average net amount of exposures ............................................................................................................................39EU CRB-C – Geographical breakdown of exposures ....................................................................................................................................41EU CRB-D – Concentration of exposures by industry or counterparty types..................................................................................................45EU CRB-E – Maturity of exposures ..............................................................................................................................................................48EU CR1-A – Credit quality of exposures by exposure class and instrument ..................................................................................................49EU CR1-B – Credit quality of exposures by industry .....................................................................................................................................50EU CR1-C – Credit quality of exposures by geography .................................................................................................................................51EU CR1-D – Ageing of past-due exposures ..................................................................................................................................................51EU CR1-E – Non-performing and forborne exposures ..................................................................................................................................52EU CR2-A – Changes in the stock of general and specific credit risk adjustments ........................................................................................52EU CR2-B – Changes in the stock of defaulted and impaired loans and debt securities ................................................................................52EU CR3 – CRM techniques – Overview .......................................................................................................................................................53CRM techniques by exposure class..............................................................................................................................................................55EU CR4 – Standardized approach – Credit Risk Exposure and Credit Risk Mitigation (CRM) effects ............................................................57EU CR5 – Standardized approach................................................................................................................................................................57EAD within the group covered by the standardized, FIRB and AIRB approaches by exposure class .............................................................59Internal Ratings and Probability of Defaults ..................................................................................................................................................60EU CR6 – AIRB approach – Credit risk exposures by exposure class and PD range – Central governments and central banks ....................63EU CR6 – AIRB approach – Credit risk exposures by exposure class and PD range – Institutions ................................................................64EU CR6 – AIRB approach – Credit risk exposures by exposure class and PD range – Corporates, total .......................................................65EU CR6 – AIRB-approach – Credit risk exposures by exposure class and PD range – Corporates, SMEs ....................................................65EU CR6 – AIRB approach – Credit risk exposures by exposure class and PD range – Corporates, specialized lending ................................66EU CR6 – AIRB approach – Credit risk exposures by exposure class and PD range – Corporates, other .....................................................67EU CR6 – AIRB approach – Credit risk exposures by exposure class and PD range – Retail, total ...............................................................67EU CR6 – AIRB approach – Credit risk exposures by exposure class and PD range – Retail, secured by real estate property SMEs ...........68EU CR6 – AIRB approach – Credit risk exposures by exposure class and PD range – Retail, secured by real estate property non-SMEs.....69EU CR6 – AIRB approach – Credit risk exposures by exposure class and PD range – Retail, qualifying revolving ........................................69EU CR6 – AIRB approach – Credit risk exposures by exposure class and PD range – Other retail SMEs .....................................................70EU CR6 – AIRB approach – Credit risk exposures by exposure class and PD range – Other retail non-SMEs ..............................................71EU CR6 – AIRB approach – Credit risk exposures by exposure class and PD range – Total .........................................................................71EU CR6 – FIRB approach – Credit risk exposures by exposure class and PD range – Central governments and central banks ....................72EU CR6 – FIRB approach – Credit risk exposures by exposure class and PD range – Institutions ................................................................72EU CR6 – FIRB approach – Credit risk exposures by exposure class and PD range – Corporates, total .......................................................73EU CR6 – FIRB approach – Credit risk exposures by exposure class and PD range – Corporates, SMEs ....................................................74EU CR6 – FIRB approach – Credit risk exposures by exposure class and PD range – Corporates, specialized lending ................................74EU CR6 – FIRB approach – Credit risk exposures by exposure class and PD range – Corporates, other......................................................75EU CR6 – FIRB approach – Credit risk exposures by exposure class and PD range – Total .........................................................................76EU CR7 – IRB approach – Effect on the RWAs of credit derivatives used as CRM techniques .....................................................................76EU CR8 – RWA flow statement of credit risk exposures under the IRB approach .........................................................................................77Validation results for risk parameters used in our advanced IRBA ................................................................................................................77EU CR9 IRB backtesting of PD per exposure class for Advanced IRBA ........................................................................................................79Validation results of risk parameters used in our Foundation IRBA at Postbank ............................................................................................81EU CR9 IRB backtesting of PD per exposure class for Foundation IRBA ......................................................................................................81Comparison of expected loss estimates for loans, commitments and contingent liabilities with actual losses recorded by regulatory exposureclass for advanced IRBA exposures .............................................................................................................................................................83Year-to-year comparison of the actual loss by IRBA exposure class .............................................................................................................83EAD net, average LGD and average PD of Advanced IRBA credit exposures by geographical location ........................................................84EAD net and average PD of Foundation IRBA credit exposures by geographical location (including derivatives and SFTs) ..........................87EU CCR1 – Analysis of CCR exposure by approach ....................................................................................................................................93EU CCR2 – CVA capital charge ...................................................................................................................................................................93EU CCR8 – Exposures to CCPs...................................................................................................................................................................93EU CCR3 – Standardized approach – CCR exposures by regulatory portfolio and risk .................................................................................94EU CCR4 – AIRB approach – CCR exposures by portfolio and PD scale – Central governments and central banks .....................................95EU CCR4 – AIRB approach – CCR exposures by portfolio and PD scale – Institutions .................................................................................95EU CCR4 – AIRB approach – CCR exposures by portfolio and PD scale – Corporates, total ........................................................................95EU CCR4 – AIRB approach – CCR exposures by portfolio and PD scale – Corporates, SME .......................................................................96EU CCR4 – AIRB approach – CCR exposures by portfolio and PD scale – Corporates, specialized lending .................................................96EU CCR4 – AIRB approach – CCR exposures by portfolio and PD scale – Corporates, other.......................................................................96EU CCR4 – AIRB approach – CCR exposures by portfolio and PD scale – Retail, total ................................................................................96EU CCR4 – AIRB approach – CCR exposures by portfolio and PD scale – Retail, secured by real estate property SMEs .............................97EU CCR4 – AIRB approach – CCR exposures by portfolio and PD scale – Retail, secured by real estate property non-SMEs ......................97EU CCR4 – AIRB approach – CCR exposures by portfolio and PD scale – Retail qualifying revolving ..........................................................97EU CCR4 – AIRB approach – CCR exposures by portfolio and PD scale – Other retail SME ........................................................................97
147
Deutsche BankPillar 3 Report 2017
List of tables
EU CCR4 – AIRB approach – CCR exposures by portfolio and PD scale – Other retail non-SME .................................................................98EU CCR4 – AIRB approach – CCR exposures by portfolio and PD scale – Total ..........................................................................................98EU CCR4 – FIRB approach – CCR exposures by portfolio and PD scale – Central governments and central banks .....................................98EU CCR4 – FIRB approach – CCR exposures by portfolio and PD scale – Institutions .................................................................................99EU CCR4 – FIRB approach – CCR exposures by portfolio and PD scale – Corporates, total ........................................................................99EU CCR4 – FIRB approach – CCR exposures by portfolio and PD scale – Corporates, SME .......................................................................99EU CCR4 – FIRB approach – CCR exposures by portfolio and PD scale – Corporates, specialized lending .................................................99EU CCR4 – FIRB approach – CCR exposures by portfolio and PD scale – Corporates, other ..................................................................... 100EU CCR4 – FIRB approach – CCR exposures by portfolio and PD scale – Total ........................................................................................ 100EU CCR7 – RWA flow statement of counterparty credit risk exposures under the internal model method.................................................... 100EU CCR5-A – Impact of netting and collateral held on exposure values...................................................................................................... 101EU CCR5-B – Composition of collateral for exposures to CCR ................................................................................................................... 101EU CCR6 – Credit derivatives exposures ................................................................................................................................................... 102Economic Capital Usage for Credit Risk per Business Area ........................................................................................................................ 102EU MR1 – Market risk under the standardized approach ............................................................................................................................ 103EU MR2-A – Market Risk under the internal models approach (IMA) .......................................................................................................... 104EU MR2-B – RWA flow statements of market risk exposures under the IMA ............................................................................................... 104Economic Capital Usage of Nontrading Portfolios by Business Division ...................................................................................................... 105Value-at-Risk of our Trading Units by Risk Type ......................................................................................................................................... 112Average, Maximum and Minimum Stressed Value-at-Risk by Risk Type ..................................................................................................... 112Average, Maximum and Minimum Incremental Risk Charge of Trading Units (with a 99.9 % confidence level and one-year capitalhorizon)1,2,3, ................................................................................................................................................................................................ 112Average, Maximum and Minimum Comprehensive Risk Measure of Trading Units (with a 99.9 % confidence level and one-year capitalhorizon)1,2,3 ................................................................................................................................................................................................ 113EU MR3 – IMA values for trading portfolios ................................................................................................................................................ 113Operational Risk Losses by Event Type (Profit and Loss view) ................................................................................................................... 116Operational Losses by Event Type occurred in the period 2017 (2012-2016) .............................................................................................. 116Economic Capital Usage for Operational Risk by Business Division............................................................................................................ 117Equity Investments According to IFRS Classification .................................................................................................................................. 119Realized Gains (Losses) in the Reporting Period and Unrealized Gains (Losses) at Year-end from Equity Investments .............................. 120Outstanding Exposures Securitized by Exposure Type (Overall Pool Size) within the Banking Book ........................................................... 128Outstanding Exposures Securitized by Exposure Type (Overall Pool Size) within the Trading Book ............................................................ 128Securitization Positions Retained or Purchased by Exposure Type ............................................................................................................. 129Securitization Positions Retained or Purchased by Region (Exposure Amount) .......................................................................................... 130Outstanding Exposures Awaiting Securitization (Exposure Amount) ........................................................................................................... 131Securitization Activity – Total Outstanding Exposures Securitized (i.e., the underlying pools) by Exposure Type within the Banking Book... 131Securitization Activity – Total Outstanding Exposures Securitized by Exposure Type within the Trading Book ............................................ 132Banking Book Securitization Positions Retained or Purchased by Risk Weight Band .................................................................................. 133Banking Book Securitization Positions Retained or Purchased by Risk Weight Bands subject to the IRBA-Rating Based Approach (RBA) . 133Banking Book Securitization Positions Retained or Purchased by Risk Weight Band subject to the IRBA-Supervisory Formula Approach (SFA) .................................................................................................................................................................................................................. 134Banking Book Securitization Positions Retained or Purchased by Risk Weight Band subject to the Credit Risk Standardized Approach (CRSA) .................................................................................................................................................................................................................. 134Trading Book Securitization Positions Retained or Purchased by Risk Weight Band subject to the Market Risk Standardized Approach(MRSA) ...................................................................................................................................................................................................... 135Re-Securitization Positions Retained or Purchased (Exposure Amount) ..................................................................................................... 135Impaired and Past Due Exposures Securitized and Losses Recognized by Exposure Type (Overall Pool Size) as Originator ..................... 136Summary reconciliation of accounting assets and leverage ratio exposures................................................................................................ 138Leverage ratio common disclosure ............................................................................................................................................................. 138Breakdown of on-balance sheet exposures (excluding derivatives and SFTs) ............................................................................................. 139Encumbered and unencumbered assets .................................................................................................................................................... 141Collateral received ..................................................................................................................................................................................... 141Encumbered assets/collateral received and associated liabilities ................................................................................................................ 142EU LIQ1 - LCR disclosure template ............................................................................................................................................................ 144Economic Capital Usage for Business Risk by Business Division ............................................................................................................... 145


![ww.ssc.f.net ! z0120-417 -449 URL ... · ww.ssc.f.net ! z0120-417 -449 URL 7-802-0077 E]](https://static.fdocuments.in/doc/165x107/5f7a35ad77a2f0185f3d13f5/wwsscfnet-z0120-417-449-url-wwsscfnet-z0120-417-449-url-7-802-0077.jpg)