Pillar 3 Mid-Year Disclosures (OCBC Group As at 30 June … and regulatory disclosures... · Pillar...
17
Oversea-Chinese Banking Corporation Limited Pillar 3 Mid-Year Disclosures (OCBC Group – As at 30 June 2015) Incorporated in Singapore Company Registration Number: 193200032W
Transcript of Pillar 3 Mid-Year Disclosures (OCBC Group As at 30 June … and regulatory disclosures... · Pillar...
Oversea-Chinese Banking Corporation Limited
Pillar 3 Mid-Year Disclosures (OCBC Group – As at 30 June 2015)
Incorporated in Singapore
Company Registration Number: 193200032W
Pillar 3 Disclosures June 2015 2
1. INTRODUCTION
The purpose of this document is to provide the information in accordance with Pillar 3 directives under
Monetary Authority of Singapore (“MAS”) Notice 637 on Risk Based Capital Adequacy Requirements
for banks incorporated in Singapore. MAS Notice 637 mandates a minimum level of public disclosures
to be made available to market participants to assist them in assessing the capital adequacy and risk
profile of a bank.
For qualitative descriptions of the Group’s capital and risk management objectives and policies, and
disclosures on remuneration, please refer to the Capital Management, Risk Management and
Corporate Governance sections of the 2014 Annual Report.
2. ACCOUNTING AND REGULATORY CONSOLIDATION
The consolidation basis used for regulatory capital computation is similar to that used for financial
reporting except for the following:
Subsidiaries that carry out insurance business are excluded from regulatory consolidation and are treated as investments in major stake companies. The regulatory adjustments applied to these investments are in accordance to MAS Notice 637 paragraphs 6.1.3(p), 6.2.3(e) and 6.3.3(e).
As at 30 June 2015, the subsidiaries that carry out insurance business are as follows: The Great Eastern Life Assurance Company Limited and its insurance entities The Overseas Assurance Corporation Limited and its insurance entities
As at 30 June 2015, the total equity of these insurance subsidiaries was S$6b and total
assets were S$63b.
The basis of consolidation for financial reporting can be found in Note 2.2 in the Notes to the Financial Statements for the year ended 31 December 2014.
3. CAPITAL ADEQUACY
Disclosures on the Group’s capital adequacy ratios and the capital positions for the Group’s
significant banking subsidiaries as at 30 June 2015 are presented in the Capital Adequacy Ratios
section of the Second Quarter 2015 Financial Results. (http://www.ocbc.com/group/investors/index.html)
Disclosures on the composition of the Group’s regulatory capital, including reconciliation between
balance sheet and regulatory capital elements, as well as terms and conditions and main features of
capital instruments can be found under the Capital and Regulatory Disclosures sections of the Bank’s
investor relations website. (http:/www.ocbc.com/group/investors/Cap_and_Reg_Disclosures.html)

Pillar 3 Disclosures June 2015 3
4. CREDIT RISK
4.1 Maximum Exposure to Credit Risk
S$ million
Period End Average (3)
Credit risk exposure of on-balance sheet assets:
Net loans and bills receivable 207,828 (1)
206,248
Placements with and loans to banks 45,366 45,959
Government treasury bills and securities 21,728 21,415
Debt securities 21,399 21,197
Assets pledged 1,795 (2)
1,641
Others 8,843 10,066
306,959 306,526
Credit risk exposure of off-balance sheet items:
Credit commitments 100,674 101,548
Contingent liabilities 10,302 11,179
110,976 112,727
Total maximum credit risk exposure 417,935 419,253
(1)
Net of specific allowances of $342 million and portfolio allowances of $1,934 million. (2)
Assets pledged comprise net loans and bills receivable of $42 million, government treasury bills and securities of $122 million and debt securities of $1,631 million.
(3) Computed on a monthly average basis.
4.2 Geographic/Industry Distribution of Major Types of Credit Exposure
Gross Loans and Bills Receivable (1)
Analysed by Geography
S$ million
Singapore 85,547
Malaysia 28,112
Indonesia 14,462
Greater China 57,624
Other Asia Pacific 9,189
Rest of the World 15,212
Total 210,146
Distribution by geography is determined based on where the credit risk resides.
(1) Includes assets pledged of $42 million.
Pillar 3 Disclosures June 2015 4
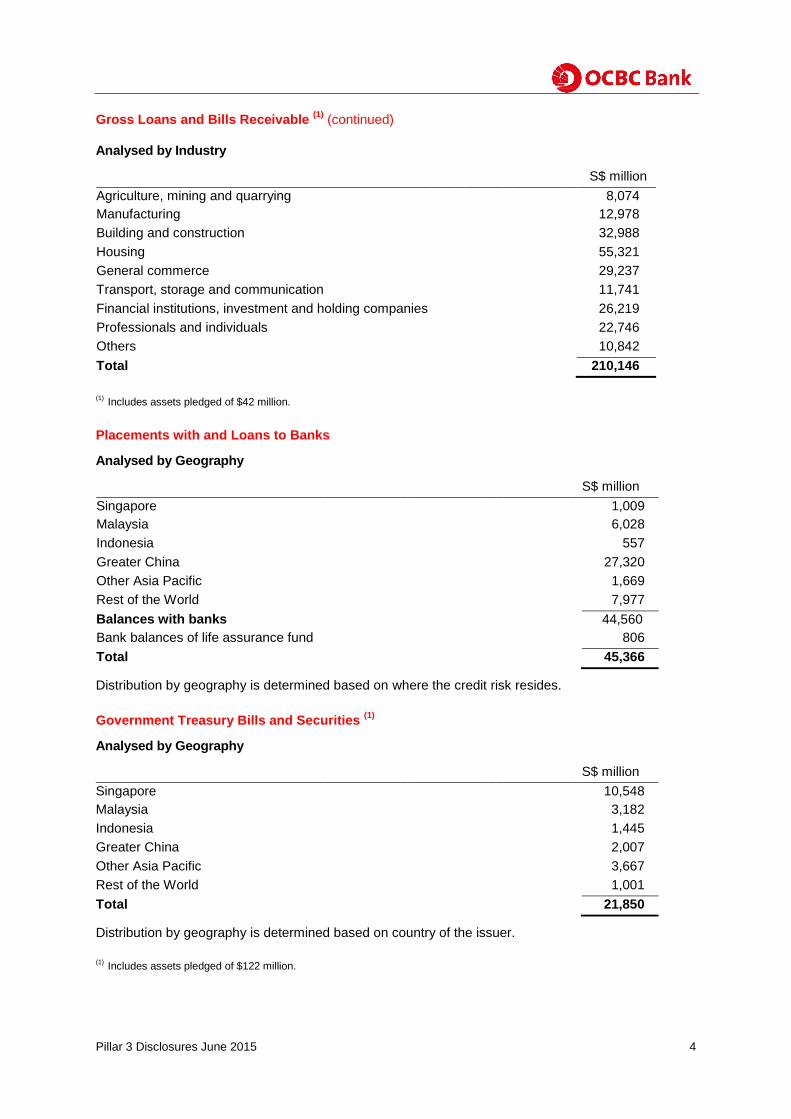
Gross Loans and Bills Receivable (1)
(continued)
Analysed by Industry
S$ million
Agriculture, mining and quarrying 8,074
Manufacturing 12,978
Building and construction 32,988
Housing 55,321
General commerce 29,237
Transport, storage and communication 11,741
Financial institutions, investment and holding companies 26,219
Professionals and individuals 22,746
Others 10,842
Total 210,146
(1)
Includes assets pledged of $42 million.
Placements with and Loans to Banks
Analysed by Geography
S$ million
Singapore 1,009
Malaysia 6,028
Indonesia 557
Greater China 27,320
Other Asia Pacific 1,669
Rest of the World 7,977
Balances with banks 44,560
44,560 Bank balances of life assurance fund 806
Total 45,366
Distribution by geography is determined based on where the credit risk resides.
Government Treasury Bills and Securities (1)
Analysed by Geography
S$ million
Singapore 10,548
Malaysia 3,182
Indonesia 1,445
Greater China 2,007
Other Asia Pacific 3,667
Rest of the World 1,001
Total 21,850
Distribution by geography is determined based on country of the issuer.
(1)
Includes assets pledged of $122 million.

Pillar 3 Disclosures June 2015 5
Debt Securities (1)
Analysed by Geography
S$ million
Singapore 3,573
Malaysia 1,864
Indonesia 997
Greater China 9,884
Other Asia Pacific 4,385
Rest of the World 2,327
Total 23,030
Distribution by geography is determined based on where the borrowers are incorporated.
Analysed by Industry
S$ million
Agriculture, mining and quarrying 1,439
Manufacturing 1,509
Building and construction 2,706
General commerce 1,074
Transport, storage and communication 1,428
Financial institutions, investment and holding companies 12,339
Others 2,535
Total 23,030
(1) Includes assets pledged of $1,631 million.
Credit Commitments
Analysed by Geography
S$ million
Singapore 73,011
Malaysia 7,368
Indonesia 3,275
Greater China 14,311
Other Asia Pacific 1,400
Rest of the World 1,309
Total 100,674
Distribution by geography is determined based on where the transactions are recorded.

Pillar 3 Disclosures June 2015 6
Credit Commitments (continued)
Analysed by Industry
S$ million
Agriculture, mining and quarrying 1,773
Manufacturing 7,236
Building and construction 8,225
General commerce 18,864
Transport, storage and communication 3,129
Financial institutions, investment and holding companies 21,924
Professionals and individuals 32,567
Others 6,956
Total 100,674
4.3 Residual Contractual Maturity of Major Types of Credit Exposure On-Balance Sheet Assets
S$ million
Within
1 week
1 week to
1 month
1 to 3
months
3 to 12
months
1 to 3
years
Over
3 years Total
Net loans and bills receivable 15,480 19,449 17,215 27,408 30,253 98,065 207,870 (1)
Placements with and loans to banks 6,634 5,330 10,374 21,837 335 50 44,560 (2)
Government treasury bills and securities 1,711 1,633 4,917 4,172 4,757 4,660 21,850 (3)
Debt securities 114 712 1,653 3,597 7,507 9,447 23,030 (4)
(1)
Includes assets pledged of $42 million. (2)
Excludes bank balances of life assurance fund. (3)
Includes assets pledged of $122 million. (4)
Includes assets pledged of $1,631 million.
Credit Commitments
S$ million
Undrawn credit facilities:
Term to maturity of one year or less 83,157
Term to maturity of more than one year 17,517
Total 100,674
Pillar 3 Disclosures June 2015 7
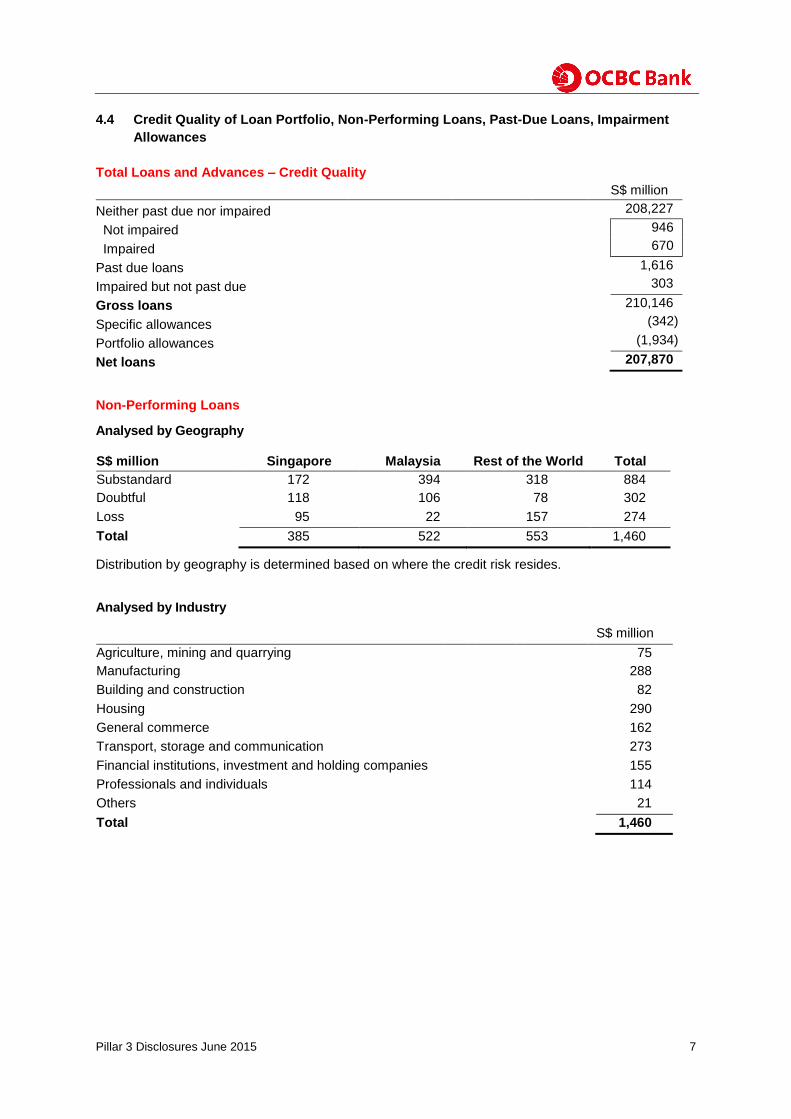
4.4 Credit Quality of Loan Portfolio, Non-Performing Loans, Past-Due Loans, Impairment
Allowances
Total Loans and Advances – Credit Quality
S$ million
Neither past due nor impaired 208,227
Not impaired 946
Impaired 670
Past due loans 1,616
Impaired but not past due 303
Gross loans 210,146
Specific allowances (342)
Portfolio allowances (1,934)
Net loans 207,870
Non-Performing Loans
Analysed by Geography
S$ million Singapore Malaysia Rest of the World Total
Substandard 172 394 318 884
Doubtful 118 106 78 302
Loss 95 22 157 274
Total 385 522 553 1,460
Distribution by geography is determined based on where the credit risk resides.
Analysed by Industry
S$ million
Agriculture, mining and quarrying 75
Manufacturing 288
Building and construction 82
Housing 290
General commerce 162
Transport, storage and communication 273
Financial institutions, investment and holding companies 155
Professionals and individuals 114
Others 21
Total 1,460
Pillar 3 Disclosures June 2015 8
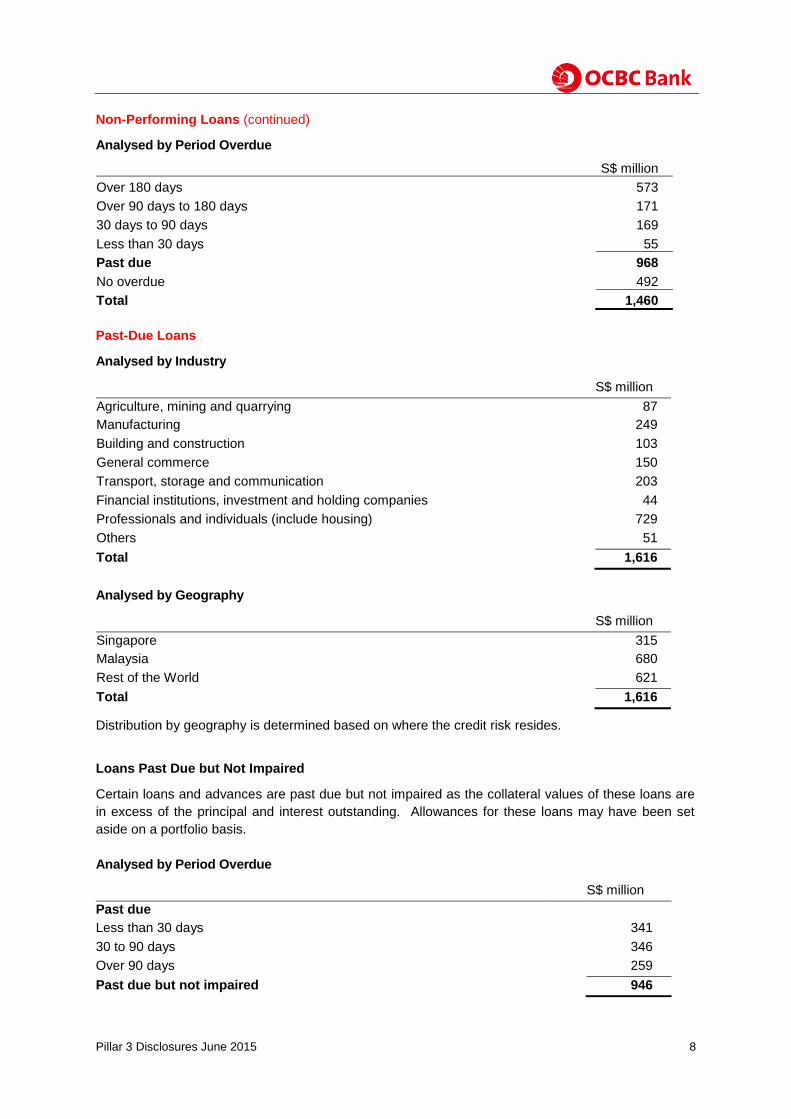
Non-Performing Loans (continued)
Analysed by Period Overdue
S$ million
Over 180 days 573
Over 90 days to 180 days 171
30 days to 90 days 169
Less than 30 days 55
Past due 968
No overdue 492
Total 1,460
Past-Due Loans
Analysed by Industry
S$ million
Agriculture, mining and quarrying 87
Manufacturing 249
Building and construction 103
General commerce 150
Transport, storage and communication 203
Financial institutions, investment and holding companies 44
Professionals and individuals (include housing) 729
Others 51
Total 1,616
Analysed by Geography
S$ million
Singapore 315
Malaysia 680
Rest of the World 621
Total 1,616
Distribution by geography is determined based on where the credit risk resides.
Loans Past Due but Not Impaired
Certain loans and advances are past due but not impaired as the collateral values of these loans are
in excess of the principal and interest outstanding. Allowances for these loans may have been set
aside on a portfolio basis.
Analysed by Period Overdue
S$ million
Past due
Less than 30 days 341
30 to 90 days 346
Over 90 days 259
Past due but not impaired 946

Pillar 3 Disclosures June 2015 9
Impairment Allowances for Loans and Bills Receivable
Analysed by Geography
S$ million
Specific
allowances
Portfolio
allowances
Singapore 79 679
Malaysia 124 398
Indonesia 40 180
Greater China 67 498
Other Asia Pacific 23 94
Rest of the World 9 85
Total 342 1,934
Distribution by geography is determined based on where the credit risk resides.
Analysed by Industry
S$ million
Cumulative specific
allowances
Specific allowances
charged/(write-back) to income
statements
Agriculture, mining and quarrying 1 (#)
Manufacturing 93 9
Building and construction 30 3
Housing 34 4
General commerce 63 25
Transport, storage and communication 24 8
Financial institutions, investment and holding companies 5 #
Professionals and individuals 75 40
Others 17 3
Total 342 92
# represents amounts less than $0.5 million.

Pillar 3 Disclosures June 2015 10
Impairment Allowances for Loans and Bills Receivable (continued)
Reconciliation of Changes in Impairment Allowances
S$ million Specific
Allowances
At 1 January 2015 332
Currency translation (9)
Bad debts written off (69)
Recovery of amounts previously provided for (21)
Allowances for loans 113
Net allowances charged to income statements 92 Interest recognition on impaired loans (4)
At 30 June 2015 342
S$ million
Portfolio
Allowances
At 1 January 2015 1,897
Currency translation (16)
Allowances charged to income statements 53
At 30 June 2015 1,934
KEY PARAMETERS USED TO QUANTIFY CREDIT RISK
1. What is the probability of an obligor going into default?
2. What is our exposure in the event of a default?
3. How much of the exposure amount should we expect to lose?
Probability of Default
Exposure at Default
Loss Given Default
PD (%)
EAD
LGD (%)
=
=
=
Pillar 3 Disclosures June 2015 11
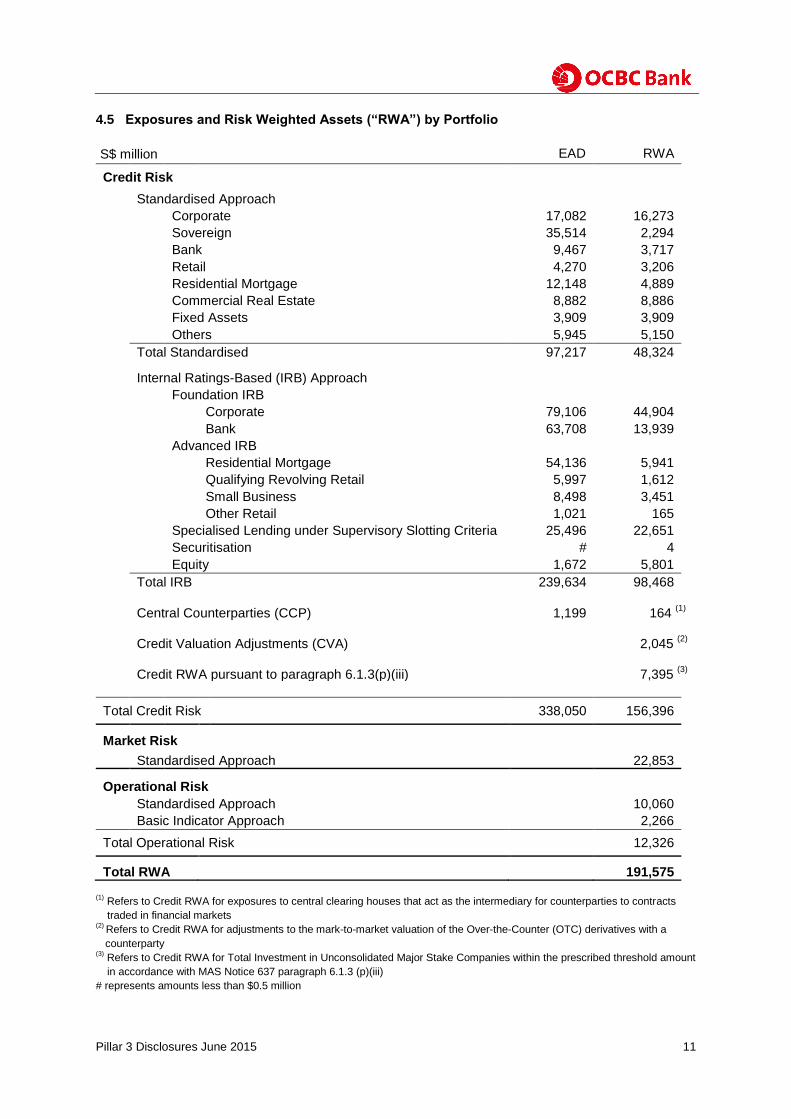
4.5 Exposures and Risk Weighted Assets (“RWA”) by Portfolio
EAD RWA
Credit Risk
Standardised Approach
Corporate 17,082 16,273
Sovereign 35,514 2,294
Bank 9,467 3,717
Retail 4,270 3,206
Residential Mortgage 12,148 4,889
Commercial Real Estate 8,882 8,886
Fixed Assets 3,909 3,909
Others 5,945 5,150
Total Standardised 97,217 48,324
Internal Ratings-Based (IRB) Approach
Foundation IRB
Corporate 79,106 44,904
Bank 63,708 13,939
Advanced IRB
Residential Mortgage 54,136 5,941
Qualifying Revolving Retail 5,997 1,612
Small Business 8,498 3,451
Other Retail 1,021 165
Specialised Lending under Supervisory Slotting Criteria 25,496 22,651
Securitisation # 4
Equity 1,672 5,801
Total IRB
239,634 98,468
Central Counterparties (CCP) Credit Valuation Adjustments (CVA)
1,199
164 (1)
2,045 (2)
Credit RWA pursuant to paragraph 6.1.3(p)(iii)
7,395
(3)
Total Credit Risk 338,050 156,396
Market Risk
Standardised Approach 22,853
Operational Risk
Standardised Approach
10,060
Basic Indicator Approach 2,266
Total Operational Risk 12,326
Total RWA 191,575 (1)
Refers to Credit RWA for exposures to central clearing houses that act as the intermediary for counterparties to contracts
traded in financial markets (2)
Refers to Credit RWA for adjustments to the mark-to-market valuation of the Over-the-Counter (OTC) derivatives with a
counterparty (3)
Refers to Credit RWA for Total Investment in Unconsolidated Major Stake Companies within the prescribed threshold amount
in accordance with MAS Notice 637 paragraph 6.1.3 (p)(iii)
# represents amounts less than $0.5 million
S$ million

Pillar 3 Disclosures June 2015 12
4.6 Credit Exposures under Standardised Approach
Credit exposures under the standardised approach comprise mainly exposures to sovereigns,
exposures from major subsidiaries such as OCBC Wing Hang, OCBC NISP and Bank of Singapore,
as well as fixed assets. Rated exposures relate mainly to debt securities, corporate and sovereign
portfolios while unrated exposures relate mainly to individuals and fixed assets.
4.7 Credit Exposures subject to Supervisory Risk Weights under Internal Ratings-Based
Approach
Equity Exposures under IRB Approach
Equities for regulatory capital computation are risk weighted and/or deducted from capital in
accordance with MAS Notice 637 under IRB Approach. Equity exposures of S$6 million have been
deducted from regulatory capital.
EAD RWA
Risk Weight S$ million S$ million
0% 33,414 -
10% - 40% 15,422 4,727
50% - 99% 12,053 7,232
100% 36,263 36,264
>100% 65 101
Total 97,217 48,324
Rated exposures 53,264 14,391
Unrated exposures 43,953 33,933
IRB Approach
S$ million S$ million
Listed securities 1,220 318% - -
Other equity holdings 315 424% 137 430%
Total 1,535 340% 137 430%
EADAverage Risk
Weight
%
EADAverage Risk
Weight
%
(SRW) (PD/LGD)

Pillar 3 Disclosures June 2015 13
Specialised Lending Exposures under Supervisory Slotting Criteria
Specialised lending exposures include financing of income-producing real estate as well as project,
object and commodity finance.
4.8 Credit Exposures under Foundation Internal Ratings-Based Approach (F-IRBA)
Corporate exposures are mainly exposures to corporate and institutional customers as well as major
non-bank financial institutions. Bank exposures are exposures to banks and eligible public sector
entities.
Corporate Exposures
Bank Exposures
EAD Average
S$ million Risk Weight
Strong 6,190 62%
Good 13,092 84%
Satisfactory 5,724 122%
Weak 302 265%
Default 188 NA
Total 25,496 89%
EAD Average
PD Range S$ million Risk Weight
up to 0.05% 13,440 17%
> 0.05 to 0.5% 32,332 44%
> 0.5 to 2.5% 25,945 77%
> 2.5 to 9% 5,807 126%
> 9% 895 145%
Default 687 NA
Total 79,106 57%
EAD Average
PD Range S$ million Risk Weight
up to 0.05% 39,584 11%
> 0.05 to 0.5% 19,672 34%
> 0.5 to 2.5% 4,169 63%
> 2.5 to 9% 245 114%
> 9% 38 184%
Default # NA
Total 63,708 22%
# represents amounts less than $0.5 million
Pillar 3 Disclosures June 2015 14
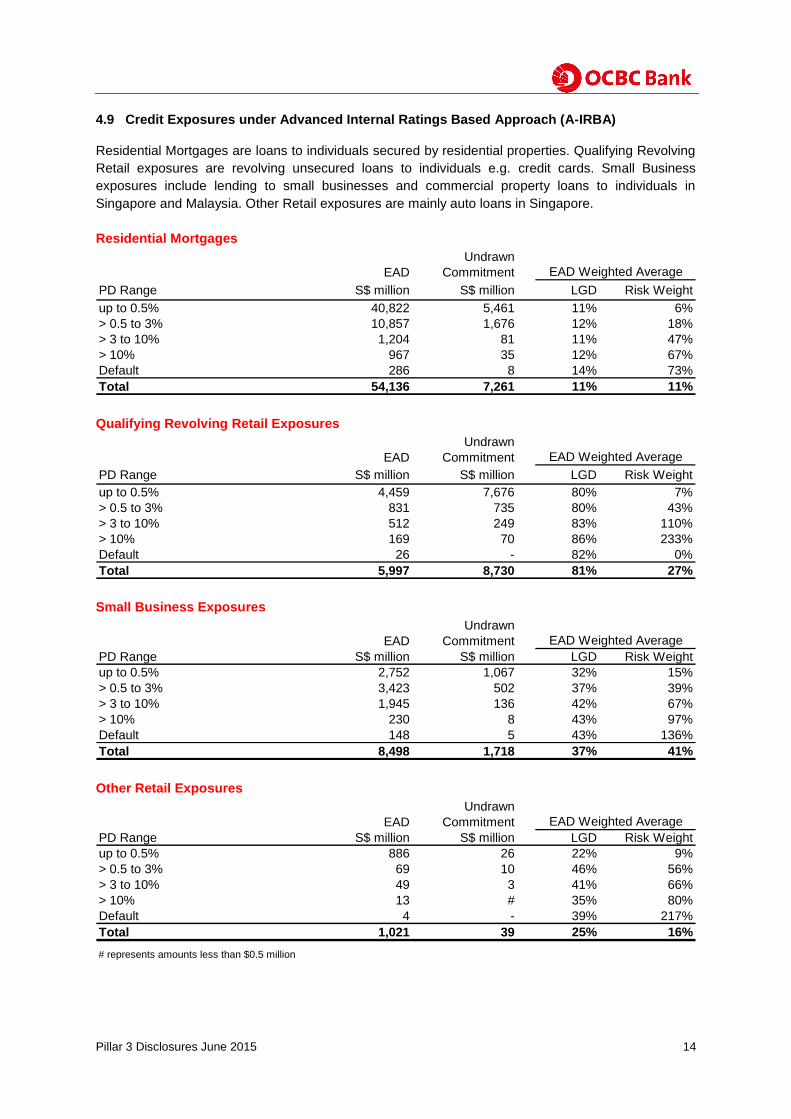
4.9 Credit Exposures under Advanced Internal Ratings Based Approach (A-IRBA)
Residential Mortgages are loans to individuals secured by residential properties. Qualifying Revolving
Retail exposures are revolving unsecured loans to individuals e.g. credit cards. Small Business
exposures include lending to small businesses and commercial property loans to individuals in
Singapore and Malaysia. Other Retail exposures are mainly auto loans in Singapore.
Residential Mortgages
Qualifying Revolving Retail Exposures
Small Business Exposures
Other Retail Exposures
Undrawn
EAD Commitment
PD Range S$ million S$ million LGD Risk Weight
up to 0.5% 40,822 5,461 11% 6%
> 0.5 to 3% 10,857 1,676 12% 18%
> 3 to 10% 1,204 81 11% 47%
> 10% 967 35 12% 67%
Default 286 8 14% 73%
Total 54,136 7,261 11% 11%
EAD Weighted Average
Undrawn
EAD Commitment
PD Range S$ million S$ million LGD Risk Weight
up to 0.5% 4,459 7,676 80% 7%
> 0.5 to 3% 831 735 80% 43%
> 3 to 10% 512 249 83% 110%
> 10% 169 70 86% 233%
Default 26 - 82% 0%
Total 5,997 8,730 81% 27%
EAD Weighted Average
Undrawn
EAD Commitment
PD Range S$ million S$ million LGD Risk Weight
up to 0.5% 2,752 1,067 32% 15%
> 0.5 to 3% 3,423 502 37% 39%
> 3 to 10% 1,945 136 42% 67%
> 10% 230 8 43% 97%
Default 148 5 43% 136%
Total 8,498 1,718 37% 41%
EAD Weighted Average
Undrawn
EAD Commitment
PD Range S$ million S$ million LGD Risk Weight
up to 0.5% 886 26 22% 9%
> 0.5 to 3% 69 10 46% 56%
> 3 to 10% 49 3 41% 66%
> 10% 13 # 35% 80%
Default 4 - 39% 217%
Total 1,021 39 25% 16%
# represents amounts less than $0.5 million
EAD Weighted Average
Pillar 3 Disclosures June 2015 15
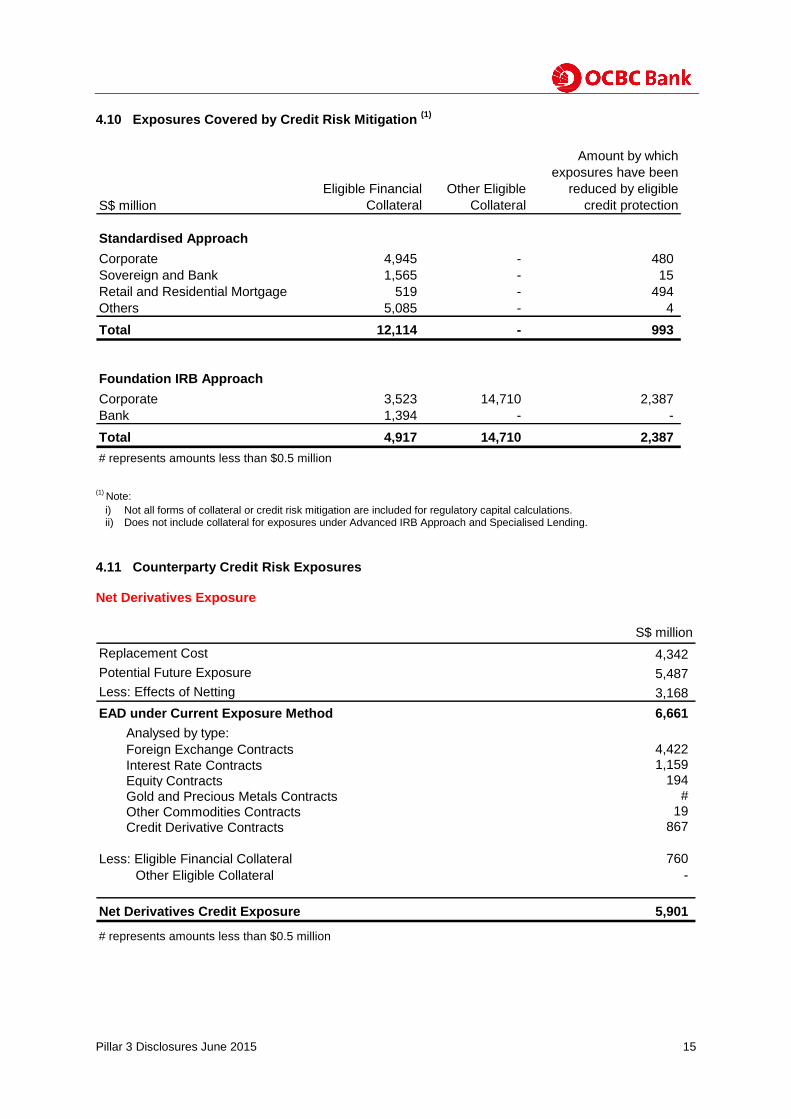
4.10 Exposures Covered by Credit Risk Mitigation (1)
(1) Note:
i) Not all forms of collateral or credit risk mitigation are included for regulatory capital calculations. ii) Does not include collateral for exposures under Advanced IRB Approach and Specialised Lending.
4.11 Counterparty Credit Risk Exposures Net Derivatives Exposure
Eligible Financial
Collateral
Other Eligible
Collateral
Amount by which
exposures have been
reduced by eligible
credit protection
Standardised Approach
Corporate 4,945 - 480
Sovereign and Bank 1,565 - 15
Retail and Residential Mortgage 519 - 494
Others 5,085 - 4
Total 12,114 - 993
Foundation IRB Approach
Corporate 3,523 14,710 2,387
Bank 1,394 - -
Total 4,917 14,710 2,387
# represents amounts less than $0.5 million
S$ million
S$ million
Replacement Cost 4,342
Potential Future Exposure 5,487
Less: Effects of Netting 3,168
EAD under Current Exposure Method 6,661
Analysed by type:
Foreign Exchange Contracts 4,422
Interest Rate Contracts 1,159
Equity Contracts 194
Gold and Precious Metals Contracts #
Other Commodities Contracts 19
Credit Derivative Contracts 867
Less: Eligible Financial Collateral 760
Other Eligible Collateral -
Net Derivatives Credit Exposure 5,901
# represents amounts less than $0.5 million
Pillar 3 Disclosures June 2015 16
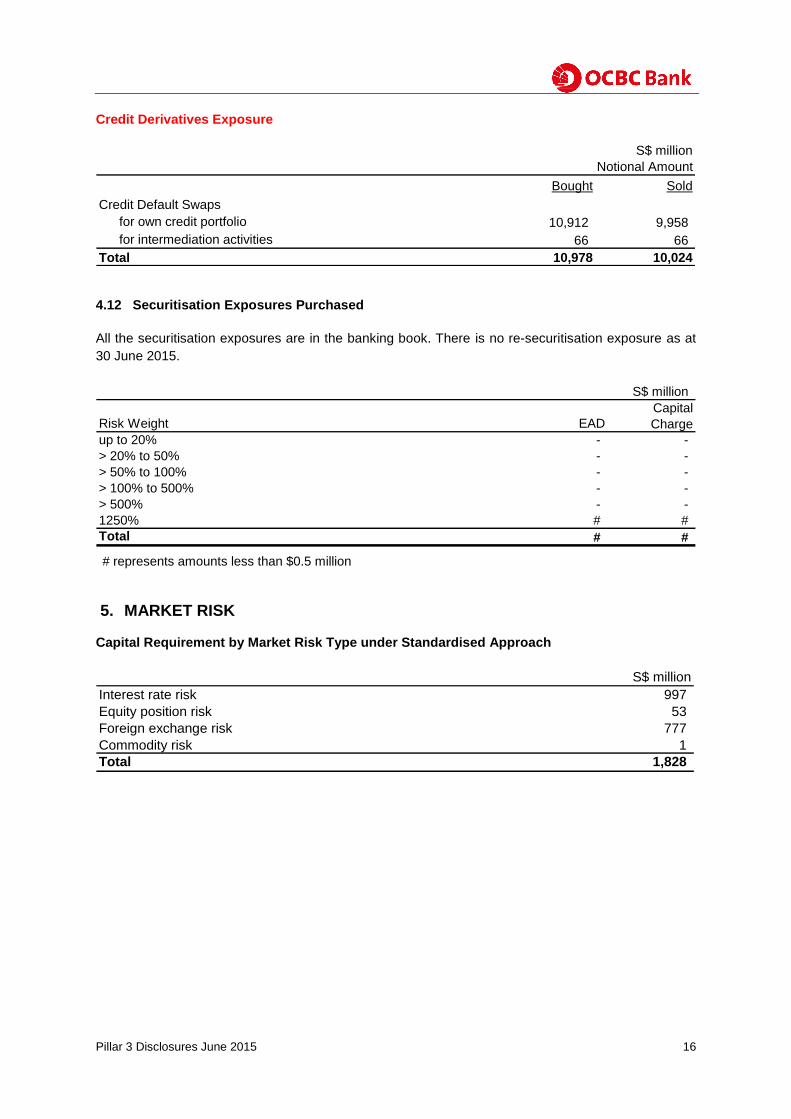
Credit Derivatives Exposure
4.12 Securitisation Exposures Purchased
All the securitisation exposures are in the banking book. There is no re-securitisation exposure as at
30 June 2015.
5. MARKET RISK
Capital Requirement by Market Risk Type under Standardised Approach
Bought Sold
Credit Default Swaps
for own credit portfolio 10,912 9,958
for intermediation activities 66 66
Total 10,978 10,024
Notional Amount
S$ million
S$ million
Risk Weight EAD
Capital
Charge
up to 20% - -
> 20% to 50% - -
> 50% to 100% - -
> 100% to 500% - -
> 500% - -
1250% # #
Total # #
# represents amounts less than $0.5 million
S$ million
Interest rate risk 997
Equity position risk 53
Foreign exchange risk 777
Commodity risk 1
Total 1,828

Pillar 3 Disclosures June 2015 17
6. EQUITY EXPOSURES IN BANKING BOOK
Disclosures on valuation and accounting treatment of equity holdings can be found in Notes 2.2.3,
2.6.2 and 2.23.3 in the Notes to the Financial Statements of the 2014 Annual Report.
Equity exposures comprise equity securities categorised as “Available-for-sale” (AFS) and
investments in associates and joint ventures. AFS securities are carried at fair value in the balance
sheet of the Group while investments in associates and joint ventures are carried at cost and
adjusted for post-acquisition changes of the Group’s share of the net assets of the associates and
joint ventures.
Equity exposures categorised and measured in accordance with Singapore Financial Reporting
Standards differ from the regulatory definition under MAS Notice 637 in the following key areas:
1. Equity investments held by insurance subsidiaries (included below) are not consolidated for
regulatory computation.
2. Debt instruments approved for inclusion as Tier 1 capital are treated as equity exposures
under MAS Notice 637.
Carrying Value of Equity Exposures
Realised and Unrealised Gains and Losses
7. INTEREST RATE RISK IN THE BANKING BOOK
A description of the nature of interest rate risk in the banking book and key assumptions made by the
Group can be found in Note 39.3 in the Notes to the Financial Statements of the 2014 Annual Report.
Based on a 100 bp parallel rise in yield curves on the Group's exposure to major currencies i.e.
Singapore Dollar, US Dollar, Hong Kong Dollar and Malaysian Ringgit, net interest income is estimated to
increase by $590 million. The corresponding impact from a 100 bp decrease is an estimated reduction of
$415 million in net interest income. As a percentage of reported net interest income (on an annualised
basis), the maximum exposure for the four major currencies is estimated to be approximately -8.1%.
S$ million
Quoted equity exposure - AFS 1,745
Unquoted equity exposure - AFS 893
Quoted equity exposure - Associates 1,593
Unquoted equity exposure - Associates 504
Total 4,735
S$ million
Gains/(losses) from disposal of AFS equities 180
Unrealised gains included in fair value reserve 385
Total 565