
Pile Setup research and Practice LCECS 2017€“ Brinch Hansen – Chin ... formula 0.10 or 0.40...
64
LADOTD Pile Setup Research and Practice Ching Tsai, Ph.D., P.E. Megan Bourgeois, P.E. Ardaman & Associates, Inc.
Transcript of Pile Setup research and Practice LCECS 2017€“ Brinch Hansen – Chin ... formula 0.10 or 0.40...

LADOTD Pile Setup Research andPractice
Ching Tsai, Ph.D., P.E.
Megan Bourgeois, P.E.
Ardaman & Associates, Inc.

Bridge Foundations in Louisiana
• Concrete
– Prestressed precast piles• Majority of the bridges
– Spun cast cylinder piles
– Large Cassions• Very few
• Timber piles– legacy oroff-system bridges
• Steel
– H piles
– Pipe piles
– Insignificant numbers
• Drilled Shafts

Design Considerations for Driven Piles
• Capacity
• Settlement/Deformation
• Vibration/Noise
• Constructability

Pile Capacity
• Static pile capacity calculation methods– 20+ widely used methods
– downdrag
• Factors affecting capacity measurement– Loading method
– Load duration
– Monotonic or cyclic loading
– Failure criteria
– Time of loading
• Pile Capacity?

5
20MN Static Load Test

Effect of Test Method
Static and Statnamic Load Tests on Stone Columns
0.0
0.2
0.4
0.6
0.8
1.0
1.2
1.4
0 200 400 600 800
Load (kips)
Dis
pla
cem
en
t(i
n)
Static Tests, Multiple Cycles
Raw Statnamic
Statnamic withInertia removed
0
5
10
15
20
25
30
0 100 200 300Load (kN)
Se
ttle
ment(m
m)
STN Derived Static
Static with holds removed
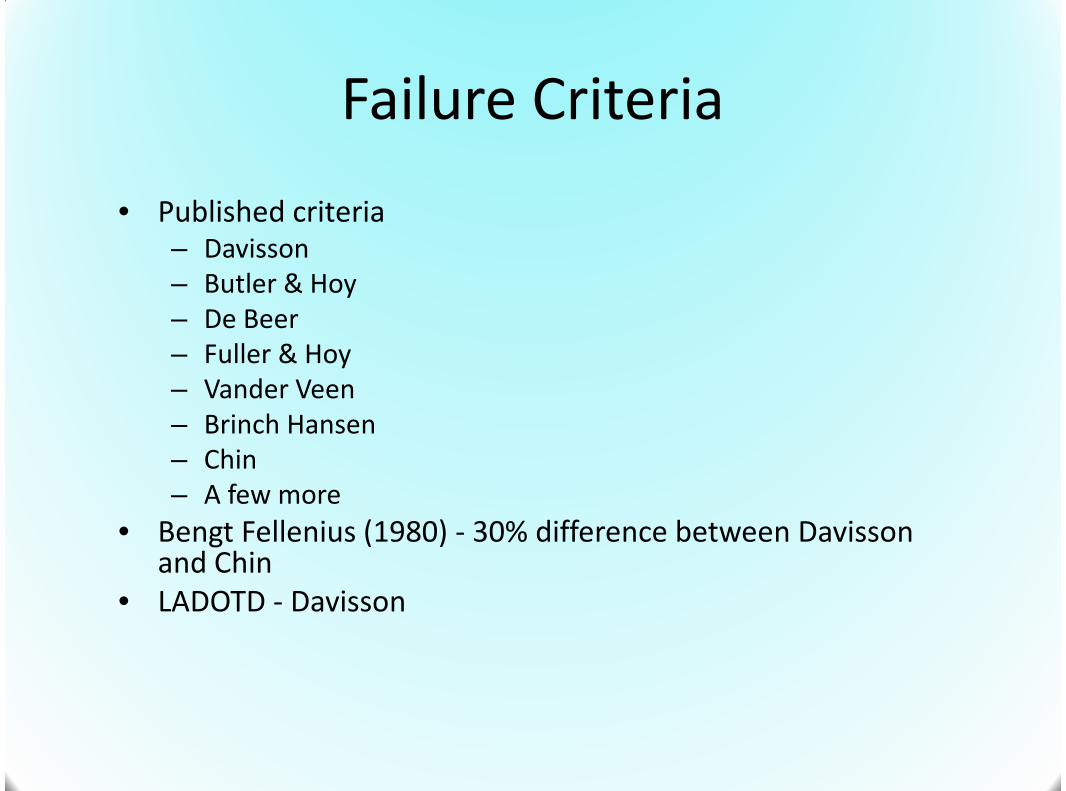
Failure Criteria
• Published criteria– Davisson– Butler & Hoy– De Beer– Fuller & Hoy– Vander Veen– Brinch Hansen– Chin– A few more
• Bengt Fellenius (1980) - 30% difference between Davissonand Chin
• LADOTD - Davisson

Two Takeaways
• Ultimate pile capacity is a value that is difficult todefine
• Geotechnical engineers can provide an estimate ofusable resistances for a specific design limit state andcondition.

LET’S CONCENTRATE ON TIMECOMPONENT

Time Effect on Pile Resistance
• Behavior is known since1950s– Some suggested 10X EOD
resistance
• How to evaluate time effect?>10 published models
• How to incorporate time inLRFD foundation design?
• How comfortable are we indesigning a pile withoutverification?
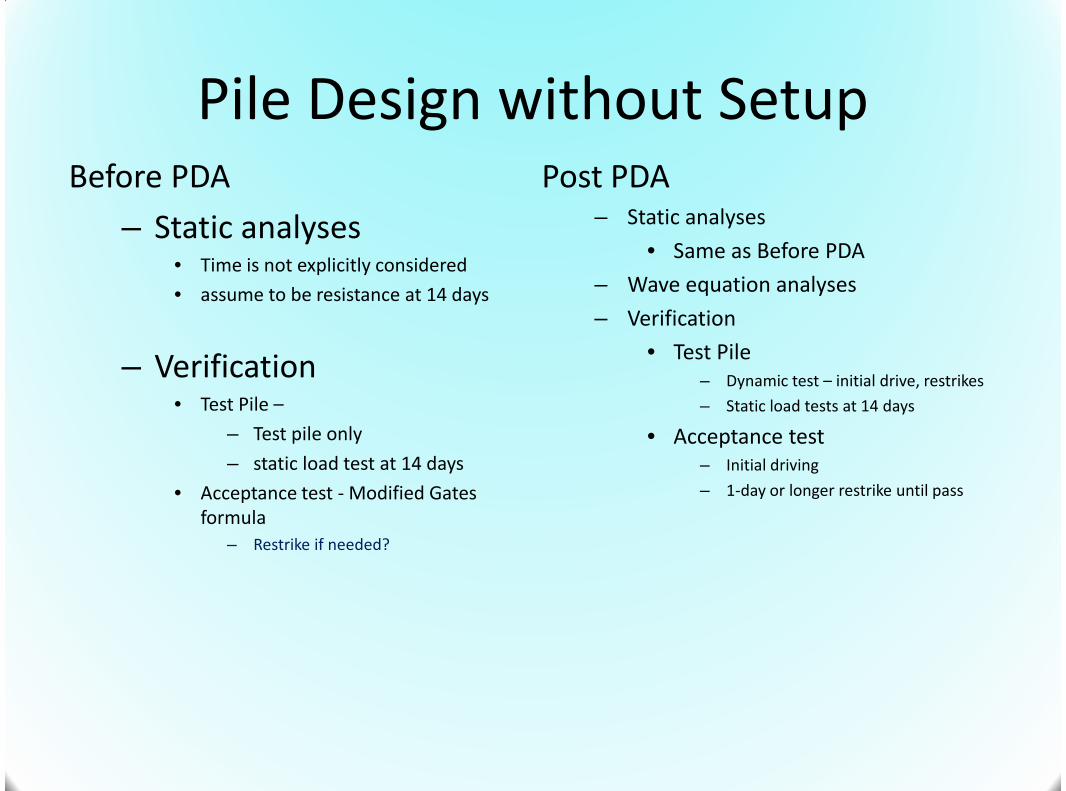
Pile Design without SetupBefore PDA
– Static analyses• Time is not explicitly considered
• assume to be resistance at 14 days
– Verification• Test Pile –
– Test pile only
– static load test at 14 days
• Acceptance test - Modified Gatesformula
– Restrike if needed?
Post PDA– Static analyses
• Same as Before PDA
– Wave equation analyses
– Verification
• Test Pile– Dynamic test – initial drive, restrikes
– Static load tests at 14 days
• Acceptance test– Initial driving
– 1-day or longer restrike until pass

Pile Design with Setup
• Design– What is the criteria for time selection?
– What resistance factor/safety factor?
• Testing– Testing time?
– Establish site specific set-up model
– Extrapolation!
• Acceptance– When to test?
– What ifs?
• Others– Foundation reuse

LADOTD Research

Early Research Effort
• Tavera and Wathugala (1999) – Bayou Boeuf BridgeExtension– Multiple O-cell load tests on same pile for 2 years
– No formal report issued
• Titi and Wathugala (1999) – Numerical modeling

Recent Research
• LA Tech – Dr. Jay Wang (2009-2011)
– Phase I – paper study
– Proposed “growth” model
• LSU/LTRC – Dr. Murad Abu-Farsakh (after2011)
– Phase II – includes test piles
– Adopted “Skov-Denver” model

Growth ModelDr. Jay Wang (2011) Louisiana Tech U
– Based on whole pile resistance
– Assumes long-term ultimate resistance exists
– Requires multiple tests to establish site specific model
– Not user friendly

Adopted Model – Skov-Denver
� ��
• A (whole pile) – rateconstant for clay or sand
• - reference time– Clay -1 day– Sand - 0.5 day
• - pile resistance at
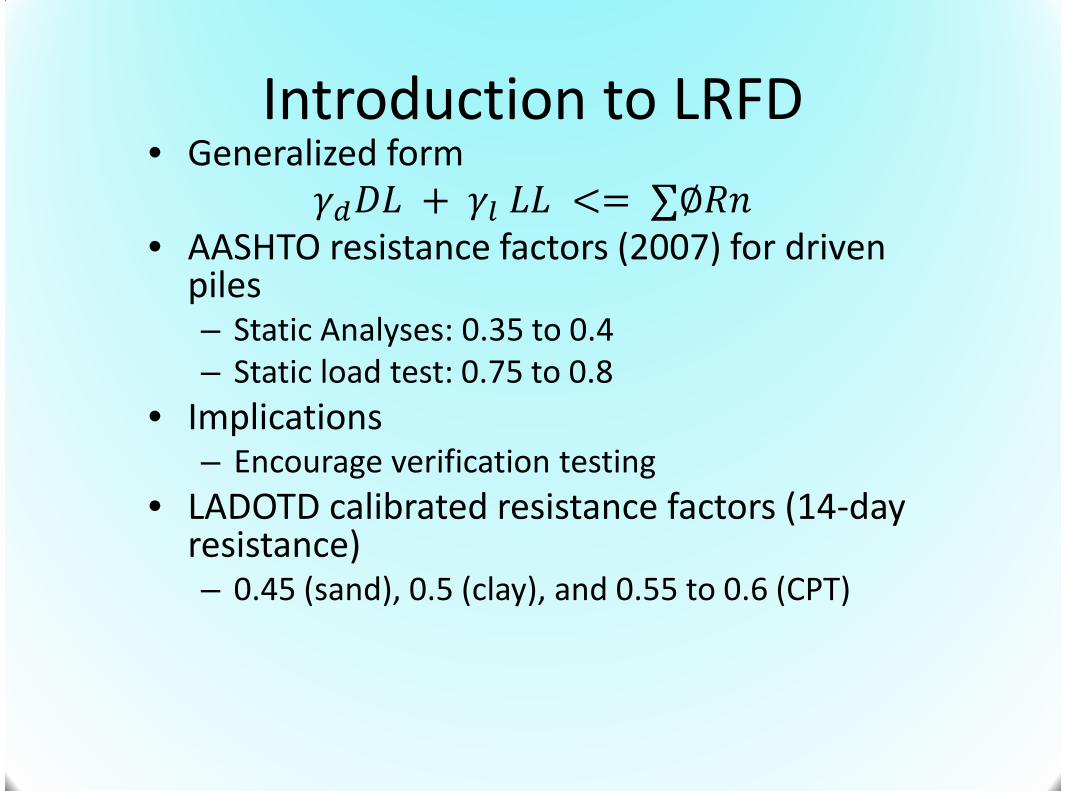
Introduction to LRFD• Generalized form
• AASHTO resistance factors (2007) for drivenpiles– Static Analyses: 0.35 to 0.4– Static load test: 0.75 to 0.8
• Implications– Encourage verification testing
• LADOTD calibrated resistance factors (14-dayresistance)– 0.45 (sand), 0.5 (clay), and 0.55 to 0.6 (CPT)

Static Analysis Methods
• Primary use is for pile length estimationfor contract drawings and feasibility.
• Secondary use for estimation ofdowndrag, uplift resistance and scoureffects
• Should rarely be used as sole means ofdetermining pile resistance. ONLY INSPECIAL SITUATIONS.
19Jerry DiMaggio – Professor’sDeep Foundation Training

Pile Testing Methods
AnalysisMethod
ResistanceFactor
(f)(AASHTO 2010)
Factor ofSafety
(FS)
Estimated Measured
Cap
acity
Stress
Ene
rgy
Cap
acity
Stress
Ene
rgy
Dynamicformula
0.10 or 0.40 3.50 X
Waveequation
0.50 2.75 X X X
Dynamictesting
0.65 or 0.75 2.25 X X X
Static loadtest
0.75 to 0.80 2.00 X
Jerry DiMaggio – Professor’sDeep Foundation Training

AASHTO(Article 10.7.3.4)Setup Relaxation
RP
RS
RP
RS
RP
RS
RP
RS
21Jerry DiMaggio – Professor’sDeep Foundation Training

LRFD Pile Design Recap• Requires “calibrated” resistance factors
• AASHTO’s resistance factors are not for anyspecific setup time
• LADOTD’s resistance factors are based on 14-day resistances
• AASHTO LRFD BDM has discussions on timeeffect but leaves out how to incorporate intodesign
• Need resistance factors for t ≠ 14 days

Current DOTD Pile Testing Practice• Test pile
– Driven in advance of the permanentpiles
– Load tested– Dynamic testing is typically done as
well
• Indicator pile– Same as test pile– Dynamic testing only
• Monitoring pile– Permanent pile with dynamic
monitoring
• Dynamic test– Initial driving– Restrike at 24 hours– After static load test, if needed
• Static load test– 14 days after installation

Match actual behavior
Easy to use
Conforms to or requires little change to currentpractices
Criteria in Selecting a Setup Model

Improvement to Original ModelCompleted
• Mixed soil conditions– Breakup model into
layers– Parametric study to
simplify analyses• Set-up rate factor A=f(PI,
Su)
Ongoing and Future
• Time effect of set-up ratefactor (A)
• Verifications
• Resistance factors for pileresistance at various setuptimes
Dr. Murad Abu-Farsakh
�
��
Whole pile only
A is t0 dependent
Arbitrary t0

Case Histories
• LA-1 (Phase 1)
– Design in 2003
– Construction 2006-2011
• McArthur Drive (Phase 1)
– Construction 2015-2016

LA-1 Project Summary
• 18-mile corridor inLafourche Parish, LA
• Connects GoldenMeadow, LA to PortFourchon and LOOP oilfacilities
LA-1 Project Vicinity Map
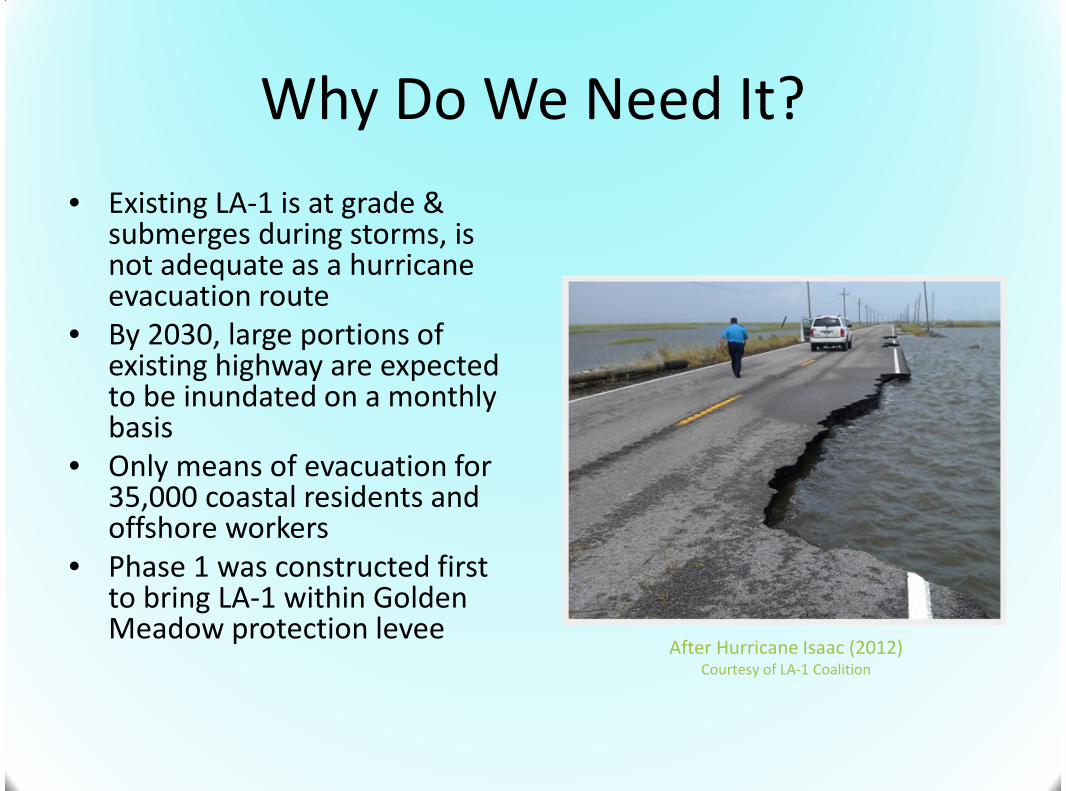
• Existing LA-1 is at grade &submerges during storms, isnot adequate as a hurricaneevacuation route
• By 2030, large portions ofexisting highway are expectedto be inundated on a monthlybasis
• Only means of evacuation for35,000 coastal residents andoffshore workers
• Phase 1 was constructed firstto bring LA-1 within GoldenMeadow protection levee
Why Do We Need It?
After Hurricane Isaac (2012)Courtesy of LA-1 Coalition

• A new high-level bridgewas needed to replacedrawbridge over BayouLafourche
• LA-1 supports 18% of thenation’s total oil and gassupply
• Per D.H.S., a 90-dayclosure of access to PortFourchon could yield a$7.8-billion loss in annualGDP
Why Do We Need It?
LA-1 Project Alignment: Phases 1 & 2

Phase 1 Construction
• Construction began 2006,completed 2011
• 8 miles of elevated highway,connectors, and a high-levelbridge
• Almost 300 borings & CPTsoundings made
• 17 test piles• 2 instrumented embankments• About 500 production piles
tested with PDA• 100 lineal miles of piles driven
Elevated Highway on Phase 1

Existing Data: Soil Borings
Soil Boring & CPT Locations

Environmentally Sensitive Area
• Disturbance to themarsh had to beminimized
• Tire & tracked vehiclesnot allowed
• Water depth generallytoo shallow forboats/barges
• Only means of accesswas an airboat
Laying Out Borings from Airboat
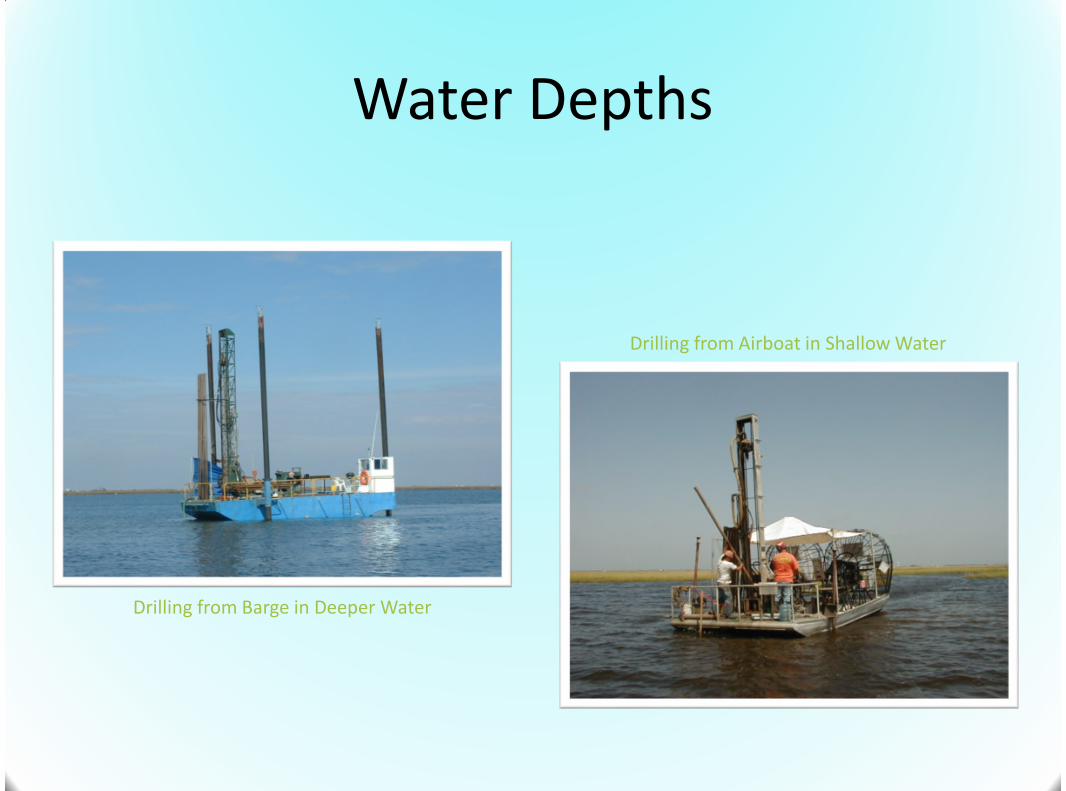
Water Depths
Drilling from Barge in Deeper Water
Drilling from Airboat in Shallow Water

Subsurface Conditions
• Delta plain deposits ofthe Holocene Age
• Consists mainly ofnormally (and under-)consolidated clays
• Surficial soils are verysoft and include somepeat
• Intermittent sand layers
Su, Lab Testing vs. CPT (Nk = 15)

End-On Construction Summary
• Phase 1B/1C wasconstructed frombarges
• No barge access for the8-mile Phase 1Aalignment
• Modified end-onconstruction used thenew bridge as aconstruction platform
Looking off the Front of the Trestle

Lead Crane
• Lead crane drovetemporary pipe piles andconstructed trestle
• Trestle consisted of a railthat supported the craneplatforms and gantrycranes
• Pipe piles were latervibrated out and“leapfrogged” back to thefront
Lead Crane Driving Temporary Piles

Pile Driving Crane
• Second crane followedwith permanent pilesand caps
• Pile driving crane sat ona platform that couldadvance along the railsystem
Pile Driving Crane and Hammer

Gantry Cranes
• Gantry cranes movedpiles and supplies to thefront of the rail
• Inner and outer railallowed the cranes topass each other
• As deck was built, it wasused to transport andstockpile supplies
Gantry Cranes and Rail System

Pile Driving
• Pile driving affected all ofthe trailing operations
• Schedule was acceleratedand problems had to besolved immediately
• Precast contingency capsaccepted 2 additionalpiles in case of damage orlow capacity Contingency Cap Design

Pile Capacity Verification
• Permanent pilessupported constructionloads
• Blow count could not beused for acceptance
• Pile acceptance could notdelay construction
• Worked with contractorto determine the mostefficient time for a PDArestrike
Permanent Piles Beneath Trestle

• 17 test piles testedbetween 2004 & 2010– 24” Sq. PPC: 12 piles– 16” Sq. PPC: 1 pile– 30” Sq. PPC: 1 pile– 54” Cyl. : 2 piles– 30” Steel Pipe: 1 pile
• About half the piles wereinstrumented
• Setup curves developed onall piles
• One lateral load test oninstrumented pile
Test Piles
Static Load Test in Progress

Test Piles
Test Pile Locations – Phase 1

• About 500 productionpiles were establishedas “monitor piles”
• Monitor piles weremonitored with PDA forinitial drive and restrike(at a minimum)
• Full driving logs takenfor all piles on theproject
Production Piles
Preparing for PDA Monitoring

• Drive test pile– Perform several restrikes
from 15-min out to 7-day
– Perform static or Statnamicload testing at 7 days
– Construct a pile setupcurve
• Drive production pile– Restrike at ≈24 hours
– Perform CAPWAP
– Compare to setup curve
– Issue acceptance
Phase 1 Verification Process
AFT’s Statnamic Load Apparatus

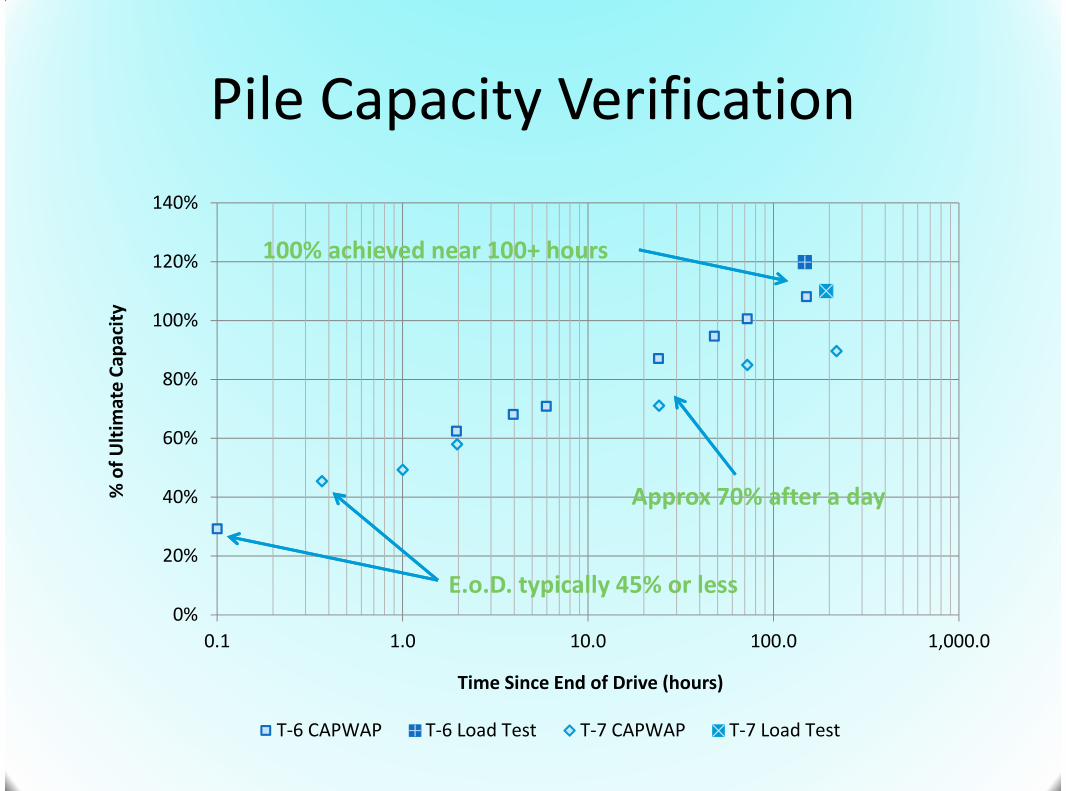
Set-up Test Results

Set-up Results and AcceptanceCriterion
• Setup rate 30% to 68%
• Average 45%
• 24-hr resistance > 65% of 14-day resistance or85% of 5-day resistance
• Acceptance - 24 hrs at 65% nominal resistance
0%
20%
40%
60%
80%
100%
120%
140%
0.1 1.0 10.0 100.0 1,000.0
%o
fU
ltim
ate
Cap
acit
y
Time Since End of Drive (hours)
T-6 CAPWAP T-6 Load Test T-7 CAPWAP T-7 Load Test
Pile Capacity Verification
E.o.D. typically 45% or less
100% achieved near 100+ hours
Approx 70% after a day

Construction Testing and ActualPerformance
• Test one pile per bent– Initial driving to check driving system
– 1-day restrike for acceptance check
• Over 99% accepted with 1-day restrike
• Two piles were subjected to multiple restrikes
• 1-day resistance– Range 57% to 141% of design resistance
– Average 74%
– COV 13%
• Average construction rate: 1 bent/6 days
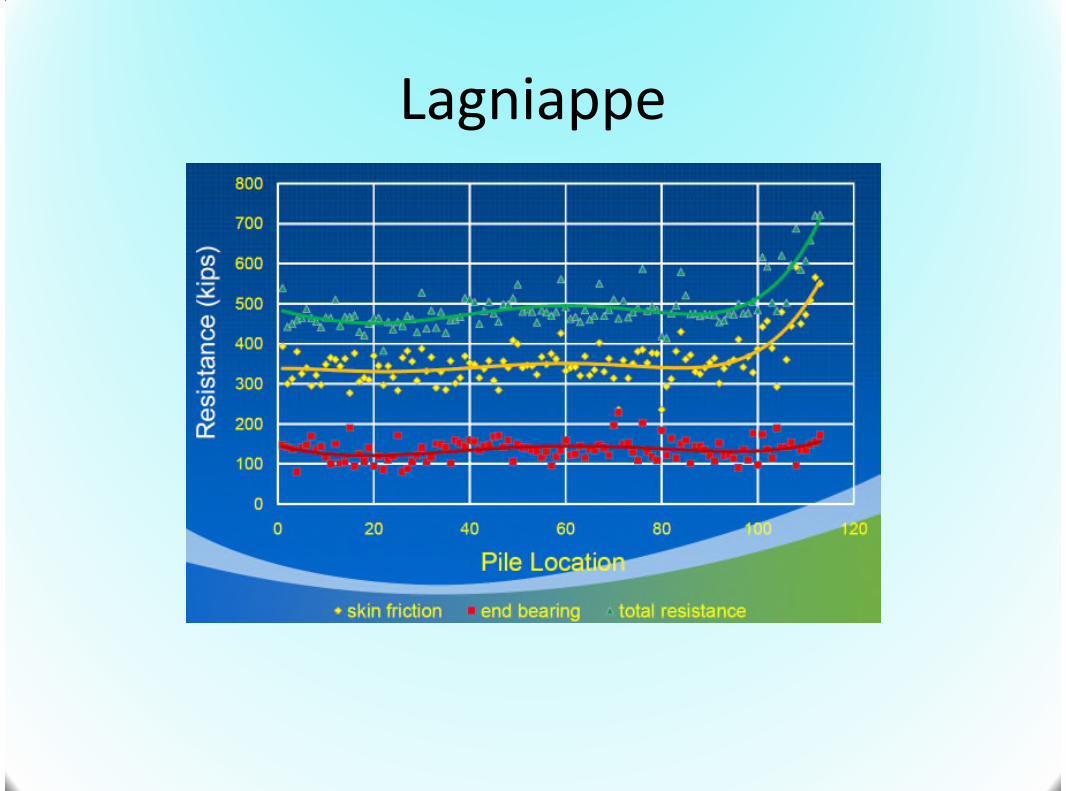
Lagniappe

McArthur Drive Phase I
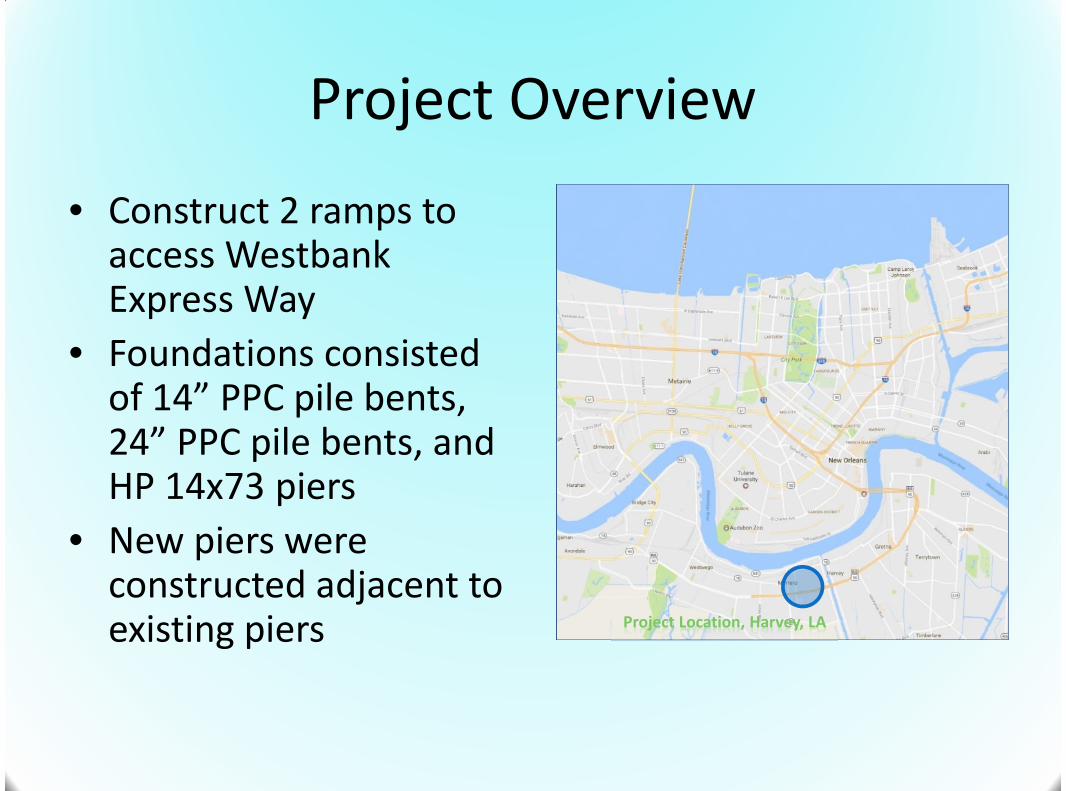
Project Overview
• Construct 2 ramps toaccess WestbankExpress Way
• Foundations consistedof 14” PPC pile bents,24” PPC pile bents, andHP 14x73 piers
• New piers wereconstructed adjacent toexisting piers Project Location, Harvey, LA


Geotechnical Overview
0
20
40
60
80
100
120
140
0 0.5 1 1.5 2 2.5
De
pth
(ft)
Undrained Shear Strength (ksf)
• 0 to 60’: Normallyconsolidated clay(Holocene)
• 60 to 80’: Clay andsand layers
• > 80’: Over-consolidated clay(Pleistocene)

Project Challenges
• Project had to befinished jointly by 3different consultants
• High-profile/politicallysensitive
• Not enough room forstatic load testing
• Vibration concerns
• Steel piles to minimizepotential constructiondelays
• Pile acceptance basedon dynamic testing only
• Restrikes wereperformed as early aspossible

Pile 7-1-1
• Due to vibration levels,District requestedearlier restrikes– 4 days > 100% required
resistance
– 1 day ≈ 90% required resistance
• We decided to attempt1-hr restrikes
0
20
40
60
80
100
120
140
160
180
200
0.0001 0.001 0.01 0.1 1 10 100
To
talN
om
inta
lRe
sist
ance
(to
ns)
Elapsed Time Since EOD (days)
7-1-1 Target
HP 14x73 x 96’ EmbedmentA = 0.21HP 14x73 x 96’ EmbedmentA = 0.21

Ramp 7 – Pile Setup
• 8 of 9 piles projected100% of their requiredresistance within a day
• Rate of setup wasconsistent– Average A = 0.21– CoV = 0.09
0.00
0.25
0.50
0.75
0.0001 0.001 0.01 0.1 1 10 100
Un
itSi
de
Fric
tio
n(k
sf)
Elapsed Time Since EOD (days)

Ramp 8 – Pile Setup
0.00
0.25
0.50
0.75
0.0001 0.001 0.01 0.1 1 10 100
Un
itSi
de
Fric
tio
n(k
sf)
Elapsed Time Since EOD (days)
• Pile 8-17-1 driven first– 1 day ≈ 100% required
resistance– A = 0.28
• Rate of setup lessconsistent than Ramp7– Average A = 0.19– CoV = 0.21

Ramp 8 – Pile Setup
0.00
0.20
0.40
0.60
0.80
1.00
1.20
1.40
0.0001 0.01 1 100
%o
fT
arge
tR
esi
stan
ce
Elapsed Time Since EOD (days)
Aavg = 0.22CoV = 0.15Aavg = 0.22CoV = 0.15
0.00
0.20
0.40
0.60
0.80
1.00
1.20
1.40
0.0001 0.01 1 100%
of
Tar
get
Re
sist
ance
Elapsed Time Since EOD (days)
Aavg = 0.17CoV = 0.23Aavg = 0.17CoV = 0.23
Piers8-68-8
8-108-118-128-13
Piers8-148-15

Piers 8-14 and 8-15
• Pier 8-14
– 20 x HP14x73 piles
– 118’ long
– 166-ton req. resistance
• Pier 8-15
– 30 x HP14x73 piles
– 124’ long
– 188-ton req. resistance 0
20
40
60
80
100
120
140
160
180
200
0.0001 0.001 0.01 0.1 1 10 100
To
talN
om
inal
Re
sist
ance
(to
ns)
Elapsed Time Since EOD (days)
8-14-1 8-15-1 8-15-30
> 50-ton deficiency @ 10 days> 50-ton deficiency @ 10 days
> 30-ton deficiency @ 10 days> 30-ton deficiency @ 10 days

Deficient Piles
• Pile resistance only projected out to 10 days
– Another log cycle could put us into columnconstruction
• Considered pile driving logs, soil borings, & NDT
• Structural consultant was provided withestimated resistance deficiency and resistancedistribution from CAPWAP
– 40’ extensions were added to the piles in 8-14 and 8-15

Extend Piles 40 feet
0
50
100
150
200
250
0.0001 0.01 1 100
To
talN
om
inal
Re
sist
ance
(to
ns)
Elapsed Time Since EOD (days)
8-14-1 8-14-1EX 8-14 Target
> 50 tons> 50 tons
Same Pile Extended 40’Same Pile Extended 40’
0
50
100
150
200
250
0.0001 0.001 0.01 0.1 1 10 100T
ota
lNo
min
alR
esi
stan
ce(t
on
s)
Elapsed Time Since EOD (days)
8-15-1 8-15 Target 8-15-1EX
> 90 tons> 90 tons
Same Pile Extended 40’Same Pile Extended 40’

More Work Needed
• Design– Resistance factors for projected resistance– Max set up time?– Impact of changing reference time from 1 day to 14 days
• Construction– Can we use initial drive to project resistance? How about
10, 15, 30 min restrikes?– Can we shorten the wait time to perform load test?– What is the shortest acceptable wait time for restrike(s)?