PII: S0263-7863(98)00043-X Time, cost and quality trade-o ...
48
Time, cost and quality trade-o in project management: a case study Do Ba Khang* and Yin Mon Myint School of Management, Asian Institute of Technology, P.O. Box 2754, Bangkok 10501, Thailand In 1996, Babu and Suresh proposed a framework to study the trade-o among time, cost and quality using three inter-related linear programming models. This paper describes our attempt to apply the method to an actual cement factory construction project. The purpose is to evaluate the practical applicability of the method by highlighting the managerial insights gained, as well as pointing out key problems and diculties faced. As consequence, the paper helps practicing project engineers to have realistic expectations of the method. It also provides suggestions to overcome some practical problems if the method is to be applied in real industrial projects. # 1999 Elsevier Science Ltd and IPMA. All rights reserved Keywords: critical path method (CPM), time, cost, quality trade-o, case study Introduction The critical path method (CPM) provides not only an excellent way of calculating the shortest completion time and the critical activities for a project, but also a framework to analyze the time/cost trade-o. In prac- tice, however, one of the critical measures of project success is the quality of its performance that may be aected by attempt to crash the completion time with additional budget 1, 2 . In this context, the traditional CPM method is inadequate to help the project man- ager make informed decisions on project progress and performance. Many attempts have been recorded in the literature to improve the method since its inception in the late 1950s 3 . However, most of this research either focused on improving the eciency of the pro- ject-crashing algorithm 4–8 , or on relaxing on the assumption of the linear relationship between cost and time factors 9–11 . In 1996, Babu and Suresh 12 proposed a new method to study the tradeo among time, cost and quality using three inter-related linear program- ming models. Their approach is based on the linear re- lationship among the project cost, the quality measure and the project completion time. The method is illus- trated with a small textbook example taken from Hillier and Lieberman 13 . This paper describes an attempt to apply the Babu and Suresh method to an actual cement factory con- struction project in Thailand. With the purpose of evaluating the practical applicability of the method, the basic assumptions are investigated, major problems in estimating input parameters are pointed out, and the resulting managerial insights are highlighted. As consequence, the paper helps practicing project engin- eers to have realistic expectations of the method. It also provides suggestions to overcome various practi- cal problems if the method is to be applied in real industrial projects. This research also validates with real data most of the conceptual findings by Babu and Suresh in their original work. Review of Babu and Suresh cost–time–quality trade-o models Babu and Suresh developed their method by assuming that the project activities and their precedence relation- ships are determined. Each activity has a normal time of completion and a crash time of completion. Associated with the normal time are normal cost and normal performance quality, and with crash time are crash cost and crash quality. It is assumed that the cost and quality of an activity vary as linear functions of the completion time. Given individual activity com- pletion times, the total project completion time can then be calculated using the traditional CPM method. The total cost is simply the sum of individual activity costs, and the total project quality is measured by the average of the individual activity quality measures. Babu and Suresh suggest three optimization models as a framework to analyze the trade-o among the cost, time and quality factors of a project. In order to formulate these models in the familiar linear program- ming (LP) format, the activity-on-arc (AOC) network convention and the following notation will be used: M: Number of events N: Number of activities International Journal of Project Management Vol. 17, No. 4, pp. 249–256, 1999 # 1999 Elsevier Science Ltd and IPMA. All rights reserved Printed in Great Britain 0263-7863/99 $ - see front matter PII: S0263-7863(98)00043-X *Corresponding author. Tel.: 00-662-524-5658; Fax: 00-662-524- 5667. 249
Transcript of PII: S0263-7863(98)00043-X Time, cost and quality trade-o ...
Time, cost and quality trade-o� inproject management: a case study
Do Ba Khang* and Yin Mon MyintSchool of Management, Asian Institute of Technology, P.O. Box 2754, Bangkok 10501, Thailand
In 1996, Babu and Suresh proposed a framework to study the trade-o� among time, cost andquality using three inter-related linear programming models. This paper describes our attempt toapply the method to an actual cement factory construction project. The purpose is to evaluatethe practical applicability of the method by highlighting the managerial insights gained, as wellas pointing out key problems and di�culties faced. As consequence, the paper helps practicingproject engineers to have realistic expectations of the method. It also provides suggestions toovercome some practical problems if the method is to be applied in real industrial projects. #1999 Elsevier Science Ltd and IPMA. All rights reserved
Keywords: critical path method (CPM), time, cost, quality trade-o�, case study
Introduction
The critical path method (CPM) provides not only anexcellent way of calculating the shortest completiontime and the critical activities for a project, but also aframework to analyze the time/cost trade-o�. In prac-tice, however, one of the critical measures of projectsuccess is the quality of its performance that may bea�ected by attempt to crash the completion time withadditional budget1, 2. In this context, the traditionalCPM method is inadequate to help the project man-ager make informed decisions on project progress andperformance. Many attempts have been recorded inthe literature to improve the method since its inceptionin the late 1950s3. However, most of this researcheither focused on improving the e�ciency of the pro-ject-crashing algorithm4±8, or on relaxing on theassumption of the linear relationship between cost andtime factors9±11. In 1996, Babu and Suresh12 proposeda new method to study the tradeo� among time, costand quality using three inter-related linear program-ming models. Their approach is based on the linear re-lationship among the project cost, the quality measureand the project completion time. The method is illus-trated with a small textbook example taken fromHillier and Lieberman13.This paper describes an attempt to apply the Babu
and Suresh method to an actual cement factory con-struction project in Thailand. With the purpose ofevaluating the practical applicability of the method,the basic assumptions are investigated, major problemsin estimating input parameters are pointed out, and
the resulting managerial insights are highlighted. Asconsequence, the paper helps practicing project engin-eers to have realistic expectations of the method. Italso provides suggestions to overcome various practi-cal problems if the method is to be applied in realindustrial projects. This research also validates withreal data most of the conceptual ®ndings by Babu andSuresh in their original work.
Review of Babu and Suresh cost±time±qualitytrade-o� models
Babu and Suresh developed their method by assumingthat the project activities and their precedence relation-ships are determined. Each activity has a normal timeof completion and a crash time of completion.Associated with the normal time are normal cost andnormal performance quality, and with crash time arecrash cost and crash quality. It is assumed that thecost and quality of an activity vary as linear functionsof the completion time. Given individual activity com-pletion times, the total project completion time canthen be calculated using the traditional CPM method.The total cost is simply the sum of individual activitycosts, and the total project quality is measured by theaverage of the individual activity quality measures.Babu and Suresh suggest three optimization models
as a framework to analyze the trade-o� among thecost, time and quality factors of a project. In order toformulate these models in the familiar linear program-ming (LP) format, the activity-on-arc (AOC) networkconvention and the following notation will be used:
M: Number of eventsN: Number of activities
International Journal of Project Management Vol. 17, No. 4, pp. 249±256, 1999# 1999 Elsevier Science Ltd and IPMA. All rights reserved
Printed in Great Britain0263-7863/99 $ - see front matter
PII: S0263-7863(98)00043-X
*Corresponding author. Tel.: 00-662-524-5658; Fax: 00-662-524-5667.
249
Yi: Earliest time of event i (i= 1,2,...,M)Xij: Duration of activity (ij) (Xij and Yi are de-
cision variables)tij: Normal time for activity (i,j)t'ij: Crash time for activity (i,j) (tijrt'ijr0)cij: Normal cost for activity (i,j)c'ij: Crash cost for activity (i,j) (c'ijrcijr0)qij: Normal quality for activity (i,j)q'ij: Crash quality for activity (i,j) (qijrq'ijr0).
Notice that a dummy activity can be indicated byletting tij=t'ij=0. The constraints common to all theLP problems can then be summarized as follows:(a) The project is started at time zero.
Y1 � 0 �1�(b) Each activity completion time Xij is bounded
from above by the normal time, and from below bythe crash time:
tijrXijrt 0ij �2�(c) For each activity (i,j),
Yi � Xij ÿ YjR0 �3�The objective function for the ®rst LP model is the
project completion time that is simply the earliest timeof the last `®nish' event:
TF � YM
For the second model, the objective function is thetotal cost of the project. By assuming the linear re-lationship of the activity cost and completion time, thetotal project cost is estimated as a linear function ofthe individual activity times:
CF �X�i,j ��Aij � Bij � Xij �,
where Bij � �c 0ij ÿ cij �=�tij ÿ t 0ij � and Aij � c 0ij ÿ Bij � t 0ijare the slope and intercept of the cost curve for ac-tivity (i,j). For the third model, the objective functionis the project's overall quality that is calculated as theaverage of the individual activity qualities, that is
QF �X�i,j ��A 0ij � B 0ij � Xij �,
where B 0ij � �qij ÿ q 0ij �=�tij ÿ t 0ij � and A 0ij � q 0ij ÿ B 0ij � t 0ijare the slope and intercept of the quality curve for ac-tivity (i,j).Thus, assuming that T' and Q' are the lower bounds
for project completion time TF and average qualityQF, and C' is the upper bound for total cost CF, themodels can be simply written as:
Model 1: Minimize TF subject to (1±3) andCFRC' and QFrQ';
Model 2: Minimize CF subject to (1±3) andTFRT' and QFrQ';
Model 3: Maximize QF subject to (1±3) andCFRC' and TFRT'.
For di�erent budget levels and the quality toler-ances, the ®rst model yields the corresponding shortestcompletion times, and thus provides a framework forthe trade-o� analysis by considering project com-
pletion time as a function of budget and quality con-straints. In a similar way, the second model searchesfor the lowest cost to complete the project as a func-tion of completion due dates and quality toleranceallowed, while the third model yields maximum overallproject quality subject as a function of budget con-straints and completion due date.
Case study and parameter estimation
TPI Polene Public Company Limited (TPIPL) islocated about 134 km north of Bangkok, Thailand.The company currently operates three cement factorieswith an annual capacity of 9 million tons per annum.The fourth factory is now under construction and isexpected to be in operation by 1998, which will bringthe total cement capacity to 12.3 million tons perannum. The total cost for this new construction pro-ject is estimated to be baht 9.6 billion (or roughlyUS$375 million). The scope of work for the whole pro-ject is large and complex with 35 di�erent sub-projectsand more than 1000 separate activities. Partly becauseof this complexity, and partly due to the fact that thecompletion of the project is subject to a large numberof exogenous factors, both economical and political,beyond the control of the top management, it wasdecided to focus this research on only one of its sub-projects. The sub-project chosen is one of erecting theDopol pre-heater tower, which is the most time con-suming and problematic sub-project in the whole fac-tory construction project. In fact, the pre-heater towererection is so important that its schedule is used byproject engineers as the benchmark to adjust the sche-dule of all other sub-projects. It is believed that usingthis sub-project in evaluating the practical value of themethod will not a�ect the validity of the conclusions.The activities of the sub-project to erect the Dopol
pre-heater tower can be grouped into 52 workpackages under four main categories: civil work (level-ing, excavation, foundation and construction), mech-anical work (fabrication, erection, refractory and coldtest run), electrical work (power distribution, substa-tion and transformer, MCC control, cable rack instal-lation, power supply) and automation (Plc cabinet,safety and local control). Each work package consistsof numerous related speci®c activities that are nor-mally carried out under a single supervisor or subcon-tractor. The work packages are identi®ed so thatactivities of di�erent work packages do not use thesame resources at the same time, and therefore can bescheduled relatively independently. Care is taken thatcompletion time and cost of individual work packagescan be estimated relatively easily and accurately. Thelist of these work packages and their brief descriptionis given in Table 1.Estimating the relevant input parameters for work
packages was probably the most time consuming taskin applying the Babu and Suresh method to the sub-project under study. The work was done in close con-sultations with site managers. Below is described theway these parameters were estimated as well as the dif-®culties encountered.
Time, cost and quality trade-o� in project management: D B Khang and Y M Myint
250
Normal time cost and quality parameters
The time and cost parameters under assumed normalconditions were easiest to estimate. In fact, the normalcompletion time of activity was taken from the existingproject schedule that had been prepared by project en-gineers with care taken to all technical details. For thepurpose of studying the inter-relationship among thecost, time and quality dimensions of the project incrashing the activities, all ®xed costs of equipment andmaterials procurement, and the overhead wereexcluded from these cost parameters. In fact, all sitemanagers and engineers believed that these costs,although being a major part of the total cost, were nota�ected by decisions of crashing the project activities.Thus the cost data used in the calculations (see alsoTable 1) include only the variable costs of whichlabour cost is the major component. Since the relative
quality reduction due to crashing activities is the focusof interest in this research, the performance qualityexpected under the normal conditions is assumed to beat 100% level for each activity. This assumptionre¯ects the research objective of investigating only theimpact of the time/cost factor, and not any other in¯u-ence, on the project's overall quality.
Crashing time, cost and quality
Most of the work at the pre-heater tower is labourintensive with relatively clear de®nition. As it is typicalfor construction sites in Thailand, the number ofworkers working 6 days a week at the project isalready at the maximum due to the limited work area.Thus, according to the managers, the only way activi-ties can be accelerated is through using overtime. Sincethe maximum overtime allowed is 4 hours on top of
Table 1 Works on Dopol preheater tower and the estimates parameters
Work-package Brief description of work
tij(days)
t'ij(days)
cij(million baht)
c'ij(million baht) q'ij
A Procurement of Rebars 33 22 5.50 8.25 0.90B Procurement of steel section, plates, pipes, etc. 33 22 58.40 87.60 0.90C Excavation 33 22 0.50 0.75 0.90D Foundation 33 22 6.50 9.75 0.95E Concrete columns to ®rst ¯oor (188 m) 22 15 3.40 5.10 0.95F Concrete ¯oor and beams to ®rst ¯oor 22 15 3.50 5.25 0.95G Concrete columns to second ¯oor (200m) 22 15 2.50 3.75 0.95H Fabrication of beams, steel ¯oor and staircase (second ¯oor) 44 29 1.09 1.63 0.83I Fabrication of kiln inlet and transaction piece 75 50 1.84 2.76 0.83J Erection of kiln inlet and transaction piece 75 50 1.10 1.65 0.85K Installation of beams, steel ¯oor and staircase (second ¯oor) 44 29 1.95 2.93 0.85L Fabrication of beams, steel ¯oor and staircase (third ¯oor) 55 37 2.22 3.34 0.83M Installation of steel structure to 3rd ¯oor (217 m) 55 37 4.00 6.00 0.85N Erection of 1st stage cyclones and ducts between 3rd and 4th ¯oors 30 20 1.80 2.70 0.85O Fabrication of 1st stage cyclones and ducts (3rd ¯oor) 30 20 1.08 1.61 0.83P Refractory works (kiln inlet, transaction pieces, column ducts) 40 27 2.85 4.28 0.90Q Electrical works in 1st, 2nd and 3rd ¯oors 40 27 2.50 3.75 0.70R Fabrication of beams, steel ¯oor and staircase (4th and 5th ¯oors) 55 37 3.15 4.73 0.83S Erection of beams, steel ¯oor and staircase for 4th and 5th ¯oors (251 m) 55 37 5.68 8.51 0.85T Erection of 2nd stage cyclones and transfer ducts 40 27 1.65 2.48 0.85U Fabrication of 2nd stage cyclones and transfer ducts 40 27 2.75 4.12 0.83V Refractory works at 1st stage cyclones and ducts 44 29 2.54 3.81 0.90W Fabrication of beams, steel ¯oor and staircase (5th and 6th ¯oors) 55 37 1.99 2.99 0.83X Erection of beams, steel ¯oor and staircase (5th and 6th ¯oors) 55 37 3.59 5.38 0.85Y Erection of 3rd stage cyclones 30 20 0.80 1.20 0.85Z Fabrication of 3rd stage cyclones and ducts 30 20 1.34 2.01 0.83AA Refractory works at 2nd stage cyclones and ducts 44 29 2.54 3.81 0.90AB Electrical and instrument cabling 4th and 5th ¯oor 22 15 1.50 2.25 0.70AC Installation of 2 Poldos-feeding equipment in 1st ¯oor 30 20 1.20 1.80 0.85AD Installation of shock blowers (M.E) in ¯oors 1,2 and 3. 30 20 1.25 1.88 0.85AE Fabrication of beams, steel ¯oor and staircase (6th and 7th ¯oors) 55 37 1.59 2.39 0.83AF Erection of beams, steel ¯oor and staircase for 6th and 7th ¯oors (268 m) 55 37 2.87 4.30 0.85AG Erection of 4th stage cyclones on 6th ¯oor 30 20 0.69 1.04 0.85AH Fabrication of 4th stage cyclones etc. 30 20 1.16 1.73 0.83AI Refractory works at 3rd stage cyclones and ducts 44 29 3.25 4.88 0.90AJ Electrical and instrument cable racks etc. (6th ¯oor) 22 15 1.50 2.25 0.70AK Fabrication of beams, steel ¯oor and staircase (7th and 8th ¯oors) 72 48 1.54 2.31 0.83AL Erection of beams, steel ¯oor and staircase for 7th and 8th ¯oors (291 m) 72 48 2.77 4.16 0.85AM Erection of 5th stage cyclones on 7th ¯oor 40 27 0.62 0.93 0.85AN Fabrication of 5th stage cyclones and ducts 40 27 1.04 1.55 0.83AO Refractory works on 4th stage cyclones and ducts 44 29 3.25 4.88 0.90AP Fabrication of ladder, platform, stairs,beams for 8th ¯oor 55 37 1.23 1.85 0.83AQ Erection of steel structures for 8th ¯oor 55 37 2.22 3.33 0.85AR Erection of 6th stage cyclones on 8th ¯oor 40 27 1.19 1.79 0.85AS Fabrication of 6th stage cyclones on 8th ¯oor 40 27 1.98 2.97 0.83AT Refractory works on 5th stage cyclones and ducts 44 29 1.66 2.49 0.90AU Fabrication of second gas duct 165 111 3.55 5.32 0.83AV Refractory work on 6th stage cyclones completed 66 44 3.26 4.90 0.90AW Electrical and instrument cables on 7th ¯oor 30 20 1.50 2.25 0.70AX Installation of local instruments 88 59 5.23 7.85 0.85AY Insulation for gas ducts and 6th stage cyclones connection 66 44 2.28 3.62 0.85AZ Readying for test run 5 3 0.50 0.75 0.85
Time, cost and quality trade-o� in project management: D B Khang and Y M Myint
251
the regular 8-hour working day, activities may becrashed on average at a ratio of 2:3. These crash timeswere then adjusted for each of the 52 work-packagestaking into account the possibility that workers maysometimes be asked to work on Sunday also, and thatsome work would permit less hours of overtime due tolighting conditions and safety reasons. The results arethe maximum crash times t'ij used in the LP models.Site managers also believed that when activities needbe crashed, the cost increase is mostly due to thedouble rate for overtime. As consequence, they had noproblem in accepting the assumption of linear relation-ship between cost escalation and time crashed which isfundamental in the Babu and Suresh method.The estimation of the quality reduction due to crash-
ing was more di�cult and elaborate. There were twomajor obstacles in arriving at an acceptable measure-ment of quality reduction. First, and not surprisingly,it was found that the practicing managers and engin-eers were very sensitive to the idea that the quality ofthe project could be compromised at all by crashing.Second, the quality of an activity can be usuallymeasured only by subjectively using managers' judge-ment. In a few cases when quality can be determinedquantitatively and objectively using technical speci®ca-tions, these speci®cations were to be adhered to ratherstrictly, and the quality measure was not noticeablya�ected by the use of overtime. The common reactionwas that `quality reduction due to overtime is negli-gible and cannot exceed 2±3%, even if the maximumamount of overtime is used'. With the objective ofarriving at workable estimates of quality reductions inproject activities due to crashing, the following prin-ciples were agreed:
1. In interpreting the results of the models, it is notthe absolute value of the quality measure that is rel-evant, but the relative quality values of the individ-ual activities when crashing is performed.
2. These relative values should re¯ect two consider-ations:
± Some works (such as painting works) are moreprone to the measurable quality reduction whencrashed;
± Some works (such as welding or electrical works)are so important and critical that a minor re-duction in quality may seriously compromise thewhole project performance.
In both cases, crashing should induce a relativelylarge reduction in the quality measures of the ac-tivities.
3. If a work-package has more than one activity thenits quality is measured as the weighted average ofthe individual activities' quality where the weightsare proportional to the contractual values of the ac-tivities.
Based on this common framework, the researchersand the managers together compared the individual ac-tivities to estimate the relative quality reductions dueto crashing. The last column of Table 1 is the result ofthis time consuming process. The numbers in that col-umn indicate the relative, and at times subjective,assessment of the quality of the individual project ac-tivities when maximum crash is performed. It is pre-sumed then that the quality measure will decrease as alinear function of activity completion time from thenormal value of 1.00 to this lower bound.
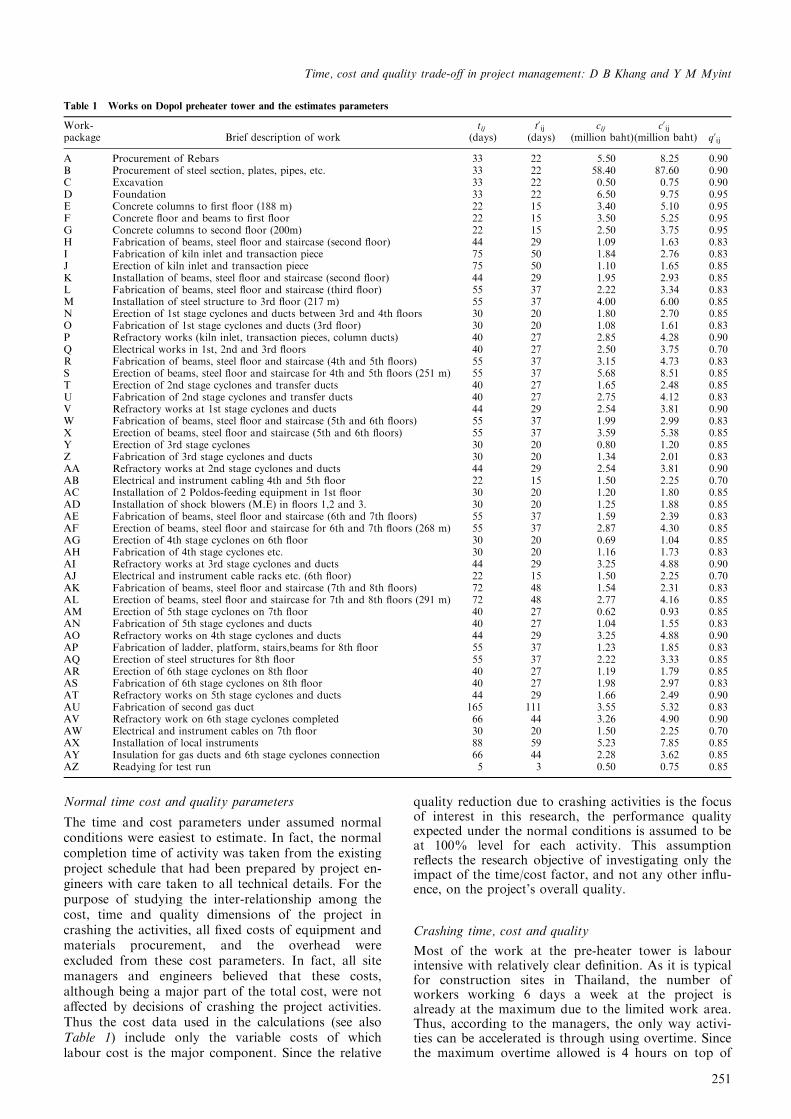
Figure 1 Optimal completion time when costs and quality are bounded
Time, cost and quality trade-o� in project management: D B Khang and Y M Myint
252
Analysis of computational results
Once the parameters are estimated, the computation ofthe three models, using software LINDO (version 5.1),is simple since the size of the LP problems is relativelysmall (104 variables and 231 constraints for eachmodel). All these problems were solved repeatedlyusing di�erent values for the goal constraints in cost,time and quality. The maximum budget varied withincrements of 10 million bahtÐexcept for the lastincrementÐfrom the normal cost of 175.60 millionbaht to the maximum crash cost of 263.60 millionbaht. The lower bound for completion time wasallowed to change in increments of 20 daysÐor 21days for the last three incrementsÐfrom the maximumcrash time of 371 days to the normal time of 554 days.
Five di�erent quality levels were considered in themodels: 85%, 89%, 92%, 95% and 98%.The computational results of the three models are
summarized in Figures 1±3 and Tables 2±4 which bearmuch similarity to the corresponding results obtainedby Babu and Suresh with their textbook example. Inparticular, the following major ®ndings can be noted:
. For each given quality level, there exists a budgetthreshold beyond which there would be of littlevalue to increase budget in the hope of expeditingfurther project completion. These thresholds aregiven in Figure 1 as 185.60 million baht at a 98%quality allowance, 195.60 million baht at a 95%quality allowance, and 215.60 million baht at a 92%quality allowance. The corresponding completiontimes are 482 days, 431 days and 391 days, respect-
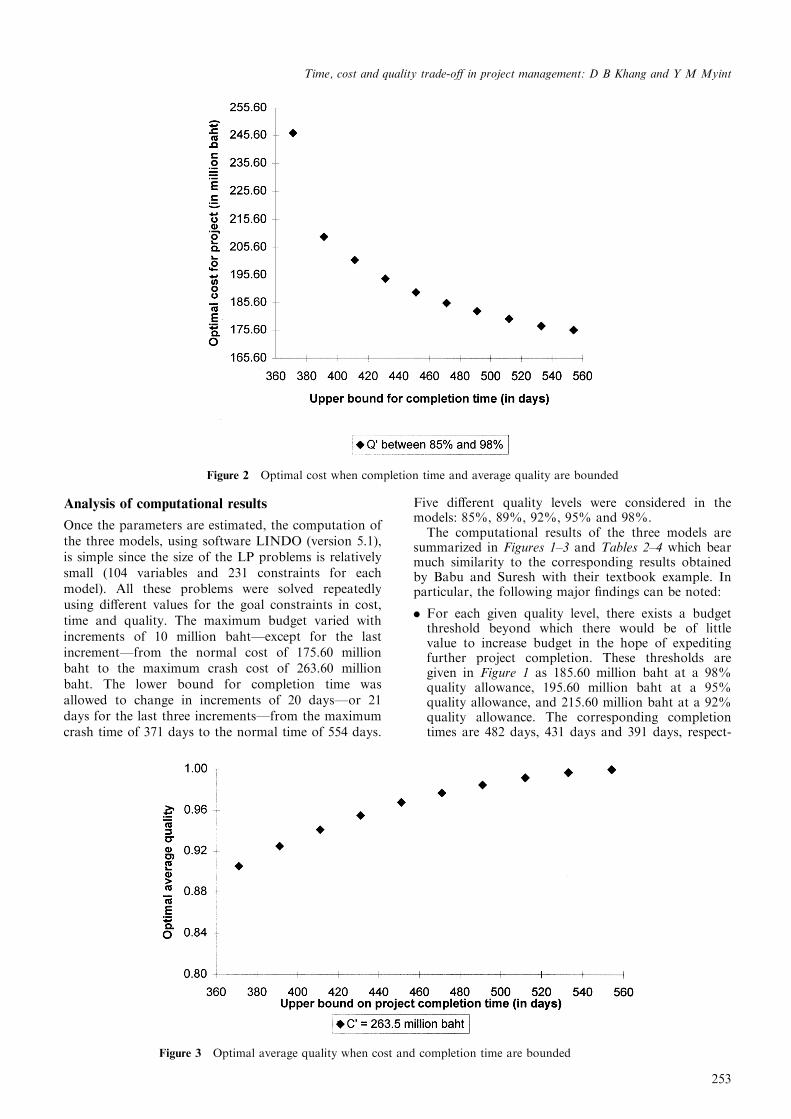
Figure 2 Optimal cost when completion time and average quality are bounded
Figure 3 Optimal average quality when cost and completion time are bounded
Time, cost and quality trade-o� in project management: D B Khang and Y M Myint
253
ively. At the lower quality levels of 89% and 85%,the thresholds are not as sharp as with the higherquality tolerances.
. If the average quality requirement is decreased, thesebudget thresholds, which can be interpreted as thepractical limiting costs for crashing, will increase,which in turn allows for a further reduction in pro-ject completion time.
. Project cost is almost independent of the qualityrequirement and therefore, the cost/time curves inFigure 3 coincide for all quality levels. This fact isnot surprising because the performance quality ateach activity was assumed to be a function of thetime factor only.
. There is a critical value for project completion time,beyond which it would be extremely expensive tocrash further. Figure 2 indicates that this criticalvalue is around 400 days.
In order to help managers to gain better insight ofthe trade-o� among time, cost and quality factors ofthe project, the output of Model 1 is re-organized byquality requirements. Wherever an increase in budgetis not accompanied by a reduction in completion time,only the minimum budget required for that time isrecorded. The results are summarized in Tables 5 andFigure 4. It is now clear that managers may not expectto crash the project completion time below 482 dayswithout compromising the high quality level of 98%
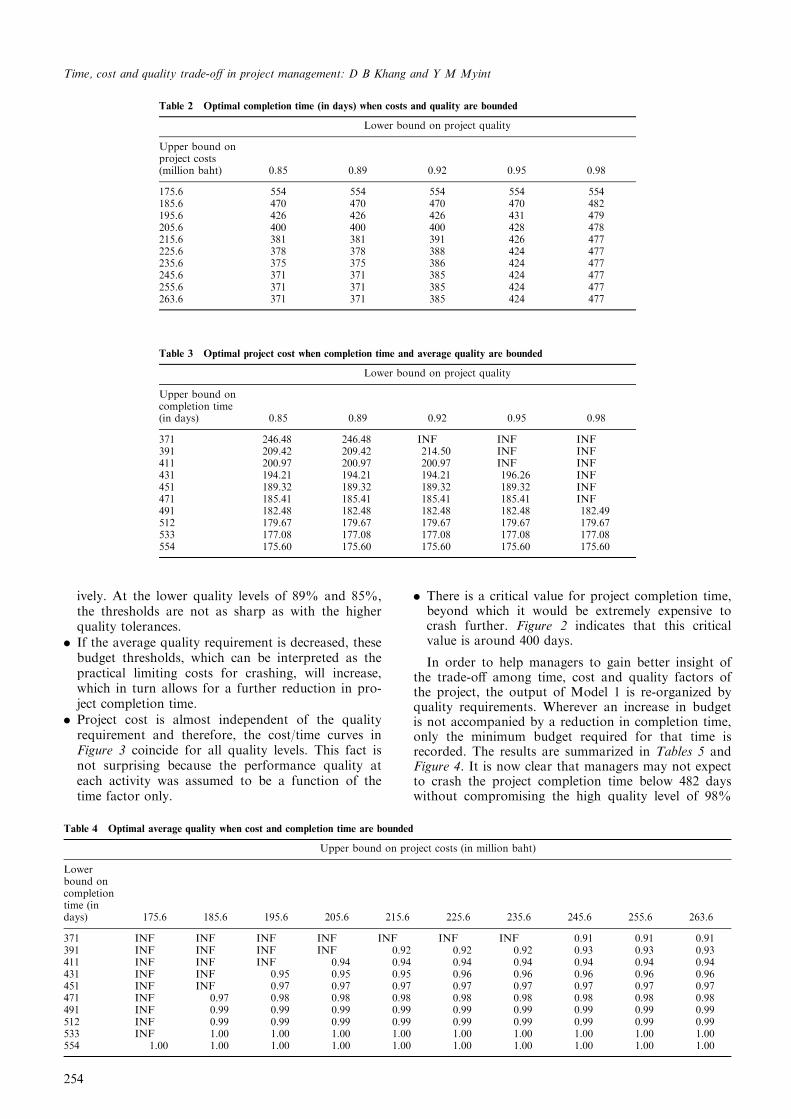
Table 2 Optimal completion time (in days) when costs and quality are bounded
Lower bound on project quality
Upper bound onproject costs(million baht) 0.85 0.89 0.92 0.95 0.98
175.6 554 554 554 554 554185.6 470 470 470 470 482195.6 426 426 426 431 479205.6 400 400 400 428 478215.6 381 381 391 426 477225.6 378 378 388 424 477235.6 375 375 386 424 477245.6 371 371 385 424 477255.6 371 371 385 424 477263.6 371 371 385 424 477
Table 3 Optimal project cost when completion time and average quality are bounded
Lower bound on project quality
Upper bound oncompletion time(in days) 0.85 0.89 0.92 0.95 0.98
371 246.48 246.48 INF INF INF391 209.42 209.42 214.50 INF INF411 200.97 200.97 200.97 INF INF431 194.21 194.21 194.21 196.26 INF451 189.32 189.32 189.32 189.32 INF471 185.41 185.41 185.41 185.41 INF491 182.48 182.48 182.48 182.48 182.49512 179.67 179.67 179.67 179.67 179.67533 177.08 177.08 177.08 177.08 177.08554 175.60 175.60 175.60 175.60 175.60
Table 4 Optimal average quality when cost and completion time are bounded
Upper bound on project costs (in million baht)
Lowerbound oncompletiontime (indays) 175.6 185.6 195.6 205.6 215.6 225.6 235.6 245.6 255.6 263.6
371 INF INF INF INF INF INF INF 0.91 0.91 0.91391 INF INF INF INF 0.92 0.92 0.92 0.93 0.93 0.93411 INF INF INF 0.94 0.94 0.94 0.94 0.94 0.94 0.94431 INF INF 0.95 0.95 0.95 0.96 0.96 0.96 0.96 0.96451 INF INF 0.97 0.97 0.97 0.97 0.97 0.97 0.97 0.97471 INF 0.97 0.98 0.98 0.98 0.98 0.98 0.98 0.98 0.98491 INF 0.99 0.99 0.99 0.99 0.99 0.99 0.99 0.99 0.99512 INF 0.99 0.99 0.99 0.99 0.99 0.99 0.99 0.99 0.99533 INF 1.00 1.00 1.00 1.00 1.00 1.00 1.00 1.00 1.00554 1.00 1.00 1.00 1.00 1.00 1.00 1.00 1.00 1.00 1.00
Time, cost and quality trade-o� in project management: D B Khang and Y M Myint
254

or running to an exceedingly high cost. Similarly, if95% average project quality is the performance thatcan be accepted, then trying to complete the project inless than 431 days may be very expensive.
Assessment of the method and conclusions
The linear programming models proposed by Babuand Suresh are conceptually easy to understand, andcomputationally easy to solve. All managers and en-gineers are interested in the possibility of incorporatingperformance quality in the time and cost scheduling.The results obtained, when presented using propergraphics, provide insightful information that can helpthe managers in making trade-o� decisions. At the
early stage of the cement factory construction projectwhen the research was conducted, the goal of complet-ing the construction in time was the most importantfor the managers. Thus, Model 1 was judged as themost relevant and interesting. However, it is possibleto foresee a situation where Model 2 becomes promi-nent, especially when some cost overrun has occurredin the project and the task of minimizing expendituresis of the top priority. In any case, the two models 1and 2 are dual in the linear programming sense, andcan always be considered together with quality levelsas parameters. Model 3, although playing a rathersymmetric role with the other two, is less appealing topractical managers and engineers. The main objectionto this model is that the quality measurements aresometimes too subjective and inaccurate to be con-sidered as an objective function in an LP formulation.At the same time, it can be observed that, while allmanagers, understandably, are sensitive to the issue ofquality reduction due to crashing work, they are alsoreluctant to consider improving an already acceptablequality level at extra expenses or by delaying the pro-ject completion.As already pointed out by Babu and Suresh, the sol-
utions of the models support the common intuitionregarding e�ects of time, cost and quality in projectmanagement. The most valuable ®nding to managersparticipating in the research, and probably a surprisingone for some, is the recognition of the existence of thedi�erent budget thresholds for the time/cost curve atdi�erent quality levels. These thresholds, not men-tioned by Babu and Suresh, are explicitly presented inFigure 4, and judged as most useful in helping man-agers making trade-o� decisions.The managers involved in this research consider as
reasonable the assumption of linear relationshipbetween cost and time. The fact that crashing this par-ticular project was practically possible only throughovertime not only made the assumption readily accep-
Table 5 Trade-o� among optimal cost, time and quality level
Optimal duration (indays)
Minimum cost (inmillion baht) Quality level
554 175.6 0.98482 185.6479 195.6478 205.6477 215.6477 225.6470 185.6 0.95431 195.6428 205.6426 215.6424 225.6424 235.6426 195.6 0.92399 205.6391 215.6388 225.6386 235.6384 245.6381 215.6 0.85±0.89378 225.6375 235.6371 245.6371 255.6
Figure 4 Trade-o� among optimal cost, time and quality requirement
Time, cost and quality trade-o� in project management: D B Khang and Y M Myint
255
table, but also facilitated estimating the necessary par-ameters. The linearity assumption between quality andtime is more problematic. In fact, the most di�cult,and probably most controversial, task in applying themethod in the case project was to assess the quality re-duction associated with crashing. In the currentresearch, this is achieved, to a certain degree of satis-faction of both the researchers and practitioners,through the framework outlined in the chapter on par-ameter estimation. Even then, it is recognized that thequality measures at best re¯ect only relative perform-ance levels of di�erent activities with di�erent crashingdecisions. The di�culty also highlights a major limi-tation of the method: in all practically justi®ablemeasurements of quality, only a very small portionbears direct relation with crashing decisions. Thus, thequality factor considered in the models accounts foronly a small, and unfortunately usually not the mostrelevant, part of the performance of managerial inter-est. This leads to an interesting research question of®nding a more holistic measurement for performancequality, and a more realistic model to describe the re-lationship among quality of individual activities, andtherefore of the whole project, and the budget andtime allowed.
Acknowledgements
The authors gratefully acknowledge the support of MrMaung Maung Myint, Chief Erection Manager, andMr Zaw Win, Site Manager, from TPI Polene plc. incarrying out this research.
References1. Kerzner H. Project management: a systems approach to plan-
ning, scheduling and controlling. 5th ed. New York: VanNostrand Reinhold, 1995.
2. Badiru AB, Pulat PS. Comprehensive project management: inte-grating optimization models, management principles, and com-puters. New Jersey: Prentice Hall, 1995.
3. Kelly JE, Walker MR. Critical path planning and scheduling.Proceedings of the Easter Joint Computer Conference, NewYork, 1959:160±173.
4. Kelley, J.E., Critical-path planning and scheduling: mathemat-ical basis. Operations Research, 1961, 9(3), 296±320.
5. Siemens, N., A simple CPM time-cost trade-o� algorithm.Management Science, 1971, 17(6), B354±B363.
6. Goyal, S.K., A note on a simple CPM time-cost tradeo� algor-ithm. Management Science, 1975, 21(6), 718±722.
7. Wu, Y. and Li, C., Minimal cost project networks: the cut setparallel di�erence method. Omega, 1994, 22(4), 401±407.
8. Kamburowski, J., On the minimum cost project schedule.Omega, 1995, 23(4), 463±465.
9. Berman, E.B., Resource allocation in a PERT network undercontinuous activity time-cost function. Management Science,1964, 10(4), 734±745.
10. Deckro RF, Herbert JE, Verdini WA. Non-linear multiple cri-teria time/cost tradeo�. In: Lee JB, editor. Proceedings of the1987 Annual Western DSI, Palm Springs, CA, 1987:134±137.
11. Falk, J.E. and Horowitz, J.L., Critical path problems with con-cave cost-time functions. Management Science, 1974, 19(4),446±455.
12. Babu, A.J.G. and Suresh, N., Project management with time,cost, and quality considerations. European J. OperationsResearch, 1996, 88, 320±327.
13. Hillier FS, Lieberman GJ. Introduction to mathematical pro-gramming. New York: McGraw-Hill, 1990.
Do Ba Khang is Associate Professorat the School of Management, AsianInstitute of Technology (AIT),Bangkok, Thailand. Holding anM.Sc. in Mathematics fromUniversity of Budapest, Hungary,and an M.Sc. and Dr. Tech. Sc. inIndustrial Engineering from AIT, hecurrently teaches graduate courses inproject and operations management.He has previously published in IIETransactions, Networks, WaterResources Research, OperationsResearch Letters, Analysis andAnnuals of Numerical Mathematics.
Yin Mon Myint holds a B.A. inInternational Relations from theUniversity of Yangoon in Myanmarand M.B.A. from Asian Institute ofTechnology in Bangkok, Thailand.She is currently Financial andPublic Relations Manager of M.Chemical Company Ltd inMyanmar.
Time, cost and quality trade-o� in project management: D B Khang and Y M Myint
256
Contents lists available at ScienceDirect
Computers & Industrial Engineering
journal homepage: www.elsevier.com/locate/caie
Time Cost Quality Trade-off Problems: A survey exploring the assessment ofquality
Mayassa Bou Orma, Jully Jeunetb,⁎
aUniversité Paris Dauphine, PSL Research University, CNRS UMR[7243], Lamsade, Place du Maréchal de Lattre de Tassigny, 75775 Paris Cedex 16, Franceb CNRS, Université Paris Dauphine, PSL Research University, CNRS UMR[7243], Lamsade, Place du Maréchal de Lattre de Tassigny, 75775 Paris Cedex 16, France
A R T I C L E I N F O
Keywords:Time Cost Quality Trade-off ProblemsProject schedulingProject crashingActivity qualityProject quality
A B S T R A C T
Time Cost Trade-off Problems have received considerable attention in the literature on deterministic projectscheduling problems but integrating the quality factor to these problems dates back to the mid-nineties with thepioneering work of Babu and Suresh (1996). Since then, to the best of our knowledge, about twenty papers havebeen published on this topic. The present paper analyses these Time Cost Quality Trade-off Problems in light ofthe usual classification for Time Cost Trade-off Problems that is based upon the number and category of re-sources and on the continuous or discrete type of the relationship between duration and cost or resources uti-lisation. In this survey, the emphasis is on the definition of project activities quality and on aggregation methodsused to derive the overall project quality. We report the absence of a direct relationship between quality andresources allocated to activities and a lack of use of the lexicographic method to solve the problem.
1. Introduction
The core strategy to faster product development projects so as togain competitive advantage consists in overlapping development stagesso the downstream stage can start earlier by using preliminary in-formation. Quality issues implied by overlapping are resolved usingrework to correct design flaws resulting from partial information. Thusfor such projects, quality is implicitly taken into account with rework(see for instance Lin, Qian, Cui, & Miao, 2010 for a recent contribution).Besides, to accelerate non innovative projects so as to ensure deliveryon the planned date, some of the project activities can be completedfaster than normal by either spending less time on them or more moneyto cover the expenses of additional resources allotted to them. Thusaccelerating a project increases its cost. As it is commonly assumed thatshortening the duration of activities decreases their quality and con-sequently the project quality, there is a trade-off between time, cost andquality. Most of Time Cost Quality Trade-off Problems (TCQTP) aremodelled in a similar way to Time Cost Trade-off Problems (TCTP) thathave been extensively studied in the literature related to deterministicproject scheduling (see Weglarz, Jozefowska, Mika, & Waligora, 2011for a recent survey). As such, they share common assumptions that wediscuss in this survey to provide a grid for classifying TCQTP. In TCQTPstudied here, quality of any activity is measured by an indicator varyingbetween 0 and 1 and so is the overall project quality for it is defined as afunction of quality levels attained by individual activities. We analyse
the meaning of such an indicator, its acceptable level as well as ag-gregation methods used to derive the project quality.
The remainder of this paper is organised as follows. Section 2 dis-cusses the definition and measure of quality and analyses the impact ofacceleration on quality. Section 3 provides a classification of TCQTPbased upon modelling assumptions and solution methods, whicheventually led us to identify three main approaches. In the first one,quality is implicitly assessed through rework needed to correct nonconforming activities (Section 4). In the second one, the quality of anyactivity is expressed as a continuous function of its duration and cost(Section 5). In the last group of references, quality of an activity isestimated in each of its possible execution modes, a mode corre-sponding to a specific combination of resources to process the activitywith an associated duration and cost. Section 7 provides a summary ofthe contributions in terms of resource category, activity quality andproject quality definitions, solution approaches and project instancesbeing addressed.
2. Definition and measure of quality and impact of acceleration
Garvin (1984) proposes several dimensions of quality from whichwe select conformance (match with specifications) as opposed to per-ceived quality which is the most subjective dimension. Conformancemakes quality a measure variable whereas perceived quality is a usefulconcept in the early design stages of a new product. As an example,
https://doi.org/10.1016/j.cie.2018.01.012Received 18 August 2017; Received in revised form 7 January 2018; Accepted 16 January 2018
⁎ Corresponding author.E-mail address: [email protected] (J. Jeunet).
Computers & Industrial Engineering 118 (2018) 319–328
Available online 09 February 20180360-8352/ © 2018 Elsevier Ltd. All rights reserved.
T
smell intensity of car interior is a component of perceived quality. Athorough analysis of perceived quality may be found in Stylidis,Wickman, and Soderberg (2015). For non innovative projects that areunder the scope of this survey, quality as conformance to customerspecifications and to technical requirements is the relevant definition.Customer specifications involve requirements related to aesthetics (fitsand finishes) or to the utilisation of high quality components and rawmaterials to ensure a longer product life. These specifications may bechanged to lower requirements to shorten the project duration. Con-versely, technical requirements can hardly be modified for they guar-antee product functionality, environmental constraints satisfaction anda level of excellence set by the company.
Consider for instance the paint activity in a manufacturing projectsuch as a high speed train. Some flaws are acceptable whereas othersare not. Mandatory technical requirements include, amongst others,compliance with a specific chemical composition of the paint to fulfilenvironmental requirements or compliance with pre-determined paintzones. If a visible paint zone is not respected, the company will decidefor a rework since the aesthetic of the train is critical to its image ofexcellence even if this flaw does not question the product functionalityor its durability. Conversely a slight hue defect may be considered asacceptable for the company but not for the customer unless he is willingto downgrade his requirements to save time on the project duration. Insuch a case quality will be below its maximum level.
Quality of an activity can therefore be measured as a percentage ofthe checked items in its quality control inspection checklist (see forinstance Mohammadipour & Sadjadi, 2016; Fu & Zhang, 2016; Babu &Suresh, 1996; Khang & Myint, 1999). The highest possible quality isequal to one meaning that 100% of the items are checked and may bereached primarily in normal production conditions where the project isnot accelerated or said to be executed in a normal mode which corre-sponds to the minimum resource allocation (Weglarz et al., 2011).
A minimum level for an activity quality may correspond to theproportion of unacceptable flaws in its checklist. Thus, imposing such aminimum quality level on activities would allow for accelerationwithout rework, on average. However in all papers tackling TCQTP butone, a minimum level is required for the project quality only, which ismostly defined as the average of qualities of its activities. Such an ag-gregation may imply that the project quality can attain the requiredlevel with unacceptable qualities for some of the project activities. Itshould be noted that when no flaw is tolerated then the evaluation ofthe quality is binary and rework is mandatory if quality does not reachits maximum level.
There is a need to expedite a project if its normal finish date doesnot meet the completion date desired by the customer or if randomevents cause the project to fall behind schedule or when there are fi-nancial incentives to finish the project ahead of schedule. This impliescompleting some of the activities faster than normal by allocating ad-ditional resources such as overtime, temporary workers or more pow-erful equipments. Thus accelerating an activity saves time but increasescosts. Besides, duration reduction negatively impacts quality becauseacceleration requires almost always additional manpower, unless infully automatised production processes, which are far from re-presenting the majority of manufacturing systems in practice. If a singleadditional resource like overtime is used to accelerate, then quality ofan activity may be expressed as an increasing continuous function ofduration since (i) overtime hours are continuously divisible and eachamount of overtime leads to a specific duration; (ii) higher durationreductions are achieved with more overtime and lower quality levelsbecause an intensive use of overtime implies fatigue and a motivationdecrease that negatively affect quality (see Li, Love, & Drew, 2000). In alot of real applications, resources are discretely divisible like machines,tools and workers so a project can be accelerated by combining for eachactivity different amounts of such heterogenous resources leading toseveral discrete execution modes to which correspond a duration, a costof these resources and a quality of the activity. Again, the quality of an
activity decreases with duration reduction due to the use of overtime ortemporary workers who crowd the workplace, which can be deleteriousto quality (Li et al., 2000).
3. Typology of Time Cost Quality Trade-off Problems
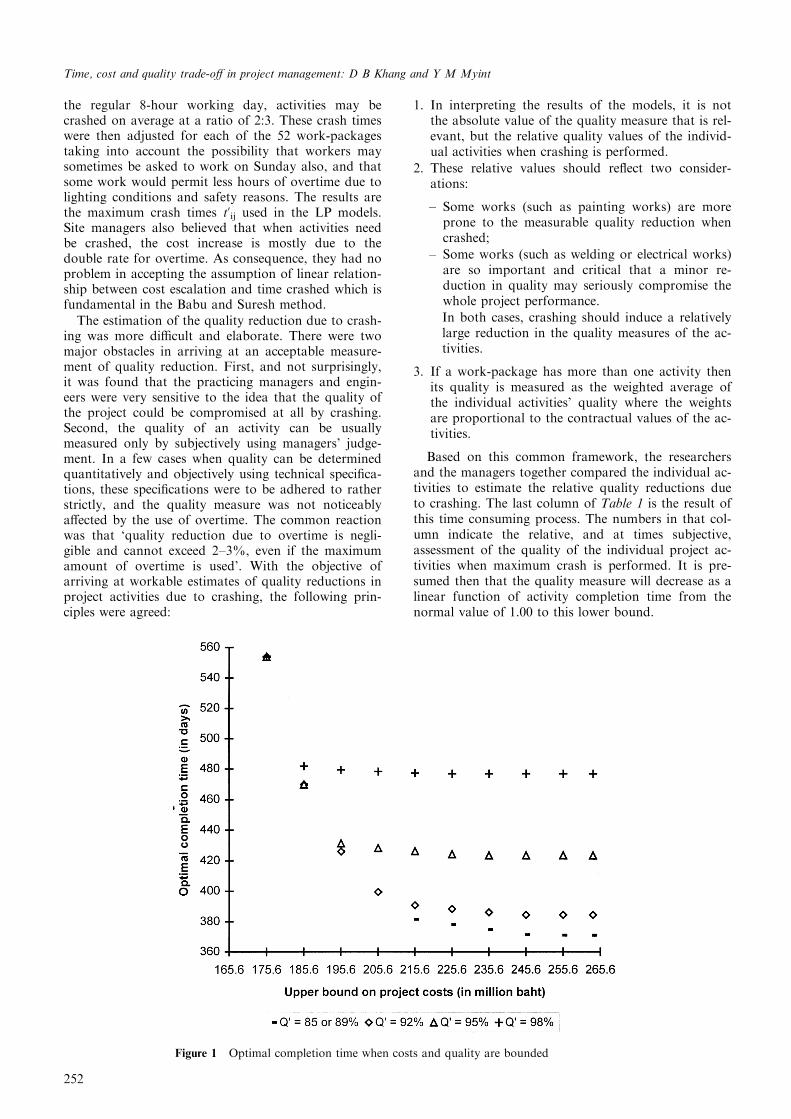
In the last five decades, there has been a great deal of research onproject management and scheduling with the aim at modelling ade-quately practical problems, and developing efficient solution ap-proaches. The focus here is on scheduling a single project (as opposed tosimultaneously scheduling multiple projects) where the project is de-fined as a collection of non preemptable activities with precedencerelationships. The main objective is to minimise the project completiontime subject to a budget constraint or to resource constraints in a de-terministic environment. Weglarz et al. (2011) survey Time Cost Trade-off Problems and propose a typology based on assumptions on thenumber of resources (single versus multiple) and on their category(continuous or discrete; renewable or not), as well as on objectives(single versus multiple) and solution approaches (exact or heuristic). AsTime Cost Quality Trade-off problems in the literature follow sameassumptions, it is important to classify them according to this typologyso as to outline the problem type being addressed. Thus, we first studyhow the quality factor is integrated in Time Cost Trade-off Problemsand which solution approaches have been implemented (Section 3.1).We then analyse how quality of an activity is modelled in these pro-blems (Section 3.2).
3.1. Integrating quality in Time Cost Trade-off Problems and solutionapproaches
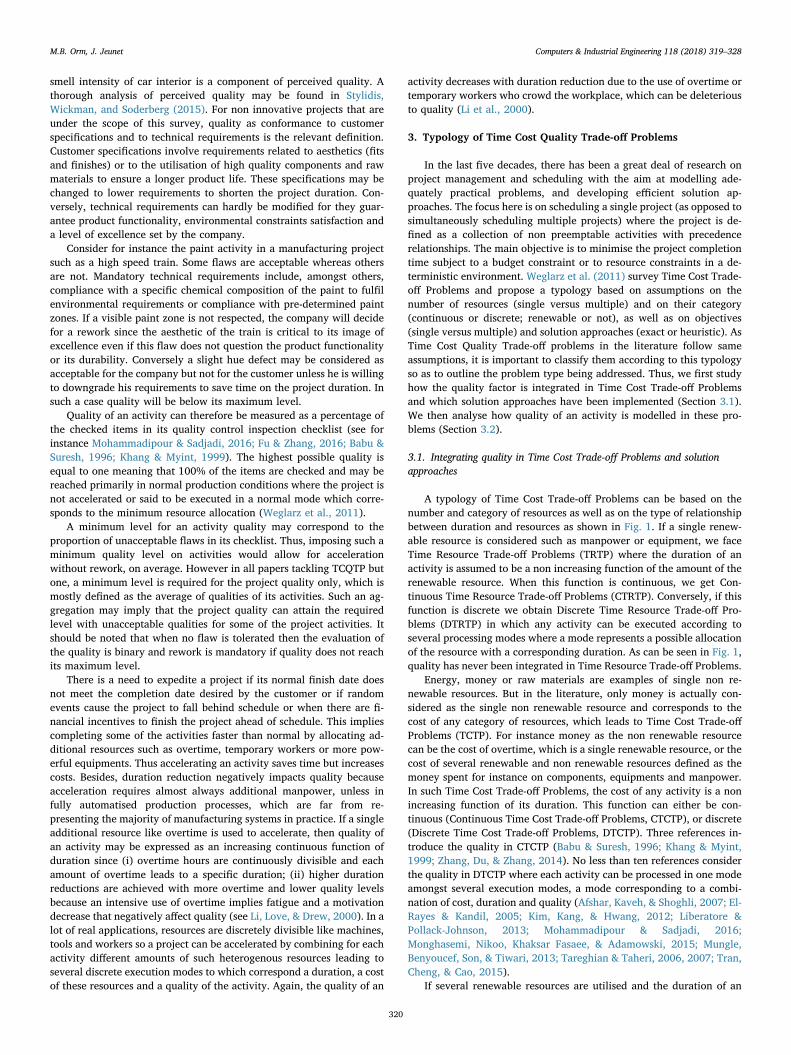
A typology of Time Cost Trade-off Problems can be based on thenumber and category of resources as well as on the type of relationshipbetween duration and resources as shown in Fig. 1. If a single renew-able resource is considered such as manpower or equipment, we faceTime Resource Trade-off Problems (TRTP) where the duration of anactivity is assumed to be a non increasing function of the amount of therenewable resource. When this function is continuous, we get Con-tinuous Time Resource Trade-off Problems (CTRTP). Conversely, if thisfunction is discrete we obtain Discrete Time Resource Trade-off Pro-blems (DTRTP) in which any activity can be executed according toseveral processing modes where a mode represents a possible allocationof the resource with a corresponding duration. As can be seen in Fig. 1,quality has never been integrated in Time Resource Trade-off Problems.
Energy, money or raw materials are examples of single non re-newable resources. But in the literature, only money is actually con-sidered as the single non renewable resource and corresponds to thecost of any category of resources, which leads to Time Cost Trade-offProblems (TCTP). For instance money as the non renewable resourcecan be the cost of overtime, which is a single renewable resource, or thecost of several renewable and non renewable resources defined as themoney spent for instance on components, equipments and manpower.In such Time Cost Trade-off Problems, the cost of any activity is a nonincreasing function of its duration. This function can either be con-tinuous (Continuous Time Cost Trade-off Problems, CTCTP), or discrete(Discrete Time Cost Trade-off Problems, DTCTP). Three references in-troduce the quality in CTCTP (Babu & Suresh, 1996; Khang & Myint,1999; Zhang, Du, & Zhang, 2014). No less than ten references considerthe quality in DTCTP where each activity can be processed in one modeamongst several execution modes, a mode corresponding to a combi-nation of cost, duration and quality (Afshar, Kaveh, & Shoghli, 2007; El-Rayes & Kandil, 2005; Kim, Kang, & Hwang, 2012; Liberatore &Pollack-Johnson, 2013; Mohammadipour & Sadjadi, 2016;Monghasemi, Nikoo, Khaksar Fasaee, & Adamowski, 2015; Mungle,Benyoucef, Son, & Tiwari, 2013; Tareghian & Taheri, 2006, 2007; Tran,Cheng, & Cao, 2015).
If several renewable resources are utilised and the duration of an
M.B. Orm, J. Jeunet Computers & Industrial Engineering 118 (2018) 319–328
320
activity is a non increasing discrete function of the amount of resourcesallocated to its execution, we obtain Multiple Discrete Time Cost Trade-off Problems (MDTRTP) in which the quality issue has never beenconsidered in the literature. Conversely we found four referencesdealing with quality in Multi mode Resource Constrained ProjectScheduling Problems (MRCPSP) that include renewable and/or nonrenewable resources and for which the Resource Constrained ProjectScheduling Problem (RCPSP) is a special case as there is a single ex-ecution mode (Afruzi, Najafi, Roghanian, & Mazinani, 2014; Fu &Zhang, 2016; Icmeli-Tukel & Rom, 1997; Tiwari, Patterson, & Mabert,2009).
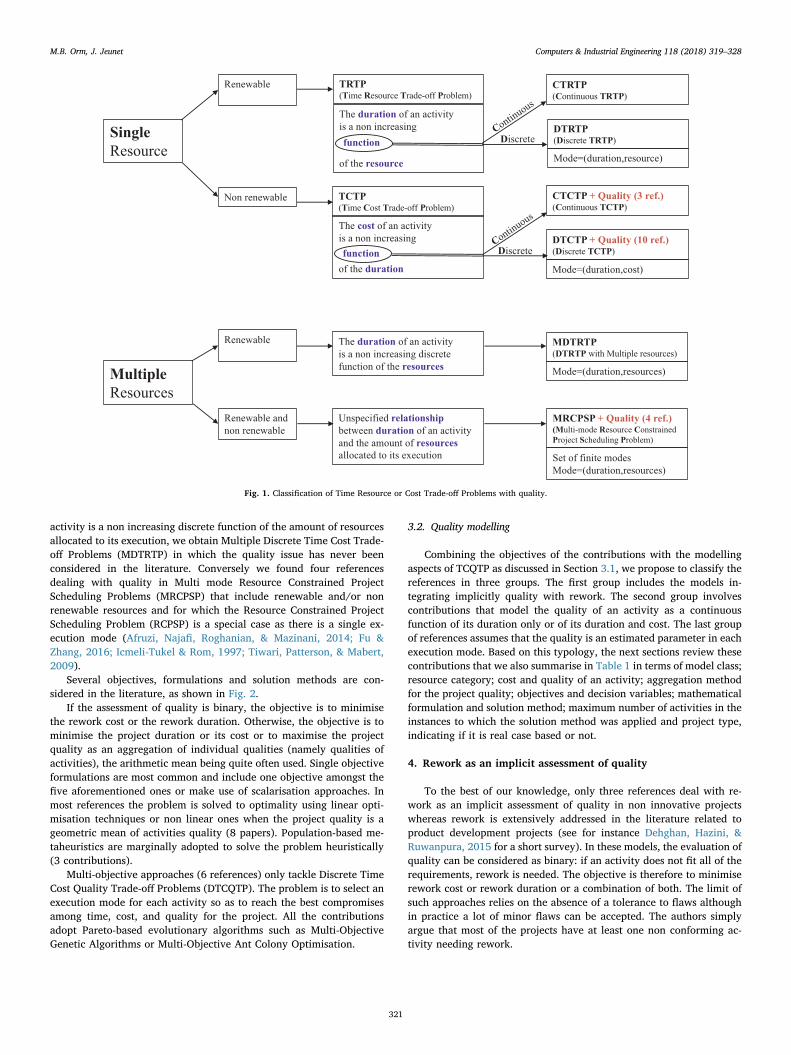
Several objectives, formulations and solution methods are con-sidered in the literature, as shown in Fig. 2.
If the assessment of quality is binary, the objective is to minimisethe rework cost or the rework duration. Otherwise, the objective is tominimise the project duration or its cost or to maximise the projectquality as an aggregation of individual qualities (namely qualities ofactivities), the arithmetic mean being quite often used. Single objectiveformulations are most common and include one objective amongst thefive aforementioned ones or make use of scalarisation approaches. Inmost references the problem is solved to optimality using linear opti-misation techniques or non linear ones when the project quality is ageometric mean of activities quality (8 papers). Population-based me-taheuristics are marginally adopted to solve the problem heuristically(3 contributions).
Multi-objective approaches (6 references) only tackle Discrete TimeCost Quality Trade-off Problems (DTCQTP). The problem is to select anexecution mode for each activity so as to reach the best compromisesamong time, cost, and quality for the project. All the contributionsadopt Pareto-based evolutionary algorithms such as Multi-ObjectiveGenetic Algorithms or Multi-Objective Ant Colony Optimisation.
3.2. Quality modelling
Combining the objectives of the contributions with the modellingaspects of TCQTP as discussed in Section 3.1, we propose to classify thereferences in three groups. The first group includes the models in-tegrating implicitly quality with rework. The second group involvescontributions that model the quality of an activity as a continuousfunction of its duration only or of its duration and cost. The last groupof references assumes that the quality is an estimated parameter in eachexecution mode. Based on this typology, the next sections review thesecontributions that we also summarise in Table 1 in terms of model class;resource category; cost and quality of an activity; aggregation methodfor the project quality; objectives and decision variables; mathematicalformulation and solution method; maximum number of activities in theinstances to which the solution method was applied and project type,indicating if it is real case based or not.
4. Rework as an implicit assessment of quality
To the best of our knowledge, only three references deal with re-work as an implicit assessment of quality in non innovative projectswhereas rework is extensively addressed in the literature related toproduct development projects (see for instance Dehghan, Hazini, &Ruwanpura, 2015 for a short survey). In these models, the evaluation ofquality can be considered as binary: if an activity does not fit all of therequirements, rework is needed. The objective is therefore to minimiserework cost or rework duration or a combination of both. The limit ofsuch approaches relies on the absence of a tolerance to flaws althoughin practice a lot of minor flaws can be accepted. The authors simplyargue that most of the projects have at least one non conforming ac-tivity needing rework.
Fig. 1. Classification of Time Resource or Cost Trade-off Problems with quality.
M.B. Orm, J. Jeunet Computers & Industrial Engineering 118 (2018) 319–328
321
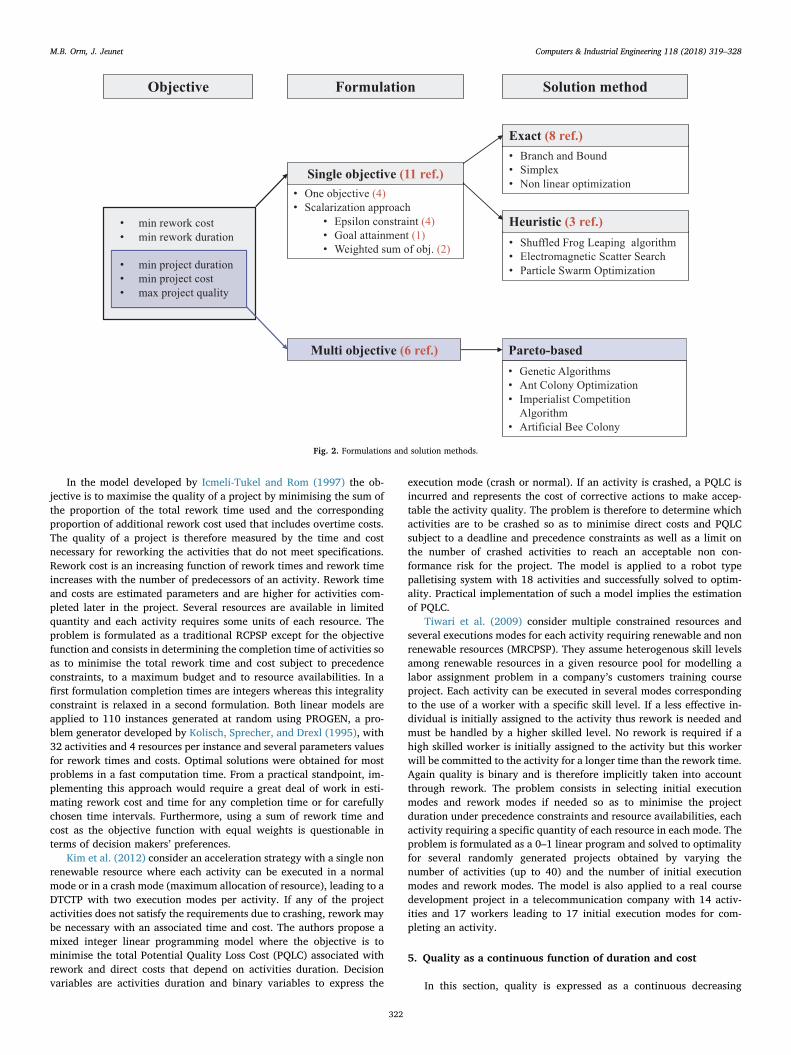
In the model developed by Icmeli-Tukel and Rom (1997) the ob-jective is to maximise the quality of a project by minimising the sum ofthe proportion of the total rework time used and the correspondingproportion of additional rework cost used that includes overtime costs.The quality of a project is therefore measured by the time and costnecessary for reworking the activities that do not meet specifications.Rework cost is an increasing function of rework times and rework timeincreases with the number of predecessors of an activity. Rework timeand costs are estimated parameters and are higher for activities com-pleted later in the project. Several resources are available in limitedquantity and each activity requires some units of each resource. Theproblem is formulated as a traditional RCPSP except for the objectivefunction and consists in determining the completion time of activities soas to minimise the total rework time and cost subject to precedenceconstraints, to a maximum budget and to resource availabilities. In afirst formulation completion times are integers whereas this integralityconstraint is relaxed in a second formulation. Both linear models areapplied to 110 instances generated at random using PROGEN, a pro-blem generator developed by Kolisch, Sprecher, and Drexl (1995), with32 activities and 4 resources per instance and several parameters valuesfor rework times and costs. Optimal solutions were obtained for mostproblems in a fast computation time. From a practical standpoint, im-plementing this approach would require a great deal of work in esti-mating rework cost and time for any completion time or for carefullychosen time intervals. Furthermore, using a sum of rework time andcost as the objective function with equal weights is questionable interms of decision makers’ preferences.
Kim et al. (2012) consider an acceleration strategy with a single nonrenewable resource where each activity can be executed in a normalmode or in a crash mode (maximum allocation of resource), leading to aDTCTP with two execution modes per activity. If any of the projectactivities does not satisfy the requirements due to crashing, rework maybe necessary with an associated time and cost. The authors propose amixed integer linear programming model where the objective is tominimise the total Potential Quality Loss Cost (PQLC) associated withrework and direct costs that depend on activities duration. Decisionvariables are activities duration and binary variables to express the
execution mode (crash or normal). If an activity is crashed, a PQLC isincurred and represents the cost of corrective actions to make accep-table the activity quality. The problem is therefore to determine whichactivities are to be crashed so as to minimise direct costs and PQLCsubject to a deadline and precedence constraints as well as a limit onthe number of crashed activities to reach an acceptable non con-formance risk for the project. The model is applied to a robot typepalletising system with 18 activities and successfully solved to optim-ality. Practical implementation of such a model implies the estimationof PQLC.
Tiwari et al. (2009) consider multiple constrained resources andseveral executions modes for each activity requiring renewable and nonrenewable resources (MRCPSP). They assume heterogenous skill levelsamong renewable resources in a given resource pool for modelling alabor assignment problem in a company’s customers training courseproject. Each activity can be executed in several modes correspondingto the use of a worker with a specific skill level. If a less effective in-dividual is initially assigned to the activity thus rework is needed andmust be handled by a higher skilled level. No rework is required if ahigh skilled worker is initially assigned to the activity but this workerwill be committed to the activity for a longer time than the rework time.Again quality is binary and is therefore implicitly taken into accountthrough rework. The problem consists in selecting initial executionmodes and rework modes if needed so as to minimise the projectduration under precedence constraints and resource availabilities, eachactivity requiring a specific quantity of each resource in each mode. Theproblem is formulated as a 0–1 linear program and solved to optimalityfor several randomly generated projects obtained by varying thenumber of activities (up to 40) and the number of initial executionmodes and rework modes. The model is also applied to a real coursedevelopment project in a telecommunication company with 14 activ-ities and 17 workers leading to 17 initial execution modes for com-pleting an activity.
5. Quality as a continuous function of duration and cost
In this section, quality is expressed as a continuous decreasing
Fig. 2. Formulations and solution methods.
M.B. Orm, J. Jeunet Computers & Industrial Engineering 118 (2018) 319–328
322
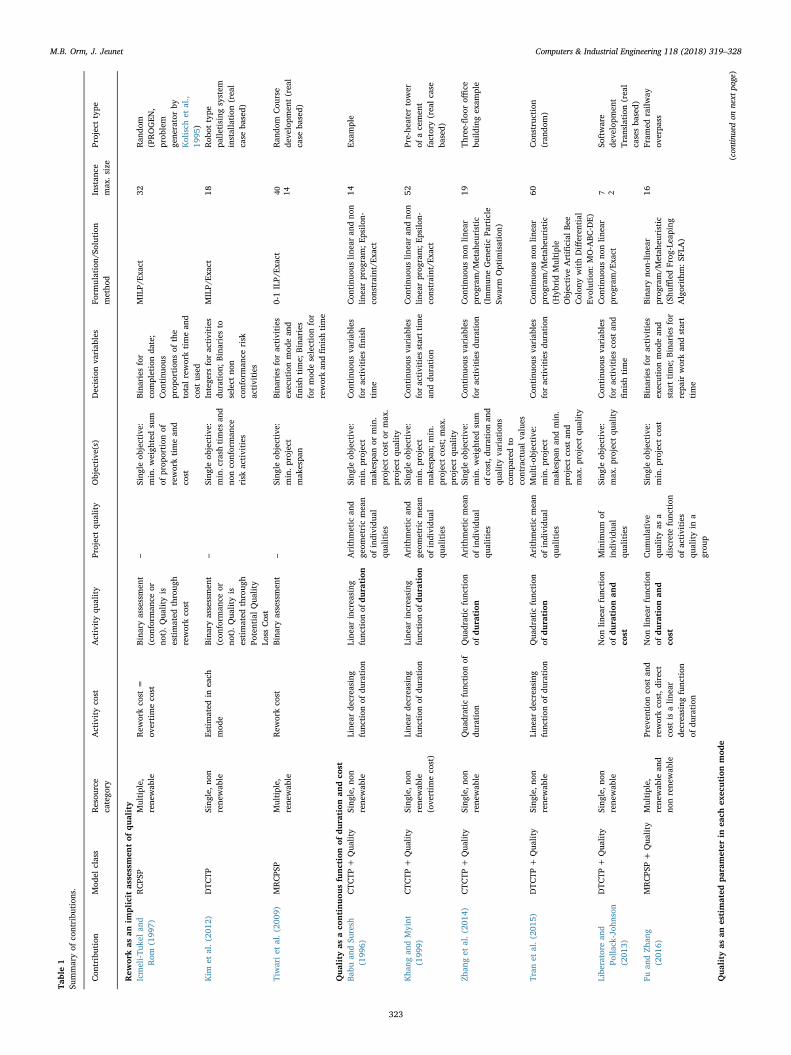
Table1
Summaryof
contribu
tion
s.
Con
tribution
Mod
elclass
Resou
rce
catego
ryActivityco
stActivityqu
ality
Projectqu
ality
Objective
(s)
Decisionva
riab
les
Form
ulation/
Solution
metho
dInstan
cemax
.size
Projecttype
Rew
orkas
anim
plicit
assessmen
tof
quality
Icmeli-Tu
kelan
dRom
(199
7)RCPS
PMultiple,
rene
wab
leRew
orkco
st=
overtimeco
stBina
ryassessmen
t(con
form
ance
orno
t).Q
ualityis
estimated
throug
hreworkco
st
–Sing
leob
jective:
min.w
eigh
tedsum
ofprop
ortion
ofreworktimean
dco
st
Bina
ries
for
completionda
te;
Con
tinu
ous
prop
ortion
sof
the
totalreworktimean
dco
stused
MILP/
Exact
32Ran
dom
(PROGEN
,prob
lem
gene
ratorby
Kolisch
etal.,
1995
)Kim
etal.(20
12)
DTC
TPSing
le,n
onrene
wab
leEstimated
ineach
mod
eBina
ryassessmen
t(con
form
ance
orno
t).Q
ualityis
estimated
throug
hPo
tentialQua
lity
Loss
Cost
–Sing
leob
jective:
min.crash
times
and
nonco
nforman
cerisk
activities
Intege
rsforactivities
duration
;Bina
ries
toselect
non
conforman
cerisk
activities
MILP/
Exact
18Rob
ottype
palle
tising
system
installation
(real
case
based)
Tiwariet
al.(20
09)
MRCPS
PMultiple,
rene
wab
leRew
orkco
stBina
ryassessmen
t–
Sing
leob
jective:
min.p
roject
mak
espa
n
Bina
ries
foractivities
executionmod
ean
dfinish
time;
Bina
ries
formod
eselectionfor
reworkan
dfinish
time
0-1ILP/
Exact
40 14Ran
dom
Cou
rse
deve
lopm
ent(real
case
based)
Qua
lity
asaco
ntinuo
usfunc
tion
ofdu
ration
andco
stBa
buan
dSu
resh
(199
6)CTC
TP+
Qua
lity
Sing
le,n
onrene
wab
leLine
arde
creasing
func
tion
ofdu
ration
Line
arincreasing
func
tion
ofdu
ration
Arithmetic
and
geom
etricmean
ofindividu
alqu
alities
Sing
leob
jective:
min.p
roject
mak
espa
nor
min.
projectco
stor
max
.projectqu
ality
Con
tinu
ousva
riab
les
foractivities
finish
time
Con
tinu
ouslin
earan
dno
nlin
earprog
ram;E
psilo
n-co
nstraint/E
xact
14Ex
ample
Kha
ngan
dMyint
(199
9)CTC
TP+
Qua
lity
Sing
le,n
onrene
wab
le(ove
rtim
eco
st)
Line
arde
creasing
func
tion
ofdu
ration
Line
arincreasing
func
tion
ofdu
ration
Arithmetic
and
geom
etricmean
ofindividu
alqu
alities
Sing
leob
jective:
min.p
roject
mak
espa
n;min.
projectco
st;max
.projectqu
ality
Con
tinu
ousva
riab
les
foractivities
starttim
ean
ddu
ration
Con
tinu
ouslin
earan
dno
nlin
earprog
ram;E
psilo
n-co
nstraint/E
xact
52Pre-he
ater
tower
ofacemen
tfactory(realcase
based)
Zhan
get
al.(20
14)
CTC
TP+
Qua
lity
Sing
le,n
onrene
wab
leQua
dratic
func
tion
ofdu
ration
Qua
dratic
func
tion
ofdu
ration
Arithmetic
mean
ofindividu
alqu
alities
Sing
leob
jective:
min.w
eigh
tedsum
ofco
st,d
urationan
dqu
alityva
riations
compa
redto
contractua
lva
lues
Con
tinu
ousva
riab
les
foractivities
duration
Con
tinu
ousno
nlin
ear
prog
ram/M
etah
euristic
(Immun
eGen
etic
Particle
Swarm
Optim
isation)
19Th
ree-floo
roffi
cebu
ildingexam
ple
Tran
etal.(20
15)
DTC
TP+
Qua
lity
Sing
le,n
onrene
wab
leLine
arde
creasing
func
tion
ofdu
ration
Qua
dratic
func
tion
ofdu
ration
Arithmetic
mean
ofindividu
alqu
alities
Multi-objective
:min.p
roject
mak
espa
nan
dmin.
projectco
stan
dmax
.project
quality
Con
tinu
ousva
riab
les
foractivities
duration
Con
tinu
ousno
nlin
ear
prog
ram/M
etah
euristic
(Hyb
ridMultiple
Objective
Artificial
Bee
Colon
ywithDifferen
tial
Evolution:
MO-ABC
-DE)
60Con
struction
(ran
dom)
Libe
ratore
and
Polla
ck-Joh
nson
(201
3)
DTC
TP+
Qua
lity
Sing
le,n
onrene
wab
leNon
linearfunc
tion
ofdu
ration
and
cost
Minim
umof
individu
alqu
alities
Sing
leob
jective:
max
.project
quality
Con
tinu
ousva
riab
les
foractivities
cost
and
finish
time
Con
tinu
ousno
nlin
ear
prog
ram/E
xact
7 2So
ftware
deve
lopm
ent
Tran
slation(real
casesba
sed)
Fuan
dZh
ang
(201
6)MRCPS
P+
Qua
lity
Multiple,
rene
wab
lean
dno
nrene
wab
le
Prev
ention
cost
and
reworkco
st,direct
cost
isalin
ear
decreasing
func
tion
ofdu
ration
Non
linearfunc
tion
ofdu
ration
and
cost
Cum
ulative
qualityas
adiscrete
func
tion
ofactivities
qualityin
agrou
p
Sing
leob
jective:
min.p
roject
cost
Bina
ries
foractivities
executionmod
ean
dstarttime;
Bina
ries
for
repa
irworkan
dstart
time
Bina
ryno
n-lin
ear
prog
ram/M
etah
euristic
(Shu
ffled
Frog
-Leaping
Algorithm
:SFL
A)
16Fram
edrailw
ayov
erpa
ss
Qua
lity
asan
estimated
parameter
inea
chex
ecutionmod
e(con
tinuedon
next
page)
M.B. Orm, J. Jeunet Computers & Industrial Engineering 118 (2018) 319–328
323
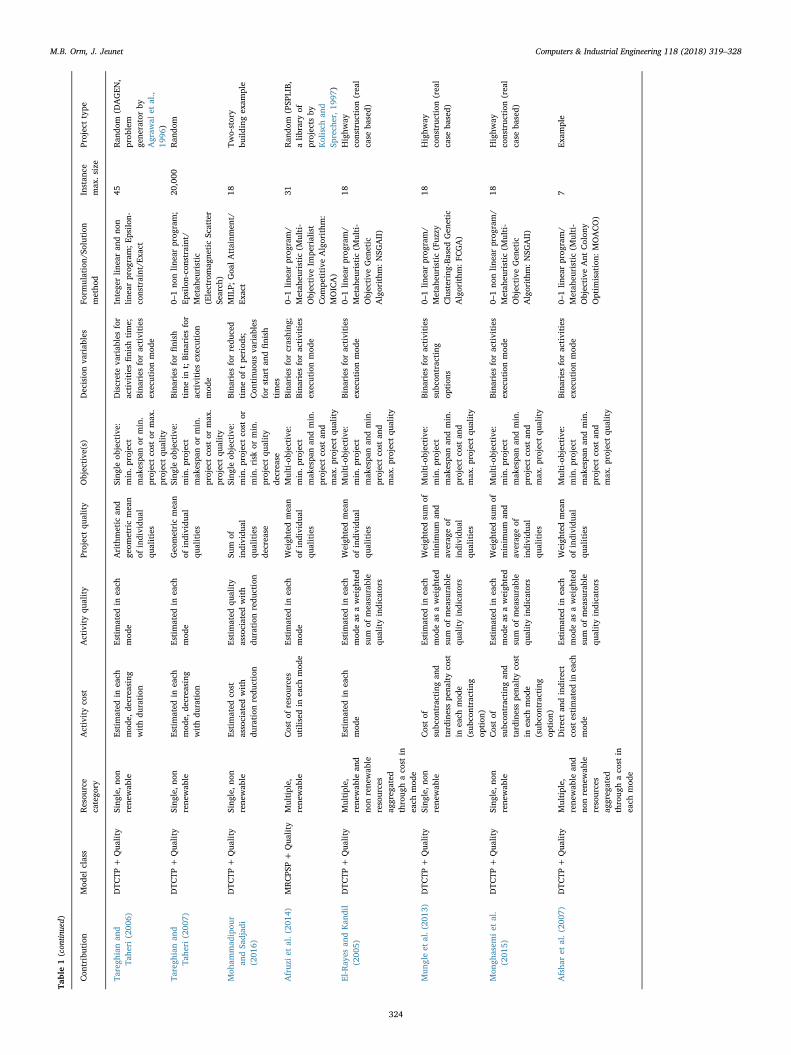
Table1(con
tinued)
Con
tribution
Mod
elclass
Resou
rce
catego
ryActivityco
stActivityqu
ality
Projectqu
ality
Objective
(s)
Decisionva
riab
les
Form
ulation/
Solution
metho
dInstan
cemax
.size
Projecttype
Taregh
ianan
dTa
heri
(200
6)DTC
TP+
Qua
lity
Sing
le,n
onrene
wab
leEstimated
ineach
mod
e,de
creasing
withdu
ration
Estimated
ineach
mod
eArithmetic
and
geom
etricmean
ofindividu
alqu
alities
Sing
leob
jective:
min.p
roject
mak
espa
nor
min.
projectco
stor
max
.projectqu
ality
Discreteva
riab
lesfor
activities
finish
time;
Bina
ries
foractivities
executionmod
e
Intege
rlin
earan
dno
nlin
earprog
ram;E
psilo
n-co
nstraint/E
xact
45Ran
dom
(DAGEN
,prob
lem
gene
ratorby
Agraw
alet
al.,
1996
)Ta
regh
ianan
dTa
heri
(200
7)DTC
TP+
Qua
lity
Sing
le,n
onrene
wab
leEstimated
ineach
mod
e,de
creasing
withdu
ration
Estimated
ineach
mod
eGeo
metricmean
ofindividu
alqu
alities
Sing
leob
jective:
min.p
roject
mak
espa
nor
min.
projectco
stor
max
.projectqu
ality
Bina
ries
forfinish
timein
t;Bina
ries
for
activities
execution
mod
e
0–1no
nlin
earprog
ram;
Epsilon-co
nstraint/
Metah
euristic
(Electromag
neticScatter
Search
)
20,000
Ran
dom
Moh
ammad
ipou
ran
dSa
djad
i(201
6)
DTC
TP+
Qua
lity
Sing
le,n
onrene
wab
leEstimated
cost
associated
with
duration
redu
ction
Estimated
quality
associated
with
duration
redu
ction
Sum
ofindividu
alqu
alities
decrease
Sing
leob
jective:
min.p
roject
cost
ormin.r
iskor
min.
projectqu
ality
decrease
Bina
ries
forredu
ced
timeof
tpe
riod
s;Con
tinu
ousva
riab
les
forstartan
dfinish
times
MILP;
Goa
lAttainm
ent/
Exact
18Tw
o-story
build
ingexam
ple
Afruz
iet
al.(20
14)
MRCPS
P+
Qua
lity
Multiple,
rene
wab
leCostof
resources
utilisedin
each
mod
eEstimated
ineach
mod
eWeigh
tedmean
ofindividu
alqu
alities
Multi-objective
:min.p
roject
mak
espa
nan
dmin.
projectco
stan
dmax
.project
quality
Bina
ries
forcrashing
;Bina
ries
foractivities
executionmod
e
0–1lin
earprog
ram/
Metah
euristic
(Multi-
Objective
Impe
rialist
Com
petitive
Algorithm
:MOICA)
31Ran
dom
(PSP
LIB,
alib
rary
ofprojects
byKolisch
and
Sprech
er,1
997)
El-Ray
esan
dKan
dil
(200
5)DTC
TP+
Qua
lity
Multiple,
rene
wab
lean
dno
nrene
wab
leresources
aggreg
ated
throug
haco
stin
each
mod
e
Estimated
ineach
mod
eEstimated
ineach
mod
eas
aweigh
ted
sum
ofmeasurable
qualityindicators
Weigh
tedmean
ofindividu
alqu
alities
Multi-objective
:min.p
roject
mak
espa
nan
dmin.
projectco
stan
dmax
.project
quality
Bina
ries
foractivities
executionmod
e0–
1lin
earprog
ram/
Metah
euristic
(Multi-
Objective
Gen
etic
Algorithm
:NSG
AII)
18Highw
ayco
nstruc
tion
(real
case
based)
Mun
gleet
al.(20
13)
DTC
TP+
Qua
lity
Sing
le,n
onrene
wab
leCostof
subc
ontracting
and
tardinesspe
naltyco
stin
each
mod
e(sub
contracting
option
)
Estimated
ineach
mod
eas
aweigh
ted
sum
ofmeasurable
qualityindicators
Weigh
tedsum
ofminim
uman
dav
erag
eof
individu
alqu
alities
Multi-objective
:min.p
roject
mak
espa
nan
dmin.
projectco
stan
dmax
.project
quality
Bina
ries
foractivities
subc
ontracting
option
s
0–1lin
earprog
ram/
Metah
euristic
(Fuz
zyClustering-Ba
sedGen
etic
Algorithm
:FCGA)
18Highw
ayco
nstruc
tion
(real
case
based)
Mon
ghasem
iet
al.
(201
5)DTC
TP+
Qua
lity
Sing
le,n
onrene
wab
leCostof
subc
ontracting
and
tardinesspe
naltyco
stin
each
mod
e(sub
contracting
option
)
Estimated
ineach
mod
eas
aweigh
ted
sum
ofmeasurable
qualityindicators
Weigh
tedsum
ofminim
uman
dav
erag
eof
individu
alqu
alities
Multi-objective
:min.p
roject
mak
espa
nan
dmin.
projectco
stan
dmax
.project
quality
Bina
ries
foractivities
executionmod
e0–
1no
nlin
earprog
ram/
Metah
euristic
(Multi-
Objective
Gen
etic
Algorithm
:NSG
AII)
18Highw
ayco
nstruc
tion
(real
case
based)
Afsha
ret
al.(20
07)
DTC
TP+
Qua
lity
Multiple,
rene
wab
lean
dno
nrene
wab
leresources
aggreg
ated
throug
haco
stin
each
mod
e
Directan
dindirect
costestimated
ineach
mod
e
Estimated
ineach
mod
eas
aweigh
ted
sum
ofmeasurable
qualityindicators
Weigh
tedmean
ofindividu
alqu
alities
Multi-objective
:min.p
roject
mak
espa
nan
dmin.
projectco
stan
dmax
.project
quality
Bina
ries
foractivities
executionmod
e0–
1lin
earprog
ram/
Metah
euristic
(Multi-
Objective
Ant
Colon
yOptim
isation:
MOACO)
7Ex
ample
M.B. Orm, J. Jeunet Computers & Industrial Engineering 118 (2018) 319–328
324

function of duration only (Section 5.1). The use of overtime to accel-erate a project may support this statement as overtime implies fatiguewhich impacts quality. Quality is also assumed to be dependent notonly on duration but also on the amount of money (cost) dedicated tothe execution of an activity since spending more is assumed to increasequality (Section 5.2).
5.1. Quality as a function of duration only
Amongst the four contributions we analyse here, the first two onesassume the cost and quality of an activity to be linear with its duration.This means that the marginal productivity is constant and the marginalquality loss related to each unit time of duration reduction is alsoconstant. These assumptions can be restrictive in practice and are re-laxed in the last two references that consider diminishing marginalproductivity and increasing marginal quality loss.
5.1.1. Quality as a linear increasing function of durationTo the best of our knowledge, Babu and Suresh (1996) are the first
authors who model the impact of acceleration on quality where the costof any activity is an affine function of its duration and bounded by itscrashed duration and cost (maximum resource allocation) and by itsnormal duration and cost, these four parameters being estimated byexperts. Similarly, the quality of an activity is an affine function of itsduration and normal and crashed quality parameters are also assumedto be estimated by experts. The authors adopt a scalarisation approachusing the epsilon constraint method where a single objective function isoptimised whereas the other objectives are expressed as constraints.Thus a first optimisation program is to minimise the project completiontime under a budget constraint and the project quality defined as thesum of individual qualities must reach a given threshold. In a secondprogram, the project total cost is minimised under a deadline constraintand a minimum level for the project quality. The last program max-imises the project quality under a deadline constraint and a budgetconstraint. To compute the project quality, the geometric mean of ac-tivities quality is also used for it is relevant when individual qualitiesare dispersed. Additionally, the project quality is defined as theminimum of activities quality for a project can be viewed as an in-tegrated set of activities so its quality can be assumed to be only as highas its weakest activity quality. These programming models are appliedto an illustrative example of a 14-activity project and solved to op-timality with results showing the intertwined effects of time, cost andquality.
Khang and Myint (1999) apply the model developed by Babu andSuresh (1996) to an actual construction project of a pre-heater tower ofa cement factory with 52 activities that is accelerated using overtimeonly. Duration, cost and quality in the normal and crash modes areestimated by experts. They also adopt the assumption of cost andquality as affine functions of the duration and consider the mean (ar-ithmetic and geometric) of activities quality to define the projectquality. Results show that for each given quality level, there exists abudget threshold beyond which it would be extremely expensive toaccelerate further. Besides, the authors point out the difficulty to assessthe quality reduction in the crash mode (maximum use of overtime) andclaim that the linearity assumption between quality and time is ques-tionable. As acceleration is performed with overtime for more than ayear to complete the project, the linearity assumption between qualityand duration may not hold since it has been shown that a decline inmarginal quality is observed after proceeding with overtime work dueto fatigue and decrease in motivation (Li et al., 2000). Ultimatelyproductivity of overtime hours is reduced as a result of fatigue, lowmorale, a higher accident rate, and because workers tend to save effort,adjusting for a longer day or week (Hanna & Sullivan, 2004).
5.1.2. Quality as a non linear increasing function of durationContrary to both previous contributions, Zhang et al. (2014) posit
that longer processing times do not always lead to a better quality. First,beyond a duration threshold, quality may degrade as is the case forinstance in construction for concreting and compaction activities.Second, the last unit of duration decrease is associated with a highermarginal quality loss than the one corresponding to the first unit ofduration reduction. This is consistent for overtime as explained pre-viously. The quality of an activity is therefore defined as a quadraticfunction of its duration and the authors suggest that parameters of thisfunction can be provided by the project engineers. The project quality ismeasured by the sum of individual activities quality and the projecttotal cost include costs related to the duration of each activity andtardiness costs. The cost of an activity is also assumed to be a quadraticfunction of its duration to reflect diminishing marginal productivity.The objective is to minimise the weighted sum of deviations betweenthe project cost, duration and quality and their contractual values. Asolution approach based on particle swarm optimisation is applied to anexample of an office building project with 19 activities.
Tran et al. (2015) adopt the definition of individual quality asproposed by Zhang et al. (2014) as a quadratic function of duration andthe project quality is expressed as a mean of individual qualities. Butthe cost here is a linear decreasing function of duration. The authorsconsider for each activity several execution modes with an estimatedduration in each mode on one hand and quality and cost computedaccording to their respective functions of duration on the other hand.The resulting DTCQTP is addressed by a multi-objective algorithmbased upon Artificial Bee Colony and implemented on an example of aconstruction project with 60 activities and a maximum of 5 modes peractivity. Simulation results show the superiority of this algorithm interms of compromise solution compared with four multi-objective ap-proaches including NSGAII. The focus is therefore on the developmentof an efficient multi-objective algorithm rather than on problem mod-elling.
It should be noted that none of these two papers provide a detailedmethodology to estimate in practice the parameters of the quadraticfunctions.
5.2. Quality as a non linear function of duration and cost
In an attempt to capture reality more closely, Liberatore andLiberatore and Pollack-Johnson (2013) model the quality of an activityas a non linear function of its duration and cost, assuming the followingproperties: (i) if duration is fixed, spending more money increasesquality; (ii) if cost is fixed, quality increases with duration. For instance,an expensive high skilled worker will provide over a same durationbetter quality work than a less expensive lower skilled worker. Fur-thermore, if the high skilled worker costs twice as much as the lowskilled worker, the second property means that the low skilled workerwill produce a higher quality outcome spending two days on an activitythan the high skilled worker for one day on same activity. The authorsalso assume that to maintain the same level of quality, one has to payincreasingly more money per unit time of duration reduction.
As a bivariate normal distribution in probability reflects these as-sumptions, the quality of an activity is expressed as a bivariate normalfunction of its cost and duration, with parameters values of the functionthat can be determined applying non linear least squares estimation onseveral observations of duration, cost and quality. The main objective isto maximise the project quality defined as the minimum of individualqualities subject to budget and deadline constraints; the decision vari-ables are the duration and cost for each activity which determine thequality. A goal programming approach is adopted and the corre-sponding non linear programs are applied to a translation project with 2parallel activities (2 documents to be translated) and to a softwaredevelopment example with 7 activities. For both examples, the authorsdescribe in detail the methodology to estimate the parameters of thebivariate normal quality functions.
Quite recently, Fu and Zhang (2016) also suggest to model the
M.B. Orm, J. Jeunet Computers & Industrial Engineering 118 (2018) 319–328
325

individual quality as a non linear function of its duration and cost,based upon the assumptions of Liberatore and Liberatore and Pollack-Johnson (2013). The quality function integrates an additional para-meter to adjust the surface shape and when this parameter is zero, thefunction is the same as Liberatore and Pollack-Johnson (2013). Thisfunction expresses that (i) quality of an activity is increasing with itsduration and cost; (ii) for a given level of quality, the relationship be-tween cost and duration is decreasing and convex since more moneymust be spent for each unit time reduction. Parameters of the functioncan also be determined using non linear least squares estimation onseveral observations.
In addition, the authors introduce the meaningful concept of cu-mulative quality since quality of an activity not only depends on its ownquality but also on the quality of its predecessors. To illustrate, consider3 activities in a construction project where activity 1 is precast pile,activity 2 is precast roof truss and activity 3 is lifting, with activities 1and 2 as predecessors. As activities 1 and 2 can be processed in parallel,their joint quality can be computed as the mean of their individualqualities. Quality of activity 3 not only depends on its own quality butalso on the joint quality of activities 1 and 2 as low qualities of precastpile and precast roof truss with good lifting would not improve theproject quality. The quality of this group of 3 activities is the quality ofactivity 3 multiplied by the average quality of activities 1 and 2 fol-lowing a computation similar to conditional probability. In such agroup, activities are therefore not only bonded by precedence re-lationships but also by a coordinative relationship. Thus, the activitiesof a project can be partitioned in several groups of dependent activitieswith an overall quality computed as described in the above example. Ifthe cumulative quality of a group is lower than a given threshold, re-work is required. The objective is to select execution modes for activ-ities so as to minimise rework costs and direct costs that decrease lin-early with duration, subject to precedence constraints and resourceavailabilities. This non linear program is solved using a metaheuristicapproach: a Shuffled Frog Leaping Algorithm which is based on ParticleSwarm Optimisation and Genetic Algorithms. The approach is appliedto an example of a framed railway overpass construction project with14 activities.
Practical implementation of these approaches requires to collectenough observations of quality, duration and cost for each activity toobtain sharp parameters estimates of the quality function. Furthermoresame quality function is assumed for all activities but may not be sui-table for all of them, and incidentally Fu and Zhang (2016) report thatfor a pit excavation activity the data fitting was “relatively acceptable.”This contribution has however the merit of considering dependencyrelationships between activities quality and to define an overall qualitylevel for a group of quality dependent activities below which rework isneeded.
6. Quality as an estimated parameter in each execution mode
All the contributions but one that we present in this Section tacklethe Discrete Time Cost Quality Trade-off Problem. The quality of anactivity is always assumed to be an estimated parameter in each ex-ecution mode. In Section 6.1 models are applied to randomly generatedinstances so that no methodology to estimate the quality is developed.By contrast, Section 6.2 groups the references dealing with real con-struction projects where the quality of an activity is expressed as aweighted sum of objectively measurable quality indicators in each of itsexecution modes.
6.1. Models with randomly generated instances
Tareghian and Taheri (2006) add the quality factor in a DiscreteTime Cost Trade-off Problem to get the Discrete Time Cost Quality
Trade-off Problem (DTCQTP). Each activity can be executed in a singlemode amongst several possible modes and to each mode correspond aduration, a cost and a quality that are assumed to be estimated by ex-perts, where the cost decreases with duration and quality increases withduration. The problem is formulated as a standard DTCTP with theadditional objective of quality maximisation where the decision vari-ables are binary variables indicating for each activity its executionmode. As in Babu and Suresh (1996) the project quality is the mean ofindividual qualities and the epsilon constraint method is also adopted.The binary linear programs are applied to 45-activity randomly gen-erated projects using DAGEN, a problem generator developed byAgrawal, Elmaghraby, and Herroelen (1996), and solved to optimality.Simulation results show that with higher budgets, shorter deadlines canbe reached at all project quality levels. Higher project quality levels andshorter project durations can also be obtained with higher budgets.Similar results are obtained when the project quality is defined as thegeometric mean of individual qualities for they are not very dispersed.Later on, the same authors (Tareghian & Taheri, 2007) utilise thegeometric mean only for quality aggregation leading to non linearprograms and develop an electromagnetic scatter search heuristic so-lution approach to solve randomly generated problems up to 20,000activities with a maximum of 15 processing modes per activity.
Recently, Mohammadipour and Sadjadi (2016) also consider theDTCQTP where each execution mode for any activity corresponds to agiven duration reduction. Decision variables are binary variables takinga value of one if the duration of an activity is decreased by a givennumber of periods and zero otherwise. Duration reduction implies acost increase and a quality decrease that are estimated by experts. Buttime reduction can also lead to a more global risk impacting on dif-ferent project objectives like cost, duration, quality and project scopes.The authors therefore consider three objectives to minimise: the totalextra cost, the total risk enhancement and the total quality reduction.The problem is formulated as a mixed integer linear program and a Goalattainment approach is used to solve 50 randomly generated instancesbased on a an example of a two-story building construction project with18 activities.
To the best of our knowledge, Afruzi et al. (2014) are the only au-thors who introduce the quality factor in a Multi Resources ConstrainedProject Scheduling Problem (MRCPSP) where processing modes can bedependent: if one activity is executed in a specific mode, the activitysuccessor must be processed in a compatible mode, thus reducing theset of possible modes for this activity. Besides, for each mode, an ac-tivity can be executed in a crash way (maximum allocation of re-sources) or in a normal way. For each activity, to the normal way ineach mode correspond a normal (maximum) duration, a maximumquality and a vector of renewable resources consumption to which costsare respectively associated. Equivalent definitions hold for the crashingway with a minimum duration, a minimum quality and a larger re-sources consumption. These parameters are estimated in each mode andin each processing way (crash or not). The project quality is a weightedsum of individual qualities with weights that must also be estimated.The problem is to select modes and processing ways so as to obtainsolutions with a good compromise between project duration, cost andquality. A Multi-Objective Imperialist Competitive Algorithm (MOICA)is used to solve the problem, where each solution is coded by threevectors describing respectively: the order in which activities are pro-cessed; the selected modes and the selected ways. In each empire, initialcolonies are merged with populations obtained by application of severaloperators on these initial colonies and non dominated solutions aremoved to an archive. The best colonies are selected whereas the othersare deleted. The algorithm is applied to 25 instances from PSPLIB, alibrary of projects developed by Kolisch and Sprecher (1997) with13–31 activities and 2–4 resources. The performance of MOICA iscompared with four other multi-objective metaheuristic algorithms and
M.B. Orm, J. Jeunet Computers & Industrial Engineering 118 (2018) 319–328
326
simulation results show the superiority of MOICA over NSGAII but re-quires a larger computational time.
6.2. Exploiting a database of quality indicators for quality estimation ineach mode
In the following references, more efforts are made to provide anestimation of the quality of an activity in each of its execution modes,exploiting a database of measurable quality indicators but related tohighway construction only. The methodology could however be im-plemented on any project for which there would exist a freely accessibledatabase of quality indicators, which most likely applies to publicprojects executed many times in the past. In all these contributions, thequality of an activity in each execution mode is expressed as a weightedsum of quality indicator values without specifying how the weightswere set.
El-Rayes and Kandil (2005) consider the DTCQTP for a highwayconstruction where each activity can be processed in several modescorresponding to specific combinations of several resources such asmaterial, crew and overtime. Again, we have the following properties.If duration is fixed, spending more money increases quality by the useof higher quality components or more sophisticated machines for ex-ample. If cost is fixed, quality increases with duration. For instance twomodes may have same cost if mode 1 uses low quality components andovertime and mode 2 uses high quality components and no overtime,then quality and duration in mode 1 are lower than their values inmode 2.
To each mode is associated the cost of the corresponding resourcesand a duration. For each activity there is a list of several quality in-dicators and each indicator takes a specific value when the activity isprocessed in a given mode. For instance, the concrete pavement activitycan be processed using a more or less powerful paving machine anddifferent concrete materials leading to several modes in which qualityindicators such as air content or thickness of the pavement take dif-ferent values. Each quality indicator has a weight to reflect its con-tribution to the quality of the activity but the authors do not explainhow the weights were set. The project overall quality is expressed as aweighted sum of individual qualities but again no information is pro-vided on the way these weights were determined. The authors adopt amulti-objective optimisation approach using a Non Sorted GeneticAlgorithm (NSGAII) to solve a highway construction project with 18activities and up to 5 modes per activity.
Mungle et al. (2013) also consider a highway construction projectwhere processing modes for activities correspond to subcontractingoptions. Like El-Rayes and Kandil (2005) they exploit a database ofquality indicators, durations and costs for identical construction pro-jects. An analytic hierarchy process (AHP) technique is used to assessthe quality of subcontractors for each activity in the project: qualityindicators are ranked and a weight is assigned to them in each mode soas to obtain the quality of an activity for each subcontractor (mode).The project quality is defined as a weighted sum of the minimum in-dividual quality and the average of all individual qualities where a highweight on the minimum ensures that no individual activity has a toolow quality level whereas a lower weight implies that the focus is moreon the overall average of individual qualities. The project cost is thesum of direct and indirect costs of subcontracting, tardiness penalty costminus earliness bonus. The problem is to select modes (subcontractors)for activities so as to get the Pareto-optimal set where each Pareto-optimal solution represents a compromise between project duration,cost and quality. The authors point out that the Pareto set of solutionscan be large and thus difficult to analyse and comprehend. They thuspropose a Fuzzy Clustering Genetic Algorithm approach to reduce thePareto set to a desirable size. An elitist strategy is used to reduce thearchived list of the best non dominated solutions by clustering this list.Instead of selecting the centroid in each cluster, the authors use a fuzzymembership function to determine the cluster centre. A simulation
study based upon the same 18-activity highway construction projectshows the ability of their approach to generate a better Pareto frontthan existing approaches such that Multi-Objective Genetic Algorithmand Multi-Objective Particle Swarm Optimisation.
Monghasemi et al. (2015) note that the approach developed byMungle et al. (2013) although helpful to reduce the Pareto set cannotimpart multiple criteria. They suggest that a Multi Criteria Decision-Making (MCDM) approach should be implemented to select the bestnon dominated solution according to decision makers’ preferences.They combine a NSGAII with a Shannon entropy technique to assignweights for each sub-objective (project duration, cost and quality) andthey apply the methodology to the same highway construction projectwith 18 activities.
Afshar et al. (2007) deal with the DTCQTP using same definitions ofindividual qualities and project quality as the ones proposed by El-Rayes and Kandil (2005). They develop a Multi-Objective Ant ColonyOptimisation where there is one colony per objective, considering firstthe objective of minimising the project duration, then cost minimisationand lastly, quality maximisation. Thus, ants of the first colony seek tofind solutions that minimise the project duration. These solutions aretransferred to the second colony where they are assessed in terms ofcost and the pheromone global trail is updated accordingly. New so-lutions based upon this pheromone trail are transferred to the thirdcolony; their quality is computed and the pheromone trail is againupdated. This iterative process of successive solutions transfers con-tinues until a limited number of iterations called a cycle is reached. Atthe end of each cycle, solutions in the third colony are also assessed interms of duration and cost and non dominated solutions are recorded inan archive. The pheromone rate is set to its initial value at the begin-ning of each cycle and the algorithm stops after a predeterminednumber of cycles. Surprisingly, the approach is not applied to the 18-activity highway construction project but to an example with a verylimited number of activities (7 only). Furthermore, no performancecomparison is made with existing solution approaches such as theNSGAII proposed by El-Rayes and Kandil (2005).
7. Summary and conclusions
Based upon the previous literature review, we draw the followingsummary and conclusions.
• Resources. The vast majority of Time Cost Quality Trade-offProblems studied here consider a single non renewable resource in acontinuous framework (CTCTP and Quality) or in a discrete one(DTCTP and Quality). One paper deals with RCSP and rework wherequality is not explicitly taken into account (Icmeli-Tukel & Rom,1997) and two contributions tackle MRCPSP where quality is ex-plicitly considered with possible rework (Fu & Zhang, 2016) andwithout rework (Afruzi et al., 2014). Quality factor is never in-troduced in DTRTP or MDTRTP so the quality is never modelled as afunction of resources.
• Activity quality. When not estimated in each execution mode, activityquality is assumed to be a continuous function of duration only orduration and cost. Quality is a linear increasing function of durationin Babu and Suresh (1996) and Khang and Myint (1999). Quality is aquadratic function of duration in Zhang et al. (2014) and Tran et al.(2015). Quality is expressed as a non linear function of duration andcost in Liberatore and Pollack-Johnson (2013) and in Fu and Zhang(2016). Let us note that quality of an activity has never been for-mulated directly as a function of resources such as manpower. Ra-ther, quality depends on cost which depends itself on resources.However it has been shown that quality degrades when additionalmanpower is used for acceleration due to overmanning and over-time (see Li et al., 2000). It would therefore be possible to formulatesuch a direct relationship between quality and manpower to model aDTRTP with quality.
M.B. Orm, J. Jeunet Computers & Industrial Engineering 118 (2018) 319–328
327
• Project quality. In most papers, project quality is expressed as anarithmetic mean of individual qualities or a geometric mean whenindividual qualities are dispersed. Such an aggregation has a majorflaw: project quality can reach a desired level with individual qua-lities below acceptable levels. To cope with this aggregation pro-blem, project quality can be expressed as a combination of theminimum and average of individual qualities (Mungle et al., 2013)or only as the minimum of activities quality (Babu & Suresh, 1996;Liberatore & Pollack-Johnson, 2013). But project quality expressedas the minimum of activities quality is quite questionable since ac-tivities differ in their contribution to the project quality. Consideringfor example a construction project, the foundation is crucial tostability of the building so taking the quality of plastering ifminimum as a measure of project quality would make no sense.More relevant is the contribution of Fu and Zhang (2016) that is theonly one to impose a minimum level to cumulated quality of subsetsof dependent activities so as to avoid rework.
• Solution approaches. Multi-objective algorithms are less employedthan single-objective formulations. These multi-objective ap-proaches all seek for Pareto optimal solutions, with two major dif-ficulties: the obtained Pareto set may not be well distributed andmay be very large which raises the question of how to choose aspecific solution. Surprisingly, a lexicographic approach has neverbeen implemented although it is recognised that minimising projectduration is the most important goal for managers, then come costconsiderations and finally quality improvements (see for instanceKhang & Myint, 1999 or Mungle et al., 2013).
• Project instances. Amongst all papers, only six different real casebased projects are considered, two of them with a very limitednumber of activities (2 activities for a translation project and 7 ac-tivities for a software project), one course development project with14 activities, two projects with 18 activities (highway constructionand robot type palletisation system) and only one large project with52 activities (pre-heater tower of a cement factory).
References
Afruzi, E. N., Najafi, A. A., Roghanian, E., & Mazinani, M. (2014). A Multi-ObjectiveImperialist Competitive Algorithm for solving discrete time, cost and quality trade-offproblems with mode-identity and resource-constrained situations. Computers andOperations Research, 50, 80–96.
Afshar, A., Kaveh, A., & Shoghli, O. R. (2007). Multi-objective optimisation of time-cost-quality using multi-colony ant algorithm. Asian Journal of Civil Engineering, 8,113–124.
Agrawal, M. K., Elmaghraby, S. E., & Herroelen, W. (1996). DAGEN: A generator of testsets for project activity nets. European Journal of Operational Research, 90, 376–382.
Babu, A. J. G., & Suresh, N. (1996). Project management with time, cost, and qualityconsiderations. European Journal of Operational Research, 88, 320–327.
Dehghan, R., Hazini, K., & Ruwanpura, J. (2015). Optimization of overlapping activitiesin the design phase of construction projects. Automation in Construction, 59, 81–95.
El-Rayes, K., & Kandil, A. (2005). Time-cost-quality trade-off analysis for highway con-struction. Journal of Construction Engineering and Management, 131, 477–486.
Fu, F., & Zhang, T. (2016). A new model for molving Time-Cost-Quality Trade-OffProblems in construction. Plos One. doi:http://dx.doi.org/10.1371/journal.pone.0167142.
Garvin, D. (1984). What does product quality really mean?MIT Sloan Management Review,26, 25–43.
Hanna, A. S., & Sullivan, K. T. (2004). Impact of overtime on construction labor pro-ductivity. Cost Engineering (Morgantown, West Virginia), 46(4), 20–27.
Icmeli-Tukel, O., & Rom, W. O. (1997). Ensuring quality in resource constrained projectscheduling. European Journal of Operational Research, 103, 493–496.
Khang, D. B., & Myint, Y. M. (1999). Time, cost and quality trade-off in project man-agement: A case study. International Journal of Project Management, 17, 249–256.
Kim, J. Y., Kang, C. W., & Hwang, I. (2012). A practical approach to project scheduling:considering the potential quality loss cost in the time-cost tradeoff problem.International Journal of Project Management, 30, 264–272.
Kolisch, R., & Sprecher, A. (1997). PSPLIB: A project scheduling library. European Journalof Operational Research, 96, 205–216.
Kolisch, R., Sprecher, A., & Drexl, A. (1995). Characterization and generation of a generalclass of resource-constrained project scheduling problems. Management Science, 41,1693–1703.
Liberatore, M. J., & Pollack-Johnson, B. (2013). Improving project management decisionmaking by modeling quality, time, and cost continuously. IEEE Transactions onEngineering Management, 30, 518–528.
Li, H., Love, P. E. D., & Drew, D. S. (2000). Effects of overtime work and additionnalresources on project cost and quality. Engineering, Construction and ArchitecturalManagement, 7, 211–220.
Lin, J., Qian, Y., Cui, W., & Miao, Z. (2010). Overlapping and communication policies inproduct development. European Journal of Operational Research, 201, 737–750.
Mohammadipour, F., & Sadjadi, S. J. (2016). Project cost-quality-risk tradeoff analysis ina time-constrained problem. Computers and Industrial Engineering, 95, 111–121.
Monghasemi, S., Nikoo, M. R., Khaksar Fasaee, M. A., & Adamowski, J. (2015). A novelmulti criteria decision making model for optimizing time cost quality trade-off pro-blems in construction projects. Expert Systems with Applications, 42, 3089–3104.
Mungle, S., Benyoucef, L., Son, Y.-J., & Tiwari, M. K. (2013). A fuzzy clustering-basedgenetic algorithm approach for time-cost-quality trade-off problems: A case study ofhighway construction project. Engineering Applications of Artificial Intelligence, 26,1953–1966.
Stylidis, K., Wickman, C., & Soderberg, R. (2015). Defining perceived quality in the au-tomative industry: An engineering approach. Procedia CIRP, 36, 165–170.
Tareghian, H. R., & Taheri, S. H. (2006). On the discrete time, cost and quality trade-offproblem. Applied Mathematics and Computation, 181, 1305–1312.
Tareghian, H. R., & Taheri, S. H. (2007). A solution procedure for the discrete time, costand quality tradeoff problem using electromagnetic scatter search. AppliedMathematics and Computation, 190, 1136–1145.
Tiwari, V., Patterson, J. H., & Mabert, V. A. (2009). Scheduling projects with hetero-geneous resources to meet time and quality objectives. European Journal ofOperational Research, 193, 780–790.
Tran, D.-H., Cheng, M.-Y., & Cao, M.-T. (2015). Hybrid multiple objective artificial beecolony with differential evolution for the time-cost-quality tradeoff problem.Knowledge-Based Systems, 74, 176–186.
Weglarz, J., Jozefowska, J., Mika, M., & Waligora, G. (2011). Project scheduling withfinite or infinite number of activity processing modes: A survey. European Journal ofOperational Research, 208, 177–205.
Zhang, L., Du, J., & Zhang, S. (2014). Solution to the time-cost-quality trade-off problemin construction projects based on immune genetic particle swarm optimization.Journal of Management in Engineering, 30, 163–172.
M.B. Orm, J. Jeunet Computers & Industrial Engineering 118 (2018) 319–328
328
Procedia - Social and Behavioral Sciences 197 ( 2015 ) 1399 – 1402
Available online at www.sciencedirect.com
ScienceDirect
1877-0428 © 2015 Published by Elsevier Ltd. This is an open access article under the CC BY-NC-ND license (http://creativecommons.org/licenses/by-nc-nd/4.0/).Peer-review under responsibility of Academic World Education and Research Center.doi: 10.1016/j.sbspro.2015.07.085
7th World Conference on Educational Sciences, (WCES-2015), 05-07 February 2015, Novotel Athens Convention Center, Athens, Greece
Conceptual model of management in automotive projects Laurentiu Margineanua*, Gabriela Prosteana, Serban Popaa
aPolytechnic University Timisoara, Faculty of Management in Production and Transportation, Str. Remus, No.14, 300191 Timisoara, Romania
Abstract
In automotive industry the development of new products, involve complex engineering processes subject to time pressures and fierce competition on the automotive market. An important role in the development of such projects it is the process planner. The position of process planner involves the interface between the department of design and development and production department, managing the projects in terms of technic side till implement them in series production. This paper develops in teach mode a conceptual model to scroll the successive phases of the project, designed to position the process planner ,in order to transfer the knowledge to the students, in the field of project management of new product development in the automotive industry. Through a case study it will be creates a conceptual model in methodological way, namely that exemplifies the main phases of automotive projects: the quote, concept, release of design, testing and qualification of product and final phase of preparing and launching in series production. Preliminary phase namely quotation phase includes defining the project team and submitting the offer. Process steps are established for each operation and the estimated cost for devices and equipment, project time planning, and can generate the first effective phase of the project, namely the concept phase, called the foundation project also. Next phase of concept phase is the release of design, thereupon the design is frozen, as well as the product bill of materials. PP sets: final steps of the process; production line (cell layout design); material flow; Process Failure Mode and Effects Analysis (P-FMEA ) and highlighting the top 5 risks assumed; In testing phase and product qualification, the PP manages and harmonizes in the smallest detail in order to achieve this target, to complete the preparation and launch in series production. © 2015 The Authors. Published by Elsevier Ltd. Peer-review under responsibility of Academic World Education and Research Center.
Keywords: - process planner, automotive, project management; product emergence process
* Laurentiu Margineanu. Tel.: +40-721788883.
E-mail address: [email protected]
© 2015 Published by Elsevier Ltd. This is an open access article under the CC BY-NC-ND license (http://creativecommons.org/licenses/by-nc-nd/4.0/).Peer-review under responsibility of Academic World Education and Research Center.
1400 Laurentiu Margineanu et al. / Procedia - Social and Behavioral Sciences 197 ( 2015 ) 1399 – 1402
1. Introduction Project management is in continuous development and a topical issue in recent years in the automotive industry,
one of the most severe competitions in the market, and where innovations are in continuous motion and succeed with rapidity and an amazing pace.
Most companies in the field of automotive project management using the same scheme that we meet in the paper of Gofer, Schulz "Supply chain during the product design emergence process-The example of the German car industry", published in the International Journal of Engineering Science and Technology, vol. 5, no. 2, 2013, pp. 110-118. The adapted scheme from this paper is presented in the figure1.
Figure 1. Product emergence process
The scheme is very good and also at present is successfully used by large companies with tradition, where
employees have extensive experience in project management. But younger companies on the market which try to use this scheme, do not always bring the desired result, because "not all projects are blessed with superstars." As Joan Knudson and Ira wrote in chapter Managing the team Bitz During the Project of Book Project Management published by AMACOM Books' ISBN: 0814450431 Pub Date: 01/01/91. Studying in detail the scheme can not be clearly observed phase sequence, and just grouping them in a certain period of time, and do not notice the interaction with the customer. Also in this scheme does not mention anything about the quotation phase, phase that helps to have a new project, and it is difficult to be interpreted by a person from outside the system, which means difficulty in understanding also for students.
Most automotive companies, wishing to initiate future employees since the time schools, but also because people who come from outside the company, can see the things from another angle and then offers a new and innovative idea, collaborate more and more with prestigious university worldwide, therefore the project management discipline has become a specialized study in college. In project management literature has been extensively studied, searching methods, tactics and tools to make it easier the project management activity, one of the reference book is Practical Project Management Tips, Tactics, and Tools, by Harvey Levine; Project Management A Systems Approach to Planning, Scheduling, and Controlling Seventh Edition, by Harold Kerzner, Ph.D. Division of Business Administration Baldwin-Wallace College Berea, Ohio).
This paper develops a conceptual model of the development phases of a new product in the automotive industry, a concept can be used as a model for introduction of students in project management of new product development in the automotive industry. The model is intended to be a summary of project management, that the paper treats them in the next pages using an original concept models.
2. The conceptual model of project management
In the paper that follows, it presents a new possible approach for new product development projects in the
automotive industry. In this paper, the project team consists of project manager, process planner, designer, quality planner and cost evaluator. Project manager is the interface between the client and design department and manage
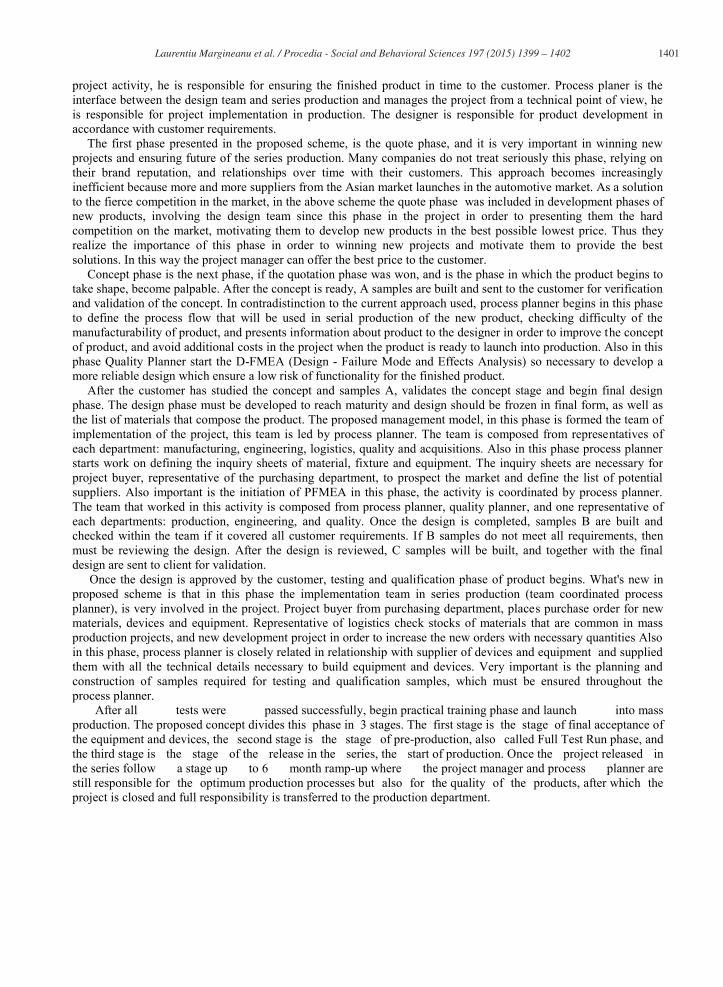
1401 Laurentiu Margineanu et al. / Procedia - Social and Behavioral Sciences 197 ( 2015 ) 1399 – 1402
project activity, he is responsible for ensuring the finished product in time to the customer. Process planer is the interface between the design team and series production and manages the project from a technical point of view, he is responsible for project implementation in production. The designer is responsible for product development in accordance with customer requirements.
The first phase presented in the proposed scheme, is the quote phase, and it is very important in winning new projects and ensuring future of the series production. Many companies do not treat seriously this phase, relying on their brand reputation, and relationships over time with their customers. This approach becomes increasingly inefficient because more and more suppliers from the Asian market launches in the automotive market. As a solution to the fierce competition in the market, in the above scheme the quote phase was included in development phases of new products, involving the design team since this phase in the project in order to presenting them the hard competition on the market, motivating them to develop new products in the best possible lowest price. Thus they realize the importance of this phase in order to winning new projects and motivate them to provide the best solutions. In this way the project manager can offer the best price to the customer.
Concept phase is the next phase, if the quotation phase was won, and is the phase in which the product begins to take shape, become palpable. After the concept is ready, A samples are built and sent to the customer for verification and validation of the concept. In contradistinction to the current approach used, process planner begins in this phase to define the process flow that will be used in serial production of the new product, checking difficulty of the manufacturability of product, and presents information about product to the designer in order to improve the concept of product, and avoid additional costs in the project when the product is ready to launch into production. Also in this phase Quality Planner start the D-FMEA (Design - Failure Mode and Effects Analysis) so necessary to develop a more reliable design which ensure a low risk of functionality for the finished product.
After the customer has studied the concept and samples A, validates the concept stage and begin final design phase. The design phase must be developed to reach maturity and design should be frozen in final form, as well as the list of materials that compose the product. The proposed management model, in this phase is formed the team of implementation of the project, this team is led by process planner. The team is composed from representatives of each department: manufacturing, engineering, logistics, quality and acquisitions. Also in this phase process planner starts work on defining the inquiry sheets of material, fixture and equipment. The inquiry sheets are necessary for project buyer, representative of the purchasing department, to prospect the market and define the list of potential suppliers. Also important is the initiation of PFMEA in this phase, the activity is coordinated by process planner. The team that worked in this activity is composed from process planner, quality planner, and one representative of each departments: production, engineering, and quality. Once the design is completed, samples B are built and checked within the team if it covered all customer requirements. If B samples do not meet all requirements, then must be reviewing the design. After the design is reviewed, C samples will be built, and together with the final design are sent to client for validation.
Once the design is approved by the customer, testing and qualification phase of product begins. What's new in proposed scheme is that in this phase the implementation team in series production (team coordinated process planner), is very involved in the project. Project buyer from purchasing department, places purchase order for new materials, devices and equipment. Representative of logistics check stocks of materials that are common in mass production projects, and new development project in order to increase the new orders with necessary quantities Also in this phase, process planner is closely related in relationship with supplier of devices and equipment and supplied them with all the technical details necessary to build equipment and devices. Very important is the planning and construction of samples required for testing and qualification samples, which must be ensured throughout the process planner.
After all tests were passed successfully, begin practical training phase and launch into mass production. The proposed concept divides this phase in 3 stages. The first stage is the stage of final acceptance of the equipment and devices, the second stage is the stage of pre-production, also called Full Test Run phase, and the third stage is the stage of the release in the series, the start of production. Once the project released in the series follow a stage up to 6 month ramp-up where the project manager and process planner are still responsible for the optimum production processes but also for the quality of the products, after which the project is closed and full responsibility is transferred to the production department.
1402 Laurentiu Margineanu et al. / Procedia - Social and Behavioral Sciences 197 ( 2015 ) 1399 – 1402
3. Conclusions
As a conclusion, the above process is a simple description, exposed in a fluid layout, in order to be able to understand the continuity of projects phases of launching new products. As can be seen every phase diagram shows special items allocated "Lesson Learnt", elements that ensure continuous improvement of the activity of project management.
This scheme can be used successfully in ISO TS certification audits, or in the customer audits in order to present the work and phases of the project in a developed and elaborated way, always a diagram or picture being more explicit than a thousand words together.
The scheme is very useful in teaching environment in initiating students in project management, but also in facilitating understanding of each phase of new product development projects, the scheme proposed conceptual model representing the skeleton of conceptual model.
Reference
Gopfert, I., & Schulz, M. D. (2013). Supply chain design during the product emergence process–The example of the German car
industry. International Journal of Engineering, Science and Technology, 5(2), 110-118. Kerzner, H. R. (2013). Project management: a systems approach to planning, scheduling, and controlling. John Wiley & Sons. Levine, H. A. (2002). Practical project management: tips, tactics, and tools. John Wiley & Sons. Volberda, H. W., Van Den Bosch, F. A., & Mihalache, O. R. (2014). Advancing Management Innovation: Synthesizing Processes, Levels of
Analysis, and Change Agents. Organization Studies, 35(9), 1245-1264.
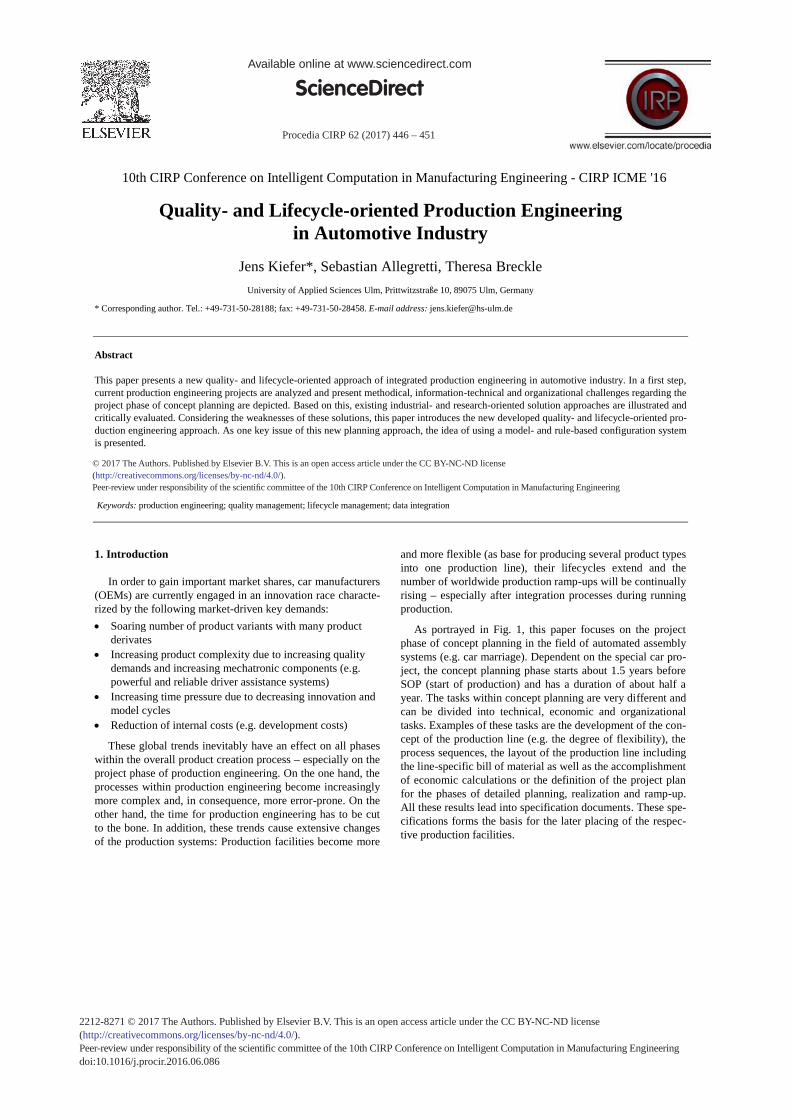
Available online at www.sciencedirect.com
2212-8271 © 2017 The Authors. Published by Elsevier B.V. This is an open access article under the CC BY-NC-ND license (http://creativecommons.org/licenses/by-nc-nd/4.0/).Peer-review under responsibility of the scientific committee of the 10th CIRP Conference on Intelligent Computation in Manufacturing Engineeringdoi: 10.1016/j.procir.2016.06.086
Procedia CIRP 62 ( 2017 ) 446 – 451
ScienceDirect
10th CIRP Conference on Intelligent Computation in Manufacturing Engineering - CIRP ICME '16
Quality- and Lifecycle-oriented Production Engineering in Automotive Industry
Jens Kiefer*, Sebastian Allegretti, Theresa Breckle
University of Applied Sciences Ulm, Prittwitzstraße 10, 89075 Ulm, Germany
* Corresponding author. Tel.: +49-731-50-28188; fax: +49-731-50-28458. E-mail address: [email protected]
Abstract
This paper presents a new quality- and lifecycle-oriented approach of integrated production engineering in automotive industry. In a first step, current production engineering projects are analyzed and present methodical, information-technical and organizational challenges regarding the project phase of concept planning are depicted. Based on this, existing industrial- and research-oriented solution approaches are illustrated and critically evaluated. Considering the weaknesses of these solutions, this paper introduces the new developed quality- and lifecycle-oriented pro-duction engineering approach. As one key issue of this new planning approach, the idea of using a model- and rule-based configuration system is presented. © 2016 The Authors. Published by Elsevier B.V. Selection and peer-review under responsibility of the International Scientific Committee of “10th CIRP ICME Conference".
Keywords: production engineering; quality management; lifecycle management; data integration
1. Introduction
In order to gain important market shares, car manufacturers (OEMs) are currently engaged in an innovation race characte-rized by the following market-driven key demands:
Soaring number of product variants with many product derivates
Increasing product complexity due to increasing quality demands and increasing mechatronic components (e.g. powerful and reliable driver assistance systems)
Increasing time pressure due to decreasing innovation and model cycles
Reduction of internal costs (e.g. development costs)
These global trends inevitably have an effect on all phases within the overall product creation process – especially on the project phase of production engineering. On the one hand, the processes within production engineering become increasingly more complex and, in consequence, more error-prone. On the other hand, the time for production engineering has to be cut to the bone. In addition, these trends cause extensive changes of the production systems: Production facilities become more
and more flexible (as base for producing several product types into one production line), their lifecycles extend and the number of worldwide production ramp-ups will be continually rising – especially after integration processes during running production.
As portrayed in Fig. 1, this paper focuses on the project phase of concept planning in the field of automated assembly systems (e.g. car marriage). Dependent on the special car pro-ject, the concept planning phase starts about 1.5 years before SOP (start of production) and has a duration of about half a year. The tasks within concept planning are very different and can be divided into technical, economic and organizational tasks. Examples of these tasks are the development of the con-cept of the production line (e.g. the degree of flexibility), the process sequences, the layout of the production line including the line-specific bill of material as well as the accomplishment of economic calculations or the definition of the project plan for the phases of detailed planning, realization and ramp-up. All these results lead into specification documents. These spe-cifications forms the basis for the later placing of the respec-tive production facilities.
© 2017 The Authors. Published by Elsevier B.V. This is an open access article under the CC BY-NC-ND license (http://creativecommons.org/licenses/by-nc-nd/4.0/).Peer-review under responsibility of the scientifi c committee of the 10th CIRP Conference on Intelligent Computation in Manufacturing Engineering
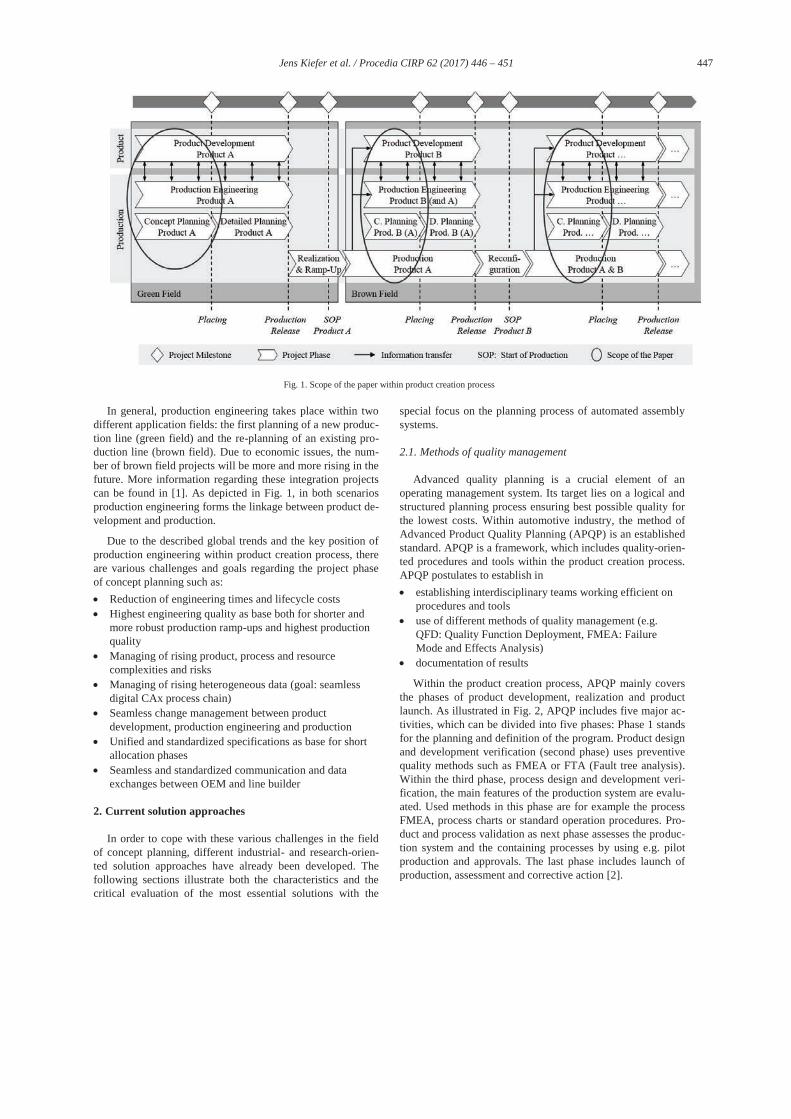
447 Jens Kiefer et al. / Procedia CIRP 62 ( 2017 ) 446 – 451
Fig. 1. Scope of the paper within product creation process
In general, production engineering takes place within two different application fields: the first planning of a new produc-tion line (green field) and the re-planning of an existing pro-duction line (brown field). Due to economic issues, the num-ber of brown field projects will be more and more rising in the future. More information regarding these integration projects can be found in [1]. As depicted in Fig. 1, in both scenarios production engineering forms the linkage between product de-velopment and production.
Due to the described global trends and the key position of production engineering within product creation process, there are various challenges and goals regarding the project phase of concept planning such as:
Reduction of engineering times and lifecycle costs Highest engineering quality as base both for shorter and
more robust production ramp-ups and highest production quality
Managing of rising product, process and resource complexities and risks
Managing of rising heterogeneous data (goal: seamless digital CAx process chain)
Seamless change management between product development, production engineering and production
Unified and standardized specifications as base for short allocation phases
Seamless and standardized communication and data exchanges between OEM and line builder
2. Current solution approaches
In order to cope with these various challenges in the field of concept planning, different industrial- and research-orien-ted solution approaches have already been developed. The following sections illustrate both the characteristics and the critical evaluation of the most essential solutions with the
special focus on the planning process of automated assembly systems.
2.1. Methods of quality management
Advanced quality planning is a crucial element of an operating management system. Its target lies on a logical and structured planning process ensuring best possible quality for the lowest costs. Within automotive industry, the method of Advanced Product Quality Planning (APQP) is an established standard. APQP is a framework, which includes quality-orien-ted procedures and tools within the product creation process. APQP postulates to establish in
establishing interdisciplinary teams working efficient on procedures and tools
use of different methods of quality management (e.g. QFD: Quality Function Deployment, FMEA: Failure Mode and Effects Analysis)
documentation of results
Within the product creation process, APQP mainly covers the phases of product development, realization and product launch. As illustrated in Fig. 2, APQP includes five major ac-tivities, which can be divided into five phases: Phase 1 stands for the planning and definition of the program. Product design and development verification (second phase) uses preventive quality methods such as FMEA or FTA (Fault tree analysis). Within the third phase, process design and development veri-fication, the main features of the production system are evalu-ated. Used methods in this phase are for example the process FMEA, process charts or standard operation procedures. Pro-duct and process validation as next phase assesses the produc-tion system and the containing processes by using e.g. pilot production and approvals. The last phase includes launch of production, assessment and corrective action [2].

448 Jens Kiefer et al. / Procedia CIRP 62 ( 2017 ) 446 – 451
Fig. 2. 5-phase-model of APQP [2]
Concept planning of an assembly system covers the third
phase of APQP. Within this phase, the method of FMEA is used. In general, FMEA is described as highly structured and systematic method for failure analysis based on experiences e.g. with similar or former products and processes. As method for preventive system and risk analysis, FMEA already starts in an early state of the product creation process. By applying FMEA, weak points of the considered system are analyzed, measurements are initiated and risks are assessed. In this way, FMEA focuses on the prevention of potential product and process failures within product creation process [2].
APQP is mainly used for product development. For the project phase of production engineering it is not exhaustively applied due to following reasons:
Project time is limited Main focus lies on other priorities Sustainable FMEA needs resources and knowlegde
Big OEMs has detected the problem and qualify their engi-neers in advanced quality planning methods. At present, there is a large gap between theory and practical application.
2.2. Risk Management
Risk is not only described as negative effects facing a com-pany but also the conditions and environment within or out-side the company, which could cause negative effects [4]. In literature, the term of risk is defined in several ways [2, 5, 6]. Managing business risks in a systematic way is the main goal of risk management, including all activities of a company co-ordinating extensively and coherently their risks for managing and controlling [5]. The new approach regarding risk manage-ment is Enterprise Risk Management (ERM). ERM describes an integrated management of all risks an organization faces and conciliates risk management with corporate governance and strategy. Manifold definitions are listed in [7]. Risk ma-nagement is described as process [5]:
Identify risk aims to carve out potential threats [2] Analyze and rate risks based on identified risks; requires
comprehensive analyzing methods e. g. FMEA [3] Evaluate identified and analyzed risks; choose criteria
Full risk assessment with two dimensions: probability and severity; followed up by an illustration e.g. in a risk port-folio diagram [7]
Depict risks strategies execute for the risks’ treatment [2] Implement and follow up measurements for treatment
Different approaches for risk classification as context-ori-ented, cause- and effect-related or related to project-manage-ment. There are a non-exhaustive enumeration of risk classifi-cations [3]: Technical, organizational, contractual as well as financial, internal and external, political and sociocultural.
Early prevention of production planning failures and failures within product development is one of the most fre-quently mentioned reasons for risk analysis according to [8] in a manufacturing company. All classifications of risk occur in production engineering projects. Risk management is a vital method, but following aspects reduce its power:
Risk management as process is not installed as mandatory within the concept phase
Risk awareness according to multiplicity of decisions in the concept phase is often lacking
Systematic and structured risk prevention is not used
2.3. Changeable Manufacturing – (Re-)configuration
ElMaraghy defines changeability as “an umbrella frame-work that encompasses many paradigms, such as agility, adaptability, flexibility and re-configurability” [9]. Change-ability can be accomplished by a system and its components possess certain properties. According to Wiendahl only these certain system-properties or features allows the system to transform. Defined as change enablers there are universality, mobility, scalability, modularity and compatibility [10]. Due to modularity acts as a booster for all change enablers, it is re-cognized as an elementary key-demand of a changeable sys-tem [11]. Changeability represents the characteristic of a pro-duction, which allows an adaption of the production system. For this purpose both technical requirements and conditions like a consequent modulized, standardized and mobile pro-duction equipment and organizational requirements and con-ditions have to be defined. Existing approaches and concepts for a changeable production system are listed in [12].
Modularity represents the idea of “plug and produce”. This means standardized and pre-tested units and elements, which are separated of each other and regards technical facilities of the factory as well as structures of the organization [11]. A module embodies all resources needed to ensure its functiona-lity and autonomy and presents the smallest element of a system that can be multiplied, displaced or eliminated as a hole [13]. According to Pahl and Beitz, modularity effects more benefits as there are re-use and re-combination of mo-dules and upgradeability [14]. Modularity is the basic require-ment for reconfiguration. Mittal and Frayman define a confi-guration task as found in [15]. According to this definition, a configuration task requires components, which are specified, able to connect and with inherent properties.
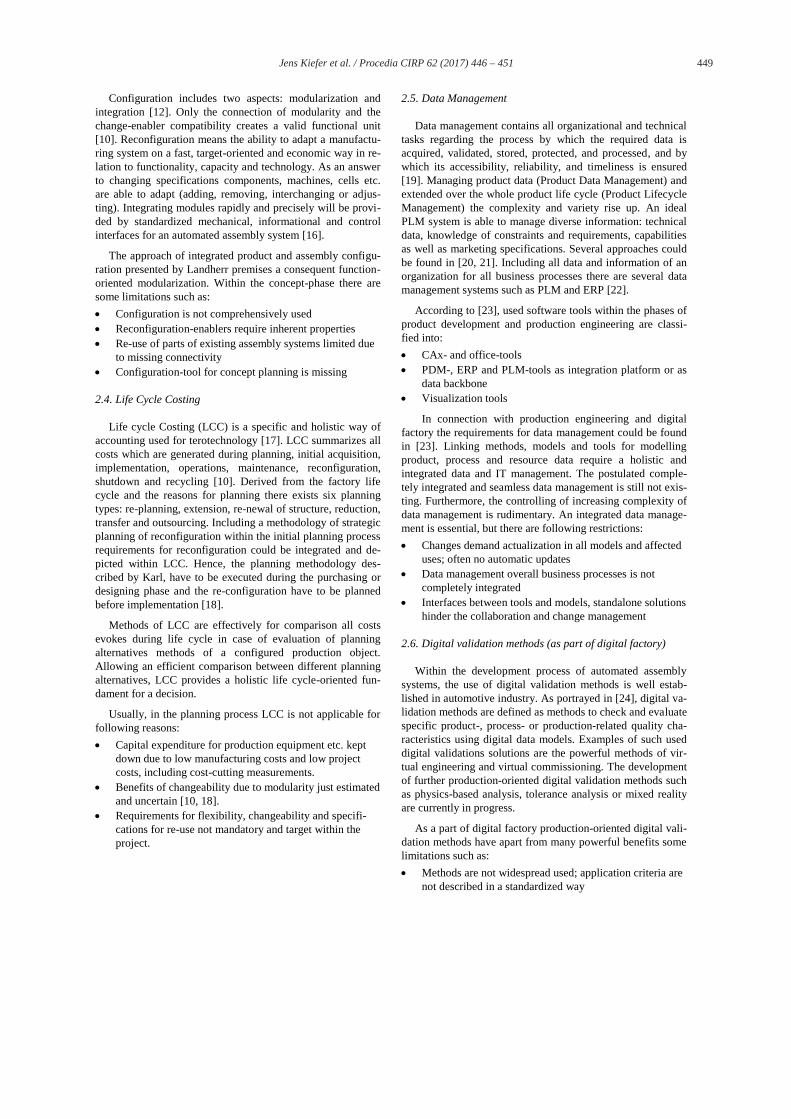
449 Jens Kiefer et al. / Procedia CIRP 62 ( 2017 ) 446 – 451
Configuration includes two aspects: modularization and integration [12]. Only the connection of modularity and the change-enabler compatibility creates a valid functional unit [10]. Reconfiguration means the ability to adapt a manufactu-ring system on a fast, target-oriented and economic way in re-lation to functionality, capacity and technology. As an answer to changing specifications components, machines, cells etc. are able to adapt (adding, removing, interchanging or adjus-ting). Integrating modules rapidly and precisely will be provi-ded by standardized mechanical, informational and control interfaces for an automated assembly system [16].
The approach of integrated product and assembly configu-ration presented by Landherr premises a consequent function-oriented modularization. Within the concept-phase there are some limitations such as:
Configuration is not comprehensively used Reconfiguration-enablers require inherent properties Re-use of parts of existing assembly systems limited due
to missing connectivity Configuration-tool for concept planning is missing
2.4. Life Cycle Costing
Life cycle Costing (LCC) is a specific and holistic way of accounting used for terotechnology [17]. LCC summarizes all costs which are generated during planning, initial acquisition, implementation, operations, maintenance, reconfiguration, shutdown and recycling [10]. Derived from the factory life cycle and the reasons for planning there exists six planning types: re-planning, extension, re-newal of structure, reduction, transfer and outsourcing. Including a methodology of strategic planning of reconfiguration within the initial planning process requirements for reconfiguration could be integrated and de-picted within LCC. Hence, the planning methodology des-cribed by Karl, have to be executed during the purchasing or designing phase and the re-configuration have to be planned before implementation [18].
Methods of LCC are effectively for comparison all costs evokes during life cycle in case of evaluation of planning alternatives methods of a configured production object. Allowing an efficient comparison between different planning alternatives, LCC provides a holistic life cycle-oriented fun-dament for a decision.
Usually, in the planning process LCC is not applicable for following reasons:
Capital expenditure for production equipment etc. kept down due to low manufacturing costs and low project costs, including cost-cutting measurements.
Benefits of changeability due to modularity just estimated and uncertain [10, 18].
Requirements for flexibility, changeability and specifi-cations for re-use not mandatory and target within the project.
2.5. Data Management
Data management contains all organizational and technical tasks regarding the process by which the required data is acquired, validated, stored, protected, and processed, and by which its accessibility, reliability, and timeliness is ensured [19]. Managing product data (Product Data Management) and extended over the whole product life cycle (Product Lifecycle Management) the complexity and variety rise up. An ideal PLM system is able to manage diverse information: technical data, knowledge of constraints and requirements, capabilities as well as marketing specifications. Several approaches could be found in [20, 21]. Including all data and information of an organization for all business processes there are several data management systems such as PLM and ERP [22].
According to [23], used software tools within the phases of product development and production engineering are classi-fied into:
CAx- and office-tools PDM-, ERP and PLM-tools as integration platform or as
data backbone Visualization tools
In connection with production engineering and digital factory the requirements for data management could be found in [23]. Linking methods, models and tools for modelling product, process and resource data require a holistic and integrated data and IT management. The postulated comple-tely integrated and seamless data management is still not exis-ting. Furthermore, the controlling of increasing complexity of data management is rudimentary. An integrated data manage-ment is essential, but there are following restrictions:
Changes demand actualization in all models and affected uses; often no automatic updates
Data management overall business processes is not completely integrated
Interfaces between tools and models, standalone solutions hinder the collaboration and change management
2.6. Digital validation methods (as part of digital factory)
Within the development process of automated assembly systems, the use of digital validation methods is well estab-lished in automotive industry. As portrayed in [24], digital va-lidation methods are defined as methods to check and evaluate specific product-, process- or production-related quality cha-racteristics using digital data models. Examples of such used digital validations solutions are the powerful methods of vir-tual engineering and virtual commissioning. The development of further production-oriented digital validation methods such as physics-based analysis, tolerance analysis or mixed reality are currently in progress.
As a part of digital factory production-oriented digital vali-dation methods have apart from many powerful benefits some limitations such as:
Methods are not widespread used; application criteria are not described in a standardized way
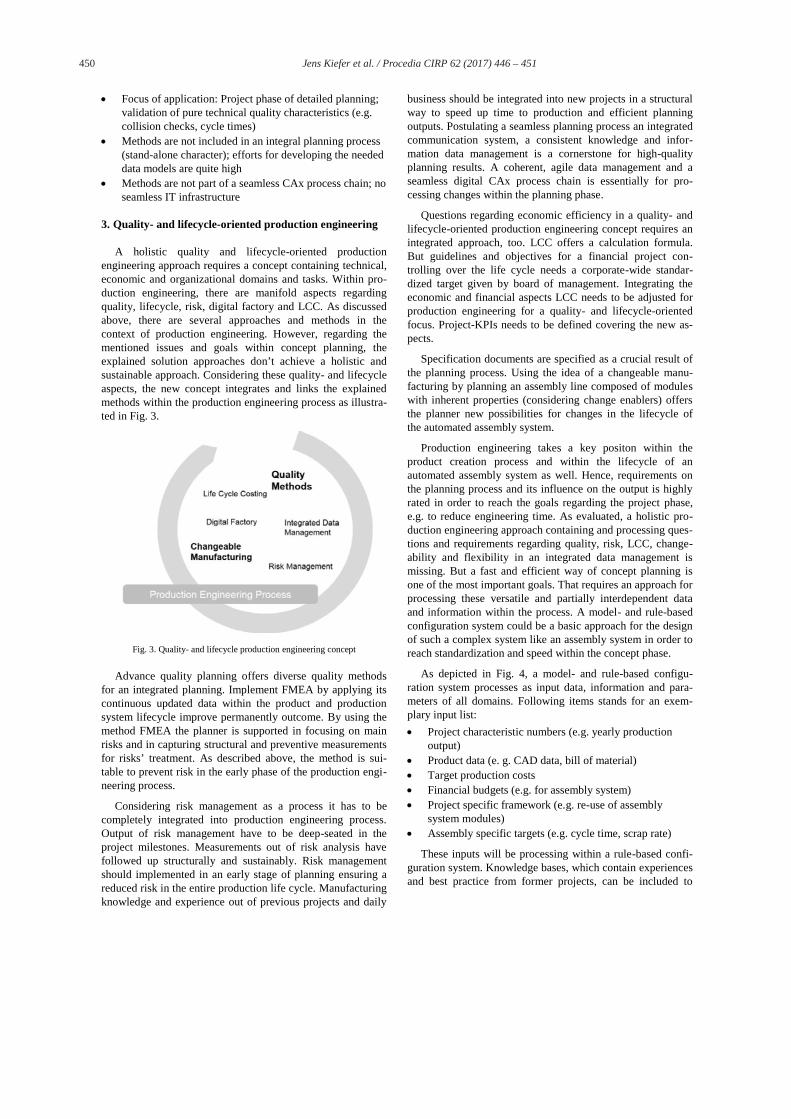
450 Jens Kiefer et al. / Procedia CIRP 62 ( 2017 ) 446 – 451
Focus of application: Project phase of detailed planning; validation of pure technical quality characteristics (e.g. collision checks, cycle times)
Methods are not included in an integral planning process (stand-alone character); efforts for developing the needed data models are quite high
Methods are not part of a seamless CAx process chain; no seamless IT infrastructure
3. Quality- and lifecycle-oriented production engineering
A holistic quality and lifecycle-oriented production engineering approach requires a concept containing technical, economic and organizational domains and tasks. Within pro-duction engineering, there are manifold aspects regarding quality, lifecycle, risk, digital factory and LCC. As discussed above, there are several approaches and methods in the context of production engineering. However, regarding the mentioned issues and goals within concept planning, the explained solution approaches don’t achieve a holistic and sustainable approach. Considering these quality- and lifecycle aspects, the new concept integrates and links the explained methods within the production engineering process as illustra-ted in Fig. 3.
Fig. 3. Quality- and lifecycle production engineering concept
Advance quality planning offers diverse quality methods
for an integrated planning. Implement FMEA by applying its continuous updated data within the product and production system lifecycle improve permanently outcome. By using the method FMEA the planner is supported in focusing on main risks and in capturing structural and preventive measurements for risks’ treatment. As described above, the method is sui-table to prevent risk in the early phase of the production engi-neering process.
Considering risk management as a process it has to be completely integrated into production engineering process. Output of risk management have to be deep-seated in the project milestones. Measurements out of risk analysis have followed up structurally and sustainably. Risk management should implemented in an early stage of planning ensuring a reduced risk in the entire production life cycle. Manufacturing knowledge and experience out of previous projects and daily
business should be integrated into new projects in a structural way to speed up time to production and efficient planning outputs. Postulating a seamless planning process an integrated communication system, a consistent knowledge and infor-mation data management is a cornerstone for high-quality planning results. A coherent, agile data management and a seamless digital CAx process chain is essentially for pro-cessing changes within the planning phase.
Questions regarding economic efficiency in a quality- and lifecycle-oriented production engineering concept requires an integrated approach, too. LCC offers a calculation formula. But guidelines and objectives for a financial project con-trolling over the life cycle needs a corporate-wide standar-dized target given by board of management. Integrating the economic and financial aspects LCC needs to be adjusted for production engineering for a quality- and lifecycle-oriented focus. Project-KPIs needs to be defined covering the new as-pects.
Specification documents are specified as a crucial result of the planning process. Using the idea of a changeable manu-facturing by planning an assembly line composed of modules with inherent properties (considering change enablers) offers the planner new possibilities for changes in the lifecycle of the automated assembly system.
Production engineering takes a key positon within the product creation process and within the lifecycle of an automated assembly system as well. Hence, requirements on the planning process and its influence on the output is highly rated in order to reach the goals regarding the project phase, e.g. to reduce engineering time. As evaluated, a holistic pro-duction engineering approach containing and processing ques-tions and requirements regarding quality, risk, LCC, change-ability and flexibility in an integrated data management is missing. But a fast and efficient way of concept planning is one of the most important goals. That requires an approach for processing these versatile and partially interdependent data and information within the process. A model- and rule-based configuration system could be a basic approach for the design of such a complex system like an assembly system in order to reach standardization and speed within the concept phase.
As depicted in Fig. 4, a model- and rule-based configu-ration system processes as input data, information and para-meters of all domains. Following items stands for an exem-plary input list:
Project characteristic numbers (e.g. yearly production output)
Product data (e. g. CAD data, bill of material) Target production costs Financial budgets (e.g. for assembly system) Project specific framework (e.g. re-use of assembly
system modules) Assembly specific targets (e.g. cycle time, scrap rate)
These inputs will be processing within a rule-based confi-guration system. Knowledge bases, which contain experiences and best practice from former projects, can be included to
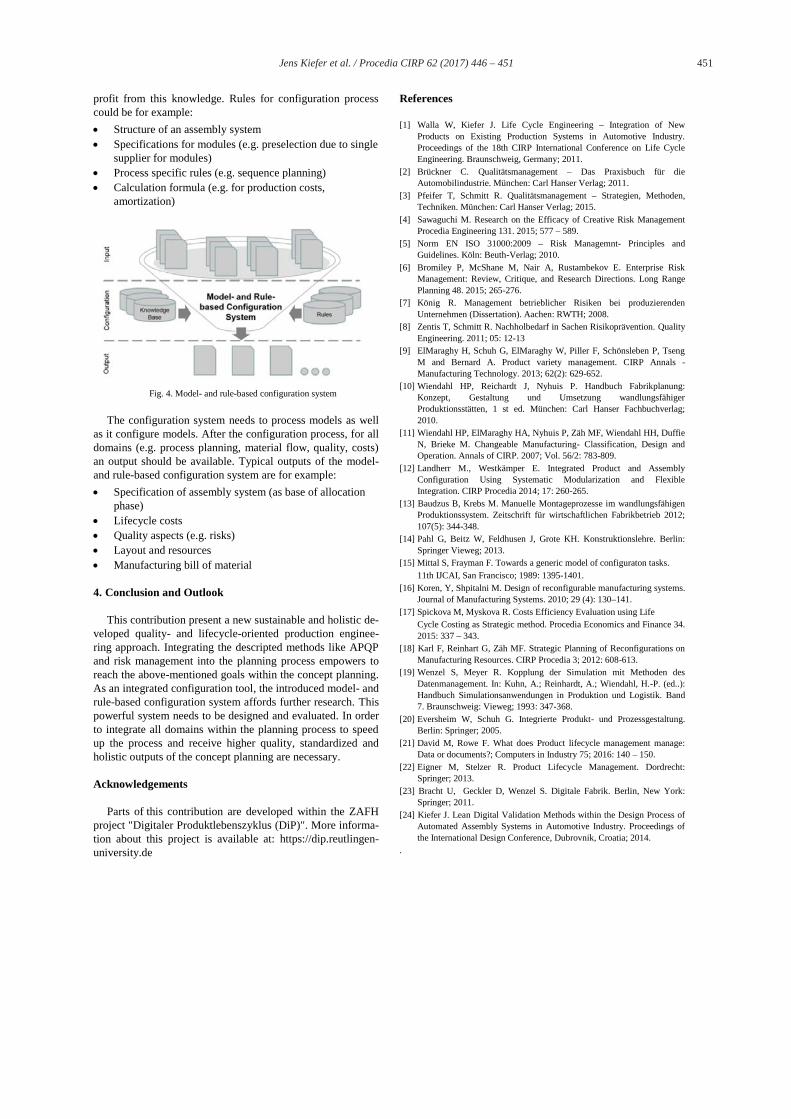
451 Jens Kiefer et al. / Procedia CIRP 62 ( 2017 ) 446 – 451
profit from this knowledge. Rules for configuration process could be for example:
Structure of an assembly system Specifications for modules (e.g. preselection due to single
supplier for modules) Process specific rules (e.g. sequence planning) Calculation formula (e.g. for production costs,
amortization)
Fig. 4. Model- and rule-based configuration system
The configuration system needs to process models as well
as it configure models. After the configuration process, for all domains (e.g. process planning, material flow, quality, costs) an output should be available. Typical outputs of the model- and rule-based configuration system are for example:
Specification of assembly system (as base of allocation phase)
Lifecycle costs Quality aspects (e.g. risks) Layout and resources Manufacturing bill of material
4. Conclusion and Outlook
This contribution present a new sustainable and holistic de-veloped quality- and lifecycle-oriented production enginee-ring approach. Integrating the descripted methods like APQP and risk management into the planning process empowers to reach the above-mentioned goals within the concept planning. As an integrated configuration tool, the introduced model- and rule-based configuration system affords further research. This powerful system needs to be designed and evaluated. In order to integrate all domains within the planning process to speed up the process and receive higher quality, standardized and holistic outputs of the concept planning are necessary.
Acknowledgements
Parts of this contribution are developed within the ZAFH project "Digitaler Produktlebenszyklus (DiP)". More informa-tion about this project is available at: https://dip.reutlingen-university.de
References
[1] Walla W, Kiefer J. Life Cycle Engineering – Integration of New Products on Existing Production Systems in Automotive Industry. Proceedings of the 18th CIRP International Conference on Life Cycle Engineering. Braunschweig, Germany; 2011.
[2] Brückner C. Qualitätsmanagement – Das Praxisbuch für die Automobilindustrie. München: Carl Hanser Verlag; 2011.
[3] Pfeifer T, Schmitt R. Qualitätsmanagement – Strategien, Methoden, Techniken. München: Carl Hanser Verlag; 2015.
[4] Sawaguchi M. Research on the Efficacy of Creative Risk Management Procedia Engineering 131. 2015; 577 – 589.
[5] Norm EN ISO 31000:2009 – Risk Managemnt- Principles and Guidelines. Köln: Beuth-Verlag; 2010.
[6] Bromiley P, McShane M, Nair A, Rustambekov E. Enterprise Risk Management: Review, Critique, and Research Directions. Long Range Planning 48. 2015; 265-276.
[7] König R. Management betrieblicher Risiken bei produzierenden Unternehmen (Dissertation). Aachen: RWTH; 2008.
[8] Zentis T, Schmitt R. Nachholbedarf in Sachen Risikoprävention. Quality Engineering. 2011; 05: 12-13
[9] ElMaraghy H, Schuh G, ElMaraghy W, Piller F, Schönsleben P, Tseng M and Bernard A. Product variety management. CIRP Annals - Manufacturing Technology. 2013; 62(2): 629-652.
[10] Wiendahl HP, Reichardt J, Nyhuis P. Handbuch Fabrikplanung: Konzept, Gestaltung und Umsetzung wandlungsfähiger Produktionsstätten, 1 st ed. München: Carl Hanser Fachbuchverlag; 2010.
[11] Wiendahl HP, ElMaraghy HA, Nyhuis P, Zäh MF, Wiendahl HH, Duffie N, Brieke M. Changeable Manufacturing- Classification, Design and Operation. Annals of CIRP. 2007; Vol. 56/2: 783-809.
[12] Landherr M., Westkämper E. Integrated Product and Assembly Configuration Using Systematic Modularization and Flexible Integration. CIRP Procedia 2014; 17: 260-265.
[13] Baudzus B, Krebs M. Manuelle Montageprozesse im wandlungsfähigen Produktionssystem. Zeitschrift für wirtschaftlichen Fabrikbetrieb 2012; 107(5): 344-348.
[14] Pahl G, Beitz W, Feldhusen J, Grote KH. Konstruktionslehre. Berlin: Springer Vieweg; 2013.
[15] Mittal S, Frayman F. Towards a generic model of configuraton tasks. 11th IJCAI, San Francisco; 1989: 1395-1401. [16] Koren, Y, Shpitalni M. Design of reconfigurable manufacturing systems.
Journal of Manufacturing Systems. 2010; 29 (4): 130–141. [17] Spickova M, Myskova R. Costs Efficiency Evaluation using Life Cycle Costing as Strategic method. Procedia Economics and Finance 34.
2015: 337 – 343. [18] Karl F, Reinhart G, Zäh MF. Strategic Planning of Reconfigurations on
Manufacturing Resources. CIRP Procedia 3; 2012: 608-613. [19] Wenzel S, Meyer R. Kopplung der Simulation mit Methoden des
Datenmanagement. In: Kuhn, A.; Reinhardt, A.; Wiendahl, H.-P. (ed..): Handbuch Simulationsanwendungen in Produktion und Logistik. Band 7. Braunschweig: Vieweg; 1993: 347-368.
[20] Eversheim W, Schuh G. Integrierte Produkt- und Prozessgestaltung. Berlin: Springer; 2005.
[21] David M, Rowe F. What does Product lifecycle management manage: Data or documents?; Computers in Industry 75; 2016: 140 – 150.
[22] Eigner M, Stelzer R. Product Lifecycle Management. Dordrecht: Springer; 2013.
[23] Bracht U, Geckler D, Wenzel S. Digitale Fabrik. Berlin, New York: Springer; 2011.
[24] Kiefer J. Lean Digital Validation Methods within the Design Process of Automated Assembly Systems in Automotive Industry. Proceedings of the International Design Conference, Dubrovnik, Croatia; 2014.
.
DAAAM INTERNATIONAL SCIENTIFIC BOOK 2012 pp. 619-632 CHAPTER 51
QUALITY MANAGEMENT IN THE AUTOMOTIVE
INDUSTRY
GOICOECHEA, I. & FENOLLERA, M. Abstract: The automotive industry has always been an example in the field of Project Management and Leadership and, of course, as far as quality is concerned. An established methodology is followed from product development through production. The aim of this investigation is to set up a relationship between the different stages of the Product Realization Process (PRP) and the most suitable quality tools for each of them, so that it can be a support to the organizations interested when it comes to choosing the most effective tools depending on the quality strategy they adopt.
This paper: sets out the development of the main quality standards in the automotive
sector; explains the most important characteristics of the PRP industry, obtaining a
proposal of project management phases or stages; makes a classification of the main
quality tools used based, on the one hand, on the extensive revision of specialized
bibliography, and on the other hand, on the authors’ experience; and finally uses a
qualitative method of data collection in order to analyze the most adequate tools and
to fit them in the different stages of the project.
Key words: automotive, project management, quality standards, quality tools, PRP
Authors´ data: Univ. Prof. Dr. Eng. Goicoechea, I[tziar]; Univ. Prof. Eng.
Fenollera, M[aria]; University of Vigo, School of Industrial Engineering. Campus
Lagoas Marcosende s/n Vigo. Spain, [email protected], [email protected]
This Publication has to be referred as: Goicoechea, I[tziar] & Fenollera, M[aria],
(2012). Quality Management in the Automotive Industry, Chapter 51 in DAAAM
International Scientific Book 2012, pp. 619-632, B. Katalinic (Ed.), Published by
DAAAM International, ISBN 978-3-901509-86-5, ISSN 1726-9687, Vienna, Austria
DOI:10.2507/daaam.scibook.2012.51
619
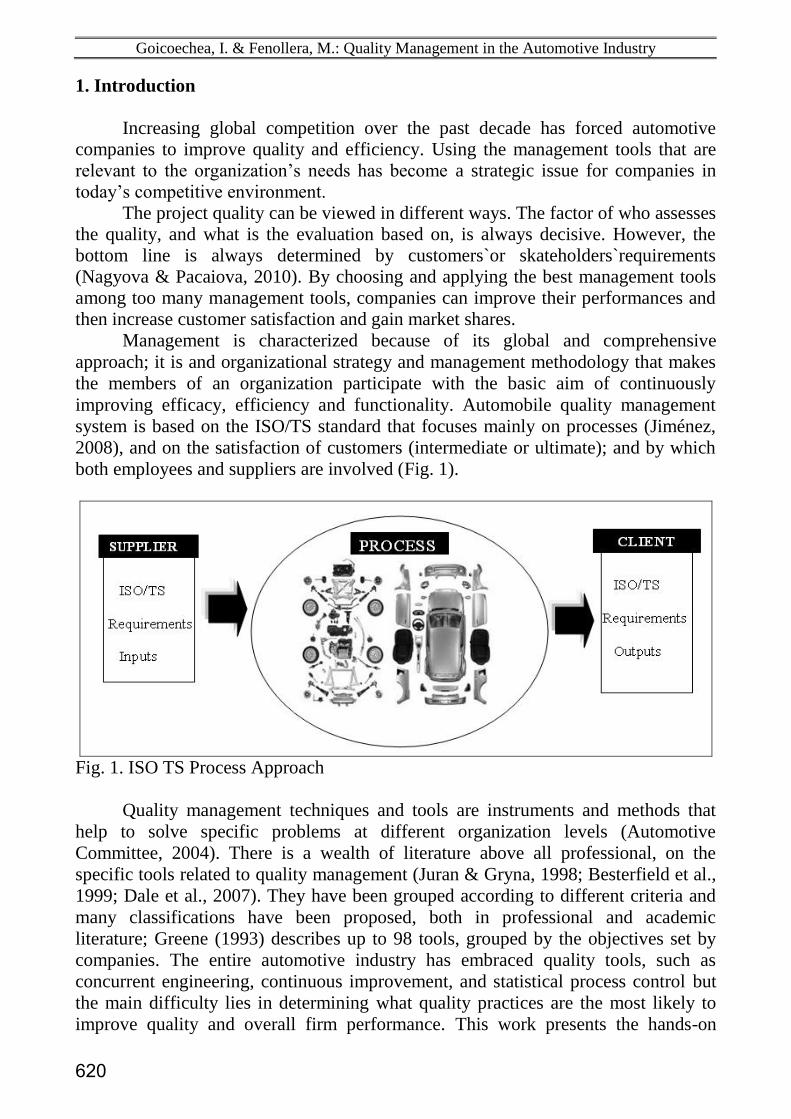
Goicoechea, I. & Fenollera, M.: Quality Management in the Automotive Industry
1. Introduction
Increasing global competition over the past decade has forced automotive
companies to improve quality and efficiency. Using the management tools that are
relevant to the organization’s needs has become a strategic issue for companies in
today’s competitive environment.
The project quality can be viewed in different ways. The factor of who assesses
the quality, and what is the evaluation based on, is always decisive. However, the
bottom line is always determined by customers`or skateholders`requirements
(Nagyova & Pacaiova, 2010). By choosing and applying the best management tools
among too many management tools, companies can improve their performances and
then increase customer satisfaction and gain market shares.
Management is characterized because of its global and comprehensive
approach; it is and organizational strategy and management methodology that makes
the members of an organization participate with the basic aim of continuously
improving efficacy, efficiency and functionality. Automobile quality management
system is based on the ISO/TS standard that focuses mainly on processes (Jiménez,
2008), and on the satisfaction of customers (intermediate or ultimate); and by which
both employees and suppliers are involved (Fig. 1).
Fig. 1. ISO TS Process Approach
Quality management techniques and tools are instruments and methods that
help to solve specific problems at different organization levels (Automotive
Committee, 2004). There is a wealth of literature above all professional, on the
specific tools related to quality management (Juran & Gryna, 1998; Besterfield et al.,
1999; Dale et al., 2007). They have been grouped according to different criteria and
many classifications have been proposed, both in professional and academic
literature; Greene (1993) describes up to 98 tools, grouped by the objectives set by
companies. The entire automotive industry has embraced quality tools, such as
concurrent engineering, continuous improvement, and statistical process control but
the main difficulty lies in determining what quality practices are the most likely to
improve quality and overall firm performance. This work presents the hands-on
620
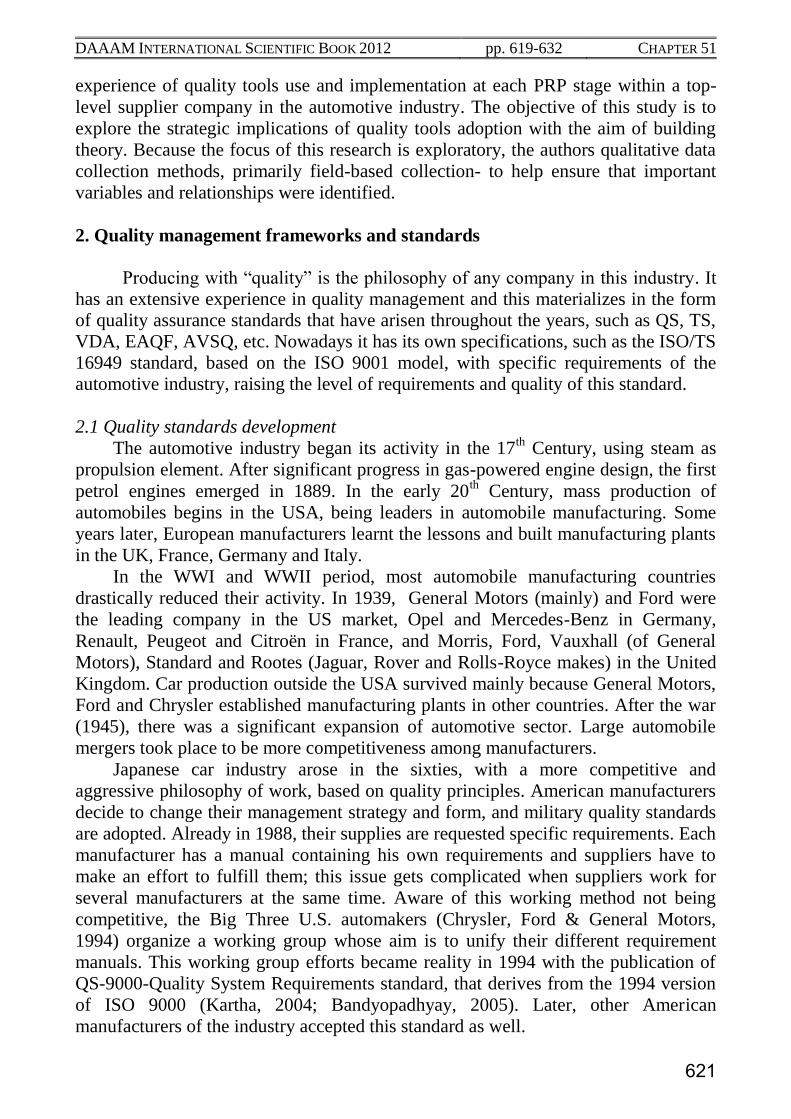
DAAAM INTERNATIONAL SCIENTIFIC BOOK 2012 pp. 619-632 CHAPTER 51
experience of quality tools use and implementation at each PRP stage within a top-
level supplier company in the automotive industry. The objective of this study is to
explore the strategic implications of quality tools adoption with the aim of building
theory. Because the focus of this research is exploratory, the authors qualitative data
collection methods, primarily field-based collection- to help ensure that important
variables and relationships were identified.
2. Quality management frameworks and standards
Producing with “quality” is the philosophy of any company in this industry. It
has an extensive experience in quality management and this materializes in the form
of quality assurance standards that have arisen throughout the years, such as QS, TS,
VDA, EAQF, AVSQ, etc. Nowadays it has its own specifications, such as the ISO/TS
16949 standard, based on the ISO 9001 model, with specific requirements of the
automotive industry, raising the level of requirements and quality of this standard.
2.1 Quality standards development
The automotive industry began its activity in the 17th
Century, using steam as
propulsion element. After significant progress in gas-powered engine design, the first
petrol engines emerged in 1889. In the early 20th Century, mass production of
automobiles begins in the USA, being leaders in automobile manufacturing. Some
years later, European manufacturers learnt the lessons and built manufacturing plants
in the UK, France, Germany and Italy.
In the WWI and WWII period, most automobile manufacturing countries
drastically reduced their activity. In 1939, General Motors (mainly) and Ford were
the leading company in the US market, Opel and Mercedes-Benz in Germany,
Renault, Peugeot and Citroën in France, and Morris, Ford, Vauxhall (of General
Motors), Standard and Rootes (Jaguar, Rover and Rolls-Royce makes) in the United
Kingdom. Car production outside the USA survived mainly because General Motors,
Ford and Chrysler established manufacturing plants in other countries. After the war
(1945), there was a significant expansion of automotive sector. Large automobile
mergers took place to be more competitiveness among manufacturers.
Japanese car industry arose in the sixties, with a more competitive and
aggressive philosophy of work, based on quality principles. American manufacturers
decide to change their management strategy and form, and military quality standards
are adopted. Already in 1988, their supplies are requested specific requirements. Each
manufacturer has a manual containing his own requirements and suppliers have to
make an effort to fulfill them; this issue gets complicated when suppliers work for
several manufacturers at the same time. Aware of this working method not being
competitive, the Big Three U.S. automakers (Chrysler, Ford & General Motors,
1994) organize a working group whose aim is to unify their different requirement
manuals. This working group efforts became reality in 1994 with the publication of
QS-9000-Quality System Requirements standard, that derives from the 1994 version
of ISO 9000 (Kartha, 2004; Bandyopadhyay, 2005). Later, other American
manufacturers of the industry accepted this standard as well.
621
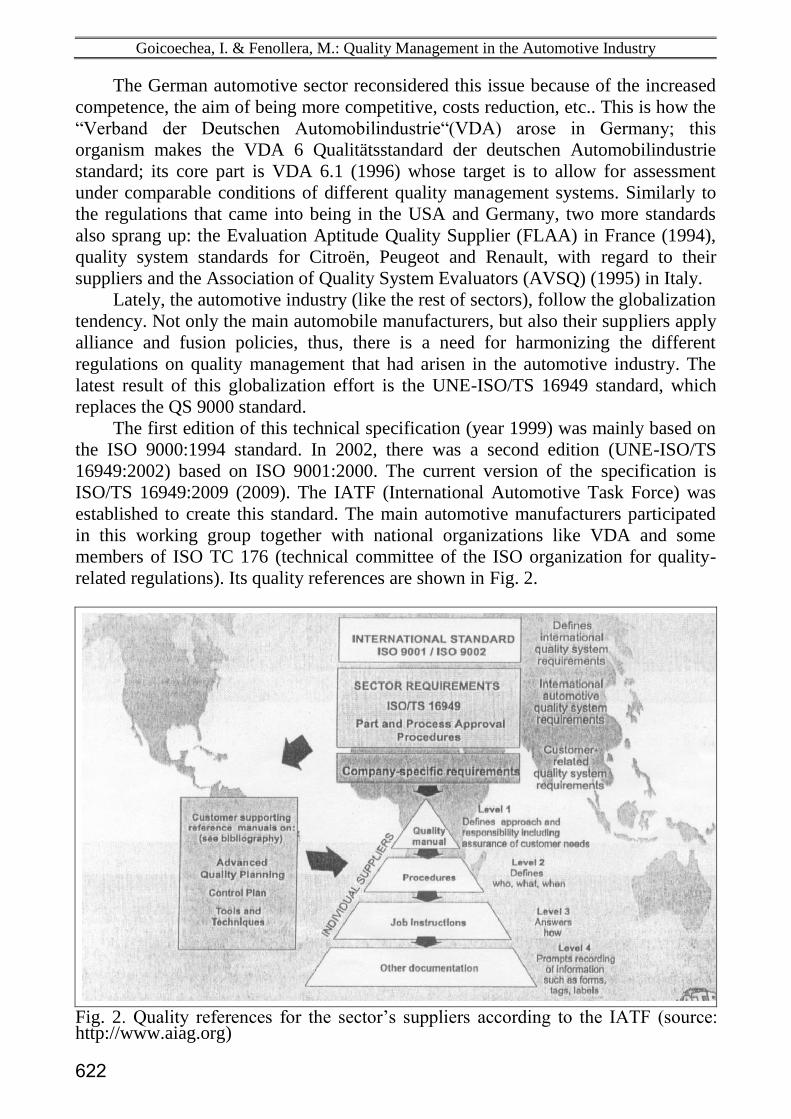
Goicoechea, I. & Fenollera, M.: Quality Management in the Automotive Industry
The German automotive sector reconsidered this issue because of the increased
competence, the aim of being more competitive, costs reduction, etc.. This is how the
“Verband der Deutschen Automobilindustrie“(VDA) arose in Germany; this
organism makes the VDA 6 Qualitätsstandard der deutschen Automobilindustrie
standard; its core part is VDA 6.1 (1996) whose target is to allow for assessment
under comparable conditions of different quality management systems. Similarly to
the regulations that came into being in the USA and Germany, two more standards
also sprang up: the Evaluation Aptitude Quality Supplier (FLAA) in France (1994),
quality system standards for Citroën, Peugeot and Renault, with regard to their
suppliers and the Association of Quality System Evaluators (AVSQ) (1995) in Italy.
Lately, the automotive industry (like the rest of sectors), follow the globalization
tendency. Not only the main automobile manufacturers, but also their suppliers apply
alliance and fusion policies, thus, there is a need for harmonizing the different
regulations on quality management that had arisen in the automotive industry. The
latest result of this globalization effort is the UNE-ISO/TS 16949 standard, which
replaces the QS 9000 standard.
The first edition of this technical specification (year 1999) was mainly based on
the ISO 9000:1994 standard. In 2002, there was a second edition (UNE-ISO/TS
16949:2002) based on ISO 9001:2000. The current version of the specification is
ISO/TS 16949:2009 (2009). The IATF (International Automotive Task Force) was
established to create this standard. The main automotive manufacturers participated
in this working group together with national organizations like VDA and some
members of ISO TC 176 (technical committee of the ISO organization for quality-
related regulations). Its quality references are shown in Fig. 2.
Fig. 2. Quality references for the sector’s suppliers according to the IATF (source: http://www.aiag.org)
622
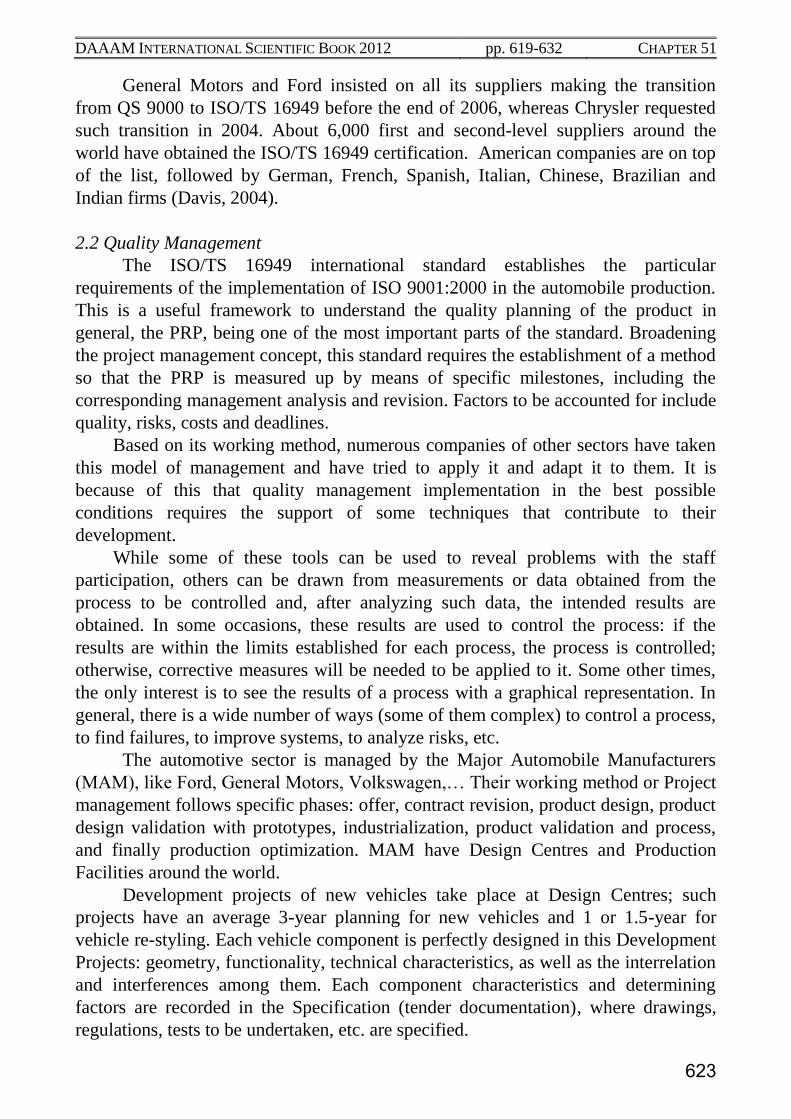
DAAAM INTERNATIONAL SCIENTIFIC BOOK 2012 pp. 619-632 CHAPTER 51
General Motors and Ford insisted on all its suppliers making the transition
from QS 9000 to ISO/TS 16949 before the end of 2006, whereas Chrysler requested
such transition in 2004. About 6,000 first and second-level suppliers around the
world have obtained the ISO/TS 16949 certification. American companies are on top
of the list, followed by German, French, Spanish, Italian, Chinese, Brazilian and
Indian firms (Davis, 2004).
2.2 Quality Management
The ISO/TS 16949 international standard establishes the particular
requirements of the implementation of ISO 9001:2000 in the automobile production.
This is a useful framework to understand the quality planning of the product in
general, the PRP, being one of the most important parts of the standard. Broadening
the project management concept, this standard requires the establishment of a method
so that the PRP is measured up by means of specific milestones, including the
corresponding management analysis and revision. Factors to be accounted for include
quality, risks, costs and deadlines.
Based on its working method, numerous companies of other sectors have taken
this model of management and have tried to apply it and adapt it to them. It is
because of this that quality management implementation in the best possible
conditions requires the support of some techniques that contribute to their
development.
While some of these tools can be used to reveal problems with the staff
participation, others can be drawn from measurements or data obtained from the
process to be controlled and, after analyzing such data, the intended results are
obtained. In some occasions, these results are used to control the process: if the
results are within the limits established for each process, the process is controlled;
otherwise, corrective measures will be needed to be applied to it. Some other times,
the only interest is to see the results of a process with a graphical representation. In
general, there is a wide number of ways (some of them complex) to control a process,
to find failures, to improve systems, to analyze risks, etc.
The automotive sector is managed by the Major Automobile Manufacturers
(MAM), like Ford, General Motors, Volkswagen,… Their working method or Project
management follows specific phases: offer, contract revision, product design, product
design validation with prototypes, industrialization, product validation and process,
and finally production optimization. MAM have Design Centres and Production
Facilities around the world.
Development projects of new vehicles take place at Design Centres; such
projects have an average 3-year planning for new vehicles and 1 or 1.5-year for
vehicle re-styling. Each vehicle component is perfectly designed in this Development
Projects: geometry, functionality, technical characteristics, as well as the interrelation
and interferences among them. Each component characteristics and determining
factors are recorded in the Specification (tender documentation), where drawings,
regulations, tests to be undertaken, etc. are specified.
623
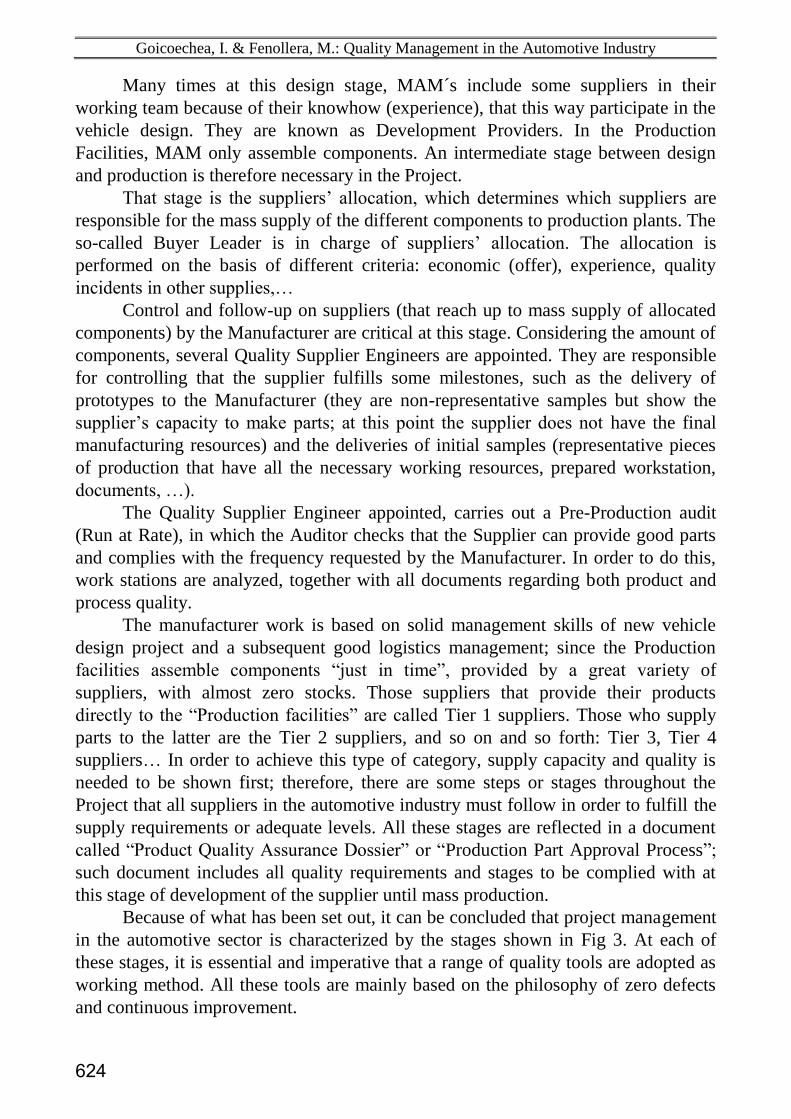
Goicoechea, I. & Fenollera, M.: Quality Management in the Automotive Industry
Many times at this design stage, MAM´s include some suppliers in their
working team because of their knowhow (experience), that this way participate in the
vehicle design. They are known as Development Providers. In the Production
Facilities, MAM only assemble components. An intermediate stage between design
and production is therefore necessary in the Project.
That stage is the suppliers’ allocation, which determines which suppliers are
responsible for the mass supply of the different components to production plants. The
so-called Buyer Leader is in charge of suppliers’ allocation. The allocation is
performed on the basis of different criteria: economic (offer), experience, quality
incidents in other supplies,…
Control and follow-up on suppliers (that reach up to mass supply of allocated
components) by the Manufacturer are critical at this stage. Considering the amount of
components, several Quality Supplier Engineers are appointed. They are responsible
for controlling that the supplier fulfills some milestones, such as the delivery of
prototypes to the Manufacturer (they are non-representative samples but show the
supplier’s capacity to make parts; at this point the supplier does not have the final
manufacturing resources) and the deliveries of initial samples (representative pieces
of production that have all the necessary working resources, prepared workstation,
documents, …).
The Quality Supplier Engineer appointed, carries out a Pre-Production audit
(Run at Rate), in which the Auditor checks that the Supplier can provide good parts
and complies with the frequency requested by the Manufacturer. In order to do this,
work stations are analyzed, together with all documents regarding both product and
process quality.
The manufacturer work is based on solid management skills of new vehicle
design project and a subsequent good logistics management; since the Production
facilities assemble components “just in time”, provided by a great variety of
suppliers, with almost zero stocks. Those suppliers that provide their products
directly to the “Production facilities” are called Tier 1 suppliers. Those who supply
parts to the latter are the Tier 2 suppliers, and so on and so forth: Tier 3, Tier 4
suppliers… In order to achieve this type of category, supply capacity and quality is
needed to be shown first; therefore, there are some steps or stages throughout the
Project that all suppliers in the automotive industry must follow in order to fulfill the
supply requirements or adequate levels. All these stages are reflected in a document
called “Product Quality Assurance Dossier” or “Production Part Approval Process”;
such document includes all quality requirements and stages to be complied with at
this stage of development of the supplier until mass production.
Because of what has been set out, it can be concluded that project management
in the automotive sector is characterized by the stages shown in Fig 3. At each of
these stages, it is essential and imperative that a range of quality tools are adopted as
working method. All these tools are mainly based on the philosophy of zero defects
and continuous improvement.
624
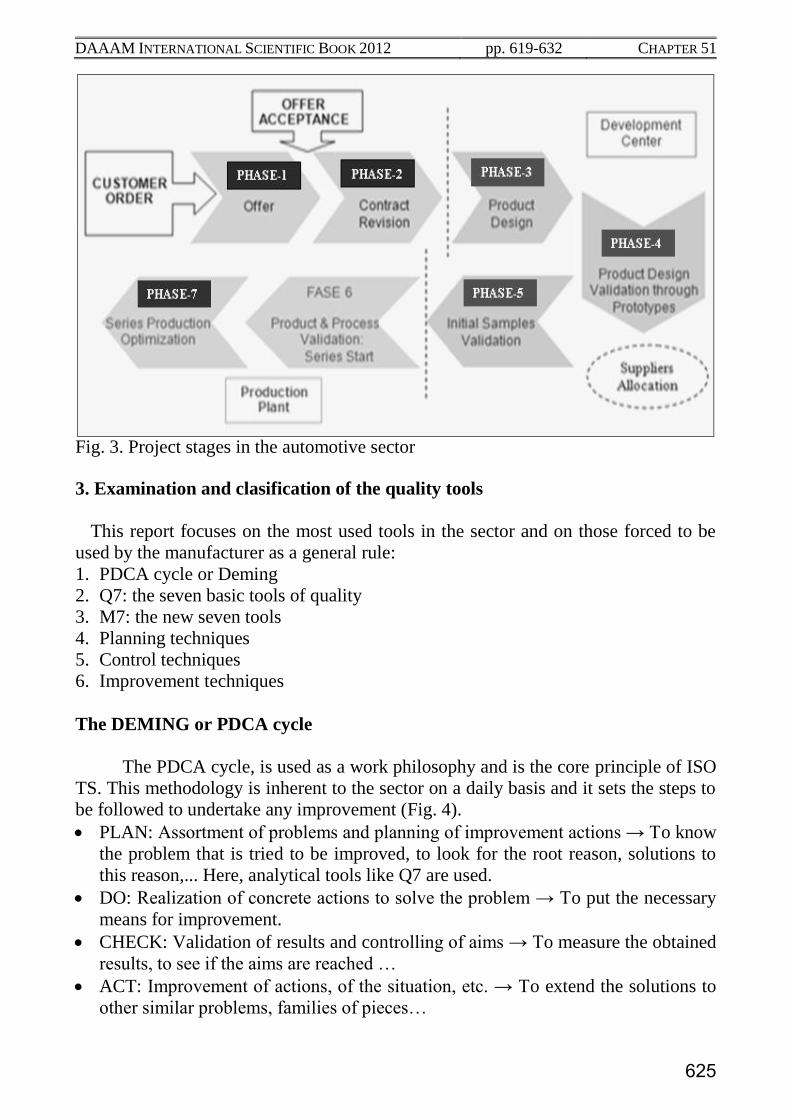
DAAAM INTERNATIONAL SCIENTIFIC BOOK 2012 pp. 619-632 CHAPTER 51
Fig. 3. Project stages in the automotive sector
3. Examination and clasification of the quality tools
This report focuses on the most used tools in the sector and on those forced to be
used by the manufacturer as a general rule:
1. PDCA cycle or Deming
2. Q7: the seven basic tools of quality
3. M7: the new seven tools
4. Planning techniques
5. Control techniques
6. Improvement techniques
The DEMING or PDCA cycle
The PDCA cycle, is used as a work philosophy and is the core principle of ISO
TS. This methodology is inherent to the sector on a daily basis and it sets the steps to
be followed to undertake any improvement (Fig. 4).
PLAN: Assortment of problems and planning of improvement actions → To know
the problem that is tried to be improved, to look for the root reason, solutions to
this reason,... Here, analytical tools like Q7 are used.
DO: Realization of concrete actions to solve the problem → To put the necessary
means for improvement.
CHECK: Validation of results and controlling of aims → To measure the obtained
results, to see if the aims are reached …
ACT: Improvement of actions, of the situation, etc. → To extend the solutions to
other similar problems, families of pieces…
625

Goicoechea, I. & Fenollera, M.: Quality Management in the Automotive Industry
Fig. 4. Deming cycle
It is based on the principle of quality management continuous improvement,
one of the basis supporting the quality philosophy. It analyzes existing data and
focuses on historical process capability to know the problem, that is to say, on
obvious and quantified facts and problems.
Q7: The seven basic tools of quality
They are known by “The Seven Basic Statistical Tools” because they are
appropriate for people with little formal education in statistics (Ishikawa, 1985):
Check sheet
Flow charts
Cause-and-Effect Diagrams (fishbone)
Control Charts
Histograms
Pareto Charts
Scatter Plot
A right approach to deal with issues is to see first if the issue exists by using
verified data (check sheet), quantifying its severity (Jiménez, 2010), if it is repetitive
and representative (histograms, Pareto charts) and using tools like cause and effect
diagrams intending to determine the root reason of the problem. Specifically, and as
an example, the scatter plot was used to pursue a test correlative to the hardness and
fatigue test applicable to polyurethane seats of any vehicle; such test is usually
626
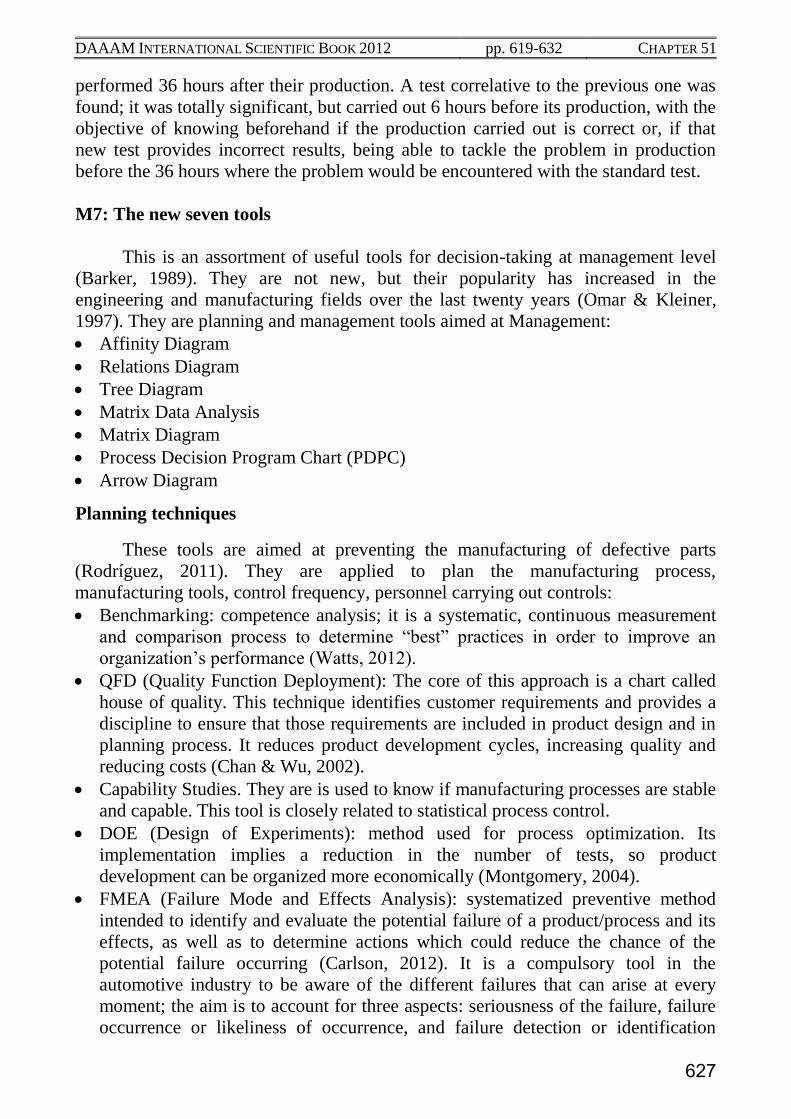
DAAAM INTERNATIONAL SCIENTIFIC BOOK 2012 pp. 619-632 CHAPTER 51
performed 36 hours after their production. A test correlative to the previous one was
found; it was totally significant, but carried out 6 hours before its production, with the
objective of knowing beforehand if the production carried out is correct or, if that
new test provides incorrect results, being able to tackle the problem in production
before the 36 hours where the problem would be encountered with the standard test.
M7: The new seven tools
This is an assortment of useful tools for decision-taking at management level
(Barker, 1989). They are not new, but their popularity has increased in the
engineering and manufacturing fields over the last twenty years (Omar & Kleiner,
1997). They are planning and management tools aimed at Management:
Affinity Diagram
Relations Diagram
Tree Diagram
Matrix Data Analysis
Matrix Diagram
Process Decision Program Chart (PDPC)
Arrow Diagram
Planning techniques
These tools are aimed at preventing the manufacturing of defective parts
(Rodríguez, 2011). They are applied to plan the manufacturing process,
manufacturing tools, control frequency, personnel carrying out controls:
Benchmarking: competence analysis; it is a systematic, continuous measurement
and comparison process to determine “best” practices in order to improve an
organization’s performance (Watts, 2012).
QFD (Quality Function Deployment): The core of this approach is a chart called
house of quality. This technique identifies customer requirements and provides a
discipline to ensure that those requirements are included in product design and in
planning process. It reduces product development cycles, increasing quality and
reducing costs (Chan & Wu, 2002).
Capability Studies. They are is used to know if manufacturing processes are stable
and capable. This tool is closely related to statistical process control.
DOE (Design of Experiments): method used for process optimization. Its
implementation implies a reduction in the number of tests, so product
development can be organized more economically (Montgomery, 2004).
FMEA (Failure Mode and Effects Analysis): systematized preventive method
intended to identify and evaluate the potential failure of a product/process and its
effects, as well as to determine actions which could reduce the chance of the
potential failure occurring (Carlson, 2012). It is a compulsory tool in the
automotive industry to be aware of the different failures that can arise at every
moment; the aim is to account for three aspects: seriousness of the failure, failure
occurrence or likeliness of occurrence, and failure detection or identification
627
Goicoechea, I. & Fenollera, M.: Quality Management in the Automotive Industry
ability during the process. Once those aspects are valued, the criticality rating is
estimated as the multiplication of the three. If that value is higher than that
requested by the Manufacturer, actions are taken. Since the seriousness of the
failure cannot be changed, focus must be on occurrence or detection, in order to
diminish the criticality rating. The ideal thing is to deal with occurrence, by means
of elements called pokayokes or “mistake proofing” systems that avoid mistakes
made by human error. Some other times, it is not possible to focus on occurrence,
and prevention is then tackled, seeking systems that fully detect failures before
moving to the next stage. As far as costs are concerned, it is important to detect
failures at the beginning of processes and not at the end of manufacturing.
Control plan: document used to plan all controls to be carried out in a manufacturing
process, per job, as a result of the FMEA planning. They are mandatory in the
automotive sector.
Control techniques
The following quality techniques are widely used as control techniques:
SPC (Statistical Process Control): in every production process, it is necessary to
know up to which extent the products meet the pre-established
requirements (Automotive Industry Action Group, 1995). The Voice of the
Process (variability observed), and the “Voice of the Customer” (Specification
limits) have to be compared. Therefore, Capability Studies provide indicators
called capability indices (Cp, Cpk, Pp, Ppk), that inform about the level of
compliance. On the other hand, process stability is to be guaranteed in order to
tackle them if they are out of control. Control charts represent the Statistical
Process Control (SPC) tool and notices when a process stops following the random
pattern of normal behaviour.
Audits: there are many types of audits, classified by internal or made by the
customer. They are daily present in automotive companies, where there are several
auditors that plan audits of all kinds yearly: Production, Pre-production (Internal);
Run at Rate (Pre-production Customer); Quality; Product; Spic & Span (5-S
philosophy); Security and Regulations.
Definition of indicators: Key Performance Indicators are quantifiable aspects that
reflect the critical factors. There are many important indicators related to quality.
They are defined during the different Project development stages, like control tool,
for example “quality incident indicators of suppliers”, of compliance of initial
samples and prototypes, those referred to delays in deliveries, suppliers’ quality
systems... The main goal is to find proper indicators for particular processes and
find methodology that helps to identify those indicators (Nagyova & Pacaiova,
2009).
628
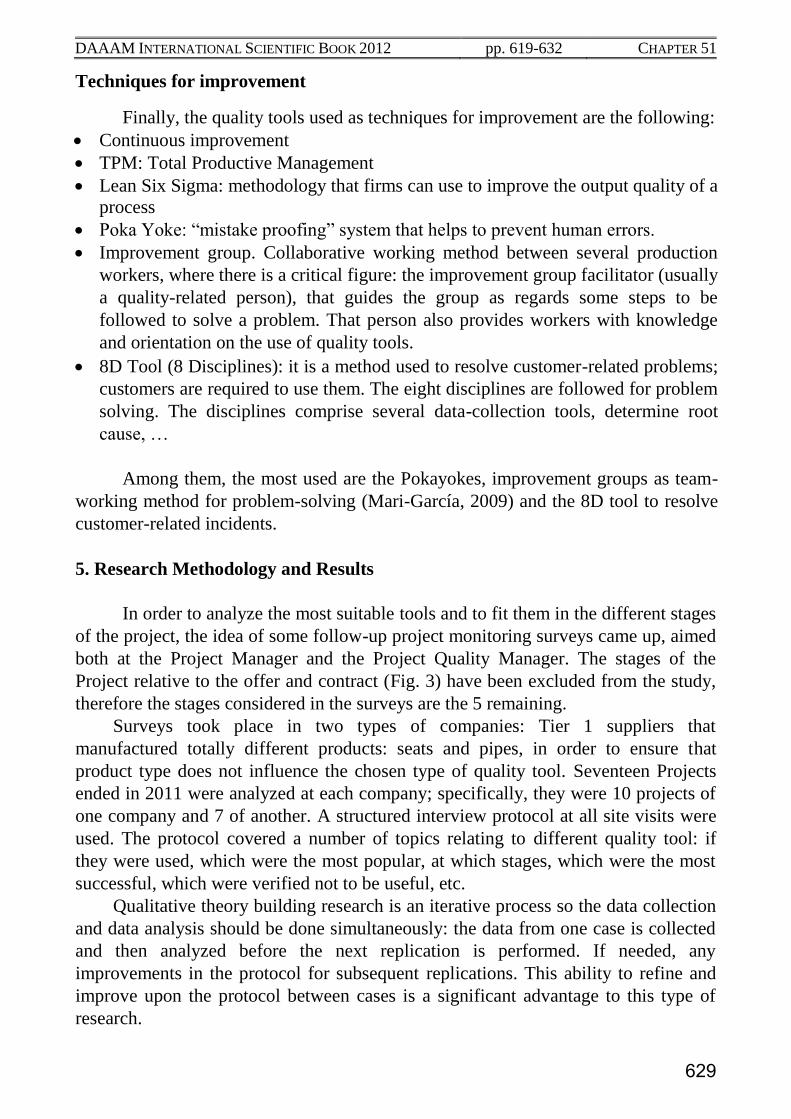
DAAAM INTERNATIONAL SCIENTIFIC BOOK 2012 pp. 619-632 CHAPTER 51
Techniques for improvement
Finally, the quality tools used as techniques for improvement are the following:
Continuous improvement
TPM: Total Productive Management
Lean Six Sigma: methodology that firms can use to improve the output quality of a
process
Poka Yoke: “mistake proofing” system that helps to prevent human errors.
Improvement group. Collaborative working method between several production
workers, where there is a critical figure: the improvement group facilitator (usually
a quality-related person), that guides the group as regards some steps to be
followed to solve a problem. That person also provides workers with knowledge
and orientation on the use of quality tools.
8D Tool (8 Disciplines): it is a method used to resolve customer-related problems;
customers are required to use them. The eight disciplines are followed for problem
solving. The disciplines comprise several data-collection tools, determine root
cause, …
Among them, the most used are the Pokayokes, improvement groups as team-
working method for problem-solving (Mari-García, 2009) and the 8D tool to resolve
customer-related incidents.
5. Research Methodology and Results
In order to analyze the most suitable tools and to fit them in the different stages
of the project, the idea of some follow-up project monitoring surveys came up, aimed
both at the Project Manager and the Project Quality Manager. The stages of the
Project relative to the offer and contract (Fig. 3) have been excluded from the study,
therefore the stages considered in the surveys are the 5 remaining.
Surveys took place in two types of companies: Tier 1 suppliers that
manufactured totally different products: seats and pipes, in order to ensure that
product type does not influence the chosen type of quality tool. Seventeen Projects
ended in 2011 were analyzed at each company; specifically, they were 10 projects of
one company and 7 of another. A structured interview protocol at all site visits were
used. The protocol covered a number of topics relating to different quality tool: if
they were used, which were the most popular, at which stages, which were the most
successful, which were verified not to be useful, etc.
Qualitative theory building research is an iterative process so the data collection
and data analysis should be done simultaneously: the data from one case is collected
and then analyzed before the next replication is performed. If needed, any
improvements in the protocol for subsequent replications. This ability to refine and
improve upon the protocol between cases is a significant advantage to this type of
research.
629
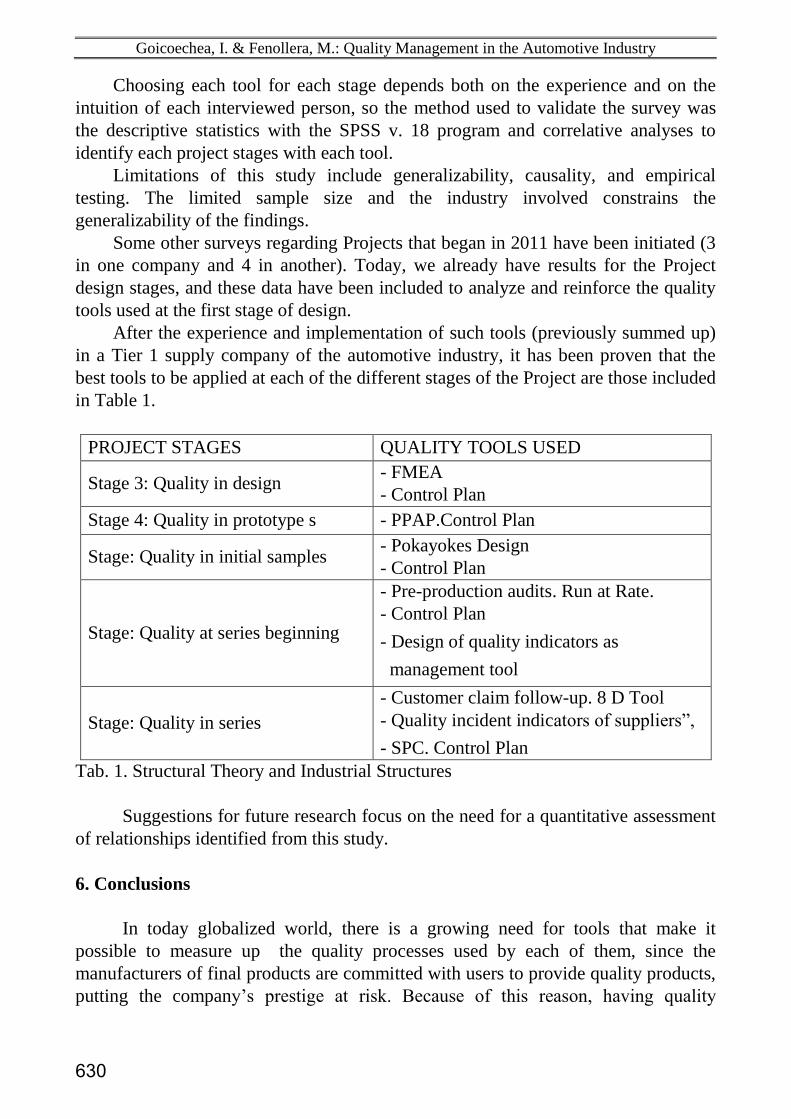
Goicoechea, I. & Fenollera, M.: Quality Management in the Automotive Industry
Choosing each tool for each stage depends both on the experience and on the
intuition of each interviewed person, so the method used to validate the survey was
the descriptive statistics with the SPSS v. 18 program and correlative analyses to
identify each project stages with each tool.
Limitations of this study include generalizability, causality, and empirical
testing. The limited sample size and the industry involved constrains the
generalizability of the findings.
Some other surveys regarding Projects that began in 2011 have been initiated (3
in one company and 4 in another). Today, we already have results for the Project
design stages, and these data have been included to analyze and reinforce the quality
tools used at the first stage of design.
After the experience and implementation of such tools (previously summed up)
in a Tier 1 supply company of the automotive industry, it has been proven that the
best tools to be applied at each of the different stages of the Project are those included
in Table 1.
PROJECT STAGES QUALITY TOOLS USED
Stage 3: Quality in design - FMEA
- Control Plan
Stage 4: Quality in prototype s - PPAP.Control Plan
Stage: Quality in initial samples - Pokayokes Design
- Control Plan
Stage: Quality at series beginning
- Pre-production audits. Run at Rate.
- Control Plan
- Design of quality indicators as
management tool
Stage: Quality in series
- Customer claim follow-up. 8 D Tool
- Quality incident indicators of suppliers”,
- SPC. Control Plan
Tab. 1. Structural Theory and Industrial Structures
Suggestions for future research focus on the need for a quantitative assessment
of relationships identified from this study.
6. Conclusions
In today globalized world, there is a growing need for tools that make it
possible to measure up the quality processes used by each of them, since the
manufacturers of final products are committed with users to provide quality products,
putting the company’s prestige at risk. Because of this reason, having quality
630
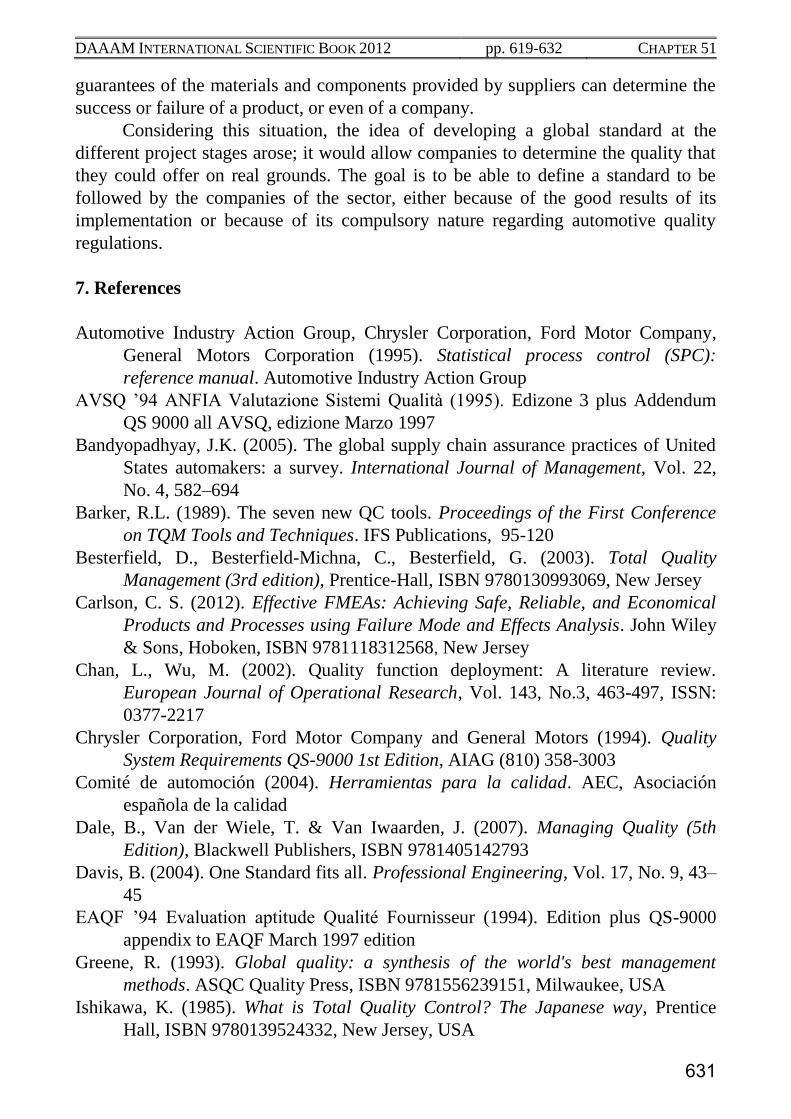
DAAAM INTERNATIONAL SCIENTIFIC BOOK 2012 pp. 619-632 CHAPTER 51
guarantees of the materials and components provided by suppliers can determine the
success or failure of a product, or even of a company.
Considering this situation, the idea of developing a global standard at the
different project stages arose; it would allow companies to determine the quality that
they could offer on real grounds. The goal is to be able to define a standard to be
followed by the companies of the sector, either because of the good results of its
implementation or because of its compulsory nature regarding automotive quality
regulations.
7. References
Automotive Industry Action Group, Chrysler Corporation, Ford Motor Company,
General Motors Corporation (1995). Statistical process control (SPC):
reference manual. Automotive Industry Action Group
AVSQ ’94 ANFIA Valutazione Sistemi Qualità (1995). Edizone 3 plus Addendum
QS 9000 all AVSQ, edizione Marzo 1997
Bandyopadhyay, J.K. (2005). The global supply chain assurance practices of United
States automakers: a survey. International Journal of Management, Vol. 22,
No. 4, 582–694
Barker, R.L. (1989). The seven new QC tools. Proceedings of the First Conference
on TQM Tools and Techniques. IFS Publications, 95-120
Besterfield, D., Besterfield-Michna, C., Besterfield, G. (2003). Total Quality
Management (3rd edition), Prentice-Hall, ISBN 9780130993069, New Jersey
Carlson, C. S. (2012). Effective FMEAs: Achieving Safe, Reliable, and Economical
Products and Processes using Failure Mode and Effects Analysis. John Wiley
& Sons, Hoboken, ISBN 9781118312568, New Jersey
Chan, L., Wu, M. (2002). Quality function deployment: A literature review.
European Journal of Operational Research, Vol. 143, No.3, 463-497, ISSN:
0377-2217
Chrysler Corporation, Ford Motor Company and General Motors (1994). Quality
System Requirements QS-9000 1st Edition, AIAG (810) 358-3003
Comité de automoción (2004). Herramientas para la calidad. AEC, Asociación
española de la calidad
Dale, B., Van der Wiele, T. & Van Iwaarden, J. (2007). Managing Quality (5th
Edition), Blackwell Publishers, ISBN 9781405142793
Davis, B. (2004). One Standard fits all. Professional Engineering, Vol. 17, No. 9, 43–
45
EAQF ’94 Evaluation aptitude Qualité Fournisseur (1994). Edition plus QS-9000
appendix to EAQF March 1997 edition
Greene, R. (1993). Global quality: a synthesis of the world's best management
methods. ASQC Quality Press, ISBN 9781556239151, Milwaukee, USA
Ishikawa, K. (1985). What is Total Quality Control? The Japanese way, Prentice
Hall, ISBN 9780139524332, New Jersey, USA
631
Goicoechea, I. & Fenollera, M.: Quality Management in the Automotive Industry
ISO/TS 16949:2009 (2009). Quality management systems: Particular requirements
for the application of ISO 9001:2008 for automotive production and relevant
service part organizations. ISO 9000, Quality Management Systems, ISO
Website
Jiménez, J.M. (2008). El coste de la variabilidad de los procesos. Proceedings of the
XIII Congreso de Calidad y medioambiente en la Automoción.
Jiménez, J.M. (2010). El valor de los datos. Proceedings of the XV Congreso de
Calidad y medioambiente en la Automoción
Juran, J. & Gryna, F. (1998). Juran´s Quality Handbook, McGraw-Hill, ISBN
9780139524332
Kartha, C.P. (2004). A comparison of ISO 9000:2000 quality system standards, QS
9000, ISO/TS 16949 and Baldrige criteria. The TQM Magazine, Vol. 16, No. 5,
331 – 340, ISSN 0954-478X
Mari-Garcia, J. (2009). La gestión de los recursos humanos: gestión del talento en el
sector de automoción. Jornada sobre innovación y mejora de procesos en el
sector de automoción
Montgomery, D.C. (2004). Design and Analysis of Experiments (6th edition), John
Wiley & Sons.Inc, ISBN 9780471487357
Nagyova, A. & Pacaiova, H. (2009). How to Build Manual for Key Performance
Indicators –KPI, Chapter 15 in DAAAM International Scientific Book 2009,
pp. 135-142, B. Katalinic (ED.), published by DAAAM International, ISBN
978-3-901509-69-8, ISSN 1726-9687, Vienna, Austria
Nagyova, A. & Pacaiova, H. (2010). Quality Evaluation Methodologhy for Research
projects, Chapter 22 in DAAAM International Scientific Book 2010, pp. 219-
226, B. Katalinic (ED.), published by DAAAM International, ISBN 978-3-
901509-74-2, ISSN 1726-9687, Vienna, Austria
Omar, T.A. & Kleiner, B.H. (1997). Effective decision making in the defence
industry. Aircraft Engineering and Aerospace Technology, Vol. 69, No. 2,
151–159, ISSN: 0002-2667
Rodriguez, E. (2011). Diseño robusto. La calidad preventiva desde el diseño y el
desarrollo. Qalidad, No. I , 49-52, ISSN 156-4915.
VDA 6.1 Qualitätsmanagement in der Automobilindustrie (1996). QM Systemaudit 3
vollständig überarbeitete Auflage 1996/1
Watts, F.B. (2012). Engineering Documentation Control Handbook .Configuration
Management and Product Lifecycle Management (Fourth Edition). Chapter 15,
335-346, Elsevier, ISBN 9781455778607, United States
632
��������� ����� ��������������������� ��
����������������� ��� ������� � ������� ���������������� ������ ��!
�"#$%&�'()*&+,�-./.#&-&/,�0$,1�2+(3-4567898648�:;:89�<�=>?@A�BCDEF?EAGH�IAFJKLK@K>M�<�NN�OPQRSTU�NVWWXYZ[TU\�]ZPTYT_ a�b�cdbe�bfdg�hibdcjekXYZ[TU\�]l�mNVWWnl�o[ZYT�pURqTPQ�rsts[TrTtQ�uZQ�XPUvrl�wspTU�pUTxTtQTy�sQ�w]z{�|YRSsY�}Rt[UTxx�NVWW~�RUQ�orTUZPs\��sYYsx\���l��TuQRutX�vsUT\�wo��wURqTPQ�]sts[TrTtQ�ztxQZQvQTl;�gbihcbXPUvr�Zx�RtT�R��QT�s[ZYT�rTQRyRYR[ZTx�yTxZ[tTy�QR�[vZyT�QTsrx�Zt�QT�ZQTUsQZ�T�sty�ZtPUTrTtQsY�yTYZ�TU��R��s�pURyvPQl�O�QTt�UT�TUUTy�QR�sx��sts[ZYT�pURqTPQ�rsts[TrTtQ��UsrTuRU�\��ZQx��RPvx�Zx�Rt�QT�vxT�R��st�TrpZUZPsY�pURPTxx�QsQ�sYYRux�QTsrx�QR�UTxpRty�UspZyY�\�T��PZTtQY�\�styT��TPQZ�TY��QR�Pst[Tl��UsyZQZRtsY�pURqTPQ�rsts[TrTtQ�rTQRyx����UT�vZUTrTtQx�Zt�st�T��RUQ�QR�PRtQURY�QZrT�sty�PRxQ��XPUvr�Rt�QT�RQTU�sty\��Tx�QZrT�sty�PRxQ�Zt�st�T��RUQ�QR�PRtQURY�UT�vZUTrTtQxl��Zx�Zx�yRtT�vxZt[�QZrT�SR�Tx\�PRYYsSRUsQZ�T�PTUTrRtZTx\�s�pUZRUZQZ�Ty�pURyvPQ�SsP�YR[\sty��UT�vTtQ��TTySsP��P�PYTxl��T�Zt�RY�TrTtQ�R��QT�SvxZtTxx�QURv[RvQ�QT�pURqTPQ�Zx�PUZQZPsY�sx�XPUvr�UTYZTx�Ts�ZY��Rt�QT�PRYYsSRUsQZRtSTQuTTt�QT�QTsr�sty�QT�PvxQRrTU�RU�PvxQRrTU�UTpUTxTtQsQZ�T�QR�PUTsQT�QT�UZ[Q�pURyvPQ�Zt�s�YTst��sxZRtl��Zx�pspTU�pUR�ZyTx�st�R�TU�ZTu�R�XPUvr�sty�ZQx�vxT�Zt�pURqTPQ�rsts[TrTtQl�fhb�dg��ci����T�xRvYy��UxQ�ST�PYTsU�Rt�usQ�XPUvr�Zx�tRQl��TUT�Zx�s�PRrrRt�rZxPRtPTpQZRt�QsQ�o[ZYT�Zx�XPUvrl�� ZYT�XPUvr�Zx�ZtyTTy�s[ZYT\�ZQ�Zx�tRQ�QTxRYT�rTQRy�R��ZrpYTrTtQZt[�s[ZYT�pUZtPZpYTxl�XPUvr�Zx�xZrpY��RtT�R��rst��s[ZYT�sppURsPTx�QR�pURyvPQ�yT�TYRprTtQl�OQTU�rTQRyx�ZtPYvyT��QUTrT�wUR[UsrrZt[�m�wn\�}U�xQsY\��TsQvUT��UZ�Tt��T�TYRprTtQ\��X�]�oQTUt\�sty�xR�Rtl�oYY�R��QTxT�rTQRyx�syTUT�QR�QT�o[ZYT�]stZ�TxQRsty�ZQx�sxxRPZsQTy�pUZtPZpYTxl�o�TYp�vY�rTQspRU�uRvYy�ST�QR�QZt��R��o[ZYT�sx�STZt[�ZPT�PUTsr\�uZYT�XPUvr\��w\�}U�xQsY\�TQPl\�sUT�sYY�xZrpY�yZ��TUTtQ��s�RUx\�YZ�T�PRPRYsQT\�xQUsuSTUU�\��stZYYsl��T��sUT�sYY�s[ZYT\�QT��sUT�sYY�[RRy\�sty�rst��Pst�ST�vxTy�Zt�PRrSZtsQZRtlXZrpY��pvQ\�XPUvr�Zx�st�s[ZYT�rTQRy�R��ZQTUsQZ�T�sty�ZtPUTrTtQsY�pURyvPQ�yTYZ�TU��QsQ�vxTx��UT�vTtQ��TTySsP��sty�PRYYsSRUsQZ�T�yTPZxZRtrs�Zt[l_dgbi�XPUvr�Zx�SsxTy�Rt�s�W����pspTU�uUZQQTt�S���ZURQs�s��s�TvPZ�sty�z�vqZUR��Rts�s��RU�QT��sU�sUy��vxZtTxx��T�ZTu�QZQYTy���T��Tu��Tu�wURyvPQ�T�TYRprTtQ�|srTl��zt�QZx�pspTU\�QT�svQRUx�vxTy�QT�xpRUQ�R��Uv[S��sx�s�rTQspRU�QR�yTxPUZST�QT�STtT�Qx�R��xTY� RU[stZ�Zt[�QTsrx�ZtZttR�sQZ�T�pURyvPQ�yT�TYRprTtQ�sty�yTYZ�TU�l�¡T���XvQTUYsty\�¢Tt�XPusSTU\�sty�]Z�T��TTyYT�QRR��QT�ZyTsx��URr�QZx�pspTU\�ZtPYvyZt[�QTrTQspRU\�sty�sppYZTy�ZQ�QR�QTZU��TYy�R��xR�QusUT�yT�TYRprTtQl��T��PsYYTy�QTZU�tTu�rTQRy�XPUvr\�s�QTU�QT�Uv[S��QTUr�QsQ�yTxPUZSTx�RuQTsrx��RUr�s�PZUPYT�sty�[R��RU�QT�SsYY�QR�[TQ�ZQ�SsP��ZtQR�pYs��s[sZtl��T���UxQ�sppYZTy�QZx�rTQRy�sQ��sxTY�}RUpRUsQZRt�Zt�W��£l�XPusSTU�sty�TTyYT�uURQT�sSRvQ�QTZU�T�pTUZTtPTx�Zt�QTZU�SRR��o[ZYT�XR�QusUT��T�TYRprTtQ�uZQ�XPUvr�Zt�NVVN\��RYYRuTy�S��XPusSTU¤x�SRR��o[ZYT�wURqTPQ]sts[TrTtQ�uZQ�XPUvr�Zt�NVV¥\�uZP�ZtPYvyTy�QT�uRU��XPusSTU�sy�yRtT�uZQ�wUZrs�TUsl¦fe��ci���7ih�ea i§XPusSTU�UT�TUx�QR�XPUvr�sx�s��UsrTuRU��sty�tRQ�s�rTQRyRYR[�l��Zx�Zx�pUZrsUZY��yvT�QR�QT�PRttRQsQZRtx�sURvty�QT�uRUy�rTQRyRYR[�\uZP�rst��Zt�TU�sx�pUTxPUZpQZ�T�Zt�tsQvUTl����PRtQUsxQ\�XPUvr�xZrpY��pUR�ZyTx�s�xQUvPQvUT��RU�yTYZ�TU�\�SvQ�yRTx�tRQ�QTYY��Rv�Ru�QR�yR�xpTPZ�PpUsPQZPTx\�YTs�Zt[�QsQ�QR�QT�QTsr�QR�yTQTUrZtTl���ZSZQ�W�xRux�QT�SsxZP�XPUvr��UsrTuRU�l
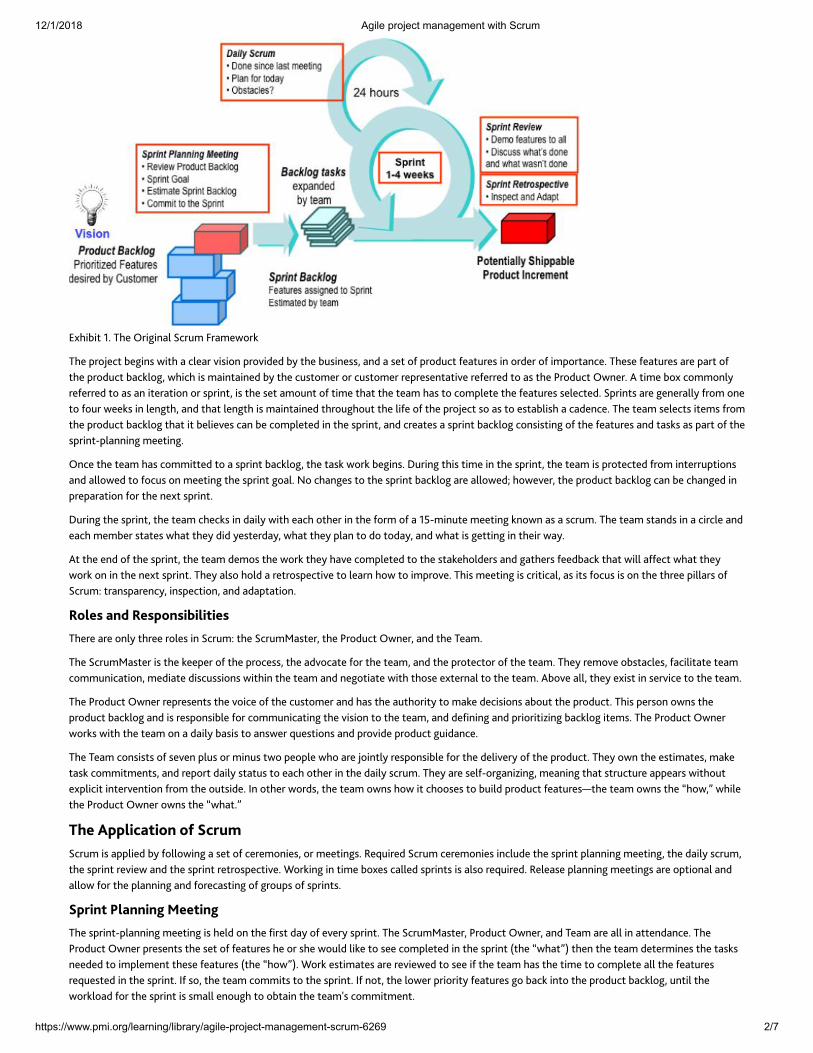
��������� ����� ��������������������� ��
����������������� ��� ������� � ������� ���������������� ������ ��!
"#$%&%'�()�*$+�,-%.%/01�23-45�6-05+78-9*$+�:-8;+3'�&+.%/<�7%'$�0�31+0-�=%<%8/�:-8=%>+>�&?�'$+�&4<%/+<<@�0/>�0�<+'�8A�:-8>43'�A+0'4-+<�%/�8->+-�8A�%5:8-'0/3+)�*$+<+�A+0'4-+<�0-+�:0-'�8A'$+�:-8>43'�&03918.@�7$%3$�%<�50%/'0%/+>�&?�'$+�34<'85+-�8-�34<'85+-�-+:-+<+/'0'%=+�-+A+--+>�'8�0<�'$+�B-8>43'�,7/+-)�C�'%5+�&8#�38558/1?-+A+--+>�'8�0<�0/�%'+-0'%8/�8-�<:-%/'@�%<�'$+�<+'�0584/'�8A�'%5+�'$0'�'$+�'+05�$0<�'8�385:1+'+�'$+�A+0'4-+<�<+1+3'+>)�2:-%/'<�0-+�.+/+-011?�A-85�8/+'8�A84-�7++9<�%/�1+/.'$@�0/>�'$0'�1+/.'$�%<�50%/'0%/+>�'$-84.$84'�'$+�1%A+�8A�'$+�:-8;+3'�<8�0<�'8�+<'0&1%<$�0�30>+/3+)�*$+�'+05�<+1+3'<�%'+5<�A-85'$+�:-8>43'�&03918.�'$0'�%'�&+1%+=+<�30/�&+�385:1+'+>�%/�'$+�<:-%/'@�0/>�3-+0'+<�0�<:-%/'�&03918.�38/<%<'%/.�8A�'$+�A+0'4-+<�0/>�'0<9<�0<�:0-'�8A�'$+<:-%/'D:10//%/.�5++'%/.),/3+�'$+�'+05�$0<�3855%''+>�'8�0�<:-%/'�&03918.@�'$+�'0<9�78-9�&+.%/<)�E4-%/.�'$%<�'%5+�%/�'$+�<:-%/'@�'$+�'+05�%<�:-8'+3'+>�A-85�%/'+--4:'%8/<0/>�01187+>�'8�A834<�8/�5++'%/.�'$+�<:-%/'�.801)�F8�3$0/.+<�'8�'$+�<:-%/'�&03918.�0-+�01187+>G�$87+=+-@�'$+�:-8>43'�&03918.�30/�&+�3$0/.+>�%/:-+:0-0'%8/�A8-�'$+�/+#'�<:-%/')E4-%/.�'$+�<:-%/'@�'$+�'+05�3$+39<�%/�>0%1?�7%'$�+03$�8'$+-�%/�'$+�A8-5�8A�0�(HD5%/4'+�5++'%/.�9/87/�0<�0�<3-45)�*$+�'+05�<'0/><�%/�0�3%-31+�0/>+03$�5+5&+-�<'0'+<�7$0'�'$+?�>%>�?+<'+->0?@�7$0'�'$+?�:10/�'8�>8�'8>0?@�0/>�7$0'�%<�.+''%/.�%/�'$+%-�70?)C'�'$+�+/>�8A�'$+�<:-%/'@�'$+�'+05�>+58<�'$+�78-9�'$+?�$0=+�385:1+'+>�'8�'$+�<'09+$81>+-<�0/>�.0'$+-<�A++>&039�'$0'�7%11�0AA+3'�7$0'�'$+?78-9�8/�%/�'$+�/+#'�<:-%/')�*$+?�01<8�$81>�0�-+'-8<:+3'%=+�'8�1+0-/�$87�'8�%5:-8=+)�*$%<�5++'%/.�%<�3-%'%301@�0<�%'<�A834<�%<�8/�'$+�'$-++�:%110-<�8A23-45I�'-0/<:0-+/3?@�%/<:+3'%8/@�0/>�0>0:'0'%8/)JKLMN�OPQ�JMNRKPNSTSLSUSMN*$+-+�0-+�8/1?�'$-++�-81+<�%/�23-45I�'$+�23-45V0<'+-@�'$+�B-8>43'�,7/+-@�0/>�'$+�*+05)*$+�23-45V0<'+-�%<�'$+�9++:+-�8A�'$+�:-83+<<@�'$+�0>=830'+�A8-�'$+�'+05@�0/>�'$+�:-8'+3'8-�8A�'$+�'+05)�*$+?�-+58=+�8&<'031+<@�A03%1%'0'+�'+0538554/%30'%8/@�5+>%0'+�>%<34<<%8/<�7%'$%/�'$+�'+05�0/>�/+.8'%0'+�7%'$�'$8<+�+#'+-/01�'8�'$+�'+05)�C&8=+�011@�'$+?�+#%<'�%/�<+-=%3+�'8�'$+�'+05)*$+�B-8>43'�,7/+-�-+:-+<+/'<�'$+�=8%3+�8A�'$+�34<'85+-�0/>�$0<�'$+�04'$8-%'?�'8�509+�>+3%<%8/<�0&84'�'$+�:-8>43')�*$%<�:+-<8/�87/<�'$+:-8>43'�&03918.�0/>�%<�-+<:8/<%&1+�A8-�38554/%30'%/.�'$+�=%<%8/�'8�'$+�'+05@�0/>�>+W/%/.�0/>�:-%8-%'%X%/.�&03918.�%'+5<)�*$+�B-8>43'�,7/+-78-9<�7%'$�'$+�'+05�8/�0�>0%1?�&0<%<�'8�0/<7+-�Y4+<'%8/<�0/>�:-8=%>+�:-8>43'�.4%>0/3+)*$+�*+05�38/<%<'<�8A�<+=+/�:14<�8-�5%/4<�'78�:+8:1+�7$8�0-+�;8%/'1?�-+<:8/<%&1+�A8-�'$+�>+1%=+-?�8A�'$+�:-8>43')�*$+?�87/�'$+�+<'%50'+<@�509+'0<9�3855%'5+/'<@�0/>�-+:8-'�>0%1?�<'0'4<�'8�+03$�8'$+-�%/�'$+�>0%1?�<3-45)�*$+?�0-+�<+1AD8-.0/%X%/.@�5+0/%/.�'$0'�<'-43'4-+�0::+0-<�7%'$84'+#:1%3%'�%/'+-=+/'%8/�A-85�'$+�84'<%>+)�Z/�8'$+-�78-><@�'$+�'+05�87/<�$87�%'�3$88<+<�'8�&4%1>�:-8>43'�A+0'4-+<['$+�'+05�87/<�'$+�\$87@]�7$%1+'$+�B-8>43'�,7/+-�87/<�'$+�\7$0')]_M�RRLSaOUSKP�Kb�cadef23-45�%<�0::1%+>�&?�A81187%/.�0�<+'�8A�3+-+58/%+<@�8-�5++'%/.<)�g+Y4%-+>�23-45�3+-+58/%+<�%/314>+�'$+�<:-%/'�:10//%/.�5++'%/.@�'$+�>0%1?�<3-45@'$+�<:-%/'�-+=%+7�0/>�'$+�<:-%/'�-+'-8<:+3'%=+)�h8-9%/.�%/�'%5+�&8#+<�3011+>�<:-%/'<�%<�01<8�-+Y4%-+>)�g+1+0<+�:10//%/.�5++'%/.<�0-+�8:'%8/01�0/>01187�A8-�'$+�:10//%/.�0/>�A8-+30<'%/.�8A�.-84:<�8A�<:-%/'<)cRdSPU�iLOPPSPj�kMMUSPj*$+�<:-%/'D:10//%/.�5++'%/.�%<�$+1>�8/�'$+�W-<'�>0?�8A�+=+-?�<:-%/')�*$+�23-45V0<'+-@�B-8>43'�,7/+-@�0/>�*+05�0-+�011�%/�0''+/>0/3+)�*$+B-8>43'�,7/+-�:-+<+/'<�'$+�<+'�8A�A+0'4-+<�$+�8-�<$+�7841>�1%9+�'8�<++�385:1+'+>�%/�'$+�<:-%/'�l'$+�\7$0']m�'$+/�'$+�'+05�>+'+-5%/+<�'$+�'0<9</++>+>�'8�%5:1+5+/'�'$+<+�A+0'4-+<�l'$+�\$87]m)�h8-9�+<'%50'+<�0-+�-+=%+7+>�'8�<++�%A�'$+�'+05�$0<�'$+�'%5+�'8�385:1+'+�011�'$+�A+0'4-+<-+Y4+<'+>�%/�'$+�<:-%/')�ZA�<8@�'$+�'+05�3855%'<�'8�'$+�<:-%/')�ZA�/8'@�'$+�187+-�:-%8-%'?�A+0'4-+<�.8�&039�%/'8�'$+�:-8>43'�&03918.@�4/'%1�'$+78-9180>�A8-�'$+�<:-%/'�%<�<5011�+/84.$�'8�8&'0%/�'$+�'+05n<�3855%'5+/')
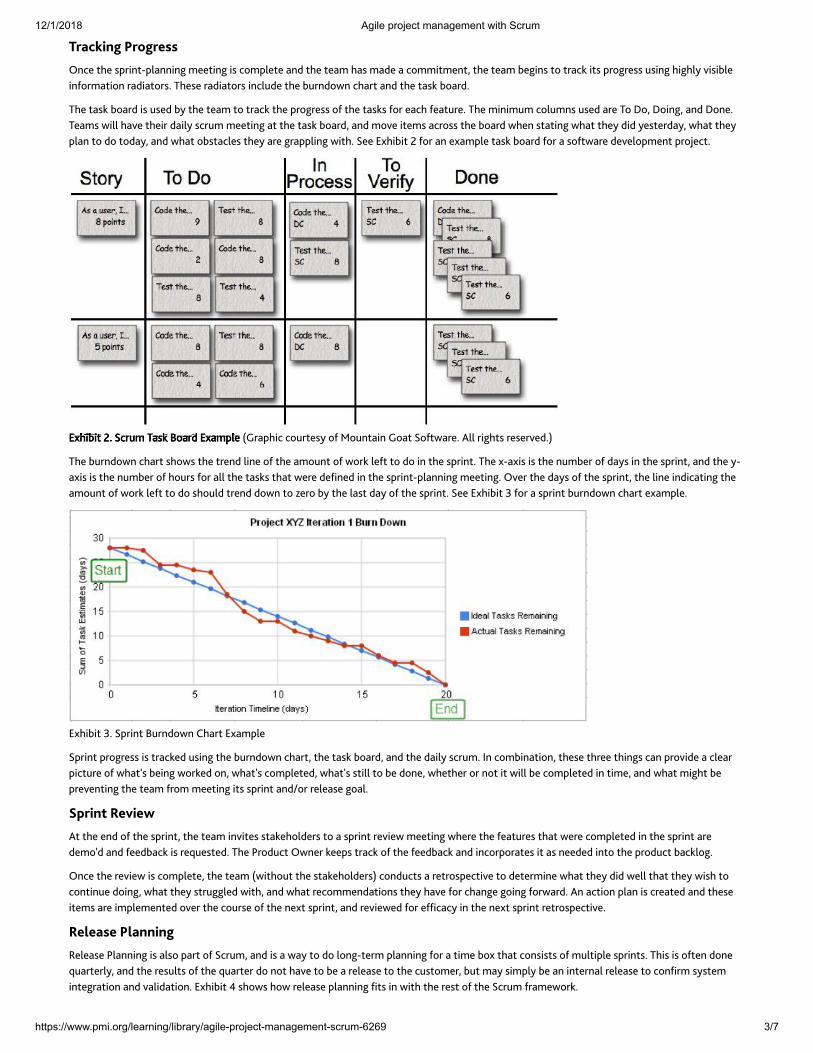
��������� ����� ��������������������� ��
����������������� ��� ������� � ������� ���������������� ������ !�"
#$%&'()*�+$,*$-../012�342�56780396:;0080<�=22380<�85�1>=6:232�;0?�342�32;=�4;5�=;?2�;�1>==83=203@�342�32;=�A2<805�3>�37;1B�835�67><7255�C580<�48<4:D�E858A:280F>7=;38>0�7;?8;3>75G�H4252�7;?8;3>75�801:C?2�342�AC70?>I0�14;73�;0?�342�3;5B�A>;7?GH42�3;5B�A>;7?�85�C52?�AD�342�32;=�3>�37;1B�342�67><7255�>F�342�3;5B5�F>7�2;14�F2;3C72G�H42�=808=C=�1>:C=05�C52?�;72�H>�J>@�J>80<@�;0?�J>02GH2;=5�I8::�4;E2�34287�?;8:D�517C=�=22380<�;3�342�3;5B�A>;7?@�;0?�=>E2�832=5�;17>55�342�A>;7?�I420�53;380<�I4;3�342D�?8?�D25327?;D@�I4;3�342D6:;0�3>�?>�3>?;D@�;0?�I4;3�>A53;1:25�342D�;72�<7;66:80<�I834G�K22�LM48A83�N�F>7�;0�2M;=6:2�3;5B�A>;7?�F>7�;�5>F3I;72�?2E2:>6=203�67>O213G
LM48A83�NG�K17C=�H;5B�P>;7?�LM;=6:2�QR7;6481�1>C7325D�>F�S>C03;80�R>;3�K>F3I;72G�T::�78<435�72527E2?GUH42�AC70?>I0�14;73�54>I5�342�3720?�:802�>F�342�;=>C03�>F�I>7B�:2F3�3>�?>�80�342�567803G�H42�M9;M85�85�342�0C=A27�>F�?;D5�80�342�567803@�;0?�342�D9;M85�85�342�0C=A27�>F�4>C75�F>7�;::�342�3;5B5�34;3�I272�?2V02?�80�342�56780396:;0080<�=22380<G�/E27�342�?;D5�>F�342�567803@�342�:802�80?81;380<�342;=>C03�>F�I>7B�:2F3�3>�?>�54>C:?�3720?�?>I0�3>�W27>�AD�342�:;53�?;D�>F�342�567803G�K22�LM48A83�X�F>7�;�567803�AC70?>I0�14;73�2M;=6:2GLM48A83�XG�K67803�PC70?>I0�Y4;73�LM;=6:2K67803�67><7255�85�37;1B2?�C580<�342�AC70?>I0�14;73@�342�3;5B�A>;7?@�;0?�342�?;8:D�517C=G�Z0�1>=A80;38>0@�34252�34722�3480<5�1;0�67>E8?2�;�1:2;76813C72�>F�I4;3[5�A280<�I>7B2?�>0@�I4;3[5�1>=6:232?@�I4;3[5�538::�3>�A2�?>02@�I423427�>7�0>3�83�I8::�A2�1>=6:232?�80�38=2@�;0?�I4;3�=8<43�A2672E20380<�342�32;=�F7>=�=22380<�835�567803�;0?\>7�72:2;52�<>;:G]$()_�-a(-bT3�342�20?�>F�342�567803@�342�32;=�80E8325�53;B24>:?275�3>�;�567803�72E82I�=22380<�I4272�342�F2;3C725�34;3�I272�1>=6:232?�80�342�567803�;72?2=>[?�;0?�F22?A;1B�85�72cC2532?G�H42�d7>?C13�/I027�B2265�37;1B�>F�342�F22?A;1B�;0?�801>76>7;325�83�;5�022?2?�803>�342�67>?C13�A;1B:><G/012�342�72E82I�85�1>=6:232@�342�32;=�QI834>C3�342�53;B24>:?275U�1>0?C135�;�7237>562138E2�3>�?2327=802�I4;3�342D�?8?�I2::�34;3�342D�I854�3>1>0380C2�?>80<@�I4;3�342D�537C<<:2?�I834@�;0?�I4;3�721>==20?;38>05�342D�4;E2�F>7�14;0<2�<>80<�F>7I;7?G�T0�;138>0�6:;0�85�172;32?�;0?�34252832=5�;72�8=6:2=2032?�>E27�342�1>C752�>F�342�02M3�567803@�;0?�72E82I2?�F>7�2FV1;1D�80�342�02M3�567803�7237>562138E2G-e-%.-�+e%))()*f2:2;52�d:;0080<�85�;:5>�6;73�>F�K17C=@�;0?�85�;�I;D�3>�?>�:>0<9327=�6:;0080<�F>7�;�38=2�A>M�34;3�1>058535�>F�=C:386:2�5678035G�H485�85�>F320�?>02cC;7327:D@�;0?�342�725C:35�>F�342�cC;7327�?>�0>3�4;E2�3>�A2�;�72:2;52�3>�342�1C53>=27@�AC3�=;D�58=6:D�A2�;0�803270;:�72:2;52�3>�1>0V7=�5D532=8032<7;38>0�;0?�E;:8?;38>0G�LM48A83�g�54>I5�4>I�72:2;52�6:;0080<�V35�80�I834�342�7253�>F�342�K17C=�F7;=2I>7BG
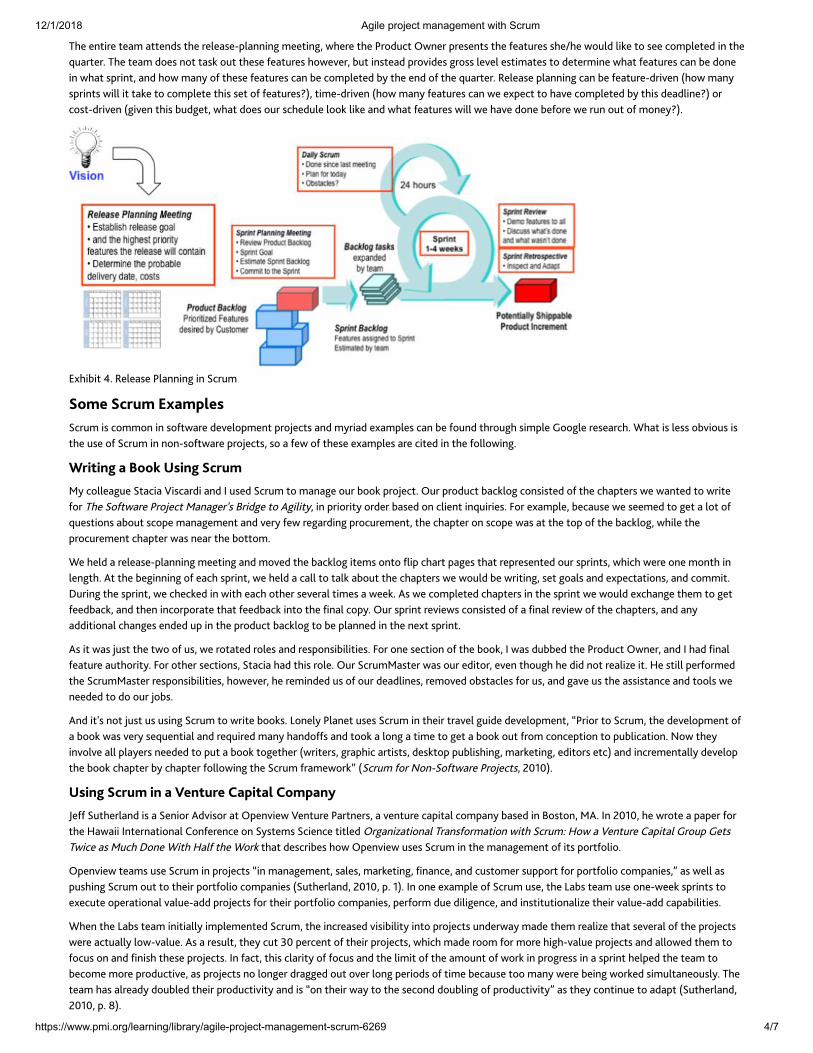
��������� ����� ��������������������� ��
����������������� ��� ������� � ������� ���������������� ������ !�"
#$%�%&'()%�'%*+�*''%&,-�'$%�)%.%*-%/0.*&&(&1�+%%'(&12�3$%)%�'$%�4)5,67'�83&%)�0)%-%&'-�'$%�9%*'6)%-�-$%:$%�356.,�.(;%�'5�-%%�75+0.%'%,�(&�'$%<6*)'%)=�#$%�'%*+�,5%-�&5'�'*-;�56'�'$%-%�9%*'6)%-�$53%>%)2�?6'�(&-'%*,�0)5>(,%-�1)5--�.%>%.�%-'(+*'%-�'5�,%'%)+(&%�3$*'�9%*'6)%-�7*&�?%�,5&%(&�3$*'�-0)(&'2�*&,�$53�+*&@�59�'$%-%�9%*'6)%-�7*&�?%�75+0.%'%,�?@�'$%�%&,�59�'$%�<6*)'%)=�A%.%*-%�0.*&&(&1�7*&�?%�9%*'6)%/,)(>%&�B$53�+*&@-0)(&'-�3(..�('�'*;%�'5�75+0.%'%�'$(-�-%'�59�9%*'6)%-CD2�'(+%/,)(>%&�B$53�+*&@�9%*'6)%-�7*&�3%�%E0%7'�'5�$*>%�75+0.%'%,�?@�'$(-�,%*,.(&%CD�5)75-'/,)(>%&�B1(>%&�'$(-�?6,1%'2�3$*'�,5%-�56)�-7$%,6.%�.55;�.(;%�*&,�3$*'�9%*'6)%-�3(..�3%�$*>%�,5&%�?%95)%�3%�)6&�56'�59�+5&%@CD=FE$(?('�G=�A%.%*-%�4.*&&(&1�(&�H7)6+IJKL�IMNOK�PQRKSTLUH7)6+�(-�75++5&�(&�-59'3*)%�,%>%.50+%&'�0)5V%7'-�*&,�+@)(*,�%E*+0.%-�7*&�?%�956&,�'$)561$�-(+0.%�W551.%�)%-%*)7$=�X$*'�(-�.%--�5?>(56-�(-'$%�6-%�59�H7)6+�(&�&5&/-59'3*)%�0)5V%7'-2�-5�*�9%3�59�'$%-%�%E*+0.%-�*)%�7('%,�(&�'$%�95..53(&1=YNZ[Z\]�R�JJ_�UZ\]�IMNOKa@�75..%*16%�H'*7(*�b(-7*),(�*&,�c�6-%,�H7)6+�'5�+*&*1%�56)�?55;�0)5V%7'=�86)�0)5,67'�?*7;.51�75&-(-'%,�59�'$%�7$*0'%)-�3%�3*&'%,�'5�3)('%95)�#$%�H59'3*)%�4)5V%7'�a*&*1%)d-�e)(,1%�'5�f1(.('@2�(&�0)(5)('@�5),%)�?*-%,�5&�7.(%&'�(&<6()(%-=�g5)�%E*+0.%2�?%7*6-%�3%�-%%+%,�'5�1%'�*�.5'�59<6%-'(5&-�*?56'�-750%�+*&*1%+%&'�*&,�>%)@�9%3�)%1*),(&1�0)576)%+%&'2�'$%�7$*0'%)�5&�-750%�3*-�*'�'$%�'50�59�'$%�?*7;.512�3$(.%�'$%0)576)%+%&'�7$*0'%)�3*-�&%*)�'$%�?5''5+=X%�$%.,�*�)%.%*-%/0.*&&(&1�+%%'(&1�*&,�+5>%,�'$%�?*7;.51�('%+-�5&'5�h(0�7$*)'�0*1%-�'$*'�)%0)%-%&'%,�56)�-0)(&'-2�3$(7$�3%)%�5&%�+5&'$�(&.%&1'$=�f'�'$%�?%1(&&(&1�59�%*7$�-0)(&'2�3%�$%.,�*�7*..�'5�'*.;�*?56'�'$%�7$*0'%)-�3%�356.,�?%�3)('(&12�-%'�15*.-�*&,�%E0%7'*'(5&-2�*&,�75++('=i6)(&1�'$%�-0)(&'2�3%�7$%7;%,�(&�3('$�%*7$�5'$%)�-%>%)*.�'(+%-�*�3%%;=�f-�3%�75+0.%'%,�7$*0'%)-�(&�'$%�-0)(&'�3%�356.,�%E7$*&1%�'$%+�'5�1%'9%%,?*7;2�*&,�'$%&�(&75)05)*'%�'$*'�9%%,?*7;�(&'5�'$%�j&*.�750@=�86)�-0)(&'�)%>(%3-�75&-(-'%,�59�*�j&*.�)%>(%3�59�'$%�7$*0'%)-2�*&,�*&@*,,('(5&*.�7$*&1%-�%&,%,�60�(&�'$%�0)5,67'�?*7;.51�'5�?%�0.*&&%,�(&�'$%�&%E'�-0)(&'=f-�('�3*-�V6-'�'$%�'35�59�6-2�3%�)5'*'%,�)5.%-�*&,�)%-05&-(?(.('(%-=�g5)�5&%�-%7'(5&�59�'$%�?55;2�c�3*-�,6??%,�'$%�4)5,67'�83&%)2�*&,�c�$*,�j&*.9%*'6)%�*6'$5)('@=�g5)�5'$%)�-%7'(5&-2�H'*7(*�$*,�'$(-�)5.%=�86)�H7)6+a*-'%)�3*-�56)�%,('5)2�%>%&�'$561$�$%�,(,�&5'�)%*.(k%�('=�l%�-'(..�0%)95)+%,'$%�H7)6+a*-'%)�)%-05&-(?(.('(%-2�$53%>%)2�$%�)%+(&,%,�6-�59�56)�,%*,.(&%-2�)%+5>%,�5?-'*7.%-�95)�6-2�*&,�1*>%�6-�'$%�*--(-'*&7%�*&,�'55.-�3%&%%,%,�'5�,5�56)�V5?-=f&,�('d-�&5'�V6-'�6-�6-(&1�H7)6+�'5�3)('%�?55;-=�m5&%.@�4.*&%'�6-%-�H7)6+�(&�'$%()�')*>%.�16(,%�,%>%.50+%&'2�n4)(5)�'5�H7)6+2�'$%�,%>%.50+%&'�59*�?55;�3*-�>%)@�-%<6%&'(*.�*&,�)%<6()%,�+*&@�$*&,599-�*&,�'55;�*�.5&1�*�'(+%�'5�1%'�*�?55;�56'�9)5+�75&7%0'(5&�'5�06?.(7*'(5&=�o53�'$%@(&>5.>%�*..�0.*@%)-�&%%,%,�'5�06'�*�?55;�'51%'$%)�B3)('%)-2�1)*0$(7�*)'(-'-2�,%-;'50�06?.(-$(&12�+*);%'(&12�%,('5)-�%'7D�*&,�(&7)%+%&'*..@�,%>%.50'$%�?55;�7$*0'%)�?@�7$*0'%)�95..53(&1�'$%�H7)6+�9)*+%35);p�BH7)6+�95)�o5&/H59'3*)%�4)5V%7'-2�qrsrD=UZ\]�IMNOK�Z\�R�tL\[ONL�uRSZ[RT�uJKSR\vw%99�H6'$%).*&,�(-�*�H%&(5)�f,>(-5)�*'�80%&>(%3�b%&'6)%�4*)'&%)-2�*�>%&'6)%�7*0('*.�75+0*&@�?*-%,�(&�e5-'5&2�af=�c&�qrsr2�$%�3)5'%�*�0*0%)�95)'$%�l*3*((�c&'%)&*'(5&*.�x5&9%)%&7%�5&�H@-'%+-�H7(%&7%�'('.%,�8)1*&(k*'(5&*.�#)*&-95)+*'(5&�3('$�H7)6+y�l53�*�b%&'6)%�x*0('*.�W)560�W%'-#3(7%�*-�a67$�i5&%�X('$�l*.9�'$%�X5);�'$*'�,%-7)(?%-�$53�80%&>(%3�6-%-�H7)6+�(&�'$%�+*&*1%+%&'�59�('-�05)'95.(5=80%&>(%3�'%*+-�6-%�H7)6+�(&�0)5V%7'-�n(&�+*&*1%+%&'2�-*.%-2�+*);%'(&12�j&*&7%2�*&,�76-'5+%)�-6005)'�95)�05)'95.(5�75+0*&(%-2p�*-�3%..�*-06-$(&1�H7)6+�56'�'5�'$%()�05)'95.(5�75+0*&(%-�BH6'$%).*&,2�qrsr2�0=�sD=�c&�5&%�%E*+0.%�59�H7)6+�6-%2�'$%�m*?-�'%*+�6-%�5&%/3%%;�-0)(&'-�'5%E%76'%�50%)*'(5&*.�>*.6%/*,,�0)5V%7'-�95)�'$%()�05)'95.(5�75+0*&(%-2�0%)95)+�,6%�,(.(1%&7%2�*&,�(&-'('6'(5&*.(k%�'$%()�>*.6%/*,,�7*0*?(.('(%-=X$%&�'$%�m*?-�'%*+�(&('(*..@�(+0.%+%&'%,�H7)6+2�'$%�(&7)%*-%,�>(-(?(.('@�(&'5�0)5V%7'-�6&,%)3*@�+*,%�'$%+�)%*.(k%�'$*'�-%>%)*.�59�'$%�0)5V%7'-3%)%�*7'6*..@�.53/>*.6%=�f-�*�)%-6.'2�'$%@�76'�zr�0%)7%&'�59�'$%()�0)5V%7'-2�3$(7$�+*,%�)55+�95)�+5)%�$(1$/>*.6%�0)5V%7'-�*&,�*..53%,�'$%+�'59576-�5&�*&,�j&(-$�'$%-%�0)5V%7'-=�c&�9*7'2�'$(-�7.*)('@�59�9576-�*&,�'$%�.(+('�59�'$%�*+56&'�59�35);�(&�0)51)%--�(&�*�-0)(&'�$%.0%,�'$%�'%*+�'5?%75+%�+5)%�0)5,67'(>%2�*-�0)5V%7'-�&5�.5&1%)�,)*11%,�56'�5>%)�.5&1�0%)(5,-�59�'(+%�?%7*6-%�'55�+*&@�3%)%�?%(&1�35);%,�-(+6.'*&%56-.@=�#$%'%*+�$*-�*.)%*,@�,56?.%,�'$%()�0)5,67'(>('@�*&,�(-�n5&�'$%()�3*@�'5�'$%�-%75&,�,56?.(&1�59�0)5,67'(>('@p�*-�'$%@�75&'(&6%�'5�*,*0'�BH6'$%).*&,2qrsr2�0=�{D=

��������� ����� ��������������������� ��
����������������� ��� ������� � ������� ���������������� ������ !�"
#$%&'�()�*+&%$+,-./�01234-�5678-1294:�;<1=>�9>�94�347-13?�@9>7<1�A<1�78-�B43791394�B43.-1>923>7�C861C8/�58-�3>�92><�78-�;3A-�<A�D-AA�5678-1294:E�<4-�<A�78-�C<FC1-97<1>�<A�5C16?/�G4�9�HIIJ�@9@-1�A<1�78-�0K32-HIIJ�L<4A-1-4C-�7372-:�5C16?�34�L861C8M�59.34K�78-�N<12:�O4-�P-9?�97�9�P3?-E�,-./�5678-1294::->C13Q-:�8-1�-R@-13-4C->�6>34K�5C16?�34�C861C8->�34�S9>>9C86>-77>E�L<44-C73C67E�T2<13:9E�U-29;91-E�94:�V31K3439/5C16?�3>�@13?9132W�6>-:�QW�<AXC-�>79AA�94:�.<2647--1>�7<�Q<78�Y=--@�78-�-4K34-�164434KZ�94:�34�Y4-;�34373973.->Z�[5678-1294:E�HIIJE�@/�\]/�1<_-C7>64:-1�.913<6>�@1<K19??34K�91-9>�>6C8�9>�@9>7<192�C91-E�C832:1-4�94:�W<678E�?-?Q-1>83@�:-.-2<@?-47E�><C392�_6>73C-E�?6>3CE�A9C32373->E�X494C->94:�A64:�193>34K�;-1-�?949K-:�6>34K�5C16?/5-.-192�9:9@7973<4>�;-1-�?9:-�34�-9C8�34>794C-�7<�9CC<??<:97-�78-�4--:>�<A�78-�7-9?�?-?Q-1>�94:�78-�C<4>719347>�<A�78-31�-4.31<4?-47/�T<1-R9?@2-E�37�;9>�3?@<>>3Q2-�7<�8<2:�:932W�34F@-1><4�>794:F6@>�;378�?<1-�7894�892A�78-�7-9?�8<2:34K�:<;4�:9W�_<Q>/�5<�5=W@-�;9>�6>-:�>34C-�Y78-291K->7�:-?<K19@83C�6>34K�5=W@-�91-�K194:@91-47>E�[94:]�-.-4�<2:-1�2->>�7-C84<2<K3C922W�><@83>73C97-:�?-?Q-1>�91-�<A7-4�>=322-:�6>-1>Z[5678-1294:E�HIIJE�@/]/G7�3>�;<178�4<734K�7897�5678-1294:�:3>C<.-1-:�Y7897�-9C8�94:�-.-1W�73?-�5C16?�3>�3471<:6C-:�347<�9�>W>7-?�37�89>�7<�Q-�9:9@7-:Z�[5678-1294:EHIIJE�@/�]/�O13K34922W�:3>C<619K-:�7897�8-1�3?@2-?-47973<4>�<A�5C16?�4-.-1�>--?-:�7<�?97C8�78-�3:-92�<A�Y1-92�5C16?EZ�>8-�a63C=2W�1-923b-:�789778-�Q-4-X7>�<A�K-4634-�9:[email protected]�C894K-�34C26:-:�78-�9:9@7973<4�<A�5C16?�37>-2A/c+de�fdggh)hi�jklmn-C96>-�783>�3>�<42W�9�>8<17�<.-1.3-;�<A�5C16?E�37�3>�-R@-C7-:�7897�78-�1-9:-1�?9W�2-9.-�;378�>-.-192�6494>;-1-:�a6->73<4>/�G4�783>�>-C73<4E�;-;322�2<<=�97�78-�7<@�781--�a6->73<4>�?<>7�<A7-4�9>=-:�QW�78<>-�4-;�7<�9K32-�94:�5C16?E�78-4�2-9.-�W<6�;378�><?-�X492�;<1:>�<4�;8-1-�7<�X4:?<1-�34A<1?973<4/c+de�fdggh)hi�ek�od)ee�*+d%ep�d)i�qe+h%�rk$&'h)ede(k)ms9477�C8917>�91-�4<7�7W@3C922W�6>-:�<4�5C16?�@1<_-C7>/�n614:<;4�C8917>�[Q<78�>@1347�Q614:<;4>�94:�1-2-9>-�Q614:<;4>]E�79>=�Q<91:>E�Q9C=2<K>E>@1347�@294>E�1-2-9>-�@294>E�94:�<78-1�?-713C>�C8917>�91-�6>-:�34>7-9:�7<�C<??643C97-�@1<K1->>E�>7976>E�94:�A<1-C9>7>/�0�.913-7W�<A�9K32-�@1<_-C7?949K-?-47�7<<2>�-R3>7�7<�@1<.3:-�783>�7W@-�<A�:9>8Q<91:�1-@<1734KE�34C26:34K�@26KF34>�A<1�S3C1<><A7�1<_-C7/P8-�<42W�9173A9C7>�5C16?�1-a631->�91-�78-�@1<:6C7�Q9C=2<KE�>@1347�Q9C=2<KE�1-2-9>-�Q614:<;4E�94:�>@1347�Q614:<;4/�022�<78-1�A<1?>�<A:<C6?-47973<4�91-�2-A7�6@�7<�78-�7-9?�7<�:-C3:-/�P8-�9K32-�162-�<A�786?Q�3>�7897�3A�78-�9173A9C7�9::>�.926-�94:�78-�C6>7<?-1�3>�;32234K�7<�@9W�A<1�37E78-4�78-�9173A9C7�>8<62:�Q-�C1-97-:/�0173A9C7>�C1-97-:�Q-C96>-�Y37t>�<4�78-�C8-C=23>7Z�<1�Y;-u.-�92;9W>�:<4-�783>Z�91-�37-?>�7897�>8<62:�Q-C<4>3:-1-:�A<1�-23?34973<4/�U<C6?-47>�1-a631-:�A<1�K<.-1494C-�3>>6->�[96:37>E�9CC<64734KE�-7C/]�?6>7�>7322�Q-�C1-97-:E�Q67�<A7-4�C94�Q->71-9?234-:/c+de�fdggh)hi�ek�e+h�v%kwh$e�xd)dyh%mP8-�@1<_-C7�?949K-1�<A7-4�Q-C<?->�78-�5C16?S9>7-1/�P83>�3>�4<7�92;9W>�78-�C9>-�94:�78-1-�91-�?94W�:3AA-1-47�7194>A<1?973<4�@-1?67973<4>/�T<1-R9?@2-E�9�@1<_-C7�?949K-1�;8<�89>�Q--4�>-1.34K�9>�9�:<?934�<1�>6Q_-C7�?977-1�-R@-17�?3K87�Q-�Q-77-1�@<>373<4-:�9>�78-�1<:6C7�O;4-1/�O1�9@1<_-C7�?949K-1�8-9:34K�6@�9�7-9?�<A�zI{�@-<@2-�?9W�1-?934�34�7897�1<2-�94:�A<C6>�<4�<.-1922�@1<_-C7�79>=>�>6C8�9>�@1<C61-?-47�94:�C<4719C74-K<73973<4E�;832-�78-�5C16?�7-9?>�<4�78-�@1<_-C7�[1-?-?Q-1E�9�5C16?�7-9?�3>�|�{}F�H�@-<@2-E�><�9�zIF@-1><4�@1<_-C7�;322�Q-�?9:-�6@�<A�~F�I5C16?�7-9?>]�-9C8�89.-�78-31�<;4�5C16?S9>7-1/�G4�783>�>C-4913<�78-�@1<_-C7�?949K-1�9>>3>7>�78-�5C16?S9>7-1>�34�C<<1:349734KE�>7197-K3b34KE�94:1-?<.34K�1<9:Q2<C=>/c+de�fdggh)hi�ek��p()y�rhed(�hi�jdp�p�d)i�jdp���pe('dehp�ek�oh)h%deh�v%kwh$e(k)pmP19:373<492�->73?9734K�94:�@294434K�6>->�9�Q<77<?F6@�?-78<:E�;8-1-�922�1-a631-?-47>�?6>7�Q-�A622W�:-X4-:E�;378�79>=>�78-4�C1-97-:�94:->73?97-:�Q9>-:�<4�783>�XR-:�>C<@-/�0K32-�->73?9734K�94:�@294434K�34>7-9:�6>->�9�7<@F:<;4�?-78<:�7<�A<1-C9>7/�s1<>>�2-.-2�->73?9734K�97�78-A-9761-�2-.-2�3>�<A7-4�:<4-�6>34K�9�7-C843a6-�C922-:�@294434K�@<=-1E�;378�->73?97->�K3.-4�34�@<347>�6>34K�78-�T3Q<49CC3�>-a6-4C-/�P-9?>�:-7-1?34-78-31�.-2<C37W�34�@<347>E�3/-/�8<;�?94W�@<347>�<4�9.-19K-�C94�78-�7-9?�C<?@2-7-�34�9�>@1347/�L<>7�@-1�@<347�3>�:-7-1?34-:�QW�C92C629734K�78-2<9:-:�>92913->�<A�78-�7-9?�A<1�@-13<:�RE�78-4�:3.3:34K�7897�QW�78-�46?Q-1�<A�@<347>�C<?@2-7-:�34�@-13<:�R/�O4C-�W<6�89.-�W<61�7-9?t>�9.-19K-.-2<C37W�94:�9�K1<>>F->73?97-:�@1<:6C7�Q9C=2<KE�W<6�C94�A<1-C9>7�@1<_-C7�?32->7<4->�94:�C<?@2-73<4�:97->E�9>�;-22�9>�78-�C<>7�@-1�@<347�94:�786>A<1-C9>7�@1<_-C7�C<>7/O4-�@919K19@8�C944<7�:<�783>�7<@3C�_6>73C-E�9>�-4731-�Q<<=>�89.-�Q--4�;1377-4�<4�783>�7<@3C/�04�-RC-22-47�Q<<=�;378�@19C73C92�9:.3C-�<4�8<;�7<�:<->73?9734K�6>34K�@294434K�@<=-1�94:�A<1-C9>734K�6>34K�.-2<C37W�94:�@<347>�3>�0K32-��>73?9734K�94:�294434K�QW�S3=-�L<84/�()d��ck%ip5C16?�3>�94�9K32-�@1<_-C7�?949K-?-47�A19?-;<1=�7897�8-2@>�7-9?>�7<�:-23.-1�.926-:�@1<:6C7>�37-1973.-2W�94:�34C1-?-47922WE�;832-�C<47346922W34>@-C734K�94:�9:9@734K�78-�@1<C->>/�1<_-C7�S949K-?-47�G4>73767-�?-?Q-1>�;322�X4:�78-W�C94�3?@2-?-47�5C16?�94:�>7322�Q-�34�=--@34K�;378�78-0�s63:-�7<�78-�1<_-C7�S949K-?-47�n<:W�<A��4<;2-:K-�[SnO��s63:-]�T<6178��:373<4E�9>�Q<78�9:.<C97-�9�@294F:<FC8-C=F9C7�9@@1<9C8�7<@1<_-C7�?949K-?-47/P83>�;9>�9�>8<17�<.-1.3-;�<A�5C16?E�94:�9>�>6C8�:3:�4<7�9::1->>�?94W�9::373<492�91-9>�<A�347-1->7�>6C8�9>�@1<:6C7�1<9:?9@>E�->73?9734K�6>34K@<347>E�6>-1�>7<13->E�>7<1W�?9@>E�94:�><�A<178/�P8->-�9K32-�@19C73C->�91-�<A7-4�6>-:�34�C<4_64C73<4�;378�5C16?E�9>�91-�<78-1�?-78<:<2<K3->E�>6C8�9>�94Q94�94:��/�0::373<492�1-><61C->�<4�78->-�7<@3C>�91-�9.9329Q2-�<4234-E�?94W�A<1�A1--/�0�C<?@1-8-4>3.-�1-9:34K�23>7�C94�Q-�A<64:�97�
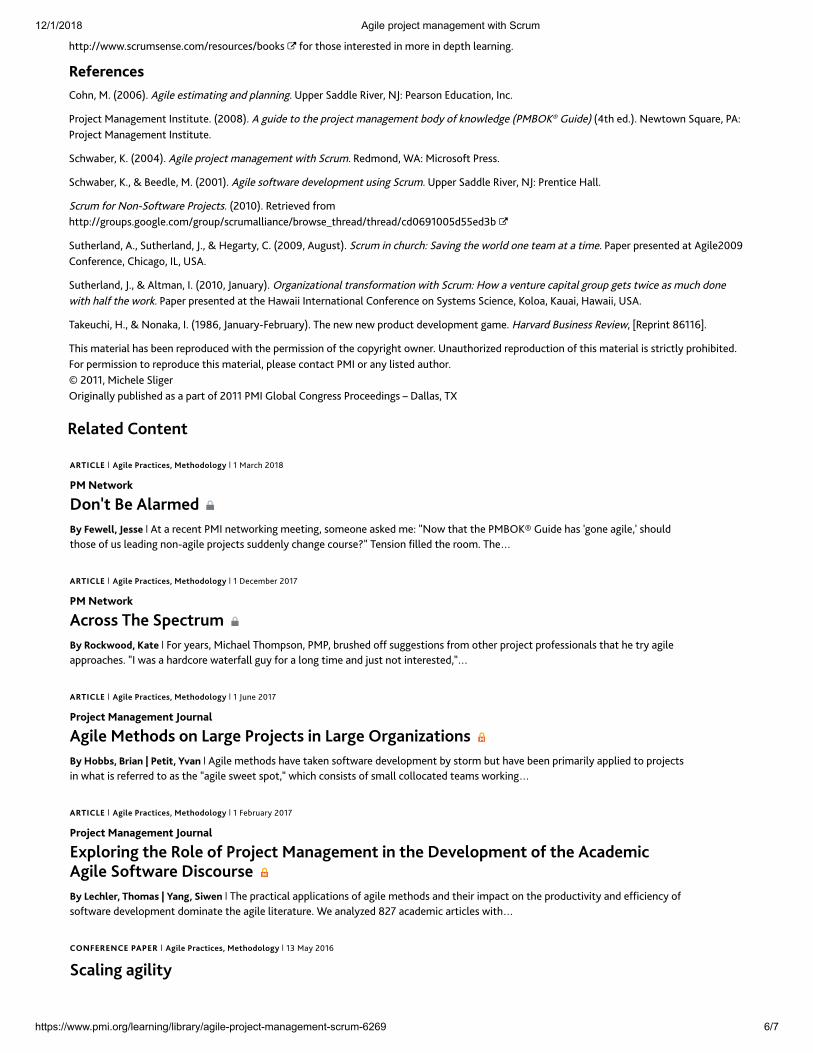
��������� ����� ��������������������� ��
����������������� ��� ������� � ������� ���������������� ������ ��!
"##$%&&'''()*+,-)./).(*0-&+.)0,+*.)&1002)��30+�#"0).�4/#.+.)#.5�4/�-0+.�4/�5.$#"�6.7+/4/8(9:;:<:=>:?@0"/A�B(�CDEEFG(�H846.�.)#4-7#4/8�7/5�$67//4/8(�I$$.+�J7556.�K4L.+A�MN%�O.7+)0/�P5,*7#40/A�Q/*(O+0R.*#�B7/78.-./#�Q/)#4#,#.(�CDEESG(�H�8,45.�#0�#".�$+0R.*#�-7/78.-./#�105T�03�2/0'6.58.�COBUVW�X,45.G�CY#"�.5(G(�M.'#0'/�JZ,7+.A�OH%O+0R.*#�B7/78.-./#�Q/)#4#,#.(J*"'71.+A�W(�CDEEYG(�H846.�$+0R.*#�-7/78.-./#�'4#"�J*+,-(�K.5-0/5A�[H%�B4*+0)03#�O+.))(J*"'71.+A�W(A�\�U..56.A�B(�CDEE]G(�H846.�)03#'7+.�5.L.60$-./#�,)4/8�J*+,-(�I$$.+�J7556.�K4L.+A�MN%�O+./#4*.�766(J*+,-�30+�M0/_J03#'7+.�O+0R.*#)(�CDE]EG(�K.#+4.L.5�3+0-"##$%&&8+0,$)(80086.(*0-&8+0,$&)*+,-76647/*.&1+0').#"+.75&#"+.75&*5EFa]EEb5bb.5c1�J,#".+67/5A�H(A�J,#".+67/5A�N(A�\�.87+#TA�@(�CDEEaA�H,8,)#G(�J*+,-�4/�*",+*"%�J7L4/8�#".�'0+65�0/.�#.7-�7#�7�#4-.(�O7$.+�$+.)./#.5�7#�H846.DEEa@0/3.+./*.A�@"4*780A�QdA�IJH(J,#".+67/5A�N(A�\�H6#-7/A�Q(�CDE]EA�N7/,7+TG(�V+87/4e7#40/76�#+7/)30+-7#40/�'4#"�J*+,-%�0'�7�L./#,+.�*7$4#76�8+0,$�8.#)�#'4*.�7)�-,*"�50/.'4#"�"763�#".�'0+2(�O7$.+�$+.)./#.5�7#�#".�7'744�Q/#.+/7#40/76�@0/3.+./*.�0/�JT)#.-)�J*4./*.A�W0607A�W7,74A�7'744A�IJH(f72.,*"4A�(A�\�M0/727A�Q(�C]aSFA�N7/,7+T_g.1+,7+TG(�f".�/.'�/.'�$+05,*#�5.L.60$-./#�87-.(�7+L7+5�U,)4/.))�K.L4.'A�hK.$+4/#�SF]]Fi(f"4)�-7#.+476�"7)�1../�+.$+05,*.5�'4#"�#".�$.+-4))40/�03�#".�*0$T+48"#�0'/.+(�I/7,#"0+4e.5�+.$+05,*#40/�03�#"4)�-7#.+476�4)�)#+4*#6T�$+0"414#.5(g0+�$.+-4))40/�#0�+.$+05,*.�#"4)�-7#.+476A�$6.7).�*0/#7*#�OBQ�0+�7/T�64)#.5�7,#"0+(j�DE]]A�B4*".6.�J648.+�V+484/766T�$,164)".5�7)�7�$7+#�03�DE]]�OBQ�X60176�@0/8+.))�O+0*..54/8)�k�l7667)A�fmn
opqrspt�uvwspwsx9yz{|}�~����qp���r�s��p����ps�vtvqv���~�]�B7+*"�DE]S����:���<��vw�s��p��qr��pt�����:�:�����:??:�~�H#�7�+.*./#�OBQ�/.#'0+24/8�-..#4/8A�)0-.0/.�7)2.5�-.%��M0'�#"7#�#".�OBUVWn�X,45.�"7)��80/.�7846.A��)"0,65#"0).�03�,)�6.754/8�/0/_7846.�$+0R.*#)�),55./6T�*"7/8.�*0,+).���f./)40/��66.5�#".�+00-(�f".�x9yz{|}�~����qp���r�s��p����ps�vtvqv���~�]�l.*.-1.+�DE] ����:���<����v���¡�p�¢£p�s�¤�����9�>����¥��¦§�:�~�g0+�T.7+)A�B4*"7.6�f"0-$)0/A�OBOA�1+,)".5�033�),88.)#40/)�3+0-�0#".+�$+0R.*#�$+03.))40/76)�#"7#�".�#+T�7846.7$$+07*".)(��Q�'7)�7�"7+5*0+.�'7#.+3766�8,T�30+�7�60/8�#4-.�7/5�R,)#�/0#�4/#.+.)#.5A��x9yz{|}�~����qp���r�s��p����ps�vtvqv���~�]�N,/.�DE] �<�:>���§=§©:ª:=����«<=§����qp��ps�vt��vw�¬r��p���vp�s���w�¬r��p�®��rw�rs�vw�����°�±±?���<²§=�³��:�²���µ§=�~�H846.�-.#"05)�"7L.�#72./�)03#'7+.�5.L.60$-./#�1T�)#0+-�1,#�"7L.�1../�$+4-7+46T�7$$64.5�#0�$+0R.*#)4/�'"7#�4)�+.3.++.5�#0�7)�#".��7846.�)'..#�)$0#A��'"4*"�*0/)4)#)�03�)-766�*0660*7#.5�#.7-)�'0+24/8�x9yz{|}�~����qp���r�s��p����ps�vtvqv���~�]�g.1+,7+T�DE] �<�:>���§=§©:ª:=����«<=§�¶·£qv��w��s�p�ovqp�v���vp�s��rwr�p�pws��w�s�p��p¹pqv£�pws�v�s�p���rtp������qp�¢vsºr�p�����v¤��p����|:>»�:<��y»�ª§?�³�§=©��¼²�:=�~�f".�$+7*#4*76�7$$64*7#40/)�03�7846.�-.#"05)�7/5�#".4+�4-$7*#�0/�#".�$+05,*#4L4#T�7/5�.3�*4./*T�03)03#'7+.�5.L.60$-./#�50-4/7#.�#".�7846.�64#.+7#,+.(�[.�7/76Te.5�SD �7*75.-4*�7+#4*6.)�'4#"�{½��}9}�{}��x�}9�~����qp���r�s��p����ps�vtvqv���~�]c�B7T�DE]F¢�rq�w��r��q�s�