Piezoelectric Wafer Active Sensors for Structural Health ...€¦ · Piezoelectric Wafer Active...
26
Piezoelectric Wafer Active Sensors for Structural Health Monitoring of Composite Structures Victor Giurgiutiu 1 and Giola Santoni-Bottai 2 University of South Carolina, Columbia, SC 29208 Piezoelectric wafer active sensors (PWAS) are lightweight and inexpensive enablers for a large class of structural health monitoring (SHM) applications such as: (a) embedded guided-wave ultrasonics, i.e., pitch-catch, pulse-echo, phased arrays; (b) high-frequency modal sensing, i.e., the electro-mechanical (E/M) impedance method; (c) passive detection (acoustic emission and impact detection). The focus of this paper will be on the challenges and opportunities posed by the composite structures as different from the metallic structures on which this methodology was initially developed. After a brief introduction, the paper discusses damage modes in composites. Then, it reviews the PWAS-based SHM principles. It follows with a discussion of guided wave propagation in composites and PWAS tuning effects. Finally, the paper presents some damage detection results in composites: (i) hole damage in unidirectional and quasi-isotropic plates; and (ii) impact damage in quasi- isotropic plates. The paper ends with conclusions and suggestions for further work I. Nomenclature 1 E = axial modulus 2 E = transverse modulus E/M = electromechanical 12 G , = shear moduli 23 G 12 23 , ν ν = Poisson’s ratios P-C = Pitch-Catch P-E = Pitch-Echo PWAS = Piezoelectric Wafer Active Sensors ij S = mechanical strain tensor kl T = mechanical stress tensor k E = electrical field tensor j D = electrical displacement tensor E ijkl s = mechanical compliance under constant electric field T jk ε = dielectric permittivity under constant mechanical stress kij d = piezoelectric constant EUSR = embedded ultrasonics structural radar C = electrical capacitance ( ) str Z ω = structural impedance ( ) PWAS Z ω = quasi-static PWAS impedance 31 κ = electromechanical coupling coefficient ω = angular frequency 1 Professor, Department of Mechanical Engineering, 300 Main St. S, Columbia, SC 29208, Associate Fellow American Institute of Aeronautics and Astronautics 1 2 Graduate Assistant and PhD Candidate, Department of Mechanical Engineering, 300 Main St. S, Columbia, SC 29208.
Transcript of Piezoelectric Wafer Active Sensors for Structural Health ...€¦ · Piezoelectric Wafer Active...

Piezoelectric Wafer Active Sensors for Structural Health Monitoring of Composite Structures
Victor Giurgiutiu1 and Giola Santoni-Bottai2
University of South Carolina, Columbia, SC 29208
Piezoelectric wafer active sensors (PWAS) are lightweight and inexpensive enablers for a large class of structural health monitoring (SHM) applications such as: (a) embedded guided-wave ultrasonics, i.e., pitch-catch, pulse-echo, phased arrays; (b) high-frequency modal sensing, i.e., the electro-mechanical (E/M) impedance method; (c) passive detection (acoustic emission and impact detection). The focus of this paper will be on the challenges and opportunities posed by the composite structures as different from the metallic structures on which this methodology was initially developed. After a brief introduction, the paper discusses damage modes in composites. Then, it reviews the PWAS-based SHM principles. It follows with a discussion of guided wave propagation in composites and PWAS tuning effects. Finally, the paper presents some damage detection results in composites: (i) hole damage in unidirectional and quasi-isotropic plates; and (ii) impact damage in quasi-isotropic plates. The paper ends with conclusions and suggestions for further work
I. Nomenclature
1E = axial modulus
2E = transverse modulus E/M = electromechanical
12G , = shear moduli 23G
12 23, ν ν = Poisson’s ratios P-C = Pitch-Catch P-E = Pitch-Echo PWAS = Piezoelectric Wafer Active Sensors
ijS = mechanical strain tensor
klT = mechanical stress tensor
kE = electrical field tensor
jD = electrical displacement tensor Eijkls = mechanical compliance under constant electric field Tjkε = dielectric permittivity under constant mechanical stress
kijd = piezoelectric constant EUSR = embedded ultrasonics structural radar C = electrical capacitance
( )strZ ω = structural impedance ( )PWASZ ω = quasi-static PWAS impedance
31κ = electromechanical coupling coefficient ω = angular frequency
1 Professor, Department of Mechanical Engineering, 300 Main St. S, Columbia, SC 29208, Associate Fellow
American Institute of Aeronautics and Astronautics
1
2 Graduate Assistant and PhD Candidate, Department of Mechanical Engineering, 300 Main St. S, Columbia, SC 29208.

( )Z ω = electromechanical impedance ( )Y ω = electromechanical admittance
Re = real part of a complex quantity Im = imaginary part of a complex quantity
I. Introduction Structural health monitoring (SHM) is an emerging technology with multiple applications in the evaluation of critical structures. The goal of SHM research is to develop a monitoring methodology that is capable of detecting and identifying, with minimal human intervention, various damage types during the service life of the structure. Numerous approaches have been utilized in recent years to perform structural health monitoring1-4; they can be broadly classified into two categories: passive methods and active methods. Passive SHM methods (such as acoustic emission, impact detection, strain measurement, etc.) have been studied longer and are relatively mature; however, they suffer from several drawbacks which limit their utility (need for continuous monitoring, indirect inference of damage existence, etc.). Active SHM methods are currently of greater interest due to their ability to interrogate a structure at will. One of the promising active SHM methods utilizes arrays of piezoelectric wafer active sensors (PWAS) bonded to a structure for both transmitting and receiving ultrasonic waves in order to achieve damage detection5-7. When used to interrogate thin-wall structures, the PWAS are effective guided wave transducers by coupling their in-plane motion with the guided wave particle motion on the material surface. The in-plane PWAS motion is excited by the applied oscillatory voltage through the d31 piezoelectric coupling. Optimum excitation and detection happens when the PWAS length is in certain ratios with the wavelength of the guided wave modes. The PWAS action as ultrasonic transducers is fundamentally different from that of conventional ultrasonic transducers. Conventional ultrasonic transducers act through surface tapping, i.e., by applying vibration pressure to the structural surface. The PWAS transducers act through surface pinching, and are strain coupled with the structural surface. This allows the PWAS transducers to have a greater efficiency in transmitting and receiving ultrasonic surface and guided waves when compared with the conventional ultrasonic transducers. There has been a marked increase in recent years in the use of composite materials in numerous types of structures, particularly in air and spacecraft structures. Composites have gained popularity in high-performance products that need to be lightweight, yet strong enough to take high loads such as aerospace structures, space launchers, satellites, and racing cars. Their growing use has arisen from their high specific strength and stiffness, when compared to metals, and the ability to shape and tailor their structure to produce more aerodynamically efficient configurations8. For this reason, it is important to study how active SHM methods (which were initially developed for isotropic metallic structures) can be extended to reliably detecting damage in these new types of materials, which are multi-layered and anisotropic. One of the most troubling forms of damage in laminar composites is low velocity impact damage. This type of damage can leave no visual traces, but subsurface delaminations can significantly reduce the strength of the structure. The present paper presents and discusses the challenges and opportunities related to the use of PWAS in generating and sensing ultrasonic guided waves in composite materials and how they can be used to detect damage in composite structures. The paper starts with a brief a presentation of the main composite materials damage types which are often different from those encountered in metallic structures. Then, it reviews the principles of PWAS-based SHM. Subsequently, the paper discusses the analytical challenges of studying guided waves in composites and shows how the concept of guided-wave tuning with PWAS can be applied in the case of composite structures: theoretical predictions and experimental tuning results are comparatively presented. Finally, the paper presents experimental results on detecting hole and impact damage in composite plates with PWAS-based pitch-catch and pulse-echo methods. Hole damage detection experiments were performed on unidirectional and quasi-isotropic plates, whereas impact damage detection experiments were performed only on quasi-isotropic plates. The paper ends with conclusions and suggestions for further work.
II. Damage in Composite Materials Composite materials combine the properties of two or more constituent materials in order to achieve properties that are not achievable by the individual constituents. For example, carbon fiber composites combine the extreme specific stiffness and strength of carbon fibers with the binding properties of a polymeric matrix. In general, composites can be created from any two materials (metals, ceramics, polymers, elastomers, glasses) that could be mixed in many ways (particulate inclusions, chopped-fiber, woven, unidirectional fibers, etc.); the final composite
American Institute of Aeronautics and Astronautics
2

properties vary with (a) the choice of constituents, and (b) the composite architecture. For high-performance structural applications, laminate composites made up of high strength/stiffness unidirectional layers stacked at various angles have gained wide application. The choice of the orientation angles in the stacking sequence allows tailoring of the composite properties along certain preferential directions that are expected to experience highest operational loads. The simplest layup sequence is the 0/90 (cross-ply) laminate, which consists of alternating 0-deg and 90-deg layers (Figure 1). Some layup sequences such as 0/45/90 and 0/60/120 are dubbed ‘quasi-isotropic’ because they try to equalize the effective properties by applying the fibers in several directions.
Loading in L direction
T direction
Splitting ofL lamina Matrix cracking
in T lamina
0-deg ply
Delamination
90-deg ply
Fiber fracture
Figure 1 Longitudinal tension of a 0/90 composite laminate highlighting several damage modes: (a)
matrix cracking in transverse (T) lamina; (b) splitting of longitudinal (L) laminae; (c) delamination between T and L laminae
The damage and failure of metallic structures is relatively well understood; their in-service damage and failure occurs mostly due to fatigue cracks that propagate under cyclic loading in metallic material. In contrast, the damage of composite materials occurs in many more ways than that of metals9,10. Composites fail differently under tension than they fail in compression, and the effect of fastener holes is much more complicated than in metals. In addition, the composites are prone to hidden damage from low velocity impact (e.g., the drop of a hand tool); such damage can be barely visible and may go undetected, but its effect on the degradation of the composite structure strength can be dramatic. These various damage aspects will be discussed briefly in the next sections. Current design requirements for composite structures are much more stringent than for metallic structures. Military aircraft components have to comply with an Aircraft Structural Integrity Program (ASIP) following the JSSG 200611 and MIL-STD-153012 guidelines. Pre-existing manufacturing flaws and service-induced cracking are assumed to exist, even if undetected and the ASIP function is to manage this fact while preventing aircraft accidents and downtime. In general, metallic structures are allowed to exhibit a certain amount of sub-critical crack growth within the design life of the component. Detectable cracks are noted and managed as part of the maintenance and inspection process. In contrast, no known delamination-cracks are allowed to exist (much less grow) in composite structure. However, the composite components are generally designed to tolerate a certain size of undetectable damage. Of course, this additional ‘safety margin’ comes with a weight penalty, which could be mitigated through better understanding of composite damage detection and management mechanisms. In order to satisfy the damage tolerance requirements, one has to demonstrate that an aircraft structure possesses adequate residual strength at the end of service life in the presence of an assumed worst-case damage, as for example that caused by a low-velocity impact on a composite structure. This may be accomplished by showing positive margins-of-safety at the maximum recommended load. Worst-case damage is defined as the damage caused by an impact event (e.g., a 1-in hemispherical impactor) at the lesser of the following two energy levels: (a) 100 ft-lb, or (b) energy to cause a visible dent (0.1-in deep).
American Institute of Aeronautics and Astronautics
3

A. Tension damage in composite materials When subjected to axial tension, the composite material displays progressive failure through several damage mechanisms take place sequentially. Consider for example the cross-ply laminate of Figure 1: as an axial load is applied in the longitudinal (L) direction, the 0-deg ply is loaded along its reinforcing fibers whereas the 90-deg ply is loaded across the fibers. Because the strength of the polymeric matrix is much less than that of the fibers, the across-the-fiber strength of the lamina is much lower than the along-the-fiber strength. Hence, matrix cracking of the 90-deg ply occurs at an early stage in the loading cycle. As the tension load increases, further damage occurs in the form of delaminations between the 0-deg and 90-deg plies due to 3-D effects at the interface between these two plies with such radically different properties. The matrix cracks existing in the transverse ply act as discontinuities generating 3-D disbonding stress that promotes delaminations. Same 3-D effects will lead to splitting of the 0-deg plies at higher tension loads. If the load continues to increase, the 0-deg plies will eventually fail due to fiber fracture, at which point no load can be any longer supported. This simple 0/90 example indicates that internal damage in a composite laminate can happen at relatively low stress levels in the form of matrix cracking to be followed, at intermediate levels, by inter-ply delamination and lamina splitting. If the applied stress is cyclic, as in fatigue loading, then these low-level damage states can increase and propagate further and further into the composite with each load cycle. The reinforcing fibers have high strength and good load carrying properties, but the matrix cracking, delamination, and lamina splitting mechanisms usually lead to in-service composite structures becoming operationally unfit and requiring replacement.
B. Compression damage in composite structures When subjected to axial compression, the composite fails through loss of elastic stability (buckling). At global scale, buckling can be avoided by relative sizing the length and bending stiffness of the component such that loss of elastic stability does not occur for the given boundary conditions and operational load levels. At the local scale, the composite material itself can fail under compression through the microbuckling mechanism (Figure 2). The high-strength fibers encased in the polymeric matrix can be modeled as beams on elastic foundation, where the elastic support is provided by the matrix stiffness. Under axial compression, such a beam on elastic foundation would eventually buckle and take an undulatory shape (Figure 2a). The compressive stress values at which this buckling occurs are dictated by the fiber bending stiffness and matrix compression stiffness.
American Institute of Aeronautics and Astronautics
4
Figure 2 Compression damage of fiber composites through microbuckling: (a) undulations of buckled
fibers; (b) kink band local failure schematic; (c) micrograph of kink band formation in T800/924C carbon-fiber composite
For a given fiber/matrix combination this micro-buckling compressive strength is fixed and cannot be altered through structural design. (Thicker fibers, e.g., boron fibers, have a higher compression buckling strength than the thinner carbon fibers, and for this reason boron composites may be preferred in places where material compression strength is critical.) As the compressive load is further increased, the microbuckling is further exacerbated until local failure occurs in the form of a kink band (Figure 2b).
Kink band
Wβ
φ
(a) (b (b

American Institute of Aeronautics and Astronautics
5
C. Fastener Hole Damage in Composite Structures Mechanical fasteners used in riveted and bolted joints are prevalent in metallic aircraft structures, where they offer a rapid and convenient method of assembling large structures from smaller components. The load bearing mechanisms of metallic joints are well understood and easily predicted. The use of mechanical fasters in composite structures is also allowed, but this comes with significant strength and fatigue penalties. The use of mechanical fasteners in composite structures somehow clashes with the very nature of composite materials, which carry the load through the high-strength fibers embedded in a relatively-weak polymeric matrix. This type of load carrying capability benefits from a smooth and continuous load ‘flow’ and is adverse to sudden changes in material properties and geometries. Ideally, composite joints should be done through adhesive bonding with gradual transition from one component into the next. However, when mechanical fasteners are used, they produce sudden discontinuities in the form of holes drilled in the composite structures; these fastener holes act as stress concentrators. They also act as crack and delamination initiators due to micro-damage introduced during the hole drilling process. For this reason, mechanical fasteners do not seem appropriate for composite construction unless special attention is given to creating stress-free holes during design through local reinforcement and damage-free holes during manufacturing through special tooling. In spite of these obvious technical issues, current manufacturing practice is such that mechanical fasteners are still widely use in the construction of composite structures, especially when load transfer has to be achieved between composite and metallic components. A typical example is illustrated in Figure 3a, where the load from a composite wing skin is transferred into an aluminum metallic bracket through a 9-bolt junction. When in service, each hole in the composite skin would be subjected to both tension and/or compression loading that may, under certain circumstances, promote damage initiation and damage progression.
Figure 3 Composite damage due to fastener holes: (a) typical bolted junction between a composite wing
skin and metallic connection; (b) tension failure modes; compression failure modes
Under tension (Figure 3b), the composite joint may fail under three major modes: (i) tear failure; (ii) bearing failure; and (iii) shear-out failure. Of these, the tear failure is unlikely to happen because the fiber reinforcement is strongest in tension. The shear-out failure would happen if the fibers are predominant in the tension direction; shear-out failure can be counteracted through design by the addition of 45-deg reinforcement. The bearing failure is more difficult to prevent because it is a compression-type loading that is has to be taken up by the polymeric matrix and by the fibers under compression. Bearing failure may occur through matrix crushing, or fiber microbuckling, or both. Under compression (Figure 3c)¸ the composite in three major modes: overall buckling of the component; local buckling of the region weaken by the hole; fiber microbuckling at the areas of highest compression strength. The
(a)
Bearing failure Shear-out failureTear failure
(b)
Tension failure
(c)Local buckling Fiber
microbuckling Component
buckling
Compression failure

overall compression buckling can be prevented by proper component design. Local buckling and fiber microbuckling may be also prevented by design but damage accumulation during cyclic loading would eventually weaken it.
D. Impact damage in Composite Structures Composite aerospace structures are prone to a particular type of damage that is not critical in metallic aerospace structures, i.e., low-velocity impact damage. Such damage may occur during manufacturing or in service due to, say, a hand tool being dropped onto a thin-wall composite part. When such an impact happens on a conventional metallic structural part, either the part is not damaged at all, or, if it is damaged, then it shows clearly as an indent or scratch. In composite structures, a similar impact may damage the structure without leaving any visible marks on the surface (so called barely visible damage). In this case, the impact result takes the form of delaminations in the composite layup. (A more drastic impact may also show spalling on the back side, while having no visible marks on the front side). Delamination due to barely visible impact damage may not have a large effect on the tension strength of the composite, but it can significantly diminish the composite compression strength (delaminated plies have a much weaker buckling resistance than the same plies solidly bonded together). Both component buckling strength and local buckling strength may be affected; when a fastening hole is present, as depicted in Figure 3c, this effect may be even worse. For this reason, manufacturing companies place a strong emphasis on testing the open-hole compression strength after impact of their composite structures. Detection of delaminations due to barely visible impact damage is a major emphasis in composite SHM research.
E. Damage Detection in Composite Materials We have seen that the inherent macroscopic anisotropy and multi-material architecture of the composite materials results in internal damage types which are significantly different from those encountered in isotropic metallic materials. Currently, one of the most commonly encountered damage types in composite materials is that caused by low-velocity impact; this damage susceptibility (which is not encountered in metallic structures) is mainly due to the low interlaminar strength of conventional composite layups. Significant degradation of the mechanical properties can easily occur as a result of low-velocity impact even for barely visible damage. Different types of damage may be encountered in the impacted region, including matrix (resin) cracking, delaminations (interlaminar cracking) and broken fibers. In the future, as composite structures accumulate years of service, other damage types related to fatigue effects are also expected to become significant. To date, much effort has been put into identifying reliable non-destructive evaluation (NDE) techniques for the detection, location, and characterization of composite materials damage with a special attention to subsurface delaminations due to manufacturing defects or to low-velocity impacts. Thermography, shearography, radiography, and ultrasonics are among the most commonly used NDE techniques13,14. These NDE techniques require stripping the aircraft and even removal of individual components; they employ bulky transducers, operate with point scanning, and, in general, are time consuming, labor intensive, and expensive. As a result, the current cost of composite structures inspection is very high, at least one order of magnitude greater than for metallic structures15. In order for composite structures to be economically viable and to realize their full design potential, it is essential that their operation and maintenance is conducted in a safe and economical manner, on par with that of existing metallic structures. For this reason, the development of new composite damage detection methods that can be applied rapidly and reliably to detect critical composite flaws is an ongoing concern. The permanently attached damage sensing technologies developed under the structural health monitoring (SHM) thrust are a promising research direction because, when implemented, they would permit the interrogation at will of the composite structures and the reliable and credible detection of internal damage in order to increase flight safety and reduce operational costs. This technology, though promising, is still in its infancy and many theoretical and experimental challenges still have to be resolved, as illustrated next.
III. PWAS for Active SHM
A. PWAS Principles Piezoelectric wafer active sensors (PWAS) are the enabling technology for active SHM systems. PWAS couples the electrical and mechanical effects (mechanical strain, , mechanical stress, , electrical field, , and electrical displacement ) through the tensorial piezoelectric constitutive equations
ijS klT kE
jD
American Institute of Aeronautics and Astronautics
6

E
ij ijkl kl kij k
Tj jkl kl jk k
S s T d E
D d T Eε
= +
= + (1)
where, Eijkls is the mechanical compliance of the material measured at zero electric field ( ), is the
dielectric permittivity measured at zero mechanical stress ( ), and represents the piezoelectric coupling effect. PWAS utilize the coupling between in-plane strain and transverse electric field. A 7-mm diameter PWAS, 0.2 mm thin, weighs a bare 78 mg and costs around (~$1 each). PWAS are lightweight and inexpensive and hence can be deployed in large numbers on the monitored structure. Just like conventional ultrasonic transducers, PWAS utilize the piezoelectric effect to generate and receive ultrasonic waves. However, PWAS are different from conventional ultrasonic transducers in several aspects:
0E = Tjkε
0T = kijd
31d
1. PWAS are firmly coupled with the structure through an adhesive bonding, whereas conventional ultrasonic transducers are weakly coupled through gel, water, or air.
American Institute of Aeronautics and Astronautics
7
Figure 4 Use of piezoelectric wafer active sensors (PWAS) as traveling wave transducers for damage
detection: (a) pitch-catch; (b) pulse-echo; (c) thickness mode; (d) detection of impacts and acoustic emission (AE).
V2
Receiver
Pitch-catchV1
Transmitter
(a)
Damaged region
Pulse-echo
Damage
Transmitter-Receiver
V2V1
(b)
Thickness mode Transmitter-Receiver
V2
Thickness gage
V1
Corrosion (c) Damage
Impact/AE Detection
AE from crack
Impact V
Receiver
(d)

American Institute of Aeronautics and Astronautics
8
2. PWAS are non-resonant devices that can be tuned selectively into several guided-wave modes, whereas conventional ultrasonic transducers are resonant narrow-band devices.
3. PWAS are inexpensive and can be deployed in large quantities on the structure, whereas conventional ultrasonic transducers are expensive and used one at a time.
By using Lamb waves in a thin-wall structure, one can detect structural anomaly, i.e., cracks, corrosions, delaminations, and other damage. Because of the physical, mechanical, and piezoelectric properties of PWAS transducers, they act as both transmitters and receivers of Lamb waves traveling through the structure. Upon excitation with an electric signal, the PWAS generate Lamb waves in a thin-wall structure. The generated Lamb waves travel through the structure and are reflected or diffracted by the structural boundaries, discontinuities, and damage. The reflected or diffracted waves arrive at the PWAS where they are transformed into electric signals. PWAS transducers can serve several purposes16: (a) high-bandwidth strain sensors; (b) high-bandwidth wave exciters and receivers; (c) resonators; (d) embedded modal sensors with the electromechanical (E/M) impedance method. By application types, PWAS transducers can be used for (i) active sensing of far-field damage using pulse-echo, pitch-catch, and phased-array methods, (ii) active sensing of near-field damage using high-frequency E/M impedance method and thickness-gage mode, and (iii) passive sensing of damage-generating events through detection of low-velocity impacts and acoustic emission at the tip of advancing cracks. An example of damage detection using PWAS phased arrays is given in Figure 6, which shows that broadside and offside cracks can be independently identified with scanning beams emitting from a central location.
B. Traveling Wave Methods of Damage Detection with PWAS Transducers Figure 4 shows the use of PWAS transducers for damage detection with traveling ultrasonic waves. Figure 4a illustrates the pitch-catch method. An electric signal applied at the transmitter PWAS generates, through piezoelectric transduction, elastic waves that transverse the structure and are captured at the receiver PWAS. As long as the structural region between the transmitter and receiver is pristine condition, the received signal will be consistently the same; if the structure becomes damaged, then the received signal will be modified. Comparison between the historically stored signals and the currently read signal will indicate when changes (e.g., damage) take place in the structure. The pitch catch method may be applied to situations in which the damage is diffuse and/or distributed such as corrosion in metals or degradation in composites. Extension of the pitch-catch method to several pitch-catch pairs leads to ultrasonic tomography, which uses a network of PWAS (‘sparse array’)placed around a structural region of interest. In such a network, all the PWAS are eventually paired through a round-robin process. The processing of all the collected data during the round robin process yields an image of the monitored region indicating the damage area. Figure 4b illustrates the pulse-echo method. In this case, the same PWAS acts as both transmitter and received. A tone-burst signal applied to the PWAS generates an elastic wave packet that travels through the structure and reflects at structural boundaries and at cracks and abrupt discontinuities. In a pristine structure, only boundary reflections are present whereas in a damaged structures, reflections from cracks also appear. By comparing historical signals one can identify when new reflections appear due to new boundaries such as cracks and abrupt discontinuities. This comparison may be facilitated by the differential signal method. Figure 4c illustrates the use of PWAS transducers in thickness mode. The thickness mode is usually excited at much higher frequencies than the guided wave modes discussed in the previous two paragraphs. For example, the thickness mode for a 0.2-mm PWAS is excited at around 12 MHz, whereas the guided wave modes are excited at tens and hundreds of kHz. When operating in thickness mode, the PWAS transducer can act as a thickness gage. In metallic structures, thickness mode measurements allow the detection of damage that affects the structural thickness, e.g., corrosion, which can be detected from that side of the structure which is outside from the corrosive environment. In composite structures, thickness mode measurements may detect cracks which are parallel to the surface, such as delaminations. However, a limitation of the thickness mode approach is that detection can only be made directly under the PWAS location, or in its proximity. In this respect, this method is rather localized, which may be alright for monitoring well defined critical areas, but insufficient for large area monitoring. Figure 4d illustrates the detection of impacts and acoustic emission (AE) events. In this case, the PWAS transducer is operating as a passive receiver of the elastic waves generated by the impact or by the AE source. By placing several PWAS transducers in a network configuration around a given structural area, one can set up a ‘listening’ system that would monitor if impact damage or AE events take place. Because the PWAS is self-energized through piezoelectric transduction, the listening system can stay in a low-energy dormant mode until a triggering by the PWAS wakes it up. The signals recorded by the PWAS network can be processed to yield the location and amplitude of the impact and/or AE event.

C. Standing Wave Methods of Damage Detection with PWAS Transducers When a structure is excited with sustained harmonic excitation of a given frequency, the waves traveling in the structure undergo multiple boundary reflections and settle down in a standing wave pattern know as vibration. Structural vibration is characterized by resonance frequencies at which the structural response goes through peak values. The structural response measured over a frequency range including several resonance frequencies generates a vibration spectrum or frequency response function. When damage occurring in a structure induces changes in its dynamic properties, the vibration spectrum also changes. However, the conventional vibration analysis methods are not sensitive enough to detect small incipient damage; they can only measure structural dynamics up to several kHz, which is insufficient for the small wavelength needed to discover incipient damage. An alternative approach, which is able to measure structural spectrum into the hundreds of kHz and low MHz range, is offered by the electromechanical (E/M) impedance method.
12.5-mm EDM crack
Piezoelectric wafer active sensors (PWAS)
#1 #2 #3 #4 Rivet head
Aircraft Panel
HP4194A Impedance Analyzer
Figure 5 Damage-detection in an aircraft panel using the electromechanical (E/M) impedance method and piezoelectric wafer active sensors (PWAS)
PWAS The electromechanical impedance method measures the electrical impedance, , of a PWAS transducer using a an impedance analyzer (
( )Z ωFigure 5). The real part of the impedance Re( )Z reflects the mechanical
behavior of the PWAS, i.e., its dynamic spectrum and its resonances. When the PWAS is attached to a structure, the real part of the impedance measured at the PWAS terminals reflects the dynamics of the structure on which the PWAS is attached, i.e., the structural dynamic spectrum and its resonances. Thus, a PWAS attached to a structure can be used as a structural–identification sensor that measures directly the structural response. In a simplified model, the electromechanical impedance measured at the PWAS terminals when the PWAS is attached to a structure can be expressed as
1
231
( )1( ) 1/ ( ) 1( ) ( )
str
str PWAS
ZZ Y
i C Z Zωω ω κ
ω ω
−⎛
= = −⎜ +⎝ ⎠ω⎞⎟ (2)
where is the electrical capacitance of the PWAS, structural impedance as seen by the PWAS, and is the quasi–static impedance of the PWAS. It is apparent that both the structural impedance, , and
the related electromechanical impedance, , are frequency dependent variables. As the structural impedance goes through resonances, so does the electromechanical impedance. However, the imaginary part of the electromechanical impedance is dominated by the capacitive response 1/ of the PWAS transducer; for this reason, the resonances are best noticed in the real part,
C ( )strZ ω( )PWASZ ω ( )strZ ω
( )Z ω
i CωRe( )Z , of the electromechanical impedance.
D. Phased Arrays and the Embedded Ultrasonics Structural Radar A natural extension of the PWAS pulse-echo method is the development of a PWAS phased array which is able to scan a large area from a single location. Phased arrays were first used in radar applications because they allowed to replace the rotating radar dish with a fixed panel equipped with an array of transmitter-receivers which were energized with prearranged phase delays. When simultaneous signals are emitted from an array of transmitters, the constructive interference of the propagating waves creates a beam positioned broadside to the array. If prearranged
American Institute of Aeronautics and Astronautics
9

phase delays are introduced in the firing of the signals of individual array elements, then the constructive interference beam can be steered to difference angular positions. Thus an azimuth and elevation sweep can be achieved without mechanical rotation of the radar platform. The phased array principle has gained wide utilization recently in ultrasonics, both for medical applications and for non-destructive evaluation, because ultrasonic phased arrays permit the sweeping of a large volume from a single location.
(a)
Simulated cracks (10mm slits)
8-PWAS phased-array
R=~80mm
Upper edge of the specimen
(b) Side
edg
e of
the
spec
imen
at ~
140m
m
R=~85mm
60°
75°
(c)
Figure 6 Crack-detection in a thin aluminum plate using two piezoelectric wafer active sensors (PWAS) phased arrays: (a) test schematic; (b) broadside crack imaging; (c) offside crack imaging
The PWAS phased arrays utilize the phase array principles to create a interrogating beam of guided waves that travel in a thin-wall structure and can sweep a large area from a single location. The embedded ultrasonics structural radar (EUSR) methodology uses the signals collected by the PWAS phased array to recreate a virtual sweeping of the monitored structural area. The associated image represent the reconstruction of the complete area as if the interrogating beam was actually sweeping it. When no damage is present, the only echoes are those arriving from the natural boundaries of the interrogated area; if damage is present, its echo reflection is imaged on the EUSR screen indicating its location in or ( , )R θ ( , )x y coordinates. An illustration of the PWAS EUSR technique is shown in Figure 6. A thin aluminum plate had two cracks simulated by two small narrow slits. The plate was instrumented with two PWAS arrays each consisting of eight elements. One array was placed directly under one crack (broadside position), the other array was placed away from the other crack (offside position). The detection of reflection from an offside crack is much more challenging than from a broadside crack because in the former case the interrogating beam hits the target at an angle and is deflected away; the only waves that are received back at the phased array are those diffracted by the crack tips. Figure 6b shows the EUSR reconstructed image for the broadside array; it can be seen that a strong reflection is observed directly above the array at , which corresponds to the actual location of the crack on the plate. It is also noticed that the EUSR image has a rectangular grid which is calibrated in units of length (meters) corresponding to wave speed of the particular guided wave mode used by the PWAS phased array.
80 mmR =
Figure 6c shows the EUSR image corresponding to the offside crack as measured by the second PWAS phased array; it can be noticed that, again, the crack presence and location are very well defined, in spite of the inherent difficulties associated with the detection of an offside target. In order to achieve this high resolution detection, advanced signal processing had to be applied to the recorded raw signals.
IV. Guided Waves in Composites The evaluation of structural integrity using Lamb wave ultrasonics has long been acknowledged as a very promising technique. Several investigators17-19 have envisioned the inspection of large metallic plates from a single location
American Institute of Aeronautics and Astronautics
10

American Institute of Aeronautics and Astronautics
11
using transducer arrays where each el iver. Guided signals are generated at
Figure 7 Laminated composite plate illustrating the orientation of its kth layer indicating the principal
axes alignment with the layer unidirectional fibers
weta
layer having late made of N layers; each layer is made of
ement acts as both transmitter and recedifferent angles around the transducer positions and the signal reflections from the boundaries are processed for damage detection. This configuration is very promising for isotropic material but might have some limitations for fibrous composite structures due to the change in properties with fiber direction. In recent years, numerous investigations have explored Lamb wave techniques for the detection of damage in composite laminates10, ,20 21. In order to take full advantage of Lamb wave techniques for composite damage detection, one needs to first understand and model how guided waves propagate in composite structures which is much more complicated than in isotropic metallic structures.
The guided aves propagating in composite structures are more difficult to model than those propagating in isotropic m llic structures because of the composite material is inherent anisotropy and multilayered, with each
a different orientation. Figure 7 shows a composite punidirectional fibers hence they are layers of orthotropic properties; however, the layer orientation varies from layer to layer. Consider a wave propagating in the material and assume that the angle between the fiber direction and the direction of wave propagation for the thk layer is kθ (see Figure 7). Define the global coordinate system 1 2 3, ,x x x such that 1x is aligned with the direction of wave propagation. Also define a local coordinate system 1 2 3, ,x x x′ ′ ′ such that 1x′ is parallel to the fiber direction (principal axes). The stiffness matrix of the kth layer can be written as
11 12 13 16
12 22 23 26
0 00 0
c c c cc c c c
0 0
'0 0 0 00 0 0 0
0 0
c c c cC T C T
c cc c
c c c c
−
⎡ ⎤⎢ ⎥⎢ ⎥
13 23 33 3611 2
44 45
45 44
16 26 36 66
⎢ ⎥= = ⎢ ⎥
⎢ ⎥⎢ ⎥⎢ ⎥⎢ ⎥⎣ ⎦
(0.3)
where is the layer stiffness in local principal axes, and is the stiffness matrix in global axes aligned with the direction of wave propagation, whereas T1 and T2 are the coordinate transformation matrices for stress and strain, respectively.
um
'C C
Ass e that the wave propagation direction is parallel to the plane 1 2x x and assume that the displacement solution can be written as
( ) ( ) ( )1 31 2 3 1 2 3, , , , i x x vtu u u U U U e ξ α+ −= (0.4)
where ξ is the wavenumber in the 1x direction, v ω ξ= is the phase velocity, ω is the circular frequency, α is an nknown parameter equal to the ratio between the wavenumber in the 3x direction and the wavenumber in the 1x u

American Institute of Aeronautics and Astronautics
12
t he eque n
direction, and Ui is the displacemen amplitude. T ation of motion in each composite layer can be solved to yield the expressions for the displacement field 1 2 3( , , )u u u in terms of th layer properties and boundary conditio s at the top and bottom of the layer. (The characteristic equation for wave propagation in an orthotropic layer is more complicated than that for isotropic materials, but le.) After the wave propagation inside each layer is setup in terms of layer properties and boundary conditions at the top and bottom contact surfaces with the other layers, the next step is to solve for wave propagation in the complete om
still solvab
c posite laminate. This is achieved by linking together the composite layers by imposing equilibrium and compatibility conditions at the interfaces, i.e., matching stresses and displacements. Two solution approaches exist: (a) the transfer matrix approach; and (b) the global matrix approach. In the transfer matrix (TM) approach22-26, the tractions and strains at the bottom of one layer are described in terms of those of the top of the layer through a transfer matrix, which depends on the properties and orientation of that specific layer, i.e.,
{ }{ } [ ]
{ }{ }
k k
k
k k
u uA
σ σ
+ −
+ −
⎧ ⎫ ⎧ ⎫⎪ ⎪ ⎪ ⎪=⎨ ⎬ ⎨ ⎬⎪ ⎪ ⎪ ⎪⎩ ⎭ ⎩ ⎭
(5)
where the matrix kA is the layer-transfer matrix for the layer. The transfer between two consecutive layers is achieved by imposing displacements continuity force equilibrium at the interfaces between consecutive layers. Thus,
s
thk
boundary condition at the top of the composite plate (e.g., wave excitation) are propagated from layer to layer to the bottom of the plate through the sequential layer to layer transfer. In the end, we relate the displacements and stresses of the top of the layered plate to those at its bottom through the overall transfer matrix, A , given by
N
kk 1
A A= ∏ =
(6)
hus, a small linear system of equation is setup in which the bothe boundary conditions at bottom of the plate. To find the dispersion curves and modeshapes, one assumes traction-T undary conditions at the top of the plate are relate to
free conditions at both top and bottom surfaces and solves the resulting homogenous system in terms of unknown top and bottom displacements. The resulting eigenvalue problem yields eigen wave numbers and the associate eigen displacements at the top and bottom of the plates. The eigen wave numbers yield the phase velocities at the assumed frequency; the dispersion curves are then obtained by repeating the process over a frequency range. The eigen displacements are propagated through the matrix transfer process through all the layers in order to determine the thickness mode shape of that particular guided wave mode. Though simple in formulation, the TM method suffers from numerical instability because error accumulates in the layer transfers. To address the numerical instabilities, Rokhlin and Wang27,28 address this numerical instability issue by introducing the layer stiffness matrix and using an efficient recursive algorithm to calculate the global stiffness matrix for the complete laminate. The layer stiffness matrix relates the stresses at the top and bottom of the layer with the corresponding displacements. The terms in the matrix have only exponentially decaying terms and hence the transfer process becomes more stable. The global matrix (GM) method was proposed by Knopoff29. In the GM method, the equations for all the layers are considered simultaneously. There is no a priori assumption on the interdependence between the sets of equations for each interface. This process results in a system of 4( 1)M N= − equations, which has a narrow banded M M× matrix. The solution carried out on the full matrix addresses all the equations concurrently, i.e.,
[ ] 11 2b t
AD D− ⎡ ⎤⎡ ⎤⎡ ⎤ −⎣ ⎦ ⎢ ⎥⎢ ⎥
2
2 33
3 44
4 55
0b t
b t
b b
AD D
AD D
AD D A
+
⎢ ⎥−⎢ ⎥⎢ ⎥ =⎢ ⎥− ⎢ ⎥⎢ ⎥⎢ ⎥⎢ ⎥⎡ ⎤− ⎢ ⎥⎣ ⎦⎣ ⎦ ⎣ ⎦
(7) [ ] [ ]
[ ] [ ][ ]

where is a field matrix that relates the amplitude of partial waves to the displacement and stress fields in
the layer and
[ ]D 4 4×thk iA is the amplitude of the partial waves in the layer. This technique is robust but slow to
compute for many layers because the matrix is rather large.
thk
Both methods share a common characteristic: a solution of the characteristic function does not strictly prove the existence of a modal solution, but only that the system matrix is singular. Furthermore, the calculation of the determinant for the modal solution needs the use of a good algorithm because the aim of the problem is to find the zero of the determinant whereas the matrix is frequently close to being singular.
1. Dispersion Curves for Composite Structures We coded the TM approach following Nayfeh26. Figure 8 shows the dispersion curves derived for a unidirectional composite plate made of one layer of 65% graphite 35% epoxy. These dispersion curves depend on the propagation direction, ; the cases are presented in θ 0 ,18 ,36 ,90θ = ° ° ° ° Figure 8. It is apparent that, for (i.e., wave propagating along the fiber direction) and for (i.e., waves propagating transversely to the fiber direction), the dispersion curves are clearly decoupled into quasi-antisymmetric (A0, A1, A2,…), quasi symmetric (S0, S1, S2, …), and quasi-shear horizontal (SH0, SH1, SH2,…) wave modes. However, this in not the case for the off-axis directions , in which case the three mode types are strongly coupled. The wave velocity is higher when the wave propagates along the fiber direction. As the angle of the wave propagation direction increases, the phase velocity decreases till reaching a minimum in the direction perpendicular to the fiber. This is due to the fact that along the fiber the material stiffness is greater than in all the other directions and it decreases while increases.
0θ = °90θ = °
18 ,36θ = ° °
θ
0 1 2 3 4 5 6 7 80
1000
2000
3000
4000
5000
6000
0 1 2 3 4 5 6 7 80
1000
2000
3000
4000
5000
6000
0 1 2 3 4 5 6 7 80
1000
2000
3000
4000
5000
6000
0 1 2 3 4 5 6 7 80
1000
2000
3000
4000
5000
6000
ξd ξd
ξd ξd
cs
cs
(a) (b)
(c) (d)
Figure 8 Dispersion curves for unidirectional 65/35 graphite-epoxy plate: (a) ; (b) ; (c)
; (d) 0θ = 18θ =
36θ = 90θ =
American Institute of Aeronautics and Astronautics
13

Next, we analyzed various composite layups. Figure 9 shows the dispersion curves for a [ ]2(0/45/90/-45) s layup. Figure 9a shows the dispersion curves over a large dξ range: a complicated pattern of tightly coupled composite-plate wave modes is present. Figure 9b presents a zoom-in to low dξ values in which case only the A0, S0, SH0 modes are present.
S0
A0
SH
S0
A0
SH
ξd
(a) (b)
Figure 9 Dispersion curves for a quasi-isotropic plate [(0/45/90/-45)2s]. (a) output from the program; (b)
elaboration of S0, SH, A0 modes
2. Group Velocity in Composite Structures In isotropic metallic plates, the calculation of group velocity, , a.k.a., energy velocity, gc Ec , is rather straight
forward, since it is done by differentiation of frequency with respect to wave number, i.e., gc ωγ
∂=∂
. In anisotropic
fibrous composite, the calculation of group velocity is rather more complicated and it has to use the slowness curve (Figure 10). The phase slowness is the inverse of the phase velocity; hence, the phase slowness curve shows how the relative arrival time of a plane wave propagating in an anisotropic plate varies with the direction of wave propagation. Assume we want to find the group velocity Ec for a wave propagating along direction with respect to the fiber direction.
θ
Ec
φ
θ ψ
1 c
cP
Figure 10 Slowness curve and notation
American Institute of Aeronautics and Astronautics
14

By definition, the group velocity vector is perpendicular to the phase slowness curve. Consider the slowness curve of Figure 10 and a point of interest P corresponding to the propagation direction . By drawing the normal to the slowness curve at point P we determine the direction of the group velocity vector
θEc ; this direction is oriented
along angle ψ . By elementary geometry applied to Figure 10, the group velocity magnitude is given by cosE
ccφ
=
where φ ψ θ= − . Knowing the magnitude of Ec and the angle ψ for each propagation direction, one can construct the wave surface.
(a) (b)
Fiber direction ψ
Fiber direction θ
1c
Figure 11 Directional dependence of wave propagation in unidirectional 65% graphite 35% epoxy plate (solid blue line: ; dash red line: ): (a) slowness curve
(plotted values are
400 kHz-mm fd = 1,700 kHz-mmfd =410 1 c ); (b) wave front
Figure 11a shows the slowness curve for a 65/35 graphite-epoxy unidirectional plate. The slowness curve is derived from the inverse of the phase velocity for every possible angle wave propagation at a given frequency-thickness product. Two frequency-thickness product values are plotted: and
; the slowness curves are different for each frequency-thickness product. 400 kHz-mmfd =
1,700 kHz-mmfd = Figure 11b shows the corresponding wave front contours. It is apparent that the wave propagation is faster along the fiber direction than across the fiber direction. This observation is consistent with the fact that the fibrous composite is much stiffer along the fibers than across the fibers. The fact that the wave front contour varies with the frequency-thickness product is also apparent in Figure 11b.
3. Tuned Guided Waves in Composite Structures The tuning between PWAS transducers and guides waves in isotropic metallic plates is relatively well understood and modeled30. The gist of the concept is that manipulation of PWAS size and frequency allow for selective preferential excitation of certain guided wave modes and the rejection of other guided wave modes, as needed by the particular SHM application under consideration. A similar tuning effect is also possible in anisotropic composite plates, only that the analysis is more complicated due to the anisotropic wave propagation characteristics inherent in composite materials.
PWAS
-a +a
x
τ(x)eiωt ta
t
tb
Figure 12 Model of bond-layer interaction between PWAS and composite structure
American Institute of Aeronautics and Astronautics
15

The analysis is performed in two steps: (a) perform the free response analysis and solve the homogenous problem to determine the dispersion curves and wave modes over the frequency domain of interest; (b) perform the force response analysis in which the PWAS transducer is used to excite guided wave modes in the composite plate (Figure 12). The analysis uses the normal modes expansion approach since, at any arbitrary frequency, several wave modes can be excited. To start with, consider the nth wave mode propagating in the kth layer of the composite plate (for notation simplicity we drop the subscript n); the velocities are given by the expression
American Institute of Aeronautics and Astronautics
16
)
)
(8) ( ) ( ) ( 1 36
1 2 3 11
, , 1, , qi x x vtq q q
qv v v i v V W U e ξ αξ + −
== − ∑
where , , are defined in guided wave propagation the solution in the composite structure. The corresponding stresses are
1qU qV qW
(9) ( ) ( 1 3
1 11 13 16
4 44 45 1
6 16 36 66
q
q q qi x x vt
q q q q qq
q q q
T c c W c VT i c V c W U eT c c W c V
ξ αα
ξ α α
α
+ −+ +⎧ ⎫ ⎧ ⎫
⎪ ⎪ ⎪ ⎪= + +⎨ ⎬ ⎨ ⎬⎪ ⎪ ⎪ ⎪+ +⎩ ⎭ ⎩ ⎭
∑
Under the ideal bonding assumption (pin-force model), the solution for the strain wave measured at the plate surface takes the form
( )
( ) sin2
ni xi tnx x n
nnn
di v y e e
Pξωε ξ
ω−= ∑v
naξ (10)
where is the half-length of the PWAS transducer and a nnP is the average power flow in the guided mode given by
thn
( )1 ˆRe2
d
nn n nd
P dy−
= − ⋅ ⋅∫ v T x 1 1 2 6 3 4ˆ v T v T v T⋅ ⋅ = + +v T x, ( ) (11)
with and being the stress and velocity expressions for the mode. It is apparent from Equation nT nv thn (10) that, as the wavenumber nξ varies, the function sin naξ goes from maxima and minima in the ( 1 interval, and
hence the response of the mode goes through peaks and valleys. The wavenumber
, 1)− +thn nξ varies with frequency
and phase velocities , i.e., ω
nc /n cnξ ω= . Since the variation of phase velocity with frequency is different from mode to mode, it is apparent that the peaks and valleys of one mode will not coincide with those of the other modes. Hence, one can find frequencies at which certain modes are rejected (valleys in their response curve) whereas other modes are tuned in (peaks in their response curves). It is also apparent that, because guided wave propagation in composite plates is directionally dependent, the tuning between the PWAS transducer and the guided waves in the composite plate will also depend on the propagation direction. To verify these theoretical predictions we performed experiments on a composite plate with PWAS receivers installed at various directions from the PWAS transmitter. Figure 13 shows the experimental setup: a 1240-mm x 1240-mm quasi-isotropic plate was used. The plate had an overall thickness of 2.25 mm; the plate a [(0/45/90/-45)2]S layup from T300/5208 carbon fiber unidirectional tape. Figure 13 shows the central part of the composite plate where 7-mm round PWAS transducers (0.2-mm thick, American Piezo Ceramics APC-850) were installed. The PWAS denoted with the letter T was the transmitter while those denoted with R were the receivers (R1…R5). The distance between the receivers and the transmitter was 250 mm. The step angle between sequential receivers was . In addition, a pair of 7-mm square PWAS were placed along the fiber direction, with S1 being the transmitter and S2 the receiver.
22.5θΔ = °
Smoothed 3-count tone-burst excitation signals were used. The signal frequency was swept from 15 kHz to 600 kHz in steps of 15 kHz. At each frequency, the wave amplitude and the time of flight for all the waves present were

collected. Since carbon fiber is electrically conductive, the composite plate could be used as ground and only a single excitation wire had to be cabled to each PWAS transducer. We found that the ground quality affects the signal strength; to obtain a strong signal, a good electrical ground was achieved through bonding a sheet of copper on the composite surface. In this way the signal was strong and consistent during the experiments.
0º
90º
T
S2
R1
S1
R3
R2
R4 R5
S3
Figure 13 Experiment setup measuring directional wave speeds in a [(0/45/90/-45)2]S plate 1240-mm x
1240-mm with 2.25-mm thickness. The plate was laminated from T300/5208 unidirectional tape
Three guided wave modes were detected: quasi-S0, quasi-A0, and quasi-SH0. Figure 14a shows the experimentally measured signal amplitudes for the three guided waves. The quasi-A0 reaches a peak response at around 50 kHz and then decreases. In fact, the A0 mode disappears as soon as the quasi-SH wave appears. The quasi-S0 mode reaches a peak at 450 kHz and then decreases. The quasi-SH0 mode reaches a peak response at around 325 kHz. Figure 14b shows a comparison between theoretical prediction and experimental values for the A0 mode; the match between theory and experiment is quite good, which gives confidence in our modeling approach.
0
1
2
3
4
5
6
7
8
9
10
11
12
0 100 200 300 400 500 600 700f (kHz)
V (m
V)
A0 S0
SH
f (kHz)0 100 200 300
5
10
(a) (b)
A0
Figure 14 Tuning of PWAS guided waves in composites: (a) quasi-A0 mode, quasi-S0 mode, quasi-SH0 mode. (b) comparison of theoretical prediction (full line) vs. experimental values for A0 mode
V. Experimental Results of Damage Detection in Composite Plates We did a series of experiments to detect damage in composite plates. The first type of damage we used in our experiments was a small hole of increasing diameter. Holes are generally not a representative type of damage for composite structures; however, we decide to use holes first in our damage detection tests because this type of
American Institute of Aeronautics and Astronautics
17

damage can be easily manufactured and reproduced with accuracy. The second type of damage we considered in our experiments was impact damage. This type of damage was produced using an inertial impactor. Details of these two types of experiments are given in the following two sections.
A. Hole Damage Detection in Unidirectional Composite Specimens We performed experiments to detect small holes of increasing size in unidirectional composite strips. Two unidirectional strips were used for these experiments. Both strips we instrumented with two 7-mm round PWAS placed 150 mm apart (Figure 15). The PWAS transducers were used in pitch catch mode. In one experimental setup, the hole damage was placed directly in the pitch-catch path; since this placement is the most favorable for detection, we used this experiments to determine the detection threshold, i.e., the smallest detectable hole size. In the second experimental setup, we placed the hole offset by 20 mm from the pitch-catch path. Again, we performed detection experiments with holes of increasing size in order to determined the smallest detectible hole size in this less favorable condition. The hole size diameters used in our experiments on unidirectional composite strips are given in Table 1.
(a)
(b)
Fibers direction
Figure 15 Unidirectional composite strips with PWAS installed 150-mm apart. (a) hole damage placed on the pitch-catch path; (b) hole damaged placed 20-mm offset from the pitch-catch path.
The first readings were taken when the strips were undamaged (baselines). Than, we drilled a 0.8 mm hole on both, and we enlarged them in 11 steps till they reached 6.35 mm in diameter. Error! Not a valid bookmark self-reference. reports the dimension of the holes for each step and reading. All readings were recorded at 480 kHz. At this frequency we have a single strong S0 wave packet.
Table 1 Hole size diameters used in damage detection experiments on unidirectional composite strips Step #
Readings Hole size (mm) Step # Readings Hole size (mm)
0 00 – 04 -- 6 31 – 35 3.2 1 05 – 09 0.8 7 36 – 40 3.6 2 10 – 14 1.5 8 41 – 45 4.0 3 15 – 19 1.6 9 46 – 50 4.8 4 20 – 25 2.0 10 51 – 55 5.5 5 26 – 30 2.4 11 56 – 60 6.4
During the pitch-catch experiments, a 3-count smoothed tone-burst was applied at the transmitter PWAS-0; the traveling wave packet was measured at the receiver PWAS-1. The tone-burst frequency was 480 kHz; this frequency was selected because, at this frequency, we had a strong quasi-S0 wave packet (tuning effect).The first pitch-catch reading was taken with the strip in pristine (undamaged) condition. This reading was used as baseline. Five separate consecutive readings were taken in order to achieve a degree of statistical variation for our experiment. Then, a 0.8-mm hole was drilled and another battery of five pitch-catch readings was taken. The process was repeated with ever increasing hole sizes. Thus, 11 reading steps were obtained until the hole reached a 6.35-mm diameter.
American Institute of Aeronautics and Astronautics
18

American Institute of Aeronautics and Astronautics
19
The collected data were analyzed with the damage index (DI) method. The DI value was computed with the root mean square deviation (RMSD) algorithm. The resulting DI values were plotted (Figure 16). The detection results for the case when the hole is directly in the pitch-catch path are given in Figure 16a, whereas the detection results for the hole placed offside from the pitch-catch path are given in Figure 16b. The first five readings were for the baseline, i.e., for the pristine specimen without damage. The next five readings are for the specimen with the 0.8-mm hole, and so on. If we look at Figure 16a representing the results for the damage in the direct pitch-catch path, we note that, as soon as damage was inflicted on the specimen, the DI value changed. This indicates that the detection method is very sensitive to small damage. The next three groups on the plot in Figure 16a give the DI values for hole sizes of 0.8, 1.5, and 1.6 mm. We note that the change from 0.8 mm to 1.5 mm damage size produced a clear jump in the DI value, but the next two changes were much smaller; this seems to be consistent with the fact that the relative change from 1.5 mm to 1.6 mm is much smaller than from 0.8 mm to 1.5 mm. The DI values keep increasing with increasing hole size; the only anomaly is that no change was registered by the DI when the hole size increased from 2 mm to 2.4 mm. It is to notice that the biggest jumps in DI values (from reading 20 to reading 21 and from reading 45 to reading 46) were achieved for the biggest changes in hole size.
Figure 16 DI analysis of damage detection in an unidirectional composite strip using the pitch-catch
method: (a) hole damage placed in the pitch-catch path; (b) hole damaged placed offside from the pitch-catch path. Each group of five readings represents five consecutive readings taken at the same damage level (hole size); the hole size values are given in Table 1
Figure 16b gives the DI results for the hole damage placed offside from the pitch-catch path. The DI value increased as soon as damage was inflicted. An unexpected fact happened when the hole size was increased from 2.0 mm to 2.4 mm: in this case, the DI increase was much larger than before; we suspect that some additional unintended damage was produced by the drilling process, or that a threshold in the interaction between the guided waves and the hole damage was reached; further investigation of this phenomenon is warranted, but could not be achieved in the time and funding framework of the reported project. Overall, we can conclude that these initial experiments have shown that the pitch-catch method can effectively detect hole damage in an unidirectional composite. In addition, these experiments have shown that the damage detection is also possible when the damage is placed offside from the pitch-catch path. This latter fact is explainable through the fact that guided waves get diffracted by the damage even when the damage is not placed directly in the pitch-catch path.
Table 2 Hole diameters for the damage detection experiments on quasi-isotropic composite panel Step Reading # Hole size in
mil [mm] Step Reading # Hole size in
mil [mm] 1 00 – 03 0 2 04 – 07 032 [0.81] 3 08 – 11 059 [1.50] 4 12 – 15 063 [1.60] 5 16 – 19 078 [1.98] 6 20 – 23 109 [2.77] 7 24 – 28 125 [3.18] 8 29 – 32 141 [3.58] 9 33 – 36 156 [3.96] 10 37 – 40 172 [4.37]
11 41 – 44 188 [4.78] 12 45 – 48 203 [5.16] 13 49 – 52 219 [5.56] 14 53 – 56 234 [5.94]
(a)0
0.05
0.1
0.15
0.2
0 5 10 15 20 25 30 35 40 45 50Reading #
DI v
alue
(b)

B. Hole Damage Detection in a Quasi-isotropic Composite Plate In this set of experiments, we used a 1240-mm x 1240-mm quasi-isotropic plate with a [(0/45/90/-45)2]S layup of T300/5208 unidirectional tape; the overall thickness was 2.25 mm. Two damage types were considered: (a) drilled holes of increasing diameter (Table 2); and (b) impact created with an inertial impactor. The experimental setup is shown in Figure 17. The two holes are marked as ‘hole’. The impact location is marked as 1 and 2. A set of 12 PWAS transducers were installed in pairs as shown in Figure 17. The PWAS pairs were (p0,p1), (p2,p3), (p4,p5), (p8,p9), (p10,p11), (p12,p13). The distance between the PWAS pairs was 300 mm. The excitation signal was a 3-count 11-V smoothed tone burst. The data were collected automatically using an ASCU2 signal switch (Figure 17).
Figure 17 Experimental set-up for hole damage detection on quasi-isotropic composite panel: Featured on
the plate are: 14 PWAS transducers (p0 through p13); one hole damage; two impact locations (1 and 2)
y
x
PWAS
8-channel signal bus
Computer Tektronix TDS210 Digital oscilloscope
GPIB GPIB
8-pin ribbon connector
Parallel Port
ASCU2-PWAS signal switch unit
HP 33120 Signal generator
hole
We collected data from PWAS p0, p1, p5, p8, p12, p13. Each PWAS was in turn transmitter and receiver. Three frequency values were used: (i) , when only the A0 mode is present; (ii) , when only the S0 mode is present; and (iii) , when the S0 mode has maximum amplitude. Four sequential baseline readings were taken with the plate undamaged. Subsequent readings were taken after each damage type was applied to the plate.
54 kHzf = 225 kHzf =255 kHzf =
A hole of increasing size was drilled between PWAS p1 and p12 (see Figure 17). The location of the hole was halfway between these two PWAS. The diameter of the hole was increased in 14 steps using the drill sizes shown in Table 2. At each damage step, several readings were taken. Table 2 shows the step index number, the reading index numbers for that step, and the hole drill size. Data processing consisted in comparing each reading with the baseline (reading 00) and calculating the damage index (DI). The DI value was computed with the root mean square deviation (RMSD) algorithm. We analyzed the DI data with statistical software (SAS) and stated our conclusions to a significance of 99%.
1. Pitch–Catch Analysis For pitch-catch analysis, we took in consideration only the data coming from the following PWAS pairs:
1. PWAS p0 transmitter, PWAS p13 receiver; 2. PWAS p1 transmitter, PWAS p12 receiver; 3. PWAS p5 transmitter, PWAS p8 receiver.
American Institute of Aeronautics and Astronautics
20

This experiment determined the minimum hole size that two PWAS pairs (p0–p13, p1–p12) were able to detect. We also used PWAS pair p05–p08 which was far away from the hole damage and hence nominally insensitive to damage; this allowed us to verify that our method is consistent and does not give ‘false positives’, i.e., no detection comes out when not supposed to do. Figure 18a shows the detection results; at 54 , only A0 mode was present. The wave velocity is 1580 m/sec; the wavelength is 29.3 mm.
54-kHz -kHzFigure 18a shows the box plot of the DI values for the three different
PWAS pairs. As the hole diameter increases, the DI values for the two PWAS pairs close to the hole (p0-p13 and p1-p12) increases while the DI for the PWAS pair p5–p8 remain almost constant. We analyzed the data with statistical software (SAS) and we observed that with a significance of 99%, PWAS pair p1–p12 can detect the presence of a hole with at lest 2.77-mm diameter. On the other hand, the PWAS pair p0–p13 could detect the presence of a hole with the same 99% significance only when the hole diameter was at lest 3.18 mm. The DI for the PWAS pair p05-p08 did not show any significant change, as expected.
Green: PWAS pair p01–p12 White: PWAS pair p00–p13 Blue: PWAS pair p05–p08
1 2 4 5 6 7 8 9 10 11 12 13
0.00
0.05
0.10
0.15
0.20
0.25
Step
DI
1 2 4 5 6 7 8 9 10 11 12 13
0.00
0.05
0.10
0.15
0.20
0.25
Step
DI
1 2 4 5 6 7 8 9 10 11 12 13
0.00
0.05
0.10
0.15
0.20
0.25
Step
DI
(a)
Green: PWAS pair p01–p12 White: PWAS pair p00p–p13 Blue: PWAS pair p05–p08
1 2 4 5 6 7 8 9 10 11 12 13 14
0.00
0.05
0.10
0.15
0.20
0.25
Step
DI
1 2 4 5 6 7 8 9 10 11 12 13 14
0.00
0.05
0.10
0.15
0.20
0.25
Step
DI
1 2 4 5 6 7 8 9 10 11 12 13 14
0.00
0.05
0.10
0.15
0.20
0.25
Step
DI
(b)
White: PWAS pair p00–p13Blue: PWAS pair p05–p08
1 2 4 5 6 7 8 9 10 11 12 13
0.00
0.05
0.10
0.15
0.20
0.25
Step
DI
1 2 4 5 6 7 8 9 10 11 12 13
0.00
0.05
0.10
0.15
0.20
0.25
Step
DI
(c)
Figure 18 Pitch-catch hole detection results showing DI values at different damage step values and different PWAS pairs. (a) , i.e., when only A0 mode is present; (b) , i.e., when only S0 mode is present; (c) , i.e., when the S0 mode has maximum amplitude
54 kHzf = 225 kHzf =255 kHzf =
Figure 18b shows the detection results. At , only S0 mode was present. The wave velocity is about 6000 m/sec, the wavelength is 26.6 mm.
225-kHz 225 kHzFigure 18b shows the box plot of the DI values for the three different
PWAS pairs. As the hole diameter increases, the DI values for the two PWAS pairs close to the hole (p0–p13 and p1–p12) increase while the DI value for the PWAS pair p05–p08 remains almost the same. We conclude that the
American Institute of Aeronautics and Astronautics
21
PWAS pairs p0–p13 and p1–p12 could detect the hole damage with a significance of 99% when the hole diameter reaches 2.77 mm. On the other hand, the PWAS pair p5-p8 did not detect damage, as expected. Figure 18c shows the detection results. At , the S0 mode has maximum amplitude. The wave velocity is about 6000 m/sec, the wavelength is 23.5 mm.
255-kHz 225 kHzFigure 18c shows the box plot of the DI values for the
three different PWAS pairs. As the hole diameter increases, the DI values for the two PWAS pairs close to the hole (pairs p0–p13 and p1–p12) increases while the DI for the PWAS pair p5–p8 remains almost constant. We conclude that, with a significance of 99%, the PWAS pairs p0–p13 and p1–p12 could detect the presence of the hole when its diameter was at least 3.18 mm. On the other hand, the PWAS pair p5-p8 did not detect damage, as expected.
American Institute of Aeronautics and Astronautics
22
Figure 19 Pulse-echo hole detection results showing DI values at different damage step values and
different PWAS pairs for i.e., when only A0 mode is present 54 kHzf =
2. Pulse–Echo Analysis Pulse – echo analysis was performed for PWAS p0–p1. PWAS p0 was used as transmitter while PWAS p1 was used as receiver. Here, we report the analysis only for when only the A0 mode is present; however, similar results were obtained at the other two frequencies.
54 kHzf =Figure 19 shows the DI box plot at different damage values.
Analyzing the data we find that the first significant difference w.r.t. step 01 (baseline) appears at step 07 corresponding to a hole of 3.18 mm. Hence, we concluded that, with 99% confidence, the pulse-echo method could detect a hole with a size of at least 3.18 mm. This set of hole-detection experiments indicated that PWAS transducers used in pitch-catch and pulse-echo modes are able to detect holes in a 2.25-mm thick isotropic composite plate. The minimum hole size detected with 99% confidence was 2.77 mm.
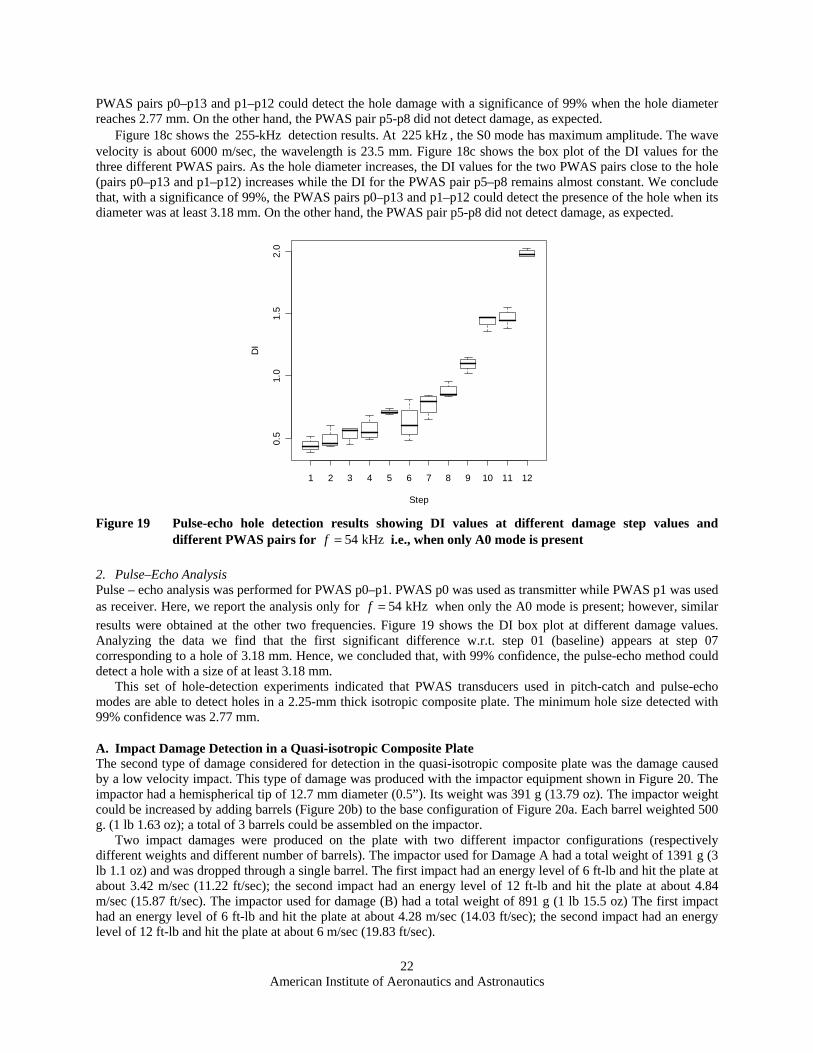
A. Impact Damage Detection in a Quasi-isotropic Composite Plate The second type of damage considered for detection in the quasi-isotropic composite plate was the damage caused by a low velocity impact. This type of damage was produced with the impactor equipment shown in Figure 20. The impactor had a hemispherical tip of 12.7 mm diameter (0.5”). Its weight was 391 g (13.79 oz). The impactor weight could be increased by adding barrels (Figure 20b) to the base configuration of Figure 20a. Each barrel weighted 500 g. (1 lb 1.63 oz); a total of 3 barrels could be assembled on the impactor. Two impact damages were produced on the plate with two different impactor configurations (respectively different weights and different number of barrels). The impactor used for Damage A had a total weight of 1391 g (3 lb 1.1 oz) and was dropped through a single barrel. The first impact had an energy level of 6 ft-lb and hit the plate at about 3.42 m/sec (11.22 ft/sec); the second impact had an energy level of 12 ft-lb and hit the plate at about 4.84 m/sec (15.87 ft/sec). The impactor used for damage (B) had a total weight of 891 g (1 lb 15.5 oz) The first impact had an energy level of 6 ft-lb and hit the plate at about 4.28 m/sec (14.03 ft/sec); the second impact had an energy level of 12 ft-lb and hit the plate at about 6 m/sec (19.83 ft/sec).
1 2 3 4 5 6 7 8 9 10 11 12
0.5
1.0
1.5
2.0
Step
DI

(a) (b) (c)
Figure 20 Impactor equipment used to generate impact damage in the quasi-isotropic specimen: (a) impactor with hemispherical tip; (b) barrel; (c) impactor assembly
Table 3 Information about the applied impacts Damage Readings Energy Velocity Step
00 – 10 1 11 – 20 6 ft-lb 11.2 ft/sec 2 A 21 – 30 12 ft-lb 16.0 ft/sec 3 00 – 10 1
11 – 20 6 ft-lb 14.0 ft/sec 2 B 21 – 30 12 ft-lb 19.8 ft/sec 3
Table 3 reports the energy and velocity levels for the two damage cases. For both damage A and damage B we recorded 11 baseline readings and 10 readings for each energy level. The readings were collected through the ASCU2 system.
Figure 21 A0 mode detection of impact Damage A: DI values as a function of the damage level for PWAS
pairs p9-p10 and p11-p12 ( ) 54 kHzf =
The first impact (Damage A) was produced between PWAS 12 and PWAS 11 (marked as ‘1’ in Figure 17). No visual damage was produced at 6 ft-lb energy level. After the second impact at energy level of 12 ft-lb, damage could be seen on the opposite side of the plate. We took readings for PWAS pairs p11–p12 and p9–p10. Each PWAS transducer in each pair was used once as transmitter and once as receiver. The second impact damage (Damage B) was produced between PWAS p2 and PWAS p11 (marked as ‘2’ in Figure 17). We collected readings from PWAS pairs p2–p11, p3–p10, and p5-p8. During the experiment, each PWAS was once transmitter and once receiver. No visible damage was produced after the two impacts. However the presence of damage in the plate structure was registered with standard ultrasonic methods.
American Institute of Aeronautics and Astronautics
23

Figure 22 S0-mode detection of impact Damage A: DI values as a function of the damage level for PWAS
pairs p9-p10 and p11-p12 ( ) 225 kHzf =
3. Pitch – Catch Analysis Pitch catch analysis was done at two frequencies, (with only the A0 mode present) and (with only the S0 mode present).
54 kHzf = 225 kHzf =Figure 21 shows the A0 DI values for Damage A (marked as ‘1’ in Figure 17).
There is not significant change between the DI values of the PWAS pair p9–p10 which are far away from the impact damage. However, for the PWAS pair p11-p12, which lies on either side of Damage A location, there is significant change after the second impact (energy level 12 ft-lb). Similar results were obtained for Damage B with PWAS pairs p2-p10, p3-p10, p5-p8. This analysis indicates that it is possible to detect the damage after the second stronger impact. Figure 22 shows the S0 DI values for Damage A. As before, The PWAS pair p9–p10 that is far from the impact damage does not show much change in the DI values. The PWAS pair p11–p12 which is placed on either side of the impact damage shows a DI change after the second impact (energy level 12 ft-lb), but the change is not as clear as in the case of A0-mode detection. We conclude that the pseudo S0 mode is less sensitive to impact damage in an quasi-isotropic composite panel. Similar results we obtained for damage B with PWAS pairs p2-p10, p3-p10, p5-p8.
4. Pulse – Echo Analysis Pulse-echo analysis was performed for PWAS p10 and p11 (damage A). PWAS p11 was used as transmitter while PWAS p10 was used as receiver. We report the analysis for the A0 mode (54 kHz) and S0 mode (225 kHz). The results are shown in Figure 23. Analysis of the data indicates that there is significant difference between step 1 (baseline) and the damage steps 2 and 3 for the case of A0 waves (54 kHz). For the case of S0 waves (225 kHz), there is significant difference only between Step 1 and Step3 (impact at 12 ft-lb). This indicates that, as in the pitch-catch method, the S0 mode is less sensitive to impact damage.
A0
S0
American Institute of Aeronautics and Astronautics
24
Figure 23 Damage A. DI values at different Step values, White box: frequency 54 kHz; Gray box: frequency 225 kHz

American Institute of Aeronautics and Astronautics
25
This paper ha electric wafer active sensors (PWAS) can be used to detect damage in composite structures. PWAS are lightweight and inexpe hat enable a large class of structural health monitoring (SHM) applications such as: (a) em pitch-catch, pulse-echo, phased
0.8 mm. The detection method used in these
fication and Health Monitoring of Structural and Mechanical Systems From Changes in Their Vibration Characteristics: A Literature Review," Los Alamos National Laboratory Report LA-13070-MS, May 1996
0 page
17Worlton, D. C., (1957). Ultrasonic Testing with Lamb Waves, NonDestructive Testing, 15 (4): 218-222.
II. Conclusion s presented how piezo
nsive transducers tbedded guided-wave ultrasonics, i.e.,
arrays; (b) high-frequency modal sensing, i.e., the electro-mechanical (E/M) impedance method; (c) passive detection (acoustic emission and impact detection). The focus of this paper has been on the challenges and opportunities posed by the composite structures as different from the metallic structures on which this methodology was initially developed. After a brief introduction, the paper discussed the damage modes commonly met in aerospace composite structures. Then, it reviewed the PWAS-based SHM principles. It follows with a discussion of guided wave propagation in composites and PWAS tuning effects. The paper presented experimental damage detection results in composites: (i) hole damage in unidirectional and quasi-isotropic plates; and (ii) impact damage in quasi-isotropic plates. In unidirectional carbon-epoxy composite strips, it was found that the minimum detectable hole size wasexperiments was pitch-catch with 480-kHz tuned S0 waves. In quasi-isotropic carbon-epoxy composite plates, it was found that the minimum detectable hole size with 99% confidence was 2.77 mm. In these experiments, we used several tuned guided wave modes, A0 waves at 54 kHz; and S0 waves at 225 kHz and 255 kHz. The detection methods used in these experiments were both pitch-catch and pulse-echo. In the impact damage experiments, it was found that tuned A0 guided wave mode were much more effective in detecting impact damage in quasi-isotropic carbon-epoxy plates than S0 mode. Further research needs to be done to better understand the interaction of guided waves with damage in composite materials and how various guide-wave types interact with various types of damage.
VI. References 1Doebling, S. W., Farrar, C. R., Prime, M. B., and Shevitz, D. W., "Damage Identi
. 2Sohn, H., Farrar, C.R., Hemez, F. M., Shunk, D. D., Stinemates, S. W., Nadler, B. R., and Czarnecki, J. J., "A Review of
Structural Health Monitoring Literature form 1996-2001," Los Alamos National Laboratory report LA-13976-MS, 2004. 3Farrar, C.R., Sohn, H., Hemez, F.M., Anderson, M.C., Bement, M.T., Cornwell, P.J., Doebling, S.W., Schultze, J.F., Lieven,
N., Robertson, A.N., "Damage Prognosis: Current Status and Future Needs," Los Alamos National Laboratory Report, LA-14051-MS, 2004
4Rose, J.L., Soley, L., “Ultrasonic guided waves for the detection of anomalies in aircraft components”, Materials Evaluation, Vol. 50, No. 9, pg. 1080-1086, 2000.
5 Giurgiutiu, V., “Lamb Wave Generation with Piezoelectric Wafer Active Sensors for Structural Health Monitoring”, SPIE's 10th Annual International Symposium on Smart Structures and Materials and 8th Annual International Symposium on NDE for Health Monitoring and Diagnostics, 2-6 March 2003, San Diego, CA, paper # 5056-17
6Giurgiutiu, V., Zagrai, A., Bao, J. J., Redmond, J. M., Roach, D., and Rackow, K. “Active Sensors for Health Monitoring of Aging Aerospace Structures,” International Journal of COMADEM, Vol. 6, No. 1, pg 3–21, 2003.
7Giurgiutiu, V., Zagrai, A., Bao, J., “Damage Identification in Aging Aircraft Structures With Piezoelectric Wafer Active Sensors,” Journal of Intelligent Material Systems and Structures, Vol. 15, No. 9–10, pg. 673–687, 2003.
8Soutis, C. and Beaumont, P.W.R., “Multi-scale modelling of composite material systems: The art of predictive damage modelling”. Woodhead Publishing Ltd., ISBN-13: 978-1-85573-936-9, 2005.
9Tong L. and Soutis, C., “Recent Advances in Structural Joints and Repairs for Composites Materials” (Kluwer Academic Publishers, The Netherlands, ISBN 1-4020-1381-7) 2003.
10Diamanti, K., Soutis, C. and Hodgkinson, J. M. “Non-Destructive Inspection of Sandwich and Repaired Composite Laminated Structures”. Composites Science & Technology, 65(13), (2005), 2059-2067.
11JSSG-2006: “Aircraft Structures, General Specification for”, US Dept. of Defense Joint Specification Guide JSSG-2006, 30 Oct. 1998, http://www.everyspec.com/DoD/DoD+PUBLICATIONS/JSSG-2006_10206/.
12MIL-HDBK-1530, “Aircraft Structural Integrity Program, General Guidelines for” US Dept. of Defense Military Handbook, 4 Nov. 1996, http://www.everyspec.com/MIL-HDBK/MIL-HDBK+(1500+-+1799)/MIL_HDBK_1530_1844/.
13Heida, J. H., Konijnenberg, P. and 'tHart, W. G. J., (1995). Characterization of Impact Damage in Carbon-Epoxy Composites, Impact and Dynamic Fracture of Polymers and Composites, eds. Williams, J. G. and Pavan, A., Mech. Eng. Publications, London, ESIS 19: 359-370.
14Cawley, P., (1994). The Rapid Non-Destructive Inspection of Large Composite Structures, Composites, 25 (5): 351-357. 15Bar-Cohen, Y., (1999). In-Service NDE of Aerospace Structures -- Emerging Technologies and Challenges at the End of
the 2nd Millennium, NDT.net, 4 (9): 1-21. 16Giurgiutiu, V. (2008) Structural Health Monitoring with Piezoelectric Wafer Active Sensors, Elsevier Academic Press, 76s, ISBN 978-0120887606, 2008.

American Institute of Aeronautics and Astronautics
26
, (2000). Lamb and SH Wave Transducer Arrays for the Inspection of Large Areas of Thi
sight, 40 (5): 335-339
Transmission of elastic waves through a stratified solid medium,” J. Appl. Phys., vol. 21, pp. 89–93,
Haskell, N. A. (1953) “Dispersion of surface waves on multilayered media,” Bull. Seism. Soc. Am., vol. 43, pp. 17–34, 195
tropic layered media” International Journal for Numerical Methods in Eng
feh A. H., (1991) “The general problem of elastic wave propagation in multilayered anisotropic media” Journal of Aco
ayfeh A. H., (1995) “Wave propagation in layered anisotropic media with application to composites” Elsevier, 1995.
merica, June, 2002. . 1;
p. 4th Monitoring with Piezoelectric Wafer Active Sensors, Elsevier Academic Press, 760
pag
18Rose J. L. (1999) “Ultrasonic waves in layered media”, Cambridge University Press, 1999. 19Wilcox, P., Lowe, M. and Cawley, P.ck Plates, Review of Progress in Quantitative Nondestructive Evaluation, eds. Thompson, D. O. and Chimenti, D. E., Plenum
Press, New York, 1049-1056. 20Birt, E. A., (1998). Damage Detection in Carbon-Fibre Composites Using Ultrasonic Lamb Waves, In. 21Diamanti, K., Soutis, C. and Hodgkinson, J. M. “Piezoelectric transducer arrangement for the inspection of large composite
structures”. Composites A, 38(4), (2007), 1121-1130. 22Thomson, W. T. (1950) “
1950. 23
3. 24Kausel E., (1986) “Wave propagation in anisoineering, Vol. 23, 1567-1578, 1986. 25 Nayustical Society of America, 89 (4), Pt. 1, April 1991. 26 N27Wang L., Rokhlin S. I., (2001) “Stable reformulation of transfer matrix method for wave propagation in layered anisotropic
media”, Ultrasonics, 39 (2001), 413-424.28Rokhlin S. I., Wang L., (2002) “Stable recursive algorithm for elastic wave propagation in layered anisotropic media:
Stiffness matrix method”, Journal of Acoustic Society of A29Knopoff, L. (1964) “A matrix method for elastic wave problems”, Bulletin of seismology society of America; v. 54; no31-438, February 1964. 30Giurgiutiu, V. (2008) Structural Heales, ISBN 978-0120887606, 2008.