Piezoelectric Accelerometers and Vibration Preamplifiers · PDF filePiezoelectric...
160
Piezoelectric Accelerometers and Vibration Preamplifiers Theory andApplication Handbook Briiel&Kiar@.
Transcript of Piezoelectric Accelerometers and Vibration Preamplifiers · PDF filePiezoelectric...

Piezoelectric Accelerometersand Vibration Preamplifiers
Theory and Application Handbook
Briiel&Kiar@.

PIEZOELECTRIC ACCELEROMETERAilD
VIBRATION PREAMPLFIERHAl{DBOOK
by
Mark Senldge, BSc
and
Torben R. Llcht, MSc
Revislon November 1987
hn6 m Dmmd: K LaM &Sen IS. Ox-zmctdruo

CONTENTS
1. V|BRAT|ON iTEASUREMENT ............. ................ 1
1.1. TNTRODUCTTON . . . . . . . . . . . . . . . . . . . . . . 11.2. WHY MEASURE VIBRATTON? . . . . . . . . . . . . . . . . . . . . . 11.3. WHAT tS V|BRAT|ON? . . . . . . . . . . . . . . . . . . . . . . . . . . . . . . . . . . 51.4. V|BRAT|ON PARAMETERS ............. .............. 61.5. THE QUANTIFICATION OF VIBRATION LEVELS ............ 7
Linear amplitude and frequency scales ........................... ILogarithmic amplitude and frequency scales ................. I
1.6. ANALYSIS OF VIBRATION MEASUREMENTS .............. 11
2. THE PIEZOELECTRIC ACCELEROiIETER
2.1. fNTRODUCTION . . . . . . . . . . . . . . . . . . . . . ' t22.2. OPERATTON OF AN ACCELEROMETER ....................... 13
Analytical treatment ol accelerometer operation ............................... 142.3. FREQUENCY RANGE .........;................ . . . . . . . . . . . . . . . . . . . . . 18
Upper frequency l imit .......... 19Lower frequency l imit .......... 20
2.4.PIEZOELECTRIC MATERTALS ................... 202.5. PRACTICAL ACCELEROMETER DESIGNS .................... 22
Line-drive accelerometersOther designs ................... ............................ 25
2.6. ACCELEROMETER SENSITIVITY ............. 25Charge and voltage sensitivity .................. 26Uni-Gaino sensitlvity ............ 28Linearity and dynamlc range .......... .......... 28Transverse sensltlvlty .......... 29
2.7. PHASE RESPONSE .............. 302.8. TRANSTENT RESPONSE ............... ............. 33
Leakage effects .................... 33Ringing . . . . . . . . . . . . . . . . . . . . . 35
12
Zero shift ......... 37

3. VIBRATION PREAMPLTFTERS . . . . . . . . . . . . . . . . . . . . . . . . . . 38
3.1. PREAMPLTFTER DESTGN AND OPERATTON . . . . . . . . . . . . . . . . . . . . . . , . . . . . . . . . . . . . . . . . . 393.2. CHARGE AMPLIFIERS . . . . . , . . . 39
Charge sensi t iv i ty . . . . . . . . . . . . . . . . . 40Lower Limiting Frequency .................. ....... 44Capacitive loading of input by accelerometer cables ....................... 48Charge attenuation ......,....... 49Nolse in charge ampl i f iers . . . . . . . . . . . . . . . . . . . . . . . . 50
3.3. VOLTAGE PREAMPLTFTERS ............. ........... 54Voltage sensitivity ................ 55Lower Limiting Frequency .................. ....... 56Noise in voltage preamplif iers .................. 57
3.4. PREAMPLIFIER OUTPUT CABLES ........... 573.5. L|NE-DRTVE SYSTEMS . . . . . . . . . . . . . . . . . . . . . . . . . . . . . . . 58
Br0el &Kjer l ine-drive accelerometer and line-drive supply ........... 61BrUel &Kjer l ine-drive amplif ier and line-drive supply ..................... 61
3.6. COMPARISON OF THE SENSITIVITY OF DIFFERENTVIBRATION PREAMPLIFIER SYSTEMS TOEXTERNAL NO|SE SOURCES . . . . . . . . . . . . . . . . . . . 61Grounded accelerometer and charge preamplif ier .................... ' ........ O+Grounded accelerometer with charge preamplif ier(" f loat ing" input) . . . . . . . . . . . . . . . . . . . 65Brriel &Kjar l ine-drive amplif ier and power supply(grounded input) .......... ......... 66BrUel & Kjar l ine-drive amplif ier and power supply(" f loat ing" input) . . . . . . . . . . . . . . . . . . . 68Line-drive system based on constant currentpower supply . . . . . . . . . . . . . . . . . . . . . . . . . 70Balanced accelerometer and differential chargeampl i f ier . . . . . . . . . . 69fnsufated mounting of the accelerometer ...........-......... 71
3.7. SPECTAL PREAMPLTFTER FEATURES . . . . . . . . . . . . . . . . . . . . . . . . . . . . 71fntegration Networks ........... 72Fi l ters . . . . . . . . . . . . . . . . . . . . . . . . . . . . . . . . . . . . . . 76Overload lndicator ............... 78Reference Oscil lator ...-........ 78Power Suppl ies . . . . . . . . . . . . . . . . . . . . . 78
ACCELEROMETER PERFORMANCE tN PRACTTCE ................................ 79
4.1. INTRODUCTTON . . . . . . . . . . . . . . . . . . . . 794.2. ENVTRONMENTAL EFFECTS ..................... 80
Temperature range ........... ........................... 80Temperature transients ....... 82

Acoustic sensitivity .. ' .. ' . ....... 84Base strains . . . . . . . . . . . . ' . . . " . . . . . . . ' . 85Humidity . ' ......-. 85Magnetic sensitivity ............. 86Radiat ion . ' . . . ' . . . 86
4.3. MASS LOADING EFFECTS OF ACCELEROMETERS ......................... 864.4. MOUNTTNG THE ACCELEROMETER . . . . . . . . . . . . . . . . . . . . . . . . . . . . . . 88
Vibration test surface finish requirements .......... ........ ' . 89Mount ing locat ion . . . . . . ' . . ' . . . . . . . 89Determination of the frequency response of accelerometersusing different mounting techniques .. ' .. ' . 90Stud mount inS . . . . . . . . . . . . . . . . . . . . . . . . . . ' . . ' . . . . . . . . . . . . . . . ' 90Wax mount inS . . . . . . . . . . . . . . . . . . . . . . . . . ' . . . ' . . . . ' . . ' . . " . . ' . 93Magnetic mounting . '.. ' . ......... 95Self-adhesive mounting discs ........... ....... ' 97Adhesives ..... ' .. 98Probes . . . . . . . . . . . . 102
4.5. MECHANICAL FILTERS . . . . . . . . . . . . . . . . . . . . . . . . . . . . 105Description .... 105Operation ..... ' 106
4.6. ACCELEROMETER CABLES . . . . . . . . . . . . . . . . . . . 1074.7. GROUNDTNG PRECAUTIONS . . . . . . . . . . . . . . . . . . 109
ACCELEROMETER CALIBRATION AND TESTING ................................. 111
5'1 ' lNTRoDUcrloN """"""""" 111Why calibrate an accelerometer? ....... ' .- 113
5.2. THE HIERARCHY OF CALIBRATION STANDARDS . . . . . . . . . . . . . . . . . . . . . . . . . . 114The general hierarchy . '..... 114The hierarchy at B&K . . . . . . . . . . . . . . . . . . . ' . . ' . . . . . . . 115The accuracy ol calibration techniques ................ ...... 118
5.3. CALTBRATION METHODS . . . . . . . . . . . . . . . . . . . . . . . . 119Laser Interferometery . '...... 119Other absolute methods '.......... ' ....... ' ...... 121Comparison calibration by the"back-to-back" method ..". 121FFT-based back-to-back calibration '-..- 123The use of calibrated vibration excitersfor sensitivity checking .".. 124
5.4. MEASUREMENT OF OTHER ACCELEROMETER PARAMETERS .. 125Transverse sensitivity . ' ..".. 125Frequency response .... ' ...... 126Undamped natural frequency ...... ' ......... ' . 128Capacitance .........-...........".. 129

6.
5.5. DETERMINATION OF THE EFFECTS OF THE ENVIRONMENToN THE ACCELEROMETER SPECTETCATTONS ......... 129Temperature transient sensitivity ........... 129Temperature sensitivity ..... 129Base strain sensitivity ....... 130Acoust ic sensi t iv i ty . . . . . . . . . . . . 130Magnetic sensitivity ........... 131Temperature l imi ts . . . . . . . . . . . . . . . . . . . . . . . . . . . . . . . . . . . . . 131Shock l imi ts . . . . . . . . . . . . . . . . . . . . . . . . . 132
5.6. FACTORY TESTING OF ACCELEROMETER CABLES ...................... 1325.7. CALTBRATTON EQUTPMENT . . . . . . . . . . . . . . . . . . . . . 133
Calibration System Type 9559 ................ 133Individual calibration equipment ............ 133
5.8. STANDARDS RELATING TO THE CALIBRATIONoF ACCELEROMETERS . . . . . . . . . . . . . . . . . . . . . . . . . . 134
APPENDTCES . . . . . . . . . . . . . . . . . . . . . . . . . . . . . 137
APPENDIX A. Conversion charts . . . . . . . . . . . . . . . . . . . 138APPENDIX B. Vibration nomogram ............... 141APPENDIX C. Vibration standards ................. 142APPENDfX D. BrUel&Kjer Vibrat ion Li terature . . . . . . . . . . . . . . . . . 142APPENDIX E. Summary of Bruel&Kjer Preampl i f iers . . . . . . . . . . . . . . . . . . . . . . . . . . . . 144APPENDIX F. Summary of BrUel &Kjar instruments
with built- in preamplif iers ...... 146APPENDIX G. BrUel&Kjar accelerometer frequency and dynamic
range charts ...... 148APPENDIX H. Summary of BrUel &Kjar accelerometers . . . . . . . . . . . . . . . . . . . . . . . , 150

SYMBOL NOTATION
General Quantities Accelerometer Dynamics
t = Time I m" = Seismic mass
f = Frequency I mo = Mass of base
@ = Angular frequ€ncy | ," = Dlsplacement ol seismicmass
j =t{4X6 = Displacement of base
e = Base to the Natural LogarithmFa = Excitation force
(tn = Natural resonance frequen-cy (rads/sec)
General Dynamics | ,^ = Mounted resonance fre-quency (rads/sec)
f. = Mounted resonance fre-x = Dlsplacement I quency (Hz)
v = Velocity I n =Amptif tcat ionfactor
a = Acceleration I Z" = Mechanical lmpedance of
F = Force structure
f = Period Z, = Mechanical lmpedance ofaccelerometer
r = Time constant
General Electrical Quantities
I = Current
V = Voltage
A = Charge
c = Capacitance
R = Resistance
Z = lmpedance

SYMBOL NOTATION
Accelerometer ElectricalQuantities
Va = Open circuit accelerometervoltage
Qu = charge generated by pi-ezoelectric elements
ca = Capacitance ot accelerom-eter
Ra = Resistance of accelerome-ter
So, = Charge sensitivity of accel-erometer
Sn = Voltage sensitivity of accel-erometer (loaded)
S,,o = Voltage sensitivity of accel-erometer (open circuit)
Ch = Capacitance to the housingof a balanced accelerome-ter from the output pins
Cable Electrical Quantities
C" = Capacitance of cable
R" = Series reslstance of cable
Rb = Resistance between centreconductor and screen
C" = Capacitance betweenscreen and inner conductorsIn balanced accelerometercable
Cd = Capacitance of dielectric inbalanced accelerometercable
en = Triboelectric charge noise
Preamplifier ElectrlcalQuantities
Re = Preamplifier Input resls-tance
Ca = Preamplifier input capaci-tance
Ct = Feedback capacitance
R' = Feedback resistance
A = Gain of operational ampli f i -er
Vi = Preamplifier Input voltage
vo = Preamplifier output voltage
4 = Feedback impedance
Zt = Total impedance of accel-erometer, cable and pream-pl i f ier input
li = Current from C,
l" = Current through feedbackcapacitor
vc = Voltage across feedbackcapacitor
Ct = Total capacitance of accel-erometer, cable and pream-pl i f ier input
Rt = Total resistance of acceler-ometer, cable and pream-pl i f ier input
Rloat = Resistance of "floating"stage of preamplifier
CMRR = Common Mode RejectionRatio of "floating" opera-tional amplifier
en = Noise voltage
i" = Noise current
Ro = Output resistance ol line-drive ampli l ier

1. VIBRATION MEASUREMENT
1.1. |NTRODUCTIOI{
Recent years have seen the rise of vibration problems associated with struc-tures which are more delicate and intricate, and machines which are faster andmore complex. The problems have been coupled with demands for lowerrunning costs and increased efficiency. Concern has also arisen about theeffects of noise and vibration on people and on the working lifetime of manu-factured items. Consequently, there has been a requirement for a greaterunderstanding of the causes of vibration and the dynamic response of struc-tures to vibratory forces. To gain such an understanding an accurate, reliableand versatile vibration transducer is required. In addition, advanced measure-ment and analysis equipment is often used. However, both the versatility andcapability of such equipment would be wasted without an accurate vibrationsignal from a reliable vibration transducer.
The piezoelectric accelerometer is the optimum choice ol vibration transduc-er. The extensive range of high performance measuring equipment now avail-able can fully utilize the very wide frequency range and dynamic range offeredby this type of vibration transducer.
This handbook is intended primarily as a practical guide to making accuratevibration measurements with Br0el& Kjer piezoelectric accelerometers.
1.2. WHY MEASURE VIBRATION?
Vibration is measured for many different reasons. ln general all uncontrolledvibration is an undesirable phenomenon which gives rise to noise, causesmechanical stress and is a possible cause of structural failure. Four broad areasof vibration measurement can be defined:
1. Vibration Testing. As part of a general environmental test program or as apart of engineering design, vibration testing performs the vital role olfinding out how well a component can endure the vibration environmentswhich it is likely to encounter in a real-life situation.

l)urlng a vibration test, a structure (an aircraft component for example) issubjected to high vibration levels with a vibration exciter. The vibration levells held constant in defined frequency regions and the frequency is swept.This is achieved with a vibration exciter controller and a feedback acceler-ometer which provides data concerning the acceleration to which the struc-ture is subjected. With the addition of a second accelerometer attached tothe structure, frequency response information is obtained.
Fig. 1.1. Vibration testing of an insulator used in the construction of a highvoltage electricity pylon
2

2. Machine Health Monitor ing and Faul t Diagnosis In i ts s implest form anoverall measurement of vibration level on a machine is used to give awarning of impending problems. However, more informat ion can be ob-tained by frequency analysis. This technique involves measuring the charac-teristic frequency spectrum of the vibration of a machine in good conditionand monitor ing any changes of the spectral components using vibrat ionmeasurements over a period ol t ime. Such changes are normally indicationsof impending problems. Fault diagnosis can also be performed using vibra-tion measurements.
Fig. 1.2. Vibration measurements are used in a machine-health monitoring andfault diagnosis program

ln Industry vibration measurements also form the basis for correcting shaftunbalance in rotating machines. Unbalance is a cause of high vibrationlevels which often lead to fatigue and bearing failures.
3. Structural Analysis. This is a powerful experimental method for determin-ing the dynamic behaviour of a structure using vibration measurements.Using a force transducer and an accelerometer, the excitation signal andvibration response of a structure are measured simultaneously using a dualchannel analyzer. High speed computation, performed within the analyzerand often in conjunction with a desk-top computer, provides essentialinformation for the design verif ication and modification of structures vary-ing in size from small turbine blades to large bridges.
Fig. 1.3. The structural analysis of a train carriage using vibration measure-ments
4

4. Human Vabration Measurement. This area concerns the measurement ofthe vibration transmitted to human beings. These vibrations can, lor exam-ple, originate from passenger vehicles and hand-held power tools. Themeasured vibration levels are then related to human comfort and healthcriteria by International Standards.
Fig. 1.4. Measuring the vibration levels transmitted from the handle ot a chainsaw using an accelerometer and a vibration meter
1.3. WHAT IS VIBRATION?
Vibration is a dynamic phenomenon observed as a to-and-fro motion aboutan equilibrium position. Vibration is caused by the transfer or storage of qnergywithin structures, resulting from the action of one or mbre forces. Vibration isoften a by-product of an otherwise useful operation and is very diflicult toavoid.

Vlbretlons can be observed in the tirne domain, i.e. the change in the ampli-tudc of the vibration with time ("time history"). Vlbration time histories can fallInto one of several classes as defined by their'mathematical form or by thertatlstlcal properties of the motions they contain. Vibrations can also be lookedat fn the frequency domain where the vibration is described by its frequencyBpectrum, The two domains are related mathematically via the Fourier Trans-/orm. Consult the Br0el & Kjer book "Frequency Analysis" which deals with thistoplc.
Unlike other vibration transducers, piezoelectric accelerometers are used tomeasure arl types of vibrations regardless of the nature of the vibration in thetime domain or the frequency domain, as long as the accelerometer has thecorrect frequency and dynamic ranges. Because of the wide frequency anddynamic ranges of piezoelectric accelerometers it is always possible to find aparticular type for any vibration measurement. lt is only the analysis techniqueswhich must change according to the type of vibration.
1.4. VIBRATION PARAI'ETERS
The piezoelectric accelerometer measures acceleration and this signal canbe electronically integrated once to provide the velocity signal and a secondtime to provide the displacement signal. This is an attractive feature of piezo-electric accelerometers.
Fig. 1.5 shows the effect of integrating the acceleration of an electric drill.The vibration is displayed in the lrequency domain. The integrator acts as alow-pass filter and attenuates the high frequency components present beforethe integration. Using an integration network effectively "throws away" infor-mation about the vibration. Obviously this is only acceptable if the lost informa-tion is not required for the purpose of the measurement.
Acceleration should always be used if there is no reason for an integration.For example, an obvious reason for measuring velocity is to obtain the actualvibration velocity magnitude. lt'is also often desirable to minimize the dynamicrange requirements of the measuring instruments in the vibration measurementset-up and hence increase the signal-to-noise ratio of the measurement. This isachieved by using the parameter which gives the flattest frequency spectrum(see Fig.1.5(b)). Only frequency analysis can reveal the frequency compositionof a vibration signal. For broad-band (wide frequency content) measurementson rotating machlnes the velocity parameter is found to be the best in 70o/o ot allcases, acceleration in 30% and displacement is hardly ever used. Displacementparameters are sometimes used for measurements of low frequency and largedisplacement vibrations often encountered on structures such as ships, build-ings and bridges.
6

a)--L o tr tr tr u o tr tr tr o D o tr o o o o o o o o tr o tr o o o tr o o o o o D q o o o p o-o Q o-EItr tr tr
R.ciitir:-aa I m-|ffi Lim FG:-l 6Jr fr. sd.-Norm!l-6dr t4t EF:-O.3-ffr ru.r &Kid ,mm!qu!?q l - : :q q ' -@ rm m & nPMrrm m m
tutr ip lyF4 bl .by- l
ooEotr oo trotro t r t r t rD oD oDtrEl t ro t ro o ootr t ro o.:-i-6-u fr. W:-Nomal-mds PF SFd:-o3-mn
1ff i l rmmRilr l@s@
c).-L tr tr tr tr tr tr tr tr tr o o E tr o o o o o tr o o o tr tr o tr tr o tr o tr o o o tr tr o.tr -D D-o Q o o tr o o
- -hdilL:--AC Loo-|ffi unFra:-1.6J2 fr. sod:-Nmal-d. Fq.!-Sp.d:-0,3-m
rdaKi.r ,m@E!! l?q -- :4
-qa Em lm 3m @ Bi l r rm m m
Fig. 1.5. Frequency analysis of the vibration ot an electric drill using the threedifferent measurement parameters-acceleration, velocity and displace-ment
When complex signals such as shocks and impulses are measured integra-tion networks should notbe used because they introduce phase errors resultingin serious amplitude measurement errors.
1.5. THE OUANTIFICATION OF VIBRATION LEVELS
There are several ways of quantifying the vibration amplitude of a signal inthe time domain. The actual measurement units (for example, in/s2, m/s2, g etc)may differ although the descriptors described in this section are widely used.

{c
!E
coEI€
Xrd[ld lGegp(0,6t17)
Fig. 1.6. Simple harmonic vibration. The amplitude referred to can be displace-ment, velocity or acceleration
Fig. 1.6 shows the simplest form of vibration time history. lt is represented bya particle oscillating about a reference position where exactly equal conditionsof motion are encountered at fixed time intervals. This time interval is called theperiod, 7i of the vibration. The vibration amplitude varies sinusoidally with time.
It can be shown that the shape and period of the vibration remain the samewhen displacement, velocity or acceleration amplitude is chosen to representthe motion. Only the relative phases are different.
The amplitude of the vibration signal shown in Fig.1.6 can be described byusing the following descriptors.
1. RllS (Root llean Square) Level: Provides the most useful description ofvibration levels. The square root of the integrated time-averaged squaredfunction is related to the vibration energy and hence the vibration's damagepotential. The RMS value ot a sine wave is 1lt[2 times the value of the peaklevel.
Peak Level: Defines the maximum level which is measured and is useful inthe measurement of short duration shocks. However, no account is taken olthe time history of the vibration.
Peak-to-peak: Although of some use in describing vibration displacements,this descriptor is rarely used.
Average Level: Takes the time history of the vibration into account butthere is no useful relatlonship between the average level and any physicalquantity. fn Fig. 1.6 the average value of lhe rectitied sine wave is referredto.
3.

5. Crest Factor: Defines the ratio of the peak value of a signal to the RMSvalue. From the definit ion of RMS above, the crest factor for the sine wavein Fig. 1.6 is !2. As the vibration becomes more impulsive, or more random,the crest factor increases. This simple relationship is easily calculated witha simple vibration meter equipped with RMS and peak facil i t i€s. Whenmaking wide-band measurements on a machine's bearing houslng, an in-crease in a single vibration component caused by a faulty bearlng may beundetectable in the RMS measurement, but might be indicated by an in-crease in the crest factor. Hence by monitoring the growth of the crestfactor, it is possible to predict a breakdown or element fault.
Another example of the utility of crest factors can be found in structuraltesting techniques. The crest factor of the input signal to the structure canreveal important information about the excitation. lf the crest factor is veryhigh, as can be the case with hammer excitation, the structure may bedriven into non-linear dynamic behaviour. A high crest factor also indicatesthat the input may not contain sufficient energy to obtain a good signal-to-noise ratio. On the other hand, a high crest factor is an indication that theinput has a wide frequency range.
1.5.1. Linear Amplitude and Frequency Scales
Linear amplitude and frequency scales are used in vibration measurementswhen a high resolution is needed. A linear frequency scale helps to separateclosely spaced frequency components. The linear lrequency scale gives thelurther advantage that equally spaced harmonic components of a vibrationsignal are easily recognized.
1.5.2. Logarithmic Amplitude and Frequency Scales
Piezoelectric accelerometers are capable of accurate vibration measure-ments over extremely wide dynamic and frequency ranges. Therefore, to obtainconvenient interpretation of results the following are often required:
1. An amplitude scale which can accomodate vibration amplitudes from thelowest detectable amplitudes up to shock amplitudes, and which can alsosimplify the comparison of vibration amplitudes.
2. A frequency scale with the same percentage resolution over the whole widthof the recording chart.
The two objectives can be achieved using the followihg:

A drclbel scale. Although more commonly associated with acoustic mea-lurements the decibel (dB) is equally uselul in vibration measurements. lt isdeflned as the ratio of one amplitude to another and it is expressed in alogarithmic form. For vibration amplitude ratios the lollowing relationshipexlsts:
N(dB) :10log,s ( +\\ qref '
:2oros1e(* )
WhereN = number of decibels
a = measured vibration amplitude
Srer = reference amPlitude
According to lSO1683 the reference amplitudes are as follows:
Acceleration = 10s ms-2
Velocity - 10-em5-1
Displacement = 10-12m
For a sine wave of angular frequency or = 1000radians per second (atapproximately 159H2) these amplitudes are numerically equivalent. Thereference amplitudes must be referred to when vibration levels are stated indBs (e.g. "The vibration level was measured at 1 10 dB referred to 1 O{ ms-2").However, when vibration amplitudes are compared, the difference in thedecibels can be used provided that they are referred to the same reference.For example, it is correct to say that one level is 20dB above anotherwithout any further reference.
A logarithmic frequency scale. Frequency is sometimes plotted on alogarithmic scale. This type of scale has the effect of expanding the lowerfrequency ranges and compressing the higher frequency ranges. The resultis equal relative resolution over the frequency axis (on a screen or onpaper), and the size of the scale is kept to reasonable proportions. Thus alogarithmic lrequency scale is used to cover a wide frequency scale.
10

1.6. ANALYSIS OF VIBRATION MEASUREIIENTS
The amount of information that can be obtained from tradltlonal tlme domainanalysis is l imited although modern time domain analysis technlques are be-coming more powerful. However, wlth the addition of frequency analysls equip-ment, such as analogue and digital frequency analyzers, very useful addltlonalinformation is obtained. No in-depth coverage of instruments ol thls nature lsgiven in this handbook. The Br0el &Kiar books "Mechanical Vlbratlon andShock Measurements' and "Frequency Analysis" should be referred to for Isolid theoretical background in frequency analysis, while the main and shortcatalogues should be consulted for details of the range of instruments avallablefrom Br0el& Kjar.
The complexity of the measuring instrumentation and the analysis of resultsmay vary widely. But in every case the vibratlon transducer is the most criticall ink in the measurement chain, for without an accurate vibration signal theresults of further analysis will not be reliable.
The most reliable, versatile and accurate vibration transducer is the piezo-electric accelerometer.

2. THE PIEZOELECTRIC ACCELEROMETER
2.1. INTRODUCTION
The aim of this chapter is to give a basic, and often theoretical insight into theoperation and the characteristics of the piezoelectric accelerometer. Due to thenature of its operation the performance of the vibration preamplifier will need tobe included to a small extent. However for a complete description of theoperation and characteristics of preamplifiers, Chapter 3 "Vibration Preampliti-ers" should be consulted. A summary of the complete Br0el & Kjer range ofaccelerometers can be found in Appendix H.
The piezoelectric accelerometer is widely accepted as the best availabletransducer for the absolute measurement of vibration. This is a direct result ofthese properties:
1. Usable over very wide frequency ranges.
2. Excellent linearity over a very wide dynamic range.
3. Acceleration signal can be electronically integrated to provide velocity anddisplacement data.
4. Vibration measurements are possible in a wide range of environmentalconditions while sti l l maintaining excellent accuracy.
5. Self-generating so no external power supply is required.
6. No moving parts hence extremely durable.
7. Extremely compact plus a high sensitivity to mass ratio.
In order to appreciate these advantages it is worth examining the character-istics of a few other types of vibration transducer and vibration measurementdevices.
1. Prorimity probe. A device measuring only relative vibration displacement.It has a response to static displacements and also a low electrical imped-ance output. However, the device is not self-generating and the high fre-quency performance is poor. In addition the vibrating surface must beelectrically conductive.
12

2. Capacitive probe. A small, non-contact, vibration displacement transducerwith a high sensitivity and a wide frequency range. The disadvantages are,however, that the vibrating surface must be electrically conductive, theprobe's dynamic range is very l imited and it is diff icult to callbrate.
Position potentiometer. A low cost, low impedance device capable olmeasuring static displacements. However, the dynamic and lrequencyranges are l imited and the device only has a short working l ifetime and lowresolution.
Piezoresistive transducer. A vibration acceleration transducer which iscapable of measuring static accelerations. The measuring frequency anddynamic ranges can be wide. The limited shock handling capacity meansthat this type of transducer is easily damaged. Viscous damping is oftenused to protect the transducer against shocks. However, this leads to areduction in the operating temperature range and alters the phase charac-teristics.
Moving coil. A self-generating low impedance vibration velocity transducer.It is severely limited in its frequency range and dynamic range, is suscepti-ble to magnetic fields and is affected by its orientation.
2.2. OPERATION OF AN ACCELEROMETER
Fig.2.1 i l lustrates a simplif ied model of a BrUel &Kjer Delta Shear@ acceler-ometer showing only the mechanical parts. The active elements of the acceler-ometer are the piezoelectric elements. These act as springs connecting the
Fig.2.1. Schematic of a Brhel&Kjar Delta Shear@ piezoelectric accelerometer
13
5.

barc ol the accelerometer to the seismic masses via the rigid triangular centrepo!t. When the accelerometer is vibrated a force, equal to the product of thetccoleratlon of a seismic mass and its mass, acts on each piezoelectric ele-ment. The piezoelectric elements produce a charge proportional to the appliedlorce. The seismic masses are constant and consequently the elements pro-duce a charge which is proportional to the acceleration of the seismic masses.As the seismic masses accelerate with the same magnitude and phase as theaccelerometer base over a wide frequency range, the output of the accelerome-ter is proportional to the acceleration ol the base and hence to the accelerationof the surtace onto which the accelerometer is mounted.
The above model can be simplified as shown in Fi9.2.2.
2.2.1. Analylical Treatment of Accelerometer Operation
Fig.2.2 shows a simplified model ol the accelerometer described in the lastsection and referenced to an inertial system. The two masses are unsupportedand connected by an ideal spring. Damping is neglected in this model becauseBrUel & Kjer accelerometers have very low damping factors.
Fiq.2.2. Simplitied model of an accelerometer
total seismic mass
mass of the accelerometer base
displacement of the seismic mass
displacement of the accelerometer base
m8
lfl6
xs
X6
)q
xb
14

l- - distance between the seismic mass and the bese when the
accelerometer is at rest in the inertial system
11 - equivalent stiffness of the piezoelectric elements
F" = harmonic excitation force
Fo = amplitude of excitation force
(t = excitation frequency (radls) = hrf
o)n = natural resonance frequency ol the accelerometer (radls)
o)m = mounted resonance frequency of the accelerometer(radls)
f. = mounted resonance lrequency of the accelerometer (Hz)
f - excitation frequency (Hz)
The following expressions describe the forces present in the model
F = k(X" -xo-L) (spr ing force)
moxo = F * Fe (force on base)
D"f," = - F (force on seismic masses)
The equation of motion for the model can be lound
*"-xo = -+-ry=- ry. (x"-xo-q-+ (1)ms fi|6 lL m6
or
1tt = -k-+Fssin@tlfl6
Where
1 = 1*1
It ms ft16
or
- = lll"lf,O
' ms+ mb
p is often referred to as the "reduced mass" and r is the relatlve displace-ment ol the seismic mass to the base
15

f = Xs-Xb-L
When the accelerometer is in a free hanging position and is not being excitedby external lorces (Fr= 0) the equation of motion for its free vibration reducesto
1ri = -kr
This simple differential equation can be solved by assuming that the displace-ment of ms relative to rno varies harmonically with an amplitude R. In otherwords
r = Fsin cof
-pRaz sin ot = - kB sin orf
and therefore the resonance frequency of the accelerometer, <rln, can bewritten directly as
okt n-
ItThe implications of this result can be seen by rewrit ing this equation as
follows
@12
lf the accelerometer is now mounted wih perfect rigidity onto a structurewhich is heavier than the total weight of the accelerometer then mo becomesmuch larger than m". The resonance frequency of the accelerometer becomeslower. Taken to the limit, if the accelerometer is mounted on an infinitery heavystructure (mo-ol then the last equation reduces to
This is the natural frequency of the seismic mass-spring system and isdefined as the mourted resonance frequency, om, of the accelerometer. Themounted resonance frequency is a property ol the accelerometer seismic mass-spring system. Later it will be seen that this frequency is used to deline theusetul operating frequency range ol an accelerometer.
In practice it is obviously not possible to mount the accelerometer on aninfinitefy heavy and stiff structure to measure ils mounted resonance frequency.An approximation is achieved by mounting the accelerometer on a 1809 steelblock and exciting the two together at a constant acceleration over a widefrequency range to measure the mounted resonance frequency. This is exam-ined in Chapter 5.
16
= -(+.*) (2)
(3)k
ms

The resonance lrequency when mounted will change if the structure is notinfinitely rigid or if the accelerometer mounting technique introduces an addi-tional compliance between the base and the structure. The resonance wil l splitup in two and the lowest resonance frequency will be lower than the mountedresonance frequency. This is examined in Chapter 4.
The forced vibration of the accelerometer must now be examlned. Theapplied force on the accelerometer must be included in the analysis along wlththe natural resonance frequency, crrn, previously defined. The equation of motionfor the model (1 ) now becomes
i + on2 r a -J-9- sin crrt = 0mb
and assuming again that the displacements of the masses vary sinusoidallythen
-c,r2Bsin@f +@n2Rsint , , l f + Fo
sin<ot = 0mb
and therefore
R(an2 -@'?) + -I9-= olfl6
or
B =- F=o =
mo (anz- ci2l
At frequencies well below the natural resonance frequency of the accelerom-eter (@<<c;n) the displacement, which is now called Be, is expressed by
Ro -- Fo-frtPn2
The ratio of the displacement at low frequency, Fs, to the displacement athigh frequency, F, can be expressed as follows
Fomo (ri.r2- ri,2l
Ro Fo-ffi
and by denoting this ratio as 4 and rearranging the expression, then
A (41., -(-v-\"
\ t , I
This important result shows that the displacement between the base and theseismic masses increases when the forcing frequency becomes comparable to
R
17

thc natural resonance frequency of the accelerometer. Consequently the forceon the plezoelectric elements and the electrical gutput trom the accelerometeralao Increase. As the piezoelectric elements used in Bruel & Kjer accelerome-tere exhibit constant force sensitivity the increase in electrical output ol anaccelerometer near its resonance frequency is attributable entirely to the natu-ral resonance of the accelerometer. The typical shape of a frequency responsecurve of an accelerometer (see Fig. 2.3) and amplitude measurement errors arerelated to this equation. This is covered in section 2.3.
The free hanging natural resonance frequency of the accelerometer dependsheavily on the ratio of the total seismic mass to the mass of the rest of thetransducer but primarily to that of the base. As a general rule the total seismicmass of an accelerometer is approximately the same as the mass of the baseand this gives the relationship
mounted resonance frequencyfree hanging resonance frequency
2.3. Frequency Range
The relative change in electrical output from an accelerometei is shown inFig. 2.3. A frequency response curve of this kind shows the variation in theaccelerometer's electrical output when it is excited by a constant vibration levelover a wide frequency range. To obtain such a frequency response curve theaccelerometer is mounted onto a 1809 exciter head. Hence the approximation
1
u2
o@oo
6ot
usetul Frequency ranges
10% limlt = 0,3 f-
3 dB limlt -
0,5 l.
Maln Axls Chatgs or Voltage Sensltlvlty
1
Prooortion of Mounted R$mme Frequency tm
18
Fiq.2.3. Relative sensitivity of an accelerometer vs' frequency

to the mounted resonance frequency of the accelerometer can be found. Thisfrequency response curve is related to equation (4) in the lasl sectlon. However,lhe mounted resonance frequency can now be directly substltuted into (4) toobtain
A=i1 i t (s)r - ls l -
\ c,t- /
Equation (5) can be used to calculate the deviation between the measuredand the actual vibration at any frequency and to define useful frequency ranges.
2.3.1. Upper Frequency Limit
Fig.2.3 shows that lhe mounted resonance frequency determines the fre-quency range over which the accelerometer can be used while a constantelectrical output for a constant vibration input is still maintained.
The higher the mounted resonance frequency, the wider the operating fre-quency range. However, in order to have a higher mounted resonance frequen-cy it is necessary to have either stiffer piezoelectric elements or a lower totalseismic mass. The stiffness ol the piezoelectric elements is generally constantso a lower seismic mass is required. Such a lower mass would however exertless force on the piezoelectric element and the accelerometer would conse-quently be less sensitive. Therefore accelerometers possessing very high fre-quency performance are less sensitive. conversely, high sensitivity accelerom-eters do not have very high frequency measurement capability.
several useful lrequency ranges can be defined from the frequency responsecurve of an accelerometer. They are:
5olo Frequency Limit is the frequency at which there is a 5% deviation betweenthe measured and the actual vibration level applied to the base of the acceler-ometer. The maximum vibration frequency which can be measured with thisaccuracy is approximately one fifth (0,22) of the mounted resonance frequencyof the accelerometer.
10% Frequency Limit is the frequency at which there is a 10% deviationbetween the measured and the actual vibration level applied to the base of theaccelerometer. The maximum vibration frequency which can be measured withthis accuracy is approximately one third (0,30) times the mounted resonancefrequency of the accelerometer.
3dB Frequency Limit is the frequency at which there is a 3dB differencebetween the measured and the actual vibration level applied to the base of the
19

accelerometer. The maximum vibration frequency which can be measured withthis accuracy is approximately one half (0,54) times the mounted resonancefrequency of the accelerometer.
2.3.2. Lower Frequency Limit
Piezolelectric accelerometers are not capable of a true DC response. Thepiezoefectric elements will only produce a charge when acted upon by dynamicforces. The actual low frequency limit is determined by the preamplilier to whichthe accelerometer is connected as it is the preamplifier which determines therate at which the charge leaks away from the accelerometer. Measurements ofvibrations at frequencies down to 0,003 Hz arc possible with BrUel & Kjar accel-erometers and preamplifiers.
Applications requiring a low frequency limit in the order of fractions of a hertzare very rare and consequently the lack of a true DC response is seldom adrawback.
Chapter 3, "Vibration Preamplif iers", should be consulted for a description ofthe low frequency performance of preamplifiers. Environmental effects associ-ated with low frequency measurements are covered in Chapter 4 "Accelerome-ter Performance in Practice".
2.4. P'EZOELECTRIC MATE RIALS
A piezoelectric material is one which develops an electrical charge whensubjected to a force. Materials which exhibit this property are intrinsic piezo-electric monocrystals such as quartz and Rochelle salt, and artificially polarizedferroelectric ceramics which are mixtures of different compounds such asbarium titanate, lead zirconate and lead metaniobate.
The process by which the ceramics are polarized is analogous to the processby which a piece of soft iron can be magnetised by a magnetic field . A highvoltage surge is applied across two ends of the material. The domains withinthe molecular structure of the material become aligned in such a way that anexternal force causes deformations of the domains and charges of oppositepolarity to form on opposite ends of the material. Fig.2.4. shows a simplifiedillustration of this effect. When a piezoelectric accelerometer is vibrated forcesproportional to the applied acceleration act on the piezoelectric elements andthe charge generated by them is picked up by the contact. lt is the extremelylinear relationship between the applied force and the developed charge, over avery wide dynamic and frequency range, which results in the excellent charac-teristics of the piezoelectric accelerometer. The sensitivity of a piezoelectricmaterial is given in pC/N.
20

Polarlzationdirection
Domains ln undelormed state
Shear deformalionof domains
(,
c r\
I ooo,* ro,""
A Av
f.)
/i'\ rnv
tII
Compression deformallonof domains
Fig. 2.4. Simple model of the piezoelectric effect within an artificially polarizedceramic. The charge q is collected between the indicated surfaces
The piezoelectric element can undergo both compression and shear defor-mation as illustrated in Fig. 2.4. In both cases a charge is developed along thesurfaces on which the forces act.
In compression deformation the charge is picked up in the polarizationdirection. This has the distinct disadvantage that non-vibration inputs, such astemperature tluctuations, cause charge to be developed in the polarizationdirection. This charge is also picked-up along with the vibration induced chargeand the accelerometer output is no longer only related to the vibration input.However, when using shear deformation, the charge is picked up in a directionperpendicular to the polarization direction and the extra charge caused by thetemperature fluctuations is not picked up. This is one of the reasons why shearmode accelerometer designs give better performance than compression de-signs. The influence of temperature fluctuations is discussed in further detail insection 4.2.2.

Ferroelectric ceramics may be produced in any desired shape and theircomposltlon may be varied to give them special.properties for different appli-catlons, With piezoelectric monocrystall ine materials such as quartz this is notth€ case as their composition is f ixed and their shape is restricted by the size ofcrystal from which they are cut. Because of this accelerometers which usemonocrystall ine elements generally have a lower sensitivity and internal capaci-tance than those with ferroelectric ceramic elements.
Piezoelectric materials used in Br0el &Kjar accelerometers are designatedP223, P227, PZ 45 and PZ 100. These have the following properties:
1. PZ 23 belongs to the lead titanate, lead zirconate family of ferroelectricceramics and is artificially polarized. lt may be used at temperatures up to250'C (482"F). Due to its high sensitivity (approx. 300 pClN) and other goodall round properties it is used in most Brtiel &Kjer accelerometers.
2. PZ27 is an artif icially polarized lead zirconate titanate element very similarlo P723. lt is suitable for use in miniature accelerometers.
3. PZ 45 is a specially formulated artif icially polarized ferroelectric ceramicwhich has a particularly flat temperature response and may be used attemperatures of up to 400'C (752F\. lt is used in Br0el &Kjer differential,high temperature and high shock accelerometers.
4. PZ 100 is a carefully selected and prepared quartz crystal. lt may be used attemperatures up to 250'C (482'F) and has excellent stabil ity with lowtemperature transient sensitivity. lt is used in the BrUel &Kjer StandardRelerence Accelerometer Type 8305 and in the force transducers.
The type of the piezoelectric element used in any particular BrUel & Kjeraccelerometer can be found in the accelerometer Product Data.
2.5. PRACTICAL ACCELEROMETER DESIGNS
Three different mechanical constructions are used in the design olBrUel &Kjar accelerometers. The first two designs, Planar Shear and DeltaShearo are shown in Fig.2.5. A Compression Design (see Fig.2.6) is also inuse. Due to its superior performance the Delta Shear@ design is used in nearlyall BrUel&Kj@r accelerometers.
1. Delta Shear@ Derign. Three piezoelectric elements and three masses arearranged in a triangular configuration around a triangular centre post. Theyare held in place using a high tensile clamping ring. No adhesives or boltsare required to hold the assembly together and this ensures optimumperformance and reliability. The ring prestresses the piezoelectric elementsto give a high degree of linearity. The charge is collected between thehousing and the clamping ring.
22

P
M
R
B
P
M
R
B
Planar Shear Delta Shear@
2.
Fiq.2.5. Planar Shear and Delta Shear@ designs. M=Seismic Mass, P=Piezoe-lectric Element, R=Clamping Ring and B:Base
The Delta Shear@ design gives a high sensitivity-to-mass ratio compared toother designs and has a relatively high resonance frequency and highisolation from base strains and temperature transients. The excellent overallcharacteristics of this design make it ideal for both general purpose accel-erometers and more specialized types.
Planar Shear. In this design the piezoelectric element undergoes sheardeformation as in the Delta Shear@ design. Two rectangular slices of piezo-electric material are arranged on each side of a rectangular centre post.Two masses are formed as shown in Fig. 2.5 and held in position using ahigh tensile strength clamping ring performing the same function as in theDelta Shear@ design. The base and piezoelectric elements are effectivelyisolated from each other thus giving excellent immunity to base bending andtemperature fluctuations.
Centre Mounted Compression Design. This traditional, simple construc-tion gives a moderately high sensitivity-to-mass ratio. The piezoelectricelement-mass-spring system is mounted on a cylindrical centre post at-tached to the base of the accelerometer. However, because the base andcentre post effectively act as a spring in parallel with the piezoelectricelements, any dynamic changes in the base such as bending or thermalexpansions can cause stresses in the piezoelectric elements and henceerroneous outputs. Even though BrUel& Kjer employ very thick bases tominimize these effects in compression designs, bending and stretchingforces can still be transmitted to the piezoelectric elements. This will resultin an erroneous non-vibration related output at the frequency of the vibra-tion. In the previous section it was seen that temperature fluctuations canalso produce charge in the piezoelectrics which are picked up in Compres-sion Designs.
3.
23
s
M
P
B
Centre Mounted Compression
Fig. 2.6. Traditional Compression Design. M=Seismic Mass, p=piezoelectricElement, B=Base, and S=Spring
For the reasons mentioned above BrUel & Kjer only produce compressiondesign accelerometers for high level measurements (i.e. shock measure-ments) where the erroneous output is small compared with the vibrationsignal. A compression design is also used for the Standard ReferenceAccelerometer which is used in the controlled environment of accelerometercalibration. Here the addition of a beryllium disc strengthens the base andminimizes the effect of base bending. This accelerometer is inverselymounted in order to measure more accurately the vibration at the base ofthe accelerometer which is mounted onto it.
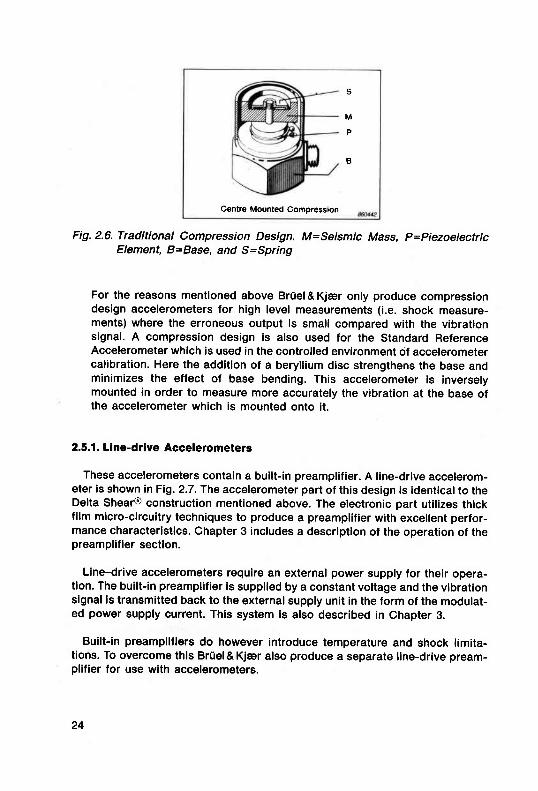
2.5,1. Line-drive Accelerometers
These accelerometers contain a built-in preamplifier. A line-drive accelerom-eter is shown in Fig. 2.7 . The accelerometer part of this design is identical to theDelta Shear@ construction mentioned above. The electronic part utilizes thickfilm micro-circuitry techniques to produce a preamplifier with excellent perfor-mance characteristics. Chapter 3 includes a description of the operation of thepreamplilier section.
Line-drive accelerometers require an external power supply for their opera-tion. The built-in preamplifier is supplied by a constant voltage and the vibrationsignal is transmitted back to the external supply unit in the form of the modulat-ed power supply current. This system is also described in Chapter 3.
Built-in preamplifiers do however introduce temperature and shock limita-tions. To overcome this Briiel& Kjer also produce a separate line-drive pream-plifier for use with accelerometers.
24

Fig.2.7. A Briiel &Kjer line-drive accelerometer with its housing removed toreveal the built-in electronics
2.5.2. Other designs
Other designs of accelerometer exist, based around the compression andshear deformation principles. Br0el &Kjer only use the designs mentionedabove as these, and in particular the Delta Shear@ design, give the mostuncompromising performance available. The following general designs may sti l lbe found elsewhere;
Annular Shear Designs where the piezoelectric elements and masses areformed into rings and simply glued together.
lsolaled Shear (Bolted Shear) is similar to the planar shear design except thepiezoelectric elements are secured using a bolt.
2.6. ACCELEROMETER SENSITIVITY
So far it has been seen that an accelerometer is a self-generating devicewhose electrical output is proportional to the applied acceleration. In order toassess the accelerometer's role as a measurement device, the relationshipbetween its input (acceleration) and output (charge or voltage) is now examinedin more detail.
25

2.t.1. Gharge and Voltage Sensitivity
The plezoelectric accelerometer can be regarded as either a charge sourceor a voltage source. The piezoelectric element acts as a capacitor C, in parallel
wlth a very high internal leakage resistance, 8* which, for practical purposes,can be ignored. lt may be treated either as an ideal charge source, Oa in parallelwith C, and the cable capacitance Cc or as voltage source V" in series with C,and loaded by C", as shown in Fig. 2.8. The equivalent circuits for both modelsare shown in Fig.2.8. Both models can be used independently according towhich model yields the easiest calculations.
Fig. 2.8. Equivalent electrical circuits for piezoelectric accelerometer and con-nection cable
The choice of accelerometer preamplifier depends on whether we want todetect charge or voltage as the electrical output from the accelerometer.
The charge sensitivity, So", of a piezoelectric accelerometer is calibrated interms of charge (measured in pC) per unit of acceleration:
.q = PC-POnus-POpeat-qa
ms-2 tnS-2nus llls-2peax
Likewise, the voltage sensitivity can be expressed in terms of voltage per unitof acceleration:
= tV = iY!u!- =ms-2 tns-2nus
mVpear
q
Ca+C"
Voltage Equivalent
"=v' unlt ot acceleietion
26
srcfis-2o""*

It can be seen from the simplified diagrams that the voltage produced by theaccelerometer is divided between the accelerometer capacitance and the cablecapacitance. Hence a change in the cable capacitance, caused elther by adifferent type of cable and/or a change in the cable length, wlll cause a changein the voltage sensitivity. A sensitivity recalibration will ther€fore be requlred.This is a major disadvantage of using voltage preamplification and ls examlnedin greater detail in chapter 3. charge amplifiers are used nearly all the flmenowadays.
At low and medium frequencies, within the useful operating frequency rangeof an accelerometer, the voltage sensitivity is independent of frequency. Thlsafso appf ies to the charge sensitivity of accelerometers using pz 45 and pz 1oopiezoefectric materials, but not to those using pZ23 and pz27 piezoelectricmalerials. Instead, this piezoelectric material has been designed so that boththe charge sensitivity and capacitance decrease by approximalely 2,So/o perdecade increase in frequency. The effect of this decrease is to partially offsetthe output rise at resonance. Therefore, the maximum deviation between themeasured and actual accelerations over the useful operating lrequency rangeof accelerometers employingPZ 23 with medium to high resonance frequenciesis only + 1vo ot the acceleration applied to the base of the accelerometer, asindicated in Fig.2.9.
Fig. 2.9. charge and voltage sensitivity versus frequency for an accelerometerusing PZ 23 piezoelectric material
50%
40
=oooo
6oCE
Usoful Frequency Range_ 0,3 tn
- Charge Sensitivity Deviation < r 5%
- -- Voltsge Sensitivity Deviarion < + 1096
Slope - 2,5%/ Frequency
o,q)l 0,01 0,1Proportlon ot Mount€d Resonanc6 Fr€quency fm

2.6.2. Unl.Gelno Senritivity
Almoot every BrUel&Kjar acceleromet€r is ot the Uni-Gaino design. Thism€ans that their measured sensitivities have been adjusted to within 2o/o ol aconvenient value such as 1; 3,16; 10 or 31 ,6 po/ms-2. With Uni-Gain@ acceler-ometers one accelerometer can be replaced by another of the same typewlthout further adjustment of any instrument setting. Because the values aboveare 10dB apart relative to each other, the calibration of measurement systemsand set-ups is very easy. For example, if one accelerometer is exchanged foranother of a difterent type, only fixed gain changes of 10dB are required on themeasurement instrumentation.
Uni-Gaino sensitivities are achieved in BrUel& Kjer accelerometers by care-tully adjusting the mass of the seismic elements.
2.6.3. Linearity and Dynamic Range
Linearity is a fundamental requirement of any measuring system. The ouputfrom the system must be linearly related to the input over as wide a frequencyand dynamic range as ls required. The excellent linearity of BrUel & Kjar accel-erometers is i l lustrated in Fig.2.10.
Fig. 2.10. Accelerometer output versus acceleration for piezoelectric acceler-ometerc demonstratlng the linearity and wide dynamic range
o
aoo
5u
Lower llmit set bynoise trom Preampllfler+ cable + envlronm€nt
Upps limit set byAGelerometer
= 160 dB(10E: l )
l<--use{ul
Acceleration
28

The piezoelectric accelerometer is an extremely linear devlce over a verywide dynamic range because of the linear performance ol the plezoelectricelements over a wide dynamic range. In theory the accelerometer ls llnear downto zero acceleration. However a practical lower limit is determlned by the noiseinherent in the measurement system. This noise can have several sources oforigin and these are discussed in Chapters 3 and 4.
When an accelerometer is taken beyond its maximum acceleratlon llmlt theperformance becomes increasingly non-linear. At levels far in excess of themaximum limit the preloading ring might begin to slip down the piezoelectrlcelements and eventually short-circuit with the base, thus rendering the acceler-ometer useless. In practice this will never happen unless the accelerometer issubjected to shock levels well outside its specified operating range.
2.6.4. Tlansverse Sensitivity
When an accelerometer has acceleration applied at right angles to its mount-ing axis, there will still be some output lrom the accelerometer. On the acceler-ometer calibration chart the transverse sensitivity is quoted as a percentage ofthe main axis sensitivity. ldeally the transverse sensitivity ol an accelerometershould be zero, but in practice minute irregularities in the piezoelectric elementand in metal parts prevent this. At BrUel&Kjar particular attention is paid toselection of homogenous piezoelectric ceramics and to careful machining,polishing and lining up of accelerometer parts. Thus with proper handling and
30dB
20
b10
iooo
€.06{,n
-zo
I -- MountodI Besonance,i\ Frequoncy
Useful Frequency Rano€ - | /l \ fm
0,@ol 0,001 0,01 0,1 1 10
Proportlon of Mounted R€sonance Frequ€ncy zmgn
Fig.2.11. The relative response of an accelerometer to'main axis and trans-verse axis vibrations
29

mountlng on a flat, clean surface, the maximum transverse sensitivity of mostBr0cl& KJar accelerometers can be kept below 4oh ot the main axis sensitivityat 30 Hz (see Fig.2.11).
At lrequencies less than one sixth of the main axis mounted resonancelrequency transverse sensitivity can be kept below 10%. At frequencies justover one third of the main axis mounted resonance frequency it is difficult tospecify exact values of transverse sensitivity as transverse resonance oc-curs.This is indicated in Fig.2.11.
As if lustrated in Fig.2.'12, transverse sensitivity can be regarded as the resultof the maximum charge and voltage sensitivity axis of the accelerometer notbeing quite aligned with the mounting axis. Because of this there are directionsof maximum and minimum transverse sensitivity which are at right angles toone another and to the main sensitivity axis. lt is therefore the mo(imum valueof transverse sensitivity which is specified on the accelerometer calibrationchart. The direction of minimum sensitivity is marked by a red dot on theaccelerometer housing. This is a unique feature of BrUel& Kjer accelerometers.
It should be noted that the Delta Shear@ design, having constant stiffness inall transverse directions, has only one transverse resonance. Other sheardesigns may have two or more transverse resonances.
Axis of
- /l maximum
<2,3.et low
36$irivity
Aceleromet6rmountng
axls
II
neo oot II r '
Axis of maximumTransr€Gssensitivity
Tramie cemitivity - -(idcrlly zoro
tarilitivity rt thcc.librltion f ilqu.nctl
30
Fig. 2.12. Vectorial representation of transverse sensitivity

As the transverse resonance is just outside the useful operatlng frequencyrange of an accelerometer and with a peak amplitude just below the main axissensitivity, it is important that transverse vibrations and shocks are kept wellbelow the specified main axis continuous vibration l imits. Slmllarly, dropping orbanging accelerometers can subject them to large transverse shocks welloutside practical design limits and permanent damage can be caused to thepiezoelectric elements inside the accelerometer.
The following precautions can be taken against severe transverse vlbratlons:
1. Align the red dot in the direction of maximum transverse acceleratlon.
Fig.2.13. Chart for determining the accelerometer transverse sensitivity in anydirection when the maximum transverse sensitivity is known
s$!oo)
S- l'r'tZVzl/-d--=:-N-As' zvlrtl '?S-,/Z/tlZ/Zj€ZalffN-"s- ,ralralzzz -a
S //Z<r,/r/r'ztxlrr:/€t-7tr-N Ao
/a'6
a
"tg,oo
oO
;180"El
a
oooo
1
oa
aaoaaa
oooo
oeoooo ss
oo ssoo
31

2.
3.
Uae a mechanical filter to filter off vibrations in dlrections other than themaln axis.
Use the chart in Fig.2.13 to calculate the sensitivity to vibrations in anydlrection from the maximum transverse sensitivity.
Erample. At 60" to the maximum sensitivity axis of 0' the chart indicates atransverse sensitivity factor of 0,5. (This could also have been calculatedfrom the cosine of the angle). Therefore an accelerometer having a maxi-mum transverse sensitivity of 2Vo will have a transverse sensitivity at 60" of:
0,5x2o/o=1o/o
2.7. PHASE RESPONSE
The phase shift of an acceleromet€r corresponds to the time delay betweenthe mechanical input and the resulting electrical output. lf the phase is notconstant at all frequencies in the operating range, the phase relationshipbetween various frequency components of a vibration signal will be altered withrespect to each other, resulting in an electrical output that is a distortedrepresentation of the mechanical input.
Fig. 2.14. Accelerometer amplltude and phase response as a function of fre-quency
32
30
dBBq
zo &.€a
roFo
o€
o
oIE
Eeo
@E
Propo.tlon of Mounted Besonance Frequency fn

The sensitivity and phase responses of an accelerometer are shown inFig.2.14. At frequencies below the mounted resonance the phase shift intro-duced is insignificant. At frequencies very close to the resonance, the motion ofthe seismic masses lags that of the base and phase distortion ls Introduced.However, with Br0el & Kjar accelerometers small resonance damplng factorsensure thet the frequency range over which resonance occurs ls relatlvelynarrow, and therefore the accelerometer may be operated well beyond lts rateduseful frequency range without introducing phase distortion.
Nevertheless, it is also necessary to consider the phase linearity of thecharge or voltage preamplifier used, especially if integration networks andother filters are in use. This is especially important when measuring transientvibrations and mechanical shocks.
2.8. TRANSIENT RESPONSE
When measuring transient vibrations and shocks particular attention must bepaid to the overall linearity of the system as otherwise the reproduced tran-sients will be distorted. Piezoelectric accelerometers are extremely linear trans-ducers and wlll reproduce a wide range of transients without problem. Theaccelerometer is the least frequent source of error when poor measurementsare made of transients. More often it is the preamplifier and any associatedfilters and integration networks which cause the problem. However, to ensurethe accuracy ol the measurement it is necessary to consider the followingtransient phenomena.
2.8.1. Leakage Effects
In Fig.2.15, a distortion has taken place in the waveform of a quasi-staticacceleration pulse, such as might be encountered during a rocket launch or in afast elevator. The distortion is caused by the accelerometer and preamplifiercombination operating in the incorrect frequency range and can be explainedas follows:
When the accelerometer is subjected to a quasi-static acceleration a chargeis developed on the piezoelectric elements. By virtue of the elements capaci-tance, this charge is stored in the element and prevented from "leaking away"by the very high leakage resistance of the accelerometer. However, due to thefinite leakage time constant of the accelerometer and the input impedance andlower limiting frequency setting on the preamplifier, some charge leaks awayand this resulls in a negative slope waveform as seen between points A and B.When the acceleration stops, the charge changes a corresponding amount anddrops below the zero level to point C before rising back up to the zero level
33

6oooe
Fig. 2.15. The distortion ot a waveform of a quasi-static acceleration inputcaused by "leakage" associated with the accelerometer and pream-plifier
again at point D. The rate of exponential change between A and B and betweenC and D is the same and is determined by the time constant set by theaccelerometer and preamplifier.
This effect causes errors in the measurement of the peak amplitude of theacceleration and is caused by the accelerometer being used with the wrongLower Limiting Frequency on the preamplifier. Measurement errors of peakamplitude due to leakage may be kept to within 5% by ensuring that the -3dBLower Limiting Frequency of the preamplifier is less than 0,008/T, where T isthe period of a square waye transient. For measurements on half-sine tran-sients the Lower Limiting Frequency must be less than 0,05/T.
The frequency bandwidth of the entire measurement system required tomeasure such transients with specified accuracies can be found from Fig. 2.16which also includes the upper lrequency requirement because transient signalshave higher frequency components which must also be reproduced withoutdistortion.
The distortlon of the waveform of transients, and in particular quasi-staticvibrations, caused by using the accelerometer with the incorrect frequencyrange can appear simllar to the distortion produced by other phenomena suchas zero shift (see sectlon 2.8.3). lt must be understood that the causes, andhence solutions, of the problems are different.
34

Frequ€ncy R6ponseshould be flat witr|in th6e limib
0.1
5
- '- '0.1 0.2 0.5 1 2 5 10 20 50 rm zfi
Puls Duration {ms} 6ffio/l
Fig. 2.16. Vibration system -3dB lower and upper limiting frequencies requiredfor acceleration measurements of pulses of duration T keeping ampli-tude measurement errors less than 5 and 10% respectively
2.8.2. "Ringing"
This term is used to describe the distortion produced by an accelerometerwhich is being used to measure transient vibrations outside its useful frequencyrange. An example of the resulting distorted signal is shown in Fig.2.17. Theresonance ol the accelerometer is excited with high frequency vibration com-ponents and this should be avoided. A first warning of ringing might be given byan overload indication on the preamplifier.
"Ringing" causes errors in the measurement ol peak vibration amplitude. For5% peak measurement error the accelerometer mounted resonance frequencyshould not be less than'10/T where T is the length of the transient in seconds.
35

Fig. 2.17. Waveform distortion due to "ringing"
The accelerometer resonance can be damped to reduce the ringing and makeoptimum use of the measurement system dynamic range and bandwidth. Thismay be achieved using a mechanical filter for mounting the accelerometer (seesection 4.5) or by applying the accelerometer signal to a preamplifier incorpo-rating a Iow-pass filter. In the latter case the filter must have a high frequencyattenuation slope of 12dBloctave and a -3dB upper limiting frequency f,corresponding to approximately half the accelerometer mounted resonancetrequency f^(i.e. f, = 0,5 f.).This gives the system response shown in Fig. 2.18'enabf ing a half-sine wave transient of duration f = 1 | f^ to be measured withless than 10% amplitude error.
Fig. 2.18. Low pass filter or preamplifier response required to damp mountedresonance lrequency f. of accelerometer lor measurement of halfsine type shock pulses of duratlon T=1/f^ seconds with less than 10%amplltude error
36
, / , \ \ .
Filter R6ponse -\
Uppcr Limiting Frequency fu = 0,5 f-----lr
\ \. \
Acoeleromet€rrespons with
Filter
Attenuatlon Slope = 12 dB/Octave
0,1 0,2 0,5 1
Proportlon of Mounted Reeonenc€ Frequency f.

2.8.3. Zero Shilt
Consider the accelerometer output signals in Fig.2.19 resuli lng from twoidentical half sine pulses. In both cases distortion of the waveform has beenintroduced by the accelerometer. The measurement dynamic levels were veryclose to the maximum acceleration limit of the accelerometer.
Fig. 2.19. Accelerometer and preamplifier output resulting from a hatf-sinepulse of such a high level that "zero shift" has been introduced
lf the piezoelectric elements are not considered to be perfectly elastic materi-als, then when the force on the element is suddenly decreased the moleculardomains may not all return to the state they were in before the shear force wasapplied. Therefore, when the force is removed the elements stilt produce acharge which slowly decays with time as the preamplifier output returns to zeroat a rate determined by its Lower Limiting Frequency. This phenomenon occursrandomly and with random sign.
The time taken for the zero shift to disappear may be a factor of 1000 timeslonger than the length of the original pulse. Therefore, large errors result ifintegration networks are used.
A mechanical filter can often guard against zero shift effects.
REMEMBER: Zero shift, "Leakage" and "Ringing" are only problems when theaccelerometer is used outside its useful operating ranges.
ofo
ooEooooq
ofo
ooEIooq
37

3. VIBRATION PREAMPLIFIERS
Vibration Preamplifiers perform the essential role of converting the highimpedance output of the piezoelectric accelerometer into a low impedancesignal suitable tor direct transmission to measuring and analyzing instrumenta-tion.
In addition to this, the preamplifier may also perform some, or all, ot thefollowing roles:
1. Matching measuring instrumentation input sensitivity to that of the acceler-ometer output.
2. Amplification of the vibration signal to obtain a desired overall systemsensitivity.
3. Integration of the accelerometer output to obtain velocity and displacementsignals.
4. Warning of overload at both the input and output of the preamplifier.
5. Low and high frequency filtering to reject unwanted signals.
The complete range ol general purpose Br0el & Kjer vibration preamplifierscan be seen in Fig. 3.1. Br0el& Kjar preamplifiers are available in the followingforms.
Fig. 3.1. The range of vibration preamplifiers available from Br0el&Kjar

1. Stand-alone units which perform most of the roles mentloned above. Theycan be either battery powered or mains powered. A summary of theseinstrument types is given in Appendix E.
As part of the input circuitry of measuring instruments such as vibrationmeters or in the form of input modules for tape recorders etc. A summary ofthese instruments is found in Appendix F.
Line-drive preamplif iers which are considerably different from both (1) and(2). They are miniature devices containing only the "front end" of a conven-tional preamplif ier in a miniaturized form which is either built into, mounteddirectly onto, or placed near to the accelerometer. Only one two-conductoror coaxial cable is required for both signal transmission and power supply.Line-drive preamplifiers are fixed gain devices with no controls.
3.1. PREAIIPLIFIER DESIGN AND OPERATION
There are two basic types of preamplifiers which may be used with piezoelec-tric accelerometers.
1. Charge Preamplifiers. These produce an output voltage proportional to theinput charge. They do not amplily charge!
2. Voltage Preamplifiers. These produce an output voltage proportional to theinput voltage.
Charge preamplifiers are generally used in preference to voltage preamplifi-ers. This is reflected in the current range of Br0el & Kjar preamplifiers whereonly the Type 2650 offers both a charge and voltage input. This preamplifier isdesigned for use in accelerometer calibration rather than general vibrationmeasurements. The distinct advantage of charge amplifiers is that both veryshort and very long cables can be used without changing the overall sensitivityof the system. However, when a voltage preamplilier is used a change in cablelength will necessitate a recalibration of the system sensitivity. This is dis-cussed in section 2.6.1 .
3.2. CHARGE AMPLIFIERS
A charge amplifier uses an operational amplifier input stage. The configura-tion of the operational amplifier with the capacitor in the feedback loop oper-ates as an integration network and integrates the current at the input. This inputcurrent is the result of the charge developed across the high impedancepiezoelectric elements inside the accelerometer. The amplifier works to nullilythis current and in doing so produces an output voltage proportional to thecharge.
39

3.2.1. Chtrge Sensi t iv i tY
Fig. 3.2. shows an equivalent circuit for a piezoelectric accelerometer con-nected to a charge preamplif ier. The nomenclature below refers to this figure.
Acc€lerom€t6r Pr€amolifler
Fig. 3.2. An equivalent circuit for an accelerometer and cable connected to acharge amplifier
Q"
caR,ccRbcpRPctRl
Avo
= charge generated by the piezoelectric elements (propor-tional to the applied acceleration)
= capacitance of accelerometer= resistance of accelerometer= capacitance of cable and connectors= resistance between cable screen and centre conductor= capacitance of preamplif ier input= resistance of preamplif ier input= feedback capacitance= feedback resistance- gain of operational amPlif ier= voltage output of the preamplifier
Normally the resistances of the accelerometer, preamplifier input and feed-back path can be kept very high. Consequently the circuit in Fig.3.2 can be
40

<__vc
tIlvo
I
Fig. 3.3. Simplified equivalent circuit of an accelerometer connected to acharge preamplifier
reduced to the one shown in Fig. 3.3 where the total capacitance and currentsflowing are shown
Ct = Ca+ Cc+ CpI = total current flowing out of the accelerometerIr = current from Ctlc = current in the feedback loop of the operational amplifierVc = voltage across feedback capacitance
The input and output voltages, V,and Vo are related by the equation
Vo = -AVt
Furthermore V" can easily be calculated since
vc -vo-vt=vo-+=(r+l tn_A \ AI -
An ideal amplifier has zero input current. Kirchhoff's laws apply to thecurrents shown in Fig.3.3.
l+ l t+1"=O
These currents can be defined in terms ol other circuit parameters. , isrelated to the charge produced by the piezoelectric elements.
, dQ,,=-
dt
tc = c,+ = (r * I\ ",!!"dt \ A, dt
4'l

By substituting these expressions into Kirchhoff's equation the current fromthe accelerometer is found
This equation can be solved by integration. Constants corresponding to anyDC offset voltage initially present at the amplifier output are assumed to bezero. Such offsets will disappear rapidly as the preamplifier is in use. Thesolution to the equation then becomes
dV, 1 dV^l i =-C, '= C, "' 'dt A dt
# =-(r .*) e,#-*" ,#
(21v^ = -Q"-ct
vo =- , Q"
( r**) c,* lc,A' A
When the magnitude of A is considered (-reduced to the simple expression
(1)
105) the solution can be further
It is clear from this that the output voltage is proportional to the input chargeand therefore to the acceleration of the accelerometer. The gain of the pream-plifier is determined by the feedback capacitance.
The input capacitance has no effect on the resulting output voltage because,in the ideal case (A - *r, the input voltage is zero.
vt = -*=oA
Consequently, the finite input resistance has no effect on the output voltage.This means that only the currents from the accelerometer and the feedbackcapacitor flow at the input point and these currents are equal in magnitude butare of opposite polarity. lt now appears that all the charge flows from theaccelerometer to the feedback capacitor.
So much for the simpler models but what about a more realistic modet whichtakes in the contributlons of R", Ro and Fo? A model of this kind ls shown inFig. 3.4 and the combined reslstances, Fln and capacitances, Cn at the input areshown. The circult now incorporates all the elements of Fig.3.2. The equationsnow become
1111=-+-+_Rt R" Rb Rp
42

dv^ v^l^ - Q,-1 '-dtR,
vo --AVt
vc = (1 + *)r"
= (1+*r[ " ,#.#)r , = -" ,0 ' ' - v ' =af c, lL *Lf' 'd t Rt AL dt RrJ
# = - (1 . f r 1 " ,#. #,1- *1",#. El{-V"-_-.+
Fiq.3.4. Equivalent circuit for an accelerometer connected to a charge pream-plitiel
This equation cannot be solved using simple integration as in the previousmodel. However, by assuming that the voltages and currents vary harmonicallywith time a solution can be obtained. Once again the DC terms and initialconditions which disappear rapidly can be ignored in the analysis. The solutionbecomes
7 1rt- v.1 1r ,_1iaQ. = - (1*T)L iavocl . ; ,1-71irro",*-^, ,
43

Thls can be rearranged to obtain the output voltage Vo
Q"(3)vo
Again assuming that both A and.Fyare very large the same relationship asbefore is derived
lf R' is finite then the expression can be written to include its effect
Q"
( ' . * ) ( ' , * ^")* ] (" ,
. ;e)
a(r+#)
v^ = -Q""ct (4)
(5)vo
Hence, with Q, being proportional to the acceleration of the accelerometer,the overall sensitivity of the accelerometer/preamplifier combination can becontrolled by varying Cr. In addition, the final equation shows that by varyingthe time constant of the feedback loop the low frequency response of thecharge amplif ier is controlled.
3.2.2. Lower Limitang Flequency
Accelerometers are self-generating devices and therefore have no true DCresponse. From the fundamentals of physics it is obvious that no power isobtainable from a device without some power input to that device. A staticforce on the piezoelectric elements does not provide any input power.
To fully understand the low frequency performance of charge amplifiers (andvoltage amplifiers) it is necessary to understand the operation of simple RCnetworks.
A capacitor is a charge storage device. lts capacitance is defined as thequantity of charge stored at a unit voltage across the capacitor. The followingequations define the relationships between the voltage, V, current, { charge, Q,
44

and capacitance, C, for an ideal capacitor, or in this case, for the plezoelectricelements.
lf an ideal capacitor is charged to a certain voltage, yo the voltage appearingacross it will be stored. This is because an ideal capacitor has perfect DCisolation (i.e infinite leakage resistance). However in a real capacitor theisolation resistance is finite. The stored charge leaks away and the voltagedrops exponentially at a rate determined by the time constant z of the system.This is i l lustrated in Fig. 3.5.
l=r=RC
Fig. 3.5. The exponential decay of the voltage across a capacitor demonstatingthe concept of the "time constant", r
For measurements on sinusoidal signals the time constant z has a particularsignificance. lt affects the low frequency perlormance of the system. Take thecharge source (the piezoelectric elements) and load it with several RC net-works. This is shown in Fig.3.6. The combined resistances and capacitancesare represented as single components.
Using the delinitions given above the circuit equation can be simply written.
o=-c
=dQdt
^dv= v-dt
-9e=!*c9!dtRdt
45

Fig. 3.6. Equivalent circuit of an accelerometer loaded by the eguivalent capaci-tance and resistance of the cable and preampllfler. This model can beused to examine the low frequency performance of preamptiliers
Once again if the currents and voltages are assumed to be harmonic func-tions, the following can be derived
l ' . |u)c
ot ' l
I t+-- : -16, j r r ,
o(r +i l1' @t,
t1r1t *
,ar) c
DC values and initial conditions have been omitted to make the analysisslmpler. The complex expression shows that the output has a magnltude I Vland phase angle { relative to the input given by
tanS = 1@t
olt+*f
( ' . (*) ' ) "
When 0r7 = 1, tand = 1, Q = 4Soand V= I12c
The phase and amplltude relatlonship between input and output voltages as afunction of arz is shown in Flg. 3.7. The frequency when sn = 1 (prfRC = 1) is
t=1=1' 2rRC 2rt
46
o
tv l

ooEL
IIII
oEEo6EoE6otr
AT
Fig.3.7. The phase and amplitude relationship between input and output volt-age as a function of ssr
This is normally referred to as the Lower Limiting Frequency (LLF) and is
characterized by a 3dB drop in the output signal level accompanied by a 45'phase change.
To return to charge preamplifiers it is seen from equation (3) In section 3.2.1
that the LLF is determined by the time constant of the feedback circuit l.e.
rf ROr. The phase difference between the input and the output is normally
-180'(phase inversion) and at the LLF it is further delayed by 45o. From (3) it
can also be seen that the resistive input load will not change the LLF until it
becomes comparable lo &l A. This means that provided that Cr and Cr are of a
slmilar magnitude, the influence ol the load has been reduced by a lactor of A
compared to the simple RO-network discussed.
Example: l l an LLF of 1Hz is required, what value lor f l l is requlred?
Assuming that A is approxlmately 105 and Cy is about 1nF then
2trC1
2zr 1 105 10-s= 1,6 kO
This example illustrates the immunity of the Lower Llmiting Frequency of acharge amplifier to changes in the input load conditions. lt would be verydifficult to make the combined resistances of the accdlerometer, connectorsand preamplifier input drop to the magnitude indicated in this example. Evencomplete immersion of the accelerometer in water would not cause this.
Rl
Rt
47

BrUel & Kjer Charge Preampliliers offer LLFs down to fractions of a Hertz. Alow freqgency capabil ity is necessary for the measurement of long durationlmpulses and quasi-static vibrations. Such mebsurements however are onlyposslble using Delta Shear@ accelerometers because other accelerometer de-slgns normally produce environmentally induced low frequency noise which wil lmask the vibration related output.
3.2.3. Gapacitive Loading of the lnput by Accelerometer Cablee
It has already been shown that the output from a charge preamplifier isdetermined only by the feedback capacitance, C, and the charge produced bythe piezoelectric elements O". In a typical charge amplifier the value of Cr isnormally between 100pF and 10nF but is typically 1nF giving an output sensi-tivity of 1 mV/pC. This will not change unless C, becomes comparable lo AC,. Ashort example will demonstrate the extent ot the charge amplifier's immunity tochanges in cable capacitance.
Example What is the maximum cable length that may be used if the chargesensitivity of the accelerometer-preamplifier combination must not change bymore than 1%?
Assuming C1 and C" are 1nFtion 3.2.1
vo
ct
and A is 105 then from equation (1) in sec-
Q"
11
1t+ o)Q+ oCt= 0,01 (A + 1) Cr = 0,01 (1os+ 1) 1 nF = 103nF = 1 pF
This capacitance corresponds to 10000m of cable of capacitance 100pF/m.
Large capacitive loading of the preamplifier input can have a slight effect onits high frequency performance. This is due to the fact that the gain of opera-tional amplifiers decreases at high frequencies. Consequently, the assumptionthat A is infinite in the analysis leading to the definition of charge sensitivity, isless accurate. The output of the charge amplifier is reduced as shown by theequation for the output voltage derived earlier
Q"vo
48
( r . *) ( " , . t* , \ .*(c,* #)

Example: Assume that the gain A is reduced to 103 at high frequencies and thatthe feedback capacitance Cr is 1nF. An input load of 20nF corresponding to200m of 100pF/m transducer cable exists. This load wil l give a sensitivity dropof 5% in the frequency response curve and therefore this effect wil l not normallybe of any significance.
Fig. 3.8 shows how the increase in input capacitance caused by very longcables effects the high lrequency response of a Bruel & Kjer charge preampllf l-er. For specific cases consult the relevant Instruction Manuals.
Fig. 3.8. lnfluence of the input load capacitance on the high frequency responseof a Br0el&Kjar charge amplifier
3.2.4. Gharge Attenuation
Although the addition of a further shunt capacitance wil l have negligibleinfluence on the charge sensitivity, the addition of a series capacitance willreduce the eflective transducer output charge. This is sometimes desirablewhen measuring high level vibrations using a high sensitivity accelerometer.The input to the preamplifier can be overloaded by the large charge. By addingcarefully chosen calibrated capacitances in series and parallel with the acceler-ometer, the charge at the input can be attenuated. This is shown in Fig. 3.9.
Alternatively ready-made charge attenuators are available from BrUel & Kjer.These are available under the numbers W80726'and W80778- which provide20dB and 12dB of attenuation respectively.
' These items are developments of the Brtiel&Kj€r Systems Engineering Group and are notstandard production items. Please contact your local representative
200
l to l.l.l
rF
t\ 10 x
\ \
t0\ ,llNi."l
\
\20k 50k l (x)k 200k
Frequency Hz
^ffiza
o
E
1k 2k 5k
49

^C2v ;:--:-;---:=- uwtrvtrv2
Fig. 3.9. The design of a charge attenuator
3.2.5. Noise in Charge Amplil iers
A model of the internal noise sources of an operational amplif ier is shown inFig. 3.10. This model does not include the effects of external noises such astriboelectric effects, groundloop voltages and electromagnetic pick-up in ca-bles. These wil l be examined in section 3.6.
= equivalent impedance of the accelerometer and cable= equivalent impedance in the feedback path= noise voltage= noise current= output voltage
In the high impedance case of the piezoelectric source and mainly capacitivefeedback the current noise is negligible. As seen in section 3.2.1 there is avirtual ground and no current flowing at the inverting input of the operationalamplifier. Therefore
, -€n en-Vot=-
zt zt
ztzteninvo
,ZI \*z)vo
50
= " ,
(1

Fig. 3.10. Equivalent circuit for an accelerometer connected to a charge pream-plifier. All the noise sources inside the preamplifier have been repre-sented by a voltage source and a current gource at the input
To convert this into an expression for the signal at the source it must bedivided by the amplification taclor, Zs / Z,
es =-v,+r Z, t
enl l+- ! l.Zt ,
In the mid-frequency range the impedances at both the source and at theoutput are mainly capacitive so
zt -C,4ct
where
Ct = Cr+ Cc+ Cp
es =-€n(r .*)
Furthermore this can be converted lnto an equivalent charge noise, gr on thesource capacitance Cr by multiplying it by Cn
Qt =os'Cr=-€n(q+C)
51

o
!Eolro
z
Input Source Capacitance nF [C" + C"]
12 5 10 ?O 50 lm 200 5(x)
Aeelerometer Cable (90 pF/m) length (m) [o C"] ,?o:81
Fig. 3.1 1. Broadband 2 Hz to 100 kHz noise from a Brhel & Kiar charge amplitieras a function ol input source capacitance
Fiq.3.12. Third octave analysis of the noise produced by a Br0el&Kier chargeamplitier

From this it is seen that although the sensitivity and LLF is not changedsignificantly by capacitive or resistive loading of the input the charge noise willincrease as C, and Cr increase. Some decrease in signal-to-nols€ ratio istherefore inevitable when using very long input cables. Fig.3'11 shows thedependence of the noise level at the input as a function of input capacltance fora particular Br0el&Kjer charge amplif ier. Other types exhibit slmllar clepen-dencies.
Preampllfler Noise
Fig. 3.13. The relationship between input resistance and noise for a chargeamplifier
53

As Cy determines the gain of the preamplif ier there wil l be higher noise atlower gain settings which require a higher feedback capacitance. The use ofhigh gain accelerometers and high gain on the preamplif ier wil l produce bettersignal-to-noise ratio.
It must be remembered that the cable itself tends to produce noise whenexposed to mechanical vibrations. In general therefore, BrUel &Kjer mininoisecables should be used. This is especially true when low level measurements arebeing made. The cables should be fixed securely. Consult section 4.6.
At low frequencies (<100H2) the noise f rom the ampl i f ier wi l l normal lyincrease in inverse proportion to the frequency. This is a property of theoperational amplif ier and can normally be reduced using a high pass fi l ter.Fig. 3.12 shows a third octave analysis of the noise produced by a Br0el & Kjercharge amplif ier.
lf the resistive load at the input drops to below 10M0 the noise from thecharge amplif ier wil l start to increase with the most significant changes at lowfrequencies. However, any analysis of the sources of this noise requires adetailed knowledge of the input components and their coupling. Fig. 3.13 showsan experimentally derived relationship between the narrowband preamplif iernoise and the input resistance. The noise is expressed as volts per square rootof f i l ter bandwidth.
3.3. VOLTAGE PREAMPLIFIERS
A voltage preamplif ier detects the vibration induced changing voltage acrossthe accelerometer's capacitance and produces an output voltage proportionalto this. Voltage preamplif iers are simpler in their design but suffer operationaldisadvantages when compared to charge preamplif iers. Because Br0el & Kjeronly produce one preamplif ier which has the option of a voltage input, theextent of the explanation of the operation is accordingly reduced and outl inesare grven.
54

3.3.1. Voltage Sensitivity
Fig.3.14 shows the equivalent circuit for an accelerometer connected to avoltage preamplif ier. By comparing this circuit with that shown in Fig. 3.2 it canbe seen that they are identical except for the connection of the operationalamplif ier. In this case the operational amplif ier is connected as a voltage bufferwith a gain of 1 (yo = Vl.The very high input impedance is represented by Coand Ro. The nomenclature is the same as in Fig. 3.2 and Fig. 3.3.
In Fig. 2.8 it was shown that when the accelerometer is not loaded by a cableand preamplifier it produces an output voltage, V" equivalent to
Q"Va=^
lJa
F, is a very high parallel resistance and can therefore be ignored. Fromsection 3.2.2 the voltage at the preamplifier input can be written directly
V,-Q'' Ca+ Cc+ Go
and therefore
caVo= Vi= V"-- :
-v"+ v"* Co
This expression can be expressed in terms of the charge sensitivity Sqa[pclms-2] and voltage sensitivity Sn" [mV/ms-2]
c=SotC"+ C.+ CD
- s", c'(ooqZ;m
Accol€rometer Ceble Proampllflet
Fig. 3.14. Equivalent citcuit of a voltage amplilier using a piezoelectric acceler-ometer es a voltage source

Where Sn roorn, is the open circuit (unloaded) accelerometer voltage sensitiv-Ity.
Because So4 the charge sensitivity and C" are accelerometer constants thevoltage sensitivity, Sn" is.dependent on the cable capacitance. This is obviouslyan undesirable sltuation because an accelerometer can only be used with thecable with which it was factory calibrated if quoted voltage sensitivities andvoltage preamplifiers are used. lf the cable is changed then a recalibration isrequired. A short example will help to illustrate this.
Erample. While taking a vibratlon measurement a requirement has arisen for alonger, stronger cable. The existing cable is a standard Br0el&Kjar 1,2mcable AO0038 and a suitable replacement is the 3m reinforced cable AO0122.Calculate the new voltage sensitivity for this combination:
Typical capacitance of cable AO0038 = 110pFCapacitance of accelerometer (including cable) = 1117pFCharge sensitivity = 9,8 pClms-2Voltage sensitivity = 8,76mV/ms-2
From this the capacitance of the piezoelectric element alone C, can becalculated
c' = 1007 PF
The typical capacitance of accessories cable AO0122, C" is 260pF. Hencethe new voltage sensitivity is easily calculated
9,8 . 10-12
(1007. 10-11 + (260. 1On2)
= 7,73mY/ms-2
The voltage sensitivity has dropped 11% simply by changing the cable.
This dependence of sensitivity on input capacitance is not only extremelyinconvenient when different cables are used but it also means that the signal-to-noise ratio is reduced with longer cables. With extremely long cables only asmall fraction of the unloaded voltage will be present at the input of theamplif ier.
3.3.2. Lower Limiling Frequency
The treatment of low frequency performance given in section 3.2.2 can beused again to show that the Lower Limiting Frequency (-3dB point) is ex-pressed by
56
sn

where
2rR,C,
= Ca+ Cc+ Cp
To ensure that the LLF is low enough to provide useful operation at frequen-cies down to 1 Hz or less the RC product must be very large. Theoretically thereare two ways of doing this;
1. Make the total capacitance as large as possible. As C, is an accelerometerconstant then C" must be increased by adding more cable. This is not apractical solution as this will result in a decrease in the voltage sensitivityand a loss in dynamic range.
2. Design a preamplifier with a high input resistance. This is the approachtaken with voltage preampllfiers. Howbver, if the input resistance is reducedfor any reason then the LLF will increase. This can happen if moisturepenetrates the output connector of an accelerometer. The leakage resis-tance is lowered and this shunt resistance across the input lowers the inputresistance.
3.3.3. Noige in V6ltage Preamplifiers
Unlike the noise produced by a charge preamplifier, the noise produced by avoltage preamplifier is independent of input capacitance and hence the gainsetting and cable length do not change the noise at the input. However this isnot a real advantage as the signal-to-noise level worsens as the voltage sensi-tivity decreases wlth increasing cable length.
3.4. PREAMPLIFIER OUTPUT CABLES
In the case of both charge and voltage amplifiers it is important that they arecapable of providing sufficient output current to drive a measuring instrument.The voltage necessary to produce this drive current is derived at the output ofthe operational amplifier and is developed across the impedance of the cable.
When high capacitance loading is present at the output of the preamplifier alimitation to the maximum output voltage swing can occur. This will only causea problem when very long cables and high frequency performance are required.For example, at 10kHz this l imitation wil l arise when the load exceeds 20nF(corresponding to 200m of 100pF/m cable) for the preamplifier shown below.
111= -+R8 Rb Rp
ct'l
Rt

In some cases the l imitation is directly caused by a maximum output capabil i-ty on the preamplif ier. lf the maximum output c.urrent is 8mA (typical) and theload is 20nF then an impedance of approximately 7960 at 10kHz is obtainedand a peak voltage of 6,37V results. Therefore if the combination of vibrationlevel, accelerometer sdnsitivity and preamplifier sensitivity should produce alarger output than this, attenuation occurs. The effect of output cable capaci-tance on the high lrequency response of a BrUel&Kjer charge amplif ier isshown in Fig. 3.15.
Fig. 3.1S.Typical inlluence of output load capacitance on the high frequencyrcsponse of a Brriel&Kjer Charge Preamplilier
3.5 LINE-DRIVE SYSTEMS
A line-drive amplitier is essentially the "front-end" of a charge or voltageamplif ier which can be built into an accelerometer. The range of Bruel &Kjarline-drive accelerometers can be seen in Fig.3.16. A separate l ine-drive ampli-fier can also be attached directly to a conventional accelerometer or placed ashort distance from it. Remote usage of the Type 2644 has the advantage thathigher levels of vibration can be measured, and at higher temperatures, com-pared to the line-drive accelerometer built into or mounted on the accelerome-ter. The Br0el&Kjar Line-drive Amplif ier Type 2644 can be seen in Fig.3.'t7.
The power for a line-drive system must be derived from an external line-drivepower supply. For driving the BrUel&Kjer line-drive accelerometers and pre-amplifier the Line-drive Supply Type 2813 is used. This is a battery poweredinstrum€nt with the capabllity of powering up to two line-drive accelerometerssimultaneously. The Type 2813 can be seen in Fig.3.18. The voltage output of
58
t
E
E
+5dB0
-c
-10
-15
-20
-30
-35
-402(n lk 2k 5k 10k 20k 50k l (nk 2mk
Frequercy Hz 76uN
\ \
\ \ ,n l \
\
\
t \x)nF
ilnl ,l ") t0
t\nF
\

Fig.3.16.Bruel &Kjar Line-drive accelerometers. (From lett to right) Types4390,8317 and 8318. The photographs are scaled 1:1,1:1, and 1:2respectively
Fi9.3.17. Attaching the Line-drive Amplitier Type 2644 to the top of anaccelerometer

Ext.Power
10- 15{,r:\
""".r t f#;,r Onry wfth
Rachrtgcaua 8ttt..br
Fiq.3.18.2 channel Line-drive supply Type 2813
the Type 2813 is used as an input into measurement and analysis equipment. Asimilar l ine-drive supply is also built into several BrUel &Kjer vibration andsignal analyzers.
The practice of building the preamplif ier into an accelerometer is by nomeans recent. The first such systems were designed with the objective ofimproving the performance ol very low capacitance and low sensitivity acceler-ometers which used quartz as the piezoelectric element. Such accelerometerswere very sensitive to noise generated by the cable (triboelectric noise) andnoise picked up by the cable (electromagnetic noise).
Although modern accelerometers using piezoelectric ceramics and low-noisetransducer cables can solve most of the earlier problems, it can still be advan-tageous to use built- in preamplif iers, or l ine-drive preamplil iers mounted closeto the accelerometer in potentially "noisy" environments. Consequently l ine-drive preamplifiers are often used in industrial measurements. Here they havethe advantage ol driving low impedance signals along extraordinarily long andinexpensive cables. The sensitivity of such a system to a combination of groundloop voltages and cable noise is lower compared to any other configuration ofvibration preamplif ier. This wil l be shown in section 3.6.
Some line-drive designs have suffered poor performance due to the inade-quacies of the built-in electronic circuitry. However with the advances in thick-fi lm circuit techniques employed at BrUel &KJer, high quality and high perfor-mance preamplif iers are built in to Br0el&Kjar accelerometers.
The addition of electronics into an accelerometer does however restrict thetemperature and dynamic range of the accelerometer into which they are built.This also applies to line-drive preamplifiers mounted onto an accelerometer.The added mass of this preamplifier must also be considered when makingmeasurements on l ight panels or similar structures.
60

Different line-drive designs have been used but today almost all systems usea two-conductor cable which l inks the preamplif ier to the power supply andcarries both the power and the vibration signal. The power supply ls either aconstant current or constant voltage source. The two systems are nof inter-changeable. The Br0el & Kjar line-drive system uses a constant voltage sourceand power supply current modulation is used to transmit the vibratlon signal.This system will be shown to perform better than the constant current sourcesystem.
3.5.1. Brtlel&Kjer Line-drive Accelerometer and Line-drive Supply
The sensitivity of a line-drive accelerometer is expressed in terms of thecurrent sensitivity (pAlms-2) at the output of its built-in line-drive amplifier. Thelinal sensitivity at the output of the power supply is simply obtained by multiply-ing this sensitivity by the power supply sensitivity (mV/pA) to obtain mV/ms-2
For example, a l ine-drive accelerometer with a sensitivity of 3,16pAlms-2connected to a Line-drive Supply Type 2813 gives an overall sensitivity of3,16 mV/ms-2.
3.5.2. Br0el&Kjar Line-drive Amplif ier and Line-drive Supply
The charge sensitivity of the accelerometer (pO/ms-2) is first converted into acurrent sensitivity (pAlms-2) at the output of the Type 2644 via the sensitivity ofthe 2644 (1tAlpOl. Then the process continues as in the last section by multiply-ing the output of the Type 2644 by the power supply sensitivity to obtainmv/ms-2.
For example, an accelerometer of sensitivity 3,16pO/ms-2 when used with aType 2644 and 2813 gives the same sensitivity as in the last example, i.e.3,16 mV/ms-2.
3.6. COiIPARISON OF THE SENSITIVITY OF DIFFERENT VIBRATIONPREATIPLIFIER SYSTEMS TO EXTERNAL NOISE SOURCES
ln multichannel measurement set-ups where ground loops and long cablesare often a problem, it is important to know the comparative sensitivity of themeasurement system to external noise and to select the best system for thatenvironment.
The following systems will be compared.
1. Normal grounded (i.e non-insulated) accelerometer with a charge preampli-f ier.
61

2. Grounded accelerometer using a charge amplif ier with a ,,f loating' input.
3. Brriel &Kjer l ine-drive system using constant voltage supply and currentmodulation.
4. Br0el& Kjer l ine-drive system using constant voltage supply, current modu-lation and a "floating" input.
5. voltage line-drive system using constant current diode supply (not suppliedby Bruel& Kj@r).
6. Balanced accelerometer using a differential charge preamplifier.
In addition to these systems the benefit of using an insulated mountingtechnique (i.e. mica washer)'or an accelerometer with an electrically insulatedbase wil l be examined.
In the following analysis the noise at the input is assumed to be caused by acombination of two effects.
1. Triboelectric Elfect. All coaxial cables wil l generate a iharge if theirmechanical movement is not restricted. For the purpose of comparing theresults in the analysis, this effect will give rise to a charge noise q, of 100 pcin the cable in each of the cases below. The triboelectric effect can be' modelled as a perfect charge source in the analysis. This phenomenon wil lbecome more apparent if the cable is not clamped down onto the vibratingsurface and low noise cables are not used.
Note: A triboelectric charge of 100pc is an extreme case and is only usedhere as a means of comparison between the systems.
2. Ground-loops. In large machines there is always the possibil i ty that themachinery housing may not be at earth potential. consequenily the acceler-ometer case and cable screen will not be at earth potential and a voltagedrop wil l exist along the cable. For the purpose of comparing the resultsobtained in the analysis, this voltage, en wil l be assumed to be 1V.
capacitance to the ground llne exists from a high voltage system, this will give adirect input signal. Line-drive systems are less sensitive to this kind of EMI thancharge systems at the normal power line frequencies.
62

Inductive coupling is often possible whenever accelerometer cables are nearto cables carrying high AO-currents. The coupling increases as the frequencyincreases. Current "spikes" trom fast switching-circuits and other high frequen-cy currents are common causes of electromagnetic interference. Magneticshielding can be used to minimize its effects. Twisted-pair cables are moreinsensitive to this effect because the total flux is close to zero. In practice,coaxial cables give adequate protection.
Noise from electromagnetic interference is normally not of comparable mag-nitude to the noise from ground-loops. Typical coupling parameters are difficultto define. Consequently, it is only ground-loop and triboelectric noise that wewill consider in the cases which follow.
Acceleromeler+
PrcamplifierDescription
Relative Senoilivatylo external noise
(dB)
Relatave Sensilivity loerternal noise with theaddition ol an insulated
base on the accelerometer(dB)
Groundloopnoise
Tribo-electricnoise
Groundloopnoise
Tribo-electricnoise
Normal accelerometergrounded input chargeamplifier
0(ret.
1000 pClV)
0(ref.
100 pc)-130 0
Normal accelerometer'floating" input chargeamplilier
-70 0 -80 0
Broel & Kjer line-driveaccelerometerBruel & Kjer line-drivepower supply
-26 -80 -154 -80
Bruel & Kj@r line-drlveaccelerometer"floating" input Br0el & Kj@rLine-drive power supply
-70 -80 - 134 -80
Line-drive accelerometerconstant current line-drivesupply - (non-Br0el & Kjer)
0 -80 - 130 -80
Balanced accelerometerDifferential Charge Amplltier -60 0 -60 0
TottffiBl
Table 3.1. Comparlson of the immunity of several accelerometer/preamplifiersystems to external noise
63

In all cases the noise is referred to the input of the final instrument in thechaln in the appropriate units (i.e. equivalent charge for a charge preamplif ier,equivalent current for a constant voltage line-drive power supply and equivalentvoltage for a constant current line-drive supply). These values can then beconverted into an overall noise sensitivity by multiplying by the sensitivity of thefinal instrument.
The results of the following analysis are first presented here in tabular form tosimplity comparison of these systems. The sensitivities are expressed in deci-bels relative to the case of a non-insulated accelerometer connected to anordinary charge preamplifier. Consequently a negative sign indicates a lesssensitive system offering greater immunity to external noise. See Table3.1.
Two reference levels are given in the table. One is for ground loop noisesensitivity and the other one is for tribolelectric noise sensitivity. Sensitivitycomparisons are only calculated between noise sources of the same origin. Thereference levels are given in the table.
3.6.1. Grounded Accelerometer and Charge Preamplilier
Fig.3.19. shows an equivalent circuit for this set-up in which the charge andvoltage noise sources have been introduced. By using the basic relationshipsbetween charge, voltage and capacitance, Ohms Law and the assumptions ofnoise levels from the last section, it is a relatively simple matter to express theequivalent charge noise at the input to the preamplifier. Each noise source isconsidered independently.
Flg. 3.19. Simplitied equivalent circuit of normal grounded accelerometer con-nected to a normal grounded lnput charge amplifier
64

Ground Loop NoiseThis is simply the product of the noise voltage and the accelerometer capaci-
tance (C" = 1nF), i .e. 1000pC/V.
Triboelectric NoiseThis has been defined as 100pC lor the sake of comparison with other
examples.
The noise due to the ground loop is much larger than the noise due to thetriboelectric noise.
3.6.2. Grounded Accelerometer with Charge Amplif ier ("Floating" Input)
The Type 2651 Charge Amplifier has the option of a so-called "floating" inputas opposed to the "grounded" input in the last example. A "grounded" input ofthis kind is used on all Br0el& Kjer preamplifiers. The analysis becomes a littlemore complicated as a second operational amplifier is switched in to the inputcircuitry of the preamplif ier. The equivalent circuit of this set-up is shown inFig.3.20.
IAcc6l6rom€ter
wlth'Floating' Input
Fiq.3.20. Simplitied equivalent circuit of normal grounded accelerometer con-nected to a charge amplifier with a "floating"rinput
65

Ground Loop NoiseThe calculation of the ground loop noise inyolves the use of the Common
Mode Rejection Ratio (CMRR) of the second operational amplifier. In this casethe CMRR is approximately 70 dB (a factor of 0,3 1 0-3). The noise f rom the cableis voltage divided between the cable's series resistance R" and the combinedh.igh resistance to earth, F7o"n before the second amplifier. Nearly all of thisvoftage falls across Bto"u A typical value for R" is 0,05 O/m. The equivalentcharge corresponding to the output of the "floating" amplifier is found bydividing by 1mV/pC, which is the charge amplil ier sensitivity.
The equivalent charge noise at the input now becomes
Rc CMRR Rto",u" -Brrru
4' en
- @ &b". + 4 e,
Substituting the relevant values into this equation and assuming there is200m of cable then the ground loop noise sensitivity becomes 0,301 pC/V.
Triboelectric NoiseThis is unaffected by the second operational amplifier and therefore it re-
mains 100pC at the input.
In this case it has been seen that using a "floating" input effectively elimi-nates the effects of the noise due to ground loops. Triboelectric noise is themore important consideration.
3.6.3. BrUel & Kjer Line-drive Amplifier and Power Supply (Grounded Inpul)
Fig. 3.21 shows an equivalent circuit for a line-drive amplifier or accelerome-ter connected to a line-drive supply such as the Type 2813 or a Brtiel &KjarAnalyzer. The equivalent current noise at the input to the power supply must beexpressed. The sensitivity of the line-drive amplifier is fixed at 1 pAlpO. Theoutput impedance of the line-drive amplifier is set at 20k0.
Ground Loop Noise
o==en- Ro 1t61A/pC1
The division by lA/pOl simply converts this value from an equivalent currentnoise at the input of the power supply to an equivalent charge noise at the inputof the line-drive ampllfier. Thls results in an equivalent noise sensltivity of50pC/V.
66

qn = qno slnol
R"
Fi7.3.21. Simplified equivalent circuit of grounded Br0el&Kiar line-drive ac-celerometer connected to Brfiel&Kjar llne-drive supply
Triboelectric NoiseThe current i flowing clue to the triboelectric effect may be assumed to be an
harmonically varying quantity if i t is derived from low frequency harmonicmechanical excitation of the cable. The noise current input into the powersupply is then expressed by
i^ =fu = roro"o"r ,,n dt
When the sensitivity of the power supply is taken into account this gives atriboelectric noise sensitivity of 10-2pC at 16Hz (co = 100) which increases withfrequency. In order to have the same triboelectric noise sensitivity as thenormal charge amplifier of section 3.6.1 the excitation frequency of the cablewould have to be 160kHz. Consequently the l ine-drive system offers a vastimprovement on triboelectric noise performance when compared to a normalcharge amplif ier.
It can also be seen that the noise originating from ground loop interference ismany thousand times greater than that originating from triboelectric effects.The line-drive system shows a greater immunity to overall noise when com-pared to the ordinary charge amplifier. Even in the case of the "floating" chargeamplif ier the immunity of the l ine-drive system to overall noise is sti l l superior ifhigh triboelectric noise is present.
67

3.0.4. Brtiel&Kjer Line-drive Amplil ierand Power Supply ("Floating" Input)
It is possible to "lloat" the input of the line-drive supply in a similar way to thecharge amplifier in section 3.6.2. This facility is available on the Type 2813. Theequivalent circuit is shown in Fig. 3.22. This is the same as in the last caseexcept that an equivalent lloating resistance Rno", (-20kO) exists. This isproduced by an operational amplifief in the Type 2813. The ground loop voltage-is again divided between R" and Rno",.The Type 2813 has a CMRB of 70dB andthe cable is assumed to be 200m long.
F19.3.22. Simplifled equivalent circuit of grounded Brilel&KJer line-drive ac'celerometer connected to a Br0el& Kiar line-drive supply with a"floating" input
Ground Loop Noiee
en lVl
F, tr410-6 lA/pcl CMRR 1 lmV/pOl
This gives a sensitivity to ground loop voltages of only 0,325pC/V which iscomparable to the normal charge ampllfier using a "floating" input.
Triboelectric NoiseThe addition of a floating input condltion will not change the sensitivity to
triboelectric noise and the same results are obtained as in the last section.
68
oR"'n Rnott
Qn
Ro 20 ko
i "=S
) o" = 0""
",n.,
Rclfiet
(+-
Equivalent cur.enl nolse
i l
Line-drlveaccelerometer
oraccel€romet€r
+llne-drlvoampllll€r
Line-drivesupPry

3.6.5. Line-drive System Based on Constanl Currenl Power Supply
This system is not used by Br0el& Kjer. The power supply is simpler than theconstant-voltage current-modulation supply used in the Type 2813. lt should bestressed that cable noise can be induced by electromagnetic fields. This isespecially true if cheap two conductor cables are used. lt will now be seen thata line-drive system based on a constant-current power supply is not as immuneto cable noise as the BrUel&Kjer system. Regardless of the type of line-drivesystem used it is recommended to use coaxial cables when severe electromag-netic fields are present. These points are important because the main benefit ofline-drive accelerometers should be the suppression of the effects of electro-magnetic fields and the possibility of using cheap two-conductor cables.
An equivalent diagram for a constant current system is shown in Fig.3.23.
stant current power supply
Ground Loop Noise
The ground loop voltage is fully developed across the input to the powersupply. lf the l ine-drive amplif igr has a sensitivity of 1mV/pC then the noisesensitivity is 1000pC/V. This is not as good as the Br0el &Kjar l ine-drivedesign and offers no improvement on the conventional charge amplifier.
Triboelectric Gharge Noise
, Equlvelent voltags nois€
1kQRo
.do
\" dr
f o" = q* sin,t
n
Llne drive I Cableacc€l6rometer
; lII Constent current
dlod€ supply
Fig. 3.23. Slmplified equivalent circuit of a line-drive system based on a con-
69

- Ro<oQroQQsut
' t lmV / PCI
At an excitation of 16Hz the triboelectric charge noise is approximately10-2pC which is the same as the Br0el&Kj@r l ine-drive design.
3.6.6. Balanced Accelerometer and Dilferential Charge Amplilier
In a balanced accelerometer the piezoelectric elements are insulated from thehousing. The equivalent circdit diagram is shown in Fig. 3.24. A capacitance c;exists between each charge pick-up point and the accelerometer housing.There will be an unbalance in these capacitances under operating conditionsand this is represented by A C6.
The capacitance between the outer screen and the two inner screens isrepresented by c" and is shown equally divided between both inner capaci-tances.
The capacitance ol the dielectric surrounding the two conductors is repre-sented by C4 and the unbalance represented by AC4
Difierential
ch + Ach
Balancsdacc€l€romoler
Chargepreamplltier
Fig.3.24. Simplitied equivatent circuit of a balanced accelerometer connectedto a ditterentlal charge amPilfiel

The triboelectric charges, gnr ?od qn2 a(e uncorrelated sources and will notbalance out.
With an unbalance of 1pF between the pick-up points on the piezoelectricelements inside the accelerometer L,C6 = 1pF, the equivalent charge noise is1pC/V.
Due to the large impedance ratio at 50Hz between C" and F", the unbalanceof the cable is about 108 times smaller than the transducer unbalance and canbe ignored.
The uncorrelated triboelectric charges still introduce the same amount ofcharge noise at the input to the charge amplif ier as the normal accelerometerand charge preamplifier combination.
3.6.7. Eflect ol Insulated Mounting of lhe Accelerometer on Noise.
An accelerometer can be electrically insulated from the surface onto which itis mounted (see section 4.4). This is achieved either by using a mica washerunder the accelerometer or using an accelerometer which has been made withan insulated base. lmprovements on ground loop noise can be obtained in allcases except the balanced accelerometer and the normal charge amplifier witha "floating" input. No improvement is obtainable in these two cases.
Obviously the triboelectric noise generated by the cable is independent of theinsulatdd mounting of the accelerometer and the sensitivity to triboelectricnoise remains unchanged. Without going through the complex circuit analysisthe noise sensitivities shown in Table 3.2 can be obtained.
Table 3.2. Comparison of sensitivitles of several accelerometer/preamplifiersystems to ground loop noise when the accelerometer is insulatedfrom the structure
lnrulated Accelerometer andPreamplifier Description
Ground loop noiseSensilivity
PC/vNormal accelerometer and charge preamplifier
Br0el & Kjer line-drive accelerometer and supply(grounded input)
Broel & Kjar line-drive accelerometer and supply("floating" input)
Line-drive system based on constant current supply
71

3.7. SPECIAL PREAMPLIFIER FEATURES
Some of the following facilities are available on Brtiel&Kjer Charge Amplifi-ers and vibration measurement equipment fitted with preamplifier inputs. Thearrangement of these features within a BrUel & Kjer preamplilier can be seen inFig. 3.25. For more details on the different types consult Appendix E for con-densed specilication tables. .
Fig. 3.25. Block diagram showing the arrangement inside a Brilel& Kjar chargeamplifier
3.7.1 Integration Networks
The integration of acceleration slgnals to give velocity and displacement datais one of the distinct advantages ol using accelerometers as the transducer inany vibratlon measurement. The choice of measurement parameter was dis-cussed In Chapter 1 and now the integration of these signals will be examined.
For harmonic signals, relationships exist between the parameters accelera-tion, velocity and displacement. Their integration is a simple matter of dividingby a factor proportional to the frequency.
72
Transducar SensitivitvExternal
to
Batttry4,5 V

Let the acceleration signal be represented by a sine wave expressed by
a = ao sincot
where
a = acceleration at time f8s = acc€leration amplitude(t = frequency in radlans per second.
The first integration wlll yield velocity y
Iv = | adt,u
-"n=
-COS@I(,= Vo COS @f
where-8s
V6(r)
It can be seen that the constant of integration has been taken as zero. This isnot true when transient signals are Integrated.
The second integration yields the displacement signal, x
I, = | vdt
t" -"o
- ^ sin crrf
( t ) '
= x;s in@f
where-2n
xo = ---^@'
R
c
Fiq.3.26. A simple RC integration network
73

Thls simple analysis has demonstrated that integration ls achieved by divid-Ing the aceeleration by a factor proportional to. the frequency to obtain velocity,and by a factor proportional to the square of the frequency to obtain displace-ment.
Electronic integration, at its most basic level can be achieved using a elec-tronic network similar to that shown in Fig 3.26.
When the voltage V,nlrom the accelerometer and preamplifier ls applied tothe input, the voltage across the capacitor Vou can be shown to be
Vou,1 + j@RC
when crrRO >> 1 then
1 Vi,v^,o
jRC o)
By comparing this expression with the previous integration analysis it can beseen that an electronic integration has taken place. The factor 1/RC can betaken care of in the internal calibration. A double integration is achieved byusing a second integration network to yield displacement information.
ll the absolute value ol the last expression is plotted against frequency then aresponse simllar to Fig. 3.27 is obtained. lt can be seen that a low frequency
Vin
74
Fiq.3.27. The quallty of the lntegrated signal as a functlon of frequency

-Actiw Intlgr.tlon Nltrcrtr
- - -Po$iv! Int grltion Nm.kt
/ - - - \ - o lsoracemmr-$_
-at t ra -
- -aa-----
'2\ \ \ \ \
. t t t -
-s\ \Dispraffir= +1.. v"r*rv =l\
-
II
c
o
t
IIt
125102080
F€quoncy .€latlw to Integratlon network lower
Fig. 3.28. Frequency response characteristics of an electronic integrator
limit cos exists below which no true integration takes place. Between @r and <rlronly partial integration takes place. only signals with frequencies greater than@7 8r€ truly integrated.
The integration range of the filter is extended by amplifying the signal beforeit is applied to the integrator. This also improves the dynamic range ol theintegrator. An integrator of this kind is termed "active" and may be found in theBrtiel & Kjer preamplif iers which have integration options. The typical responseof an integrat[r can be seen in Fig. 3.28. Notice the existence of a peak in thefilter.
Integration networks must be used with caution when measuring transientvibration signals. The low frequency content of a transient may excite the peakof the lilter and cause the integration network to "ring' and distort the measure-ment. ln addition the phase response ol the integrator will cause transientdistortion. Fig. 3.29 shows the effect of electronic integrailon on two sinusoidalacceleration transients ol 1 and 10ms duration. The electronic integration iscompared to the true integration. The low frequency content of the longertransient Causes errors in the measurement of the peak values.
75

Accclelation
f+loms{Velocity_
- ------- ldeal integrator
- Real integrator (Cut-off frGquency 10 Hz)
_A_i3p!€q94!
F19.3.29. comparison between electronic and theoreticat integration ol twoacceleration pulses
3.7.2. Filters
It is often desirable to limit the frequency range in a vibration measurement.For example, when making vibration measurements on rotating machinerycontaining gears, frequency components above the band of interest can haveappreciably higher levels than the vibrations of interest. ff these high frequen-cles are not filtered out at this stage they will be clipped by amplifier overloadsand create difference freguencies lying in the desired frequency band wherethey are no longer separable from the required signal components. Filtering of avibratign signal can optimize the dynamic range of the instrumentaflon asdescribed in section 1.4.
A high pass filter can be used to remove the spurious low frequency noiseresulting from non-vibrational inputs such as temperature transients and basebending. In general these are only a problem when accelerometers other thanthe Delta Shear@ type are used.
Several Br0el&Kjer preamplifiers are equipped wlth active low and highpass filters whose -3dB points are selectable. For details on the various typesconsult Appendices E and F.
76

Fig. 3.30. Phase characteristics of a Br0el & Kjer charge amplifier for differentfilter settings
As far as the measurement of periodic signals is concerned, phase non-linearities associated with tilters will have no influence on their RMS valuesalthough phase must be taken into account when measuring transients. ll thefrequency content of the signal is known it is possible to select the frequencyrange which introduces the minimum amount of phase distortion. This can beachieved by referring to a diagram similar to that in Fig3.30 which is takendirectly lrom the Instruction Manual of a charge amplifier.
When two charge amplifiers are used together as in mechanical impedancemeasurements or in calibration the maximum phase difference, AO, can bedetermined from the following relationship:
a0 = tan-1
- . fc ' r ' f .z' - t"r'
Where f"' and f", are the individual lower limiting frequencies for eachpreamplifier and fcn is the frequency for which the maximum difference isrequired. This relationship holds true for preamplif iers containing 6dB/octave(20dB/decade) fi l ters. lf the fi l ter slope is 12dBloctave (40dB/decade) then thephase angle is twice as big and the expression above becomes
f "'r -
fcz
f"n f",
77

fcz
l"n
1",f"n
Ad = 2tan4.t+f"r ' ! "2
f"r'
3.7.3 Overload Indicator
An essential and unique feature of Br0el & Kjar preamplifiers is the overloadwarning facility. This effectively eliminates the possibillty of making misleadingmeasurements by monitoring the signal levels at the output of the input amplifi-er, the output ol the filter and the output of the output amplifier (see Fig. 3.25).Only this arrangement can ensure that overloaded signals are not masked byfiltering. Overload conditions are indicated by a small lamp. The overloadcircuitry can respond to peak overloads as short as 20ps. A 20dB fromoverload indicator is also a very uselul feature. The input and output gains canbe adjusted until this light comes on. This means that the dynamic range of thispart of the system is optimized.
3.7.4. Reference Oscillator
This facillty is for use in system calibration and checking. lt is particularlyuseful when making measurements in the field using portable tape recorders. Areference signal can be recorded on to the tape along with the vibration signalsand later used to help calibrate the recordlngs. lt can also be used to definelevels when using level recorders and measuring amplifiers.
3.7.5. Power Supplies
Br0el& Kjer preamplifiers can be powered in several ways. Consult the tablesin Appendices E and F.
Whenever possible a dual polarity power supply should be used because inthis way there is greater suppression of common mode signals and powersupply noise. This is particularly useful in large multichannel vibration measure-ment setups.
Battery power supplies make the instrument fully portable and also reducesystem noise. Both of these features are particularly useful in outdoor measure-ments.
Up to twelve dual polarity supplies are avallable from the Powel Supply Type2805 which is also capable of providing 12 single polarity supplies.
78
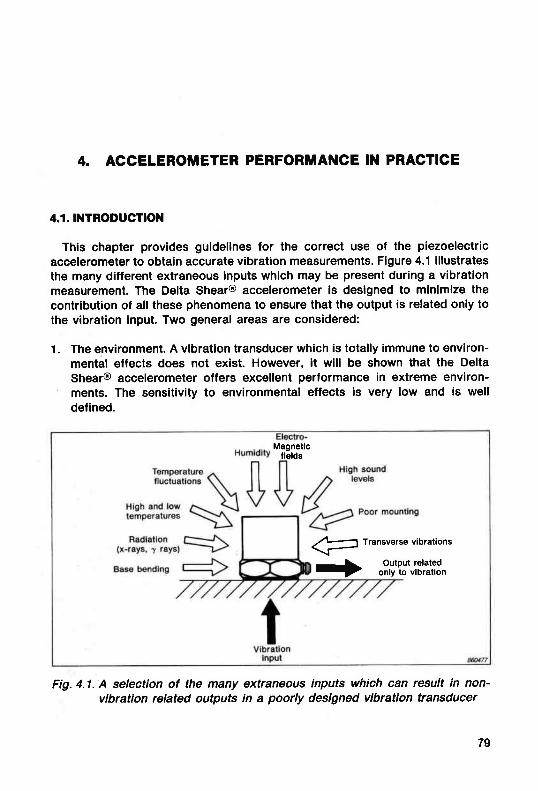
4. ACCELEROiIETER PERFORMANCE IN PRACTICE
4.1. TNTRODUCTION
This chapter provides guidelines for the correct use of the piezoelectricaccelerometer to obtain accurate vibration measurements. Figure 4.1 illustratesthe many different extraneous inputs which may be present during a vibrationmeasurement. The Delta Shearo accelerometer is designed to minimize thecontribution of all these phenomena to ensure that the output is related only tothe vibration input. Two general areas are considered:
1. The environment. A vibration transducer which is totally immune to environ-mental ellects does not exlst. However, it will be shown that the DeltaShear@ accelerometer offers excellent performance in extreme environ-ments. The sensitivity to environmental effects is very low and is welldelined.
Fig.4.1.A selection of the many extraneous inputs which can result in non-vibration related outputs ln a poorly designed vibratlon transducer
Magnetlcflelds
Transverse vibrations
Output telaledonly to vibratlon
Fr+
79

2. Mounting. The mounting technique can alter the frequency response anddynamic ranges of the accelerometer. In addition, consideration must beglven to the accelerometer mass as well'as its mounting location. Theguidelines set out In this chapter must be followed if optimum performanceis to be obtained.
4.2. ENVIRONMENTAL EFFECTS
Vibration measurements pften need to be made in environments which placespecial demands on the accelerometer. To make reliable measurements it isimportant to deslgn a transducer with maximum suppression of a// environmen-tal influences. To this end, there have been numerous accelerometer designs.None, however, have been able to match the Delta Shear@ design in suppress-ing environmental etfects. lts low sensitivity to extreme environments is welldefined and the effect of, lor example, an excessively high temperature or astrong magnetic field, can be calculated and its contribution to the overallmeasured vibration level can be estimated.
Each BrUel & Kjer accelerometer is supplied with very comprehensive speci-fications relating to the sensitivity to environmental effects. The methods ofmeasuring these effects are described in International Standards and in partic-ular to ISO 5347, "Methods lor the Calibration of Shock and Vibration Pickups"and also the American standard ANSI S2.11-1969. "The Selection of Calibra-tions and Tests for Electrical Transducers Used for Measuring Shock andVibration".
4.2.1. Temperature Range
The piezoelectric aqcelerometer is capable of vibration measurements over awide temperature range. However, due to the properties of piezoelectric mate-rials, variations of both voltage and charge sensitivities as well as impedancewill occur when the accelerometer is operated at temperatures other than thereference.
As an example, Fig. 4.2 shows the variation in capacitance, charge sensitlvityand voltage sensitivity of piezoelectric material PZ23 which is the material usedin nearly all Br0el&Kjar accelerometers. tncluded on the calibration chartsupplied with each accelerometer is a similar diagram contalning informationon the type of piezoelectric material used in that accelerometer. These changesin sensltivity are well defined and no permanent change occurs when thetemperature is returned to the calibration temperature. When using the acceler-ometer at hlgh temperatures lts actual sensitivity, taklng into account thechange in sensltlvlty due to the Increased operating temperature, can bedetermlned using such a diagram.
80

dB
2
1
+5€
Vo
+26
oEt
oE
o
ooar
12
0
1l
21
29
sqttt:=dc
o
ooE
\ | PZ 23 Voltage
Temperature ('C)
Fig. 4-2. The temperature dependency of the capacitance, charge sensitivityand voltage sensitivity of piezoelectric material PZ23
The time required for the sensitivity to return to the one stated on thecalibration chart is not easy to determine but it will partly depend on thetemperature to which the accelerometer was taken. lf the ambient temperaturechanges slowly then the sensitivity of the accelerometer will follow the curveshown in Fig.4.2. However, for rapid temperature changes the piezoelectricexhibits a hysterisis-type effect and the accelerometer will take some time tostabilize at the sensitivity indicated on the chart. In general a period of 24 hoursis required for an accelerometer to return to the calibrated sensitvity when it issuddenly returned to room temperature from a temperature close to its maxi-mum operating temperature.
Each accelerometer has a specified maximum operating temperature abovewhich the piezoelectric element will begin to depolarize and cause a permanentchange in sensitivity. This is 250" C for those accelerometers using PZ 23piezoelectric material. At temperatures up to 50o C above the specified limit theloss is gradual. lf i t is any higher then rapid depolarization takes place and theaccelerometer is ruined.
For high temperature work above 250" C the Industrial Accelerometer Type8310 can be used. This has been designed lor use up to 400'C. lt is possible tothermally isolate the base of a general purpose accelerometer trom the vibrat-ing surface using a screen made of a metal with high thermal conductivity such
81

es that shown in Fi9.4.3. This increases the rate of heat transfer away from theaccelerometer. Such a screen enables measurements to be made on surfaceswlth temperatures up to 350" C. lf a stream of cooling air is also directed at theaccelerometer it is possible to measure on surfaces up to 450"C. However, itmust be remembered that the stiffness at the mounting point of the accelerome-ter may be altered by such a fixture and this in turn will lower the resonancefrequency of the accelerometer when mounted and decrease the useful fre-quency range. The associated measuring instruments will in general have alower temperature capability and may need to be mounted at some distancefrom the accelerometer.
The lower temperature limit for most Br0el& Kjer accelerometers is specifiedas -74o C. Speciflcations have not been defined at temperatures below thisalthough lt is still possible to use general purpose accelerometers at even lowertemperatures. Using general purpose accelerometers, vibration measurementson structures have been made at liquid nitrogen temperatures (-196"C).
Fi9.4.3. Mounting an 'accelerometer on a hot surface using an aluminiumscreen to lncrease the heat dissipation
4.2.2. Temperature Transients
Fairly' rapid fluctuations in the ambient temperature (due to draughts andthermal ourrents, for example) during a vibration measurement can give rise toa low frequency noise signal from the accelerometer. This signaf is due to twoeffects.
1. The Pyroelectric Ellect. This is a phenomenon whereby piezoelectric crys-tals and ferroelectrlc ceramlcs, become charged by temperature inequal-ities and temperature changes. In artificially polarized ceramics this chargeis bullt up on the surtaces perpendicular to the polarization directlon.Therefore when the vlbration induced charge is picked up perpendicularlylo
82

Pyroelectric charge not picked up in sheer d€slgn
\ { - - - /
t l-l .l
pyro€recrric chare€I Polarization I Piezoelectric I a + pick€d up between th€se
I direaion
I erement
I t - ::rJ,l"J"
in compresston
I I ,* .1Temperaturefluctuatlons
Fiq.4.4. The immunity to temperature fluctuations of a piezoelectric materiat inshear mode compared to compression mode. The charge shown iscaused by the pyroelectric ettect and is not correlated with the vibra-tion
the polarization direction, as in compression designs, this pyroelectriccharge is also picked up and erroneous outputs result. However, in a sheardesign this extra charge is not picked up as the charge pick up points are onthe surfaces parallel to the polarization direction. This is illustrated inFig.4.4.
As a direct result of this, shear types are theoretically insensitive to tem-perature transients. In practice they are approxlmately 100 times less sensi-tive to temperature transients than compression types. At Br0el&Kjarcareful choice of piezoelectric elements also helps to minimize this effect.
2. Non-unilorm thermal expansion. This is possible when parts of the accel-erometer structure expand or contract at different rates or the accelerome-ter is subjected to a heat differential across lts case. Both phenomena resultin forces on the piezoelectric element and a resultant output. Compressionconstructions are more susceptible to these effects than shear construc-tions.
These effects will only become noticeable when low level, low frequencyvibrations are measured. In the case of outdoor measurements on large struc-tures such as buildings, bridges or ships where the prevailing wind may causesudden cooling effects it is vital to use an accelerometer designed to give lowsensitivity to these effects. Many industrial environments may also presentpotential temperature fluctuation problems but as most measurements aremade at high vibration levels the effects are not so serious.

The typical temperature transient sensitivity for each accelerometer type canbe lound on the calibration chart supplied lvith each accelerometer. lt ispossible to reduce or even eliminate the low frequency noise caused by thesetemperature fluctuations using one or more of the following methods.
1. Correct Ghoice. The most important of all the factors concerning thereduction of temperature transient effects is the correct choice of acceler-ometer design. Delta Shear@ design is lar superior to compression design'
2. High Pa$ Filters. lf a compression type is used it may be necessary to usea high-pass filter to remove the spurious low frequency output. Such filtersare included on most of the Briiel & Kjar preamplifiers used for vibrationmeasurements. Lower limiting frequencies are selectable and are typically0,3 Hz up to 30 Hz. A lower limiting frequency of greater than 3 Hz is neces'sary when using compression design accelerometers in environments wherethe temperature is fluctuating. Line-Drive amplifiers such as the Type 2644or those built in to Accelerometer Types 4390, 8317 and 8318 have specifiedlower frequency limits which minimize these effects. For details of theindividual preamplifiers and Line-Drive Types consult the Product DataSheets available on these products.
3. Shielding. ln some cases it may be possible to attach a screen or lightthermal insulator around the accelerometer. A microphone windshield isoften suitable lor this purpose. Alternatively one can be constructed lrom alight polystyrene material.
4.2.3. Acoustic Sensitivity
Most vibrations are associated with an acoustic output. Vibration measure-ments are often made in environments where there is a high sound pressure
level. BrUel&Kjer Delta Shear@ accelerometers have been designed so thathigh sound pressure levels (SPL) do not interfere with the vibration measure-ment. This is achieved by using a rigid mechanically isolated design. The typicalacoustic sensitivity of a Delta Shear@ accelerometer is in the range 0,0001 to0,004ms-2 for an SPL of 154dB in the 2 to 100H2 ranger. Other constructionshave cdnsiderably higher sensitivities than this. Older compression type de-signs effectively acted like microphones because there was no mechanicalisolation between the case and the piezoelectric discs.
In many cases the acoustically induced vlbration of the test structure will be amore important lactor to consider.
1 The acoustic sensitlvlty ls measured in this range but is probably constant uP to higher frequen-cies. See sectlon 5.5.4.
84

4.2.4. Base Strains
This is more easily understood if it is referred to as "base bendlng". Whenev-er an accelerometer is mounted on a vibrating structure th€ base will besubjected to bending forces and a resultant charge will be measured. Thefrequency of this charge will always be at the frequency of the vlbration.consequently, it is at low frequencies where displacements, and henc€ strains,are large that this effect is noticeable.
Low base strain sensitivlty is particularly important in the design of a feed-back compressor clrcuit for vibration testing set-ups. The accelerometer pro-viding the feedback signal may be subjected to large base strains and theexcitation signal to the vlbration exciter will be distorted.
Bruel&Kjer accelerometers are designed to have low sensitivity to theseeflects by utilizing the Delta shear@ design. ln thls design the piezoelectricelements are effectively isolated from all deformations of the base. lt is notnecessary to employ a very thick, and hence excessively heavy base to mini-mize thls etfect as is necessary in all compression designs.
The BrUel&Kjar Type 8305 Reference Accelerometer is a compression de-sign and utilises a beryllium disc to isolate the piezoelectric discs from basebending effects. Under the controlled conditions of calibration base bending isnot a problem for this accelerometer.
Typical base strain sensitivity for a general purpose Delta Shear@ accelerom-eter 0,02ms-2lp.c al a base strain of 250pte. The typical value for each type isincluded on the calibration chart supplied with each accelerometer.
4.2.5. Humidity Eflects
All Br0el & Kjar accelerometers are of a sealed construction with either awelded or epoxy sealed housing, effectively isolating the accelerometer fromthe effects of humidity. when they or€ uS€d in wet or extremely humid condi-tions it is important that the accelerometer cable and screw connector arecompletely sealed. otherwise there will be a decrease in the leakage resistanceof the accelerometer and a change in the low frequency response. This can beachieved using a sealing agent such as Dow Cornings RTVTgg, 3M Scotch Cladstrip coating 2253 or similar compounds. Bruel&Kjar accelerometer cablesleeves are generally made of moisture impervious pTFE or pFA (Teflon) andcan be completely immersed in liquids.
85

4.2.6. Magnetic Sensitivity
Br0el&Kj@r accelerometers are very insensitive to magnetic fields. Thesensitivity lies between 0,5 and 30 ms-2 per Tesla (0,005 and 0,3 g per k Gauss)which is a worst case situation with the magnetic flux flowing in the direction ofthe maximum sensitivity.
4.2.7. Radaation Ellects
With the exception ot line-drive designs, all Brriel & Kjer accelerometers maybe used under gamma radiation conditions (100Gy/h,6MeV) up to accumulateddoses ol 20kGy (1 Gy=199 1"d). Tests indicate that these accelerometers showless than 10% sensitivity change after such exposure. Normal types of acceler-ometer cable may be used but special cables are recommended for accumulat-ed doses exceeding 1kGy. The Industrial Accelerometer Type 8310 shows lessthan 3% change in sensitivity at these doses and can be used under very highradiation conditions. With accumulated doses of l MGy and 1018 neutrons persquare centimetre (10kGy/h, 1 to 5MeV and a thermal neutron flux of 1012neutrons per square centimetre per second) a sensitivity change of approxi-mately 5% is obtained. For further details consult the Product Data for IndustrialAccelerometers.
4.3. MASS LOADING EFFECTS OF ACCELEROMETERS
When an accelerometer is mounted onto a vibrating specimen the increase inoverall mass, combined with a change in the local stiffness, will inevitably alterthe dynamic properties of the structure.
These changes are only significant if the accelerometer introduces an addi-tional mechanical impedance of similar magnitude to that possessed by thestructure before the addition of the accelerometer. The mechanical impedance,.Z", presented to the structure by the accelerometer can be expressed in termsof its mass m,
za = @fra
This is valid at frequencies up to 0,9 times its mounted resonance frequency.Within this frequency range the acceleration of the part of the structure near theaccelerometer is modified according to the following relationship;
am = "" z3T - "";I ^
86

where
am = acceleration measured by the accelerometer
as = acceleration of the structure when the accelerometer isnot present
Z" = mechanical impedance of the unloaded structure
ms = 'mass" of the structure. In many cases the mechanicalimpedance is mainly the mass of the structure near theaccelerometer
There will also be a reduction in the resonance frequencies of the structureaccording to thls relationship
rm =1", fEV ms+ ma
where
fm = any resonance frequency ot the structure with the influ_ence of the accelerometer mass
fs = any resonance frequency of the structure without the influ_ence of the accelerometer mass
These relationships show that if accelerometer mass, and hence mechanicalimpedance, are kept small compared to the mass of the structure then anychanges in the vibration wil l only be small. A general rule is to ensure that theaccelerometer mass is less than one tenth of the mass of the structure.
Fig.4.5. Theoretically derived retationship between accelerometer mass andchange in vibration ot thin aluminium and steel plates
Eoo]oEoooaqo
Ef
E6
Plate thlckn€ss
87

Fig.4.5 shows a theoretically derived relationship between the required ac-celerometer mass and the thickness of a plate for a specified change in theacceleration level over a defined frequency range. This can be used whenmeasuring vibration on light aluminium and steel plates.
4.4. MOUNTING THE ACCELEROilETER
To measure vibration accurately one must ensure that;
1. The useful frequency and dynamic ranges are not limited by poor acceler-ometer mounting.
2. The addition of the accelerometer mass does not alter the vibration charac-teristics of the test object.
3. The measurement point can be exactly located repeatedly thus ensuringrepeatable measurements.
The selection of the correct mounting arrangement can significantly affecteach ol these criteria. lt has already been seen that the useful frequency rangeof the accelerometer is determined by its mounted resonance frequency quotedon the individual calibration chart for each accelerometer. The mounted reso-nance frequency is measured under optimum mounting conditions using thestandard mounting studs on a 1809 steel block whose surfaces have beenfinished to the standard defined in Fig.4.6.
Fiq.4.6. Recommended tolerances for the mounting surface and tapped fixing.hole. Dimensions and symbols in accordance with lSO1101
88

4.4.1. Vibralion Test Specimen Surface Finish Requirementr
It is very important that the surface of the test specimen is as clean andsmooth as practically possible in order to have a high mounted resonancefrequency. lf possible, the surface should have the finish defined in Fig. 4.6. Thehole for the accelerometer stud must also be tapped according to the standardsset out in Fig.4.6. Unwanted grease can be removed by using commerciallyavailable solvents such as acetone.
4.4.2. Mounting Location
In many cases the accelerometer mounting location is fairly obvious and willbe dictated by the reason for measuring the vibration. The accelerometershould be mounted with its main sensitivity axis aligned with the desiredmeasurement direction.
However, it has already been mentioned that the accelerometer responds tovibrations in directions other than the main sensitivity axis. The red dot on B & Kaccelerometers can be aligned with the direction of maximum transverse vibra-tion and consequently their effects wil l be minimized.
chose a location which provides a short and rigid vibration transmission pathto the vibration source avoiding any compliance and damping elements presentin the structure such as gaskets. For example, when measuring vibrations onrotating machinery, bearing housings are often good places to mount theaccelerometer.
There is often valuable information to be found in directions other than theone in which we mount the accelerometer. The use of a triaxial accelerometercan provide simultaneous data concerning vibration in three mutually perpen-dicular axes at the same point.
The dynamic response of many structures can be very complicated and onlyslight diflerences in mounting locations can cause large differences in themeasurement, particularly at high frequencies. As a general rule, never makemeasurements at a node point. To identify the location of the nodes andantinodes on a structure it may be necessary to perform a quick vibrationsurvey over the structure by using a "quick test" method with a hand-held probesimilar to that described in section 4.4.9.
Perhaps one of the most difficult areas of vibration to measure meaningfullyis the area of vibrations applied to humans. This can cover both whole bodyvibration and hand-arm vibration. Both require special cohsiderations of trans-ducer type, frequency range, dynamic range, mounting technique and mountinglocation.
89

4.4.3. Determination ol the Frequency Response ol AccelerometersWith Dilfelent Mounting Technigues
The following sections contain advice on mounting techniques and theirinfluence on the frequency range and dynamic performance of accelerometers.Most feasible techniques are covered. The lrequency response measurementsare made with a small permanent magnet exciter to drive a moving table of1809 onto which is mounted the accelerometer. The acceleration of the table iskept constant over a wide frequency range using an electronic feedback circuit(compressor loop).
To simplify comparison the same general purpose accelerometer is used inaff the measurements. Fig.4.7 compares the most important of the frequencyresponses obtained by using the mounting techniques covered in this section.
Fr6quency
Fig. 4.7. Comparison of frequency response curves obtained using several ac-celerometer mounting techniques
4.4.4. Stud llounting
llethod:
Prepare the surface of the test object to the tolerances shown in Fig.4.6.The accelerometer base should also be as clean and as smooth as possible.
Drill and tap the requlred slze flxing hole in the test object. This will dependon the tlpe ol accelerometer. The hole must be deep enough to accept theaccelerometer stud. For miniature accelerometers use the QA 0041 Tap for
1.
2.
90

M3 lhread and the 8mm (0,25) inch long steel stud YQ2007. For generalpurpose accelerometers use the Q40029 tap and 10-32 UNF mounting studsYQ2960 and YQ2962 which are 12mm and 8mm (0,5 and 0,312lnches) longrespectively. For Type 8318 Accelerometer use the M8 tap QA0141 and studYQ9335.
3. Screw the stud into the hole and then the accelerometer onto the stud.Check that the stud does not bottom in the accelerometer and use aspanner to tighten the accelerometer, taking care not to overtighten it. SeeFig.4.8.
Fig.4.8. The use of a stud to mount an accelerometer. The accelerometer onthe right is mounted using the insulating stud and mica washer
Applications:
1. High frequency vibration measurements requiring the highest possiblemounted resonance frequency.
2. Permanent vibration monitoring.
Advantages:
1. Optimum accelerometer performance. This method should be used whenev-er possible.
2. The mounting does not limit the temperature range of the accelerometer.
3. Operation at very high vibration levels.
91

Diradvantages:
1. lt may take some time to prepare the surfa0e of the test object and to drilland tap the hole.
Notes:
1. A thln layer of silicone grease applied between the accelerometer base andthe test surface will improve the high frequency performance especially ifthe surface is not completely smooth.
2. The recommended torque with which to mount the accelerometer dependson the size of stud being used and is 1,8Nm for the normal 10-32 UNF studand 0,60Nm for the smaller M3 steel mounting stud. .,Fingertight" may atfirst appear barely sufficient (=0,3Nm) although actual differences in themeasured frequency response of the accelerometer are very slight providedthat the accelerometer is tightened with a strong grip. Only when the highestfrequencies are under investigation is it necessary to use a spanner totighten the accelerometer. See Fig. 4.9.
3. Take care not to use excessive torque when using a spanner as the studmay break or the thread may be pulled out of the accelerometer. This makesit very dilficult to remove from the accelerometer or test surface. Theaccelerometer can be ruined.
4. The stud should not bottom on the end of the accelerometer thread. lf theaccelerometer base is not in contact with the vibrating surface, large errorscan occur.
Frequency
Fiq.4.9. The frequency response of a stud-mounted generat purpose acceler-ometer using slightly different mounting technigues
92

6.
7.
8.
Because ground loops can arise in vibration measurements, particulary withmulti-point set-ups on large machines, it is sometimes necessary to etectri-cally insulate the accelerometer from the test surface. This is achieved byeither using an accelerometer with an insulated base or uslng the MicaWasher YO0534 or YO0746 together with an Insulating Stud yp01S0. Theaddition of the mica washer does however lower the mounted resonancelrequency particulary at temperatures over 80. C when creeping can occurin the stud. Try to use the thinest possible slice of mica to obtain goodmechanical coupling.
The miniature accelerometer Type 4374 is not designed to be stud-mountedand an alternative method must be used.
The shock accelerometer Type 8309 has an M5 integral stud.
The Industrial Accelerometers are mounted with screws.
4.4.5. Wax ilounling
llethod:
1.
2.
Ensure that the mounting surface is as smooth as possible. Also ensure thatthe accelerometer base is free from dirt and grease.
scrape off a small amount of the wax YJ0216 supplied with the accelerom-eter sets and roll it with the fingers to soften it.
Smear the wax onto the test surface, covering an area larger than the areaof the accelerometer base. The layer should be just thick enough fill out thevoid between the two surfaces.
Slide the accelerometer onto the wax and by applying pressure and turningthe accelerometer it is secured to the surface. This may take a litfle prac-t ice. See Fig.4.10.
Thln layerot beeswax
F19.4.10. The use of wax lor mounting of a minlature accelerometer
Applications:
1. Quick test vibration measurements.
93

2. Measurements where it is not possible, or indeed desirable, to drill amounting hole for a stud.
3. Attaching accelerometers which do not have a tapped hole in the base.
Advantages:
1. A quick and easy mounting option.
2. The mounted resonance frequency is only slighily less than that for studmounting.
Disadvantages:
1. Serious temperature limitation of 40"C.
2. The maximum vibration level is approximately 100 ms-2
Notes:
1. The poor temperature performance is caused by softening of the wax. Thiscauses a decrease in the coupling stiffness leading to a lower mountedresonance until eventually the accelerometer becomes detached from thetest surface.
2. The use of excessive wax will lower the mounted resonance frequency andlimit the measuring frequency range. See Fig.4.11.
Frequ€ncy 6iloo
4'11' The treguency response of a wax mounted general purpose acceler-ometer
Fig.
94

4.4.6. ilagnel ilounting
Method:
1. Ensure that the surface of test object and accelerometer are free fromgrease and protrusions.
2. Screw the accelerometer onto the permanent magnet UA0642 and tightenwith a spanner if necessary. A smaller magnet is available for mountingminiature accelerometers. High frequency response is improved by applyinga thin layer of silicone grease between the accelerometer base and themagnet and between the magnet and the structure before attaching theaccelerometer to the structure. See Fig. 4.12.
Fig.4.12. The use of the mounting magnet lJA0642 to mount an accelerometer
Applications:
1. The rapidity of this method makes it ideal for many preliminary measure-ments on, for example, industrial machinery, before a decision is made onthe location of a permanent vibration monitoring point.
Advanlages:
1. Very rapld method.
2. Considering the apparently low coupling stiffness this method gives goodhigh frequency performance, especlally on flat surfaces. See Fig. 4.13.
3. High acceleration capability.
95

Fr6quency
Fig. 4.13. The trequency response of a magnet-mounted general purpose accel-erometer
Disadvantages:
1. The surface of the test object must be ferro-magnetic. Alternatively, aferromagnetic disc or plate can be glued (or screwed) onto the structure.
2. Absolute repeatabillty of the measurement point cannot be guaranteed.
3. The addition of the magnet creates an extra mass loading effect on thestructure. This could be a serious disadvantage when making measure-ments on light structures such as panels or plates. The magnet UA0642welghs 169.
Notes:
It is possible to electrically insulate the accelerometer from the test object.This is achieved by using the PTFE self-adhesive insulating disc suppliedwlth the set of 5 mounting magnets UA0643. The disc is placed between thesurface of the test structure and the magnet.
Measurements are possible on curved surfaces such as plpes although thefrequency range will reduce as the radius of curvature of the surface getssmaller.
The peak holding force of the magnet varies between 35 and 60N, depend-ing on the surface condltlon and whether insulating discs are used. Conse-quently the maximum vlbration levels will vary according to the combinedweight of the accelerometer and magnet. The BrUel & Kjar Accelerometer
1.
96

Product Data contains this limit for the different types. For example, anaccelerometer weighing 17 grams can be used at acceleration levels of 1,2kms-2 whereas an accelerometer weighing 175 grams can only be used upto 0,2 kms-2
4.4.7. Selt-Adhesive ilounting Discs
tethod
1. Ensure that the vibration test surface and accelerometer are free fromgrease.
2. Peel off the protective backing film of the disc and apply the disc firmly tothe accelerometer. See Fig. 4.14.
3. Attach the accelerometer to the vibrating surface.
Fig. 4.14. The use of a self adhesive mounting disc to mount an accelerometer
Applications:
1. Quick test vibration measurements.
2. Measurements where it is not possible, or indeed undesirable, to drill amounting hole for a stud.
3. Attaching accelerometers which do not have a tapped hole in the base.
Advantages:
1. Rapid method giving reasonable hlgh frequency response and high accel-eration capability.
2. Electrical insulation is provided.

Disadvantages:
1. High and low temperature operation l imitations.
Notes:
1. Double sided self-adhesive discs are available in two diameter sizes- 40 mmDiscs (DU0079) and 5,5mm Discs (YO0073). The smaller variety come insets of 25 and are designed for use with the miniature type accelerometerswhereas the larger one is supplied as a single item and is capable ofsecuring the largest accelerometer at any angle with sufficient adhesiveforce to maintain a reasonably high frequency performance. See Fig.4.15.However it must always be remembered that this and the other methodsonly approximate to the superior performance obtainable with stud mount-ing.
Double-sided adhesive tape can also be used and good results are obtain-able if the tape is thin. However if the tape is very thick then the highfrequency performance will be reduced.
Frequency ffilltl
Fig. 4.15. The frequency response of a general purpose accelerometer mountedwith a self-adhesive disc
4.4.8. Adheeives
There are two basic methods for using adhesives to mount an accelerometer.
98

Direct Attachment:
Method:
1. Ensure that the surface is as smooth as possible and free lrom dirt.
2. Use a quick setting cyanoacrylate type adhesive to secure the accelerome-ter to the test structure following the instructions given with the adhesive.See Fig.4.16.
Cyanoecrylat€Adh€sive
Fig. 4.16. The use of cyanoacrylate adhesive to mount a miniature accelerome-ter
Applications:
1. This method is very commonly used with the miniature range of accelerom-eters.
2. Permanent vibration monitoring where it is not possible to use stud mount-ing.
Advanlages:
1. Excellent high frequency performance and high acceleration levels.
Disadvantages:
1. lt is not very easy to remove the accelerometer from the surface and in allcases it will be necessary to clean the accelerometer afterwards with asuitable solvent. This may take some tlme.
2. Repeatability of the exact mounting location cannot be guaranteed.
3. Electrical insulation is difficult.
Gementing Stud llounting
Method:
1. Ensure a smooth, grease-free mounting surface.
2. Select the appropriate cementing stud and glue this to the test surface using

an epoxy adhesive and allow this to dry. This may take up to 30minutesdepending on the glue used. Araldite' is re.commended.
3. Screw the accelerometer firmly onto the stud using the fingers. A spannershoufd only be used with care. See Fig.4.17.
Fiq.4.17. The use of a cementing stud to mount an accelerometer
Applications:
1. Multi-point vibration monitoring where the accelerometer is regulary movedfrom one location to another and repeatability is required but normal studmounting is not possible.
Advantagee:
1. Good all round measurement characteristics.
Disadvantages:
1. Time-consuming (if epoxy adhesives are used).
2. lt cah be difficult to remove the stud and the hardened glue from the testsurface.
3. Electrical insulation is difficult. However, the addition of two glass fibresunder the cementing stud can provide good insulation. Alternatively, thestud can be palnted with a thin layer of epoxy and left to cure beforecementing on to the surface.
4. Typical maxlmum temperature limitation of 80" C, depending on the adhe-sive in use. Several higher temperature adhesives are available, such as 3MCyanollte HG303 which can be used to 200"C.
100

1.
2.
Cyanoacrylate cement can only be used on the smoothest surtaces. This isbecause the protrusions of rough or milled surfaces such as the base of thecementing stud can "store" air pockets which reduce the adhesive effects ofthis type of cement.
Epoxy adhesives can be used to glue the accelerometer direct to thesurface although they are not as quick as the cyanoacrylate types.
"Soft" adhesives are not recommended because of the reduction in cou-pling stiffness which greatly reduces the frequency range. See Fig.4.18."Soft" adhesives also have inferior high temperature performance charac-teristics.
Suitable methyl cyanoacrylate adhesives are 3M Cyanolite 101 and Perma-bond747 which have the BrUel & Kjar order no. QS 0007. These may be usedat temperatures from -50" C to 80" C. Other types are Eastman (Kodak)910MHT and Loct i te lS.
A spanner should only be used with extreme care for t ightening the acceler-ometer on to the cementing stud. Experience has shown that, when remov-ing the accelerometer, instead of the accelerometer first unscrewing fromthe stud, the stud breaks away lrom the test surface and leaves the cement-ing stud screwed tightly into the base ol the accelerometer. This can be verydiff icult to remove.
100 200 10 20Frequency
Fig. 4.18. The frequency response of a general purpose actelerometer mountedusing adhesives
5.
50861406
101

6. Threetypes of cementing stud are available. There is the 14mm diameterD80756 and 25mm D82790 which both use a 10-32 UNF thread compatiblewith the majority of BrUel&Kjer accebrdmeters. The former is available ina set of twenty five pieces under the number UA 0866. There is also an 8 mmdiameter version with an M3 thread (DB0757). This is available as a set of 25(uA0867).
4.4.9. Probes'
Fig. 4.19. The use of the Hand Probe YP0080 for rapid vibration measurements
- The limitatlons of this methbd must always be considered when making measurements wlthprobes.
102

ilethod:
1. Attach the accelerometer to the Hand Probe YP0080 via the 10-32 UNFthread. See Fig.4.19
2. Dip the tip of the probe into a small amount of sil icone grease and thenpress the tip onto the test surface ensuring that the shaft of the probe isheld perpendicular to it while preventing the tip from slipping.
Applications:
1. Only lor quick spot measurements and checks below 1000H2.
Advantages:
1. The most rapid mounting method available.
Disadvanlages:
1. The resonance frequency when mounted is brought down so low that it willlie within the frequency range of most vibration measurements and rendersthe results invalid. The use of low-pass filters is recommended when usingone of these probes. See Fig.4.20.
2. Yery poor repeatability
Frequency 6'1to
Fiq.4.20. The frequency response of a general purpose accelerometer mountedon the Hand Probe YP0080
103

Fig. 4.21. An inverted probe. The rubber effectively decouples the probe tube sothe probe resonance is not excited. The rounded cementing studprovides a smooth contact surface.
200 500 1 kHz 2
dB50
5102050
Fr€quency 6tsts/l
Fig. 4.22. The frequency response of a general purpose accelerometer mountedon an inverted probe
104
20

1.
Notes:
The application of sil icone grease is an attempt to raise the couplingstiffness. A slight extension of frequency range is obtainable when theround tip probe (DB0544) is in use.
An inverted probe similar to that shown in Fig. 4.21 can be constructedwhich allows for vibration measurements in locations where it is not possi-ble to reach the desired measuring point. A rounded cementing-studcan beused as a probe tip. This technique can offer improved high frequencyperformance compared to the first probe. See Fig. 4.22.
4.5. MECHANICAL FILTERS
The mechanical filter UA0559 is a very simple and useful device for use withmost Br0el&Kjar accelerometers. lt is available as a set of five (UA0553).
The following is a short list of the applications of the mechanical filter.
1. To measure low frequency, low level vibrations which are "hidden" by highfrequency, high level vibrations.
2. To protect the accelerometer from damaging high level shocks and to avoidzero shift effects.
3. To electrically insulate the accelerometer from the specimen.
4. To provide a defined upper frequency limit which is particulary useful whenthe preamplifier being used has no built-in filters.
5. To remove the influence of transverse vibrations.
4.5.1. Description
The Mechanical Filter UA 0559 is shown in Fig. 4.23. lt has a sturdy, corrosionresistant stainless steel body with a 10-32 UNF threaded hole in the base formounting onto test specimens and a 10-32 UNF thread screw on top forattachment to accelerometers. The upper part is bonded to an internal butylrubber core which electrically insulates it lrom the base whilst at the same timeacts as a low-pass filter between the structure and the accelerometer. There isa hole through the side of the mechanical filter through which a tommy bar maybe passed, thus locking the top and bottom sections together and protectingrubber core from undue twisting when an accelerometer is tightened onto thedevice. The tommy bar can also serve as a wrench with which to tighten thefilter to the vibrating surface. The recommended torque for this is 1,8Nm(15 lb in).
105

Fiq.4.23. The Mechanical Filter UA0559
4.5.2. Operation
The influence of the mechanical filter on the main axis and transverse re-sponse of an accelerometer is clearly shown in Fig.4.24. lt behaves as a low-pass filter, thus attenuating the main axis and the transverse axis resonances.Whereas the normal accelerometer resonance causes a sensitivity increase ofabout 30dB above the nominal sensitivity, the mechanical f i l ter causes a highlydamped resonance of only 3 to 4dB with a high frequency roll off of 40dB/de-cade. An added feature is that the cut-off frequency is adjustable simply byadding extra mass between the accelerometer and the filter. Sensitivity totransverse vibrations is also reduced.
Because the filtering process is dependent on the stiffness and dampingcharacteristics of the rubber there is a temperature dependency involved. Atlow temperatures the stiffness of the rubber core increases and the resonancefrequency increases accompanied by a decrease in damping. At high tempera-
Frequgncy zre/1
Fig.4.24. Typical main axis and transverse frequency response of aBrilel&Kjar accelerometer when mounted on the mechanical filter
106
@!
ID
coooE
Maln axis aesponse ot

Cutoff Frequency asfunction of Ambi
Temperature-r 1(X)r-
80
60
4{)
20
0
0,6Frequency Factor Relative to 20"C
Fiq.4.25. Typical temperature response of UA0559
tures the stiffness decreases accompanied by a decrease in resonance tre-quency and damping. These characteristics are shown in Fig 4.25.
lf the mechanical f i l ter is l ikely to be used in environments where there is oilor other hydrocarbons then it is recommended that a resistant silicone rubbersealant should be used around the top of the filter and at the entrance to theholes for the tommy bar.
Further details on the device are available in the appropriate BrUel &KjerProduct Data Sheet.
4.6. ACCELEROMETER CABLES
Incorrect vibration measurements are often caused by careless mounting androuting of the cable connecting the accelerometer to the charge amplif ier. Themain causes ol this are as follows:
1. When a coaxial cable is subjected to bending, compression or tension thescreening may become separated momentarily from the dielectric at pointsalong its length. Local changes in capacitance are created and so-called"triboelectric" charges are formed. This effect is known as the TriboelectricEffect and is particularly troublesome when measuring low level vibrationswhere it appears in the form of noise.
2. Yery strong electromagnetic fields can induce a voltage across the cableand this could cause extraneous noise in the measured signal.
3. In compression designs, bending forces can be transmitted to the piezo-electric discs via the connector if the cable is not prevented from vibrating.
Resonance Amplitude ldBl y7sc6
107

The first of these points can be effectively reduced by using special coaxialcable with a noise reduction treatment. This is a standard feature of all acceler-ometer cables supplied by BrUel &Kjar. 'In addition the cable should not besharply bent or twisted as this will not only reduce the noise reduction treatmentbut it will also damage the connectors. The cable should be clamped to the testspecimen to avoid excess relative movement which causes triboelectric noise.This is illustrated in Fig. 4.26.
Fig.4.26. Clamping the accelerometer cable to reduce cable noise
The second point is overcome by careful routing of the cable away fromsources ol high electromagnetic fields. lf this is not possible then either a line-drive system or a balanced accelerometer and special cable should be used.The benefits of these systems were examined in section 3.6 and summarized inTable 3.1. Consult the Industrial Accelerometer Product Data for details of theBalanced Accelerometer Type 8310 and Differential Charge Amplifier Type2634.
Most BrUel&Kjer accelerometer cable sleeves are constructed lrom mois-ture impervious Teflon for use in very damp environments. Additionally thecable connector may be sealed using a room temperature vulcanising rubberwhen the environment ls particulary wet. For details see section 4.2.5 onhumidity effects. For exact details on the range of cables available fromBr0el& Kjar, including hard-llne designs and curly cables, see the Br0el & KjerAccelerometers and Industrial Accelerometers Product Data Sheets.
Line-Drive accelerometers require only one cable for simultaneous transmis-sion of power and vibration signals. Ordinary two-conductor cables are oftenused as they are inexpensive compared to normal low-noise accelerometercables. lt should be stressed that when a line-drive accelerometer is used inenvironments where there are electromagnetic fields, a voltage will be induced
108
- - - - -- - \ \ ,-- \ .
- t t - -

in the cable. This voltage corresponds to the ground loop noise described insections3.6.3,3.6.4 and 3.6.6. These sections show that the Brtiel &Kjar l ine-drive system is more immune to ground-loop noise than systems based onconstant-current power supplies. However, it is always recommended to usecoaxial cables with l ine-drive amplif iers in severe industrial environments. Inless severe environments twisted-pair cables can be used.
4.7. GROUNDING PRECAUTIONS
ln multichannel vibration set-ups problems are often encountered where smallcurrents flow between the earth l ines of the measuring instrumentation. Thisphenomena is caused by the set-up being earthed at more than one point andthe potential of each earthing point being different.
Earthing can be made via the protective earth terminal of the instrumentsmains connector. The accelerometer housing can also form an earthing pointwhen it is in contact with an earthed structure such as as a machine. However,in some industrial environments there is always the possibil i ty that a machinehousing may not be at earth potential and may even be several volts aboveearth. This may be because the machine lacks a proper earth connection or theimpedance of the earth connection is not zero.
The screens of connecting cables are often connected to the chassis andcase of the instrument which is then connected to the ground. Therefore groundloop currents can tlow from one instrument to another via the screening on thecables or via the chassis of the instruments if the cases are touching.
Ground loops manifest themselves in the form of mains "hum" which isdetected at the final measuring point and effectively adds to the vibrationoutput signal. This gives rise to false vibration level indication. To prevent this itis necessary to "break" the loop in which the current is f lowing. There areseveral ways of doing this.
1. Ensure that the instrumentation is earthed at only one point in the chain andthat this earth connection is reliable.
2. Select a charge preampifier with an option to insulate the screen of the inputcable from the ground line of the preamplif ier. This is referred to as a"Floating Input". Consult section 3.6 for a detailed analysis of noise pick-upin preamplif iers.
3. Mount the accelerometer using an insulating stud as described in sec-t ion 4.5.1.
109

ln industrial environments it is advisable to use an electrically balanced andinsulated accelerometer with a differential am.plifier. This design of accelerome-ter reduces the effects of electromagnetic pick-up in the cable. The cable in thiscase contains two conducting cores, each with an individual screen. Bothscreens pick up the same interference. The differential preamplifier producesan output proportional to the signal difference in these conductors which,because of the design ol the balanced accelerometer, eflectively eliminates theelfect of the electromagnetic interference. Such a design will also reduce theeffects of ground loop voltages.
110

5. ACCELEROMETER CALIBRATION AND TESTING
s.1. TNTRODUCTTON
The accuracy, reliability and versatility of the piezoelectric accelerometer isonly of limited value if the vibration measurements cannot somehow be tracedto an absolute physical standard. lt is the purpose of calibration to ensure thatthe benefits can be utilized and hence provide a defined degree of conlidence inany vibration measurement. Accelerometer testing provides data concerningthe environment and operating l imits within which the calibration is valid.
Fig.5.1.The Calibration Chart. This section describes individual and batchcali brated specifications
Celibrltion Chrrt tolAcceleromeler Type rl38il
Seriaf No. .i.kAA!.7.L .
Rcb?cncc Scndlivily rl sOHz,'looms-2
and . . . . . . . .? l .c
Ch.rg. scn.lfivity. .31 !.A pcns-z o, 1?.r5. pCtg
Yoll.ec Sondlivilt'(incl AO (x)38)
......2ti1.5........ mV/ms-2 or .................2.h:j. nvrs(Voltage Preamp Input Capacitanco: 3.5pF)
crp.cttrnc (inct. cebte) . !.1.1y. pF
Ttpial CrFtrcltrncc ot ceble AO @38 ... . . l10pF
llarimun Tranrrprae Sanrillvllt(at 3)Hz, looms-2) ......................:. . . LE ./.
Typic.l Un.t.mp.d 1{!lu?.1 Fr.qucnct 51 kHz
Ttplcal Tranrvaraa ncaonrncc F?aquancy, using Ex-citer Tabl€ 4290. with accelerometer mounted on a tiia-nlum cube by a 10 - 32 UNF-2A stel stud, mountingtorque 1,8Nm and graas€d surfaces;
. . . . . . . . . lokHz
Polrrltt is posltive on the center of the connslor tor anaccelerellon dlrstad from the mounting $rface Into th€body ot the accelerometsr
noir|.nca minimum 20.000M0 at room l€mo€rature
o.*: .Ekr..Q.!.:...!.9..:......... stsnaturo: . iJ..,Q.. ,. .I 9 . 9,8o7mf,2 or loms-2 = r,o2g
(
. Thls callbratlon ls tro@able to the Nattonal Bur€au ot StandardsWGhinglon O C
BC 0r53-r2
EnYlronmantrl:Humidllt: Weld6d. SseledT.mFrrlura iang.: -74 to +25O"^C (-10O to +482"F)far. Shocl Accala.llaon: zokms-' psakTyplctl t.gncllc Scn.iliyily (sOHz - 0,03 T):1 ms-'/TTtplc.l [email protected] Sen.ilivitt: 0,fl)2ms-2 at 151d8 SPL(2 - 100H2)Ttpbrl Bu glr.in Scndtlvlty (st 25ote In baseplane): 0,01 ms-/t (ftpic.l Tcmpar.lu?. frrnrlcnl S.n.illvitt (3Hz LLF):0.1 ms-'/ 'CSpciflotlon. obtained in eccordance wlth ANSI S2.11-1969
Phy.isl:
| | 2tmnf7]tn'LAJP !
15 mm
Elrclrl€l Connclor
n" Coaxial l0 - 32 UNF-2A
t -m\./falarlrh Titanium, ASTM Grade 2S.ndng El.ncnl: Plgzo€l€ctrlc, tyge PZ23Waleht 17 gramCilalrrcllon: Delta Shealtounline Thr..d: 10 - 32 UNF-28fdn$ng sludi 10 - 32 UNF-2A xt3 mm, sl6lfounting sud.o Fl.ln6r: <3lrmIonung Torque Normal 1,6Nm. Mln 0,5NmMax. 3,5NmS.ltnlc trc 6,6 9r8mCcnt.t ot Gt.yllt of S.lanlc f,.tr 12,1mm trommounting 3urlacg on central axlsC.nl.? ol G?arltt of A€luomala.: 9.2mm trommountlng sudace on centrel axlsFor further Intormatlon s€ B&K'Plezoel@trlc Accaler-om€td and Preamplltlar" hendbook
Pet OK 131{rt
111

Every accelerometer produced at Bruel & Kjer undergoes the strictest pro-duction and quality control techniques to. ensure that the transducers are notonly reliable, and indeed likely to remain reliable, but also that the spread in theparameters amongst devices of the same type is small. The accelerometers canthen be individually calibrated to provide accurate data on several parameters.
Often, when we talk about calibration we are essentially referring to thesensitivity calibration. However, other parameters sueh as frequency response,capacitance and weight, as well as environmental effects, are given as part ofthe calibration information. Each accelerometer comes complete with an indi-vidual calibration chart containing extensive calibration information. Some ofthis information is individual to that particular accelerometer while some istypicaf of that type only. See Figs. 5.1, 5.2, and 5.3.
It is not the intention ol this Chapter to give a step-by-step guide on how toperform the calibrations. The Instruction Manuals on the particular calibrationequipment mentioned provide this information. However, the chapter will give acomprehensive overview of the calibration and testing of BrUel& Kjer acceler-ometers.
- Oate:
-owe. Lim, Freq; -Hz Wtiling Sped:-mm/soc Papet Speed:-mm/sec
Potont iomst€r:-ZeroLevel:- D A 8
Fig. 5.2. The Calibration Chart. This section shows an individual frequencyresponse curve
112

Ttplcal T.mparalurc gcn.ilivilt Deyirlion:lPl€zo€leclrlc Meterial PZ23)
Scham.lic Dnring ol Ercitat a2ec(Moditied laboratory teference)
.26
0
300"ca72F79ot9t
trlcli.h Stainless steol
Laa. of Ercll.. lablc: 1E0 gram
Lountad Rctonanca Frrqucnct obtained onlhe Exiter 4290 using lhe rscommendedmounting tshnique is shown on the atlach€dindividual Fraquancy Fsponaa CU'YC
founllne T.chnlqu.:Examln€ lhe mounting surface for cleanliness andsmoolhfross.It n€c€$ary, machin€ suda@ to lolerances shown inschemallc drawing ot Calibralion Exciler 4290Fast€n the.l3Ei, uslng a 10 - 32 UNF-zA stud. Take carenot lo oxce€d the recommond€d mounllng torque andlhal iho stud doss nol bonom in the mountlng holesA ttrln fllm ol oll or greas€ b€tween the ecceleromelerand the mountlng surface helps achiev€ good contacland improves mounting stifln€ss.For oth€r typ€s ol muntlng, s€€ B&K 'Plozo€lectrlcA@ol€romtor and Pr€amplltler" handbook
o32
Fig. 5.3. The Calibration Chart. This section contains general information
5.1.1. Why Calibrale an Accelerometer?
There are several reasons for performing a calibration apart from the basicone of establishing the link to the physical quantity with a definable degree ofaccuracy. In many cases there may be legal or contractual reasons that create arequirement for evidence of the accuracy of the tranqducer, possibly withreference to international standards.
Situations may also arise when the accelerometer is being used in a particu-lar set-up or environment where the performance of the accelerometer has notbeen documented in the calibration chart. ln this case it will be necessary forthe user to perform a calibration for that particular purpose. The calibrationchart is sufficiently comprehensive to cover most applications.
System checking also forms an important part of the calibration process,particularly in measurement systems consisting gf many instruments. Errorsmade in the computation of the overall system sensitivity can be avoided simplyby using a quick calibration check. This is outlined in section 5.3.5.
113

It ls always advisable, before any calibration is performed, that the frequencyresponse of the accelerometer is measured.. This will ensure that the acceler-ometer has not been damaged in any way. Such damage can show up asirregularities in the frequency response of the accelerometer implying that theaccelerometer is ruined or, at best, that the frequency range is limited. lf this isthe case then the calibration is no longer valid. The measurement of accelerom-eter frequency response is covered in section 5.4.2.
5.2. THE HIERARCHY OF CALIBRATION STANOARDS
5.2,1. The General Hierarchy
To avoid the necessity for carrying out absolute calibrations of each individ-ual transducer, a hierarchy of standard transducers is first established. Ahierarchy of thls kind is shown in Fig. 5.4.
Fundamentel Physlcal Quantlibs:L6ngth, Ma$, Tlme, Cur.ont, T€mpetature, Amount ot Substance, Lumlnoug Intonglty
lnt€rnatlonal and Netlonal Standard InstltutosMeasurlng proc€dures for fundam€ntal and derlv€d unltg
Vlbrsilon Laboratori€sOallbratlon ol Prlmary SienderdTrangducors, uslng traceabl€ Instrumenlgto m€asu.e tundamontal unlts. Callb.atlon(comparlson or absolute) otTranstor Standard Tran3ducets
Users of vlbretlon equlpmGnt (maklng comparlson calibratlon of WorklngReleronc€ Standa.d Transducers and mgasurlng Transducer8 In common use)
lvlbratlon Transducers In common usolL------__---___--J
114
Fiq.5.4. A general hlerarchy of callbration standards

Standard transducers are ranked into three groups;
1. Primary Standard Transducers. By definit ion, a calibration method whichestablishes the sensitivity of a transducer in terms of fundamental or de-rived units for physical quantit ies, such as the Sl system, is known as anabsolute method. A transducer which has been calibrated in this manner isa Primary Stanoard Transducer and is placed at the top of this hierarchy.Such transducers are kept at the International or National Standard Insti-tutes, or at the Calibration Laboratories where they have been calibrated.
2. Transfer Standard Transducers. These transducers are calibrated by thelnstitutes and Laboratories mentioned above. They are calibrated either bya comparison method, using a Primary Reference Standard, or by an abso-lute method.
Transfer Standard Transducers are interchanged and recalibrated betweenStandards Institutions to establish consistancy among these Institutions.Consistency between Calibration Laboratories and a Standards Institute isalso established by interchanging and recalibrating Transfer Standards. Inthis way, traceability is also established. Traceability defines which Stan-dards Institute is responsible for the establishment of the consistancy ol thecalibration performed at a Calibration Laboratory. Therefore, a transducercalibrated at that Calibration Laboratory is designated as "traceable" tothat Standard Institute.
3. Working Reference Standard Transducers. These transducers are usedfor comparison calibration of transducers in common use. Working Refer-ence Standards are calibrated by Standards Institutes or Calibration Lab-oratories using absolute or comparison methods. They are checked againstTransfer Standard Transducers. ln this way the traceability of the calibrationof transducers in common use is maintained.
5.2.2. The Hierarchy at Briiel & Kjar
The callbratlon of Br0el & Kjer accelerometers begins with the StandardReference Accelerometer Type 8305 (see Fig.5.5).
This is a piezoelectric accelerometer based on an inverted centre-mountedcompression design. The piezoelectric element is a carefully selected andprepared quartz crystal PZ 1OO which has been chosen for its low sensitivity totemperature fluctuations and excellent stability over very long periods of time.A threaded hole in the top of the accelerometer allows oJher accelerometers tobe mounted on to the top of this accelerometer for back-to-back accelerometercalibration (see section 5.3.3).
115
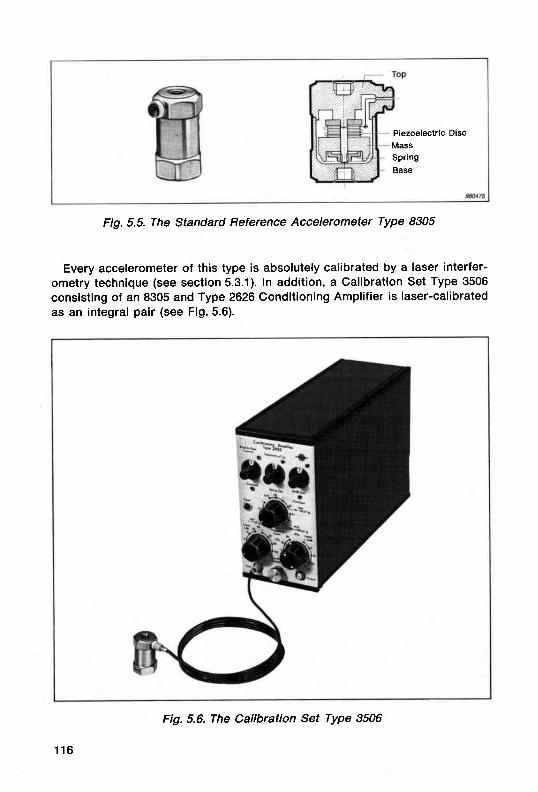
PiezoelectricMassSpringBase
Disc
Fig. 5.5. The Standard Reference Accelerometer Type 8305
Every accelerometer of this type is absolutely calibrated by a laser interfer-ometry technique (see section5.3.1). In addition, a Calibration Set Type 3506consisting of an 8305 and Type 2626 Conditioning Amplif ier is laser-calibratedas an integral pair (see Fig.5.6).
116
Fig. 5.6. The Calibration Set Type 3506

Two 3506's from BrUel & Kjer's calibration laboratory are regularly sent to theNational Bureau of Standards (NBS) in the United States at set t imes throughoutthe year. These Transfer Standards are always transported to the NBS by handrather than by normal mail ing services. This procedure ensures that Bruel &K-jar's laser calibration is consistent and provides for all 8305's to be traceableto the NBS.
A set of Primary Standard Accelerometers is established together with a setof Supplementary Standards which are kept in Denmark as insurance againstdamage to any of the Primary Standards.
The remainder of the range of BrUel & Kjer accelerometers are calibrated bya semi-automatic back-to-back comparison system in-house which employs aType 8305 as a Working Reference Standard.
A collection ot Transfer Standards is established for checking the calibrationsystems throughout the world at several BrUel & Kjer Service Centres and othercalibration laboratories. Here all types of accelerometers are calibrated for thecustomer by a back-to-back method using the Type 9559 Calibration System(see section 5.7.1). Other parameters may be calibrated using this system.
In this way BrUel &Kjer has evolved an efficient calibration hierarchy whichcan control the calibration process not only at the manufacturing stage but alsofor many years after the purchase of the accelerometer, while still maintainingthe traceability of the calibration of any accelerometer. This hierarchy is illus-trated in Fig.5.7.
XBS and othrC6llbrallon Inillules
B&K Las lnl€d€ro.frbr Canbrailon
Fiq.5.7. The hierarchy of calibration at Brriel&Kjer
117
5.2.3. The Accuracy ol Galibration Techniques
It is important to understand the differencd between traceability and accura-cy. Traceability only implies consistency with the calibration performed at aStandards Institute, and that the calibration is within tolerances. This meansthat if a Calibration Laboratory uses more accurate instruments than theStandards lnsititute to which they refer, the uncertainty of the calibrationperformed by the former will be less than that of the la{ter.
In order to evaluate the accuracy of various calibration methods the uncer-tainty of the calibration must be treated in a conslstent way. At BrUel& Kjar themethod described in the British Calibration Service Guidance Document No.3003 is adopted. The document describes a method for assigning a single (+)value of uncertainty to the measurement, including a statement of confidence,in terms of the probability, that the true value for the measulement lies betweenthe 1+ I l imits stated. For practical convenience the contributions to the calibra-tion uncertainty are classified into two categories
a) random uncertaintyb) systematic uncertainty
The uncertainty incurred in absolute and comparison calibration methods arenow examined.
Absolute Method. Using laser interferometry, theoretically the amplitude ofvibration can be determined to an accuracy of O,O2o/o. However, in practicemeasurement errors occur in the voltage measurement (0,1%), distortion in thevibration exciter motion (0,1%), tilting of the reference accelerometer (0,2%)and transverse motions of the reference accelerometer (0,1%). The estimatedinaccuracy of the absolute calibration of the Calibration Set Type 3506 and theStandard Reference Accelerometer Type 8305 has been calculated to be 0,6%at a confidence level of 99%.
Gomparison Method. This method is used by NBS to check the Br0el& KjerTransfer Standards. lt is also used by Br0el&Kjar to calibrate the range ofaccelerometers. lt results in an estimated total inaccuracy of better than 0,95%.This must be added to the uncertainty produced by the absolute calibration ofthe 3506 Calibration Set described above to give an overall estimatdd error forthis method ot 1,12Yo at a confidence level of 99%.
It must be remembered that these figures are based on the use of Br0el & K-jar's own in-house laser calibration system which is an absolute method.However the NBS comparison system is accurate to 1o/o. Therefore if the NBSfigures for the accuracy of the Type 3506 system are used, the overall estimatedinaccuracy of the comparison method is correspondingly increased to 1,38% ata confidence level ol 99%.
118

5.3. CALIBRATION METHODS
Sensitivity calibrations are divided into three distinct methods;
1. Absolute methods. These include Laser Interferometry and Reciprocitytechniques.
2. Comparison methods. This refers to the back-to-back method.
3. Calibrators. This involves the use of a vibration exciter of known vibrationlevel.
5.3.1. Laser Inlerlerometry
This absolute method of calibration involves the use ol very specializedequipment and it is therefore unlikely that average users of accelerometerswould ever carry out their own calibration ol this type.
Fig. 5.8 shows the arrangement used at Brriel & Kjer for the calibration of theStandard Reference Accelerometer Type 8305 and Calibration Set Type 3506.
The measuring arrangement centres round a Michelson Interferometer. Thelaser beam is directed at the upper surface of the Standard Accelerometer tobe calibrated, from which it is reflected back along the same path. Thebeamsplitter (semi-reflecting plane mirror) of the Interferometer is located inthis path and directs some of the beam reflected from the Accelerometer onto aPhotodiode. Some of the Laser beam reaching the Photodiode also comes viathe beamsplitter and the fixed mirror of the Interferometer, thus generating l ightfringes at the Photodiode. The amplified output of the Photodiode is fed into theinput of the Frequency Ratio Counter which measures the number of fringes perperiod which is proportional to the peak-to-peak displacement of the acceler-ometer.
The vibration frequency (a sinewave) is generated by the Sine Generator, whoseoutput is used as an External Clock for the Frequency Ratio Counter. Thevibration amplitude is adjusted until the displayed Ratio is correct. The electri-cal output of the Standard Accelerometer is measured using a ConditioningAmplifier and an RMS Differential Voltmeter, both of which have been calibrat-ed electrically.
The laser interferometer part of this set-up measures the peak-to-peakdisplacement of the 8305. From this the acceleration is derived using thefrequency read off the frequency counter. The sensitivify is obtained by mea-suring the electrical output from the accelerometer and dividing by the accel-eration.
119

srE'D:
92oo
Io
BHoefo
I!(o
tttF
3or-0!at,o
=o*d3oo
ooT€sC"oa0)
Dc,gao
6s
120

At Br0el &Kjar the excitation frequency used is 160H2 and the accelerationlevel used is 10ms-2.
5.3.2. Other Absolute ltlethods
Other methods of absolute calibration do exist. They are however not used atBr0el & Kjer and therefore are only briefly descibed here. The methods are:
1. Reciprocity Calibration. Until recently this method has been suggested inBr0el &Kjer l i terature as an absolute method which can be performed byanyone possessing basic, non-specialised equipment. The method is veryinvolved and good results are difficult to obtain. The method will not bedescribed in this handbook.
2. Calibration by using the Earth's gravity. In this method the accelerometer iscarefully turned in a vertical circle so that gravity alone is acting on theaccelerometer. This method is only practical at low frequencies and issometimes used with static (DC) accelerometers and is consequently notused at BrUel & Kjar.
5.3.3. Comparison Calibration by the "Back-to-Back" Method
The back-to-back method is used at BrUel & Kjer for the factory calibration ofevery type of measurement accelerometer. Br0el & Kjer use a semi-automatedsystem but a similar system can be built up by anybody wishing to perform theirown comparison calibration ol accelerometers.
The accelerometer whose sensitivity is to be measured is mounted in a back-to-back arrangement with a Standard Reference Accelerometer Type 8305 andthe combination is mounted on a suitable vibration source. Since the inputacceleration is the same for both devices the ratio of their outputs is also theratio of their sensitivit ies.
The Vibration Exciter Type 4801 or 4805 fitted with the Calibration Head Type4815 is designed for back-to-back calibration of accelerometers. The Type4815 has a built- in Standard Reference Accelerometer Type 8305. Consult theBrUel &Kjeer Product Data on this instrument for more details.
In its simplest form a back-to-back arrangement can be seen in Fig.5.9.The accelerometers are excited at a constant frequency and their outputs arepassed through preamplif iers (operating in charge or voltage mode dependingon whether the charge or voltage sensitivity is of ihterest) and measuredindividually by using any high quality electronic voltmeter whose accuracy isknown.
121

Accelerometerto be
Calibrated
ReferenceAederometer
Fig. 5.9. A simple arrangement for the back-to-back calibration of accelerome-ters. The accelerometer signals are passed through a preamplitierbefore the voltmeter
The previous system can be improved by using an expanded voltmeter devicesuch as the Sensitivity Comparator Type 2970 as part of the system (seeFig.5.10). By adjusting the sensitivity of the preamplif ier in the path of theunknown accelerometer a minimum deflection can be obtained on the 2970. Thesensitivity is then simply read off the dials on the conditioning preamplif ier.
Fig. 5.10. A complete high accuracy set-up for the back-to-back calibrationbased around the Type 2970 Sensitivity Comparator
122
Control and Balancing Slgnal
control SlgnalPrecision
CondltloningAmplltier
2650ol
2628
Sine/Nolse Generatol1 049
SensitivityComparatorType 2970
Unknown Accelerometer
Stendard AccelerometgrType 8305
Powe. Amplltlot2707

The Type 2970 performs the following roles:
1. Simplif ies the comparison of the outputs.
2. Increases the speed of the procedure.
3. Gives calibration accuracy similar to the one obtained by Broel & Kjar's ownfactory calibration and that ot NBS.
4. Performs voltage-to-charge conversion for voltage and charge calibrations.
The calibration frequency and acceleration level will vary according to thestandard with which it is necessary to comply. At BrUel &Kjer measurementaccelerometers are calibrated at a frequency of 160H2 al a level of 100ms-2.The Type 297O can only be used in the frequency range of 60 to 25OHz.
In practice it makes little difference at what level or frequency the accelerom-eter is calibrated providing they lie well within the normal working range of theaccelerometer. After all, accelerometers are extremely linear devices in fre-quency and dynamic range. In section 2.5.2 it was seen that the charge sensitiv-ity (and capacitance) of BrUel & Kjar general purpose accelerometers employ-ing piezoelectric elemenl PZ23 and PZ27 decreases at a rate of 2.5oh perdecade increase in frequency and therefore this effect can be accounted for ifthe sensitivity at another frequency is required. For example, the dilferencefrom 50Hz to 160H2 is approximately 1,3%.
When voltage sensitivities are measured it should be remembered that thevoltage sensitivity is only valid for the accelerometer and cable as an integralpair and these are calibrated together. lf the cable is changed the calibration isno longer valid.
5.3.4. FFT-based back-to-back calibration
It is possible to perform back-to-back calibration using a Fast Fourier Trans-form (FFT) approach. By using a BrUel& Kjar Dual Channel Analyzer Type 2032or 2034 it is possible to apply broad-band noise to the vibration exciter. Theoutputs of the reference accelerometer and the unknown accelerometer are fedinto the two channels of the analyzer. The analyzer computes a frequencyresponse function. After averaging it is possible to produce answers as to thesensitivity and relative phase of the unknown accelerometer over a wide rangeof frequencies.
As with any calibration set-up, the accuracy of the final calibration dependson the individual accuracies of each of the instruments constituting the set-up,and of the accuracy of the reference accelerometer at all frequencies, includingall those which are different from the lrequency at whicli the reference acceler-ometer was originally calibrated (i.e.160 Hz). For more details of this technique,contact your local Bruel & Kjar office.
123

5.3.5. The Use of Calibrated Vibration Exciters for Sensitivity Checking
Perhaps the most convenient and commonly used checking technique is theapplication of a calibrated vibration exciter. BrUel & Kjar produce an instrumentspecifically for this purpose. The method can be used by anybody makingvibration measurements.
Calibration Exciter Type 4294. This small, pocket-sized and battery-poweredinstrument is simply a calibrated vibration exciter which provides a fixedacceleration level of 10ms-2 RMS at 159,2H2 (1000rads/s) corresponding to anRMS velocity of 10mms-1 and an RMS displacement of 10pm. The accuracy isbetter than + 3%. lt is ideal for system checking in the field. Fig. 5.11 shows theType 4294 being used to check the sensitivity of an accelerometer using ameasuring amplif ier.
The Type 4294 can be used in two ways;
1. Accelerometer sensitivity checks.
2. System calibration checks and adjustment.
Accelerometer sensititvity checking is sirnply a matter of attaching the accel-erometer to the exciter head and measuring the output lrom the preamplif ier towhich the accelerometer is attached. This can be achieved by using a goodvoltmeter.
124
Fig.5.11. The Calibration Exciter Type 4294

An attractive feature of the Type 4294 is its ability to calibrate an entiremeasurement chain from accelerometer to analyzer. The overall system sensi-tivity can be measured regardless of the individual sensitivit ies of the instru-ments in the measurement chain.
In addition the gain can be adjusted on one of the instruments to give a fullscale deflection corresponding to the relerence acceleration produced by theexciter.
5.4. MEASUREMENT OF OTHER ACCELEROMETER PARAMETERS
Accelerometer sensitivity is the most commonly used measured parameter. ltis, however, by no means the only parameter most commonly measured for theaccurate measurement of vibration. We may wish to have individually measuredinformation on the following:
1. Transverse sensitivity
2. Frequency response
3. Mounted resonance frequency
4. Gapacitance
Most of these parameters are individually measured for each individualaccelerometer produced by Br0el & Kjer.
The measurement of environmental parameters is covered in section 5.5
5.4,1. Transverse Sensitivity
Fig. 5.12. A special exciter similar to this is used at Brtiel & Kjer to measure thetrensverse sensitivity of an accelerometer
125

At BrUel & Kjer transverse sensitivity is measured by using a special custom-built vibration table similar to that shown in Fig.5.12. The platform onto whichthe accelerometer is mounted is vibrated in ihe horizontal plane at an accelera-tion of 100 ms-2 and at a f requency of 30 Hz. At the same time the accelerometermounting platform at the centre of the table slowly rotates. This alters thedirection of the transverse vibration applied to the accelerometer. The output ofthe accelerometer is measured and the maximum transverse sensitivity can befound. The direction of the minimum transverse sensitivity is also determinedand is indicated by a red dot on most BrUel & Kj@r accelerometers.
5.4.2. Frequency Response
Fig.5.13 shows a set-up similar to that used at BrUel &Kjer for the measure-ment of the frequency response of all measurement accelerometers except forthe miniature types.
Fig. 5.13. A set-up to measure the frequency response of an accelerometer
The Galibration Exciter Type 4290 (see Fig. 5.14) is driven by the sine genera-tor over a lrequency range from 2OOHz to 50kHz. The moving element of theType 4290 is a 180gram steel head which has a carefully finished mountingsurface with a tapped fixing hole providing the optimum mounting arrangementfor the accelerometer.
The acceleration at the table is kept constant over the frequency range by
126
Voltm€ter/Amplifier
2125
ConditioningAmplltier (1)
2626Accelerometer
under test
Level Recorder2307
Frequency Synchronisation (Cable AQ 0035) i

Fiq.5.14. The Calibration Exciter Type 4290
means of a feedback signal (compressor loop). A miniature accelerometer builtinto the exciter head provides a signal relating to the actual acceleration. Thissignal is fed into the compressor section of the generator where it is used toregulate the output level of the generator automatically so that constant accel-eration is obtained at the exciter head. The output from the accelerometer to becalibrated is then passed through a preamplifier and to a level recorder.
Apart from the miniature types and Type 8310, each Br0el & Kjer accelerome-ter is supplied with an individual frequency response curve recorded in thismanner. The mounted resonance frequency stated on the calibration chart canbe identified from this curve. By knowing the response of the accelerometer atany particular frequency one is no longer l imited to rigid frequency l imits
The following points should be remembered when measuring the frequencyresponse of an accelerometer using this technique:
1. The mounting of the accelerometer onto the exciter head is critical. Poormounting can result in misleading errors in the frequency response curve.For further details consult section 4.4
127

Constant acceleration ol the exciter head is not possible unless there issufficient gain in the feedback (compressor). loop. lt is advisable to checkthat the acceleration of the exciter head is constant over the frequencyrange of the measurement. This is done by feeding the output of the controlaccelerometer into the level recorder via its preamplifier and adjusting thepreamplifier gain and generator compressor speed accordingly. This meth-od is described in the lnstruction Manual for the sine generator or excitercontrol in use.
Over 30kHz the accuracy with which the compressor maintains a constantacceleration at the exciter head decreases rapidly. However, the range upto 50kHz still gives a reliable check of the mounted resonance frequency.
5.4.3. Undamped Natural Frequency
This parameter has little practical use in vibration measurements. Neverthe-less it is quoted on the calibration chart because it is a fundamental accelerom-eter parameter. There are two alternative methods for measuring it.
The accelerometer is suspended by its cable and is excited electrically from avoltage source coupled through a 1 nF capacitor. The undamped natural fre-quency is defined as that frequency at which the voltage and the current in theaccelerometer are in phase. An approximation of this is obtained by monitoringboth the voltage across the capacitor and across the accelerometer and findingthe frequency where there is a 90' phase difference between the two. This is
Oscilloscope
Fig. 5.15. A set-up for the measurement of the undamped natural trequency ofan accelerometer
128

most easily done uslng a set-up similar to the one shown in Fig.5.15 where anoscilloscope is used to simultaneously monitor both these quantities. By adjust-ing the excitation frequency a circular Lissajous figure is formed when thecorrect frequency has been found.
In the second method the accelerometer is once again suspended by itscable, but this time it is given a mechanical shock by tapping its base. Theaccelerometer signal is fed via a charge amplifier into a storage oscllloscopewhere a trace ot the decaying oscillations is obtained. By measuring the periodol one oscillation in this response and taking its reciprocal, the undampednatural frequency is obtained.
5.4.4. Capacitance
The capacitance of an accelerometer can be defined as the ratio of its chargesensitivity to its voltage sensitivity and can be calculated from these twocalibrations. This is how the value on the callbration chart is obtained.
ll the capacitance is measured at a frequency of 1000H2 with a capacitancebridge, a different value to the one calculated in the first paragraph is found.This is caused by the capacitance decrease of 2,5o/o per frequency decade forpiezoelectric elements. The measurement voltage may also be different.
The typical capacitance noted on the calibration chart includes the effect ofany cable supplied for use with, or as an integral part of, the accelerometer. Tocalculate the capacitance of the accelerometer alone it is necessary to subtractthe effect of the cable capacitance. A typical value for the cable capacitancecan be found on the calibration chart.
5.5. DETERilIINATION OF THE EFFECTS OF THE ENVIRONMENT ON THEACCELEROMETER SPECIFICATIONS
The accelerometer calibration chart has a section giving details on thesensitivity of the accelerometer to environmental phenomena. This sectiondeals with the methods Bruel&Kjer use to determine these sensltivities.
5.5.1. Temperature Transient Sensitivity
This is measured by mounting the accelerometer on an aluminium blockwhose-mass is approximately ten times that of the accelerometer and slowlylowering the combination into a container containing water at a temperature ofapproximately 25'C greater than the room temperature. Care is taken not toinduce any vibration in the set-up:
129

The preamplifier is set to give a lower limiting frequency ot 3Hz, with a6dB/octave roll-off. The peak output from the aqcelerometer is measured on astorage oscil loscope. The acceleration required to produce this output is calcu-lated lrom the sensitivity of the accelerometer and divided by the temperaturechange to obtain the temperature transient sensitivity.
5.5.2. Temperature Sensitivity
lf a measurement accuracy better than 1 or 2 dB is required when makingvibration measurements at temperatures significantly removed from room tem-perature, it is advisable to use the information given on the Calibration Chart toobtain a correction factor for the sensitivity of an accelerometer. The informa-tion is provided in the form of a graph of the change in sensitivity and capaci-tance from the values obtained at the calibration temperature (room tempera-ture). Voltage, charge sensitivity and capacitance all vary with temperature.
For BrUel & Kjer accelerometers, individual calibration of temperature depen-dence is unnecessary because piezoelectric materials of the same type willhave similar dependencies. The temperature curves can then be obtained frombatch tests and preprinted on all the calibration charts for accelerometers ofthe same type.
To measure the temperature dependence, the accelerometer is mounted on aspecial vibration exciter incorporating a push rod which passes into an environ-mental chamber. The accelerometer to be calibrated is mounted on a tablefitted to the end of the rod inside the chamber, and the exciter and referenceaccelerometer are attached to the other end of the rod, outside the chamber.The table used at BrUel& Kjer can accommodate up to twenty accelerometers(depending on their size). Calibration is performed at a low frequency so thereis no risk ol inaccuracies caused by resonance in the rod or table. The mea-surement of temperature dependence is a time-consuming procedure becauseit is essential to allow sufficient t ime for the accelerometers to reach equil ibri-um temperature. There must be no thermal gradients which would otherwisemodify the sensitivities.
When this technique is used, the temperature dependence of accelerometercapacitance may be deduced from that of the voltage and charge sensitivities.
5.5.3. Base Strain Sensitivity
Base strain sensitivity is measured by mounting the accelerometer near thefixed end of a heavy steel cantilever beam. Strain gauges are attached to thebeam around the accelerometer. The beam is given a displacement at the freeend and the accelerometer base is stressed by this motion. The output from the
130

strain gauges is monitored on a storage oscilloscope along with the accelerom-eter output. When the strain falls to a level ot 25O pe the accelerometer output ismeasured and the acceleration required to produce an equivalent output iscalculated. This acceleration is divided by the strain and the base strain sensi-tivity is obtained. A typical value is given on each calibration chart.
5.5.4. Acouslic Sensitivity
It is difficult to accurately measure the acoustic sensitivity of an accelerome-ter without mechanical interference from the acoustic actuator producing mis-leading results. At Br0el &Kjer the accelerometer is mounted inside a specialchamber which is rigidly secured to a high pressure microphone calibratorwhich produces a sound pressure level of 154dB inside the chamber. Thisarrangement ensures that the minimum possible vibration is transmitted to theaccelerometer.
The output from the accelerometer and its preamplifier is passed through afrequency analyzer and the calibrator is excited with a swept frequency sinewave. From the spectrum of the accelerometer output it is possible to deter-mine which part of the signal is due to the acoustic excitation and which is dueto the vibration transmitted trom the piston ol the actuator. The latter willnormally mask the former at frequencies above 100 Hz which is why the acous-tic sensitivity specification is only quoted in the 2 to 100 Hz band. However, theresults are estimated to be valid up to frequencies of several kilohertz. At thesehigh frequencies the wavelengths are comparable to the dimensions of theaccelerometer.
5.5.5. Magnelic Sensil ivity
This is also a difficult parameter to measure accurately. At BrUel & Kjer theaccelerometer is placed in the centre of a large coil and an alternating magneticfield is created by passing 50 Hz mains through the coil. In the centre of the coilthe field strength is 0,03T. The accelerometer is rigidly fixed to a heavy supportso that electromagnetically induced motion of the accelerometer and fixing isminimized. The output lrom the accelerometer is measured and converted to asensitivity as in the examples above. The following points are considered.
1. The induction of a current in the clamping ring around the elements isunavoidable. This current wil l react with the magnetic f ield and the ring, andthe piezoelectric elements to which it is secured, will move.
2. There wil l be some induced motion of the seismic masses because they wil lhave some magnetic permeability, however small it may be.
3. Currents will be induced in the accelerometer cable.
131

As it is not possible to isolate the individual contributions of these effects, thecumulative eflect is taken and used to derivq the magnetic sensitivity.
5.5.6. Temperature Limits
Temperature limits are defined as the maximum and minimum temperaturesat which it is possible to use the accelerometer. There mubt not be more than asmall and well defined change in any calibration parameter after the accelerom-eter has had 24 hours to "recover" at room temperature.
At BrUel&Kjer this is achieved simply by heating the accelerometer in anoven or cooling it in a freezer. When it is taken out again a full check of thecalibration is performed aller 24 hours. A 2o/o change in sensitivity is allowed.
5.5.7. Shock Limits
Shock limits are determined by mounting the accelerometer on a hydraulicmachine which strikes the accelerometer one hundred times in short succes-sion at a known shock level. This is repeated in all 3 axes of the accelerometer(x,y and z) and a calibration of sensitivity and frequency response is then made.The maximum shock is taken as the lowest shock in any axis which causesmore than a 2% change in sensitivity .
The shock limits are measurement limits provided that the preamplifler usedwith the accelerometer can accomodate the very high input charge presented toit by the accelerometer. In the rare case that a high sensitivity accelerometer isused to measure shock, the accelerometer output can be reduced using acharge attenuator. See section 3.2.4.
5.6. FACTORY TESTING OF ACCELERO]TETER CABLES
Fig.5.16 shows a set-up similar to that used at Brriel&Kjar to test the lownoise performance of accelerometer cables. The cable is terminated by a loadwhichTepresents a general purpose accelerometer and one end is subjected toa preloading force. The output from the cable is fed into a charge preamplifier.The cable is then connected between .the two end supports and its centre isclamped onto a shaker. The cable is excited, using narrow band randomvibration centred around 80 Hz. The output of the cable is measured. lf a cableis too noisy it is rejected. At Br0el&Kj@r every AO0038 cable is individuallytested. All other cables are batch tested.
132
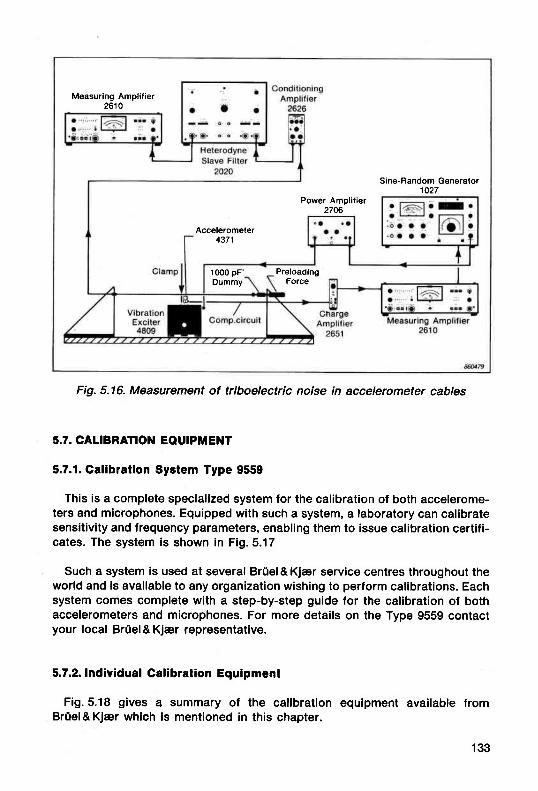
Measuring Amplifier261 0
Sine-Random Gen€rator1027
Power Amplif ier2706
Accelerometel4371
1000 pF'Dummy
PreloadingForce
Fig. 5.16. Measurement of triboelectric noise in accelerometer cables
5.7. CALIBRATION EOUIPIIENT
5.7.1. Galibration System Type 9559
This is a complete specialized system for the calibration of both accelerome-ters and microphones. Equipped with such a system, a laboratory can calibratesensitivity and frequency parameters, enabling them to issue calibration certifi-cates. The system is shown in Fig.5.17
Such a system is used at several Br0el & Kjer service centres throughout theworld and is available to any organization wishing to perform calibrations. Eachsystem comes complete with a step-by-step guide for the calibration of bothaccelerometers and microphones. For more details on the Type 9559 contactyour local BrUel&Kjar representative.
5.7.2. Individual Calibration Equipment
Fig.5.18 gives a summary of the calibration equipment available fromBr0el&Kjer which is mentioned in this chapter.
133

Fiq.5.17. The Calibration System Type 9559
5.8. STANDARDS RELATING TO THE CALIBRATION OF ACCELEROMETERS
At BrUel & Kj@r the wide range of accelerometer calibrations and tests com-ply with ISO 5347-"Methods for the Calibration of Vibration and Shock Pick-ups". This paper contains outl ines of the techniques which are recommendedfor the various calibrations of accelerometers and should be consulted forfurther.details.
Other standards relating to calibration are;
ANSI 52.11-1969-"The selection of calibrations and tests for electrical trans-ducers used for measuring shock and vibration"
ISO/DP 8042-"Characteristics to be specified for seismic transducers for shockand vibration measurements"
Brit ish Calibration Service Guidance Document No. 3003
134

Type 4290 Galibration Exciter Small vibration exciter for use in acceler-ometer frequency response measure-ments. Used with B & K Sine Generators.r Max. force level 3N. Frequency Range
200 Hz to 50 kHzr Built-in accelerometer for level regu-
lation of generator
Galibration Head Type t1815 Primarily intended for high accelerationcalibration of accelerometers and othermeasuring transducers using back-to-back and laser interferometer methodsr Built-in Standard Reference Acceler-
ometer Type 8305r Fits Exciter Body Type 4801 or Perma-
nent Magnet Body Type 4805r Accelerometer Calibration possible
over a frequency range from 5 Hz to10 kHz
Type 2!J7O Sensitivity Gomparator Rapid back to back comparison calibra-tion of accelerometers. Used together withCalibration Set Type 3506 and PrecisionConditioning Amplifier Type 2650.r Cafibration accuracy + 1,02oh al99o/o
confidence level
Type 4294 Calibration Exciter Pocket-size vibration reference source forcalibration of accelerometers or measur-ing systems.r Fixed RMS level 10ms-2 !3oh al
1 59,2 Hz (1 000 radls)r Internal batt. supply
(1 x tEC 6LF22)
Type 35116 Galibration Sel Consists of Reference AccelerometerType 8305 plus Conditioning AmplifierType 2626 calibrated as integral pair usinglaser interferometry method. For use in ac-celerometer calibration set-ups.
fot0t9@o
Fig.5.18. A summary ot calibration equipment available trom Br0el &Kiar
135

136

6. APPENDICES
137

APPENDIX A
Table 1. Conversion of length
Table 2. Conversion of velocity
Table 3. Conversion of acceleration
m cm mm tt n
1 100 1000 3,281 39,37
0,01 1 10 0,0328 0,3937
0,001 0,1 1 0.00328 0,03937
0,3048 30,48 304,8 1 12
0,0254 2,54 25,4 0,0833 1fuuTcao
m/s km/h ftlmin mile/h'| 3,6 196,85 2,2369
o,2778 1 54,68 o,6214
5,08 x 10⁻³ 1,829 x 1O-2 1 1,136 x 10-2
0,4470 1,6093 88 1
fotNSGB()
g mls2 cm/s2 ftls2 in/s2
1 9.81 981 32,2 386
o,102 1 100 3,281 39,37
0,00102 0.01 1 0,0328 0,3937
0,03109 0,3048 30,48 1 '12
0.00259 0.0254 2,54 0,0833 1fotN9@0
138

kg tekma gram lbs oz
1 0,102 1 000 2,2046 35,274
9,807 1 9807 21,6205 345,93
1fi3 1,O2 10{ 1 2,205 10-3 3,527 10-2
0,45359 4,625 1o-2 453,59 1 16
2,835 1o-2 2.8908 1o-3 28,35 6,25 10-2 1
fot09tGBo
Table 4. Conversion ot weight (mass)
Table 5. Conversion of force
Table 6. Converslon of pressure
N kp lb ftls2
1 0,102 7,23299,807 1 71,0
0.1379 1,405 10-, 1TOlW
N/m2 mbar mm H2O atm in WG psi1 10-2 0,102 9,869 10-6 4,02 10r 1,4505 10-4
100 1 10,917 9,868 10-4 0,402 1,4504 10-2
9,807 9,807 10-2 1 9,678 10-5 3,937 10-2 1,4223 10-3
1,013 10s 1013 1.0332 104 1 406,77 14,696
249,10 2,491 25,4 2,453 1o-3 1 3.605 10-2
6908,9 69.089 704,49 6,805 1o-2 27.736 1
tol@G&
139

J=Ws kwh Kpm kcal Btu it tb
1 2,778 1(r'. 0,1020 2,39 ' 10r 9,48 104 0,7376
3,6 1011 3,6710 101860 3413 2,655 10t
9,807 2,7241 10-6 1 2,3423 10^ 9,2949 1o-3 7,233
4187 1 ,163 103 t27 1 3,9685 3087,4
1056 2,93 101107,59 0,251 98 1 778
1,3558 3,766 1o-7 0,1383 3,239 10-4 1,285 10< 1
Table 7. Conversion of work, energy and heat
kw kpm/s hk kcal/h ft lb/s hp
1 102 1,36 860 738 1,34
9,81 1o-3 1 1,33 1 0-2 8.44 7,23 1,32 1o-2
0,735 75 1 632 542 0,986
r ,16 1o-3 0,119 1,58 10r 1 0,858 1,56 1 o-3
1,36 0,138 1,84 1o-3 1,17 1 1,82 1o-3
0,745 76 1,014 642 550 1
2,93 1o-'{ 2,99 1o-'? 3,99 10{ o,252 0,216 3,93 10{
3,52 35,9 0,479 3024 259 o,471
Table 8. Conversion of Power
Symbol Prefix Multiple
GMkcmItnp
gigamegakilo
centlmil l i
micronanopico
1oe10610310-21 o-31o-€1 o-e1 o-12
Table 9. Commonly used Prefixes
140

APPENDIX B
VIBRATION NOMOGRAM
The vibration nomogram is a graphical description of the relationship be-tween frequency, displacement, velocity and acceleration for simple harmonicvibrations. lf any two parameters are known the other two can be simply readoff the chart.
10
vllaiq, Di9lffi€nr rnd A@t€ration, RMS y!tu6
Hr 1n 00
141

APPENDIX C
VIBRATION STANDARDS
Due to the continously evolvlng nature of standards and the varlety of stan-dards around the world, the incluslon of a set of relevant stAndards would havelimited value. However, Br0el&Klar have a publlcatlon 'Natlonal and Interna-tional Standards and Recommendations-Acoustlcs; Vibratlon & Shock, Luml-nance and Contrast" which ls avallable from your local Br0el& Kjar represena-tive agent. A selectlon of the maln standards in thls area publlshed by everystandard authority ln the world are included along wlth the addresses of theauthorities.
APPENDIX D
BRIIEL & KJIER VIBRATION LITERATURE
Br0el&Kjar produce a large number of technical education publications inthe lield of vibratlon. They are dlvlded up into the followlng categories:
Primerr. These A5 slze baslc texts offer a simplifled introductlon lnto thetheory and application of a selected subject area. In the fleld of vlbratlon thereare presently three primers; Measuring Vlbration, Vibration Testing and Ma-chlne Health Monltoring. All three are available from your local Br0el&Kjarrepresentative.
Application Noteo. These short papers are published regularly and concentrateon the application of Br0el&Kjar equipment to a partlcular area of currentlnterest.
Technical Review. Thls ls publlshed four times a year and deals wlth theapplication of Br0el&Kjar lnstruments and special developments whlch thecompany may consider of Interest to customers.
142

Books. Several books on vibration are available from Br0el & Kjar. Here is aselection;
"Mechanical Vibration and Shock Measurements'"Frequency Analysis""Modal Testing - Theory and Practice""Modal Analysls of Large Structures"
A list of current Appllcatlon Notes and Technical Revlews is avallable onrequest.
143

APPENDIX E
Summary of preamplifiers currently avallable from Br0el & Kjer. The Line-driveAmpfilier Type 2644 is covered in Chapter 3. For more information consult theProduct Data Sheets on these types
Pl€rmplilielTyPe
2695
Sdiglt .en.itivitycondilionlng, low
noile chrlgeemplifie?
a:a
3-digit .endtivitycondilioning, low
nolae charge
terau|€menftoder
AccelsrationVeloclty
Dlsplac€mentAcceleratlon
AmplitielSen.alivaly
0,1 mV to 10 V/pC(-20 to + 80 dB) 0,1 mV to 1 V/pC
(-20 to + 60 dB)
Fr€quencyRlnge (-3 dB limit.) 0,1 Hz to 200 kHz 0,3 Hz to 100 kHz
Selectlble LowFr.quenctLimit. (-3 dB llmit.) High
O,2i 1i 2i 10 Hz (10% llmlts) 0,3: 3; 10; 30 Hz
0,1; 1; 3; 10; 30;> 100 kHz (10% limlts)
1;3; 10;30;> 100 kHz
Power Supply lnternal batterlesor Ext. DC
AC Malns
OlhetFaalu|r!
Ov€rload Indlcator,Test oscillator. Battery
condltlon Indicator
Overload Indlcator.Dlrect and transformel
coupled outputs
Applicrtion.Fleld measurement of vibra-tlon. Underwater sound mea-
surement with Hydrophon€s
Gen€ral purpose measure-msnts. Comparlson callbratlon
of accelerom€ters
144

E3-Uni-Grin .en.itiYlty tet-ting.. Cha?ge amplilier. verylow lraquenct merauiement
cep.bilily
,t
sm.ll, ?obu!t, rdiu.tlble g.an,ch.rgc rmplifier. Excellent.l€ctromagnelic rudirtion lm-
munity
tl digit .on.itiyity conditioning.Low noile charge rnd Yolllge
.mPliliel
AccelerationV€loclty
Acceleration Acceleration
0,1-1-10mV/pC(-20 to + 20 dB)
0,9 to 10mV/pCinternally adJustable
(0 to 20 dB)
0,1 mV/pC to 100mV/pC. 100 mV/V(-20 to + 40 dB)
0,003H2 to200 kHz
1 Hz to 200 kHz 0.3 Hz to 200 kHz
0,003;0,03;0,3;1 Hz 0,3;3Hz;2kHz
200 kHz 1;3; 10;30;> 200 kHz
Ext. DC Ext. DC AC Mains
Input slgnal-ground floating
or grounded
Normal or dltlerentialInput. Can be tixed to
machlng frames
Overload indlcatorTest osclllator
Multi-channelmeasurem€nt9
shock measurements
Vlbration measuremsntsln industrlal envlronmentsP€rmanent installatlons
Comparlson calibratlonof accelerometers.
General measurementsIW9GBI
1tl6

APPENDIX F
Accelerometers can be connected directly to these instruments. For moredetails consult the Product Data Sheets on these types
InalruneilTyPo
2511
Yibrltbn tctctInteg].ling Yabr.lion
tat€ra
Dercriptlon A v€rsatlle vlbratlon m€t€r forg€neral vlbratlon m€agurgment
Economlcal and acrurate vlbratlonmet€rs for day-to-day use
nosuramantIoda.
accgtgraltonr YEloGtIy
dlsplacomgnt accaleratlon, voloclty
Frrquency rlnga(€dB)
0.3 Hz to 15 kHz 10 Hz to 10 kHzr
8.Lct!blefraquaDctllnlt ({rlB}
LLF 1,3 and 1O HzlULF 1 and 15 kHl
LLF28 Hz and 10 HzULFz 1 kHz and 10 kHz
Dclaclora RMSTruo Psak-to-P€ak
On€ minut€ LcqRMS. Max. P€ak
PouorSupplt
Int€rnal battery€xtornel DC Internal batt€ry
lnpul Charge Oharge
llote.
1. 0,3H2 and 3Hz lor accel-eratlon mode
2. Wlth 1 kHz S€l€cted the2511 can b€ us6d ln vlbra-tlon sov€rlty measur€ments
1. When llnear w€ightlng ls selectedR€lated to llnear, Hand-Arm andVlbratlon S€verlty measurements(lSO/DPs34g and lSO2954)2513 uses Sl units. 2516 useslmperlal. 2513/WH 2134 ls a slm-plltled verslon ot thes€ Instru-m€nts
2.
3.
146

7fi7zt 0060
T.pc Rocordel
2515
Ylbrltlon Anlltucr
. ! !
! . ! .
A fully portable Instrument for tleldand laboratory r€cording ot vlbratlonand sound data uslng plugJn module
zM 0060
A poworful FFT analfzer tormachlne vlbratlon analysls,Includlng machlns health
monltorlng, f ault dlagnoslsand balanclng
acceleratlon, v€loclty acc€laratlon, v€loclty, dlsplac€m€nt (analogu€)
0.3 Hz to 16 kHzi 0,3 Hz to 20 kHz (-1 dB)l
LLF0,3,1 and 10 Hz LLF 0,3 Hz or 3 HzULF up to I sel€ctable, dependlng on analysls mode
Total RMS In addltlon to many trequency enalysls optlons.
Plugln battery boxexternal Dc
Internal battery,ext€rnal Dc
Charge Chargs, Voltag6, Llne-drlve
1. D€pends on tape speed
1. Th€ followlng tacllltles are availeble:Constant Perc€ntage Bandwlth analysls fff/o and 23o/ol,Narrow Band Analysls, Zoom Analysls, Scan Analysls,Cepstrum Analysls, Sp€€d Compensatlgn, SpectrumComparlson, Mass Storag€
fqg:xEl
147

APPENDIX G
RaE(,)*o
oco!
t4q)q)
cooo()o-a
*ois)ro
a
asuoq)q)
oc
qrcEQ(! or
s.c<)\! - 'sSE
-pSb\ (r,9obs
o@
@oo
o
6
o
N
@
g=gEr=
6
148

149

APPENDIX H
150

Type U.ighl
(gr.m.)
Senilivity
vo|tege I chargemYtmta I pClmf(rnv/g) | hc/c)
F|rquencyRange+10%Linil(kHz)
l{oltble Cher.cle.irlic. Applicllion A!€..
13740,65
(€xcludlngcablo)
= 0,18(- 1,8)
:0,11(= 1,1)
26Miniature Shear Type wlth €xtremely lowwelght and hlgh resonance frequencyIntegral cable. Unl-Gaino sensltlvlty High level and hlgh trequ€ncy vlbra-
tlon m€asurementsShock measurementsVihralion mdtsuremanlR dn .lclicale
4393 2,4 = O,48(B 4,8)
0,316 + 2Vo13,10 + 2o/ol
16.5Mlniature Delta Shearo Type with lowwgight and hlgh resonance frequency
43752,4
(excludlngcable)
= Q,r[$(= 4,81
o,316 + 20/o13,10 + 2oh'
16,5Mlniature Delta Shear@ Type with lowwelght and high resonance trequency.Integral cable
structureg and In contined sDaces
.1391 16= 0,8(- 8)
1 + 20/o(9,81 r 2%)
l2Delta Sheero constructlon withUni-Gain @ sensitlvlty leaturing an insulatedbase and TNC top connectot
Suitable for general shock andvlbration measurem€nts
437'l 11= 0,8(= 8)
1 + 2o/o(9,81 ! 2o/ol
12,6Side
Connector
TopConnector Delta Shear@construcilon
T"p wlth Uni-Galno sensltlvltes
Connector tor easy system calibratlon
Sld"Connector
4384 11= 0,8(= 8)
1+zYo19,81 ! 206l
12,6
43,,,2 17= 2,6
(e 26)3,'16 + 2Vo(31,0 ! 2o/ol
8,4
4383 17x 2,6l= 261
3,16 ! 2o/o(31,O !2o/ol
8,4
4390 173,16 + 2c/o pAlms'2
(O1,0 + 2o/opAlgl8,4
Llne-Drlve accelerometer wlth Uni-Gain osensltivity and D€lta Shearo deslgn
Sultable for general vlbration workand also tor dlrect connectlon lo B & KDual Chann€l Slgnal Analyzers
4370 tt o8(= 80)
10 + 2o/o(98,1 + 2olo)
4,8 conl?to, Detta shearo constructton G€neral vlbratlon measurementsHigher s€nsltlvlty for low levelmeasurements4381 43 *8
(= 80)10 + 2o/o
(98,1 ! 2chl4,8
Slde sensnttityConnector
4378 175=26
(= 260)31,6 + 2Yc
(310 ! 2.hl3,9
^^__-:^.^_ Very hlgh s€nsltlvity Unl-Galno Type accelerom€t€rs
Slde of Delta Shear@ construc-Connector tlon
Sultable for €nvironments where onlylow level vlbratlons are €ncounter€d
4379 175*f r
(= 260)31,6 + ?/o
l31Q ! 2o/o)3,9
8318 470316 + 2Vc pAtms-2(3100 + !/o pAlgl
1Delta Shearo deslgn featurlng bullt-tnLln€-Orlve preampllfle, and veryhlgh sensltlvlty. Unl-Galno sensitivlty
very low level vibratlon measuro-ments. Bullt-ln low pass tllter giveswell detined upper frequency limlt
&xlg3
(excludlngcabl6)
= 0,04(* 0,4) -
0,004(= 0,04) 54
Small slz6. smm integral fixlng stud.Integral cable
Shock measurements up to 1 mllllonms-2. High trequency vibrationm€asurements
4321 55= 0,8(= 8)
1!2Vo(9,81 ! 2o/ol
12Thre€ Delta Sh€ar@ accelerometers ot thesame Uni-Galno sensltivity combined into aslngle unit
For measuremenls of vlbrallons In 3mutually p€rpendicular directlons
fyp,e 4322 is used wlth the Type 2512Human Respons€ vibratlon Met€r lomeasure Whole Body Vlbratlon
4322 3{t0= 0,8(o 8)
'l + 2o/o
19,81 !2%l
0,1In rubbor
pad
Three Delta Shearo Uni-Galno typeaccelerometers mounted In a rubber andmetal housing
8{n5 & = O,125(- 1,251
5,3(2% llmlt)
Quertz element wlth very hlgh stablllty andwlde temperatur€ range. Laser callbratedto + 0,6% accuracy
Reference Standard Accelerom€terfor back-to-back calibratlon ofaccel€tometers
8it10100
(excludlngcable)
* 1,0(= 10)
1 +zYo(9,81 i 2%)
9Integral stalnlsss ste6l cable and hlghtemperature operatlon up to 400'C.Unl-Galno sensltlvlty
831 5 102 * 2,5(- 251
1O + 2o/o(98,1 + 2olo)
8,1Electrically balanc€d and Insulated for lownoise In strong electromagngtlc flelds
usg In the most sever€ €nvlronmentalcondltions otten encounted In perma-nent vlbration monitoring sltuatlons
831 7 1129,16 + 2% pAlms-2(31,0 + 2o/c pAlgl 7,5
Bullt-ln Llne-Drlve amplilier for low nolseSafe for us€ in €xploslve envlronm€nts.Uni-Gain@ sensltlvlty
(tl
Summary of accelerometer types currently available from Brilel&Kjer. Consult the latest General PurposeAccelerometers, lndustrial Accelerometers and Standard Reference Accelerometer Product Data Sheets forcomplete details

Bri,iel & Kier "#r'DK-2850 Narum Denmark . Teleohone: +452800500 Telex. 37316 bruka dk
Engl ish DK 880694-12