Pierre-Pascal Urbon, CEO/CFO August 13, 2015 · 8/13/2015 · Analyst / Investor Presentation...
24
Date, Author SMA Solar Technology AG SMA SOLAR TECHNOLOGY AG Analyst / Investor Presentation Half-Yearly Financial Results: January to June 2015 Pierre-Pascal Urbon, CEO/CFO August 13, 2015
Transcript of Pierre-Pascal Urbon, CEO/CFO August 13, 2015 · 8/13/2015 · Analyst / Investor Presentation...

Date, Author SMA Solar Technology AG
SMA SOLAR TECHNOLOGY AG Analyst / Investor Presentation Half-Yearly Financial Results: January to June 2015 Pierre-Pascal Urbon, CEO/CFO August 13, 2015

Disclaimer
IMPORTANT LEGAL NOTICE
This presentation does not constitute or form part of, and should not be construed as, an offer or invitation to subscribe for, underwrite or otherwise acquire, any securities of SMA Solar Technology AG (the "Company") or any present or future subsidiary of the Company (together with the Company, the "SMA Group") nor should it or any part of it form the basis of, or be relied upon in connection with, any contract to purchase or subscribe for any securities in the Company or any member of the SMA Group or commitment whatsoever.
All information contained herein has been carefully prepared. Nevertheless, we do not guarantee its accuracy or completeness and nothing herein shall be construed to be a representation of such guarantee.
The information contained in this presentation is subject to amendment, revision and updating. Certain statements contained in this presentation may be statements of future expectations and other forward-looking statements that are based on the management's current views and assumptions and involve known and unknown risks and uncertainties. Actual results, performance or events may differ materially from those in such statements as a result of, among others, factors, changing business or other market conditions and the prospects for growth anticipated by the management of the Company. These and other factors could adversely affect the outcome and financial effects of the plans and events described herein. The Company does not undertake any obligation to update or revise any forward-looking statements, whether as a result of new information, future events or otherwise. You should not place undue reliance on forward-looking statements which speak only as of the date of this presentation.
This presentation is for information purposes only and may not be further distributed or passed on to any party which is not the addressee of this presentation. No part of this presentation must be copied, reproduced or cited by the addressees hereof other than for the purpose for which it has been provided to the addressee.
This document is not an offer of securities for sale in the United States of America. Securities may not be offered or sold in the United States of America absent registration or an exemption from registration under the U.S. Securities Act of 1933 as amended.
2

Date, Author SMA Solar Technology AG
1. Executive Summary

SMA is the Clear #1 in the Global PV Inverter Industry with a Sound Strategy and a Unique Positioning
4
SMA serves all markets - More than 100 countries covered -
SMA serves all segments
- Complete Product Portfolio -
SMA performs under all conditions - High Operational Leverage -
- Low Break Even Point -
- Low Capital Intensity -
1. Executive Summary | 2. Market & SMA Segments | 3. Financials & Investment Highlights

Highlights H1 2015
SMA Increased Sales and Improved Profitability During the First Six Months of 2015
1.Guidance H1 2015: Sales: €400 m to 450 m; EBIT: €-15 m to -25 m 2.Cash Flow H1 2015 is impacted by severance payments 3.Net Working Capital= Inventory+Trade Receivables- Trade Payables
(no advanced payments included); As of last 12 months sales 4.New full year guidance 2015: Sales: €800 m to 850 m;
EBIT: €0 to -25 m 5
Key Financials (in € million)1
> Transformation project is on track and will deliver € >160 million fixed cost savings by the end of 2015
> New products (high runner) for market segments Residential, Commercial and Utility launched on-time
> Best positioned for energy storage demand and close cooperation with European and American car makers as well as with battery manufacturers
> Strategically important projects won: e.g. c. 34 MW O&M in UK; c. 24 MW storage in South Korea
Sales
Gross Margin
EBIT
Free Cash Flow (Adj.)2
EBITDA
H1 2014 H1 2015
429
17%
21
-15
-22
341
14%
-17
-62
-15
Net Cash 225 211
Guidance increase on July 9, 2015 is backed by good performance in H1 2015 and strong order backlog4
Change
26%
n.m.
n.m.
n.m.
-6%
1. Executive Summary | 2. Market & SMA Segments | 3. Financials & Investment Highlights
NWC Ratio2 32% 26%
2. Market and SMA Segments

In the Past, Demand was Mainly Stimulated by Incentive Schemes - In the Future, Market Drivers will Change
7
SMA has the technology, which becomes pivotal for new business models and new markets
> All key solar regions are driven by the regulatory environment - the main goal is to reduce CO2-emissions and to change the energy mix towards renewable energies
> In future, technology will predominately drive growth, not regulation
> Technology improvement will allow i.e. the convergence of energy supply and demand and thus open up new business models1
> With the transition towards flexible, decentralized power generation the inverter is at the core of integrated, sophisticated energy systems
Renewable Energy in Emerging Markets2 Renewable Energy in Developed Markets
1.The ability of classical market players to share the future market design is limited due to their financial situation
2.Many emerging markets subsidize diesel fuel prices but usually not renewable energies
3.SMA estimate
> Today, emerging markets mainly rely on diesel gensets for energy generation
> Solar will become the key energy source in sunbelt regions due to the ease of installation and the attractive cost point
> LCOE for diesel gensets depend on fuel price and genset efficiency (OpEx), while LCOE for PV depend on irradiation level and PV system costs (CapEx)
6
20 5
10
11 LCOE
PV
Range
30
Diesel Genset
Price advantage: €-Cent15 to 20 /kWh
(- 60% to -70 %)
Leve
lize
d C
ost
of
Ele
ctri
city
(LC
OE)
in
€-C
en
t/k
Wh
3
1. Executive Summary | 2. Market & SMA Segments | 3. Financials & Investment Highlights

SMA’s Market Outlook Improved Since the Beginning of the Year1 – The PV Market Remains Volatile and therefore Difficult to Predict
8
> In APAC (esp. China), growth in demand is higher than expected - Japan will experience a slight decline, whilst India is on its way to become a multi-GW-market
> North America remains strong, esp. in the utility segment - Latin and South America announced programs to grow solar installations
> In Europe the UK will loose importance in 2016 - at the same time France is expected to grow its share in renewable energies
> New technologies and fast changing market dynamics will accelerate the consolidation process in the inverter industry (e.g. Advanced Energy exited the solar market in June 2015)
Global PV Installations per Segment/Region2,3
According to IHS, SMA is clearly the global #1 player in the solar industry4
GWdc € billion
Comments
13 16
2327
Residential
Commercial
Utility
2015
48
6
2014
41
5
1,6 1,5
1,6 1,8
1,00,9
2015
4,4
2014
4,1
Trend ’16
1.2015: from 45 to 48 GWdc;, raise in forecast affects APAC, especially China
2.Excluding Off-grid and Hybrid systems
3.Source: SMA MI Market Model, prices according to IHS World Market Report (July 2014)
4. IHS PV Inverter Report Q2/2015
2,3 2,2
0,9 1,0
1,10,9
2015
4,4
2014
4,1
Trend ’16
1. Executive Summary | 2. Market & SMA Segments | 3. Financials & Investment Highlights
2528
910
108Americas
2015
APAC
EMEA
48
2014
41
c. +17% c. +7%

SMA has the World’s Largest Installed Base with a Cumulative Power of > 35 GW1
9
SMA is best positioned to serve all market segments and power ranges
SMA Commercial (> 20 % of 2015 Group Sales) SMA Utility (>35 % of 2015 Group Sales)
> New 60 kW US unit & 25 kW JP unit
> Simple installation
> Low maintenance costs
> Comprehensive plant performance analysis
1. Thereof >12 GW for utility applications and > 23 GW of string inverters 2. Sunny Central Inverter + MV transformer + MV Switchgear 3. In Europe and North America
SMA Residential (> 25 % of 2015 Group Sales) SMA Service (> 5 % of 2015 Group Sales)
> New 2.5 MW turnkey solution2
> Less design work
> Less working capital
> More yield
> New 1.5 kW unit
> Simple installation
> O&M Service3
> Largest service infra-structure for fast response > Advanced preventive monitoring features to
secure investments > Ease of integration into the home grid
> PV Monitoring via smartphone or tablet
2.6
m
Sunny Tripower Sunny Central
Sunny Boy
1. Executive Summary | 2. Market & SMA Segments | 3. Financials & Investment Highlights

3. Financials & Investment Highlights

Sales by Segments (in € million)
America and EMEA each Account for c. 40 % of SMA’s Group Sales1
11
Group Sales (in € million)
The business unit Utility remains the strongest segment in Q2 2015 – however, the business units Residential and Commercial gained importance
26%
H1 2015
87%
H1 2014
73%
2014
429 76%
341
805
Germany
International Share
86
34
63
98
72
121
31
56
176
114
Utility
Other Business
Service2
Commercial
Residential
H1 2015
H1 2014
1. Sales by Regions: Americas 41%, EMEA 40%, APAC 19% 2. Internal and external sales
1. Executive Summary | 2. Market & SMA Segments | 3. Financials & Investment Highlights

X-Rate and Higher Sales Have a Significant Positive Impact on EBIT
12
SMA EBIT (in € million)
-15
-62
-165
2014 H1 2015 H1 2014
EBIT-margin by Segments
Depreciation/Amortization -107 -36
SMA reaches the upper end of the earnings forecast for the first six months of 20152
-2
Other Business
Service
-32% -40%
7%
Utility 9%
-4%
Commercial -25% -24%
Residential -9%
-22%
H1 2015
H1 2014
-45
One- Offs1 -129 -25 -12
1.H1 2014: €7.5 million Impairment on Working Capital; Loss in Zeversolar: €8.0 million; R&D impairment: €7.0 million; Others €2.6 million H1 2015: €7.3 million Impairment on Working Capital; Loss in Zeversolar:
€3.4 million; R&D impairment: €1.3 million 2. Ebit-Guidance H1 2015: € -15 to -25 million
1. Executive Summary | 2. Market & SMA Segments | 3. Financials & Investment Highlights
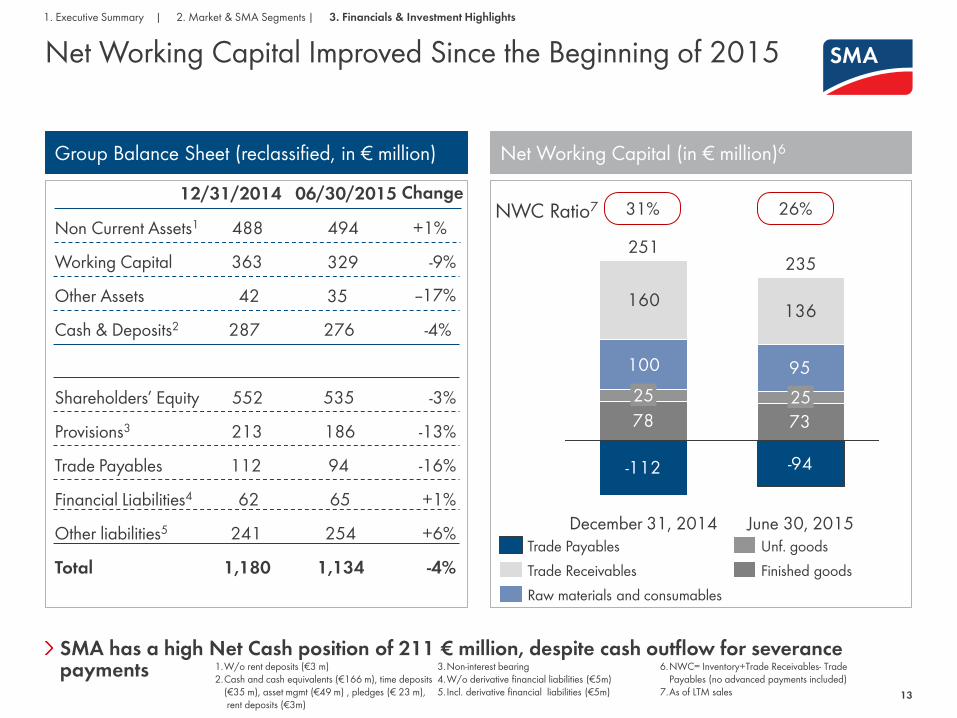
SMA has a high Net Cash position of 211 € million, despite cash outflow for severance payments
Net Working Capital Improved Since the Beginning of 2015
13
Group Balance Sheet (reclassified, in € million) Net Working Capital (in € million)6
Non Current Assets1
Working Capital
Cash & Deposits2
Other Assets
12/31/2014
Shareholders’ Equity
Trade Payables
Provisions3
Financial Liabilities4
Other liabilities5
Total
488
363
42
287
552
213
112
241
62
1,180
06/30/2015
1.W/o rent deposits (€3 m) 2.Cash and cash equivalents (€166 m), time deposits
(€35 m), asset mgmt (€49 m) , pledges (€ 23 m), rent deposits (€3m)
3.Non-interest bearing 4.W/o derivative financial liabilities (€5m) 5. Incl. derivative financial liabilities (€5m)
6.NWC= Inventory+Trade Receivables- Trade Payables (no advanced payments included)
7.As of LTM sales
494
276
535
186
94
254
65
1,134
+1%
-9%
-4%
-3%
-13%
-16%
+6%
+1%
-4%
Change
-112 -94
78 73
100 95
160136
June 30, 2015
251
25
December 31, 2014
235
25
35
329
--17%
31% 26% NWC Ratio7
Finished goods
Unf. goods
Raw materials and consumables
Trade Receivables
Trade Payables
1. Executive Summary | 2. Market & SMA Segments | 3. Financials & Investment Highlights

The Increase of Cash Flow from Operating Activities is Mainly due to Lower Trade Receivables
1.R&D capitalization: H1 2014: €16 million, H1 2015: €19 million
14
Cash Flow (in € million)
H1 2014 H1 2015
Net Income
Gross Cash Flow
Net Capex1
Free Cash Flow (Adj.)
Cash Flow from Operating Activities
Net Investments from Securities and Other Financial Assets
Free Cash Flow (IFRS)
-45
-42
-33
32
-65
50
-15
-21
-5
12
32
-20
--2
-22
n.m.
n.m.
n.m.
0%
n.m.
n.m.
-51%
Change
The Free Cash Flow is impacted by severance payments
1. Executive Summary | 2. Market & SMA Segments | 3. Financials & Investment Highlights
Key transformation measures (FTE)1
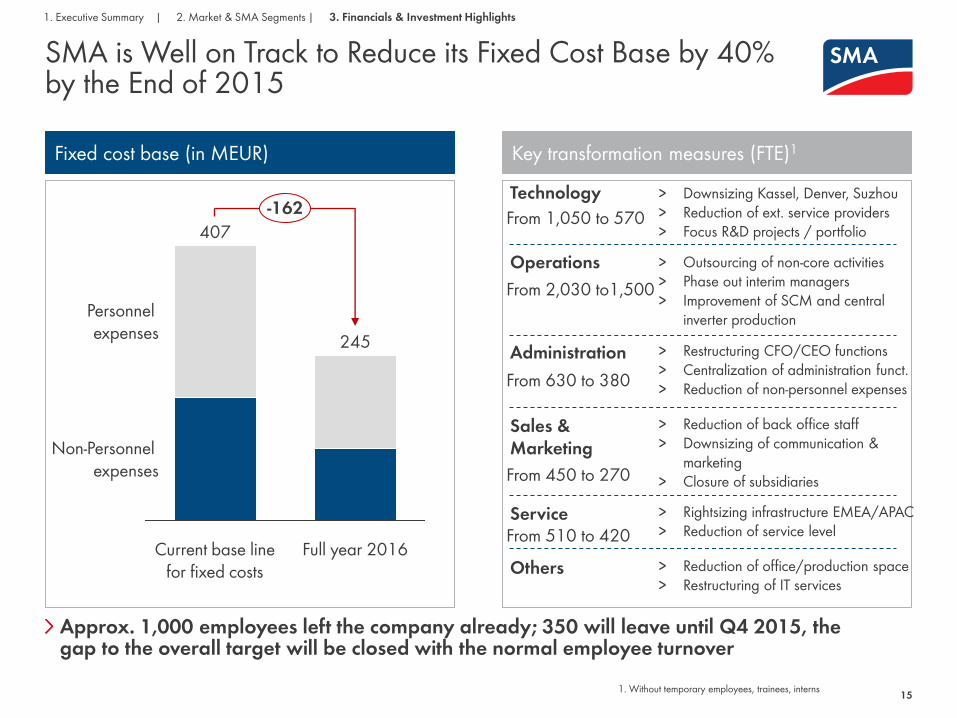
SMA is Well on Track to Reduce its Fixed Cost Base by 40% by the End of 2015
15
Fixed cost base (in MEUR)
Technology > Downsizing Kassel, Denver, Suzhou > Reduction of ext. service providers > Focus R&D projects / portfolio 407
245
-162
Current base line for fixed costs
Personnel expenses
Non-Personnel expenses
Full year 2016
Operations > Outsourcing of non-core activities > Phase out interim managers > Improvement of SCM and central
inverter production
Administration > Restructuring CFO/CEO functions > Centralization of administration funct. > Reduction of non-personnel expenses
Sales & Marketing
> Reduction of back office staff > Downsizing of communication &
marketing > Closure of subsidiaries
Service > Rightsizing infrastructure EMEA/APAC > Reduction of service level
Others > Reduction of office/production space > Restructuring of IT services
From 1,050 to 570
From 2,030 to1,500
From 630 to 380
From 450 to 270
From 510 to 420
1. Without temporary employees, trainees, interns
Approx. 1,000 employees left the company already; 350 will leave until Q4 2015, the gap to the overall target will be closed with the normal employee turnover
1. Executive Summary | 2. Market & SMA Segments | 3. Financials & Investment Highlights

2015 Sales & EBIT-Guidance (€ million)
SMA Increased its Guidance in Light of Successful First Six Months and Strong Order Backlog
16
Order Backlog by Segments (in € million)1
The order intake remained strong in July 2015; SMA targets a positive free cash flow in 2015
1. As of June 30, 2015 2. Only Utility, Commercial, Residential, Others
345
46
137
28
39
Residential
Service
Commercial
Utility
Others
1. Executive Summary | 2. Market & SMA Segments | 3. Financials & Investment Highlights
2014 2015
800-850 805
EBITDA
EBIT
-58
-165
45 to 70
0 to -25
Total: €595 million
Order Backlog by Region1,2
Americas: 40% EMEA: 34% APAC: 26%

SMA is a Technology Driven Company With a Global Presence and a Flexible Business Model
Direct exposure to the global solar market
SMA has been the #1 for solar inverters for more than 2 decades
Proven technology and game changing new products
Flexible business model and best-cost sourcing strategy
Powerful sales and service infrastructure
Transformation process will lead to significant cost reduction
Bankable partner due to high equity ratio and net cash position
Conservative planning assumptions, despite unique positioning
17
Stable shareholder structure with Danfoss as strategic anchor investor
1. Executive Summary | 2. Market & SMA Segments | 3. Financials & Investment Highlights

SMA Solar Technology AG
Backup
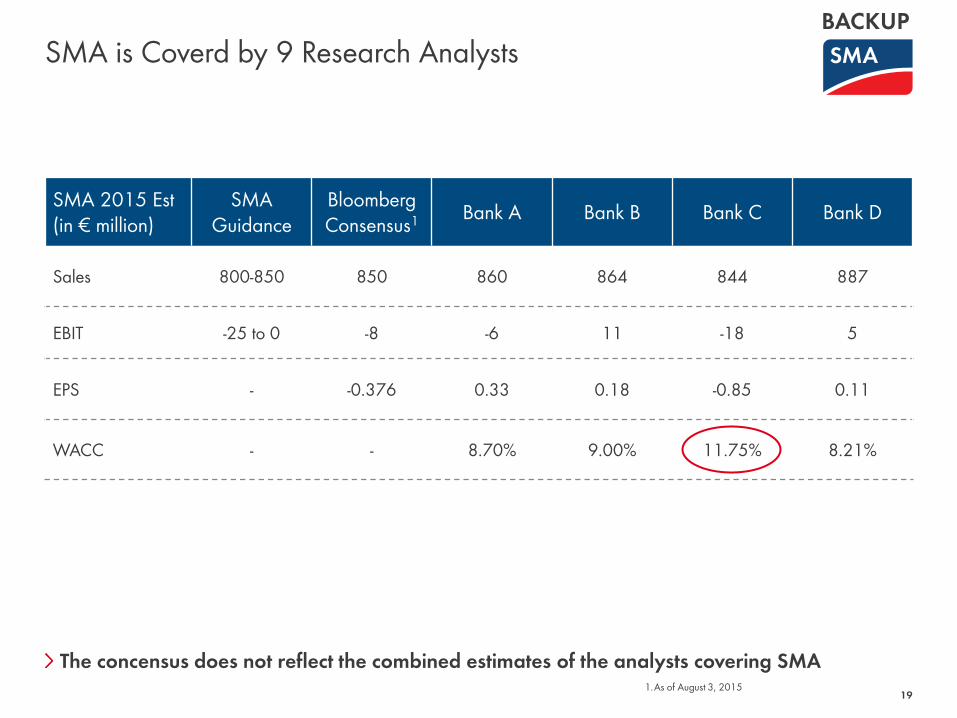
SMA is Coverd by 9 Research Analysts
19 1.As of August 3, 2015
SMA 2015 Est (in € million)
SMA Guidance
Bloomberg Consensus1 Bank A Bank B Bank C Bank D
Sales 800-850 850 860 864 844 887
EBIT -25 to 0 -8 -6 11 -18 5
EPS - -0.376 0.33 0.18 -0.85 0.11
WACC - - 8.70% 9.00% 11.75% 8.21%
The concensus does not reflect the combined estimates of the analysts covering SMA
BACKUP

20
14 %
16 %
18 %
20 %
Q2 2015 Q1 2015 Q42014 Q3 2014 Q2 2014 Q1 2014
-60
-40
-20
0
20
40
Q2 2015 Q1 2015 Q1 2014 Q2 2014 Q42014 Q3 2014
0
50
100
150
200
250
300
Q2 2015 Q1 2015 Q42014 Q3 2014 Q2 2014 Q1 2014
17 %
2014
18-20 %
2015
-58
2015
45-70
2014
Gro
ss m
arg
in
EBIT
DA
in €
mill
ion
Sa
les
in €
mill
ion
Development of Key Financials BACKUP
805 800-850
2015 2014

21
0
20
40
60
80
100
120
Q2 2014 Q3 2014 Q1 2014 Q2 2015 Q1 2015 Q42014
0
20
40
60
80
100
120
Q1 2014 Q1 2015 Q2 2015 Q42014 Q3 2014 Q2 2014
0
20
40
60
80
100
120
Q1 2014 Q2 2014 Q42014 Q3 2014 Q2 2015 Q1 2015
159
2014
190-200
2015
2014 2015
300-320 282
Co
mm
erci
al
Util
ity
Resi
den
tial
Development of Key Financials (Cont‘) – Sales Development by Segment in (€ million)
BACKUP
230-240
2015 2014
249

22
0
5
10
15
20
25
Q2 2015 Q1 2015 Q42014 Q3 2014 Q2 2014 Q1 2014
0
5
10
15
20
25
Q2 2015 Q1 2015 Q42014 Q3 2014 Q2 2014 Q1 2014
74
30-40
2015 2014 Oth
ers
Ser
vice
Development of Key Financials (Cont‘) – Sales Development by Segment in (€ million)
BACKUP
41
2014 2015
>50

23
20 %
22 %24 %
26 %
28 %
30 %32 %
34 %
36 %
6/30/14 3/31/14 12/31/14 3/31/15 6/30/15 9/30/14
0 %
10 %
20 %
30 %
40 %
50 %
60 %
6/30/15 6/30/14 3/31/15 9/30/14 3/31/14 12/31/14
23-26 % 31 %
2014 2015 NW
C r
atio
Eq
uity
ra
tio
Development of Key Financials (Cont‘) BACKUP
2014
47 %
2015
> 47 %
1

SOCIAL MEDIA www.SMA.de/Newsroom