PIEDMONT AND CAROLINIAN FALL 2014 ON BOARD ... Carolina Train Service Study PIEDMONT AND CAROLINIAN...
43
North Carolina Train Service Study PIEDMONT AND CAROLINIAN FALL 2014 ON-BOARD SURVEY RESULTS NCDOT Rail Division Prepared by Parsons Brinckerhoff January 2015
Transcript of PIEDMONT AND CAROLINIAN FALL 2014 ON BOARD ... Carolina Train Service Study PIEDMONT AND CAROLINIAN...

North Carolina Train Service Study
PIEDMONT AND CAROLINIAN
FALL 2014 ON-BOARD SURVEY RESULTS
NCDOT Rail Division
Prepared by
Parsons Brinckerhoff
January 2015

1 | P a g e
TABLE OF CONTENTS
EXECUTIVE SUMMARY................................................................................................................2
1 INTRODUCTION ...............................................................................................................3
1.1 Study Description ................................................................................................3
1.2 Route Description ................................................................................................3
2 METRICS AND OBJECTIVES ..............................................................................................5
3 DATA COLLECTION ..........................................................................................................5
3.1 Survey Design and Administration ......................................................................5
3.2 Database and Quality Control .............................................................................7
4 DATA SUMMARY.............................................................................................................7
4.1 Rider Profile and Passenger Demographics .........................................................7
4.1.1 Passenger Residence ................................................................................8
4.1.2 Gender, Age, and Ethnicity .......................................................................9
4.1.3 Socioeconomics ......................................................................................10
4.1.4 Passenger Communications ....................................................................11
4.2 Trip Specifics......................................................................................................12
4.2.1 Boarding and Alighting ...........................................................................12
4.2.2 Access and Egress ...................................................................................15
4.2.3 Trip Purpose ...........................................................................................16
4.2.4 Alternative Travel Mode .........................................................................16
4.2.5 Other Trip Specifics ................................................................................17
4.2.6 Type of Ticket and Booking Method .......................................................18
4.3 Customer Satisfaction and Passenger Preferences ............................................19
4.3.1 Trip Experience .......................................................................................19
4.3.2 Importance Rating ..................................................................................19
4.3.3 Other Services and Additional Comments ...............................................21
5 EVALUATION .................................................................................................................22
6 CONCLUSION .................................................................................................................26

2 | P a g e
EXECUTIVE SUMMARY
North Carolina Department of Transportation Rail Division contracted Parsons Brinckerhoff to complete a passenger rail study in the fall of 2014 to gain an understanding of the characteristics of rail users in North Carolina. The fall 2014 survey is a follow-up to a similar survey conducted in the spring of 2014. This passenger study considers nearly 6,000 surveys completed by passengers aboard the Piedmont and the Carolinian passenger trains. Initial analysis of the data highlights a few trends among the participating passengers. A brief list of the general findings includes:
1. Using the train to commute to work is very rare. Commuting accounts for less than 2% of the Piedmont ridership, and less than 1% of the Carolinian passengers;
2. Booking tickets through the mobile app and the internet decreases in popularity with increasing age, while the inverse is true for ticket window and telephone reservations. Additionally, purchasing tickets on-board the train, through a travel agent, or at the ticketing kiosk, is relatively uncommon;
3. Riders falling within the middle age groups (35-49) are less likely to use the train for visiting family and friends than the other riders, but they are more likely to ride the train for business purposes;
4. Riders with a higher income level are more likely to use the train for business as well as leisure;
5. Both the Piedmont and Carolinian are chosen by those intending to visit family/friends, partially in order to avoid highway traffic, and relax;
6. The Piedmont is more popular with students, while the Carolinian is more popular with the elderly and those visiting family/friends.
3 | P a g e
1 INTRODUCTION
The North Carolina Department of Transportation (NCDOT) Rail Division conducted this survey in fall 2014 to validate and supplement data collected during an earlier survey period (spring 2014). Both recent surveys were intended to update information regarding passenger demographics and origin/destination statistics for both the Piedmont and Carolinian routes. Information gathered through the survey effort could be used to guide the development of a marketing plan to improve awareness and establish a brand for North Carolina’s state-supported intercity passenger rail program. Additionally, the survey data highlights potential areas where operations and level of service may be adjusted to optimize the use of resources while maintaining rider satisfaction.
1.1 Study Description
A survey was distributed, completed, and collected on-board the Piedmont and Carolinian. Surveys were administered by North Carolina Volunteer Train Hosts who were trained to brief passengers about the questions on the survey and how to handle situations such as incomplete forms and nonparticipation. The survey process was conducted in November 2014, before the Thanksgiving holiday period. In total, over 6,000 completed responses were received, covering all six daily, state-supported trains. The survey responses have been electronically entered and analyzed using Microsoft Excel and Access. The results have been compiled and displayed for easy interpretation.
1.2 Route Description
The Piedmont and Carolinian passenger rail corridors operate along 173- and 704-mile routes, respectively. Together, the state-supported services run three daily round trips in North Carolina and along the eastern seaboard. The Piedmont serves nine stations between Raleigh and Charlotte. The Carolinian operates along the entirety of the Piedmont corridor and extends north beyond the state boundary to connect with the Northeast Corridor. Figure 1 displays the train schedules adapted from the Amtrak System Timetable.

4 | P a g e
Figure 1 Piedmont and Carolinian train schedules (adapted from Amtrak System Timetable)
Table 1 displays select performance metrics provided by Amtrak and compares November 2014 and April 2014 values that correspond with spring and fall survey times. The ridership and revenue numbers are comparable, while on-time performance and satisfaction show significant discrepancies. Between the two survey periods, Amtrak’s customer satisfaction surveys switched from paper to electronic form.
Table 1 Performance metrics during the operating months when surveys I and II occurred
Ridership Revenue On-time Performance
Overall Customer Satisfaction
APR 2014 NOV 2014 APR 2014 NOV 2014 APR 2014 NOV 2014 APR 2014 NOV 2014
Carolinian 27,774 24,920 $1,690,553 $1,614,300 77% 66% 0.83 0.75
Piedmont 14,353 15,384 $291,984 $325,330 84% 73% 0.99 0.92

5 | P a g e
2 METRICS AND OBJECTIVES
The goal of surveying passengers on the Carolinian and Piedmont is to discern ridership trends by doing the following:
1. Summarize the most popular train stations; 2. Compile a list of the demographics that describes a majority of the ridership along these
two routes; 3. Highlight potential marketing channels by analyzing ridership characteristics and
common sources of media; 4. Evaluate customer satisfaction with regards to the services currently provided.
By summarizing the information collected and examining trends, it may be possible to adjust services to more effectively meet the needs of rail users in North Carolina. Refining marketing activities and adjusting level of service are two such applications.
3 DATA COLLECTION
Sample surveys for both the Piedmont and Carolinian trains are included in Appendix A.1 and A.2. Copies of these surveys were distributed by Train Hosts on selected surveying dates. The response rate across all six daily trains exceeded 30%.
3.1 Survey Design and Administration
The survey was developed to compliment the spring 2014 survey effort. To increase outreach, Spanish versions of the survey were created for the fall survey to accommodate any non-English speaking Hispanic riders. Many questions were similar to the spring 2014 survey, but some included changes. These changes facilitate an update to the baseline established earlier this year. The primary revisions from the spring 2014 survey are found on the Piedmont survey, which places less emphasis on food and Wi-Fi services than was previously done. Wi-Fi on-board the Piedmont has been a consistent demand over the past few years, and the Rail Division has continuously made strides toward procurement and implementation. In order to remain consistent with the previous process and avoid any logistical issues, Piedmont surveys were distributed to passengers throughout the entire duration of the service between the Charlotte and Raleigh Stations. However, Carolinian surveys were distributed, completed, and collected within North Carolina between the Charlotte and Rocky Mount stations. Surveys were administered by Volunteer Train Hosts with the assistance of contracted staff. Surveyors participated in an updated NCDOT training session prior to deployment. Training covered the following topics:
1. When to arrive at the station, and how to prepare for the trip; 2. Common questions that may be asked and proper answers to these inquiries; 3. Engaging passengers early and often; 4. What to say to the passengers and how to present the surveys; 5. How to distribute and collect the surveys efficiently; 6. When/how to collect the completed surveys;

6 | P a g e
7. Where to submit the collected surveys. These training topics have been reevaluated since the survey conducted in the spring. As such, surveying was conducted in a much more efficient and successful manner. Survey instructions were provided to survey administrators. The instructions included specific procedures covered during the training sessions, NCDOT and consultant contact information, and an announcement script. The survey instructions are included in Appendix A.3 and A.4. The Piedmont and Carolinian trains were surveyed between 1st November 2014 and 22nd November 2014 on weekdays and weekends. All trains were surveyed during this time period. The overall survey participation rate was determined by comparing the number of surveys completed and the number of train passengers for the respective train. A summary of data collection is shown in Table 2. Note that the ridership data for the Carolinian (#79 and #80) represents only the number of passengers available to participate during the actual span of survey administration between Rocky Mount and Charlotte. This adjustment was made to give an accurate portrayal of the participation in the survey.
Table 2 Summary of data collection activities
Piedmont Carolinian
All Trains
#73 #74 #75 #76 #79 #80
Survey Dates
Res
po
nd
ents
Rid
ersh
ip
Res
po
nd
ents
Rid
ersh
ip
Res
po
nd
ents
Rid
ersh
ip
Res
po
nd
ents
Rid
ersh
ip
Res
po
nd
ents
Rid
ersh
ip
Res
po
nd
ents
Rid
ersh
ip
Res
po
nd
ents
Rid
ersh
ip
1-Nov 31 71 14 89 70 135 16 89 60 230 66 275 257 889
2-Nov 27 41 77 107 90 202 97 263 91 230 80 275 462 1,118
3-Nov 62 104 34 80 73 87 26 263 54 484 159 317 408 1,335
4-Nov 39 104 31 80 32 87 30 82 65 270 99 330 296 953
5-Nov 23 61 28 47 32 67 23 82 38 196 90 226 234 679
6-Nov 31 47 28 73 45 82 23 87 173 220 95 203 395 712
7-Nov 31 53 130 79 67 94 72 131 170 334 156 230 626 921
8-Nov 48 78 36 205 63 204 26 210 78 490 113 306 364 1,493
9-Nov 29 103 51 100 52 118 38 111 64 223 85 272 319 927
11-Nov 23 61 24 80 35 94 32 87 52 259 98 241 264 822
13-Nov 28 47 37 74 30 84 34 116 77 310 83 243 289 874
15-Nov 38 106 6 93 71 170 30 114 43 213 77 226 265 922
16-Nov 43 217 71 196 49 170 86 377 74 406 133 305 456 1,671
18-Nov 19 62 19 45 25 60 19 79 46 184 65 184 193 614
20-Nov 25 70 40 80 44 85 59 135 119 279 126 304 413 953
21-Nov 28 61 49 153 59 177 37 213 140 478 154 276 467 1,358
22-Nov 40 97 35 118 48 130 16 73 74 389 76 366 289 1,173
Total 565 1,383 710 1,699 885 2,046 664 2,512 1,418 5,195 1,755 4,579 5,997 17,414
Response Rate
40.9% 41.8% 43.3% 26.4% 27.3% 38.3% 34.4%

7 | P a g e
The overall survey response rate increased from 28.3 percent in the spring to 34.4 percent in the fall. This increase is most noticeable in the Carolinian statistics. Survey percentages increased by approximately 10-20 percent among these passengers. The increased efficiency is largely due to revised training methods and improved preparation of the on-board survey administrators.
3.2 Database and Quality Control
A Microsoft Access database was created for the survey project conducted in the spring and was updated for this new survey process. Completed surveys were divided into batches according to the date of collection and were manually entered into the Microsoft Access database. A quality control procedure for the database entries followed. This procedure involved the review of at least 10 percent of each entered survey batch. If reviewers found errors, the batch was resubmitted for checking and data entry. From this database, pivot tables were used to cross-analyze datasets and summarize survey results. Quality control measures were applied throughout all phases of data collection. Contracted staff collaborated with NCDOT to ensure that either qualified Volunteer Train Hosts or other representatives were present during survey periods (typically scheduled one week before the survey date). Contracted staff assisted the Train Hosts when necessary, to carry out the procedures outlined in the survey instructions. Survey administrators routinely checked the stock of survey questionnaires and pens at designated train stations to ensure that sufficient survey materials were available during data collection. NCDOT coordinated with train station attendants to ensure that completed surveys were delivered to NCDOT in a timely manner.
4 DATA SUMMARY
In order to retain consistency and allow easy comparison, the Data Analysis chapter has been divided into the following sections: Rider Profiles and Passenger Demographics, Trip Specifics, and Customer Satisfaction and Passenger Preference. Many of the trends are similar to the previously established baseline. As expected, this confirms a sufficient sample size and stable travel characteristics. As such, the focus throughout this section is shifted towards any new trends or discrepancies. Throughout this section, many charts and graphs are presented. These figures were chosen to quickly display trends in the answers to the survey questionnaire. For a more detailed overview of the response statistics, see Appendix B.
4.1 Rider Profile and Passenger Demographics
The information presented below reports the survey results regarding passenger residence, gender, age group, ethnicity, and other socioeconomic aspects. Note that the percentage values present do not always sum up to 100 percent due to rounding or multiple selection questions.

8 | P a g e
4.1.1 Passenger Residence
Passengers were asked to provide their zip code in both the Carolinian and Piedmont surveys. A comparison of the collected numbers can be seen in Table 3.
Table 3 Passenger residence from Piedmont and Carolinian surveys
Service Response Rate In-state Residence Out-of-state Residence
Survey Period Spring Fall Spring Fall Spring Fall
Piedmont 85% 93%
92% 88% 8% 12%
Carolinian 63% 59% 37% 41%
Compared to spring results, the percent of non-North Carolina riders increased slightly on both train routes. This may be attributed to seasonal travel patterns in which additional interstate travel occurs during holiday periods. This is a trend worth examining in more depth over time.
In-state Residence
Figure 2 displays where the concentrations of passengers reside in North Carolina. As could be expected, the greatest numbers of riders claimed residence in the largest metropolitan areas.
Figure 2 Distribution of in-state residents who responded to on-board surveys

9 | P a g e
Out-of-state Residence
Figure 3 depicts the most common out-of-state residency. Passengers residing outside of North Carolina were generally located along the eastern seaboard. On the Piedmont, the majority of non-North Carolina residents were from Florida and South Carolina. The Carolinian showed significant contrast, with most out of state residents located to the north of the state along the route’s corridor.
Figure 3 Top out-of-state Residency of Piedmont and Carolinian passengers
4.1.2 Gender, Age, and Ethnicity
Figure 4 shows basic demographic information about Piedmont and Carolinian riders. The only significant variations from the spring study are a slight increase in Hispanic/Latino ridership (from 2 percent to 5 percent). It should be noted that the increase in Hispanic riders is not attributed to the creation of Spanish version surveys, as none were completed for collection. Additionally, there is a noticeable spike in Carolinian riders over the age of 65. In regards to the gender split, the Piedmont was about 55/45 (female to male), while the Carolinian was 65/35.
0.0%
5.0%
10.0%
15.0%
20.0%
25.0%
30.0%
Piedmont
Carolinian

10 | P a g e
Figure 4 Passenger demographics of Piedmont and Carolinian respondents
4.1.3 Socioeconomics
Table 4 displays three categories of socioeconomic data for the Piedmont and Carolinian services; these include employment status, education level, and household income. The ridership of both trains exhibit fairly similar characteristics, with the exception that the Carolinian has a higher percentage of retired individuals, while the Piedmont is weighted toward students. This is likewise reflected in the education and income levels, as the students would likely answer “some college” and fall in a lower income bracket. This coincides with the age distribution mentioned in the previous section.
0%
5%
10%
15%
20%
25%U
nd
er20 20
to
24
25 t
o29
30 t
o34
35 t
o39
40 t
o44
45 t
o49
50 t
o54
55 t
o59
60 t
o64 65
+
Age Distribution Piedmont Carolinian
American Indian, 2%
Asian/ Asian
American, 5%
Black/ African
American, 39%
Hispanic/ Latino, 5%
White/ Caucasian,
45%
Other, 4%
Ethnicity - Piedmont American Indian, 2%
Asian/ Asian
American, 3%
Black/ African
American, 41%
Hispanic/ Latino, 5%
White/ Caucasian,
45%
Other, 5%
Ethnicity - Carolinian

11 | P a g e
Table 4 Socioeconomic data on the Piedmont and Carolinian passengers
Piedmont
Employment Education Household Income Full Time 41.9% No HS Diploma 3.5% Under $25,000 29.6%
Part Time 9.9% HS Diploma or GED 17.2% $25,000 to $49,000 25.0%
Student 28.8% Some College 31.6% $50,000 to $100,000 25.7%
Unemployed 6.6% Associate’s Degree 6.7% $100,000 or more 19.7%
Retired 12.8% Bachelor’s Degree 22.2%
Master’s Degree 12.1%
Post Graduate 6.7%
Carolinian
Employment Education Household Income Full Time 42.6% No HS Diploma 3.8% Under $25,000 23.7%
Part Time 7.8% HS Diploma or GED 15.6% $25,000 to $49,000 27.3%
Student 13.8% Some College 24.3% $50,000 to $100,000 29.1%
Unemployed 7.0% Associate’s Degree 8.9% $100,000 or more 19.9%
Retired 28.9% Bachelor’s Degree 22.3%
Master’s Degree 15.5%
Post Graduate 9.6%
4.1.4 Passenger Communications
For marketing and communication purposes, passengers were asked about the types of media they use and their exposure to train services. Trends in media usage do not typically show significant variation within the course of a single year. Consequently, the collected responses shown in Figure 5 are almost identical to those reported in the spring.
Figure 5 Regularly used media sources
0%
10%
20%
30%
40%
50%
60%
70%
80%
90%
100%
Magazines
Newspaper
Radio
Social Media
Television
Internet
Piedmont
Carolinian

12 | P a g e
Figure 6 shows how passengers learned about Piedmont and Carolinian services prior to their trip. The discrepancies with the spring data are minor. They involve a small decrease in the percentage of passengers reporting to have taken the train before, while the reported usage of NCByTrain.org and Amtrak.com has risen slightly. As with the spring survey results, highway signs, radio, print, tabling events, and travel agencies each apply to less than 5 percent of riders. This does not necessary imply that these formats are ineffective, but warrants consideration as to which sources should and should not be utilized.
Figure 6 Means of exposure to state-supported passenger rail services
4.2 Trip Specifics
This section relates to the travel characteristics of on-board survey respondents; the analysis includes station boarding and alighting, means of access and egress to and from stations, trip purpose, alternate travel mode preference, travel party details, trip length, booking methods, ticket type, and trip experience.
4.2.1 Boarding and Alighting
The boarding and alighting data presented in this section represent the stations where passengers stated to have gotten on and off trains. There were three common issues with responses to this survey item: (1) passengers stated getting on and off at stations that were inconsistent with specific train directions, (2) passengers stated getting on and off at the same station, and (3) passengers listed stations along a connecting route. For quality assurance, the responses that presented any of these cases were excluded from analysis.
Piedmont
Figure 7 These passengers seem to have been reallocated equally across the other stations. shows the percentage of survey respondents boarding at each station along the Piedmont route. Corresponding to the Amtrak System Timetable, and similar to expectations, the
0%
10%
20%
30%
40%
50%
60%
Travel Agent
Events and Festivals
Radio, Print Advertisement
Highway Sign
NCByTrain.org or Amtrak.com
Internet
Friend/ Relative/ Word of Mouth
Have Taken it Before
Piedmont (Fall)
Piedmont (Spring)
Carolinian (Fall)
Carolinian (Spring)

13 | P a g e
majority of boarding occurred in the Triangle metropolitan area for the morning and midday. Over 65 percent of the afternoon and evening boarding occurred at the Charlotte station on #74 and #76. The significant shift, when compared to the responses collected earlier in the year, is a 10 percent decrease in boarding at the Charlotte station. These passengers seem to have been reallocated equally across the other stations.
Figure 7 Respondents boarding at stations along the Piedmont corridor
Figure 8 shows the percentage of survey respondents alighting at each station along the Piedmont route. Compared to the spring, Charlotte and Raleigh stations appear to be reaching the same levels of popularity, but the number of individuals reporting to have alighted in Greensboro has decreased by 2 percent to 5 percent across each of the four trains.
Figure 8 Respondents alighting at stations along the Piedmont corridor
0.0%
10.0%
20.0%
30.0%
40.0%
50.0%
60.0%
70.0%
80.0%
73 (SB)
75 (SB)
74 (NB)
76 (NB)
0.0%
10.0%
20.0%
30.0%
40.0%
50.0%
60.0%
70.0%
73 (SB)
75 (SB)
74 (NB)
76 (NB)

14 | P a g e
Carolinian
Figure 9 shows the percentage of survey respondents boarding at each station along the Carolinian route. Many of the percentages displayed below correspond closely with the baseline established in the spring. The largest difference is 5 percent decline in reports of passengers on train #79 boarding in Raleigh.
Figure 9 Respondents boarding at stations along the Carolinian corridor
Figure 10 shows the percentage of survey respondents alighting at each station along the Carolinian route. The alighting inversely parallels the boarding, in which passengers were alighting train #79 mostly at Charlotte, Greensboro, and Raleigh, and just over a third of the passengers are alighting train #80 at North Carolina Stations. The reported alighting from train #79 in Raleigh has increased by about 8 percent while alighting in Greensboro has lost 7 percent of the total reports. Alighting from train #80 has increased by almost 5 percent in Durham.
Figure 10 Respondents alighting at stations along the Carolinian corridor
0.0%
5.0%
10.0%
15.0%
20.0%
25.0%
30.0%
35.0%
New
Yo
rk N
Y
New
ark
NJ
Tren
ton
NJ
Phi
lade
lphi
a P
A
Wilm
ingt
on D
E
Bal
tim
ore
MD
Was
hin
gto
n D
C
Ale
xan
dri
a V
A
Qu
anti
co V
A
Fred
rick
sbu
rg V
A
Ric
hm
on
d V
A
Pet
ersb
urg
VA
Ro
cky
Mo
un
t
Wils
on
Selm
a
Ral
eigh
Car
y
Du
rham
Bu
rlin
gto
n
Gre
ensb
oro
Hig
h P
oin
t
Salis
bury
Kan
nap
olis
Ch
arlo
tte
79 (SB)
80 (NB)
0.0%
5.0%
10.0%
15.0%
20.0%
25.0%
New
Yo
rk N
Y
New
ark
NJ
Tren
ton
NJ
Ph
ilade
lphi
a P
A
Wilm
ingt
on D
E
Bal
tim
ore
MD
Was
hin
gto
n D
C
Ale
xan
dri
a V
A
Qu
anti
co V
A
Fred
rick
sbu
rg V
A
Ric
hm
on
d V
A
Pet
ersb
urg
VA
Ro
cky
Mo
un
t
Wils
on
Selm
a
Ral
eigh
Car
y
Du
rham
Bu
rlin
gto
n
Gre
ensb
oro
Hig
h P
oin
t
Salis
bury
Kan
nap
olis
Ch
arlo
tte
79 (SB)
80 (NB)

15 | P a g e
4.2.2 Access and Egress
Figure 11 shows the way in which respondents traveled to and from their boarding and alighting stations. On both services, the majority of riders were dropped off, with driving as the second most common method at approximately 20 percent. Very few respondents accessed the station by another connecting train, by foot, or bicycle. The rate of usage for connecting trains was slightly higher than the last survey period for Piedmont passengers (1-3 percent), but otherwise there are no major discrepancies between this data and that from the spring survey.
Figure 11 Access and egress modes to and from Piedmont and Carolinian stations
0% 10% 20% 30% 40% 50% 60% 70% 80% 90% 100%
Piedmont - Ingress
Piedmont - Egress
Dropped off / Picked up Drove Taxi Bus / Transit Walk / Bike Connecting Train
0% 10% 20% 30% 40% 50% 60% 70% 80% 90% 100%
Carolinian - Ingress
Carolinian - Egress
Dropped off / Picked up Drove Taxi Bus / Transit Walk / Bike Connecting Train

16 | P a g e
4.2.3 Trip Purpose
Figure 12 shows the trip purpose distribution of the riders surveyed on both services. Along the Piedmont route, there was a shift (4-5 percent) from school to leisure, while passengers visiting friends and family increased slightly on the Carolinian. This shift is likely a seasonal trend in that people travel more for leisure and visiting during the holidays.
Figure 12 Distribution of trip purposes on the Piedmont and Carolinian
4.2.4 Alternative Travel Mode
Figure 13 displays the alternative travel mode that respondents would have preferred if passenger rail had not been available. These charts closely replicate the statistics from the first survey, indicating a large and representative sample. One key finding verified in both the spring and fall surveys is that 16 percent of Piedmont passengers and 11 percent of Carolinian passengers would forgo taking their trips had the train services been unavailable.
Figure 13 Alternative travel modes preferences for each train service
Visit Family/ Friends,
58% Business,
14%
Commute to Work,
3%
Leisure, 13%
School, 7% Other, 6%
Piedmont
Visit Family/ Friends,
65%
Business, 13%
Commute to Work,
1%
Leisure, 10%
School, 3%
Other, 8%
Carolinian
Car 67%
Forgo Travel 16%
Bus 12%
Airplane 4%
Taxi 1%
Piedmont
Car 52%
Airplane 25%
Bus 12%
Forgo Travel 11%
Taxi 0%
Carolinian

17 | P a g e
4.2.5 Other Trip Specifics
Travel Party
Similar to the choices regarding alternative travel mode, the passenger party sizes show no statistically significant variation from the 2014 spring results. Figure 14, below, displays that three quarters of passengers travel alone and about a fifth are traveling with a companion. Promoting group travel could be an opportunity given that (1) it is relatively low and (2) the majority of first-time riders learn about the services by word of mouth.
Figure 14 Passenger party for the Piedmont and Carolinian
Trip Duration
Carolinian passengers typically spent more nights on their trips than Piedmont passengers. While two-thirds of Piedmont passengers spent two or fewer nights during the span of their trip, less than half cited this on the Carolinian. Compared to the spring survey, there have been minor shifts in this category. There was a slight increase of Piedmont passengers taking day trips and a slight increase of Carolinian passengers staying more than four nights away. Figure 15 displays responses collected during the fall of 2014.
Figure 15 Trip duration by train service
One, 76%
Two, 16%
Three, 3%
Four, 3% Five or
more, 2%
Piedmont
One, 70%
Two, 20%
Three, 5%
Four, 2% Five or
more, 3%
Carolinian
0 1 2 3 4 5+
Piedmont 27% 19% 22% 10% 5% 18%
Carolinian 15% 7% 17% 16% 10% 35%
0%10%
20%30%
40%
Per
cen
t o
f R
esp
on
den
ts
Number of Nights Away

18 | P a g e
4.2.6 Type of Ticket and Booking Method
Figure 16 displays the rate of selection for different ticket types. Compared to the spring results, 5 percent of Piedmont travelers have switched from round trip tickets, to purchasing a one-way ticket.
Figure 16 Type of ticket purchased by service
New to this survey period is the Amtrak mobile app. This app for personal mobile devices has significantly cut into the number of riders using the online websites (Amtrak.com and NCByTrain.org). A comparison of the two sets of data indicates that approximately 11 percent of passengers aboard the train have shifted from using the website to the mobile app. Again, purchasing a ticket on-board the train, at the ticketing kiosk, or through a travel agent is uncommon. During both survey periods these three sources combine for less than 4 percent of the ticket sales.
Figure 17 Method in which passengers purchase train tickets
One-Way, 50%
Round Trip, 45%
Multi-Ride, 5%
Group, 0%
Piedmont
One-Way, 42%
Round Trip, 55%
Multi-Ride, 2%
Group, 1%
Carolinian
59.4%
11.2% 12.7% 12.9% 1.6% 0.6% 1.5%
0%
20%
40%
60%
80%
100%
ww
w.A
mtr
ak.c
om
or
ww
w.N
CB
yTra
in.o
rg
Am
trak
Mo
bile
Ap
p
1-8
00-U
SA-R
ail o
r 1-
800
-By-
Trai
n
Am
trak
Tic
ket
Win
dow
Qu
ik-T
rak
Tick
etin
gK
iosk
On-
bo
ard
th
e tr
ain
Trav
el A
gen
t

19 | P a g e
4.3 Customer Satisfaction and Passenger Preferences
A series of items in the on-board survey sought to gauge the satisfaction of passengers’ experience, importance of various factors, and interest in additional services. Some survey items presented a set of factors and had respondents rate the importance or satisfaction on a scale of 1 to 5. Other questions allowed respondents to select multiple answers or provide a simple yes or no.
4.3.1 Trip Experience
Figure 18 compares how satisfied respondents were on the Piedmont and Carolinian. On a scale of 1 to 5, 1 being least satisfied and 5 being most satisfied, the majority of passengers (over 95 percent) rated their trip at least a 3 or greater. Compared to the earlier survey period, there does seem to be a difference in passenger satisfaction between the two trains. The satisfaction in the Piedmont has remained largely unchanged, perhaps increasing by a slight margin, but the satisfaction with the Carolinian has declined. 4 percent fewer riders selected the highest satisfaction rating. These riders have shifted equally throughout the other possible selections (1-4).
Figure 18 Overall trip satisfaction on the Piedmont and Carolinian
4.3.2 Importance Rating
While on-board both the Carolinian and Piedmont trains, survey participants were asked to rank the importance of several items in three different categories. Within each category, the three most highly ranked items are listed below and are shown in bold in Table 5 and Table 6. These top three selections match the three highest ranked selections during the first survey period, and are as follows (in order of rating, highest to lowest):
1. Reason for taking the train: Relaxation, Avoid highway traffic, and Save money; 2. Stations and connections: Station security and safety, Station signage and boarding
directions, and Station staffing; and 3. Aboard the train: On time performance, Seat spacing, and Seat comfort.
0% 10% 20% 30% 40% 50% 60% 70% 80% 90% 100%
Piedmont
Carolinian
Piedmont Carolinian
1 0.8% 1.6%
2 0.9% 2.5%
3 6.5% 11.9%
4 33.2% 35.8%
5 58.6% 48.2%
Trip Satisfaction: 1 (least) - 5 (most)

20 | P a g e
The lowest ranking items in each category were: only transportation option, connecting bus services, and ability to handle bicycles, respectively. The metrics below are key indicators that could be used to adjust services and promotion to gain and retain ridership; this feedback must be considered when adjusting passenger service operations in the future.
Table 5 Passenger importance ratings on the Piedmont
Reason for taking the train Mean rating
Aboard the train Mean rating
Only transportation option 2.87 On time performance 4.61
Save time 3.24 Trip information/alerts/status 4.22
Save money 3.64 Seat spacing 4.38
Avoid highway traffic 3.76 Seat comfort 4.48
Ability to work while traveling 2.90 Visibility and scenery 4.00
The experience 3.31 Checked baggage 3.15
Relaxation 3.79 Ability to handle bicycles 2.17
Environmental benefits 3.15 NCDOT volunteer train hosts 2.95
Snack and beverage service 3.56
Stations and connections Mean rating
Station staffing 3.79
Station signage and boarding directions 3.80
Availability of parking 3.27
Connecting bus services 2.76
Checked baggage 2.86
Station security and safety 4.32
Table 6 Passenger importance ratings on the Carolinian
Reason for taking the train Mean rating
Aboard the train Mean rating
Only transportation option 2.56 On time performance 4.57
Save time 2.73 Trip information/alerts/status 4.11
Save money 3.59 Seat spacing 4.44
Avoid highway traffic 3.90 Seat comfort 4.54
Ability to work while traveling 2.93 Visibility and scenery 4.12
The experience 3.42 Checked baggage 3.32
Relaxation 3.89 Ability to handle bicycles 1.95
Environmental benefits 3.18 NCDOT Volunteer Train Hosts 2.87
Stations and connections Mean rating
Carolinian Specific
Station staffing 3.98 Availability of business and premium class service
3.22
Station signage and boarding directions 4.06
Availability of parking 3.11 Wi-Fi 4.31
Connecting bus services 2.53 Food service 3.89
Checked baggage 3.10
Station security and safety 4.38

21 | P a g e
4.3.3 Other Services and Additional Comments
Passengers were asked what other types of services they would be interested in purchasing if made available. They were given a set of options in which they could select multiples of the listed supplemental services. Although a large majority of respondents selected none, the top selections in the spring included restaurant and dining options, connecting transportation, and rental car services. Figure 19 shows passenger interest in additional services from the current on-board survey. In the spring results, dining options was the most common selection. Within the new dataset there is an increased focus on connecting transportation and rental cars. The Rail Division could benefit in partnering with local transit agencies and private transportation providers in connecting passengers to stations and final destinations. Furthermore, well established connectivity also requires clear dissemination of how travelers can use multi-modal connections. Presenting information online and at stations would be helpful in trip planning and for traveling patrons.
Figure 19 Number of interested respondents for additional services
Table 7 lists the number of respondents who claimed to be interested in a bicycle share program. As expected, interest is almost identical to the interest expressed in the first survey. Roughly one-fourth showed interest.
Table 7 Interest in a bicycle share program for the five stations with the highest number of responses
Boarding Station Yes No Yes-No Ratio Alighting Station Yes No Yes-No Ratio
Charlotte 338 1,122 0.30 Charlotte 273 837 0.33
Raleigh 220 552 0.40 Raleigh 225 716 0.31
Durham 152 371 0.41 Greensboro 161 503 0.32
Greensboro 151 438 0.34 Durham 159 386 0.41
Cary 130 357 0.36 Cary 98 312 0.31
0 200 400 600 800 1000 1200 1400 1600 1800 2000
None
Tour packages
Lodging
Sporting event tickets
Rental car
Connecting transportation
Restaurant or dining options
Interest in Additional Services (Number of Responses)

22 | P a g e
Additional Comments
The final item on the survey was an additional comments box for respondents to share any suggestions and concerns regarding their travel experience or towards the state-supported rail service in general. Approximately 1500 comments were collected. Overall, there was positive feedback as rider expressed their experience with words including “great” (145 appearances), “pleasant” (35 appearances), “love” (120), “enjoy” (77), “nice” (90), and “friendly” (44). Mentioned 329 times, the primary suggestion was to provide complementary Wi-Fi on trains without it and enhance the connection on those with it. A significant number of passengers expressed the importance of timeliness, and nearly 100 complaints were presented that the train was late.
5 EVALUATION
Table 8 shows a matrix of the average importance that passengers on various trip purposes assigned for reasons in utilizing passenger rail services. The two highest rated factors for each trip purpose are shown in bold in order to distinguish them in the table below.
Table 8 Trip purpose versus reason for taking the train importance ratings
Vis
it
Fam
ily/
Frie
nd
s
Bu
sin
ess
Co
mm
ute
to
Wo
rk
Leis
ure
Sch
oo
l
Oth
er
Only transportation option 2.84 2.37 3.01 2.01 3.14 2.90
Save time 3.03 2.89 3.36 2.69 3.15 2.95
Save money 3.71 3.62 3.68 3.15 3.48 3.56
Avoid highway traffic 3.85 4.02 4.14 3.80 3.32 3.64
Ability to work while traveling 2.79 3.87 3.63 2.44 2.84 2.68
The experience 3.34 3.28 3.09 3.95 2.92 3.23
Relaxation 3.87 3.78 3.78 4.11 3.26 3.68
Environmental benefits 3.21 3.14 3.49 3.10 2.87 3.05
Upon further examination, trip purpose was cross analyzed with demographic and socioeconomic data to ascertain the reasons that particular passengers take the train. Figure 20 displays trip purpose by age group for the Piedmont. “Commuting” and “other” have been omitted from this table as they were fairly uncommon selections. Visiting family/friends demonstrated a unique distribution. Younger and older age groups were significantly more likely to cite this purpose than those individuals of middle age. Inversely, business was a more common selection in the center of the age spectrum. “School” made a significant appearance only among the two youngest age groups. This coincides with the typical age of college students.

23 | P a g e
Figure 20 Piedmont trip purpose by age group
Figure 21 presents the same comparison as above, but for the Carolinian train. The trends are almost identical, except for a greater emphasis on visiting family and friends (about 10 percent throughout).
Figure 21 Carolinian trip purpose by age group
0.0% 20.0% 40.0% 60.0% 80.0% 100.0%
19 and under
20 to 24
25 to 29
30 to 34
35 to 39
40 to 44
45 to 49
50 to 54
55 to 59
60 to 64
65+
Visting Family/Friends
Business
Leisure
School
0.0% 20.0% 40.0% 60.0% 80.0% 100.0%
19 and under
20 to 24
25 to 29
30 to 34
35 to 39
40 to 44
45 to 49
50 to 54
55 to 59
60 to 64
65+
Visit Family/Friends
Business
Leisure
School

24 | P a g e
Figure 22 displays the relationship between trip purpose and educational level. As passengers’ level of education increased, the number of individuals taking the train to visit family and friends decreased and travel for leisure and business increased.
Figure 22 Trip purpose by education level for both trains
Figure 23 illustrates the most common method of purchasing a ticket for each age group. Younger groups are more apt to use mobile applications. Approximately 60 percent of tickets were booked online as discuss in Section 4.2.6. The table below examines the 40 percent of passengers that used an alternate method, and compares usage by age groups.
Figure 23 Method of ticket purchase by age group for both trains
0.0% 20.0% 40.0% 60.0% 80.0% 100.0%
No HS Diploma
HS Diploma or GED
Some College
Associate's degree
Bachelor's Degree
Master's Degree
Post Graduate
Visit Family/Friends
Business
Leisure
School
Other
0.00%
10.00%
20.00%
30.00%
40.00%
50.00%
60.00%
Travel Agent
Telephone - 1-800-USA-Rail orTelephone - 1-800-By-Train
Quik-Trak Ticketing Kiosk
On-board the train
Amtrak Ticket Window
Amtrak Mobile App

25 | P a g e
Figure 24 compares trip purpose with income level. Although the majority of passengers are taking trains to visit family and friends, some correlation between income level and trip purpose can be found. Passengers in higher income brackets are more commonly taking the train for business and for leisure. The chart below does not include visiting family and friends.
Figure 24 Trip purpose by income level for both trains
Additionally, cited reasons for choosing the train have been evaluated by every different age group. Figure 25, below, graphically displays these findings. The younger age groups responded that the train was their only source of transportation and that saving money was important, while older individuals wanted to avoid highway traffic and relax. These discrepancies can be beneficial tools in adjusting advertisements and areas of emphasis for the passenger train service.
Figure 25 Reasons for taking the train by age group for both trains
0.00%
10.00%
20.00%
30.00%
40.00%
50.00%
60.00%
Under $25,000 $25,000 to$50,000
$50,000 to$100,000
$100000 or more
School
Other
Leisure
Commute to Work
Business
0.00.51.01.52.02.53.03.54.04.5
19 and under
20 to 24
25 to 29
30 to 34
35 to 39
40 to 44
45 to 49
50 to 54
55 to 59
60 to 64

26 | P a g e
As a final comparison, selections of trip purpose were evaluated against the corresponding selections for alternative travel mode choice. The findings from this comparison were not outstanding. The distributions across every trip purpose were similar to those presented in the data summary section (see Figure 13).
6 CONCLUSION
The fall survey effort supplements and validates many of the findings from the initial survey in spring. In order to provide an accurate representation of passenger population, a large sample size, stringent data collection process, and quality control were implemented. A portrait of important ridership metrics can be framed from these results and the accompanying analysis. The most significant findings and discrepancies are enumerated below.
1. Using the train to commute to work is very rare, and accounts for less than 2 percent of the Piedmont ridership, and less than 1 percent of the Carolinian passengers.
2. Booking tickets through the mobile app and the internet decreases in popularity with increasing age, while the inverse is true for ticket window and telephone reservations. Additionally, purchasing tickets on-board the train, through a travel agent, or at the ticketing kiosk, is relatively uncommon.
3. Riders falling within the middle age groups (35-49) are less likely to use the train for visiting family and friends than the other riders, but they are more likely to ride the train for business purposes.
4. Riders with a higher income level are more likely to use the train for business as well as leisure.
5. Both the Piedmont and Carolinian are chosen by those intending to visit family/friends, partially in order to avoid highway traffic and relax.
6. The Piedmont is more popular with students, while the Carolinian is more popular with the elderly and those visiting family/friends.

27 | P a g e
APPENDIX A: SURVEY INSTRUMENTS AND INSTRUCTIONS
A.1 Piedmont survey instrument

28 | P a g e
A.2 Carolinian survey instrument

29 | P a g e
A.3 Piedmont survey instructions
30 | P a g e
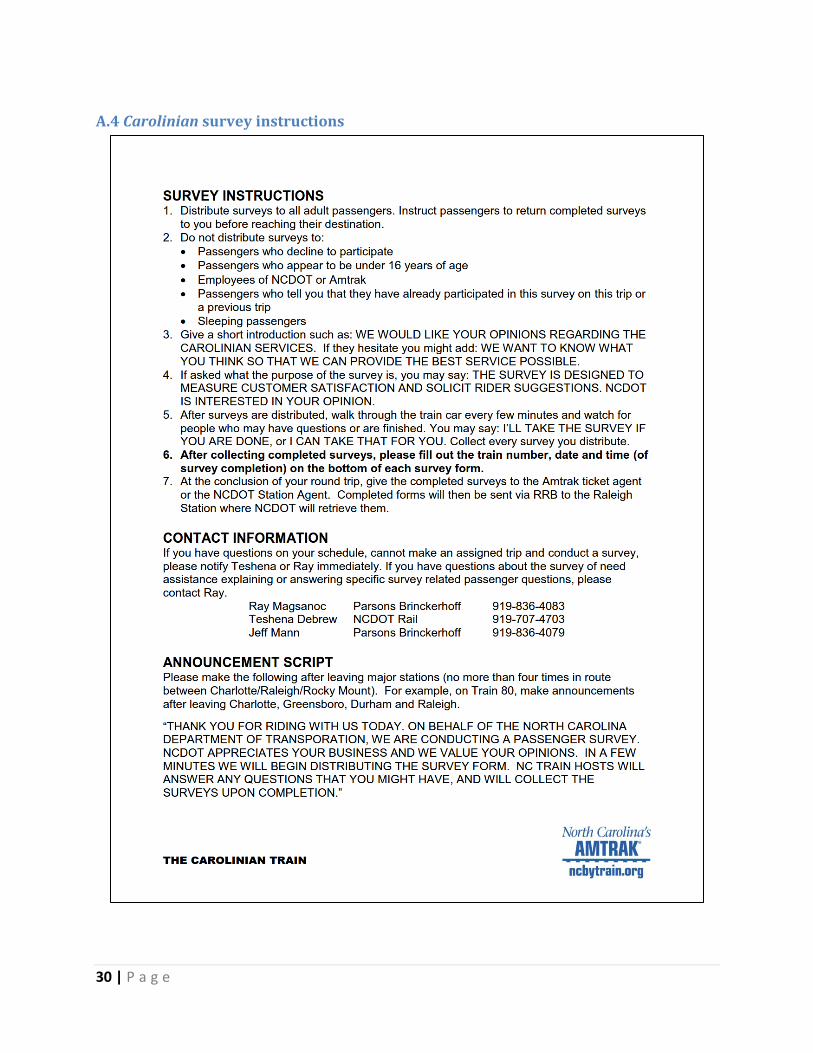
A.4 Carolinian survey instructions

APPENDIX B: SURVEY QUESTION RESPONSES 1. Where did you get on the train?
PIEDMONT # 73 # 74 # 75 # 76
Responses 565 710 885 664
Non-responses 2 4 3 8
(% of responses) (% of responses) (% of responses) (% of responses)
Charlotte 2.1% 65.3% 4.0% 74.4%
Kannapolis 0.4% 4.8% 0.8% 4.0%
Salisbury 2.0% 3.7% 0.9% 4.4%
High Point 3.7% 4.5% 1.4% 3.8%
Greensboro 10.8% 17.0% 8.6% 10.2%
Burlington 6.2% 1.4% 1.4% 0.5%
Durham 19.9% 1.4% 22.1% 0.8%
Cary 20.2% 0.8% 27.8% 1.5%
Raleigh 34.6% 1.0% 33.1% 0.5%
CAROLINIAN # 79 # 80
Responses 1398 1743
Non-responses 20 12
(% of responses) (% of responses)
Charlotte 0.9% 30.1%
Kannapolis 0.0% 4.8%
Salisbury 0.1% 4.9%
High Point 0.1% 6.2%
Greensboro 1.1% 16.0%
Burlington 0.5% 3.4%
Durham 3.4% 10.5%
Cary 1.8% 6.4%
Raleigh 5.7% 14.1%
Selma 0.6% 0.9%
Wilson 5.4% 0.9%
Rocky Mount 3.9% 0.1%
Petersburg VA 0.9% 0.1%
Richmond VA 6.6% 0.1%
Fredericksburg VA 1.6% 0.0%
Quantico VA 0.8% 0.0%
Alexandria VA 6.0% 0.2%
Washington DC 22.8% 0.3%
Baltimore MD 4.9% 0.1%
Wilmington DE 2.4% 0.2%

Philadelphia PA 9.1% 0.2%
Trenton NJ 1.8% 0.1%
Newark NJ 6.4% 0.1%
New York NY 13.2% 0.4%
2. Where will you get off this train?
PIEDMONT # 73 # 74 # 75 # 76
Responses 565 710 885 664
Non-responses 6 9 7 14
(% of responses) (% of responses) (% of responses) (% of responses)
Charlotte 62.1% 4.0% 52.3% 2.3%
Kannapolis 5.2% 1.1% 3.5% 0.6%
Salisbury 5.0% 2.3% 4.3% 1.8%
High Point 7.0% 4.3% 9.1% 8.2%
Greensboro 13.8% 15.3% 20.0% 18.5%
Burlington 2.1% 2.7% 5.5% 3.4%
Durham 2.5% 22.4% 2.4% 16.8%
Cary 0.7% 14.3% 1.7% 23.2%
Raleigh 1.6% 33.7% 1.1% 25.2%
CAROLINIAN # 79 # 80
Responses 1395 1717
Non-responses 23 38
(% of responses) (% of responses)
Charlotte 23.6% 0.5%
Kannapolis 3.4% 0.0%
Salisbury 3.5% 0.2%
High Point 6.0% 0.5%
Greensboro 13.5% 1.7%
Burlington 2.2% 0.5%
Durham 12.3% 5.9%
Cary 7.7% 3.4%
Raleigh 22.3% 14.3%
Selma 1.4% 1.6%
Wilson 1.0% 7.3%
Rocky Mount 0.1% 2.9%
Petersburg VA 0.0% 1.3%
Richmond VA 0.3% 6.1%
Fredericksburg VA 0.1% 1.5%
Quantico VA 0.0% 0.7%
Alexandria VA 0.4% 5.2%

Washington DC 0.4% 17.5%
Baltimore MD 0.4% 5.1%
Wilmington DE 0.3% 1.6%
Philadelphia PA 0.4% 7.2%
Trenton NJ 0.1% 1.6%
Newark NJ 0.2% 3.9%
New York NY 0.3% 9.5%
3. How did you get to the train station?
Piedmont Carolinian
Responses 2,801 3,148
Non-responses 23 25
(% of responses) (% of responses)
Connecting Train 3.5% 4.4%
Drove 22.7% 19.5%
Dropped off 50.5% 50.7%
Taxi 9.6% 12.6%
Bus/Transit 9.4% 10.1%
Walk/Bike 4.5% 2.7%
Total 100.0% 100.0%
4. How will you get to your final destination?
Piedmont Carolinian
Responses 2,764 3,110
Non-responses 60 63
(% of responses) (% of responses)
Connecting Train 3.1% 3.6%
Drive 12.8% 10.7%
Pick Up 55.7% 59.4%
Taxi 12.8% 12.4%
Bus/Transit 10.2% 9.9%
Walk/Bike 5.4% 4.1%
Total 100.0% 100.0%

5. What best describes the purpose of your trip? (Select One)
Piedmont Carolinian
Responses 2,801 3,148
Non-responses 23 25
(% of responses) (% of responses)
Visit Family/Friends 57.7% 65.3%
Business 13.7% 13.2%
Commute to Work 3.0% 1.1%
Leisure 13.1% 9.6%
School 6.5% 3.1%
Other 6.0% 7.8%
Total 100.0% 100.0%
6. If train service were not available, how would you make this trip? (Select One)
Piedmont Carolinian
Responses 2,772 3,081
Non-responses 52 92
(% of responses) (% of responses)
Automobile 67.4% 51.5%
Taxi 0.5% 0.4%
Bus 12.4% 12.2%
Airplane 3.9% 25.2%
Would not make the trip 15.9% 10.8%
Total 100.0% 100.0%
7. How important was each factor in choosing to take the train today?
Piedmont Carolinian
Responses Mean Rating Responses Mean Rating
Only transportation available 2,655 2.87 2,794 2.56
Save time 2,681 3.24 2,828 2.73
Save money 2,695 3.64 2,904 3.59
Avoid driving in traffic 2,701 3.76 2,938 3.90
Ability to work while traveling 2,649 2.90 2,799 2.93
The experience 2,682 3.31 2,869 3.42
Relaxation 2,711 3.79 2,980 3.89
Environmental benefits 2,665 3.15 2,820 3.18

8. How many people (including yourself) are traveling in your party?
Piedmont Carolinian
Responses 2,746 3,100
Non-responses 78 73
(% of responses) (% of responses)
1 75.6% 69.5%
2 15.8% 20.4%
3 3.3% 4.7%
4 2.8% 2.1%
5+ 2.4% 3.4%
Total 100.0% 100.0%
9. Are you traveling with children under 13 years old?
Piedmont Carolinian
Responses 2,692 3,040
Non-responses 132 133
(% of responses) (% of responses)
Yes 6.4% 7.1%
No 93.6% 92.9%
Total 100.0% 100.0%
If yes, how many?
Piedmont Carolinian
Responses 125 139
(% of responses) (% of responses)
1 60.0% 54.7%
2 29.6% 33.1%
3 8.8% 7.2%
4 0% 0.7%
5+ 1.6% 4.3%
Total 100.0% 100.0%
10. How many nights will you stay away from home on this trip?
Piedmont Carolinian
Responses 2,729 3,075
Non-responses 95 98
(% of responses) (% of responses)
0 26.5% 14.5%
1 18.9% 7.4%
2 22.2% 17.1%
3 10.1% 15.9%

4 4.8% 9.9%
5+ 17.5% 35.1%
Total 100.0% 100.0%
11. Including this trip, how many train trips have you made in the past 30 days? (Count round-trip as 2)
Piedmont Carolinian
Responses 2,608 2,861
Non-responses 216 312
(% of responses) (% of responses)
1 45.2% 54.4%
2 25.5% 27.9%
3 7.8% 6.3%
4 10.0% 6.0%
5+ 11.5% 5.4%
Total 100.0% 100.0%
12. Do you use the internet to make purchases?
Piedmont Carolinian
Responses 2,601 2,921
Non-responses 223 252
(% of responses) (% of responses)
Yes 81.4% 77.0%
No 18.6% 23.0%
Total 100.0% 100.0%
13. Which media source do you use regularly? (Multiple options selectable)
Piedmont Carolinian
Responses 2,691 3,018
Non-responses or None 133 155
(% of responses) (% of responses)
Radio 33.3% 36.8%
Television 50.7% 57.5%
Newspaper 19.1% 28.8%
Magazines 13.8% 20.5%
Internet 83.4% 77.4%
Social Media 47.3% 38.6%

14. For this trip, how did you purchase your ticket?
Piedmont Carolinian
Responses 2,720 3,062
Non-responses 104 111
(% of responses) (% of responses)
www.Amtrak.com or www.NCByTrain.org 58.6% 60.2%
Amtrak Mobile App 13.8% 8.9%
Telephone – 1-800-USA-RAIL or 1-800-BY-TRAIN 9.3% 15.7%
Amtrak Ticket Window 13.8% 12.1%
Quik-Trak Ticketing Kiosk 2.3% 1.1%
On-board the train 0.7% 0.5%
Travel Agent 1.5% 1.5%
Total 100.0% 100.0%
15. If the method used to purchase the ticket for this trip were not available, how would you
purchase your ticket? (Multiple options selectable)
Piedmont Carolinian
Responses 2,659 2,968
Non-responses 165 205
(% of responses) (% of responses)
www.Amtrak.com or www.NCByTrain.org 21.3% 17.7%
Amtrak Mobile App 22.6% 16.7%
Telephone – 1-800-USA-RAIL or 1-800-BY-TRAIN 23.0% 34.7%
Amtrak Ticket Window 30.0% 28.6%
Quik-Trak Ticketing Kiosk 6.2% 4.4%
On-board the train 4.7% 4.2%
Travel Agent 2.2% 2.9%
16. Which type of ticket did you purchase?
Piedmont Carolinian
Responses 2,735 3,066
Non-responses 89 107
(% of responses) (% of responses)
One-Way 49.9% 42.4%
Round Trip 45.1% 55.2%
Multi-Ride 4.8% 1.9%
Group 0.2% 0.6%
17. What is your zip code? (Excluded)

18. How did you learn about the Piedmont or Carolinian services? (Multiple options selectable)
Piedmont Carolinian
Responses 2,725 3,056
Non-responses 99 117
(% of responses) (% of responses)
Have taken it before 58.1% 54.0%
Friend/Relative/Word of Mouth 38.3% 29.0%
Highway Sign 3.0% 2.0%
Internet 17.4% 23.6%
Radio, Print Advertisement 2.7% 2.4%
Travel Agent 0.9% 2.0%
Events and Festivals 1.4% 1.0%
NCByTrain.org or Amtrak.com 12.1% 16.6%
19. For this trip, please rate the importance of the following.
Piedmont Carolinian
Responses Mean Rating
Responses Mean Rating
Station Staffing 2,655 3.79 2,936 3.98
Station Signage and Boarding Directions 2,629 3.80 2,900 4.06
Availability of Parking 2,609 3.27 2,825 3.11
Connecting Bus Service 2,573 2.76 2,764 2.53
Checked Baggage 2,597 2.86 2,849 3.10
Station Security and Safety 2,646 4.32 2,916 4.38
20. (Piedmont) When traveling by train, please rate the importance of the following.
Piedmont
Responses Mean Rating
On Time Performance 2,688 4.61
Trip Information/Alerts/Status 2,646 4.22
Seat Spacing 2,677 4.38
Seat Comfort 2,680 4.48
Visibility (Size and clarity of windows, scenery) 2,656 4.00
Checked Baggage 2,630 3.15
Ability to handle Bicycles 2,593 2.17
NCDOT Volunteer Train Hosts 2,598 2.95
Snack & Beverage Service 2,647 3.56

20. (Carolinian) When traveling by train, please rate the importance of the following.
Carolinian
Responses Mean Rating
On Time Performance 2,999 4.57
Availability of Business/Premium Class Service 2,880 3.22
Trip Information/Alerts/Status 2,906 4.11
Seat Spacing 2,959 4.44
Seat Comfort 2,972 4.54
Visibility (Size and clarity of windows, scenery) 2,924 4.12
Checked Baggage 2,890 3.32
Ability to handle Bicycles 2,784 1.95
NCDOT Volunteer Train Hosts 2,797 2.87
Wi-Fi 2,867 4.31
Food Service 2,913 3.89
21. (Piedmont) / 24. (Carolinian) Do you live in North Carolina?
Piedmont Carolinian
Responses 2,681 2,892
Non-responses 143 281
(% of responses) (% of responses)
Yes 88.1% 59.3%
No 11.9% 40.7%
Total 100.0% 100.0%
22. (Piedmont) / 25. (Carolinian) What is you gender?
Piedmont Carolinian
Responses 2,693 3,038
Non-responses 131 135
(% of responses) (% of responses)
Female 55.1% 64.5%
Male 44.9% 35.5%
Total 100.0% 100.0%
23. (Piedmont) / 21. (Carolinian) If you were able to bundle services with your train fare,
which services would you be interested in purchasing? (Multiple options selectable)
Piedmont Carolinian
Responses 2,657 2,925
Non-responses 167 248
(% of responses) (% of responses)
Connecting Transportation 37.0% 32.9%
Rental Car 25.8% 27.7%

Lodging 17.8% 20.5%
Tour Packages 11.7% 13.9%
Dining Options at Destination 22.5% 18.5%
Sporting Event Tickets 19.4% 11.5%
None 29.6% 33.4%
24. (Piedmont) / 22. (Carolinian) Would you be interested in a bicycle share program at the
stations?
Piedmont Carolinian
Responses 2,657 2,976
Non-responses 167 197
(% of responses) (% of responses)
Yes 27.1% 20.2%
No 72.9% 79.8%
Total 100.0% 100.0%
25. (Piedmont) / 23. (Carolinian) Overall how would you rate your trip experience today on the
Piedmont or Carolinian?
Piedmont Carolinian
Responses 2,688 2,919
Non-responses 136 254
(% of responses) (% of responses)
1 0.8% 1.6%
2 0.9% 2.5%
3 6.5% 11.9%
4 33.2% 35.8%
5 58.6% 48.2%
Mean Rating 4.48 4.27
26. What best describes your age group?
Piedmont Carolinian
Responses 2,738 3,081
Non-responses 86 92
(% of responses) (% of responses)
19 and under 18.8% 8.0%
20 to 24 18.5% 11.0%
25 to 29 9.3% 6.8%
30 to 34 6.6% 7.0%
35 to 39 6.2% 5.9%
40 to 44 6.5% 5.6%

45 to 49 5.9% 6.7%
50 to 54 6.6% 8.1%
55 to 59 6.6% 8.9%
60 to 64 5.6% 10.5%
65+ 9.3% 21.5%
Total 100.0% 100.0%
27. What best describes your employment status?
Piedmont Carolinian
Responses 2,715 3,038
Non-responses 109 135
(% of responses) (% of responses)
Full Time 41.9% 42.6%
Part Time 9.9% 7.8%
Student 28.8% 13.8%
Unemployed 6.6% 7.0%
Retired 12.8% 28.9%
Total 100.0% 100.0%
28. What is your highest education level?
Piedmont Carolinian
Responses 2,525 2,824
Non-responses 299 349
(% of responses) (% of responses)
No HS Diploma 3.5% 3.8%
HS Diploma or GED 17.2% 15.6%
Some College 31.6% 24.3%
Associate’s Degree 6.7% 8.9%
Bachelor’s Degree 22.2% 22.3%
Master’s Degree 12.1% 15.5%
Post Graduate 6.7% 9.6%
Total 100.0% 100.0%
29. What is your ethnicity?
Piedmont Carolinian
Responses 2,682 3,011
Non-responses 142 162
(% of responses) (% of responses)
American Indian 1.7% 1.8%
Asian/Asian American 5.0% 3.2%
Black/African American 39.2% 40.7%

Hispanic/Latino 4.5% 4.6%
White/Caucasian 45.5% 44.9%
Other 4.1% 4.8%
Total 100.0% 100.0%
30. What is your total household income in the past 12 months?
Piedmont Carolinian
Responses 2,366 2,663
Non-responses 458 510
(% of responses) (% of responses)
Under $25,000 29.6% 23.7%
$25,000 to $49,000 25.0% 27.3%
$50,000 to $100,000 25.7% 29.1%
$100,000 or more 19.7% 19.9%
Total 100.0% 100.0%
Would you like to receive North Carolina’s Amtrak information, promotions and deals?
Piedmont Carolinian
Responses 1,705 1,861
Non-responses 1,119 1,312
(% of responses) (% of responses)
Yes 36.8% 38.8%
No 63.2% 61.2%
Total 100.0% 100.0%
These are the states of residency for out-of-state riders. They have been enumerated using the zip codes supplied.
State Piedmont Carolinian Total
Virginia 5.0% 18.1% 15.8%
Maryland 5.0% 16.2% 14.2%
New York 4.6% 16.1% 14.1%
New Jersey 3.8% 13.9% 12.1%
Pennsylvania 0.8% 9.7% 8.1%
South Carolina 15.9% 4.5% 6.5%
Florida 28.5% 1.7% 6.4%
Washington, DC 3.3% 6.9% 6.3%
California 4.2% 1.8% 2.2%
All other states 28.9% 11.3% 14.4%