Pie Face Investor Presentation
11
WELCOME TO August 2014 INVESTOR PRESENTATION 1
-
Upload
real-world -
Category
Investor Relations
-
view
57 -
download
1
Transcript of Pie Face Investor Presentation

WELCOME TO
August 2014
INVESTOR PRESENTATION
1

We
ma
ke p
ies
with
funn
y lit
tle fa
ce
s o
n th
em
. The
y’re
da
mn
tast
y.
Introduction to Pie Face
Management and Board
Investment Highlights
Financial Information
Appendices
AGENDA the best damn pies in the world !sweet & savoury pies, coffee, sandwiches, cakes & pastries
1
2
3
4
5
4
1
2
3
4
5
OUR FOOD the best damn pies in the world !sweet & savoury pies, coffee, sandwiches, cakes & pastries
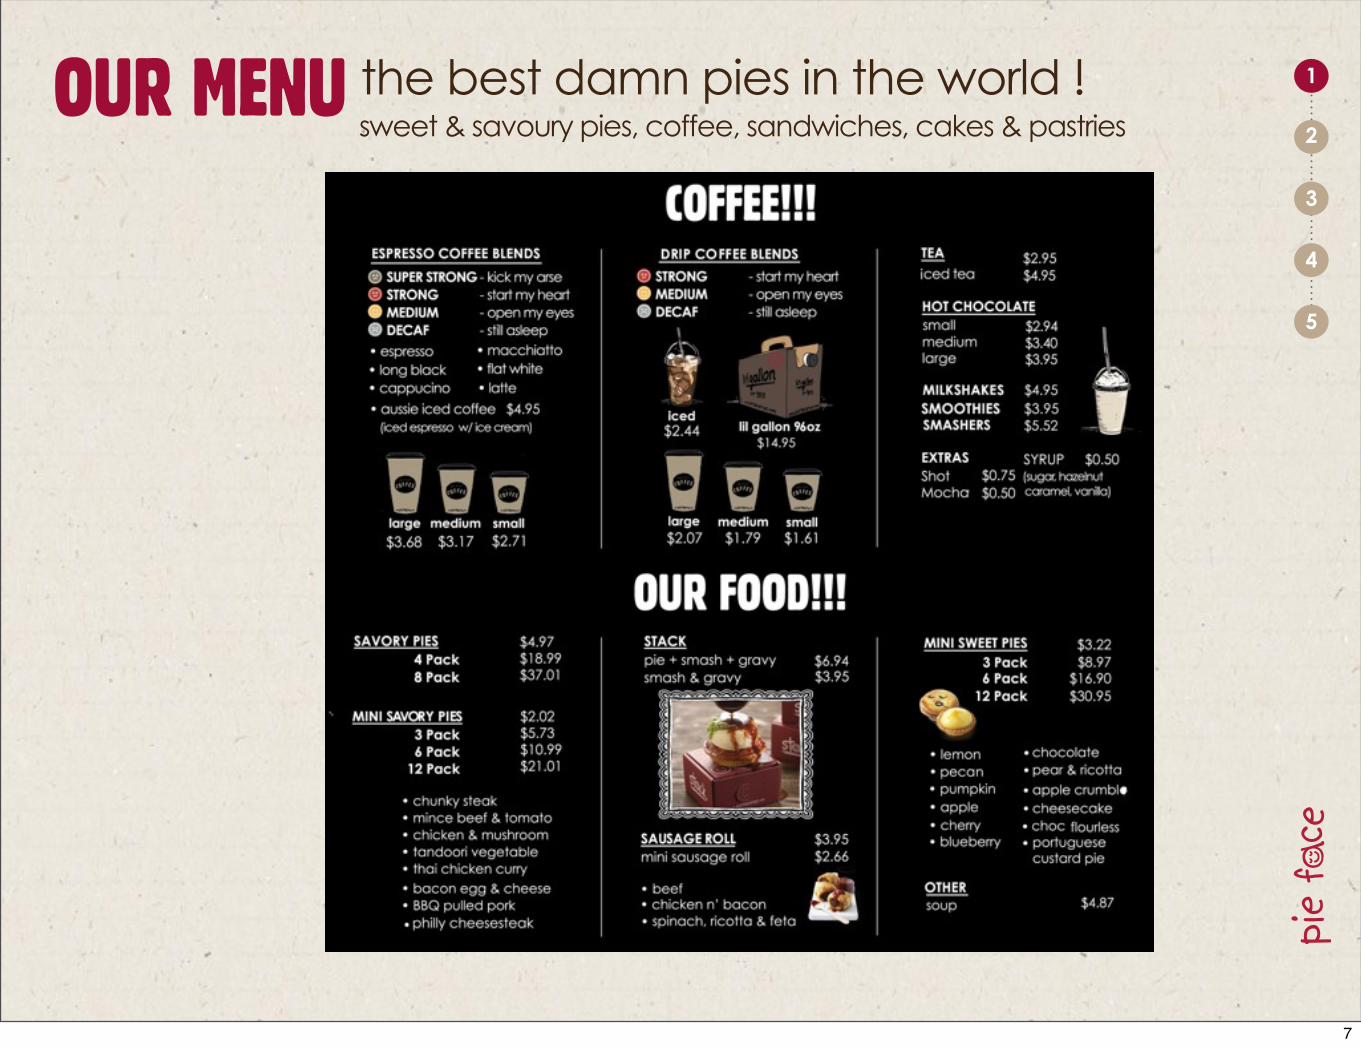
Premium fillingsin flaky golden pastry.
savoury mini-sweetpastrymini
Same as regular product but in snack sized portions.
Mouth watering menu of muffins, brownies, quiches, croissants & assorted pastries.
Finger licking small sweet pies a range of sweet fillings including cherry, apple & pumpkin.
Freshly made range including tuna, chickenor ham all withcrisp salad.
Select your pie and top with mashed peppery potatoes,peas & special gravy.
fresh stack
6
1
2
3
4
5
OUR MENU the best damn pies in the world !sweet & savoury pies, coffee, sandwiches, cakes & pastries
7
1
2
3
4
5
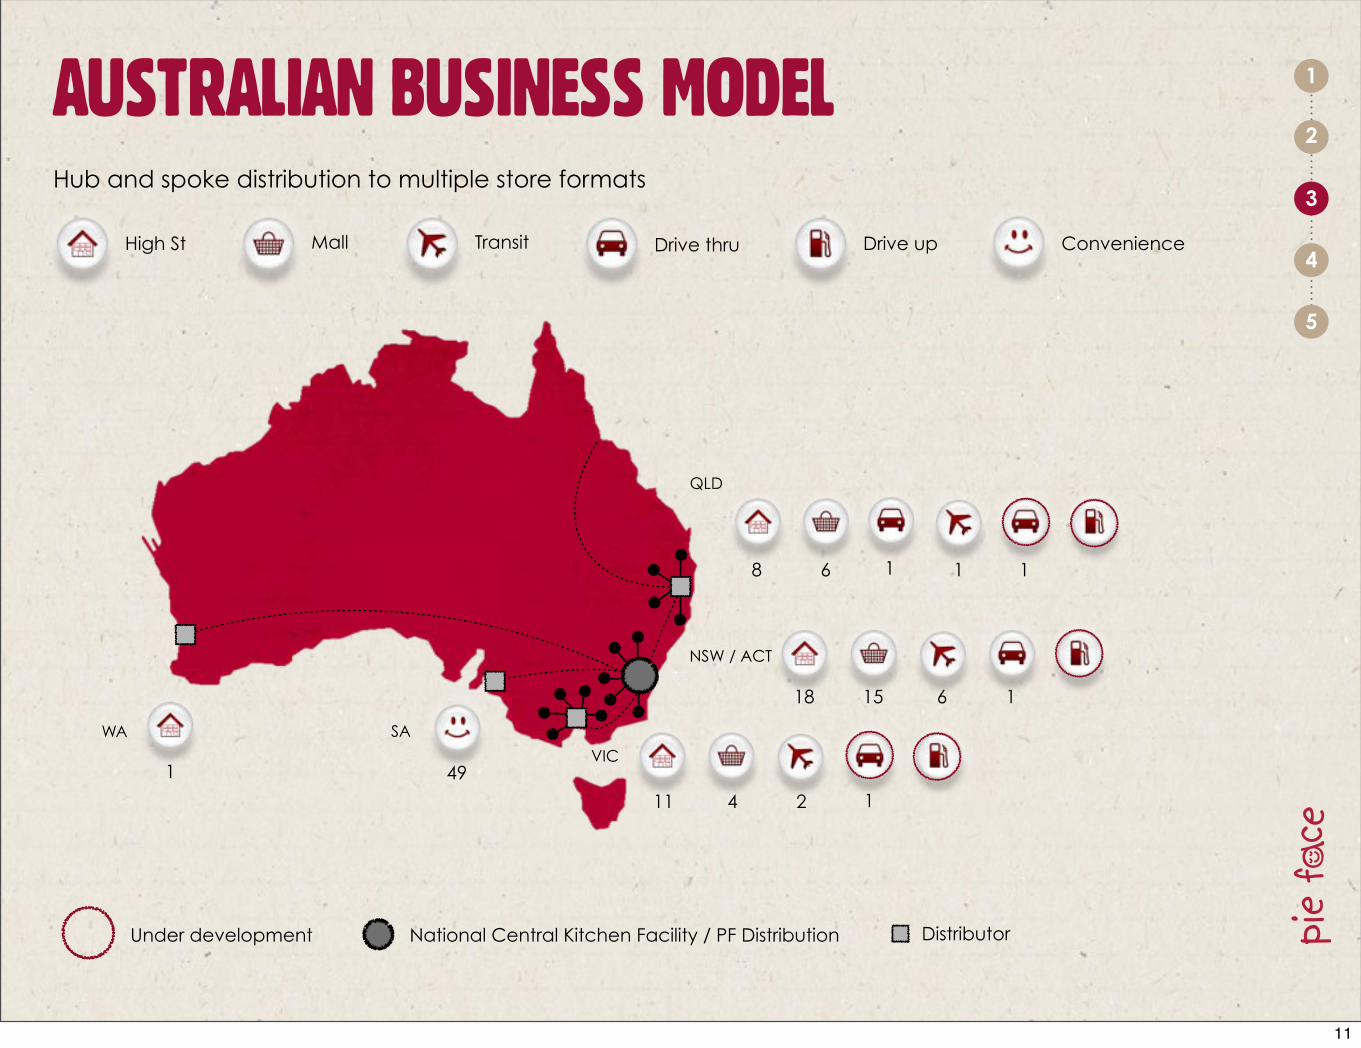
11 4 2
VIC
QLD
NSW / ACT
18 15 6 1
8 6 1 1
1
WA
1
AUSTRALIAN BUSINESS MODEL
National Central Kitchen Facility / PF Distribution
Hub and spoke distribution to multiple store formats
DistributorUnder development
MallHigh St Transit Drive thru Drive up Convenience
1
SA
49
11

1
2
3
4
5
ATTRACTIVE OFFERING - Strong Brand
Selfie
14
1
2
3
4
5
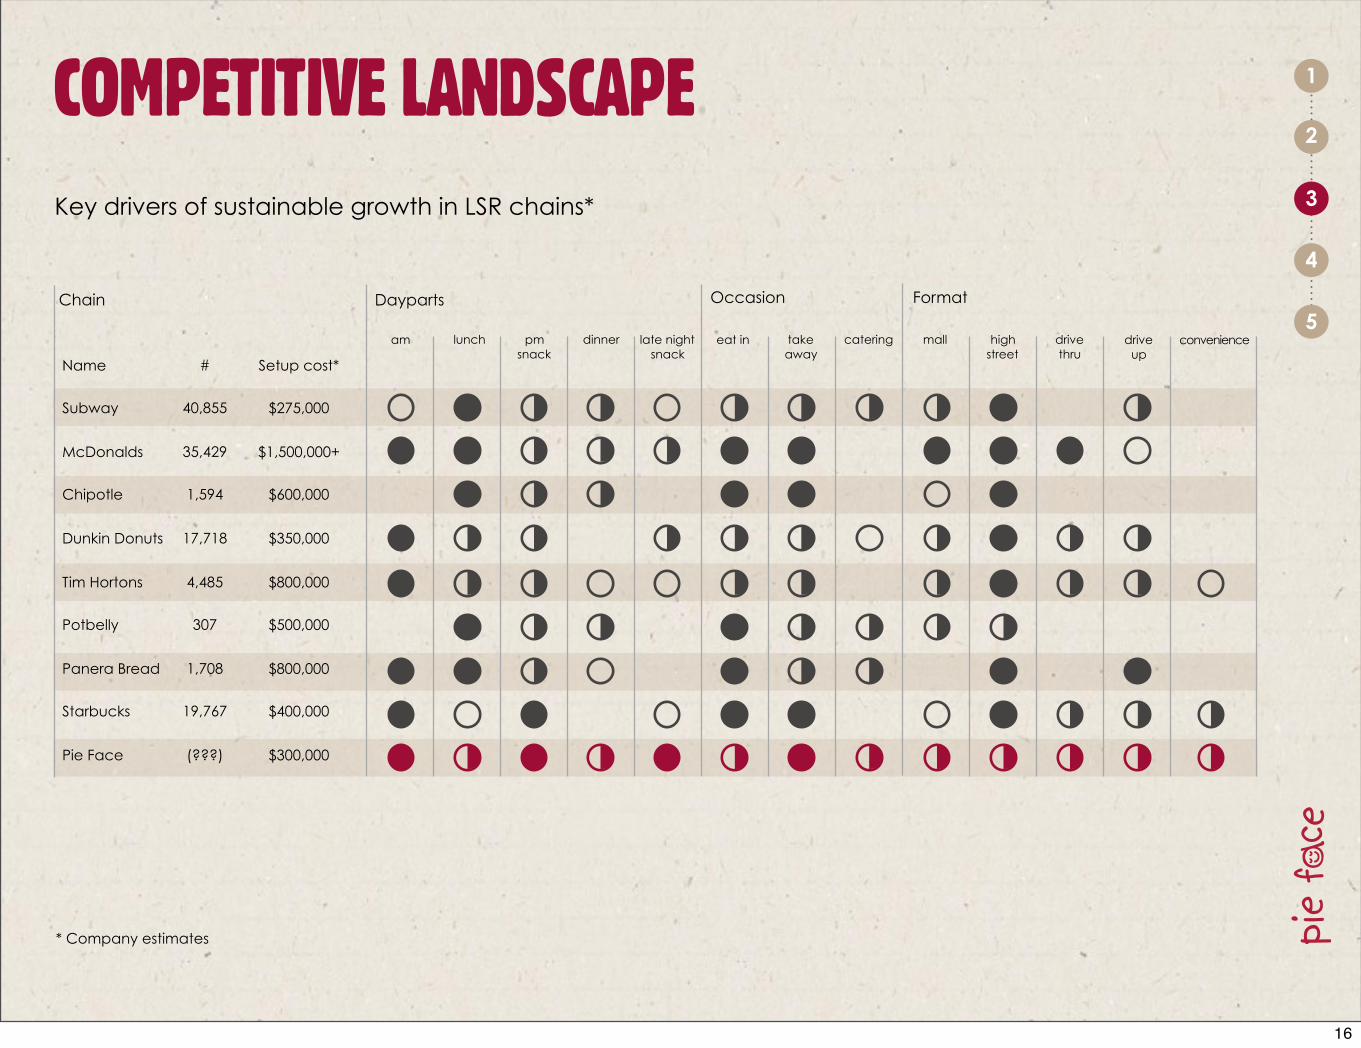
COMPETITIVE LANDSCAPE
Key drivers of sustainable growth in LSR chains*
pmsnack
Chain Dayparts Occasion Format
Name
Subway
McDonalds
Chipotle
Dunkin Donuts
Tim Hortons
Potbelly
Panera Bread
Starbucks
Pie Face
#
40,855
35,429
1,594
17,718
4,485
307
1,708
19,767
(???)
Setup cost*
$275,000
$1,500,000+
$600,000
$350,000
$800,000
$500,000
$800,000
$400,000
$300,000
am lunch dinner late nightsnack
eat in takeaway
catering mall highstreet
drivethru
driveup
convenience
* Company estimates
16
1
2
3
4
5
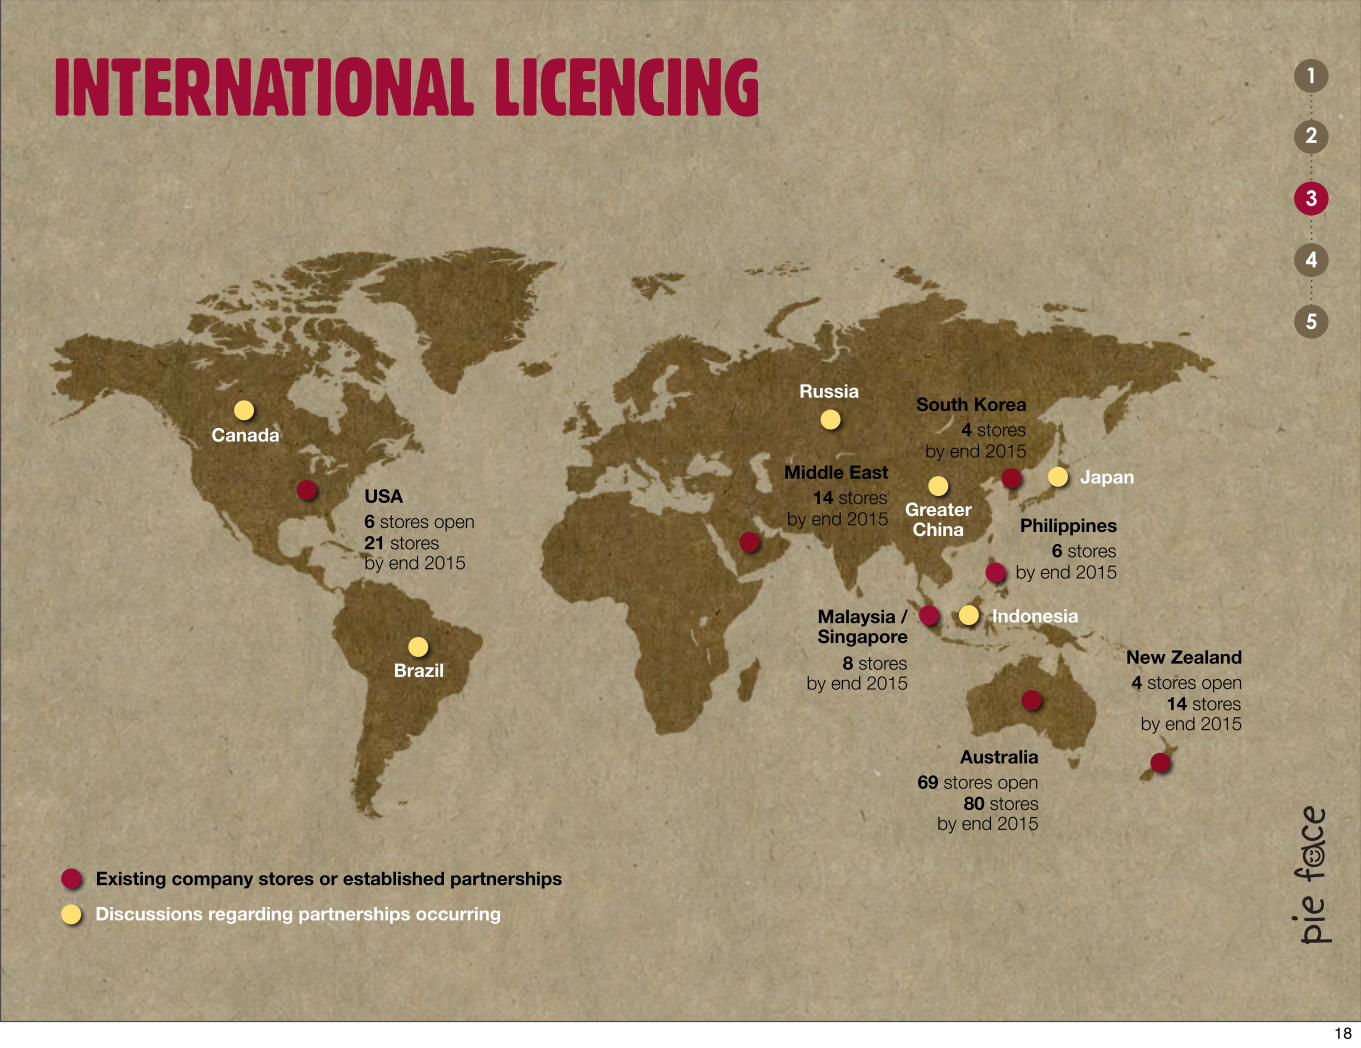
Philippines6 stores
by end 2015
INTERNATIONAL LICENCING
Australia69 stores open
80 stores by end 2015
New Zealand4 stores open
14 storesby end 2015
USA6 stores open21 storesby end 2015
Indonesia
Japan
Malaysia /Singapore
8 storesby end 2015
Brazil
Canada
Discussions regarding partnerships occurring
Middle East14 stores
by end 2015
Existing company stores or established partnerships
GreaterChina
RussiaSouth Korea
4 storesby end 2015
18
1
2
3
4
5
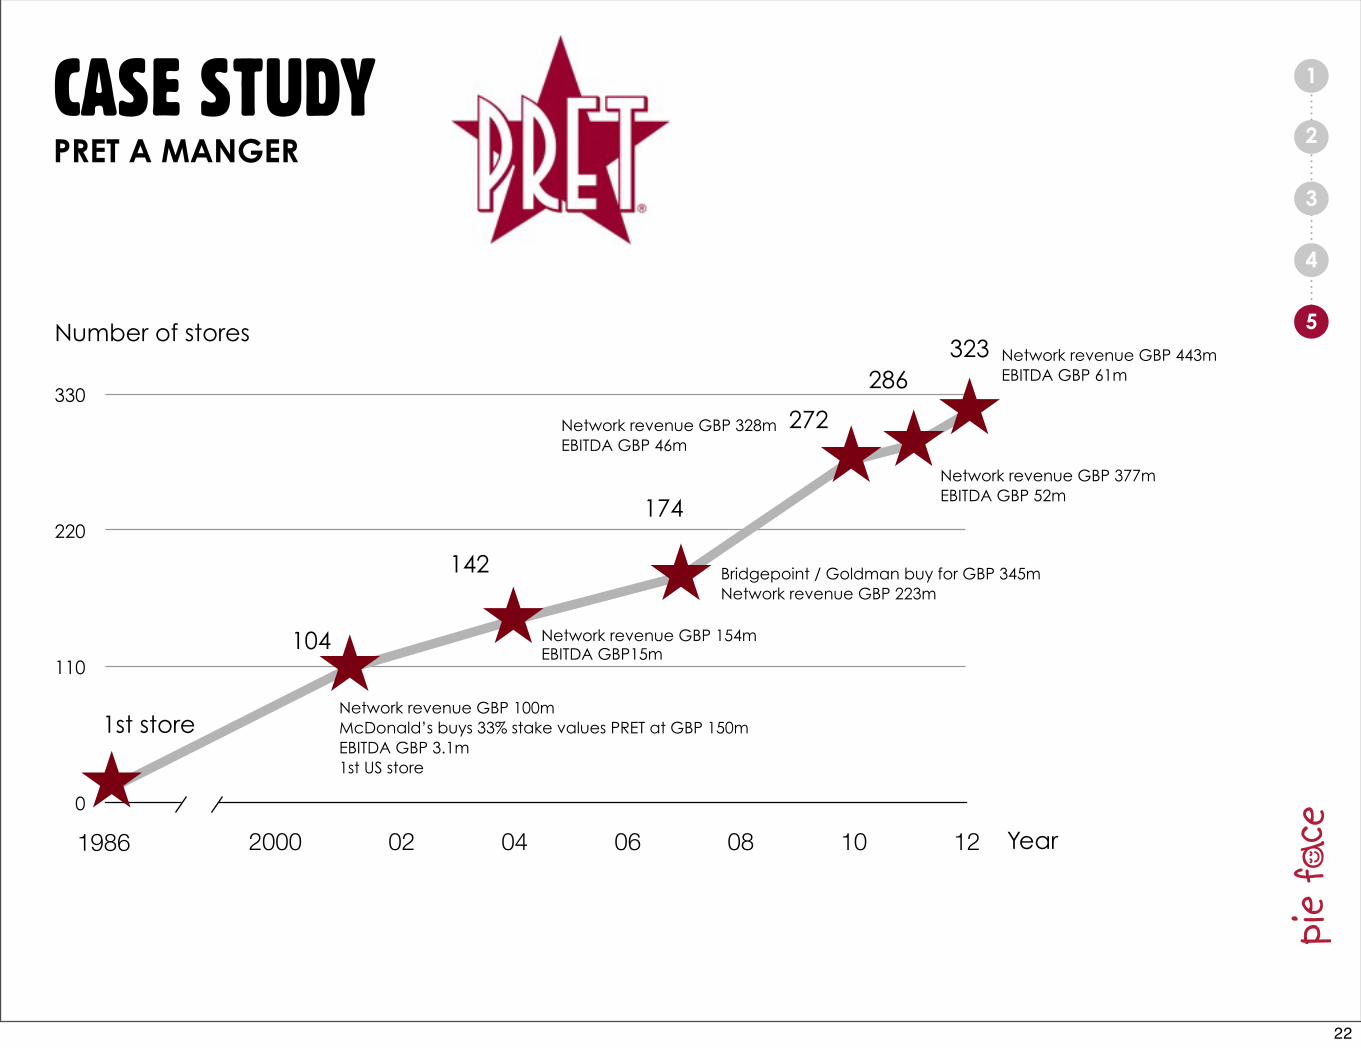
CASE STUDY
Number of stores
PRET A MANGER
0
110
220
330
86 88 90 92 94 96 98 2000 02 04 06 08 10 12 Year
1st storeNetwork revenue GBP 100mMcDonald’s buys 33% stake values PRET at GBP 150mEBITDA GBP 3.1m1st US store
Network revenue GBP 154mEBITDA GBP15m
Bridgepoint / Goldman buy for GBP 345mNetwork revenue GBP 223m
Network revenue GBP 443mEBITDA GBP 61m
104
142
174
323
272Network revenue GBP 328mEBITDA GBP 46m
1986 2000 02 04 06 08 10 12
286
Network revenue GBP 377mEBITDA GBP 52m
22
1
2
3
4
5
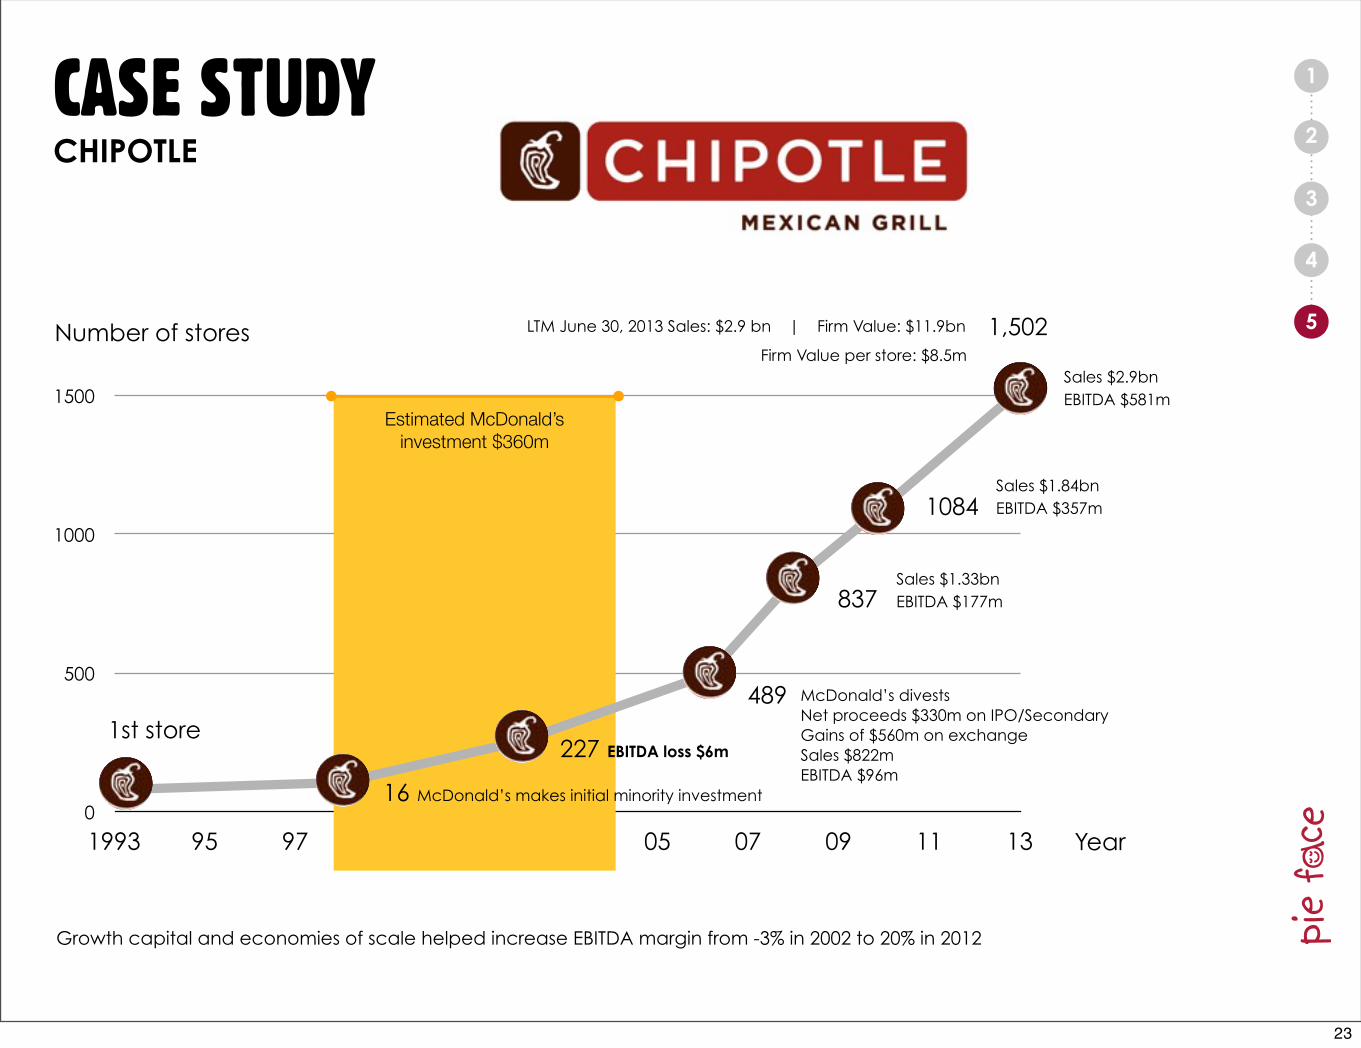
CASE STUDYCHIPOTLE
0
500
1000
1500
1993 95 97 99 01 03 05 07 09 11 13
Estimated McDonald’sinvestment $360m
Year
1st store
16 McDonald’s makes initial minority investment
McDonald’s divests Net proceeds $330m on IPO/SecondaryGains of $560m on exchangeSales $822mEBITDA $96m
227 EBITDA loss $6m
1,502LTM June 30, 2013 Sales: $2.9 bn | Firm Value: $11.9bn
489
837
1084
Sales $1.33bnEBITDA $177m
Sales $1.84bnEBITDA $357m
Growth capital and economies of scale helped increase EBITDA margin from -3% in 2002 to 20% in 2012
Firm Value per store: $8.5mSales $2.9bnEBITDA $581m
Number of stores
23
1
2
3
4
5
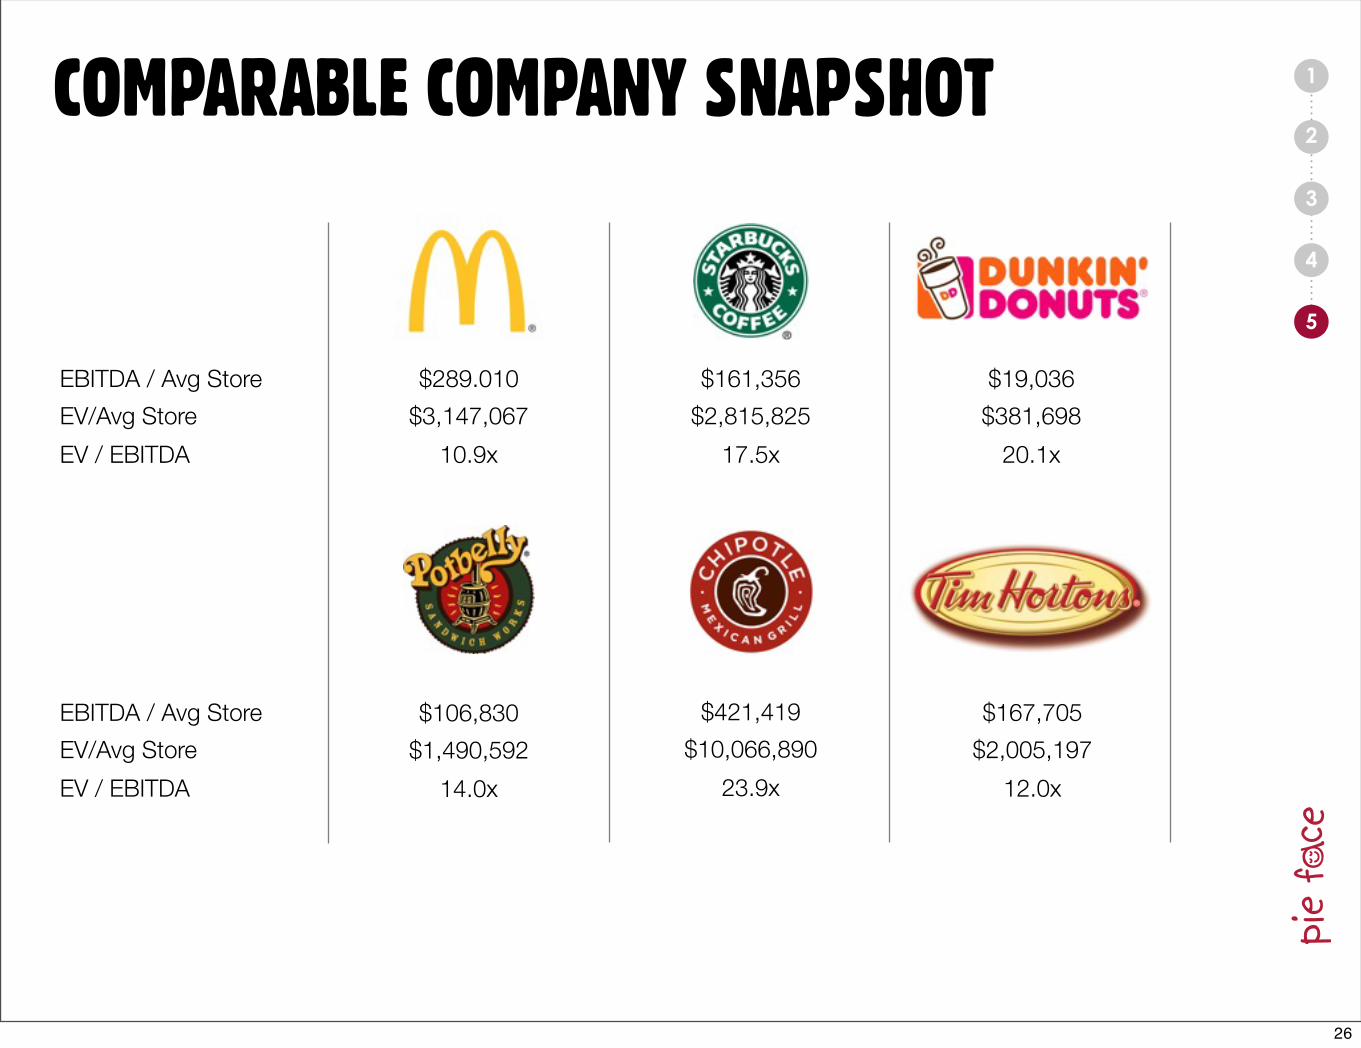
$106,830
$1,490,592
14.0x
$421,419
$10,066,890
23.9x
$167,705
$2,005,197
12.0x
EBITDA / Avg Store
EV/Avg Store
EV / EBITDA
COMPARABLE COMPANY SNAPSHOT
$289.010
$3,147,067
10.9x
$161,356
$2,815,825
17.5x
$19,036
$381,698
20.1x
EBITDA / Avg Store
EV/Avg Store
EV / EBITDA
26


![SCface surveillance cameras face databasescface.org/SCface - Surveillance Cameras Face Database.pdf · SCface – surveillance cameras face database ... CMU PIE [18], FERET [16, 17]](https://static.fdocuments.in/doc/165x107/5b15d5d87f8b9a961e8b91c5/scface-surveillance-cameras-face-surveillance-cameras-face-databasepdf-scface.jpg)