P&ID Handout.pdf
18
P&ID SYMBOLS P&ID SYMBOLS ISA Symbols and Loop Diagrams Process Analysis and Control P&ID Handout Page 1 Lecture 4, Week 3, 2012
description
Training3
Transcript of P&ID Handout.pdf
P&ID SYMBOLSP&ID SYMBOLS
ISA Symbols and Loop Diagrams
Process Analysis and Control P&ID Handout Page 1 Lecture 4, Week 3, 2012
P&IDs
• Piping & Instrumentation Drawing (original)• Process & Instrumentation Diagram (also used)• Process Flow Diagram – PFD (simplified version of
the P&ID)
Most industries have standardized the symbols according to the ISA Standard S5.1 Instrumentation Symbol Specification.
Piping and Instrumentation Diagrams or simply P&IDs are the “schematics” used in the field of instrumentation and control (Automation)
The P&ID is used to by field techs, engineers, and operators to better understand the process and how the instrumentation is inter connected.
Process Analysis and Control P&ID Handout Page 2 Lecture 4, Week 3, 2012
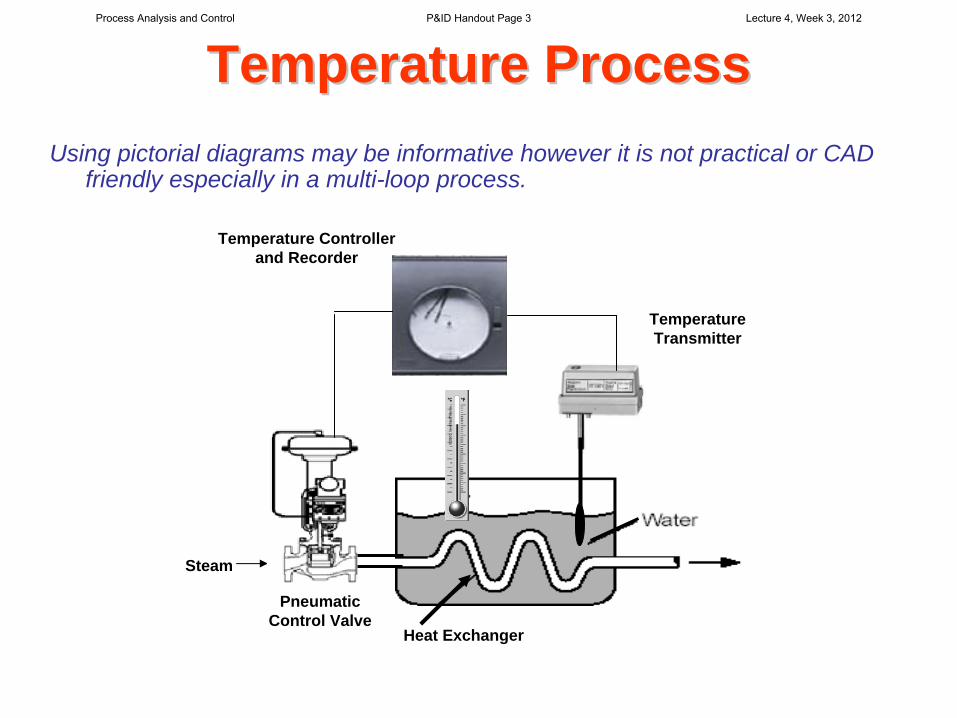
Temperature ProcessTemperature ProcessUsing pictorial diagrams may be informative however it is not practical or CAD
friendly especially in a multi-loop process.
Steam
Temperature Controller and Recorder
Temperature Transmitter
Pneumatic Control Valve
Heat Exchanger
Process Analysis and Control P&ID Handout Page 3 Lecture 4, Week 3, 2012
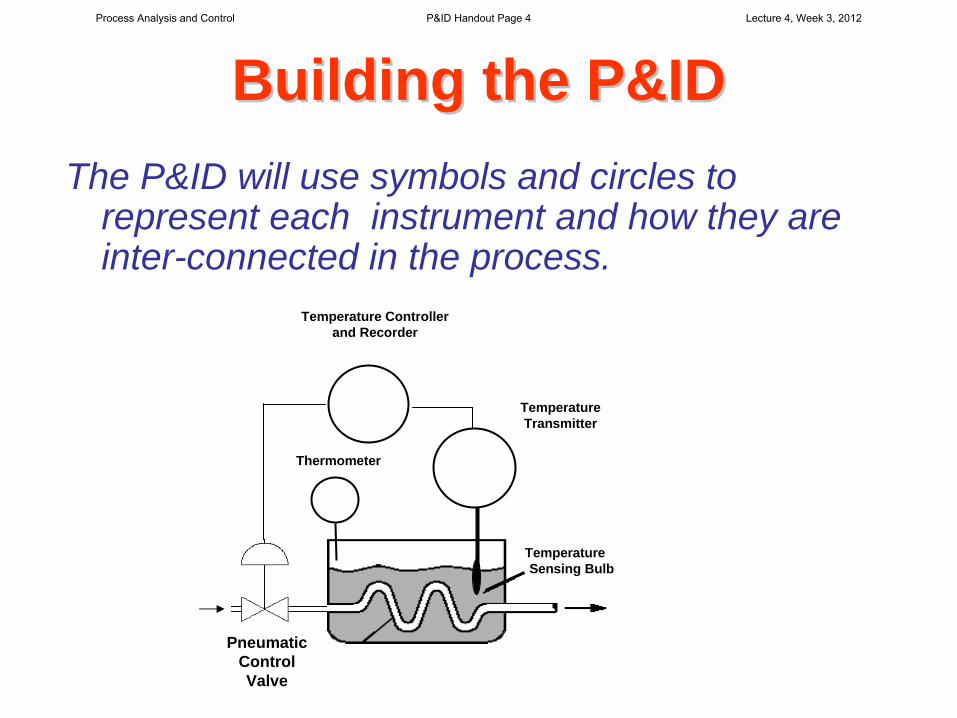
Building the P&IDBuilding the P&IDThe P&ID will use symbols and circles to
represent each instrument and how they are inter-connected in the process.
Thermometer
TemperatureSensing Bulb
Temperature Transmitter
Temperature Controller and Recorder
Pneumatic Control Valve
Process Analysis and Control P&ID Handout Page 4 Lecture 4, Week 3, 2012
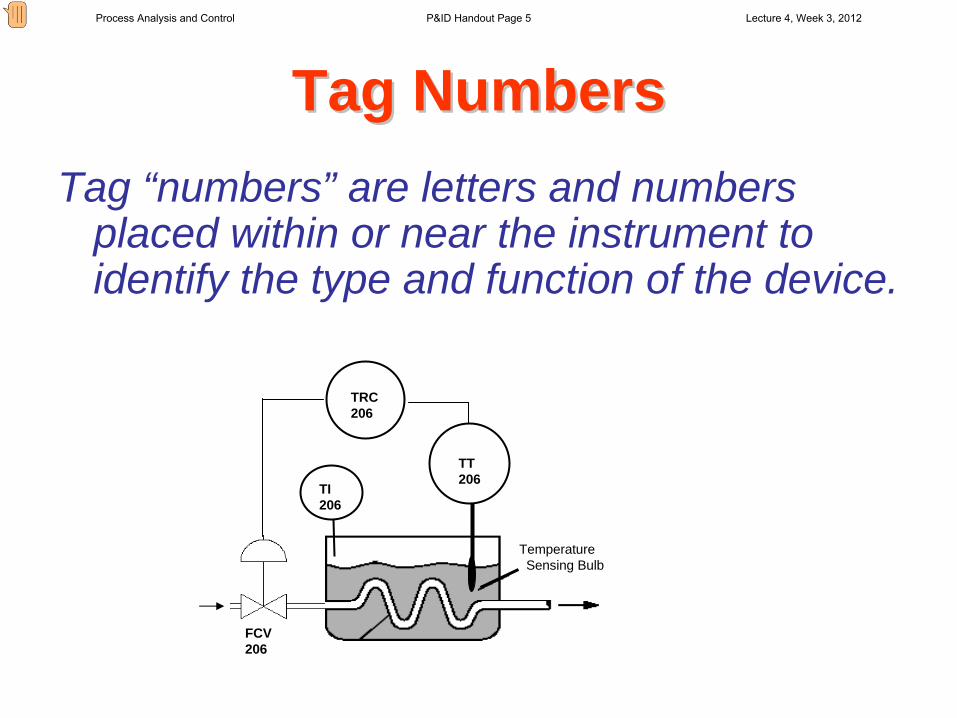
Tag NumbersTag NumbersTag “numbers” are letters and numbers
placed within or near the instrument to identify the type and function of the device.
TemperatureSensing Bulb
TRC206
FCV206
TT206
TI206
Process Analysis and Control P&ID Handout Page 5 Lecture 4, Week 3, 2012
Presenter
Presentation Notes
Inside the I.S.A. instrumentation symbols is a code called a tag number that indicates the function and nature of the component represented. The tag number is composed of letters and numbers.
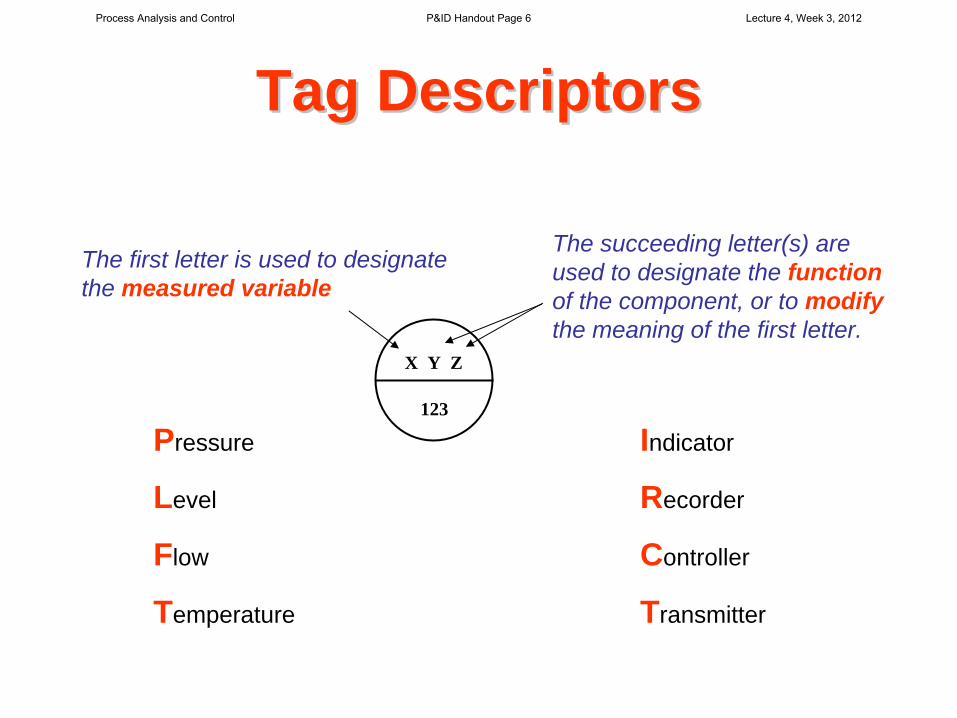
The first letter is used to designate the measured variable
Tag DescriptorsTag Descriptors
123
X Y Z
The succeeding letter(s) are used to designate the function of the component, or to modify the meaning of the first letter.
Pressure
Level
Flow
Temperature
Indicator
Recorder
Controller
Transmitter
Process Analysis and Control P&ID Handout Page 6 Lecture 4, Week 3, 2012
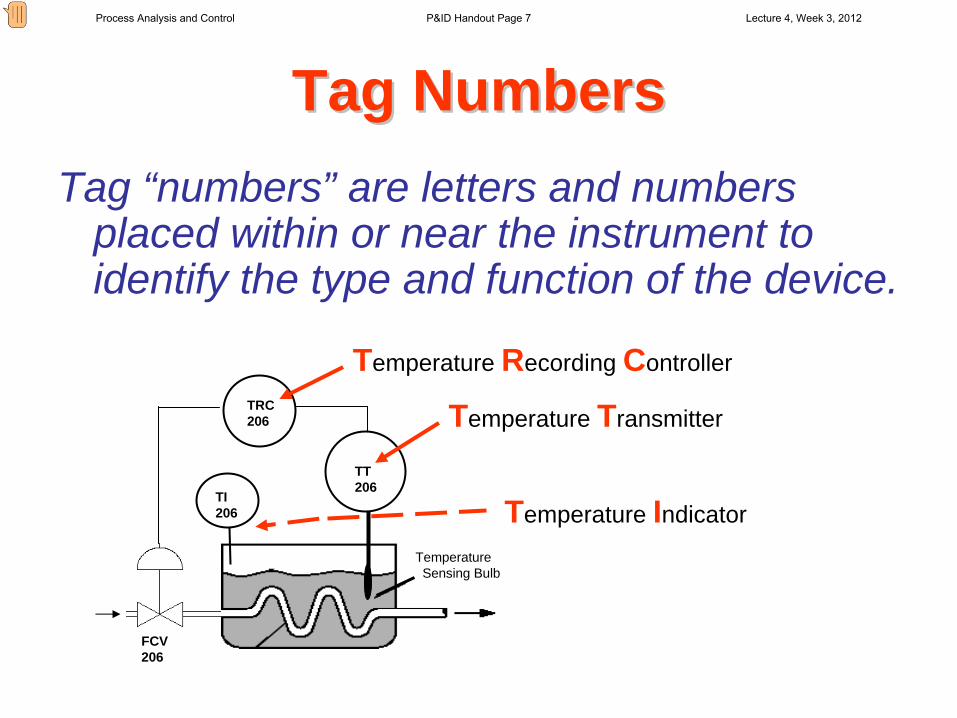
Tag NumbersTag NumbersTag “numbers” are letters and numbers
placed within or near the instrument to identify the type and function of the device.
TemperatureSensing Bulb
TRC206
FCV206
TT206
TI206
Temperature Recording Controller
Temperature Transmitter
Temperature Indicator
Process Analysis and Control P&ID Handout Page 7 Lecture 4, Week 3, 2012
Presenter
Presentation Notes
Inside the I.S.A. instrumentation symbols is a code called a tag number that indicates the function and nature of the component represented. The tag number is composed of letters and numbers.
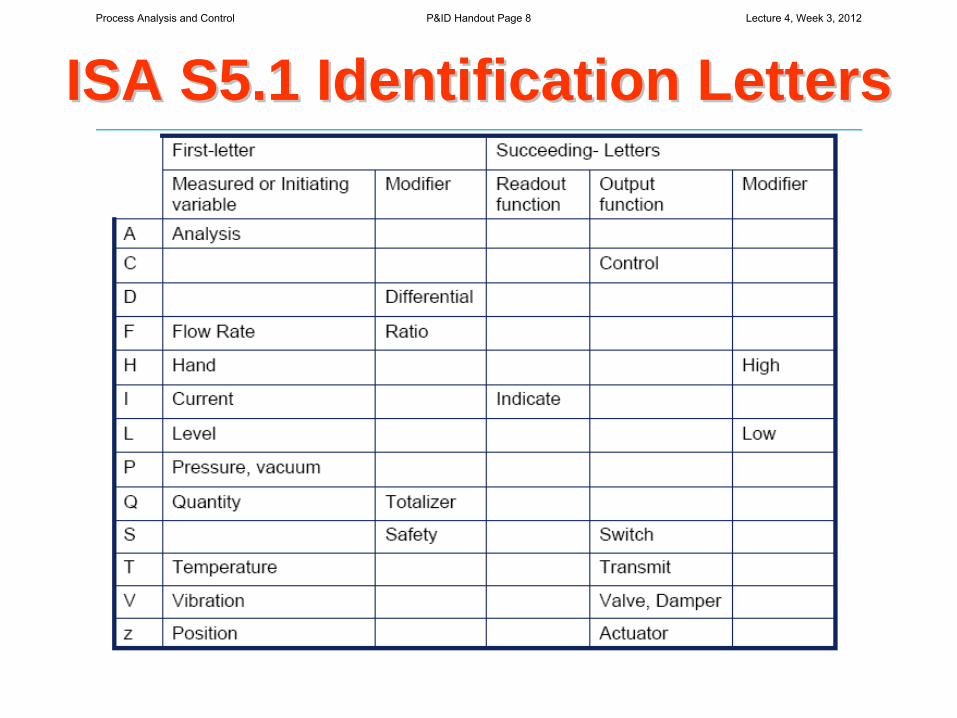
ISA S5.1 Identification LettersISA S5.1 Identification LettersProcess Analysis and Control P&ID Handout Page 8 Lecture 4, Week 3, 2012
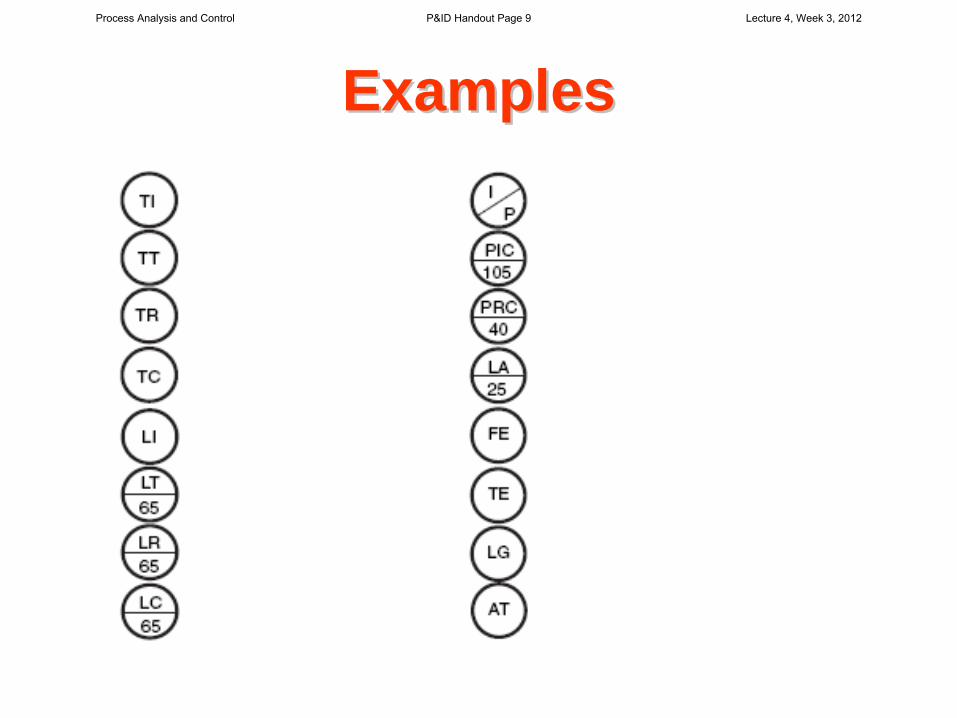
Examples Examples Process Analysis and Control P&ID Handout Page 9 Lecture 4, Week 3, 2012
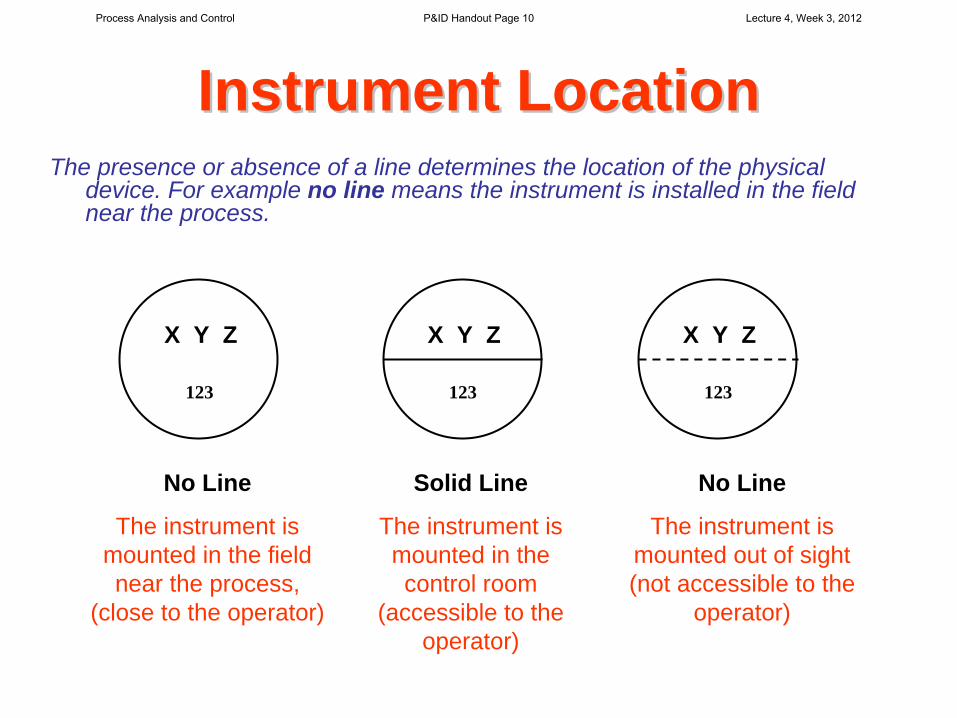
Instrument LocationInstrument LocationThe presence or absence of a line determines the location of the physical
device. For example no line means the instrument is installed in the field near the process.
123
X Y Z
123
X Y Z
123
X Y Z
No Line
The instrument is mounted in the field near the process,
(close to the operator)
Solid Line
The instrument is mounted in the control room
(accessible to the operator)
No Line
The instrument is mounted out of sight (not accessible to the
operator)
Process Analysis and Control P&ID Handout Page 10 Lecture 4, Week 3, 2012
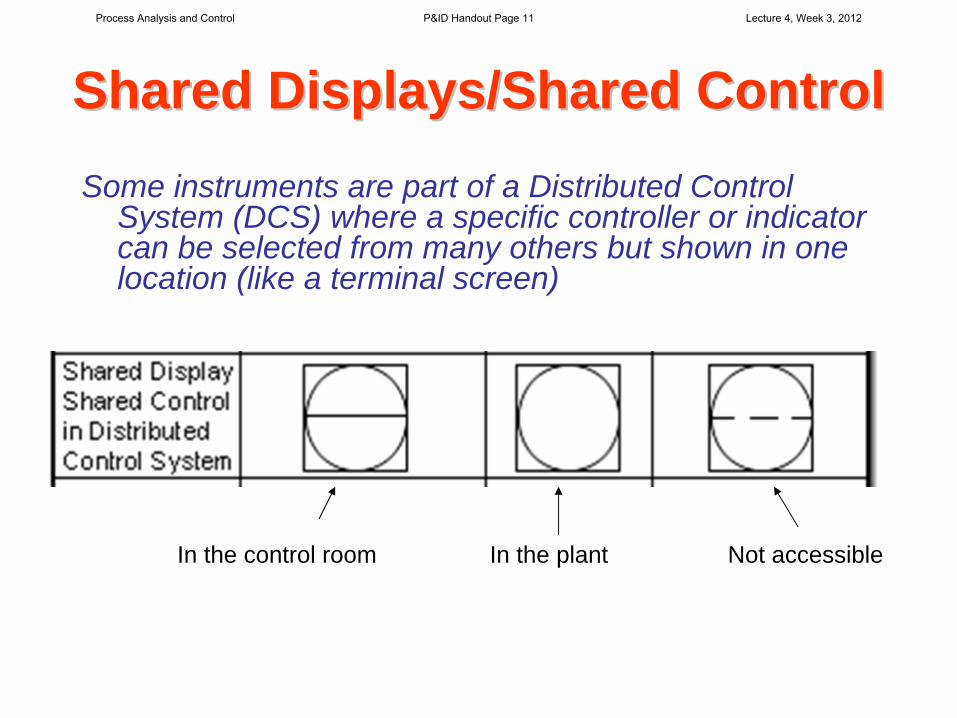
Shared Displays/Shared ControlShared Displays/Shared ControlSome instruments are part of a Distributed Control
System (DCS) where a specific controller or indicator can be selected from many others but shown in one location (like a terminal screen)
In the control room In the plant Not accessible
Process Analysis and Control P&ID Handout Page 11 Lecture 4, Week 3, 2012
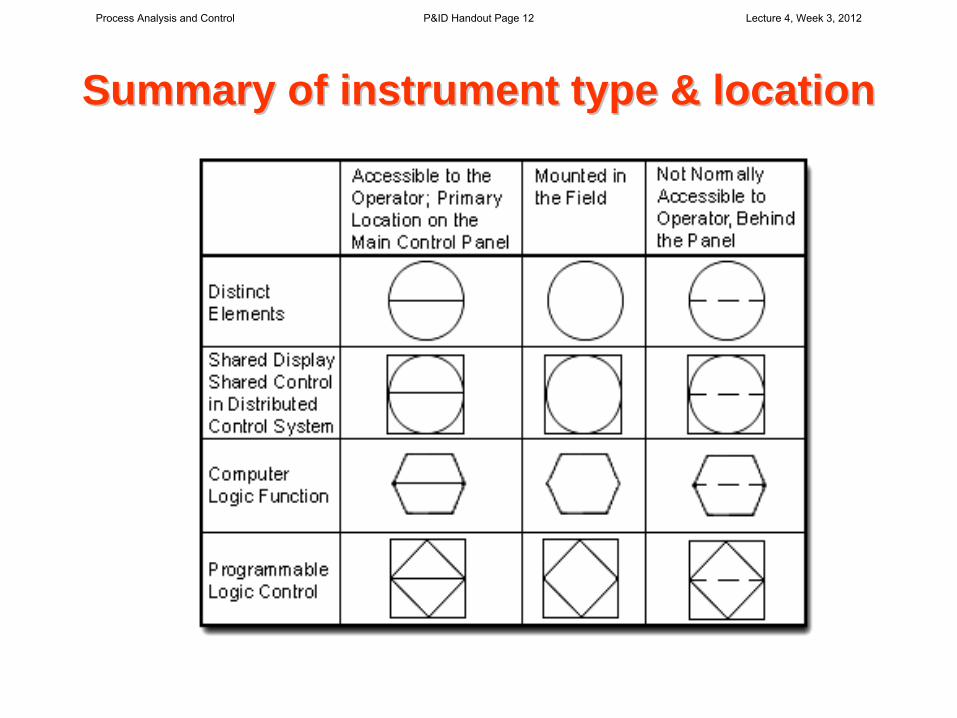
Summary of instrument type & locationSummary of instrument type & location
Process Analysis and Control P&ID Handout Page 12 Lecture 4, Week 3, 2012
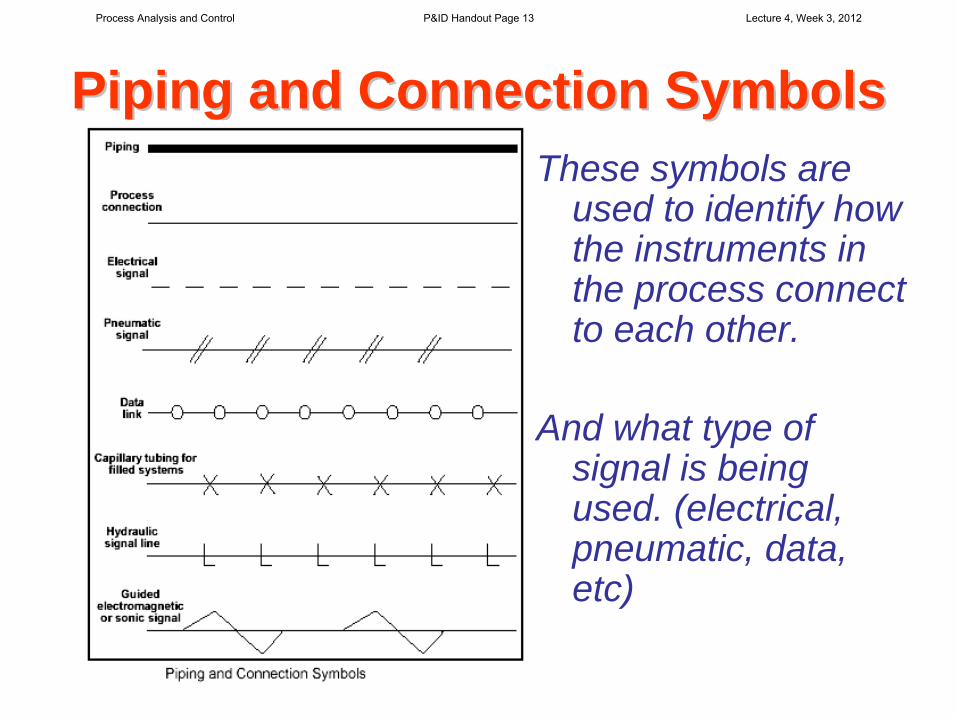
Piping and Connection SymbolsPiping and Connection SymbolsThese symbols are
used to identify how the instruments in the process connect to each other.
And what type of signal is being used. (electrical, pneumatic, data, etc)
Process Analysis and Control P&ID Handout Page 13 Lecture 4, Week 3, 2012
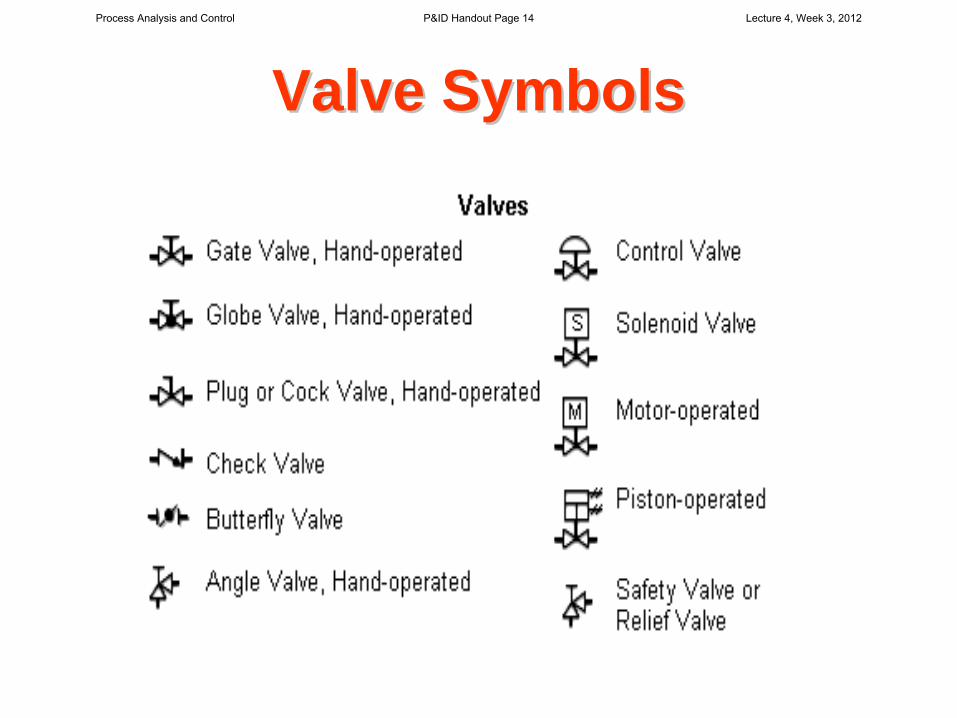
Valve SymbolsValve SymbolsProcess Analysis and Control P&ID Handout Page 14 Lecture 4, Week 3, 2012
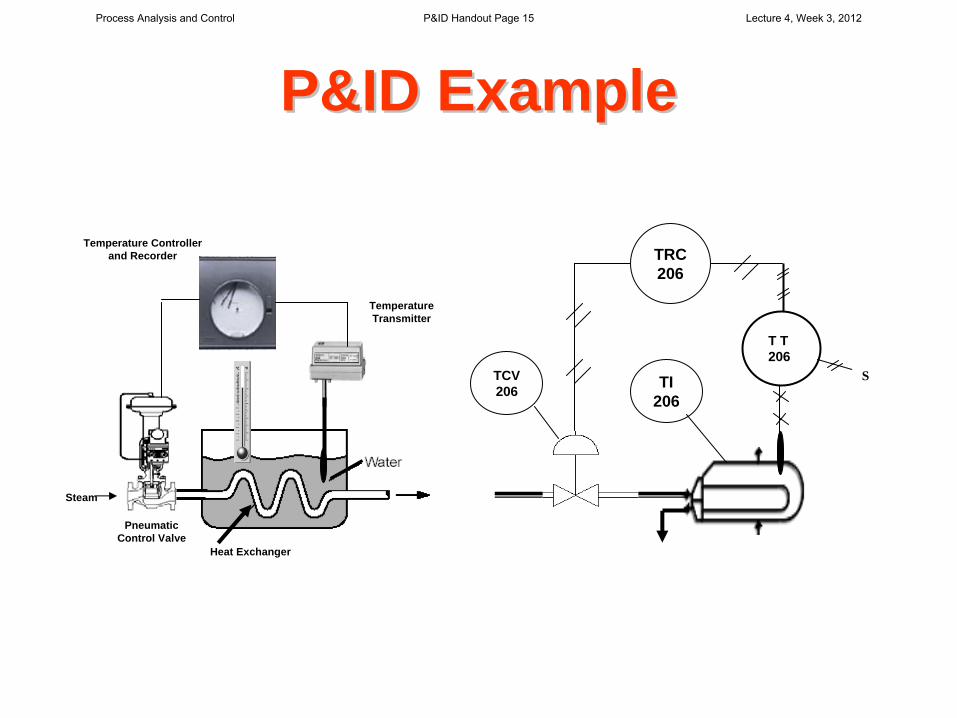
P&ID ExampleP&ID Example
Steam
Temperature Controller and Recorder
Temperature Transmitter
Pneumatic Control Valve
Heat Exchanger
TRC206
S
T T206
TI206
TCV206
Process Analysis and Control P&ID Handout Page 15 Lecture 4, Week 3, 2012
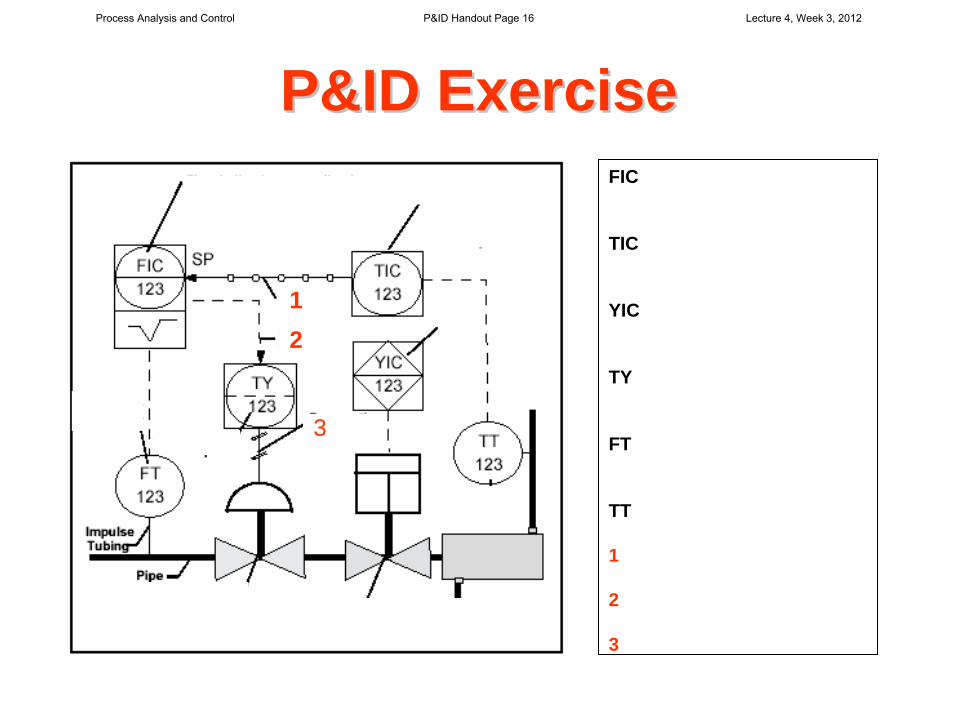
P&ID ExerciseP&ID ExerciseFIC
TIC
YIC
TY
FT
TT
1
2
3
2
3
1
Process Analysis and Control P&ID Handout Page 16 Lecture 4, Week 3, 2012
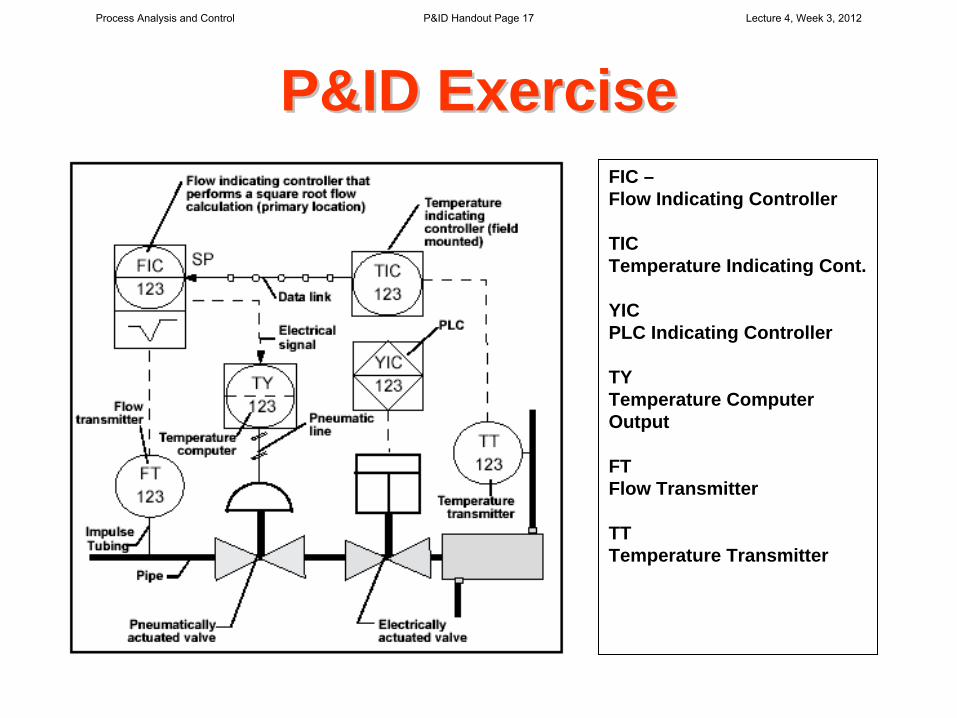
P&ID ExerciseP&ID ExerciseFIC –Flow Indicating Controller
TICTemperature Indicating Cont.
YICPLC Indicating Controller
TYTemperature Computer Output
FTFlow Transmitter
TTTemperature Transmitter
Process Analysis and Control P&ID Handout Page 17 Lecture 4, Week 3, 2012
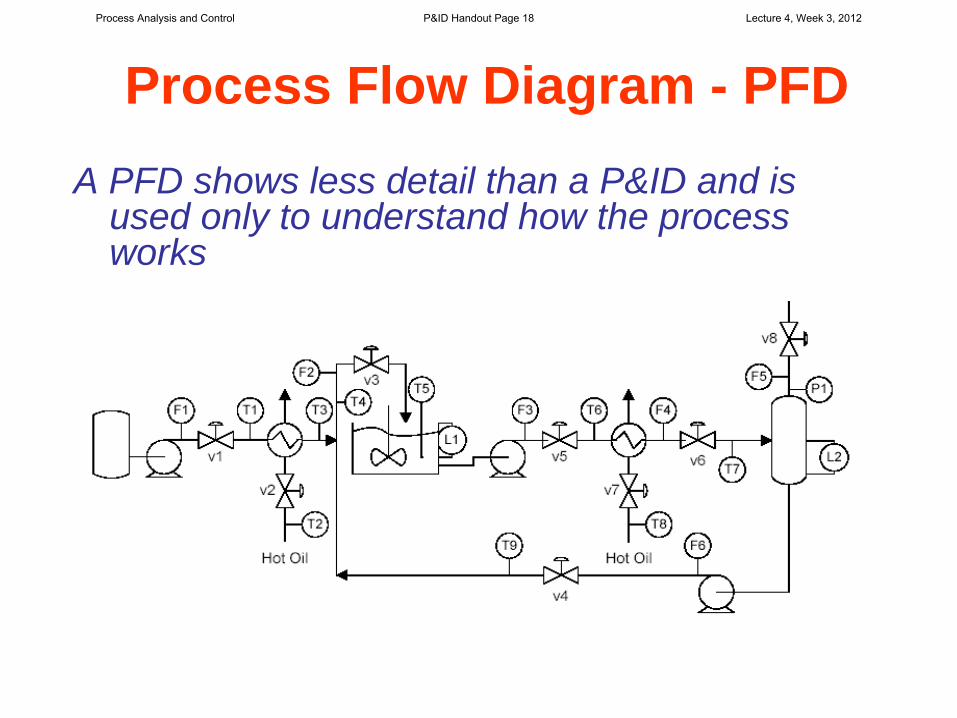
Process Flow Diagram - PFDA PFD shows less detail than a P&ID and is
used only to understand how the process works
Process Analysis and Control P&ID Handout Page 18 Lecture 4, Week 3, 2012