Picosecond time-resolved infrared spectroscopy of rhodium and...
14
This is a repository copy of Picosecond time-resolved infrared spectroscopy of rhodium and iridium azides. White Rose Research Online URL for this paper: http://eprints.whiterose.ac.uk/109109/ Version: Accepted Version Article: Portius, P. orcid.org/0000-0001-8133-8860, Meijer, A. J. H. M., Towrie, M. et al. (2 more authors) (2014) Picosecond time-resolved infrared spectroscopy of rhodium and iridium azides. Dalton Transactions, 43 (47). pp. 17694-17702. ISSN 1477-9226 https://doi.org/10.1039/c4dt02097a [email protected] https://eprints.whiterose.ac.uk/ Reuse Unless indicated otherwise, fulltext items are protected by copyright with all rights reserved. The copyright exception in section 29 of the Copyright, Designs and Patents Act 1988 allows the making of a single copy solely for the purpose of non-commercial research or private study within the limits of fair dealing. The publisher or other rights-holder may allow further reproduction and re-use of this version - refer to the White Rose Research Online record for this item. Where records identify the publisher as the copyright holder, users can verify any specific terms of use on the publisher’s website. Takedown If you consider content in White Rose Research Online to be in breach of UK law, please notify us by emailing [email protected] including the URL of the record and the reason for the withdrawal request.
Transcript of Picosecond time-resolved infrared spectroscopy of rhodium and...
This is a repository copy of Picosecond time-resolved infrared spectroscopy of rhodium and iridium azides.
White Rose Research Online URL for this paper:http://eprints.whiterose.ac.uk/109109/
Version: Accepted Version
Article:
Portius, P. orcid.org/0000-0001-8133-8860, Meijer, A. J. H. M., Towrie, M. et al. (2 more authors) (2014) Picosecond time-resolved infrared spectroscopy of rhodium and iridium azides. Dalton Transactions, 43 (47). pp. 17694-17702. ISSN 1477-9226
https://doi.org/10.1039/c4dt02097a
[email protected]://eprints.whiterose.ac.uk/
Reuse
Unless indicated otherwise, fulltext items are protected by copyright with all rights reserved. The copyright exception in section 29 of the Copyright, Designs and Patents Act 1988 allows the making of a single copy solely for the purpose of non-commercial research or private study within the limits of fair dealing. The publisher or other rights-holder may allow further reproduction and re-use of this version - refer to the White Rose Research Online record for this item. Where records identify the publisher as the copyright holder, users can verify any specific terms of use on the publisher’s website.
Takedown
If you consider content in White Rose Research Online to be in breach of UK law, please notify us by emailing [email protected] including the URL of the record and the reason for the withdrawal request.

1
2
Picosecond time-resolved infrared spectroscopy of rhodium and iridium azides
Peter Portius*,1 Anthony J. H. M. Meijer,1 Michael Towrie,2 Benjamin F. Crozier,1 Ingrid Schiager1
Picosecond time-resolved infrared spectroscopy was used to elucidate early photochemical processes in the diazido complexes
M(Cp*)(N3)2(PPh3), M = Rh (1), Ir (2), using 266 nm and 400 nm excitation in THF, CH2Cl2, MeCN and toluene solutions. The
time-resolved data have been interpreted with the aid of DFT calculations on vibrational spectra of the singlet ground states and
triplet excited states and their rotamers. While the yields of phototransformations via N2 loss are low in both complexes, 2
cleaves a N3 ligand under 266 nm excitation. The molecular structure of 1 is also reported as determined by single crystal X-ray
diffraction.
Introduction
Azides play a prominent role in photochemical transformations1,2 and photo-induced catalysis3 involving organic and inorganic
azides as well as azido complexes. Detailed photochemical studies of transition metal azido complexes revealed photo-induced
reductive eliminations4-8 with mechanisms reminiscent of photo-induced C-H bond activation reactions observed with transition metal
carbonyl complexes.9-14 These reactions were studied in inert matrices,15,16 in solution17-21 and in the gas phase.22 A primary step in the
photolysis of azido complexes may involve the initial elimination of N2 from an excited state and the formation of highly reactive
nitrenes, which is usually followed by the addition of electron-rich species in solution or rearrangement via insertion reactions.23 The
formation of nitrido complexes and the reductive elimination of the azidyl radical are alternative photochemical responses.7,24
Reactions involving azides can be monitored conveniently since the symmetric and asymmetric stretching vibrations of the linear N3
group, as(N3) and s(N3) give rise to intense absorption bands in the mid-IR spectral region. The spectral position of these bands is
sensitive to structural and electronic changes which makes time-resolved infrared (TRIR) spectroscopy a suitable technique to study
the nature and the photochemistry of the photogenerated excited states.26,27 Using transient absorbance (TA) and time-resolved
infrared (TRIR) spectroscopies, a variety of azides has been investigated,25 including, for example, mono- and bis(phosphine) diazido
platinum(II) complexes. In these experiments, a coordinatively unsaturated species, Pt(N3)(PPh3)2, was identified as highly reactive
intermediate. Investigations of the iridium complex Ir(Cp*)(N3)2(PPh3), Cp* = C5Me5, involved the continuous irradiation of benzene
solutions at exc = 313 nm,9 which produced Ir(Cp*)H(Ph)(PPh3) and Ir(Cp*)H{(ȝ-Ph)PPh2}(PPh3) in reductive elimination / C-H
insertion and orthometallation reactions. In halogenated solvents, however, the photo-reaction generates the chloro complex
Ir(Cp*)Cl2(PPh3) via N3 / Cl ligand exchange. In a related investigation near-ultraviolet radiation generates Ir(Cp*)(L) as a reactive
intermediate, which undergoes oxidative addition with solvent C-H and C-Cl bonds.5 The quantum yields for these reactions range
from 0.01 to 0.3. The lack of mechanistic insight on the ultrafast time scale motivated our investigation of late transition metal azido
complexes as part of a wider research programme into nitrogen-rich energetic compounds.28-30 This work describes the first pico-
second TRIR (ps-TRIR) spectroscopic study on these complexes using Rh(Cp*)(N3)2(PPh3) and Ir(Cp*)(N3)2(PPh3).
Results and Discussion
Spectroscopy
The complexes subject to this investigation, M(Cp*)(N3)2(PPh3), M = Rh (1), Ir (2), are shown in Scheme 1. The UV/vis absorption spectra
in MeCN (Fig. 1) feature two resolved bands at 393 nm and 269 nm (with the extinction coefficients 6.1103 and 2.0104 l mol1 cm1,
respectively) for complex 1, whilst the spectrum of complex 2 exhibits one band at 305 nm (3.7103 l mol1 cm1). The band positions of 1
are slightly solvent dependent with shifts of less than 300 to 500 cm1 (max [nm] = 397, 272, DMF; 398, 272, THF; 398, 273, CH2Cl2).
Journal Name ARTICLE
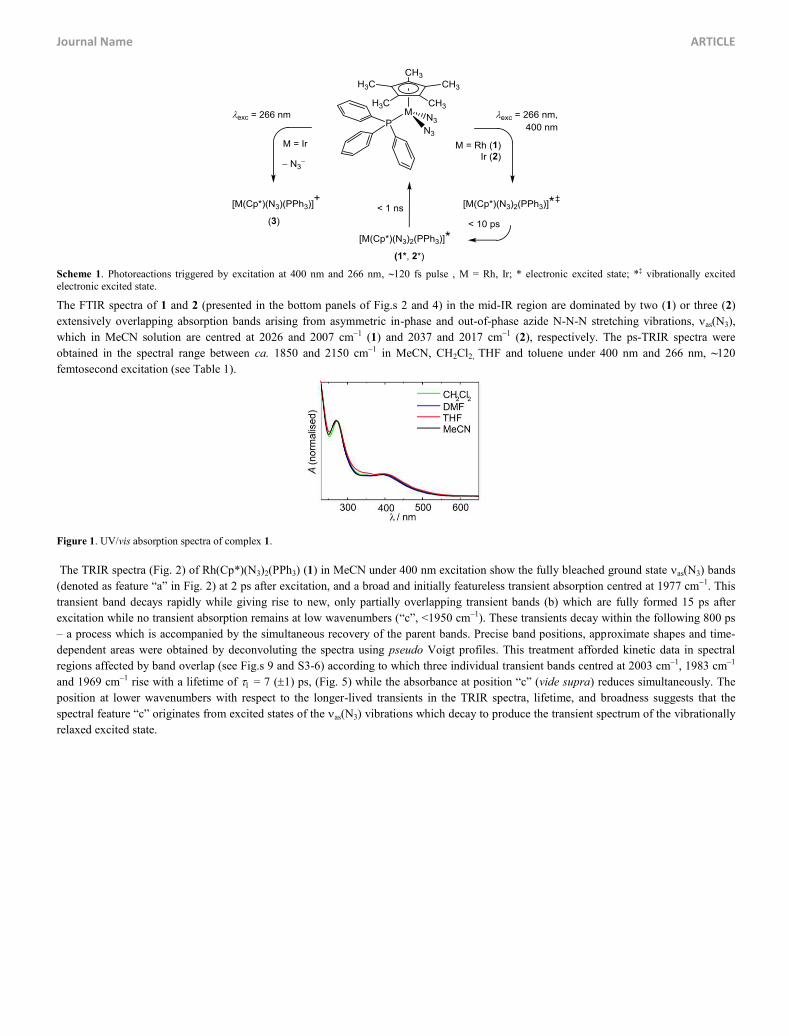
Scheme 1. Photoreactions triggered by excitation at 400 nm and 266 nm, ~120 fs pulse , M = Rh, Ir; * electronic excited state; *‡ vibrationally excited electronic excited state.
The FTIR spectra of 1 and 2 (presented in the bottom panels of Fig.s 2 and 4) in the mid-IR region are dominated by two (1) or three (2)
extensively overlapping absorption bands arising from asymmetric in-phase and out-of-phase azide N-N-N stretching vibrations, as(N3),
which in MeCN solution are centred at 2026 and 2007 cm1 (1) and 2037 and 2017 cm1 (2), respectively. The ps-TRIR spectra were
obtained in the spectral range between ca. 1850 and 2150 cm1 in MeCN, CH2Cl2, THF and toluene under 400 nm and 266 nm, ~120
femtosecond excitation (see Table 1).
Figure 1. UV/vis absorption spectra of complex 1.
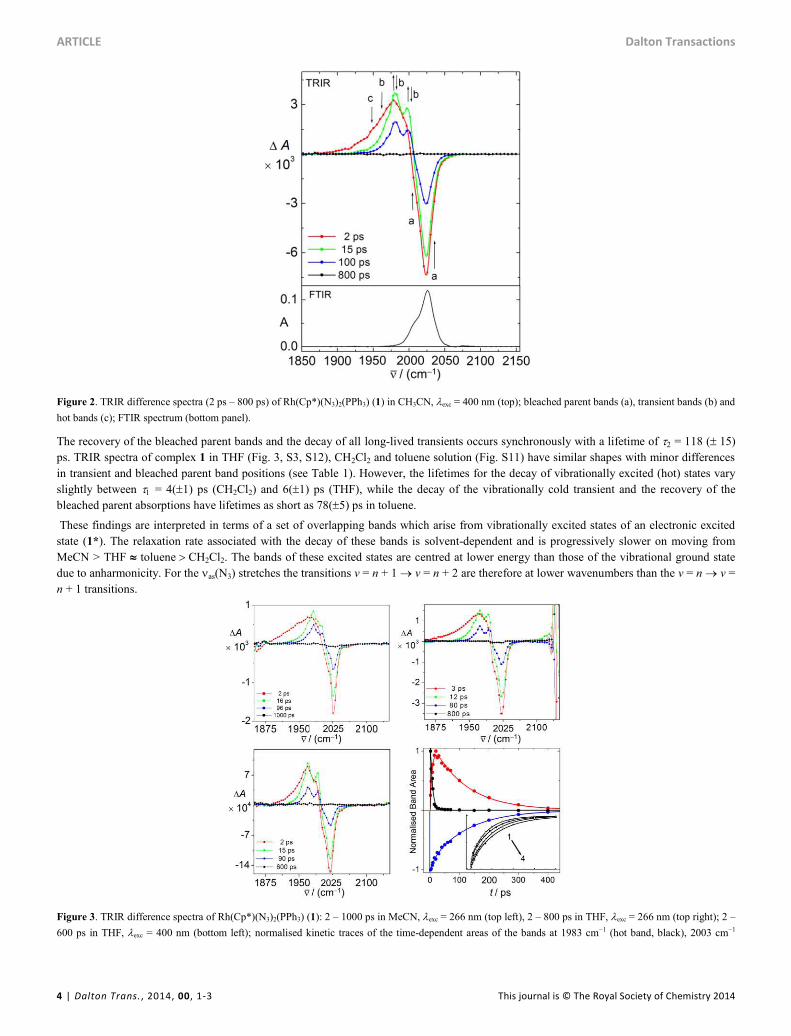
The TRIR spectra (Fig. 2) of Rh(Cp*)(N3)2(PPh3) (1) in MeCN under 400 nm excitation show the fully bleached ground state as(N3) bands
(denoted as feature “a” in Fig. 2) at 2 ps after excitation, and a broad and initially featureless transient absorption centred at 1977 cm1. This
transient band decays rapidly while giving rise to new, only partially overlapping transient bands (b) which are fully formed 15 ps after
excitation while no transient absorption remains at low wavenumbers (“c”, <1950 cm1). These transients decay within the following 800 ps
– a process which is accompanied by the simultaneous recovery of the parent bands. Precise band positions, approximate shapes and time-
dependent areas were obtained by deconvoluting the spectra using pseudo Voigt profiles. This treatment afforded kinetic data in spectral
regions affected by band overlap (see Fig.s 9 and S3-6) according to which three individual transient bands centred at 2003 cm1, 1983 cm1
and 1969 cm1 rise with a lifetime of = 7 (1) ps, (Fig. 5) while the absorbance at position “c” (vide supra) reduces simultaneously. The
position at lower wavenumbers with respect to the longer-lived transients in the TRIR spectra, lifetime, and broadness suggests that the
spectral feature “c” originates from excited states of the as(N3) vibrations which decay to produce the transient spectrum of the vibrationally
relaxed excited state.
ARTICLE Dalton Transactions
4 | Dalton Trans. , 2014, 00, 1-3 This journal is © The Royal Society of Chemistry 2014
Figure 2. TRIR difference spectra (2 ps – 800 ps) of Rh(Cp*)(N3)2(PPh3) (1) in CH3CN, exc = 400 nm (top); bleached parent bands (a), transient bands (b) and
hot bands (c); FTIR spectrum (bottom panel).
The recovery of the bleached parent bands and the decay of all long-lived transients occurs synchronously with a lifetime of = 118 (15)
ps. TRIR spectra of complex 1 in THF (Fig. 3, S3, S12), CH2Cl2 and toluene solution (Fig. S11) have similar shapes with minor differences
in transient and bleached parent band positions (see Table 1). However, the lifetimes for the decay of vibrationally excited (hot) states vary
slightly between = 4(1) ps (CH2Cl2) and 6(1) ps (THF), while the decay of the vibrationally cold transient and the recovery of the
bleached parent absorptions have lifetimes as short as 78(5) ps in toluene.
These findings are interpreted in terms of a set of overlapping bands which arise from vibrationally excited states of an electronic excited
state (1*). The relaxation rate associated with the decay of these bands is solvent-dependent and is progressively slower on moving from
MeCN > THF tolueneCH2Cl2. The bands of these excited states are centred at lower energy than those of the vibrational ground state
due to anharmonicity. For the as(N3) stretches the transitions v = n + 1 v = n + 2 are therefore at lower wavenumbers than the v = n v =
n + 1 transitions.
Figure 3. TRIR difference spectra of Rh(Cp*)(N3)2(PPh3) (1): 2 – 1000 ps in MeCN, exc = 266 nm (top left), 2 – 800 ps in THF, exc = 266 nm (top right); 2 –
600 ps in THF, exc = 400 nm (bottom left); normalised kinetic traces of the time-dependent areas of the bands at 1983 cm1 (hot band, black), 2003 cm1
Journal Name ARTICLE
(transient, red) and 2026 cm1 (parent, blue) in CH3CN, exc = 400 nm (bottom right; inset: traces of parent bleach recovery in toluene (1), THF (2) CH2Cl2 (3),
MeCN (4) and in the same time interval).
This assignment is supported by the recently observed anharmonicity in time-resolved 2DIR measurements on azido complexes38 as well as
results from picosecond TRIR for the CO stretching vibrations of short lived intermediates generated by femtosecond excitation of
Rh(Cp)(CO)2 where the hot bands have been found ca. 40 – 80 cm1 below in energy than the vibrationally cold transient bands.39,40 Ex-
citation of complex 1 at 400 nm in any of the studied solvents is reversible and the quantum yield for the generation of any reactive
intermediate is negligible (Fig. 3). While the excitation of complex 1 in MeCN and THF at higher photon energy (266 nm, see Fig. 3 top left
and top right) leads to similar spectral transient features, these are, however, extended much further to lower wavenumbers in the period up
to 10 ps after excitation. On the contrary, the TRIR spectra at late time delays, after the cooling process of the electronic excited states is
complete, are nearly identical for both excitation energies. This indicates that the excited state detected in TRIR experiments is formed
considerably hotter vibrationally if populated with a 266 nm pulse, which in principle could be expected. Importantly, close inspection of the
TRIR spectra of 1 (exc = 266 nm) reveals residual parent bleach bands which persist at late time indicating irreversible photochemical
transformations with estimated quantum yields of 0.033(18) and 0.006(5) in CH3CN and THF, respectively (Table 1). The nature of the
photoproduct could not be ascertained as the long lived transient bands were too weak.
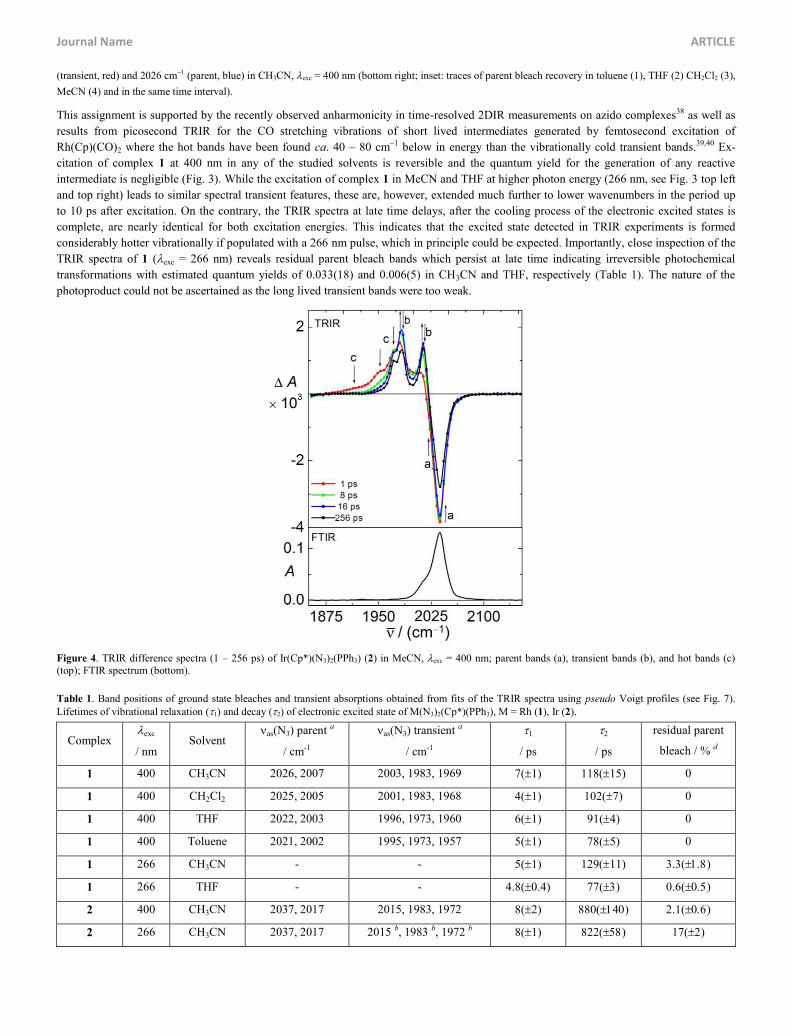
Figure 4. TRIR difference spectra (1 – 256 ps) of Ir(Cp*)(N3)2(PPh3) (2) in MeCN, exc = 400 nm; parent bands (a), transient bands (b), and hot bands (c) (top); FTIR spectrum (bottom).
Table 1. Band positions of ground state bleaches and transient absorptions obtained from fits of the TRIR spectra using pseudo Voigt profiles (see Fig. 7). Lifetimes of vibrational relaxation (1) and decay (2) of electronic excited state of M(N3)2(Cp*)(PPh3), M = Rh (1), Ir (2).
Complex exc
/ nmSolvent
as(N3) parent a
/ cm-1
as(N3) transient a
/ cm-1
1
/ ps
2
/ ps
residual parent
bleach / % d
1 400 CH3CN 2026, 2007 2003, 1983, 1969 7(1) 118(15) 0
1 400 CH2Cl2 2025, 2005 2001, 1983, 1968 4(1) 102(7) 0
1 400 THF 2022, 2003 1996, 1973, 1960 6(1) 91(4) 0
1 400 Toluene 2021, 2002 1995, 1973, 1957 5(1) 78(5) 0
1 266 CH3CN - - 5(1) 129(11) 3.3()
1 266 THF - - 4.8(0.4) 77() 0.6()
2 400 CH3CN 2037, 2017 2015, 1983, 1972 8(2) 880() 2.1()
2 266 CH3CN 2037, 2017 2015 b, 1983 b, 1972 b 8(1) 822() 17()
ARTICLE Dalton Transactions
6 | Dalton Trans. , 2014, 00, 1-3 This journal is © The Royal Society of Chemistry 2014
2030 c, 2006 c
a position of peak maximum, b electronic excited state,c permanent photoproduct, d (residual bleach) / (total bleach 2 ps after excitation) 100 %.
The transient spectra of the iridium complex Ir(Cp*)(N3)2(PPh3) (2) in MeCN solution (exc = 400 nm, Fig.s 4 and S14) are similar to those
of the Rh analog discussed above if the time delay 30 ps after excitation is considered. Intriguingly, two comparably broad bands are
discernible at low energy, centred at 1919 cm1 and 1954 cm1, which decay with lifetimes of 4(1) ps and 8(1) ps, respectively (Fig. 4,
Tab. 1). Spectral position and decay characteristics again match expectations for the vibrationally excited states of the electronic excited state
2* in which the spectral positions of the absorption bands possibly arise from the transitions v v +1 (v = 2, 1919 cm1; v = 1, 1954 cm1; v
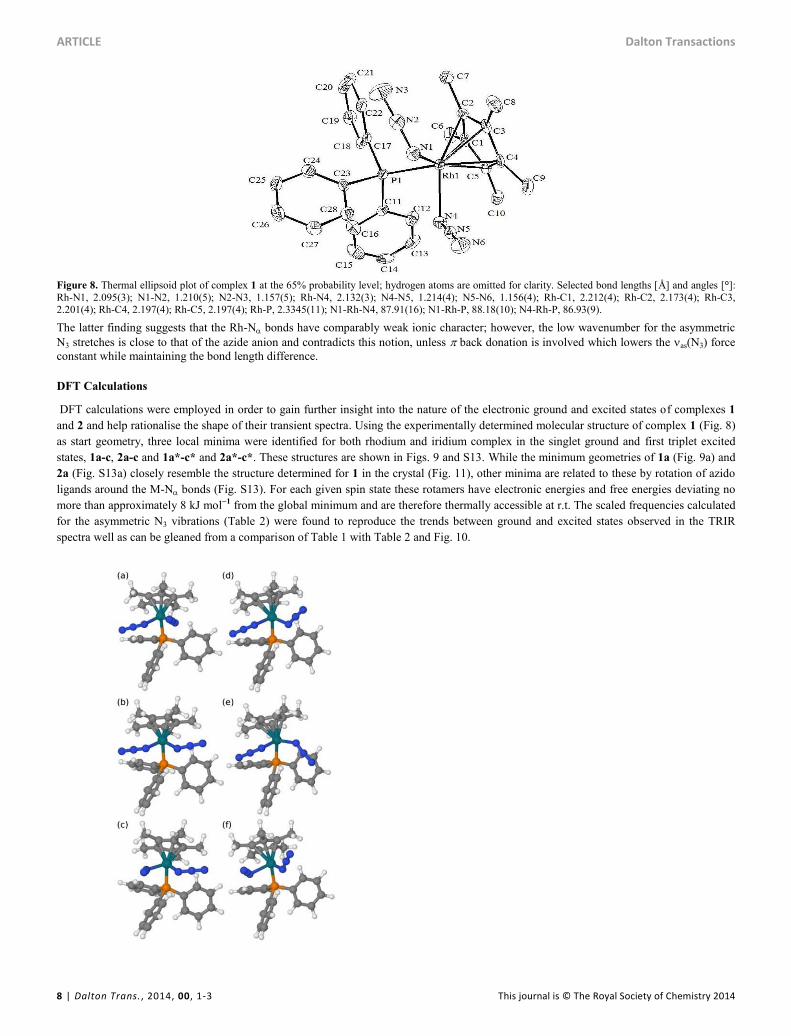
= 0, 1983 cm1). Fig. 7 shows pseudo Voigt fits revealing the precise position and shape of the overlapping bands (see experimental for
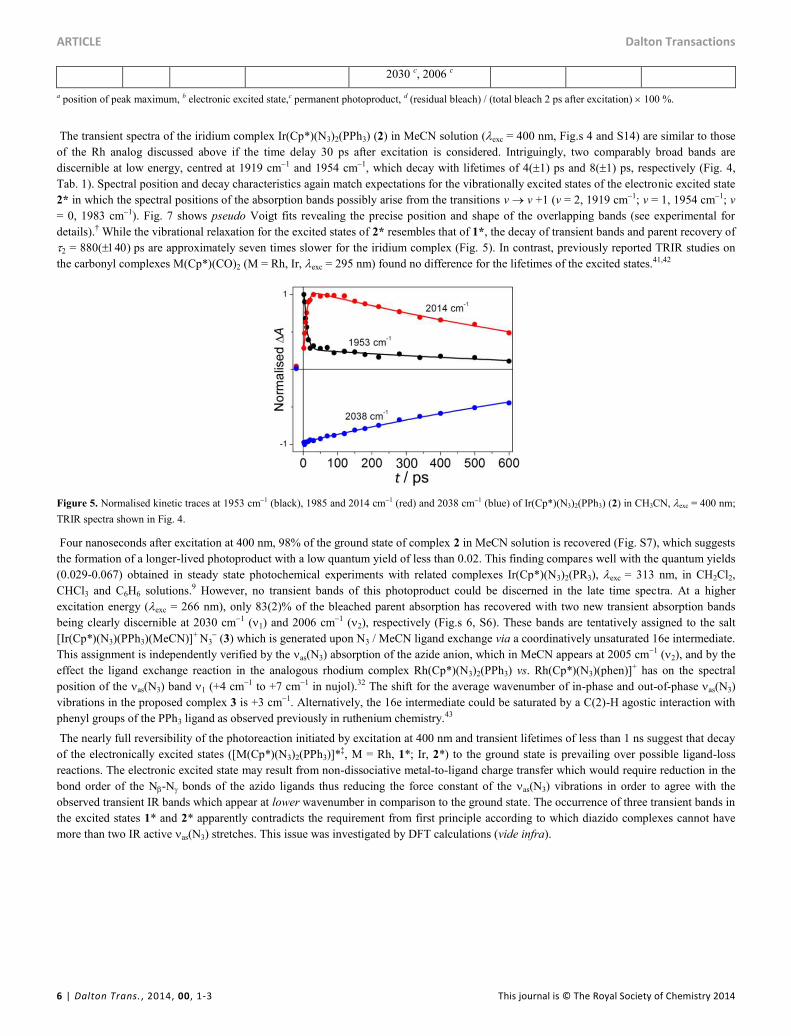
details).† While the vibrational relaxation for the excited states of 2* resembles that of 1*, the decay of transient bands and parent recovery of
2 = 880() ps are approximately seven times slower for the iridium complex (Fig. 5). In contrast, previously reported TRIR studies on
the carbonyl complexes M(Cp*)(CO)2 (M = Rh, Ir, exc = 295 nm) found no difference for the lifetimes of the excited states.41,42
Figure 5. Normalised kinetic traces at 1953 cm1 (black), 1985 and 2014 cm1 (red) and 2038 cm1 (blue) of Ir(Cp*)(N3)2(PPh3) (2) in CH3CN, exc = 400 nm;
TRIR spectra shown in Fig. 4.
Four nanoseconds after excitation at 400 nm, 98% of the ground state of complex 2 in MeCN solution is recovered (Fig. S7), which suggests
the formation of a longer-lived photoproduct with a low quantum yield of less than 0.02. This finding compares well with the quantum yields
(0.029-0.067) obtained in steady state photochemical experiments with related complexes Ir(Cp*)(N3)2(PR3), exc = 313 nm, in CH2Cl2,
CHCl3 and C6H6 solutions.9 However, no transient bands of this photoproduct could be discerned in the late time spectra. At a higher
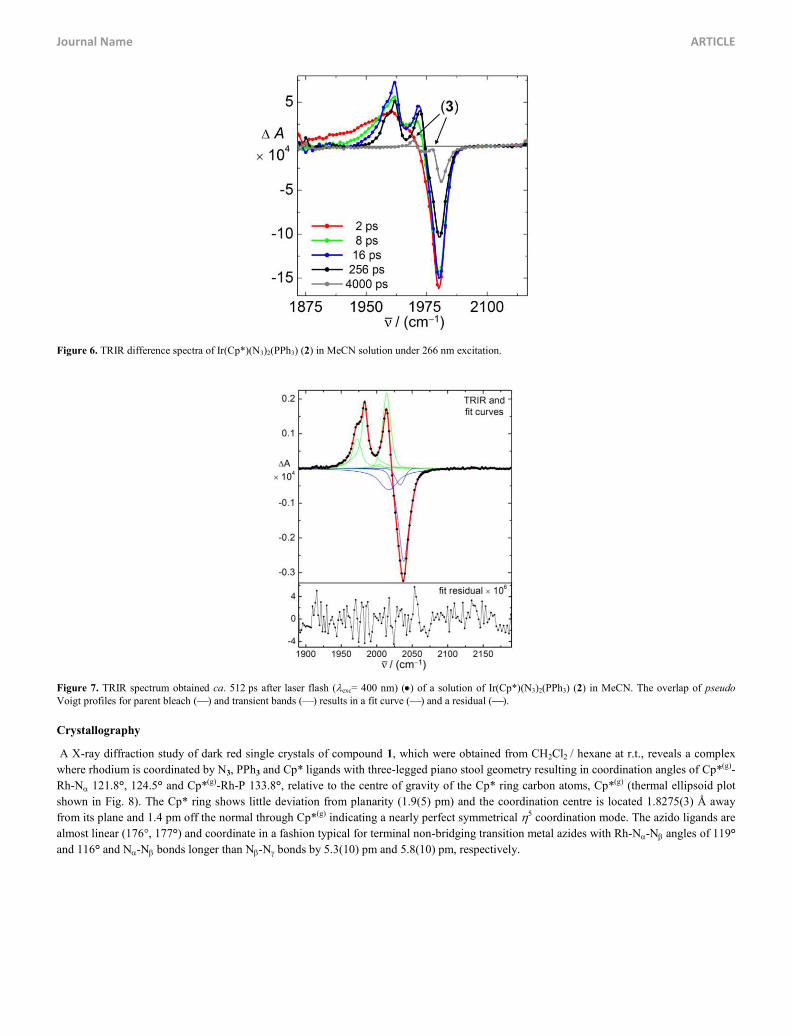
excitation energy (exc = 266 nm), only 83(2)% of the bleached parent absorption has recovered with two new transient absorption bands
being clearly discernible at 2030 cm1 (1) and 2006 cm1 (2), respectively (Fig.s 6, S6). These bands are tentatively assigned to the salt
[Ir(Cp*)(N3)(PPh3)(MeCN)]+ N3 (3) which is generated upon N3 / MeCN ligand exchange via a coordinatively unsaturated 16e intermediate.
This assignment is independently verified by the as(N3) absorption of the azide anion, which in MeCN appears at 2005 cm1 (2), and by the
effect the ligand exchange reaction in the analogous rhodium complex Rh(Cp*)(N3)2(PPh3) vs. Rh(Cp*)(N3)(phen)]+ has on the spectral
position of the as(N3) band 1 (+4 cm1 to +7 cm1 in nujol).32 The shift for the average wavenumber of in-phase and out-of-phase as(N3)
vibrations in the proposed complex 3 is +3 cm1. Alternatively, the 16e intermediate could be saturated by a C(2)-H agostic interaction with
phenyl groups of the PPh3 ligand as observed previously in ruthenium chemistry.43
The nearly full reversibility of the photoreaction initiated by excitation at 400 nm and transient lifetimes of less than 1 ns suggest that decay
of the electronically excited states ([M(Cp*)(N3)2(PPh3)]*‡, M = Rh, 1*; Ir, 2*) to the ground state is prevailing over possible ligand-loss
reactions. The electronic excited state may result from non-dissociative metal-to-ligand charge transfer which would require reduction in the
bond order of the N-N bonds of the azido ligands thus reducing the force constant of the as(N3) vibrations in order to agree with the
observed transient IR bands which appear at lower wavenumber in comparison to the ground state. The occurrence of three transient bands in
the excited states 1* and 2* apparently contradicts the requirement from first principle according to which diazido complexes cannot have
more than two IR active as(N3) stretches. This issue was investigated by DFT calculations (vide infra).
Journal Name ARTICLE
Figure 6. TRIR difference spectra of Ir(Cp*)(N3)2(PPh3) (2) in MeCN solution under 266 nm excitation.
Figure 7. TRIR spectrum obtained ca. 512 ps after laser flash (exc= 400 nm) () of a solution of Ir(Cp*)(N3)2(PPh3) (2) in MeCN. The overlap of pseudo Voigt profiles for parent bleach () and transient bands () results in a fit curve () and a residual ().
Crystallography
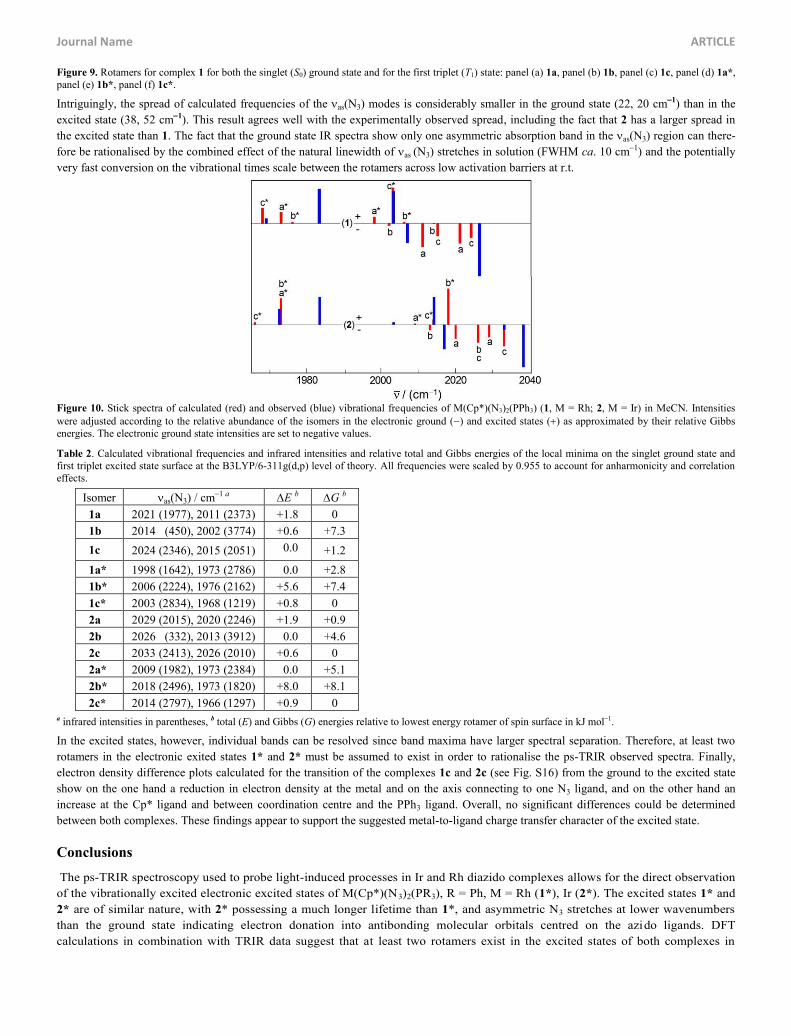
A X-ray diffraction study of dark red single crystals of compound 1, which were obtained from CH2Cl2 / hexane at r.t., reveals a complex
where rhodium is coordinated by N3, PPh3 and Cp* ligands with three-legged piano stool geometry resulting in coordination angles of Cp*(g)-
Rh-N 121.8°, 124.5° and Cp*(g)-Rh-P 133.8°, relative to the centre of gravity of the Cp* ring carbon atoms, Cp*(g) (thermal ellipsoid plot
shown in Fig. 8). The Cp* ring shows little deviation from planarity (1.9(5) pm) and the coordination centre is located 1.8275(3) Å away
from its plane and 1.4 pm off the normal through Cp*(g) indicating a nearly perfect symmetrical 5 coordination mode. The azido ligands are
almost linear (176°, 177°) and coordinate in a fashion typical for terminal non-bridging transition metal azides with Rh-N-N angles of 119°
and 116° and N-N bonds longer than N-N bonds by 5.3(10) pm and 5.8(10) pm, respectively.
ARTICLE Dalton Transactions
8 | Dalton Trans. , 2014, 00, 1-3 This journal is © The Royal Society of Chemistry 2014
Figure 8. Thermal ellipsoid plot of complex 1 at the 65% probability level; hydrogen atoms are omitted for clarity. Selected bond lengths [Å] and angles [°]: Rh-N1, 2.095(3); N1-N2, 1.210(5); N2-N3, 1.157(5); Rh-N4, 2.132(3); N4-N5, 1.214(4); N5-N6, 1.156(4); Rh-C1, 2.212(4); Rh-C2, 2.173(4); Rh-C3, 2.201(4); Rh-C4, 2.197(4); Rh-C5, 2.197(4); Rh-P, 2.3345(11); N1-Rh-N4, 87.91(16); N1-Rh-P, 88.18(10); N4-Rh-P, 86.93(9).
The latter finding suggests that the Rh-N bonds have comparably weak ionic character; however, the low wavenumber for the asymmetric N3 stretches is close to that of the azide anion and contradicts this notion, unless back donation is involved which lowers the as(N3) force constant while maintaining the bond length difference.
DFT Calculations
DFT calculations were employed in order to gain further insight into the nature of the electronic ground and excited states of complexes 1
and 2 and help rationalise the shape of their transient spectra. Using the experimentally determined molecular structure of complex 1 (Fig. 8)
as start geometry, three local minima were identified for both rhodium and iridium complex in the singlet ground and first triplet excited
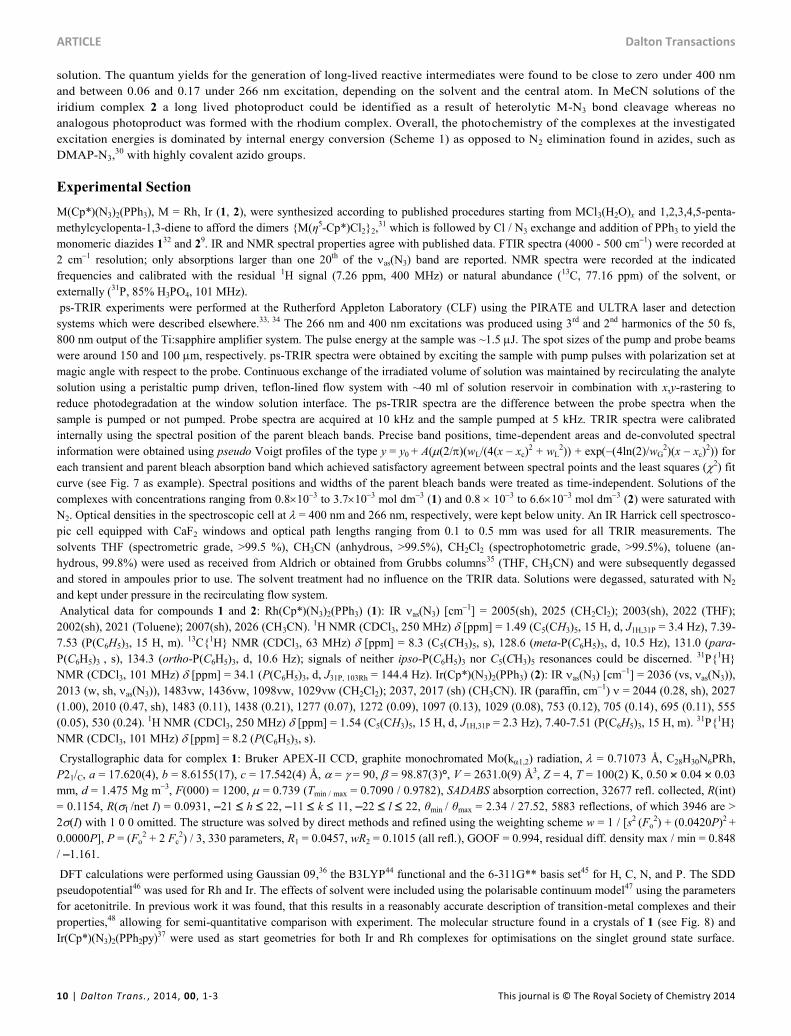
states, 1a-c, 2a-c and 1a*-c* and 2a*-c*. These structures are shown in Figs. 9 and S13. While the minimum geometries of 1a (Fig. 9a) and
2a (Fig. S13a) closely resemble the structure determined for 1 in the crystal (Fig. 11), other minima are related to these by rotation of azido
ligands around the M-N bonds (Fig. S13). For each given spin state these rotamers have electronic energies and free energies deviating no
more than approximately 8 kJ mol1 from the global minimum and are therefore thermally accessible at r.t. The scaled frequencies calculated
for the asymmetric N3 vibrations (Table 2) were found to reproduce the trends between ground and excited states observed in the TRIR
spectra well as can be gleaned from a comparison of Table 1 with Table 2 and Fig. 10.
Journal Name ARTICLE
Figure 9. Rotamers for complex 1 for both the singlet (S0) ground state and for the first triplet (T1) state: panel (a) 1a, panel (b) 1b, panel (c) 1c, panel (d) 1a*, panel (e) 1b*, panel (f) 1c*.
Intriguingly, the spread of calculated frequencies of the as(N3) modes is considerably smaller in the ground state (22, 20 cm1) than in the
excited state (38, 52 cm1). This result agrees well with the experimentally observed spread, including the fact that 2 has a larger spread in
the excited state than 1. The fact that the ground state IR spectra show only one asymmetric absorption band in the as(N3) region can there-
fore be rationalised by the combined effect of the natural linewidth of as (N3) stretches in solution (FWHM ca. 10 cm1) and the potentially
very fast conversion on the vibrational times scale between the rotamers across low activation barriers at r.t.
Figure 10. Stick spectra of calculated (red) and observed (blue) vibrational frequencies of M(Cp*)(N3)2(PPh3) (1, M = Rh; 2, M = Ir) in MeCN. Intensities were adjusted according to the relative abundance of the isomers in the electronic ground () and excited states () as approximated by their relative Gibbs energies. The electronic ground state intensities are set to negative values.
Table 2. Calculated vibrational frequencies and infrared intensities and relative total and Gibbs energies of the local minima on the singlet ground state and first triplet excited state surface at the B3LYP/6-311g(d,p) level of theory. All frequencies were scaled by 0.955 to account for anharmonicity and correlation effects.
Isomer as(N3) / cm1 a E b G b
1a 2021 (1977), 2011 (2373) +1.8 0
1b 2014 (450), 2002 (3774) +0.6 +7.3
1c 2024 (2346), 2015 (2051) 0.0 +1.2
1a* 1998 (1642), 1973 (2786) 0.0 +2.8
1b* 2006 (2224), 1976 (2162) +5.6 +7.4
1c* 2003 (2834), 1968 (1219) +0.8 0
2a 2029 (2015), 2020 (2246) +1.9 +0.9
2b 2026 (332), 2013 (3912) 0.0 +4.6
2c 2033 (2413), 2026 (2010) +0.6 0
2a* 2009 (1982), 1973 (2384) 0.0 +5.1
2b* 2018 (2496), 1973 (1820) +8.0 +8.1
2c* 2014 (2797), 1966 (1297) +0.9 0 a infrared intensities in parentheses, b total (E) and Gibbs (G) energies relative to lowest energy rotamer of spin surface in kJ mol1.
In the excited states, however, individual bands can be resolved since band maxima have larger spectral separation. Therefore, at least two
rotamers in the electronic exited states 1* and 2* must be assumed to exist in order to rationalise the ps-TRIR observed spectra. Finally,
electron density difference plots calculated for the transition of the complexes 1c and 2c (see Fig. S16) from the ground to the excited state
show on the one hand a reduction in electron density at the metal and on the axis connecting to one N3 ligand, and on the other hand an
increase at the Cp* ligand and between coordination centre and the PPh3 ligand. Overall, no significant differences could be determined
between both complexes. These findings appear to support the suggested metal-to-ligand charge transfer character of the excited state.
Conclusions
The ps-TRIR spectroscopy used to probe light-induced processes in Ir and Rh diazido complexes allows for the direct observation
of the vibrationally excited electronic excited states of M(Cp*)(N3)2(PR3), R = Ph, M = Rh (1*), Ir (2*). The excited states 1* and
2* are of similar nature, with 2* possessing a much longer lifetime than 1*, and asymmetric N3 stretches at lower wavenumbers
than the ground state indicating electron donation into antibonding molecular orbitals centred on the azido ligands. DFT
calculations in combination with TRIR data suggest that at least two rotamers exist in the excited states of both complexes in
ARTICLE Dalton Transactions
10 | Dalton Trans. , 2014, 00, 1-3 This journal is © The Royal Society of Chemistry 2014
solution. The quantum yields for the generation of long-lived reactive intermediates were found to be close to zero under 400 nm
and between 0.06 and 0.17 under 266 nm excitation, depending on the solvent and the central atom. In MeCN solutions of the
iridium complex 2 a long lived photoproduct could be identified as a result of heterolytic M-N3 bond cleavage whereas no
analogous photoproduct was formed with the rhodium complex. Overall, the photochemistry of the complexes at the investigated
excitation energies is dominated by internal energy conversion (Scheme 1) as opposed to N2 elimination found in azides, such as
DMAP-N3,30 with highly covalent azido groups.
Experimental Section
M(Cp*)(N3)2(PPh3), M = Rh, Ir (1, 2), were synthesized according to published procedures starting from MCl3(H2O)x and 1,2,3,4,5-penta-
methylcyclopenta-1,3-diene to afford the dimers {M(Ș5-Cp*)Cl2}2,31 which is followed by Cl / N3 exchange and addition of PPh3 to yield the
monomeric diazides 132 and 29. IR and NMR spectral properties agree with published data. FTIR spectra (4000 - 500 cm1) were recorded at
2 cm1 resolution; only absorptions larger than one 20th of the as(N3) band are reported. NMR spectra were recorded at the indicated
frequencies and calibrated with the residual 1H signal (7.26 ppm, 400 MHz) or natural abundance (13C, 77.16 ppm) of the solvent, or
externally (31P, 85% H3PO4, 101 MHz).
ps-TRIR experiments were performed at the Rutherford Appleton Laboratory (CLF) using the PIRATE and ULTRA laser and detection
systems which were described elsewhere.33, 34 The 266 nm and 400 nm excitations was produced using 3rd and 2nd harmonics of the 50 fs,
800 nm output of the Ti:sapphire amplifier system. The pulse energy at the sample was ~1.5 J. The spot sizes of the pump and probe beams
were around 150 and 100 m, respectively. ps-TRIR spectra were obtained by exciting the sample with pump pulses with polarization set at
magic angle with respect to the probe. Continuous exchange of the irradiated volume of solution was maintained by recirculating the analyte
solution using a peristaltic pump driven, teflon-lined flow system with ~40 ml of solution reservoir in combination with x,y-rastering to
reduce photodegradation at the window solution interface. The ps-TRIR spectra are the difference between the probe spectra when the
sample is pumped or not pumped. Probe spectra are acquired at 10 kHz and the sample pumped at 5 kHz. TRIR spectra were calibrated
internally using the spectral position of the parent bleach bands. Precise band positions, time-dependent areas and de-convoluted spectral
information were obtained using pseudo Voigt profiles of the type y= y0 + A((2/)(wL/(4(x xc)2 + wL
2)) + exp4ln(2)/wG2)(x xc)
2)) for
each transient and parent bleach absorption band which achieved satisfactory agreement between spectral points and the least squares (2) fit
curve (see Fig. 7 as example). Spectral positions and widths of the parent bleach bands were treated as time-independent. Solutions of the
complexes with concentrations ranging from 0.8103 to 3.7103 mol dm3 (1) and 0.8 103 to 6.6103 mol dm3 (2) were saturated with
N2. Optical densities in the spectroscopic cell at = 400 nm and 266 nm, respectively, were kept below unity. An IR Harrick cell spectrosco-
pic cell equipped with CaF2 windows and optical path lengths ranging from 0.1 to 0.5 mm was used for all TRIR measurements. The
solvents THF (spectrometric grade, >99.5 %), CH3CN (anhydrous, >99.5%), CH2Cl2 (spectrophotometric grade, >99.5%), toluene (an-
hydrous, 99.8%) were used as received from Aldrich or obtained from Grubbs columns35 (THF, CH3CN) and were subsequently degassed
and stored in ampoules prior to use. The solvent treatment had no influence on the TRIR data. Solutions were degassed, saturated with N2
and kept under pressure in the recirculating flow system.
Analytical data for compounds 1 and 2: Rh(Cp*)(N3)2(PPh3) (1): IR as(N3) [cm1] = 2005(sh), 2025 (CH2Cl2); 2003(sh), 2022 (THF);
2002(sh), 2021 (Toluene); 2007(sh), 2026 (CH3CN). 1H NMR (CDCl3, 250 MHz) [ppm] = 1.49 (C5(CH3)5, 15 H, d, J1H,31P = 3.4 Hz), 7.39-
7.53 (P(C6H5)3, 15 H, m). 13C{1H} NMR (CDCl3, 63 MHz) [ppm] = 8.3 (C5(CH3)5, s), 128.6 (meta-P(C6H5)3, d, 10.5 Hz), 131.0 (para-
P(C6H5)3 , s), 134.3 (ortho-P(C6H5)3, d, 10.6 Hz); signals of neither ipso-P(C6H5)3 nor C5(CH3)5 resonances could be discerned. 31P{1H}
NMR (CDCl3, 101 MHz) [ppm] = 34.1 (P(C6H5)3, d, J31P, 103Rh = 144.4 Hz). Ir(Cp*)(N3)2(PPh3) (2): IR as(N3) [cm1] = 2036 (vs,as(N3)),
2013 (w, sh, as(N3)), 1483vw, 1436vw, 1098vw, 1029vw (CH2Cl2); 2037, 2017 (sh) (CH3CN). IR (paraffin, cm1) = 2044 (0.28, sh), 2027
(1.00), 2010 (0.47, sh), 1483 (0.11), 1438 (0.21), 1277 (0.07), 1272 (0.09), 1097 (0.13), 1029 (0.08), 753 (0.12), 705 (0.14), 695 (0.11), 555
(0.05), 530 (0.24). 1H NMR (CDCl3, 250 MHz) [ppm] = 1.54 (C5(CH3)5, 15 H, d, J1H,31P = 2.3 Hz), 7.40-7.51 (P(C6H5)3, 15 H, m). 31P{1H}
NMR (CDCl3, 101 MHz) [ppm] = 8.2 (P(C6H5)3, s).
Crystallographic data for complex 1: Bruker APEX-II CCD, graphite monochromated Mo(k1,2) radiation, = 0.71073 Å, C28H30N6PRh,
P21/C, a = 17.620(4), b = 8.6155(17), c = 17.542(4) Å, = = 90, = 98.87(3)°, V = 2631.0(9) Å3, Z = 4, T = 100(2) K, 0.50 0.04 0.03
mm, d = 1.475 Mg m3, F(000) = 1200, = 0.739 (Tmin / max = 0.7090 / 0.9782), SADABS absorption correction, 32677 refl. collected, R(int)
= 0.1154, R(I /net I) = 0.0931, 21 h 22, 11 k 11, 22 l 22, șmin / șmax = 2.34 / 27.52, 5883 reflections, of which 3946 are >
2(I) with 1 0 0 omitted. The structure was solved by direct methods and refined using the weighting scheme w = 1 / [s2 (Fo2) + (0.0420P)2 +
0.0000P], P = (Fo2 + 2 Fc
2) / 3, 330 parameters, R1 = 0.0457, wR2 = 0.1015 (all refl.), GOOF = 0.994, residual diff. density max / min = 0.848
/ 1.161.
DFT calculations were performed using Gaussian 09,36 the B3LYP44 functional and the 6-311G** basis set45 for H, C, N, and P. The SDD
pseudopotential46 was used for Rh and Ir. The effects of solvent were included using the polarisable continuum model47 using the parameters
for acetonitrile. In previous work it was found, that this results in a reasonably accurate description of transition-metal complexes and their
properties,48 allowing for semi-quantitative comparison with experiment. The molecular structure found in a crystals of 1 (see Fig. 8) and
Ir(Cp*)(N3)2(PPh2py)37 were used as start geometries for both Ir and Rh complexes for optimisations on the singlet ground state surface.
Journal Name ARTICLE
These optimised structures served as start geometries for the triplet states. Two more conformers were identified on the triplet surface by
adjusting the P-M-N-N dihedral angles of both azido ligands and were, in turn, used as start structures on the singlet ground state surfaces.
For all optimized geometries frequencies were calculated in the harmonic approximation to allow the determination of free energies. No
imaginary frequencies were found, confirming that the structures reported on are true minima. A scaling factor of 0.955 was used to compare
calculated and experimental frequencies. This factor takes account of anharmonicity and correlation effects not included in our calculation.49
Acknowledgements
The authors acknowledge support by EPSRC (fellowship EP / E054978/1 (PP), E-Futures doctoral training centre at the University of
Sheffield (BFC)) and STFC through programmatic access “Real-time Structural Dynamics of Molecular Systems for Energy Generation and
Storage” (PP, J. A. Weinstein, MT) to the ULTRA facility. I. P. Clark, B. Coles, G. Greetham, I. Sazanovich, J. Best and M. Davis are
thanked for their assistance in performing TRIR experiments, R. Campbell and H. Adams for the X-ray analysis, and T. Kane and A. W.
Parker for discussions.
Notes and references
a Department of Chemistry, University of Sheffield, Brook Hill, Sheffield, S3 7HF, UK. Email: [email protected]; Fax: +44 (0)114-22-29346;
Tel: +44 (0)114-22-29385. b Central Laser Facility (CLF), STFC Rutherford Appleton Laboratory, Harwell Science and Innovation Campus, Didcot, Oxfordshire, OX11 0QX,
UK.
† The wavenumbers found for the vibrationally excited as(N3) stretches could be predicted by applying a simplified anharmonic oscillator model:
G(v+1) – G(v) = e – exe(2v + 2), e = 2000 cm1, exe = 16 cm1.
Electronic Supplementary Information (ESI) available containing additional kinetic data on 1 and 2 in MeCN, CH2Cl2, THF and toluene under 266 and
400 nm excitation, TRIR spectra at high and low resolution including pseudo Voigt fit profiles, ground state FTIR and UV/vis absorption spectra,
crystallographic information file as well as coordinates for the different rotamers in XYZ format, see DOI: 10.1039/b000000x/. CCDC
1013155 contains the supplementary crystallographic data for this paper. These data can be obtained free of charge from The Cambridge Crystallo-
graphic Data Centre via www.ccdc.cam.ac.uk/data_request/cif.
1. P. C. Samartzis and A. M. Wodtke, Phys. Chem. Chem. Phys., 2007, 9, 3054.
2. J. Sima, Coord. Chem. Rev., 2006, 250, 2325-2334.
3. W. P. Fehlhammer and W. Beck, Z. Anorg. Allg. Chem., 2013, 639, 1053.
4. L. Ronconi and P. J. Sadler, Chem. Commun., 2008, 235.
5. Y.-F. Song, J. F. Berry, E. Bill, E. Bothe, T. Weyhermüller and K. Wieghardt, Inorg. Chem., 2007, 46, 2208.
6. H. Hennig, R. Stich, H. Knoll, D. Rehorek and D. J. Stufkens, Coord. Chem. Rev., 1991, 111, 131.
7. A. Vogler, C. Quett and H. Kunkely, Ber. Bunsen Ges. Phys. Chem., 1988, 92, 1486.
8. J. L. Manson, W. E. Buschmann and J. S. Miller, Inorg. Chem., 2001, 40, 1926.
9. D. A. Freedman and K. R. Mann, Inorg. Chem., 1991, 30, 836.
10. G. A. Ozin and J. G. McCaffrey, J. Am. Chem. Soc., 1982, 104, 7351.
11. A. Vogler and J. Hlavatsch, Angew. Chem. Int. Ed., 1983, 22, 154.
12. R. S. Paonessa, A. L. Prignano and W. C. Trogler, Organometallics, 1985, 4, 647.
13. D. M. Blake and C. J. Nyman, J. Am. Chem. Soc., 1970, 92, 5359.
14. A. F. Vaudo, E. R. Kantrowitz, M. Z. Hoffman, E. Papaconstantinou and J. F. Endicott, J. Am. Chem. Soc., 1972, 94, 6655.
ARTICLE Dalton Transactions
12 | Dalton Trans. , 2014, 00, 1-3 This journal is © The Royal Society of Chemistry 2014
15. D. M. Haddleton, J. Organomet. Chem., 1986, 311, C21.
16. D. M. Haddleton and R. N. Perutz, Chem. Commun., 1985, 1372.
17. M. W. George, M. B. Hall, O. S. Jina, P. Portius, X.-Z. Sun, M. Towrie, H. Wu, X. Yang and S. D. Zaric, Proc. Natl. Acad. Sci. U.S.A., 2010, 107, 20178.
18. A. J. Blake, M. W. George, M. B. Hall, J. McMaster, P. Portius, X. Z. Sun, M. Towrie, C. E. Webster, C. Wilson and S. D. Zaric, Organometallics, 2008, 27, 189.
19. M. C. Asplund, P. T. Snee, J. S. Yeston, M. J. Wilkens, C. K. Payne, H. Yang, K. T. Kotz, H. Frei, R. G. Bergman and C. B. Harris, J. Am. Chem.
Soc., 2002, 124, 10605.
20. S. E. Bromberg, H. Yang, M. C. Asplund, T. Lian, B. K. McNamara, K. T. Kotz, J. S. Yeston, M. Wilkens, H. Frei, R. G. Bergman and C. B. Harris, Science, 1997, 278, 260.
21. B. H. Weiller, E. P. Wasserman, R. G. Bergman, C. B. Moore and G. C. Pimentel, J. Am. Chem. Soc., 1989, 111, 8288.
22. E. P. Wasserman, C. B. Moore and R. G. Bergman, Science, 1992, 255, 315.
23. A. L. Poznyak and V. I. Pavlovski, Angew. Chem. Int. Ed., 1988, 27, 789.
24. A. Vogler, C. Quett, A. Paukner and H. Kunkely, J. Am. Chem. Soc., 1986, 108, 8263.
25. H. Hennig, K. Ritter, A. K. Chibisov, H. Görner, F.-W. Grevels, K. Kerpen and K. Schaffner, Inorg. Chim. Acta, 1998, 271, 160.
26. K. McFarlane, B. Lee, J. Bridgewater and P. C. Ford, J. Organomet. Chem., 1998, 554, 49.
27. M. W. George and P. Portius, Comprehensive Organometallic Chemistry III, Elsevier: Oxford 2007, ed. R. H. Crabtree and D. M. P. Mingos, pp. 263-277.
28. P. Portius, A. C. Filippou, G. Schnakenburg, M. Davis and K.-D. Wehrstedt, Angew. Chem. Int. Ed., 2010, 49, 8013.
29. P. Portius, J. A. Weinstein, M. Davis and I. V. Sazanovich, CCLRC Central Laser Facility, Rutherford Appleton Laboratory Annual Report, Lasers
for Science Facility Programme - Chemistry, 2009-2010.
30. P. Portius, M. Davis, R. Campbell, F. Hartl, Q. Zeng, A. J. H. M. Meijer and M. Towrie, J. Phys. Chem. A, 2013, 117, 12759.
31. C. White, A. Yates, P. M. Maitlis and D. M. Heinekey, Inorg. Synth., 1992, 29, 228.
32. W. Rigby, P. M. Bailey, J. A. McCleverty and P. M. Maitlis, J. Chem. Soc., Dalton Trans., 1979, 371.
33. M. Towrie, D. C. Grills, J. Dyer, J. A. Weinstein, P. Matousek, R. Barton, P. D. Bailey, N. Subramaniam, W. M. Kwok, C. Ma, D. Phillips, A. W. Parker and M. W. George, Appl. Spectrosc., 2003, 57, 367.
34. G. Greetham, P. Burgos, Q. A. Cao, I. P. Clark, P. S. Codd, R. C. Farrow, M. W. George, M. Kogimtzis, P. Matousek, A. W. Parker, M. R. Pollard, D. A. Robinson, Z.-J. Xin and M. Towrie, Appl. Spectrosc., 2010, 64, 1311.
35. A. B. Pangborn, M. A. Giardello, R. H. Grubbs, R. K. Rosen and F. J. Timmers, Organometallics, 1996, 15, 1518.
36. M. J. Frisch, G. W. Trucks, H. B. Schlegel, G. E. Scuseria, M. A. Robb, J. R. Cheeseman, J. A. Montgomery, J. T. Vreven, K. N. Kudin, J. C. Burant, J. M. Millam, S. S. Iyengar, J. Tomasi, V. Barone, B. Mennucci, M. Cossi, G. Scalmani, N. Rega, G. A. Petersson, H. Nakatsuji, M. Hada, M. Ehara, K. Toyota, R. Fukuda, J. Hasegawa, M. Ishida, T. Nakajima, Y. Honda, O. Kitao, H. Nakai, M. Klene, X. Li, J. E. Knox, H. P. Hratchian, J. B. Cross, V. Bakken, C. Adamo, J. Jaramillo, R. Gomperts, R. E. Stratmann, O. Yazyev, A. J. Austin, R. Cammi, C. Pomelli, J. W. Ochterski, P. Y. Ayala, K. Morokuma, G. A. Voth, P. Salvador, J. J. Dannenberg, V. G. Zakrzewski, S. Dapprich, A. D. Daniels, M. C. Strain, O. Farkas, D. K. Malick, A. D. Rabuck, K. Raghavachari, J. B. Foresman, J. V. Ortiz, Q. Cui, A. G. Baboul, S. Clifford, J. Cioslowski, B. B. Stefanov, G. Liu, A. Liashenko, P. Piskorz, I. Komaromi, R. L. Martin, D. J. Fox, T. Keith, M. A. Al-Laham, C. Y. Peng, A. Nanayakkara, M. Challacombe, P. M. W. Gill, B. Johnson, W. Chen, M. W. Wong, C. Gonzalez and J. A. Pople, Gaussian Inc. Wallingford, CT, 2009, Gaussian03.
37. T. Suzuki, M. Kotera, A. Takayama and M. Kojima, Polyhedron, 2009, 28, 2287.
Journal Name ARTICLE
38. P. Portius and M. Towrie, unpublished results, 2012.
39. P. T. Snee, C. K. Payne, K. T. Kotz, H. Yang and C. B. Harris, J. Am. Chem. Soc., 2001, 123, 2255.
40. J. B. Asbury, H. N. Ghosh, J. S. Yeston, R. G. Bergman and T. Lian, Organometallics, 1998, 17, 3417.
41. S. E. Bromberg, T. Lian, R. G. Bergman and C. B. Harris, J. Am. Chem. Soc., 1996, 118, 2069.
42. T. P. Dougherty, W. T. Grubbs and E. J. Heilweil, J. Phys. Chem., 1994, 98, 9396.
43. S. J. L. Placa and J. A. Ibers, Inorg. Chem., 1965, 4, 778.
44. A. D. Becke, J. Chem. Phys., 1993, 98, 5648.
45. A. D. McLean and G. S. Chandler, J. Chem. Phys., 1980, 72, 5639; R. Krishnan, J. S. Binkley, R. Seeger and J. A. Pople, ibid. 650.
46. X. Y. Cao and M. Dolg, J. Chem. Phys., 2001, 115, 7348; A. Nicklass, M. Dolg, H. Stoll and H. Preuss, ibid., 1995, 102, 8942.
47. B. Mennucci and J. Tomassi, J. Chem. Phys., 1997, 106, 5151; M. Cossi, V. Barone, B. Menucci and J. Tomassi, Chem. Phys. Lett., 1998, 286, 253, and references therein.
48. J. Best, I. V. Sazanovich, H. Adams, R. D. Bennett, E. S. Davies, A. J. H. M. Meijer, M. Towrie, S. A. Tikhomirov, O. V. Bouganov, M. D. Ward and J. A. Weinstein, Inorg. Chem., 2011, 49, 10041; C. S. Grange, A. J. H. M. Meijer and M. D. Ward Dalton Trans., 2010, 39, 200; S. P. Foxon, C. Green, M. Walker, A. Wragg, H. Adams, J. A. Weinstein, S. C. Parker, A. J. H. M. Meijer and J. A. Thomas, Inorg. Chem., 2012, 51, 463; J. A. Thomas, H. Ahmad and A. J. H. M. Meijer, Chem. Asian J., 2011, 6, 2339; A. B. Wragg, S. Derossi, T. L. Easun, M. W. George, X.-Z. Sun, F. Hartl, A. H. Shelton, A. J. H. M. Meijer and M. D. Ward, Dalton Trans., 2012, 41, 10354.
49. K. K. Irikura, R. D. Johnson, R. N. Kacker. J. Phys. Chem. A. 2005, 109, 8430.


![The Story of Picosecond Ultrasonicsperso.univ-lemans.fr/~pruello/Picosecond ultrasonics from lab to... · The Story of Picosecond Ultrasonics 1 Christopher Morath, ... [ps] 0.00 0.05](https://static.fdocuments.in/doc/165x107/5a8820a97f8b9aa5408e58d4/the-story-of-picosecond-pruellopicosecond-ultrasonics-from-lab-tothe-story-of.jpg)