PicoScope 6 PC Oscilloscope · PDF filemanual as if it were a book, ... PCO basics PicoScope...
91
Copyright © 2007 Pico Technology Limited. All rights reserved. PicoScope 6 User's Guide psw.en-2.6 PC Oscilloscope Software
Transcript of PicoScope 6 PC Oscilloscope · PDF filemanual as if it were a book, ... PCO basics PicoScope...
Copyright © 2007 Pico Technology Limited. All rights reserved.
PicoScope 6
User's Guide
psw.en-2.6
PC Oscilloscope Software

PicoScope 6 User's GuideI
Copyright © 2007 Pico Technology Limited. All rights reserved.psw.en
Table of Contents.....................................................................................................................................11 Welcome
.....................................................................................................................................22 Version 6.0 update
...........................................................................................................................................31 Release Notes
.....................................................................................................................................43 Introduction
...........................................................................................................................................51 Legal statement
...........................................................................................................................................62 Contact information
...........................................................................................................................................63 How to use this manual
...........................................................................................................................................74 System requirements
.....................................................................................................................................84 Using PicoScope for the first time
.....................................................................................................................................95 PicoScope and oscilloscope primer
...........................................................................................................................................91 Oscilloscope basics
...........................................................................................................................................102 PCO basics
...........................................................................................................................................103 PicoScope basics
...........................................................................................................................................114 Frequency legend
...........................................................................................................................................115 Measurements table
...........................................................................................................................................126 Post-trigger arrow
...........................................................................................................................................127 Ruler legend
...........................................................................................................................................138 Scope view
...........................................................................................................................................149 Spectrum view
...........................................................................................................................................1510 Properties sheet
...........................................................................................................................................1611 Cursor position tool tip
...........................................................................................................................................1712 Time rulers
...........................................................................................................................................1813 Trigger marker
...........................................................................................................................................1914 Signal rulers
...........................................................................................................................................1915 Windows, views and viewports
...........................................................................................................................................2016 Custom probes
.....................................................................................................................................216 Menus
...........................................................................................................................................221 File menu
...........................................................................................................................................231 Save As dialog
...........................................................................................................................................272 Startup Settings menu
...........................................................................................................................................282 Edit menu
...........................................................................................................................................281 Notes area
...........................................................................................................................................293 Views menu
...........................................................................................................................................301 Custom grid layout dialog
...........................................................................................................................................304 Measurements menu
...........................................................................................................................................311 Add / Edit Measurement dialog
...........................................................................................................................................325 Tools menu
...........................................................................................................................................321 Custom Probes dialog
...........................................................................................................................................332 Custom Probe wizard
...........................................................................................................................................443 Preferences dialog

IITable of Contents
Copyright © 2007 Pico Technology Limited. All rights reserved. psw.en
...........................................................................................................................................476 Help menu
...........................................................................................................................................487 Connect Device dialog
.....................................................................................................................................497 Toolbars
...........................................................................................................................................501 Buffer Navigation toolbar
...........................................................................................................................................502 Channel Setup toolbar
...........................................................................................................................................511 Advanced Options menu
...........................................................................................................................................523 Measurements toolbar
...........................................................................................................................................534 Capture Setup toolbar
...........................................................................................................................................541 Spectrum Options dialog
...........................................................................................................................................565 Signal Generator toolbar
...........................................................................................................................................561 Signal Generator dialog
...........................................................................................................................................582 Arbitrary waveform files
...........................................................................................................................................596 Start / Stop toolbar
...........................................................................................................................................607 Triggering toolbar
...........................................................................................................................................621 Advanced Triggering dialog
...........................................................................................................................................632 Advanced trigger types
...........................................................................................................................................668 Zooming and Scrolling toolbar
...........................................................................................................................................679 Demonstration Signals toolbar
...........................................................................................................................................671 Demonstration Signals dialog
.....................................................................................................................................698 How to...
...........................................................................................................................................701 How to change to a different scope device
...........................................................................................................................................702 How to use rulers to measure a signal
...........................................................................................................................................713 How to measure a time difference
...........................................................................................................................................724 How to move a view
...........................................................................................................................................735 How to scale and offset a signal
...........................................................................................................................................746 How to set up the spectrum view
.....................................................................................................................................759 Reference
...........................................................................................................................................751 Measurement types
...........................................................................................................................................751 Scope measurements
...........................................................................................................................................762 Spectrum measurements
...........................................................................................................................................782 Window functions
...........................................................................................................................................793 Trigger timing (part 1)
...........................................................................................................................................804 Trigger timing (part 2)
...........................................................................................................................................815 Keyboard shortcuts
...........................................................................................................................................816 Glossary
..............................................................................................................................................83Index

PicoScope 6 User's Guide1
Copyright © 2007 Pico Technology Limited. All rights reserved.psw.en
1 WelcomeWelcome to PicoScope 6, the PC Oscilloscope software from Pico Technology Limited.
With a scope device from Pico Technology, PicoScope turns your PC into apowerful PC Oscilloscope with all the features and performance of a bench-toposcilloscope at a fraction of the cost.
How to use this manualWhat's new in this version?
Software version: PicoScope 6.0.10
10
10
9
6
2
Version 6.0 update 2
Copyright © 2007 Pico Technology Limited. All rights reserved. psw.en
2 Version 6.0 updatePicoScope 6 is a major new release of PicoScope, Pico Technology's software for PCOscilloscopes.
Higher performance• Faster capture rates, making it easier to see fast-moving signals• Faster data processing• Better support for the latest PicoScope USB oscilloscopes including the
PicoScope 5000 Series
Improved usability and appearance• Clearer graphics and text• Tooltips and help messages to explain all features• Easy point-and-click tools for panning and zooming
New features• The latest Windows .NET technology helps us get new features to you quicker• Custom probes manager to make it easy for you to use your own probes and
sensors with PicoScope• Multiple views of the same data, with individual zoom and pan settings for each
view• Advanced triggering conditions• Properties sheet displaying all settings at a glance
See the Release Notes for more details.
32
62
15
3

PicoScope 6 User's Guide3
Copyright © 2007 Pico Technology Limited. All rights reserved.psw.en
2.1 Release Notes
Release 6.0.10 - June 2007
New channel scaling featureHysteresis added to advanced triggeringNew binary file formats for exported dataLogic trigger now has edge triggering.Full range of devices now available in Demonstration mode.New 200 second per division timebase added.
Release 6.0.9 - May 2007
Improvements to advanced triggering.
Release 6.0.8 - May 2007
New Advanced Triggering conditionsSimplified Startup Settings menu
Release 6.0.7 - April 2007
New Spectrum viewNew measurements to accompany spectrum viewNew Properties sheetNew 'save & load defaults' menu commands
Release 6.0.1 - December 2006
New Auto Setup buttonNew support for PicoScope 5000 Series scopesSupport for PicoScope 5000's large memory buffer, by storing waveform bufferin scope memoryImproved compatibility with PicoScope 5 PSD files
51
25
60
27
14
14
15
27
53
50
22

Introduction 4
Copyright © 2007 Pico Technology Limited. All rights reserved. psw.en
3 IntroductionPicoScope is a comprehensive software application for Pico Technology PCOscilloscopes. Used with a scope device from Pico Technology, it creates a virtualoscilloscope, spectrum analyser and multimeter on your PC.
PicoScope 6 supports the following scope devices:
PicoScope 5000 SeriesPicoScope 6 runs on any 32-bit computer with Windows XP SP2 or Windows Vista.(See System requirements for further recommendations.)
Legal statementContact informationHow to use this manual
How to use PicoScope 6
Getting started: see using PicoScope for the first time , and PicoScope'sFeatures.For further information: see descriptions of Menus and Toolbars , and theReference section.For step-by-step tutorials, see the "How to " section.
7
5
6
6
8
9
21 49
75
69
PicoScope 6 User's Guide5
Copyright © 2007 Pico Technology Limited. All rights reserved.psw.en
3.1 Legal statement
The material contained in this release is licensed, not sold. Pico Technology Limitedgrants a licence to the person who installs this software, subject to the conditionslisted below.
AccessThe licensee agrees to allow access to this software only to persons who have beeninformed of these conditions and agree to abide by them.
UsageThe software in this release is for use only with Pico products or with data collectedusing Pico products.
CopyrightPico Technology Limited claims the copyright of, and retains the rights to, all material(software, documents etc) contained in this release. You may copy and distribute theentire release in its original state, but must not copy individual items within therelease other than for backup purposes.
LiabilityPico Technology and its agents shall not be liable for any loss, damage or injury,howsoever caused, related to the use of Pico Technology equipment or software,unless excluded by statute.
Fitness for purposeNo two applications are the same: Pico Technology cannot guarantee that itsequipment or software is suitable for a given application. It is your responsibility,therefore, to ensure that the product is suitable for your application.
Mission-critical applicationsThis software is intended for use on a computer that may be running other softwareproducts. For this reason, one of the conditions of the licence is that it excludes usagein mission-critical applications, for example life-support systems.
VirusesThis software was continuously monitored for viruses during production, but you areresponsible for virus-checking the software once it is installed.
SupportIf you are dissatisfied with the performance of this software, please contact ourtechnical support staff, who will try to fix the problem within a reasonable time. If youare still dissatisfied, please return the product and software to your supplier within 14days of purchase for a full refund.
UpgradesWe provide upgrades, free of charge, from our web site at www.picotech.com. Wereserve the right to charge for updates or replacements sent out on physical media.
TrademarksWindows is a registered trademark of Microsoft Corporation. Pico Technology Limitedand PicoScope are internationally registered trade marks.
Introduction 6
Copyright © 2007 Pico Technology Limited. All rights reserved. psw.en
3.2 Contact information
Address: Pico Technology LimitedThe Mill HouseCambridge StreetSt NeotsCambridgeshirePE19 1QBUnited Kingdom
Phone:Fax:
+44 (0)1480 396395+44 (0)1480 396296
Office hours: 09:00 to 17:00 Mon-Fri
Technical support email:Sales email:
[email protected]@picotech.com
Web site: www.picotech.com
3.3 How to use this manual
If you are using a PDF viewer to read this manual, you can turn the pages of themanual as if it were a book, using the back and forward buttons in your viewer.These buttons should look something like this:
back
forward
You can also print the entire manual for reading away from your computer. Look for a print button similar to this:
For your first introduction to PicoScope, we suggest that you start with these topics:
Using PicoScope for the first timeOscilloscope basicsPCO basicsPicoScope basics
8
9
10
10
PicoScope 6 User's Guide7
Copyright © 2007 Pico Technology Limited. All rights reserved.psw.en
3.4 System requirements
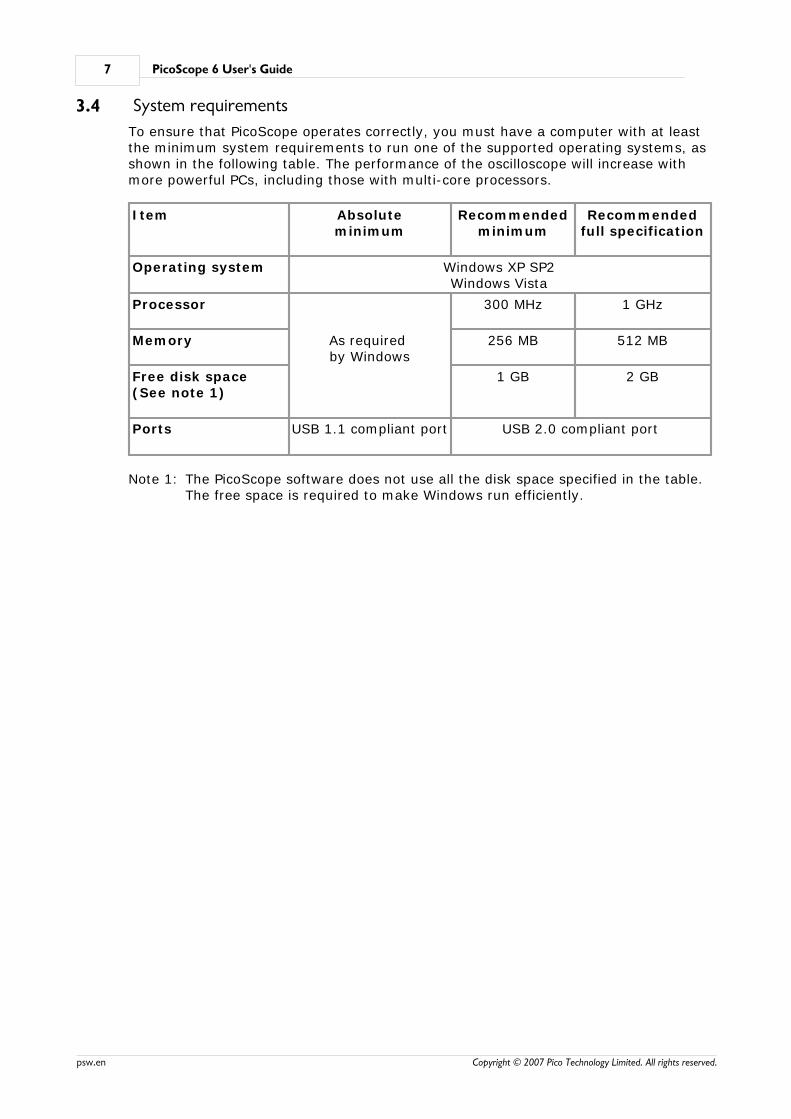
To ensure that PicoScope operates correctly, you must have a computer with at leastthe minimum system requirements to run one of the supported operating systems, asshown in the following table. The performance of the oscilloscope will increase withmore powerful PCs, including those with multi-core processors.
Item Absoluteminimum
Recommendedminimum
Recommendedfull specification
Operating system Windows XP SP2Windows Vista
Processor
As required by Windows
300 MHz 1 GHz
Memory 256 MB 512 MB
Free disk space (See note 1)
1 GB 2 GB
Ports USB 1.1 compliant port USB 2.0 compliant port
Note 1: The PicoScope software does not use all the disk space specified in the table.The free space is required to make Windows run efficiently.

Using PicoScope for the first time 8
Copyright © 2007 Pico Technology Limited. All rights reserved. psw.en
4 Using PicoScope for the first timeWe have designed PicoScope to be as easy as possible to use, even for newcomers tooscilloscopes. Once you have followed the introductory steps listed below, we hopethat you will soon become a PicoScope expert.
1. Install the software. Load the CD-ROM that is included with your scopedevice, then click the "Install Software" link and follow the on-screeninstructions.
2. Plug in your scope device. Windows will recognise it and make thenecessary changes to allow your computer to work with it. Wait untilWindows tells you that the device is ready to use.
3. Click the new PicoScope icon on your Windows desktop.
4. PicoScope will detect your scope device and configure itself, ready todisplay a waveform. The green Start button will be highlighted toshow that PicoScope is ready.
5. Connect a signal to one of the scope device's input channels and seeyour first waveform!
"Why did it do that?"
Help is at hand! Our technical support staff are always ready to answer yourtelephone call during office hours (see our Contact Details ). At other times, youcan contact our support forum or send us an email.
59
6
PicoScope 6 User's Guide9
Copyright © 2007 Pico Technology Limited. All rights reserved.psw.en
5 PicoScope and oscilloscope primerThis chapter explains the fundamental concepts that you will need to know beforeworking with the PicoScope software. If you have used an oscilloscope before, thenmost of these ideas will be familiar to you. If not, please take a few minutes to read atleast the "Oscilloscope basics" and "PicoScope basics" topics, and then returnhere to read the more detailed topics in this chapter when you need them.
5.1 Oscilloscope basics
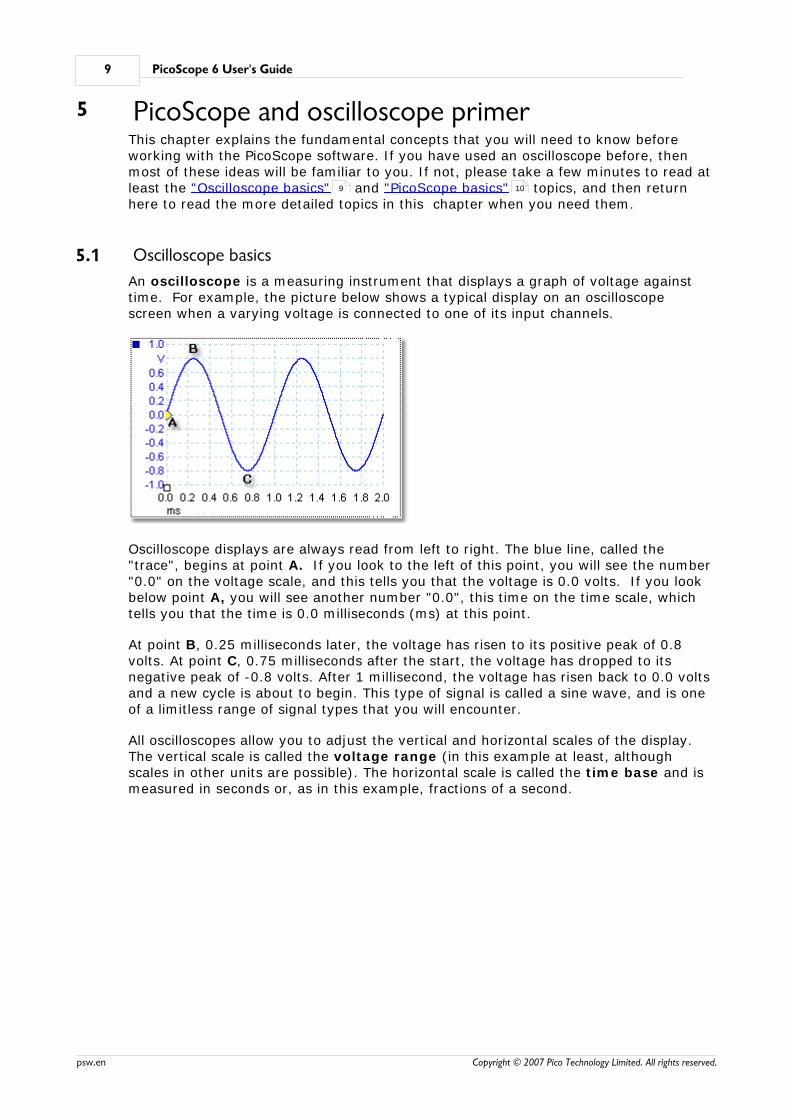
An oscilloscope is a measuring instrument that displays a graph of voltage againsttime. For example, the picture below shows a typical display on an oscilloscopescreen when a varying voltage is connected to one of its input channels.
Oscilloscope displays are always read from left to right. The blue line, called the"trace", begins at point A. If you look to the left of this point, you will see the number"0.0" on the voltage scale, and this tells you that the voltage is 0.0 volts. If you lookbelow point A, you will see another number "0.0", this time on the time scale, whichtells you that the time is 0.0 milliseconds (ms) at this point.
At point B, 0.25 milliseconds later, the voltage has risen to its positive peak of 0.8volts. At point C, 0.75 milliseconds after the start, the voltage has dropped to itsnegative peak of -0.8 volts. After 1 millisecond, the voltage has risen back to 0.0 voltsand a new cycle is about to begin. This type of signal is called a sine wave, and is oneof a limitless range of signal types that you will encounter.
All oscilloscopes allow you to adjust the vertical and horizontal scales of the display.The vertical scale is called the voltage range (in this example at least, althoughscales in other units are possible). The horizontal scale is called the time base and ismeasured in seconds or, as in this example, fractions of a second.
9 10

PicoScope and oscilloscope primer 10
Copyright © 2007 Pico Technology Limited. All rights reserved. psw.en
5.2 PCO basics
A PCO (PC Oscilloscope) is a virtual oscilloscope that consists of a hardware scopedevice and a PC running oscilloscope software. Oscilloscopes were introduced longbefore digital computers existed, and were originally self-contained electronicinstruments with limited abilities. Later oscilloscopes began to use new digitaltechnology to introduce more functions, but they remained highly specialised andexpensive instruments. PC Oscilloscopes are the latest step in the evolution ofoscilloscopes, combining the measuring power of Pico Technology's scope devices withthe convenience of the PC that's already on your desk.
+ =PC scope device PCO
5.3 PicoScope basics
PicoScope can display simple waveforms such as the example we saw in the "Oscilloscope basics " topic, but has many advanced features too. The screen shotbelow shows the PicoScope window. Click on any of the underlined labels to learnmore. Also, please see "Windows, views and viewports" for an explanation of theseimportant concepts.
9
9
19
PicoScope 6 User's Guide11
Copyright © 2007 Pico Technology Limited. All rights reserved.psw.en
5.4 Frequency legend
The frequency legend appears when you have placed two time rulers on a scopeview . It shows 1/D in hertz (the SI unit of frequency, equal to cycles per second),where D is the time difference between the two rulers. You can use this to estimatethe frequency of a periodic waveform, but you will get more accurate results bycreating a frequency measurement using the Add Measurements button on theMeasurements toolbar .
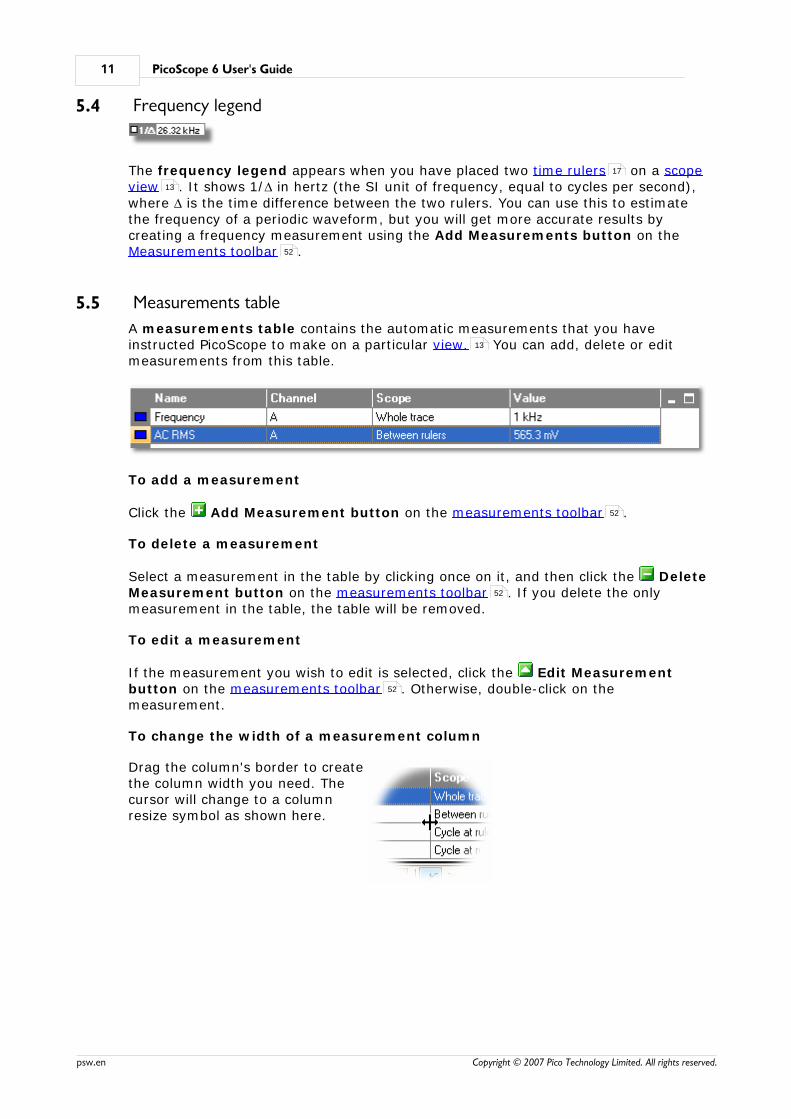
5.5 Measurements table
A measurements table contains the automatic measurements that you haveinstructed PicoScope to make on a particular view. You can add, delete or editmeasurements from this table.
To add a measurement
Click the Add Measurement button on the measurements toolbar .
To delete a measurement
Select a measurement in the table by clicking once on it, and then click the DeleteMeasurement button on the measurements toolbar . If you delete the onlymeasurement in the table, the table will be removed.
To edit a measurement
If the measurement you wish to edit is selected, click the Edit Measurementbutton on the measurements toolbar . Otherwise, double-click on themeasurement.
To change the width of a measurement column
Drag the column's border to createthe column width you need. Thecursor will change to a columnresize symbol as shown here.
17
13
52
13
52
52
52
PicoScope and oscilloscope primer 12
Copyright © 2007 Pico Technology Limited. All rights reserved. psw.en
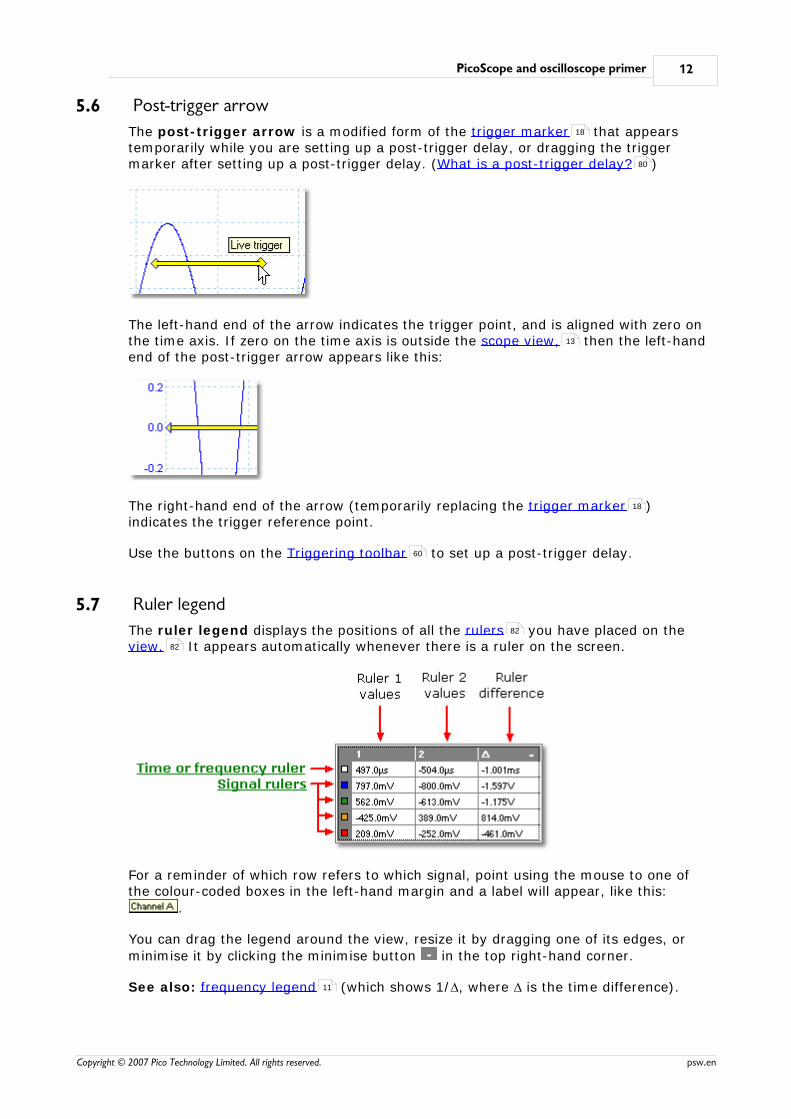
5.6 Post-trigger arrow
The post-trigger arrow is a modified form of the trigger marker that appearstemporarily while you are setting up a post-trigger delay, or dragging the triggermarker after setting up a post-trigger delay. (What is a post-trigger delay? )
The left-hand end of the arrow indicates the trigger point, and is aligned with zero onthe time axis. If zero on the time axis is outside the scope view, then the left-handend of the post-trigger arrow appears like this:
The right-hand end of the arrow (temporarily replacing the trigger marker )indicates the trigger reference point.
Use the buttons on the Triggering toolbar to set up a post-trigger delay.
5.7 Ruler legend
The ruler legend displays the positions of all the rulers you have placed on theview. It appears automatically whenever there is a ruler on the screen.
For a reminder of which row refers to which signal, point using the mouse to one ofthe colour-coded boxes in the left-hand margin and a label will appear, like this:
.
You can drag the legend around the view, resize it by dragging one of its edges, or
minimise it by clicking the minimise button in the top right-hand corner.
See also: frequency legend (which shows 1/D, where D is the time difference).
18
80
13
18
60
82
82
11
PicoScope 6 User's Guide13
Copyright © 2007 Pico Technology Limited. All rights reserved.psw.en
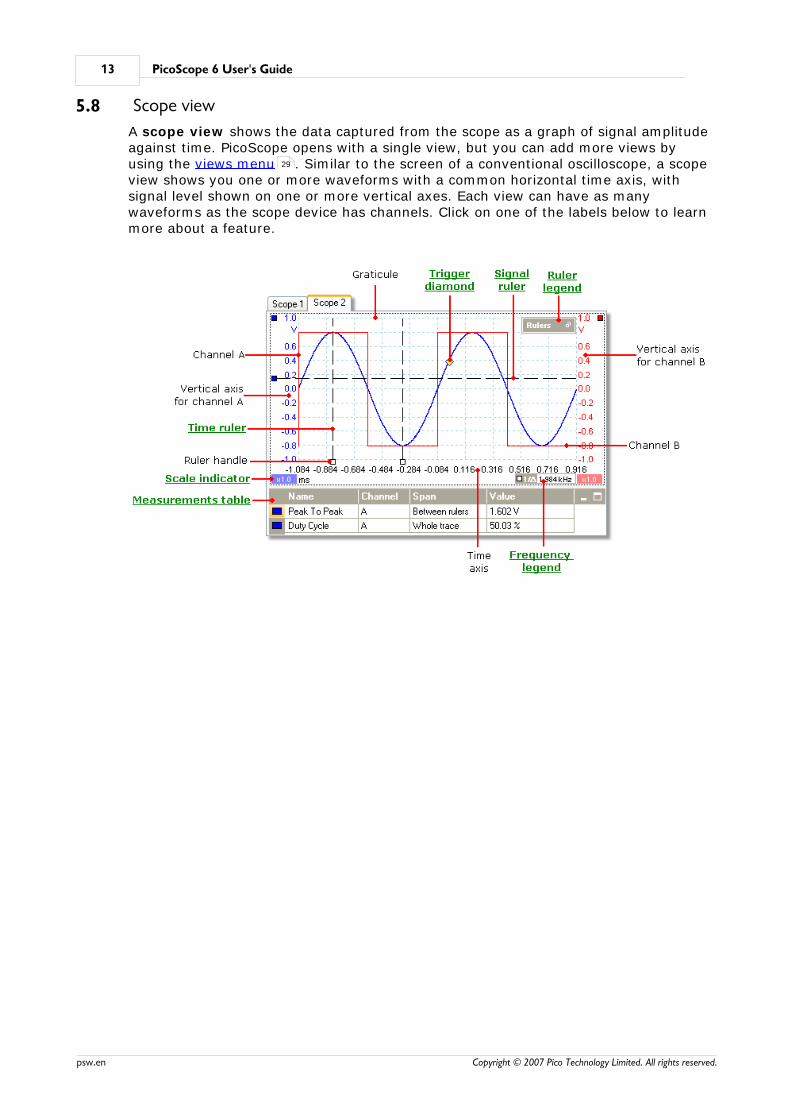
5.8 Scope view
A scope view shows the data captured from the scope as a graph of signal amplitudeagainst time. PicoScope opens with a single view, but you can add more views byusing the views menu . Similar to the screen of a conventional oscilloscope, a scopeview shows you one or more waveforms with a common horizontal time axis, withsignal level shown on one or more vertical axes. Each view can have as manywaveforms as the scope device has channels. Click on one of the labels below to learnmore about a feature.
29

PicoScope and oscilloscope primer 14
Copyright © 2007 Pico Technology Limited. All rights reserved. psw.en
5.9 Spectrum view
A spectrum view is one view of the data from a scope device. PicoScope opens witha single view, but you can add more views by using the views menu . Similar to thescreen of a conventional spectrum analyser, a spectrum view shows you one or morespectra with a common frequency axis. A spectrum is a diagram of signal level on avertical axis plotted against frequency on the horizontal axis. Each view can have asmany spectra as the scope device has channels. Click on one of the labels below tolearn more about a feature.
For more information, see: How to set up the spectrum view and SpectrumOptions dialog.
29
74
54
PicoScope 6 User's Guide15
Copyright © 2007 Pico Technology Limited. All rights reserved.psw.en
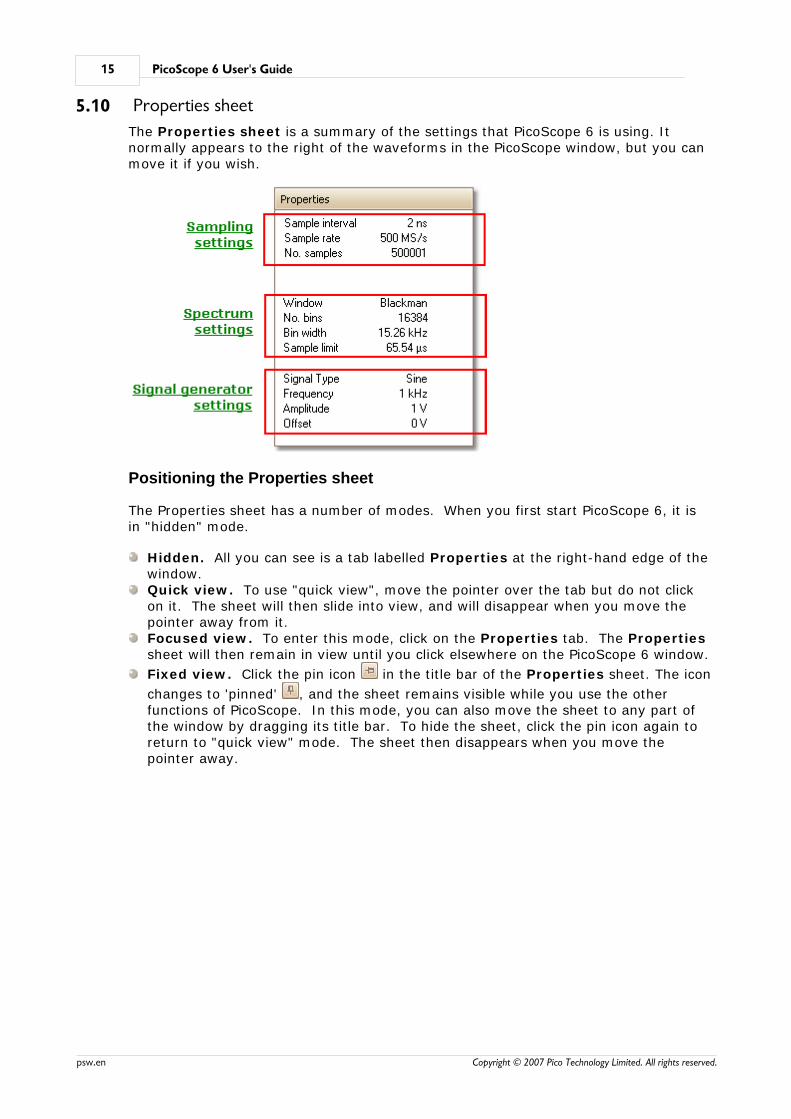
5.10 Properties sheet
The Properties sheet is a summary of the settings that PicoScope 6 is using. Itnormally appears to the right of the waveforms in the PicoScope window, but you canmove it if you wish.
Positioning the Properties sheet
The Properties sheet has a number of modes. When you first start PicoScope 6, it isin "hidden" mode.
Hidden. All you can see is a tab labelled Properties at the right-hand edge of thewindow.Quick view. To use "quick view", move the pointer over the tab but do not clickon it. The sheet will then slide into view, and will disappear when you move thepointer away from it.Focused view. To enter this mode, click on the Properties tab. The Propertiessheet will then remain in view until you click elsewhere on the PicoScope 6 window.
Fixed view. Click the pin icon in the title bar of the Properties sheet. The icon
changes to 'pinned' , and the sheet remains visible while you use the otherfunctions of PicoScope. In this mode, you can also move the sheet to any part ofthe window by dragging its title bar. To hide the sheet, click the pin icon again toreturn to "quick view" mode. The sheet then disappears when you move thepointer away.
PicoScope and oscilloscope primer 16
Copyright © 2007 Pico Technology Limited. All rights reserved. psw.en
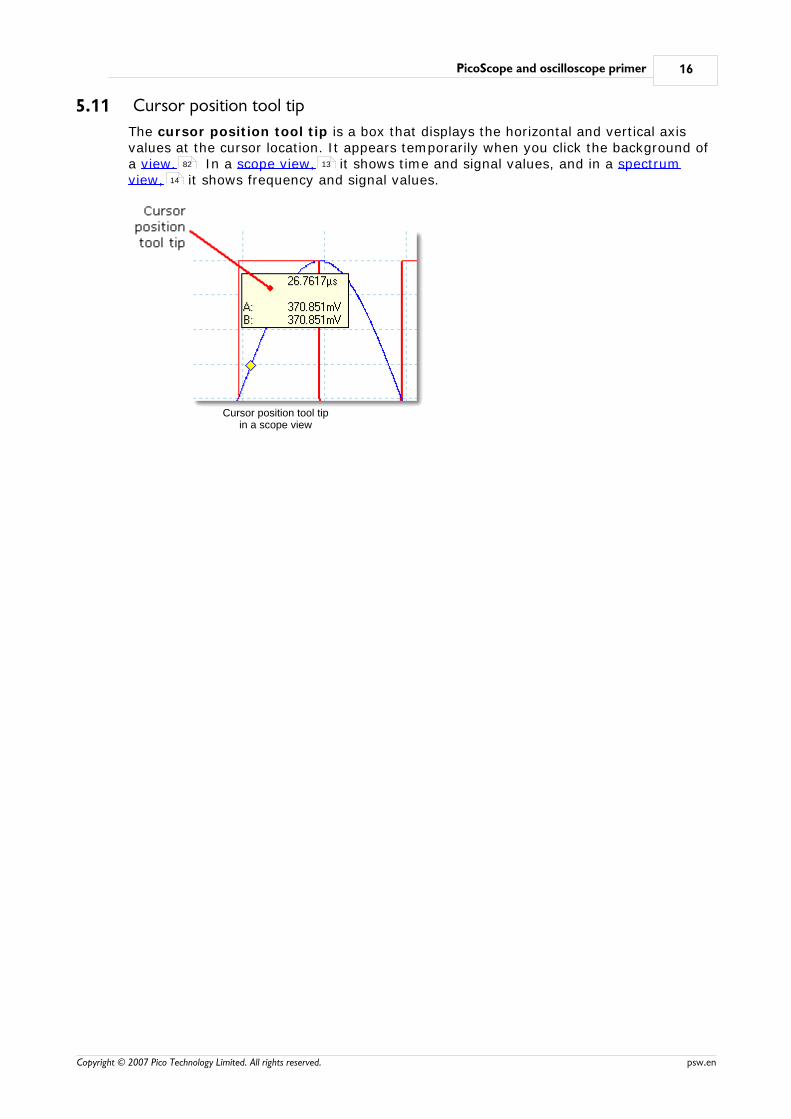
5.11 Cursor position tool tip
The cursor position tool tip is a box that displays the horizontal and vertical axisvalues at the cursor location. It appears temporarily when you click the background ofa view. In a scope view, it shows time and signal values, and in a spectrumview, it shows frequency and signal values.
Cursor position tool tipin a scope view
82 13
14
PicoScope 6 User's Guide17
Copyright © 2007 Pico Technology Limited. All rights reserved.psw.en
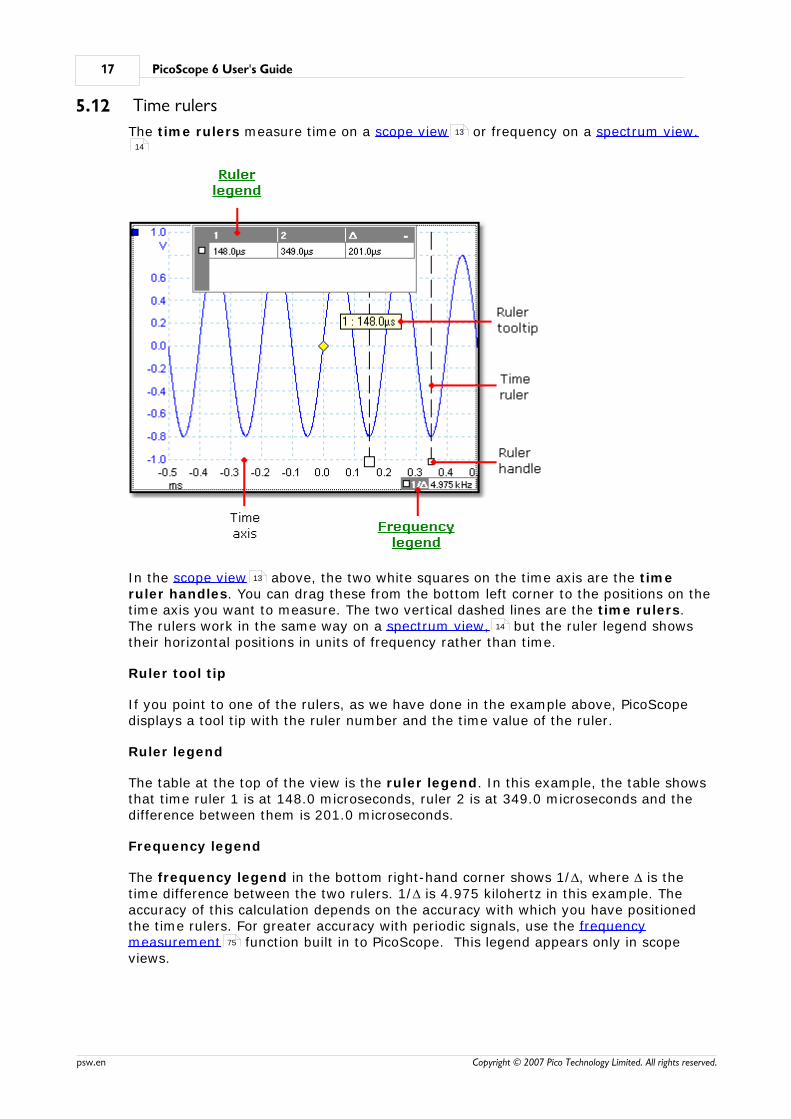
5.12 Time rulers
The time rulers measure time on a scope view or frequency on a spectrum view.
In the scope view above, the two white squares on the time axis are the timeruler handles. You can drag these from the bottom left corner to the positions on thetime axis you want to measure. The two vertical dashed lines are the time rulers.The rulers work in the same way on a spectrum view, but the ruler legend showstheir horizontal positions in units of frequency rather than time.
Ruler tool tip
If you point to one of the rulers, as we have done in the example above, PicoScopedisplays a tool tip with the ruler number and the time value of the ruler.
Ruler legend
The table at the top of the view is the ruler legend. In this example, the table showsthat time ruler 1 is at 148.0 microseconds, ruler 2 is at 349.0 microseconds and thedifference between them is 201.0 microseconds.
Frequency legend
The frequency legend in the bottom right-hand corner shows 1/D, where D is thetime difference between the two rulers. 1/D is 4.975 kilohertz in this example. Theaccuracy of this calculation depends on the accuracy with which you have positionedthe time rulers. For greater accuracy with periodic signals, use the frequencymeasurement function built in to PicoScope. This legend appears only in scopeviews.
13
14
13
14
75
PicoScope and oscilloscope primer 18
Copyright © 2007 Pico Technology Limited. All rights reserved. psw.en
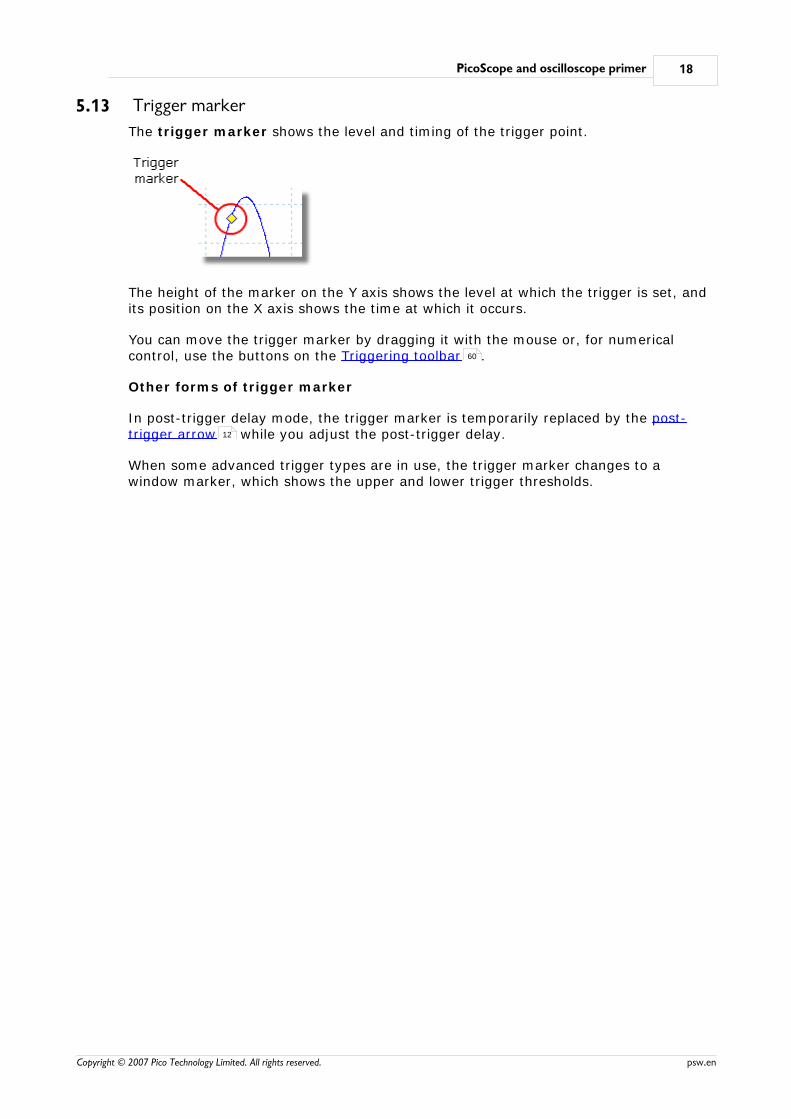
5.13 Trigger marker
The trigger marker shows the level and timing of the trigger point.
The height of the marker on the Y axis shows the level at which the trigger is set, andits position on the X axis shows the time at which it occurs.
You can move the trigger marker by dragging it with the mouse or, for numericalcontrol, use the buttons on the Triggering toolbar .
Other forms of trigger marker
In post-trigger delay mode, the trigger marker is temporarily replaced by the post-trigger arrow while you adjust the post-trigger delay.
When some advanced trigger types are in use, the trigger marker changes to awindow marker, which shows the upper and lower trigger thresholds.
60
12

PicoScope 6 User's Guide19
Copyright © 2007 Pico Technology Limited. All rights reserved.psw.en
5.14 Signal rulers
The signal rulers are to help you measure signal levels with respect to ground, orsignal differences, on a scope view or spectrum view .
In the scope view above, the two coloured squares to the left of the vertical axisare the ruler drag-handles. You can drag these from the top-left corner to thepositions you want to measure on the waveform. The two horizontal dashed lines arethe signal rulers. The signal rulers work in the same way on a spectrum view.
Ruler legend
The table at the top of the view is the ruler legend. In this example, the table showsthat ruler 1 is at 807 millivolts, ruler 2 is at -811.0 millivolts and the differencebetween them is –1.618 volts. If you prefer to see the difference as a positive value,swap the positions of the two rulers by dragging them.
Ruler tool tip
If you move the mouse pointer over one of the rulers, PicoScope displays a tool tipwith the ruler number and the signal level of the ruler. You can see an example of thisin the picture above.
5.15 Windows, views and viewports
PicoScope contains one or more views - which can be scope views or spectrumviews. When you first open PicoScope, it contains a single scope view. You canzoom and pan this to show various different waveforms based on the data that thescope device captured. If you wish, you can add more views to the PicoScope window(how? ). Each view is a differently zoomed and panned section of the samecapture.
Multiple views are always arranged in a grid. Each location in the grid is called aviewport, and can be empty or occupied by one or more views.
13 14
13
14
82
13
14
66
29
PicoScope and oscilloscope primer 20
Copyright © 2007 Pico Technology Limited. All rights reserved. psw.en
5.16 Custom probes
A probe is any connector, transducer or measuring device that you connect to theinput channel of your scope device . PicoScope has a built-in library of commonprobe types, such as the x1 and x10 voltage probes used with most oscilloscopes, butif your probe is not included in this list you can use the Custom Probes dialog todefine a new one. Custom probes can have any voltage range within the capabilitiesof the oscilloscope, display in any units, and have either linear or nonlinearcharacteristics.
Custom probe definitions are particularly useful when you wish to display the probe'soutput in units other than volts, or to apply linear or nonlinear corrections to the data.
82
32

PicoScope 6 User's Guide21
Copyright © 2007 Pico Technology Limited. All rights reserved.psw.en
6 MenusMenus are the quickest way to get to PicoScope's main features. The Menu bar isalways present at the top of the PicoScope main window, just below the window's titlebar. You can click any of the menu items, or press the Alt key and then navigate tothe menu using the cursor keys, or press the Alt key followed by the underlined letterin one of the menu items.
The list of items in the menu bar may vary depending on the windows that you haveopen in PicoScope.

Menus 22
Copyright © 2007 Pico Technology Limited. All rights reserved. psw.en
6.1 File menu
Click File on the Menu bar to open the File menu.
Connect Device. This command appears only when there is no scopedevice connected. It opens the Connect Device dialog which allows youto select the scope device you wish to use.
Open. Allows you to select the file you want to open. PicoScope can open *.
psdata and *.psd files, which contain both waveform data and scope device
settings, and *.pssettings and *.pss files, which contain only scope device
settings. You can create your own files using the Save and Save As...commands, described below. If the file was saved using a different scopedevice from the one that is presently connected, PicoScope may need tomodify the saved settings to suit the present device.
Save All Waveforms As. Opens the Save As dialog , which allows you tosave the settings and waveforms for all views in various formats.
Save Current Waveform As. Opens the Save As dialog , which allowsyou to save the settings and waveforms for all views in various formats.
Startup Settings. Opens the Startup Settings dialog.
Print Preview. Opens the Print Preview window, which allows you to seehow your workspace will be printed when you select the Print command.
Print. Opens a standard Windows Print dialog, which allows you to choose aprinter, set printing options and then print the selected view.
Exit. Close PicoScope without saving any data.
21
48
23
23
27

PicoScope 6 User's Guide23
Copyright © 2007 Pico Technology Limited. All rights reserved.psw.en
6.1.1 Save As dialog
The Save As dialog allows you to save your waveforms and settings to a file invarious formats. To open it, go to the File menu and click Save As.
Type your chosen file name in the File name box, and then select a file format in theSave as type box. You can save data in the following formats:
Data files (*.psdata) Stores all waveforms and settings from thecurrent scope device. Can be opened on anycomputer running PicoScope.
Settings files (*.pssettings) Stores all settings (but not waveforms) fromthe current scope device. Can be opened onany computer running PicoScope.
CSV (Comma delimited) files (*.csv)Stores waveforms as a text file with comma-separated values. This format is suitable forimporting into spreadsheets such as MicrosoftExcel. The first value on each line is the timestamp, and it is followed by one value foreach active channel. (Details)
Text (Tab delimited) files (*.txt) Stores waveforms as a text file with tab-separated values. The values are the same asthose in the CSV format. (Details)
Bitmap images (*.bmp) Stores the graticule , rulers andwaveforms in Windows bitmap format. Theimage is 800 pixels wide by 600 pixels high,in 16 million colours, and uncompressed. BMPfiles are suitable for importing into Windowsdesktop publishing programs.
22
82 82

Menus 24
Copyright © 2007 Pico Technology Limited. All rights reserved. psw.en
GIF images (*.gif) Stores the graticule , rulers andwaveforms in Compuserve GIF format. Theimage is 800 pixels wide by 600 pixels high,in 256 colours, and compressed. GIF files arewidely used to illustrate web pages.
PNG images (*.png) Stores the graticule , rulers andwaveforms in Portable Network Graphicsformat. The image is 800 pixels wide by 600pixels high, in 16 million colours, andcompressed.
Matlab 4 files (*.mat) Stores the waveform data in Matlab 4 format.(Details)
6.1.1.1 File formats for exported data
PicoScope 6 can export raw data in one of two fundamental ways:
In a text-based file
Easy to read without special toolsCommon formats like CSV and tab-delimited can be imported into standardspreadsheet applicationsFiles are very large if there are a lot of samples in the data (so files are limited to65,536 values per channel)
Text file format details
In a binary file
Files remain relatively small and can even be compressed in some situations (thismeans that the amount of saved data is unlimited)Either a special application is required to read the files or the user must write asmall program to read the data from the file
If you need to save more than 65,536 values per channel, then you must use a binaryfile format such as the Matlab® MAT-file format.
Binary file format details
Data types for PicoScope 6
Regardless of whether the data types were loaded from a binary file or from atext-based file, we recommend the following data formats for storing the loadedvalues: -
Sampled data (such as voltages) should use 32-bit single-precision floating-pointdata types.Times should use 64-bit double-precision floating-point data types.
6.1.1.1.1 Text formats
Text-format files exported by PicoScope 6 are encoded in UTF-8 format by default.This is a popular format which is capable of representing a huge range of characterswhilst still retaining some compatibility with the ASCII character set if only standardWestern European characters and numbers are used in the file.
82 82
82 82
24
25
24

PicoScope 6 User's Guide25
Copyright © 2007 Pico Technology Limited. All rights reserved.psw.en
CSV (comma-separated values)
CSV files store data in the following way: -
Time, Channel A, Channel B(µs), (V), (V)-500.004, 5.511, 1.215-500.002, 4.724, 2.130-500, 5.552, 2.212…
CSV files have a comma after each value on a line to represent a column of data anda carriage return at the end of the line to represent a new row of data. The 65,536values per channel limit applies to CSV files to prevent excessively large files beingcreated.
Note. Because some languages use the comma character as the decimal point, CSVfiles are not the best choice of format if you are working in one of these languages.Instead, try using the tab-delimited format which works in an almost identical way.
Tab-delimited
Tab-delimited files store data in the following way: -
Time Channel A Channel B(µs) (V) (V)-500.004 5.511 1.215-500.002 4.724 2.130-500 5.552 2.212…
The files have a tab character after each value on a line to represent a column of dataand a carriage return at the end of the line to represent a new row of data. These fileswork in any language and are a good choice for sharing data internationally. The65,536 values per channel limit applies to tab-delimited files to prevent excessivelylarge files being created.
6.1.1.1.2 Binary formats
PicoScope 6 can export data into version 4 of the .mat binary file format. Thisis an open format and the full specification is freely available from the www.mathworks.com website. PicoScope 6 saves data into the MAT-File format in aspecific way, which is detailed in this topic.
Importing into Matlab®
Load the file into your workspace using this syntax: -
load myfile
Each channel’s data is stored in array variable named by the channel. So, thesampled data for channels A to D would be in four arrays named A, B, C and D.
There is only one set of times data for all channels and this is loaded in one of twopossible formats: -1. A start time, an interval and a length. The variables are named Tstart, Tinterval
and Tlength.1. An array of times (sometimes used for ETS data). The time array is named T.
If the times are loaded in as Tstart, Tinterval and Tlength then you can use thefollowing command to create the equivalent array of times: -
T = [Tstart : Tinterval : Tstart + (Tlength – 1) * Tinterval];
24
Menus 26
Copyright © 2007 Pico Technology Limited. All rights reserved. psw.en
Exploring the file format
The full file specification, available from www.mathworks.com, is comprehensive sothis guide does not describe the entire format. Instead, this guide describes enough ofthe format to allow you to get data from the file and use it in your own program.
The variables described above (under Importing into Matlab® ) are stored in aseries of data blocks, each preceded by a header. Each variable has its own headerand data block and the corresponding variable names are stored with them (such as A, B, Tstart). The following sections describe how to read each variable from the file.
The order of the data blocks is not specified, so programs should look at the variablenames to decide which variable is currently being loaded.
The headerThe file consists of a number of data blocks preceded by 20-byte headers. Eachheader contains five 32-bit integers (as described in the table below).
Bytes Value
0 – 3 Data format (0, 10 or 20)
4 – 7 Number of values
8 – 11 1
12 – 15 0
16 – 19 Name length
Data formatThe ‘Data format’ in the first 4-bytes describes the type of numerical data in thearray.
Value Description
0 Double (64-bit floating point)
10 Single (32-bit floating point)
20 Integer (32-bit)
Number of valuesThe ‘Number of values’ is a 32-bit integer describing the number of numerical valuesin the array. This value may be 1 for variables that only describe 1 value; but forarrays of samples or times, expect this to be a large number.
Name lengthThe ‘Name length’ is the length of the name of the variable as a ‘null terminated’1-byte per character ASCII string. The last null terminating character (‘\0’) is includedin the ‘Name length’ so if the variable name is “TStart” (same as ‘TStart\0’) then thename length will be 7.
The data blockThe data block begins with the name of the variable (such as A, Tinterval) and youshould read in the number of bytes described by the ‘Name length’ part of the header(not forgetting that the last byte in the string is ‘\0’ if your programming languageneeds to take account of this).
The remaining part of the data block is the actual data itself, so read in the number ofvalues described in the ‘Number of values’ part of the header. Remember to takeaccount of the size of each value as described in the ‘Data format’ part of the header.
25

PicoScope 6 User's Guide27
Copyright © 2007 Pico Technology Limited. All rights reserved.psw.en
Channel data such as voltages in variables such as A and B are stored as 32-bitsingle-precision floating-point data types. Times such as Tstart, Tinterval and T arestored as 64-bit double-precision floating-point data types. Tlength is stored as a32-bit integer.
6.1.2 Startup Settings menu
The Startup Settings menu allows you to load, save and restore the PicoScope 6startup settings. To open it, go to the File menu and click Startup Settings.
Save Startup Settings. Saves your current settings ready for when younext select Load Startup Settings. These settings are remembered fromone session of PicoScope 6 to the next.
Load Startup Settings. Returns to the settings you created with the SaveStartup Settings command.
Reset Startup Settings. Deletes the startup settings you created with theSave Startup Settings command.
22
Menus 28
Copyright © 2007 Pico Technology Limited. All rights reserved. psw.en
6.2 Edit menu
Click Edit on the Menu bar .
Copy as Image. Copies the active view to the clipboard as a bitmap. Youcan then paste the image into any application that accepts bitmap images.
Copy as Text. Copies the data in the active view to the clipboard as text.You can paste the data into a spreadsheet or other application. The textformat is the same as that used by the Save As *.txt command, and isexplained in the Save As dialog topic.
Notes. Opens a Notes area at the bottom of the PicoScope window. Youcan enter any explanatory text that you wish to in this area.
6.2.1 Notes area
A Notes area can be displayed at the bottom of the PicoScope window. You can enterany text you wish in this area. You can also copy formatted text from anotherprogram and paste it here.
To display the Notes area, click on the Edit menu, then select Notes.
21
23
28

PicoScope 6 User's Guide29
Copyright © 2007 Pico Technology Limited. All rights reserved.psw.en
6.3 Views menu
Click Views on the Menu bar or right-click on a view . This menu controls thelayout of PicoScope views .
The contents of the Views menu may vary depending on the location of the cursorand the state of the PicoScope window. It sometimes incorporates the Measurementsmenu .
Add view: Adds a view of the selected type ("scope " or "spectrum "). In automatic mode (the default), PicoScope will create a newgrid or expand the existing grid to make room for the newview, up to a limit of four views. Any further views will beadded as tabs in existing viewports. If you have selected astandard or custom grid layout, PicoScope will not change it.
Close view: Removes a view from the PicoScope window. In automaticmode (the default), PicoScope will rearrange the grid to makethe best use of the remaining space. If you have selected astandard or custom grid layout, PicoScope will not change it.
Grid Layout: The grid layout defaults to "Automatic" mode, in whichPicoScope automatically arranges views in a grid. You can alsoselect one of the standard grid layouts or create a customlayout, which PicoScope will not change as you add or removeviews.
Arrange grid layout:Adjusts the grid layout to fit the number of views. Moves anytabbed views to empty viewports. PicoScope may change thenumber of viewports.
Reset view sizes: If you have resized any of the views by dragging the vertical orhorizontal separator bars between viewports, this option willreset all the viewports to their original sizes.
Move view to: Lets you move views backward or forward in the grid, or tospecified viewports. You can achieve the same effect bydragging views by their name tabs and dropping them in a newplace. See How to move a view .
21 19
82
30
13 14
72

Menus 30
Copyright © 2007 Pico Technology Limited. All rights reserved. psw.en
6.3.1 Custom grid layout dialog
This dialog allows you to lay out the view grid with the number of rows andcolumns that you want, up to a limit of four rows and four columns. You can then dragthe views to different locations in the grid.
Where to find it
Right-click on the PicoScope window to get the Views menu , then select the GridLayout submenu and then the Custom layout... command. You can also find theView menu on the Menu bar .
6.4 Measurements menu
Click Measurements on the Menu bar .
Add measurement. Adds a row to the measurements table , and opensthe Edit Measurement Dialog . You can also find this button on theMeasurements toolbar .
Edit measurement. This takes you to the Edit Measurement Dialog .You can find this button on the Measurements toolbar , or you can edit ameasurement by double-clicking on a row of the measurements Table .
Delete measurement. Removes the selected row from themeasurements table . You can also find this button on theMeasurements toolbar .
Grid font size. Sets the font size for the entries in the measurementstable .
Column Auto-width. If this button is pressed, the columns of themeasurements table will continually adjust to fit the contents wheneverthe table changes. Click again to release the button.
82
29
21
21
11
31
52
31
52
11
11
52
11
11
PicoScope 6 User's Guide31
Copyright © 2007 Pico Technology Limited. All rights reserved.psw.en
6.4.1 Add / Edit Measurement dialog
This dialog allows you to add a measurement of a waveform to the selected view,or edit an existing measurement. PicoScope automatically refreshes the measurementevery time it updates the waveform. If this is the first measurement for the view,PicoScope will create a new measurements table to display the measurement;otherwise, it will add the new measurement to the bottom of the existing table.
Where to find it
Click the Add Measurement or Edit Measurement button on theMeasurements toolbar or in the Views menu , or double-click a measurement inthe measurements table .
Channel: Select one of the scope device 's channels to measure.
Type: PicoScope can calculate a wide range of measurements for waveforms.See Measurement Types for details.
Section: You can measure the whole trace, just the section between rulers , or asingle cycle that you point to using one of the rulers.
Where to find it
Click the Edit Measurement button on the Measurements toolbar or in theViews menu ,
19
11
52 29
11
82
75
82
52
29
Menus 32
Copyright © 2007 Pico Technology Limited. All rights reserved. psw.en
6.5 Tools menu
Click Tools on the Menu bar .
Custom Probes: Opens the Custom probes dialog, which allows you todefine new probes and copy, delete, move and edit existing ones.
Preferences: Opens the Preferences dialog , which contains variousoptions that control PicoScope's behaviour.
6.5.1 Custom Probes dialog
This dialog allows you to define your own probes and set up custom probes . To
open this dialog, choose Custom Probes in the Tools menu or click the Channel Advanced Options button.
Understanding the probe list
All the probes that PicoScope knows about are listed under three main headings: Built-in, Library and Loaded. The probe list is preserved between sessions, so thatPicoScope will never forget your custom probes unless you delete them.
Built-in probes. The built-in probes are supplied by Pico Technology and do notchange unless you download an authorised update from us. As a safeguard,PicoScope does not allow you to edit or delete these probes. If you want to modifyone of them, you can copy it to your library by clicking Duplicate, and then editthe copy in your library.Library probes. These are the probes that you have created using any of themethods described in this topic. You can edit, delete or duplicate any of theseprobes by clicking the appropriate button in this dialog.
21
32
44
20
32

PicoScope 6 User's Guide33
Copyright © 2007 Pico Technology Limited. All rights reserved.psw.en
Loaded probes. Probes in PicoScope data files (*.psdata) or settings files (*.
pssettings) that you have opened appear here until you copy them to your
library. You cannot edit or delete these probes directly, but you can click Duplicateto copy them to your library where you can edit them. You can also import probesfrom the custom ranges stored in PicoScope 5 *.psd and *.pss files, but these lack
many of the features provided by PicoScope 6. (See "Upgrading from PicoScope 5" for more details.)
Adding a new probe to your library
There are three ways to create a new probe:
1. Create a duplicate of an existing probe as described above.
2. Click New Probe... to define a new probe.
3. Click Import to load a probe definition from a *.psprobe file and add it to your
library. These files are normally supplied by Pico, but you can also create your ownby defining a new probe and then clicking Export.
The second and third methods open the Custom Probe Wizard to guide you throughthe probe definition process.
6.5.2 Custom Probe wizard
The Custom probe wizard allows you to define custom probes and set up customranges.
The first dialog in the series is either the Create a new Custom Probe dialog or theEdit an existing Custom Probe dialog .
2
33
20
34
35

Menus 34
Copyright © 2007 Pico Technology Limited. All rights reserved. psw.en
6.5.2.1 Create New Custom Probe dialog
This dialog introduces you to the process for creating a new custom probe. To open it,click the New Probe button in the Custom Probes dialog .
How to use the dialog
Click Next to continue to the Probe Output Units dialog .
32
36
PicoScope 6 User's Guide35
Copyright © 2007 Pico Technology Limited. All rights reserved.psw.en
6.5.2.2 Edit Existing Custom Probe dialog
This dialog introduces you to the process for editing an existing custom probe. Gethere by clicking the Edit button in the Custom Probes dialog .
How to use the dialog
Click Next to continue to the Probe Output Units dialog , where you can edit thecustom probe.
Click Jump forward... if you have already set up the custom probe's basiccharacteristics and want to add or change a custom range manually.
32
36
Menus 36
Copyright © 2007 Pico Technology Limited. All rights reserved. psw.en
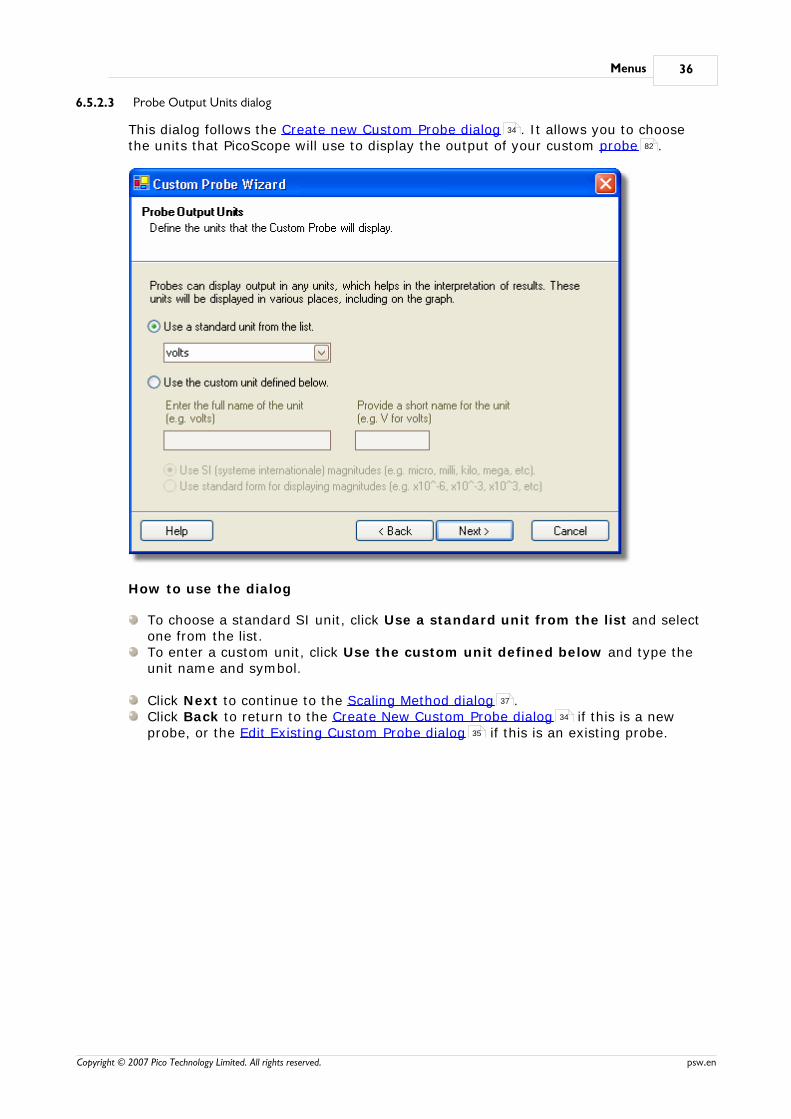
6.5.2.3 Probe Output Units dialog
This dialog follows the Create new Custom Probe dialog . It allows you to choosethe units that PicoScope will use to display the output of your custom probe .
How to use the dialog
To choose a standard SI unit, click Use a standard unit from the list and selectone from the list.To enter a custom unit, click Use the custom unit defined below and type theunit name and symbol.
Click Next to continue to the Scaling Method dialog .Click Back to return to the Create New Custom Probe dialog if this is a newprobe, or the Edit Existing Custom Probe dialog if this is an existing probe.
34
82
37
34
35
PicoScope 6 User's Guide37
Copyright © 2007 Pico Technology Limited. All rights reserved.psw.en
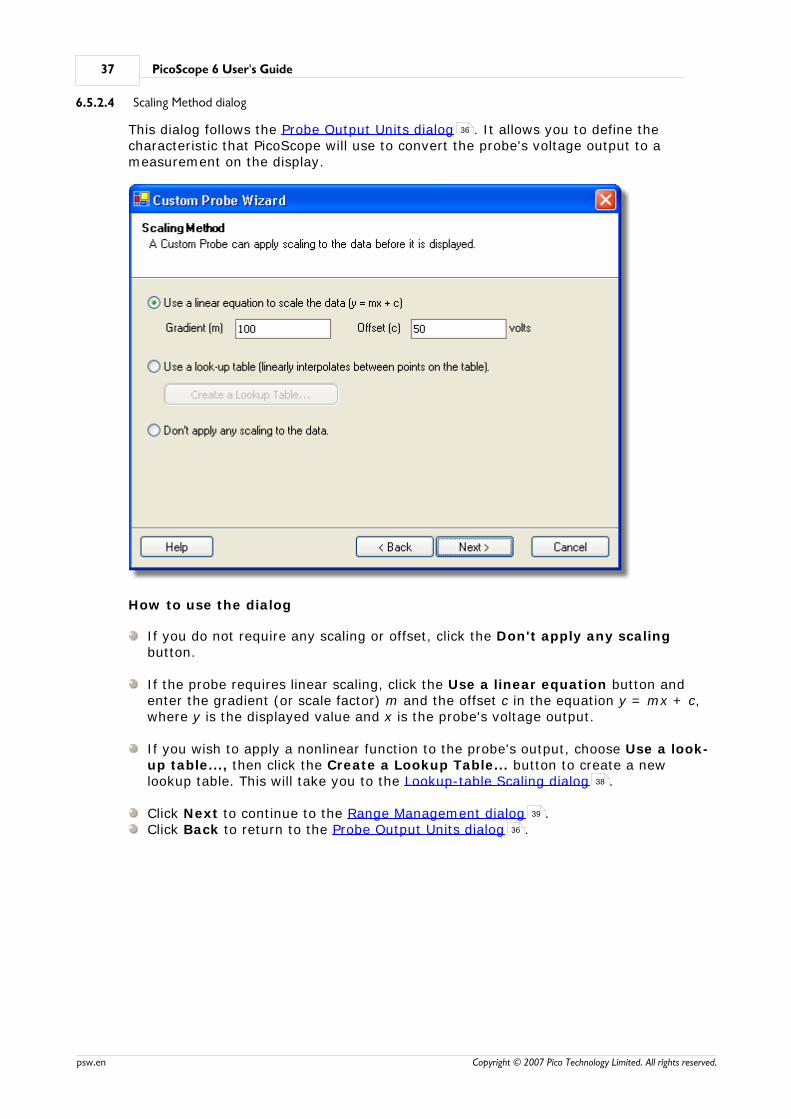
6.5.2.4 Scaling Method dialog
This dialog follows the Probe Output Units dialog . It allows you to define thecharacteristic that PicoScope will use to convert the probe's voltage output to ameasurement on the display.
How to use the dialog
If you do not require any scaling or offset, click the Don't apply any scalingbutton.
If the probe requires linear scaling, click the Use a linear equation button andenter the gradient (or scale factor) m and the offset c in the equation y = mx + c,where y is the displayed value and x is the probe's voltage output.
If you wish to apply a nonlinear function to the probe's output, choose Use a look-up table..., then click the Create a Lookup Table... button to create a newlookup table. This will take you to the Lookup-table Scaling dialog .
Click Next to continue to the Range Management dialog .Click Back to return to the Probe Output Units dialog .
36
38
39
36

Menus 38
Copyright © 2007 Pico Technology Limited. All rights reserved. psw.en
6.5.2.4.1 Lookup-table Scaling dialog
This dialog allows you to enter a look-up table to calibrate a custom probe. You canget here by clicking the Create a Look-up Table button or Edit the LookupTable... button in the Scaling Method dialog .
Editing the Look-up Table
First, select suitable values in the Input units and Scaled units drop-down boxes.For example, if your probe is a current clamp that outputs one millivolt per ampereover the range -600 to +600 amperes, select Input units of millivolts and Outputunits of amperes.
Next, enter some data in the scaling table. Click the first empty cell at the top of thetable and type "-600", then hit the Tab key and type "-600". When you are ready toenter the next pair of values, press the Tab key again to start a new row. You canalso right-click on the table to obtain a more detailed menu of options, as shown inthe picture. In the example above, we have entered a slightly nonlinear response; ifthe response had been linear then it would have been easier to use the linear optionin the Scaling Method Dialog .
Import/Export
Using the Import and Export buttons, you can fill the look-up table from data in acomma-separated or tab-delimited text file, and save the look-up table to new file.
Finishing
Clicking OK or Cancel will return you to the Scaling Method dialog .
37
37
37

PicoScope 6 User's Guide39
Copyright © 2007 Pico Technology Limited. All rights reserved.psw.en
6.5.2.5 Range Management dialog
This dialog follows the Scaling Method dialog . It allows you to override PicoScope'sautomatic range-creation feature for custom probes. In most cases, the automaticprocedure will be ideal.
How to use the dialog
If you select Let the software manage my ranges for me automatically, thenclicking Next will take you to the Custom Probe Identification dialog .PicoScope's automatic ranges should be ideal for most applications.
If you select I will manage the Custom Probe Ranges manually, clicking Nextwill take you to the Manual Ranges Setup dialog .
Click Back to return to the Scaling Method dialog .
What is Auto-ranging?
When the Auto-ranging function is selected, PicoScope continually monitors theinput signal and adjusts the range when necessary to allow it to display the signalwith maximum resolution. This function is available on all standard ranges, and can beused with custom ranges only if you select Let the software manage my rangesfor me automatically in this dialog.
37
43
40
37
Menus 40
Copyright © 2007 Pico Technology Limited. All rights reserved. psw.en
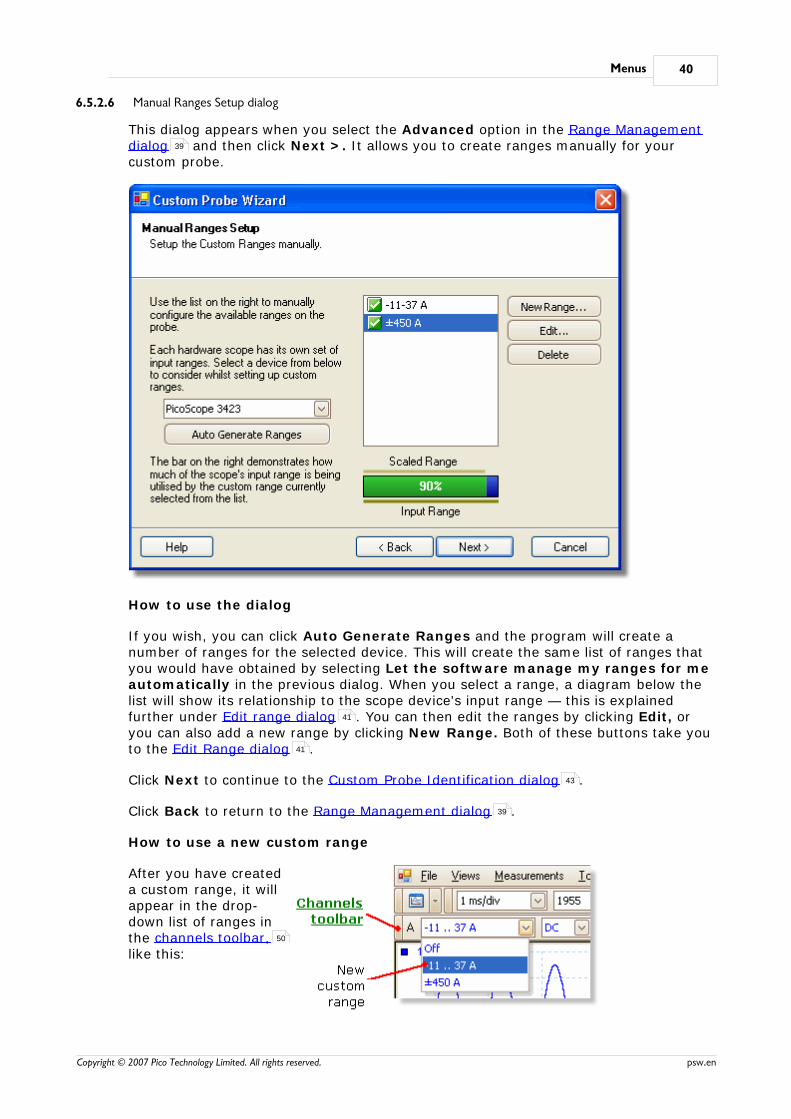
6.5.2.6 Manual Ranges Setup dialog
This dialog appears when you select the Advanced option in the Range Managementdialog and then click Next >. It allows you to create ranges manually for yourcustom probe.
How to use the dialog
If you wish, you can click Auto Generate Ranges and the program will create anumber of ranges for the selected device. This will create the same list of ranges thatyou would have obtained by selecting Let the software manage my ranges for meautomatically in the previous dialog. When you select a range, a diagram below thelist will show its relationship to the scope device's input range — this is explainedfurther under Edit range dialog . You can then edit the ranges by clicking Edit, oryou can also add a new range by clicking New Range. Both of these buttons take youto the Edit Range dialog .
Click Next to continue to the Custom Probe Identification dialog .
Click Back to return to the Range Management dialog .
How to use a new custom range
After you have createda custom range, it willappear in the drop-down list of ranges inthe channels toolbar,like this:
39
41
41
43
39
50

PicoScope 6 User's Guide41
Copyright © 2007 Pico Technology Limited. All rights reserved.psw.en
6.5.2.6.1 Edit Range dialog
This dialog allows you to edit a manual range for a custom probe.
You can get here by clicking the Edit or New Range buttons in the Manual RangesSetup dialog .
Automatic mode
If you leave the "Automatic" radio button pressed, the program will automaticallydetermine the best hardware input range for the device as you change the Scaledrange limits. This is the best mode to use for almost all ranges. You should set theScaled range limits to the maximum and minimum values you wish to see on thevertical axis of the scope display.
Fixed range mode
If you press the "Hardware input range" radio button and select a hardware inputrange from the drop-down box, PicoScope will then use that hardware input rangewhatever scaled range limits you choose. Set the upper and lower scaled range limitsto the limits you wish to appear at the top and bottom of the vertical axis inPicoScope's scope view.
What is an input range?
An input range is the signal range, usually in volts, on the input channel of the scopedevice . Your scaled range should match this as closely as possible to make themost of the scope's resolution.
What is a scaled range?
The scaled range is the range that will appear on the vertical axis of the scope displaywhen the probe is selected.
The scaling that you chose on the Scaling Method page defines the relationshipbetween the input range and the scaled range. This dialog enables you to set upranges to display the scaled data on the scope view.
40
13
82
37

Menus 42
Copyright © 2007 Pico Technology Limited. All rights reserved. psw.en
The range utilisation bar
This diagram at the bottom of the dialog represents the relationship between the
scaling and the hardware input range of the scope device.
• Green - The section of the input range that is used by the scaled range. Thisshould be as large as possible, to maximise the use of the scope device'sresolution.
• Blue - Areas of the input range that are not being used. These indicate wastedresolution.
• Grey - Parts of the scaled range that are not covered by the input range. Thesewill result in wasted space on the graph. The range utilisation bar may notrepresent these areas accurately when non-linear scaling is being used, so youshould always test the scaled range limits on the scope view.
FinishingClicking OK or Cancel will return you to the Manual Ranges Setup dialog .40
PicoScope 6 User's Guide43
Copyright © 2007 Pico Technology Limited. All rights reserved.psw.en
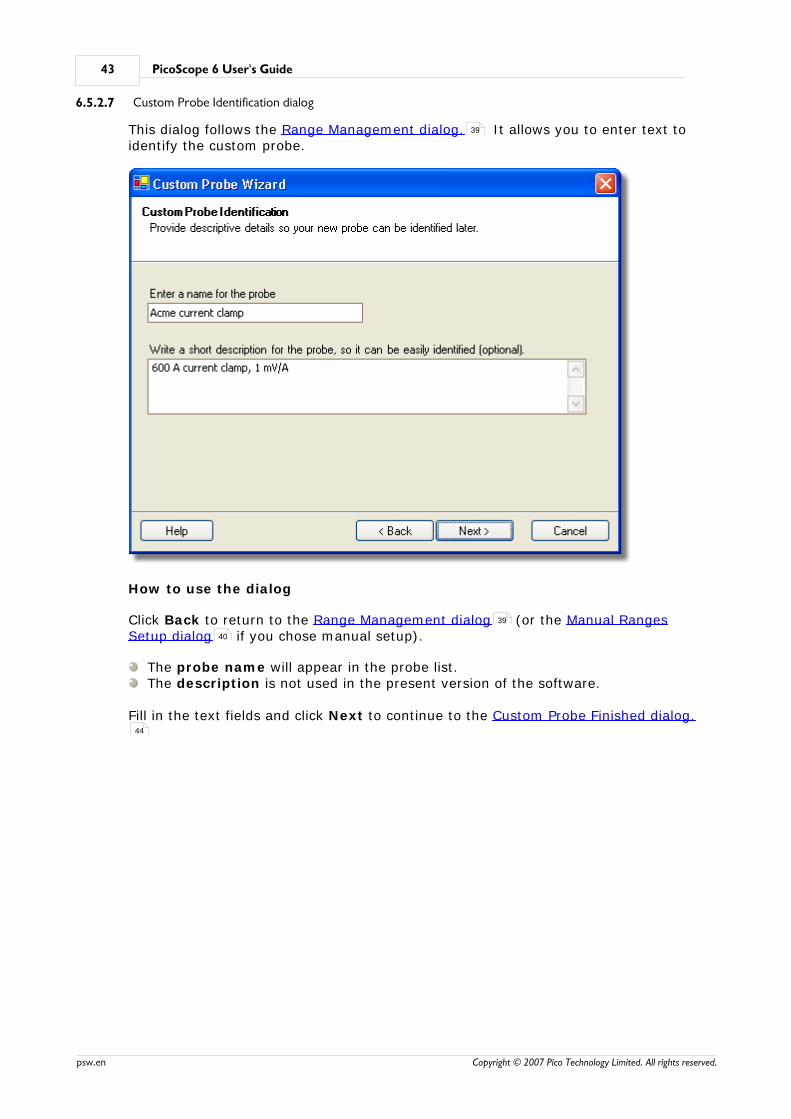
6.5.2.7 Custom Probe Identification dialog
This dialog follows the Range Management dialog. It allows you to enter text toidentify the custom probe.
How to use the dialog
Click Back to return to the Range Management dialog (or the Manual RangesSetup dialog if you chose manual setup).
The probe name will appear in the probe list.The description is not used in the present version of the software.
Fill in the text fields and click Next to continue to the Custom Probe Finished dialog.
39
39
40
44

Menus 44
Copyright © 2007 Pico Technology Limited. All rights reserved. psw.en
6.5.2.8 Custom Probe Finished dialog
This dialog follows the Custom Probe Identification dialog . It displays a summary ofthe custom probe that you have just set up.
How to use the dialog
Click Back to return to the Custom Probe Identification dialog .
Click Finish to accept your custom probe settings and return to the Custom Probesdialog .
6.5.3 Preferences dialog
This dialog allows you to set miscellaneous options for the PicoScope software. Clickone of the tabs on the screen shot below to learn more.
Where to find it
Click the Preferences command in the Tools menu on the Menu bar .
43
43
32
32 21
PicoScope 6 User's Guide45
Copyright © 2007 Pico Technology Limited. All rights reserved.psw.en
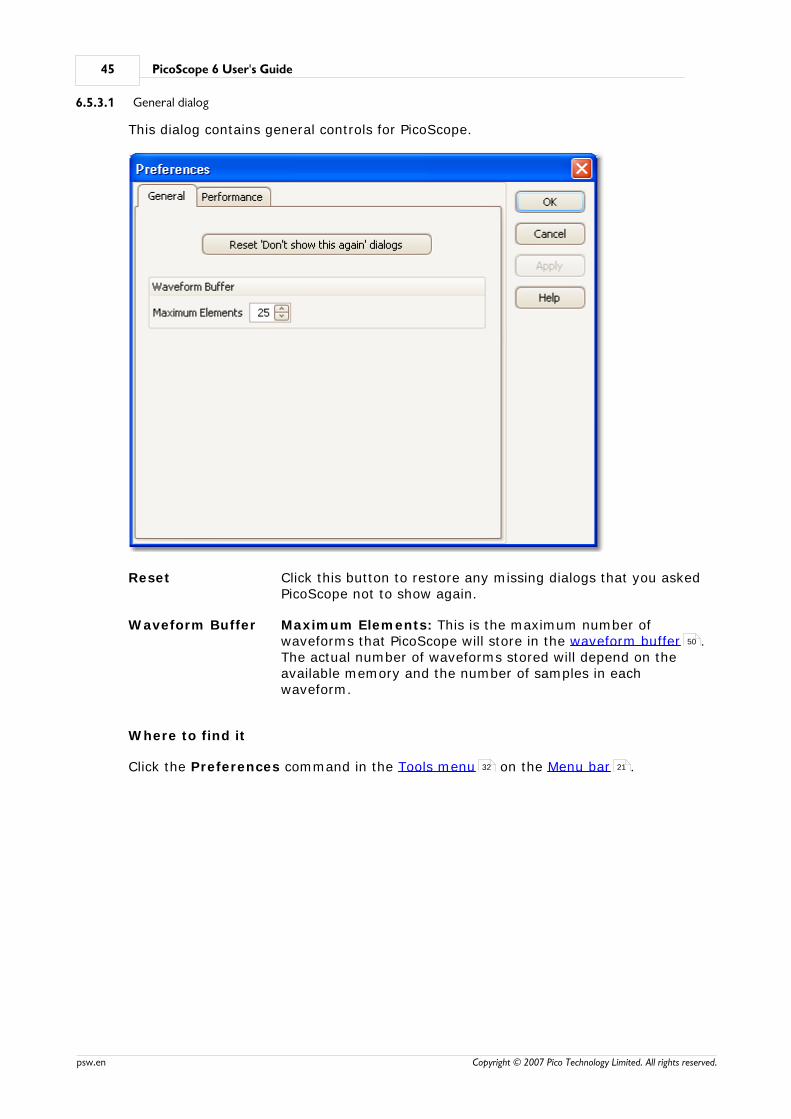
6.5.3.1 General dialog
This dialog contains general controls for PicoScope.
Reset Click this button to restore any missing dialogs that you askedPicoScope not to show again.
Waveform Buffer Maximum Elements: This is the maximum number ofwaveforms that PicoScope will store in the waveform buffer .The actual number of waveforms stored will depend on theavailable memory and the number of samples in eachwaveform.
Where to find it
Click the Preferences command in the Tools menu on the Menu bar .
50
32 21
Menus 46
Copyright © 2007 Pico Technology Limited. All rights reserved. psw.en
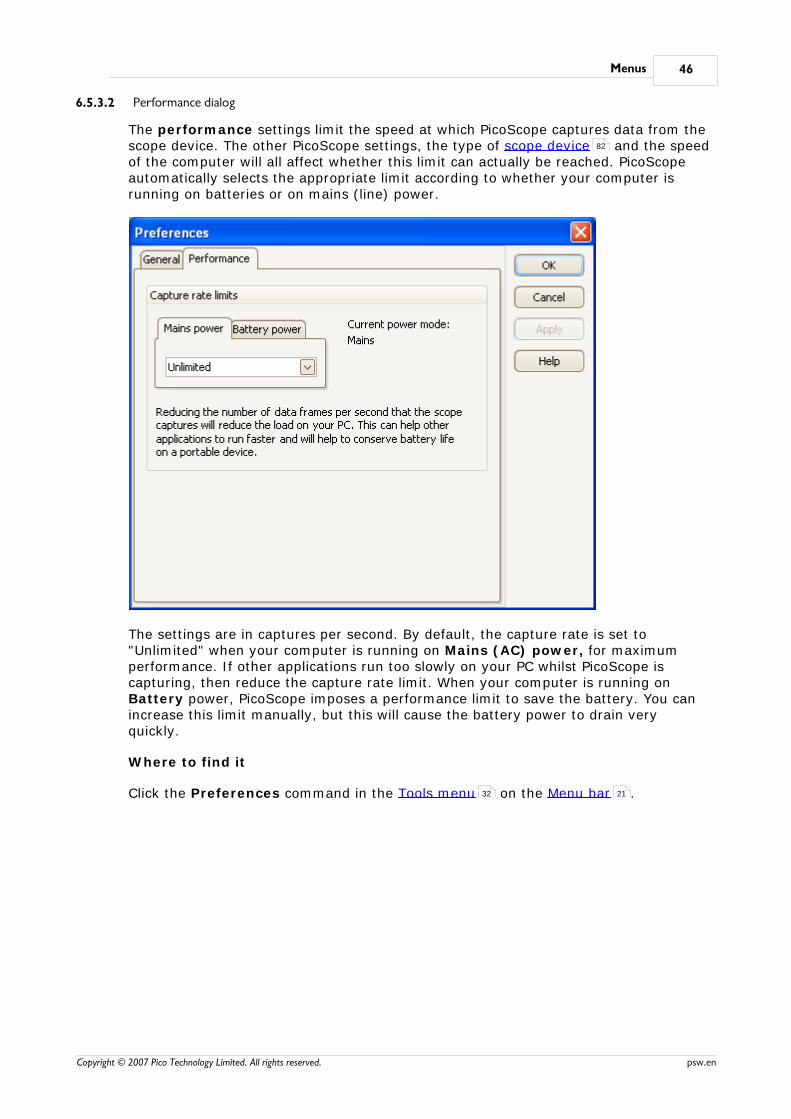
6.5.3.2 Performance dialog
The performance settings limit the speed at which PicoScope captures data from thescope device. The other PicoScope settings, the type of scope device and the speedof the computer will all affect whether this limit can actually be reached. PicoScopeautomatically selects the appropriate limit according to whether your computer isrunning on batteries or on mains (line) power.
The settings are in captures per second. By default, the capture rate is set to"Unlimited" when your computer is running on Mains (AC) power, for maximumperformance. If other applications run too slowly on your PC whilst PicoScope iscapturing, then reduce the capture rate limit. When your computer is running onBattery power, PicoScope imposes a performance limit to save the battery. You canincrease this limit manually, but this will cause the battery power to drain veryquickly.
Where to find it
Click the Preferences command in the Tools menu on the Menu bar .
82
32 21
PicoScope 6 User's Guide47
Copyright © 2007 Pico Technology Limited. All rights reserved.psw.en
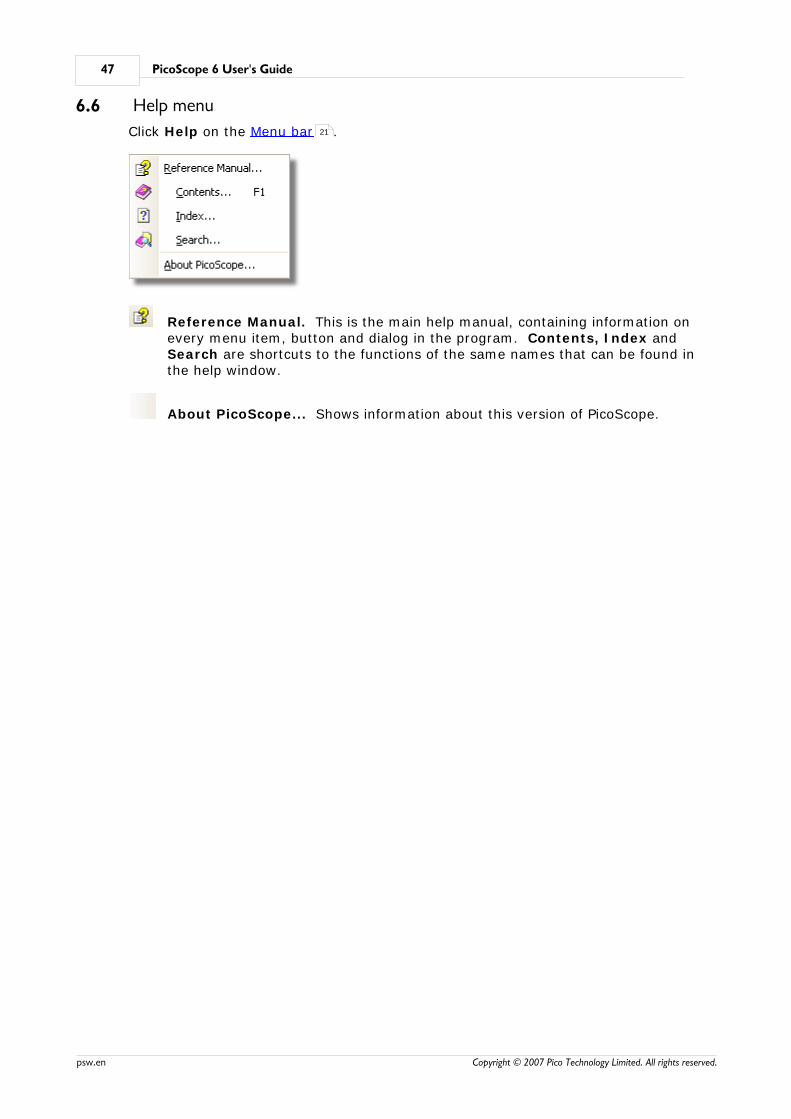
6.6 Help menu
Click Help on the Menu bar .
Reference Manual. This is the main help manual, containing information onevery menu item, button and dialog in the program. Contents, Index andSearch are shortcuts to the functions of the same names that can be found inthe help window.
About PicoScope... Shows information about this version of PicoScope.
21

Menus 48
Copyright © 2007 Pico Technology Limited. All rights reserved. psw.en
6.7 Connect Device dialog
When PicoScope is not sure which scope device to use, it displays a list of all theunits attached to your computer and allows you to select which one to use.
Where to find it
Select the File menu and then the Connect Device command.
See "How to change to a different scope device " if you wish to switch to a differentscope device later.
Procedure
To restrict the selection to a particular series of devices, click on the device drop-down box and select a device series; otherwise, click the Find All button.Wait for a list of devices to appear in the grid.Select one device and click the OK button.PicoScope will open a scope view for the selected scope device.Use the toolbars to set up the scope device and the scope view orspectrum view to display your signals.
Demonstration mode
If you start PicoScope with no scope device connected, the Connect Devicedialog automatically appears and contains a list of Demonstration devices for you tochoose from. Once you have selected a demonstration device and clicked OK,PicoScope adds a Demo Signals toolbar to the main window. Use this toolbar toset up the test signals from your demonstration device.
82
22
70
13
49 82 13
14
82
67

PicoScope 6 User's Guide49
Copyright © 2007 Pico Technology Limited. All rights reserved.psw.en
7 ToolbarsA toolbar is a collection of buttons and controls with related functions. TheMeasurements toolbar , for example, looks like this:
Buffer Navigation toolbarChannel Setup toolbarDemonstration Signals toolbarMeasurements toolbarCapture Setup toolbarSignal Generator toolbarStart / Stop toolbarTriggering ToolbarZooming and Scrolling toolbar
52
50
50
67
52
53
56
59
60
66

Toolbars 50
Copyright © 2007 Pico Technology Limited. All rights reserved. psw.en
7.1 Buffer Navigation toolbar
The Buffer Navigation toolbar allows you to select one waveform from the buffer ofstored waveforms.
The waveform buffer
When you click the Start button or change a capture setting , PicoScope clearsthe waveform buffer and then adds a new waveform to it every time the scope devicecaptures data. This continues until the buffer is full or you click the Stop button.
You can review the waveforms stored in the buffer using these buttons:
First waveform button. Displays waveform 1.
Previous waveform button. Displays the previous waveform in thebuffer.
Waveform number indicator. Shows which waveform is currentlydisplayed, and how many waveforms the buffer holds. You can edit thenumber in the box and press Enter, and PicoScope will jump to thespecified waveform.
Next waveform button. Displays the next waveform in the buffer.
Last waveform button. Displays the last waveform in the buffer.
7.2 Channel Setup toolbar
The Channel Setup toolbar controls the settings for each vertical input channel .The screen shot below shows the toolbar for a four-channel scope device , butdifferent scope devices may have different numbers of channels.
Each channel has its own set of buttons:
Scale Control. Determines the maximum and minimum signallevels at the top and bottom of the Y axis for this channel. Thenumber of options depends on the selected scope device andprobe . If you select Auto, PicoScope will continually adjust thevertical scale so that the height of the waveform fills as much ofthe view as possible.
Coupling Control. Selects AC coupling or DC coupling .
Advanced Options button. Opens the Advanced Options menu with options for probes and scaling.
59 53
59
81
82
82
82
81 82
51 82 51

PicoScope 6 User's Guide51
Copyright © 2007 Pico Technology Limited. All rights reserved.psw.en
7.2.1 Advanced Options menu
The Advanced Options menu appears when you click the Advanced Optionsbutton on the Channels toolbar .
Probe list. Indicates the probe currently in use and andallows you to select a different one. Use it to tell PicoScopewhat type of probe is connected to a channel. By default,the probe is assumed to be x1, which means that a one-volt signal at the input to the probe will appear as one volton the display.
Expand probe list. Click this to select from a list ofprobes.
Open Custom Probes dialog. The Custom Probes dialog allows you to edit your library of custom probes.
These are the axis scaling controls .
7.2.1.1 Axis scaling controls
The axis scaling controls let you change the scale and offset of each vertical axisindependently.
There are two ways to obtain these controls: -
Click the axis scaling button ( ) at the bottom of a vertical axis in a viewClick the probe drop-down menu
Scale control. Increase to magnify the waveform, decrease to reduceit. The vertical axis rescales accordingly so that you can always read
the correct voltage from the axis. Click the reset button ( ) to returnto a scale of 1.0.
50
32
51
51
Toolbars 52
Copyright © 2007 Pico Technology Limited. All rights reserved. psw.en
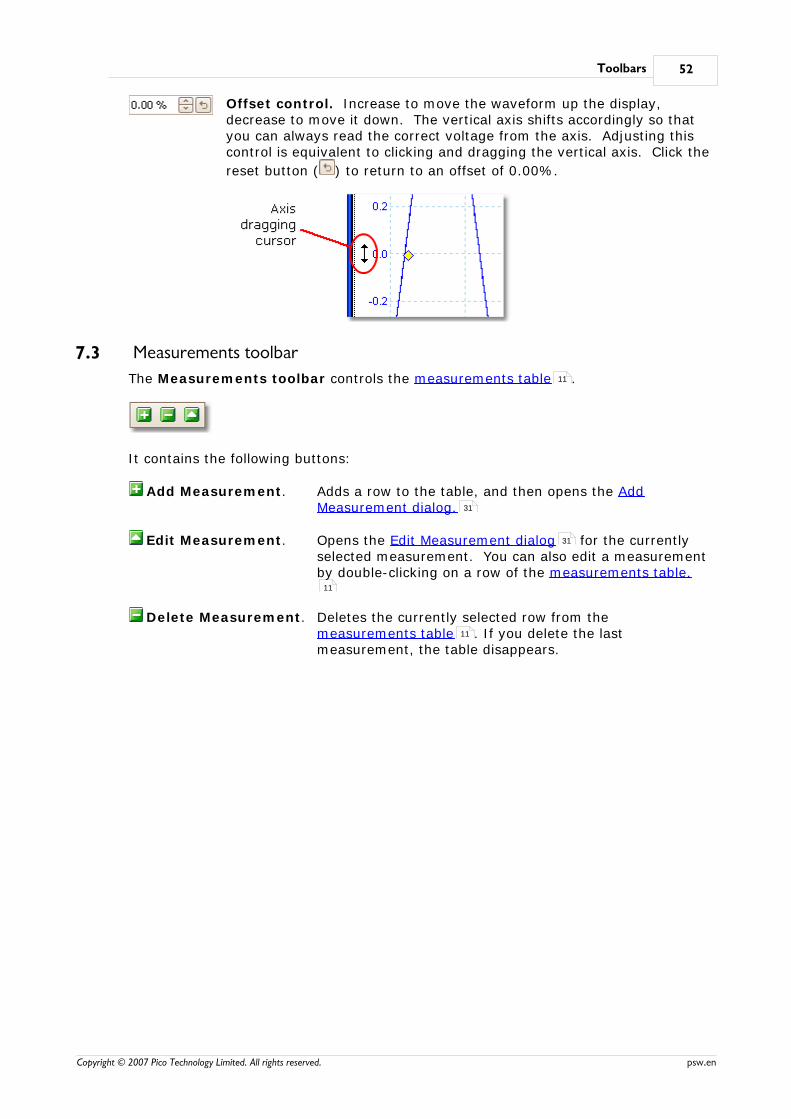
Offset control. Increase to move the waveform up the display,decrease to move it down. The vertical axis shifts accordingly so thatyou can always read the correct voltage from the axis. Adjusting thiscontrol is equivalent to clicking and dragging the vertical axis. Click the
reset button ( ) to return to an offset of 0.00%.
7.3 Measurements toolbar
The Measurements toolbar controls the measurements table .
It contains the following buttons:
Add Measurement. Adds a row to the table, and then opens the AddMeasurement dialog.
Edit Measurement. Opens the Edit Measurement dialog for the currentlyselected measurement. You can also edit a measurementby double-clicking on a row of the measurements table.
Delete Measurement. Deletes the currently selected row from themeasurements table . If you delete the lastmeasurement, the table disappears.
11
31
31
11
11

PicoScope 6 User's Guide53
Copyright © 2007 Pico Technology Limited. All rights reserved.psw.en
7.4 Capture Setup toolbar
The Capture Setup toolbar controls the time-related settings of your oscilloscope. Itlooks like this:
Auto Setup button. Searches for a signal on one of theenabled input channels, then sets up the timebase andsignal range to display the signal correctly.
Timebase control. When the active view is a scopeview, this sets the time represented by a singledivision of the horizontal axis when the zoom factor is100%. The timebases available depend on the type ofscope device you are using.
Choosing a timebase of 200 ms/div or slower causesPicoScope to switch to a different mode of data transfer. The internal details of this are taken care of by PicoScope,but the slow mode limits the sampling rate to a maximumof 1 million samples per second.
Samples control. Sets the maximum number ofsamples that will be captured. If this is larger than thenumber of pixels across the scope view, then you canzoom in to see more detail. The actual number ofsamples captured is displayed on the Properties sheet,and may be different from the number requested here,depending on which timebase is selected.
Spectrum Options button. Appears if a spectrum view is open. It opens the Spectrum Options dialog.
13
66
82
15
14 54
Toolbars 54
Copyright © 2007 Pico Technology Limited. All rights reserved. psw.en
7.4.1 Spectrum Options dialog
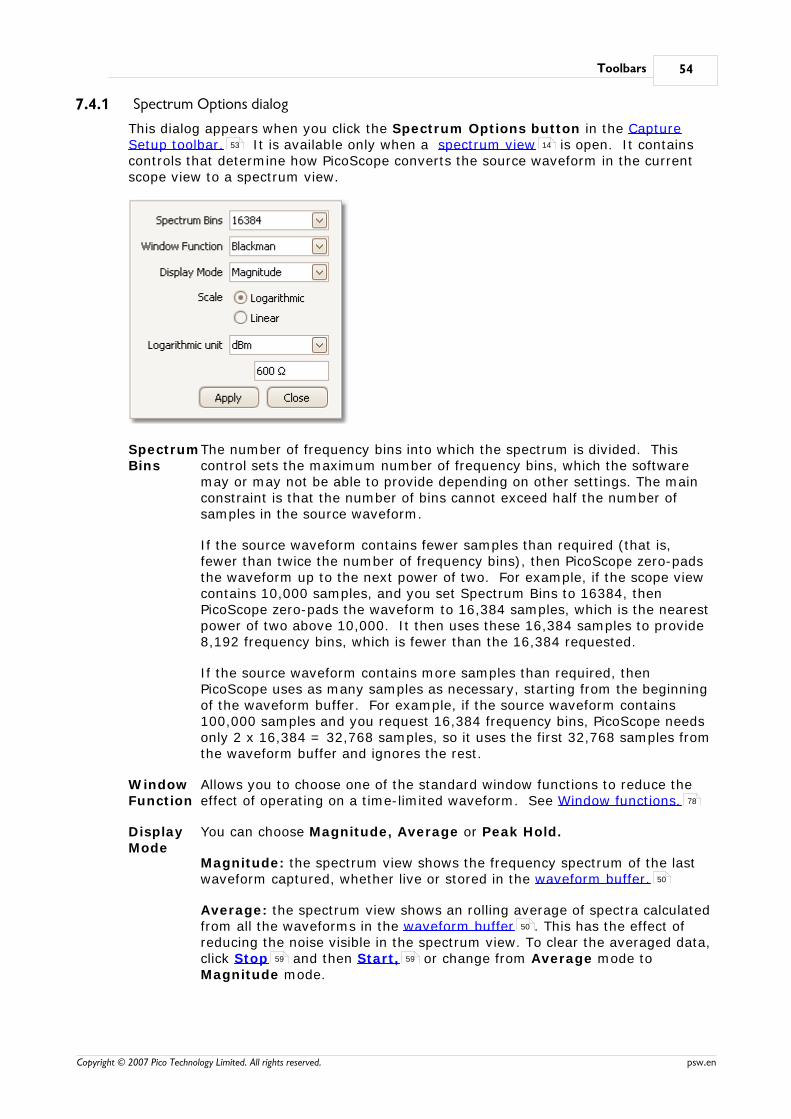
This dialog appears when you click the Spectrum Options button in the CaptureSetup toolbar. It is available only when a spectrum view is open. It containscontrols that determine how PicoScope converts the source waveform in the currentscope view to a spectrum view.
SpectrumBins
The number of frequency bins into which the spectrum is divided. Thiscontrol sets the maximum number of frequency bins, which the softwaremay or may not be able to provide depending on other settings. The mainconstraint is that the number of bins cannot exceed half the number ofsamples in the source waveform.
If the source waveform contains fewer samples than required (that is,fewer than twice the number of frequency bins), then PicoScope zero-padsthe waveform up to the next power of two. For example, if the scope viewcontains 10,000 samples, and you set Spectrum Bins to 16384, thenPicoScope zero-pads the waveform to 16,384 samples, which is the nearestpower of two above 10,000. It then uses these 16,384 samples to provide8,192 frequency bins, which is fewer than the 16,384 requested.
If the source waveform contains more samples than required, thenPicoScope uses as many samples as necessary, starting from the beginningof the waveform buffer. For example, if the source waveform contains100,000 samples and you request 16,384 frequency bins, PicoScope needsonly 2 x 16,384 = 32,768 samples, so it uses the first 32,768 samples fromthe waveform buffer and ignores the rest.
WindowFunction
Allows you to choose one of the standard window functions to reduce theeffect of operating on a time-limited waveform. See Window functions.
DisplayMode
You can choose Magnitude, Average or Peak Hold.
Magnitude: the spectrum view shows the frequency spectrum of the lastwaveform captured, whether live or stored in the waveform buffer.
Average: the spectrum view shows an rolling average of spectra calculatedfrom all the waveforms in the waveform buffer . This has the effect ofreducing the noise visible in the spectrum view. To clear the averaged data,click Stop and then Start, or change from Average mode toMagnitude mode.
53 14
78
50
50
59 59

PicoScope 6 User's Guide55
Copyright © 2007 Pico Technology Limited. All rights reserved.psw.en
Peak Hold: the spectrum view shows a rolling maximum of the spectracalculated from all the waveforms in the buffer. In this mode, theamplitude of any frequency band in the spectrum view will either stay thesame or increase, but never decrease, over time. To clear the peak holddata, click Stop and then Start, or change from Peak Hold mode toMagnitude mode.
Note: when you switch to Average or Peak Hold mode, there may be anoticeable delay while PicoScope processes the entire contents of thewaveform buffer, which may contain many waveforms, to build up theinitial display. If this occurs, a progress bar appears at the bottom of thescreen to show that PicoScope is busy:
Scale Specifies the labelling and scaling of the vertical (signal) axis. This can beone of the following:
Linear: The vertical axis is calibrated in volts.
Logarithmic: The vertical axis is calibrated in decibels, referred tothe level selected below in the Logarithmic unitcontrol.
dBV: Reference level is 1 volt.
dBu: Reference level is 1 milliwatt with aload resistance of 600 ohms.
dBm: Reference level is one milliwatt. Youcan enter the load impedance forthis calculation in the text boxbelow the Logarithmic unitcontrol.
Arbitrary dB: Reference level is an arbitraryvoltage, which you can specify inthe box below the Logarithmicunit control.
59 59

Toolbars 56
Copyright © 2007 Pico Technology Limited. All rights reserved. psw.en
7.5 Signal Generator toolbar
The Signal Generator toolbar allows you to set up your scope device 's test signaloutput. This toolbar appears only when you are using a scope device with a built-insignal generator.
Clicking the Signal Generator button opens the Signal Generator dialog .
7.5.1 Signal Generator dialog
This dialog controls the scope device's built-in signal generator. It is not available ifthe selected scope device does not have a signal generator. The number of controls inthe dialog may vary according to the type of scope device in use.
Signal generator dialog for thePicoScope 5204
82
56
82
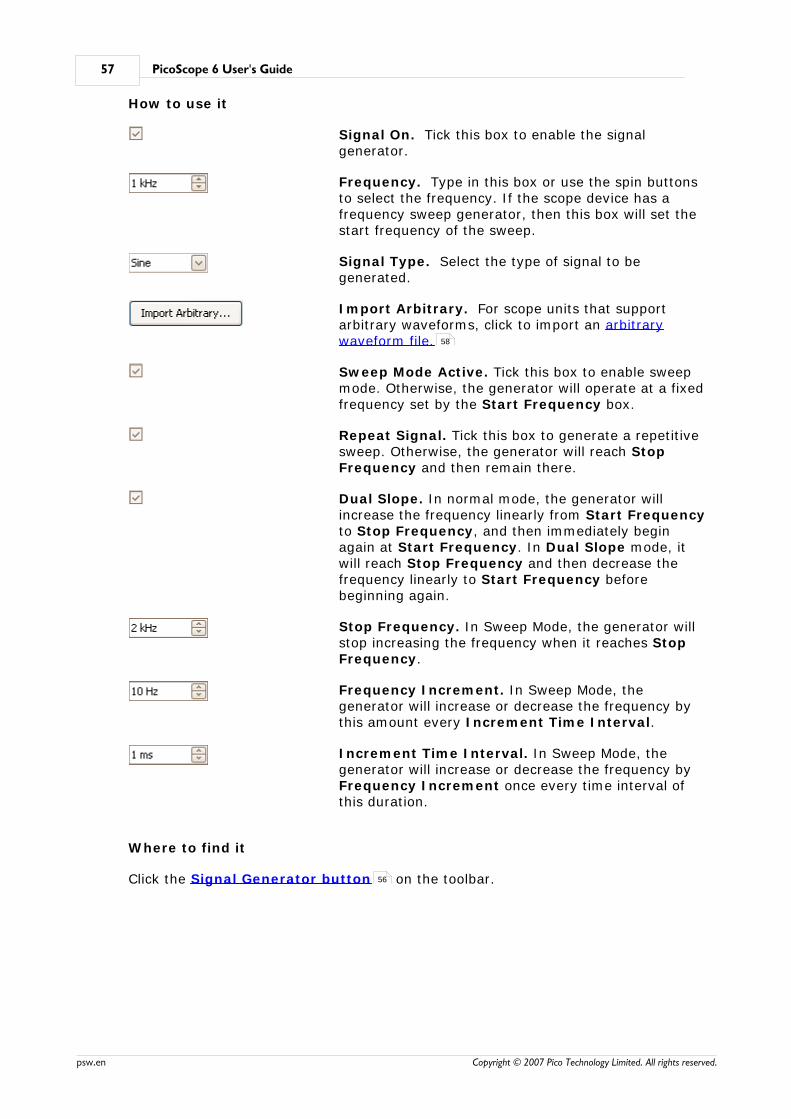
PicoScope 6 User's Guide57
Copyright © 2007 Pico Technology Limited. All rights reserved.psw.en
How to use it
Signal On. Tick this box to enable the signalgenerator.
Frequency. Type in this box or use the spin buttonsto select the frequency. If the scope device has afrequency sweep generator, then this box will set thestart frequency of the sweep.
Signal Type. Select the type of signal to begenerated.
Import Arbitrary. For scope units that supportarbitrary waveforms, click to import an arbitrarywaveform file.
Sweep Mode Active. Tick this box to enable sweepmode. Otherwise, the generator will operate at a fixedfrequency set by the Start Frequency box.
Repeat Signal. Tick this box to generate a repetitivesweep. Otherwise, the generator will reach StopFrequency and then remain there.
Dual Slope. In normal mode, the generator willincrease the frequency linearly from Start Frequencyto Stop Frequency, and then immediately beginagain at Start Frequency. In Dual Slope mode, itwill reach Stop Frequency and then decrease thefrequency linearly to Start Frequency beforebeginning again.
Stop Frequency. In Sweep Mode, the generator willstop increasing the frequency when it reaches StopFrequency.
Frequency Increment. In Sweep Mode, thegenerator will increase or decrease the frequency bythis amount every Increment Time Interval.
Increment Time Interval. In Sweep Mode, thegenerator will increase or decrease the frequency by Frequency Increment once every time interval ofthis duration.
Where to find it
Click the Signal Generator button on the toolbar.
58
56

Toolbars 58
Copyright © 2007 Pico Technology Limited. All rights reserved. psw.en
7.5.2 Arbitrary waveform files
Some PicoScope PC Oscilloscopes, such as the PicoScope 5203 and PicoScope 5204,have an arbitrary waveform generator (AWG). PicoScope can program this with astandard waveform, such as a sine or a square wave, or can import an arbitrarywaveform from a text file.
A text file for PicoScope 6 is a simple list of decimal floating-point values, as in thisexample:
0.00.30.90.60.60.0-0.30.00.00.0
®
The file may have between 10 and 8,192 values, as many it needs to define thewaveform. Each line may have more than one value, in which case the values must beseparated by tabs or commas.
The values are samples between –1.0 and +1.0 and must be equally spaced in time.The output is scaled to the amplitude selected in the Signal Generator dialog. andthe selected offset is added if necessary. For example, if the signal generatoramplitude is set to "1 V", then a sample value of -1.0 corresponds to an output of -1.0 V and a sample of +1.0 corresponds to an output of +1.0 V.
The file should contain exactly one cycle of the waveform, which will then be playedback at the speed specified in the Signal Generator dialog . In the example above,the signal generator was set to 1 kHz, so one cycle of the waveform lasts for 1 ms. There are 10 samples in the waveform, so each sample lasts for 0.1 ms.
Using files saved from PicoScope 6
As PicoScope 6 can export CSV and TXT files, you can capture a waveform andthen play it back using the arbitrary waveform generator. You must first modify thefile by removing the header rows and time values, so that its format matches theexample above.
81
56
56
24

PicoScope 6 User's Guide59
Copyright © 2007 Pico Technology Limited. All rights reserved.psw.en
7.6 Start / Stop toolbar
The Start / Stop toolbar allows you to start and stop the scope device . The Startbutton is highlighted if the scope device is sampling; otherwise, the Stop button ishighlighted.
Start button. Start sampling.
Stop button. Click to stop sampling.
You can also use the space bar to start and stop sampling.
82

Toolbars 60
Copyright © 2007 Pico Technology Limited. All rights reserved. psw.en
7.7 Triggering toolbar
The Triggering toolbar tells the scope device when to start capturing data.
Trigger Mode.
None: PicoScope acquires waveforms repeatedlywithout waiting for specific events.
Auto: PicoScope tries to wait for a trigger eventbefore displaying data. If there is no trigger eventwithin a specified time, it displays data anyway. Itrepeats this process until you click the Stop button. "Auto" mode does not set up the trigger levelautomatically; you still need to do this yourself.
Repeat: PicoScope waits for a trigger event beforedisplaying data; but if there is no trigger event, itdisplays nothing. It repeats this process until youclick the Stop button .
Single: PicoScope waits once for a trigger event,then stops sampling. To repeat a single trigger, clickthe Start button.
ETS: Equivalent Time Sampling. The scope view captures several cycles of a repetitive signal, then
combines the results to produce a single waveformwith higher time-resolution than a single capture. For accurate results, the signal must be perfectlyrepetitive and the trigger must be stable.
If you select ETS when an Advanced Trigger typeis enabled, the trigger type will revert to SimpleEdge and the Advanced Triggering button will bedisabled.
Advanced Triggering. Click to open the AdvancedTriggering dialog, which gives you extra triggertypes beyond the simple edge trigger. If this buttonis disabled, it is because you have selected either None or ETS in the trigger mode control. If youwant to enable the Advanced Triggering button,set the control to another trigger mode, such as Auto, Repeat or Single.
Trigger Source. This is the channel that PicoScopemonitors for the trigger condition.
Rising Edge. Click to trigger on the rising edge ofthe waveform.
Falling Edge. Click to trigger on the falling edge ofthe waveform.
59
59
59
82
13
62
62
82
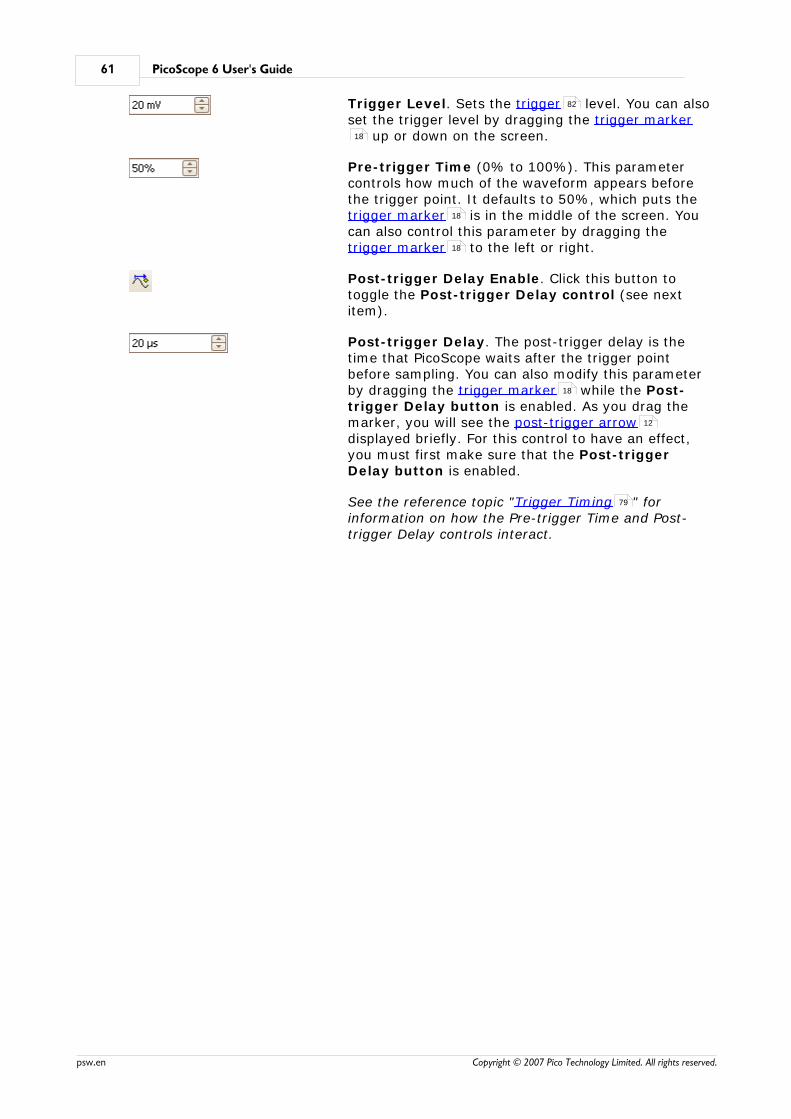
PicoScope 6 User's Guide61
Copyright © 2007 Pico Technology Limited. All rights reserved.psw.en
Trigger Level. Sets the trigger level. You can alsoset the trigger level by dragging the trigger marker
up or down on the screen.
Pre-trigger Time (0% to 100%). This parametercontrols how much of the waveform appears beforethe trigger point. It defaults to 50%, which puts the trigger marker is in the middle of the screen. Youcan also control this parameter by dragging the trigger marker to the left or right.
Post-trigger Delay Enable. Click this button totoggle the Post-trigger Delay control (see nextitem).
Post-trigger Delay. The post-trigger delay is thetime that PicoScope waits after the trigger pointbefore sampling. You can also modify this parameterby dragging the trigger marker while the Post-trigger Delay button is enabled. As you drag themarker, you will see the post-trigger arrowdisplayed briefly. For this control to have an effect,you must first make sure that the Post-triggerDelay button is enabled.
See the reference topic "Trigger Timing " forinformation on how the Pre-trigger Time and Post-trigger Delay controls interact.
82
18
18
18
18
12
79

Toolbars 62
Copyright © 2007 Pico Technology Limited. All rights reserved. psw.en
7.7.1 Advanced Triggering dialog
This dialog appears when you click the Advanced Triggering button in theTriggering toolbar. It allows you to set up more complex trigger types than simpleedge-triggering.
Advanced trigger types list. This controllists all the available advanced trigger types. Click on the condition you require, and adiagram and description will appear on theright of the dialog.
If ETS triggering is enabled in the triggeringtoolbar , then selecting any trigger typeexcept Simple Edge switches off ETS mode.
Advanced triggering options. The optionsavailable depend on the trigger type selected.See Advanced trigger types. Instructionsand diagrams also appear in the dialog.
60
63
82
60
63

PicoScope 6 User's Guide63
Copyright © 2007 Pico Technology Limited. All rights reserved.psw.en
7.7.2 Advanced trigger types
The advanced trigger types can be switched on in the Advanced Triggeringdialog.
For all trigger types, the first step is to select which signal the scope should use as thetrigger; so set Source to either A, B, Ext or AuxIO. These names correspond to theBNC input connectors on the scope device. Then choose one of the trigger typesbelow.
Simple Edge. This type provides the same Rising and Falling edge triggersthat are available from the Triggering toolbar. It is included in this dialog asan alternative method of setting up the Simple Edge trigger.
You can set the trigger Threshold while in the advanced triggering dialog, or alternatively you can drag the Trigger marker on the scope view.
This is the only trigger type that is compatible with ETS mode.
Advanced Edge. This trigger type adds an extra Rising or Falling edgetrigger, and Hysteresis, to the Simple Edge trigger. The Rising or Fallingoption triggers on both edges of a waveform, and is useful for monitoringpulses of both polarities at once. Hysteresis is described in a separatetopic.
Window. This trigger type detects when the signal enters or leaves a specifiedvoltage window. The Direction control specifies whether the trigger shoulddetect the signal entering the window, leaving it, or both. Threshold 1 andThreshold 2 are the upper and lower voltage limits of the window. The orderin which you specify the two voltages does not matter. Hysteresis can beset to reduce the number of false triggers on a noisy signal, and is described ina separate topic.
Pulse Width. This trigger type detects pulses of a specified width.
First set the Pulse Direction to either Positive or Negative according to thepolarity of the pulse you are interested in.
Next, set one of the four Condition options:
Greater than triggers on pulses wider than the specified time.
Less than triggers on pulses that are narrower (useful for findingglitches).
Inside time range triggers on pulses that are wider than Time 1 butno wider than Time 2 (useful for finding pulses that meet aspecification).
Outside time range does the opposite: it triggers on pulses that areeither narrower than Time 1 or wider than Time 2 (useful for findingpulses that violate a specification).
Next, set the trigger Threshold in volts or other units, or drag the Triggermarker on the scope view.
Finally, set up Time 1 (and Time 2 if present) to define the pulse width.
62
60
18
82
65
65
18
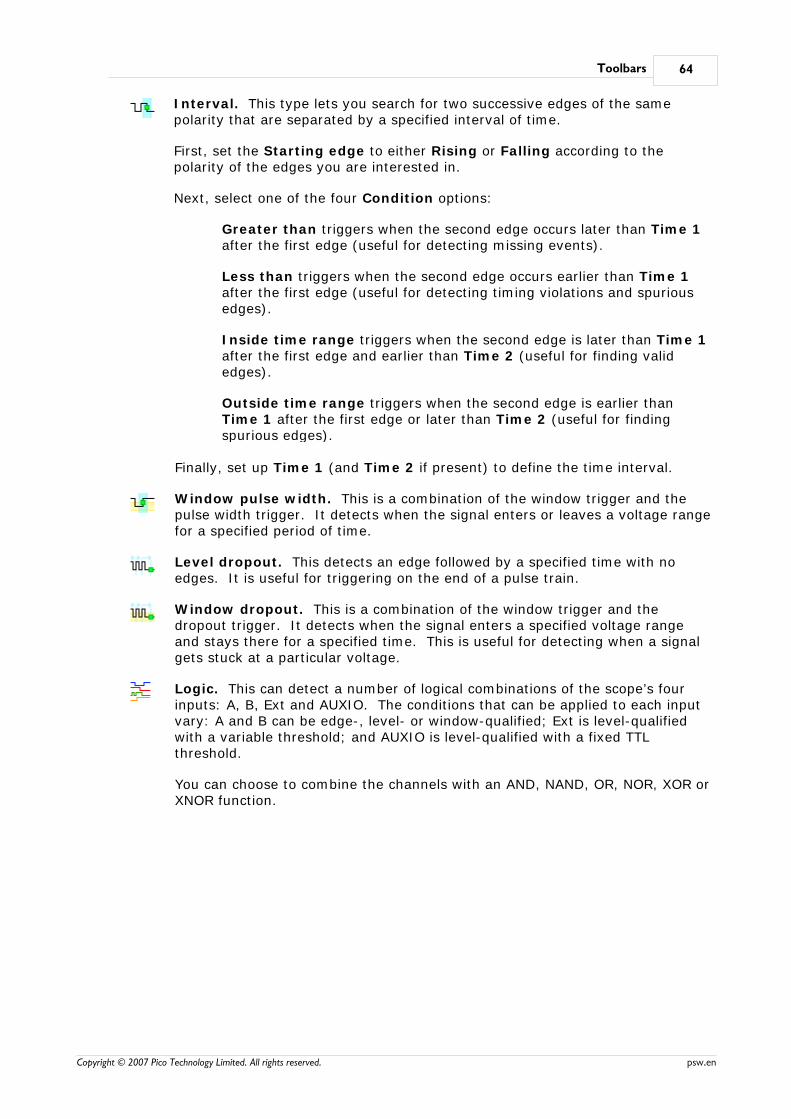
Toolbars 64
Copyright © 2007 Pico Technology Limited. All rights reserved. psw.en
Interval. This type lets you search for two successive edges of the samepolarity that are separated by a specified interval of time.
First, set the Starting edge to either Rising or Falling according to thepolarity of the edges you are interested in.
Next, select one of the four Condition options:
Greater than triggers when the second edge occurs later than Time 1after the first edge (useful for detecting missing events).
Less than triggers when the second edge occurs earlier than Time 1after the first edge (useful for detecting timing violations and spuriousedges).
Inside time range triggers when the second edge is later than Time 1after the first edge and earlier than Time 2 (useful for finding validedges).
Outside time range triggers when the second edge is earlier thanTime 1 after the first edge or later than Time 2 (useful for findingspurious edges).
Finally, set up Time 1 (and Time 2 if present) to define the time interval.
Window pulse width. This is a combination of the window trigger and thepulse width trigger. It detects when the signal enters or leaves a voltage rangefor a specified period of time.
Level dropout. This detects an edge followed by a specified time with noedges. It is useful for triggering on the end of a pulse train.
Window dropout. This is a combination of the window trigger and thedropout trigger. It detects when the signal enters a specified voltage rangeand stays there for a specified time. This is useful for detecting when a signalgets stuck at a particular voltage.
Logic. This can detect a number of logical combinations of the scope’s fourinputs: A, B, Ext and AUXIO. The conditions that can be applied to each inputvary: A and B can be edge-, level- or window-qualified; Ext is level-qualifiedwith a variable threshold; and AUXIO is level-qualified with a fixed TTLthreshold.
You can choose to combine the channels with an AND, NAND, OR, NOR, XOR orXNOR function.

PicoScope 6 User's Guide65
Copyright © 2007 Pico Technology Limited. All rights reserved.psw.en
7.7.2.1 Hysteresis
Hysteresis is a feature of the advanced trigger types in PicoScope 6 that reducesfalse triggering on noisy signals. When hysteresis is enabled, a second triggerthreshold voltage is used in addition to the main trigger threshold. The trigger firesonly when the signal crosses the two thresholds in the correct order. The firstthreshold arms the trigger, and the second causes it to fire. An example will help toillustrate how this works.
Noisy signal with a single threshold
Consider the very noisy signal above. It is difficult to trigger reliably on this signalwith a normal rising edge trigger because it crosses the trigger threshold, the red linein this picture, several times in one cycle. If we zoom in on the highlighted parts ofthe signal, we will see how hysteresis can help.
Noisy signal with hysteresis threshold
In these zoomed-in views, the original threshold is the lower red line. The upper redline is the second threshold used by the hysteresis trigger.
The signal rises across the lower threshold at (1) and (2), arming the trigger but notfiring it. At (3) the signal finally crosses the upper threshold, firing the trigger. Onthe falling edge of the signal, at (4) and (5), rising edges of noise pulses cause thesignal to cross the upper and lower thresholds, but in the wrong order, so the triggeris not armed and does not fire. Thus the trigger occurs at only one well-defined pointin the cycle (3), despite the noise on the signal.
Hysteresis is enabled by default for all the advanced trigger types. The Hysteresiscontrols in the Advanced triggering dialog let you change the hysteresis voltage as
a percentage of full scale. The trigger marker shows the size of the hysteresiswindow.
63
62
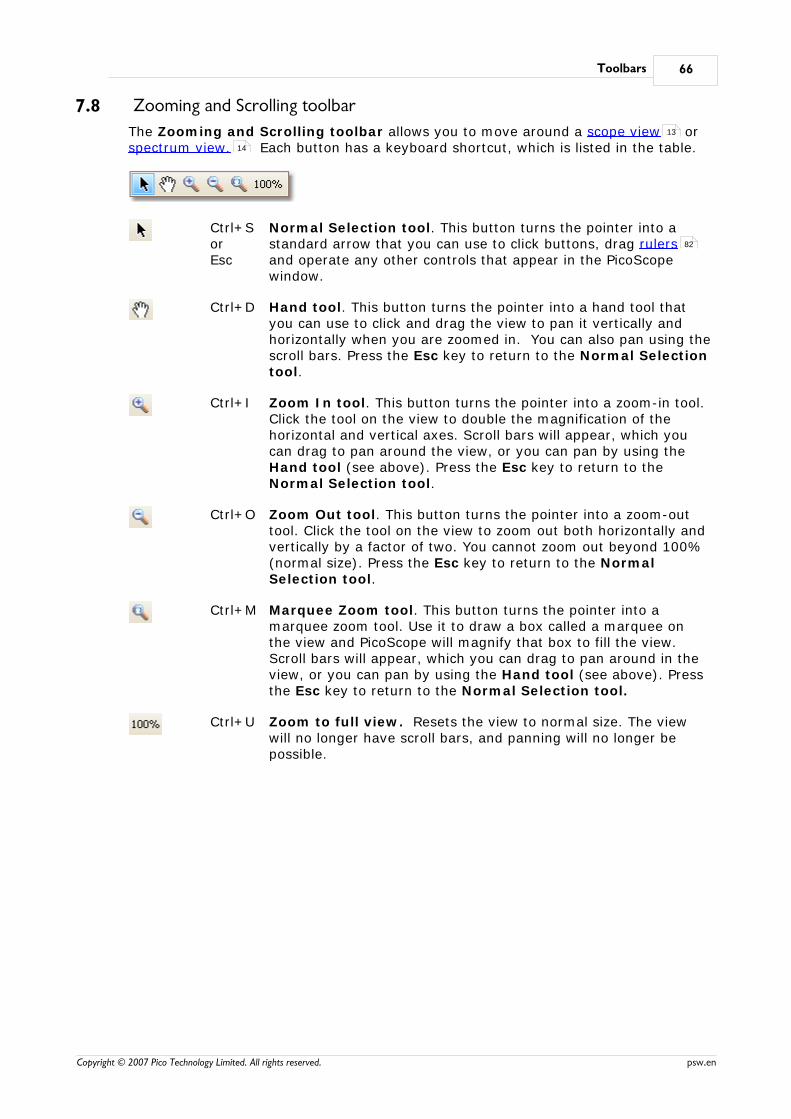
Toolbars 66
Copyright © 2007 Pico Technology Limited. All rights reserved. psw.en
7.8 Zooming and Scrolling toolbar
The Zooming and Scrolling toolbar allows you to move around a scope view orspectrum view. Each button has a keyboard shortcut, which is listed in the table.
Ctrl+SorEsc
Normal Selection tool. This button turns the pointer into astandard arrow that you can use to click buttons, drag rulersand operate any other controls that appear in the PicoScopewindow.
Ctrl+D Hand tool. This button turns the pointer into a hand tool thatyou can use to click and drag the view to pan it vertically andhorizontally when you are zoomed in. You can also pan using thescroll bars. Press the Esc key to return to the Normal Selectiontool.
Ctrl+I Zoom In tool. This button turns the pointer into a zoom-in tool.Click the tool on the view to double the magnification of thehorizontal and vertical axes. Scroll bars will appear, which youcan drag to pan around the view, or you can pan by using the Hand tool (see above). Press the Esc key to return to theNormal Selection tool.
Ctrl+O Zoom Out tool. This button turns the pointer into a zoom-outtool. Click the tool on the view to zoom out both horizontally andvertically by a factor of two. You cannot zoom out beyond 100%(normal size). Press the Esc key to return to the NormalSelection tool.
Ctrl+M Marquee Zoom tool. This button turns the pointer into amarquee zoom tool. Use it to draw a box called a marquee onthe view and PicoScope will magnify that box to fill the view.Scroll bars will appear, which you can drag to pan around in theview, or you can pan by using the Hand tool (see above). Pressthe Esc key to return to the Normal Selection tool.
Ctrl+U Zoom to full view. Resets the view to normal size. The viewwill no longer have scroll bars, and panning will no longer bepossible.
13
14
82

PicoScope 6 User's Guide67
Copyright © 2007 Pico Technology Limited. All rights reserved.psw.en
7.9 Demonstration Signals toolbar
The Demonstration Signals toolbar allows you to set up test signals so that youcan experiment with PicoScope when no scope device is connected. To use thisfeature, close PicoScope, unplug all scope devices and then restart the program.PicoScope will prompt you to select a demonstration device using the Connect Devicedialog .
When you click the button, a drop-down list of all the available channels in yourdemonstration device will appear, like this:
Click one of the channels to open the Demonstration Signals dialog, which willallow you to set up a signal from that channel.
7.9.1 Demonstration Signals dialog
This dialog controls one channel of the demonstration signal generator, a feature ofPicoScope that creates a variety of test signals to simulate a scope device. Open it byclicking the Demo Signals button on the Demonstration Signals toolbar andthen selecting a channel. It is available only when you start PicoScope with no scopedevice connected to your computer, and then select a scope device type of "Demo"in the Connect Device dialog .
Signal On: Tick this box to enable the demonstration signal generator.
Frequency: Type your desired frequency in hertz here, or use the spinbuttons.
Amplitude: Type your desired amplitude in millivolts here, or use thespin buttons.
Offset: Enter a number here to add a d.c. offset to the demo signal. Bydefault, the demo signals have a mean value of zero volts.
48
67
67
82
48
Toolbars 68
Copyright © 2007 Pico Technology Limited. All rights reserved. psw.en
Where to find it
Click the Demo Signals button on the Demonstration Signals toolbar. Youmust have previously selected a "Demo" scope device type in the Connect Devicedialog.
67
82
48

PicoScope 6 User's Guide69
Copyright © 2007 Pico Technology Limited. All rights reserved.psw.en
8 How to...This chapter explains how to achieve some common tasks.
How to...
Change to a different scope deviceUse rulers to measure a signalMeasure a time differenceMove a viewHow to set up the spectrum view
70
70
71
72
74

How to... 70
Copyright © 2007 Pico Technology Limited. All rights reserved. psw.en
8.1 How to change to a different scope device
Close PicoScope Unplug the old scope device Plug in the new scope device Restart PicoScope
PicoScope will detect that the scope device has changed and will immediately startusing the new scope device. If there is more than one scope device connected, the Connect Device dialog will appear to let you choose a scope.
8.2 How to use rulers to measure a signal
Using a single ruler for signal-to-ground measurements
Look at the Channels toolbar to find the colour code for the channel you wishto measure:
Find the ruler handle (the small coloured square in the top-left or top-right cornerof the scope view or spectrum view ) of this colour:
Drag the ruler handle downwards. A signal ruler (horizontal broken line) willappear across the view. Release the ruler handle when the ruler is where you wantit.
Look at the ruler legend (the small table that appears on the view). It shouldhave a row marked by a small coloured square matching the colour of your rulerhandle. The first column shows the signal level of the ruler.
Using two rulers for differential measurements
Follow the steps above for "using a single ruler".Drag the second ruler handle of the same colour downwards until its ruler is at thesignal level to be measured.Look at the ruler legend again. The second column now shows the signal level ofthe second ruler, and the third column shows the difference between the tworulers.
82
48
50 81
13 14
19
12
12
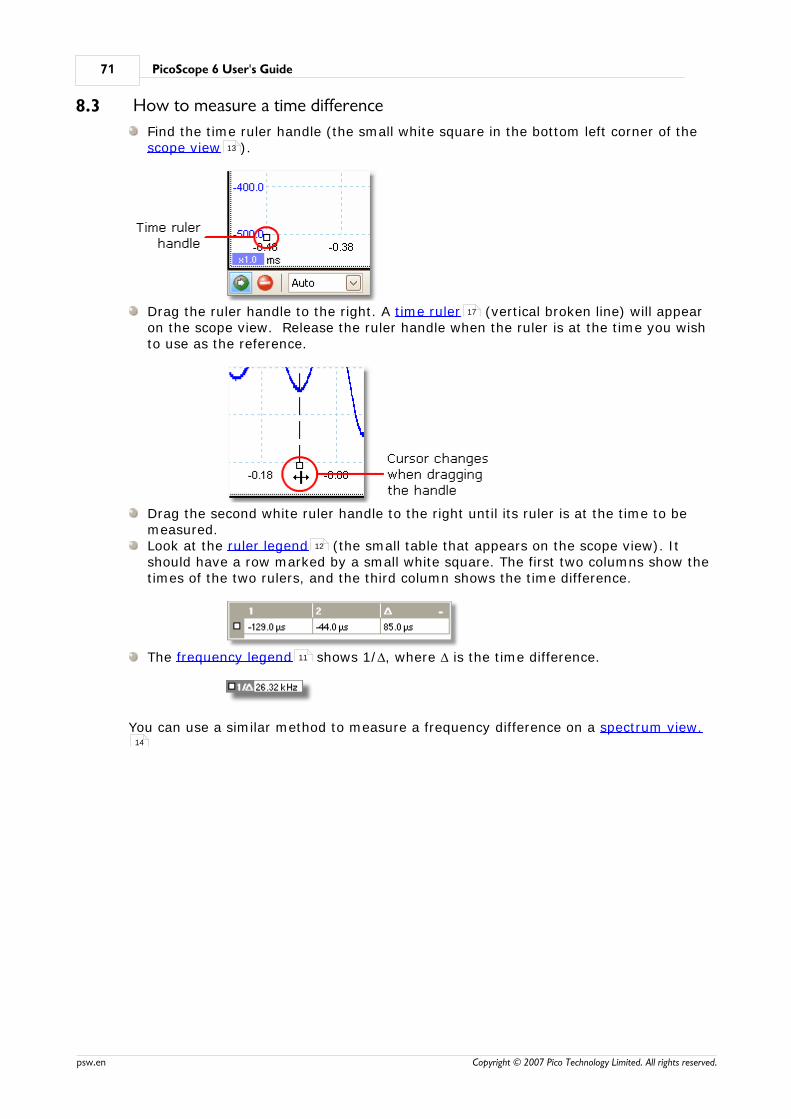
PicoScope 6 User's Guide71
Copyright © 2007 Pico Technology Limited. All rights reserved.psw.en
8.3 How to measure a time difference
Find the time ruler handle (the small white square in the bottom left corner of thescope view ).
Drag the ruler handle to the right. A time ruler (vertical broken line) will appearon the scope view. Release the ruler handle when the ruler is at the time you wishto use as the reference.
Drag the second white ruler handle to the right until its ruler is at the time to bemeasured.Look at the ruler legend (the small table that appears on the scope view). Itshould have a row marked by a small white square. The first two columns show thetimes of the two rulers, and the third column shows the time difference.
The frequency legend shows 1/D, where D is the time difference.
You can use a similar method to measure a frequency difference on a spectrum view.
13
17
12
11
14

How to... 72
Copyright © 2007 Pico Technology Limited. All rights reserved. psw.en
8.4 How to move a view
You can easily drag a view from one viewport to another. This example showsfour viewports. The viewports contain scope views or spectrum views called"Scope 1" to "Scope 4". Suppose you wish to move the "Scope 4" view to the top leftviewport.
1. Click on the name tab of the "Scope 4" view andhold the mouse button down.
2. Drag the mouse pointer to the new location nextto the name tab of the "Scope 1" view.
3. Release the mouse button, and the view willmove to the new location.
19 82
13 14

PicoScope 6 User's Guide73
Copyright © 2007 Pico Technology Limited. All rights reserved.psw.en
8.5 How to scale and offset a signal
PicoScope offers three ways to change the size and position of a signal during or aftercapture. These methods apply equally to scope views and spectrum views.
Use global zooming and scrolling
To move all signals at once, use the global zoom and pan controls on the zooming andscrolling toolbar.
This is usually the quickest way to put your signals where you want them. When aview is zoomed in, it has vertical and horizontal scroll bars that let you move thesignals around as a group. You can also use the hand tool.
Use axis scaling and offset
Use this method when you want to apply an accurate scale and offset to only onechannel.
Click the scaling indicator at the bottom of the axis you wish to modify, andthe axis scaling controls will appear. To adjust the offset without using the axisscaling controls, click on the vertical axis and drag it up or down.
Define a custom probe
This is the most complex method, but saves time if you use a particular scope probefrequently. You only need to set it up once for each probe, and you can then easilyretrieve it whenever you use that probe. See the Custom probe topic for details.
13 14
66
51
51
32

How to... 74
Copyright © 2007 Pico Technology Limited. All rights reserved. psw.en
8.6 How to set up the spectrum view
Creating a spectrum view
First, ensure that the trigger mode is not set to ETS, as it is not possible toopen a spectrum view in ETS trigger mode.
There are two ways to open a spectrum view:
Go to the Views menu select Add view, then select Spectrum.
Right-click on any view , select Add view, then select Spectrum. The menu issimilar to the Views menu shown above.
Configuring the spectrum view
See Spectrum Settings dialog.
Selecting the source data
PicoScope can produce a spectrum view based on either live or stored data. IfPicoScope is running (the Start button is pressed in), the spectrum viewrepresents live data. Otherwise, with PicoScope stopped (the Stop button pressedin), the view represents data stored in the currently selected page of the waveformbuffer. When PicoScope is stopped, you can use the buffer controls to scrollthrough the buffer and the spectrum view will be recalculated from the waveformcurrently selected.
60 82
14
29
13
29
54
14
59
59
50
PicoScope 6 User's Guide75
Copyright © 2007 Pico Technology Limited. All rights reserved.psw.en
9 ReferenceThis is where you can find detailed information on the operation of PicoScope.
Measurement types Trigger timing Keyboard shortcuts Glossary
9.1 Measurement types
The Edit Measurement dialog allows you to select one of a range of measurementsthat PicoScope can calculate for the selected view. The list of measurements availabledepends on whether the view is a scope view (see scope measurements ) or aspectrum view (see spectrum measurements )
9.1.1 Scope measurements
AC RMS: The root mean square (RMS) value of the AC component of thewaveform. This measurement subtracts any DC offset from thewaveform. It is equivalent to a ripple measurement.
Cycle Time: PicoScope will attempt to find a repeated pattern in thewaveform and measure the duration of one cycle.
DC Average: The mean value of the waveform.
Duty Cycle: The amount of time that a signal spends above its mean value,expressed as a percentage of the signal period. A duty cycle of50% means that the high time is equal to the low time.
Falling Rate: The rate at which the signal voltage falls, in signal units persecond. Measured between 80% and 20% of its peak-to-peakvalue.
Fall Time: The time the signal takes to fall from 80% to 20% of its peakvalues.
Frequency: The number of cycles of the waveform per second.
High Pulse Width: The amount of time that the signal spends above its meanvalue.
Low Pulse Width: The amount of time that the signal spends below its meanvalue.
Maximum: The highest level reached by the signal.
Minimum: The lowest level reached by the signal.
Peak To Peak: The difference between maximum and minimum.
Rise Time: The time the signal takes to rise from 20% to 80% of its peak-to-peak value.
Rising Rate: The rate at which the signal rises, in signal units per second.Measured between 20% and 80% of its peak-to-peak value.
75
79
81
81
31
13 75
14 76

Reference 76
Copyright © 2007 Pico Technology Limited. All rights reserved. psw.en
9.1.2 Spectrum measurements
Frequency at peak
The frequency at which the peak signal value appears.
Amplitude at peak
The amplitude of the peak signal value.
Total power
The power of the whole signal captured in the spectrum view.
Total power = sqrt(sum(value(n)^2)) for all n
Total Harmonic Distortion (THD)
The ratio of the harmonic power to the power at the specified frequency.
Total Harmonic Distortion plus Noise (THD+N)
The ratio of the harmonic power plus noise to the fundamental power. THD+N valuesare almost be greater than the THD values for the same signal.
Spurious-free Dynamic Range (SFDR)
This is the ratio of the amplitude of the specified point (normally the peak frequencycomponent) and the frequency component with the second largest amplitude (call it"SFDR frequency"). The component at the "SFDR frequency" is not necessarily aharmonic of the fundamental frequency component. For example, it might be astrong, independent noise signal.
Signal+Noise+Distortion to Signal+Noise Ratio (SINAD)
The ratio, in decibels, of the signal-plus-noise-plus-distortion to noise-plus-distortion.
Signal to Noise Ratio (SNR)
The ratio, in decibels, of the mean signal power to the mean noise power. Hanning orBlackman windows are recommended because of their low noise.

PicoScope 6 User's Guide77
Copyright © 2007 Pico Technology Limited. All rights reserved.psw.en
Intermodulation Distortion (IMD)
A measure of the distortion caused by the nonlinear mixing of two tones. Whenmultiple signals are injected into a device, modulation or nonlinear mixing of thesetwo signals can occur. For input signals at frequencies f1 and f2, the two second-orderdistortion signals will be found at frequencies: f3 = (f1 + f2) and f4 = (f1 - f2).
IMD is expressed as the dB ratio of the RMS sum of the distortion terms to the RMSsum of the two input tones. IMD can be measured for distortion terms of any order,but the second-order terms are most commonly used. In the second-order case, theintermodulation distortion is given by:
where
F3 and F4 are the amplitudes of the two second-order distortion terms (atfrequencies f3 and f4 defined above)
and
F1 and F2 are the amplitudes of the input tones (at frequencies f1 and f2, asmarked by the frequency rulers in the spectrum window).
For reference, the third-order terms are at frequencies (2F1 + F2), (2F1 - F2), (F1 +2F2) and (F1 - 2F2).
Note: Hanning or Blackman windows are recommended because of their low noise. AnFFT size of 4096 or greater is recommended in order to provide adequate spectralresolution for the IMD measurements.
Reference 78
Copyright © 2007 Pico Technology Limited. All rights reserved. psw.en
9.2 Window functions
To create a spectrum view, PicoScope uses a Fast Fourier Transform to computethe spectrum of a block of sampled data. A block of sampled data has a beginningand an end, and these sharp boundaries have an effect on the computed spectrum,creating unwanted artefacts such as ripple and gain errors. To reduce these artefacts,the signal can be smoothed so it tapers off to zero at the start and end of the block. A number of different types of smoothing, called window functions, can be applieddepending on the type of signal and the purpose of the measurement. Therectangular window is simply the unsmoothed, truncated version of the data.
The Window Functions control in the Spectrum Options dialog lets you selectone of the standard window functions for spectrum analysis. The following tableshows some of the figures of merit used to compare window functions.
Window Main peakwidth (bins@ -3 dB)
Highest side lobe(dB)
Side lobe roll-off(dB/octave)
Notes
Blackman 1.68 -58 18 often used for audio work
Gaussian 1.33 to 1.79 -42 to -69 6 gives minimal time andfrequency errors
Triangular 1.28 -27 12 also called Bartlett window
Hamming 1.30 -41.9 6 also called raised sine-squared;used in speech analysis
Hann 1.20 to 1.86 -23 to -47 12 to 30 also called sine-squared; usedfor audio & vibration
Blackman-Harris 1.90 -92 6 general-purpose
Flat-top 2.94 -44 6 negligible pass-band ripple;used mainly for calibration
Rectangular 0.89 -13.2 6 maximal sharpness; used forshort transients
14
54

PicoScope 6 User's Guide79
Copyright © 2007 Pico Technology Limited. All rights reserved.psw.en
9.3 Trigger timing (part 1)
The pre-trigger time control and post-trigger delay control functions aredescribed individually under "Triggering toolbar", but the interaction between thetwo controls is also important to understand. Here is a screen shot of a scope viewwith post-trigger delay enabled:
Note 1. The trigger reference point ( ) does not lie on the waveform. This is becausethe post-trigger delay is set to 3.3 ms, which means that the trigger occurred3.3 ms before the reference point, somewhere off the left-hand edge of the scope view. The time axis is aligned so that the trigger reference point isat 3.3 ms.
Note 2. The pre-trigger delay is set to 30%, which forces the trigger reference pointto appear 30% of the way across the scope view from the left-hand edge.
Note 3. PicoScope limits the trigger-to-reference-point delay to a multiple of the totalcapture time. Once you have reached this limit, the program will not let youincrease the pre-trigger delay, and if you increase the post-trigger delay,PicoScope will reduce the pre-trigger delay to stop the total exceeding thelimit. The multiple is typically 100 in most trigger modes, and 1 in ETSmode.
60
13
13
82
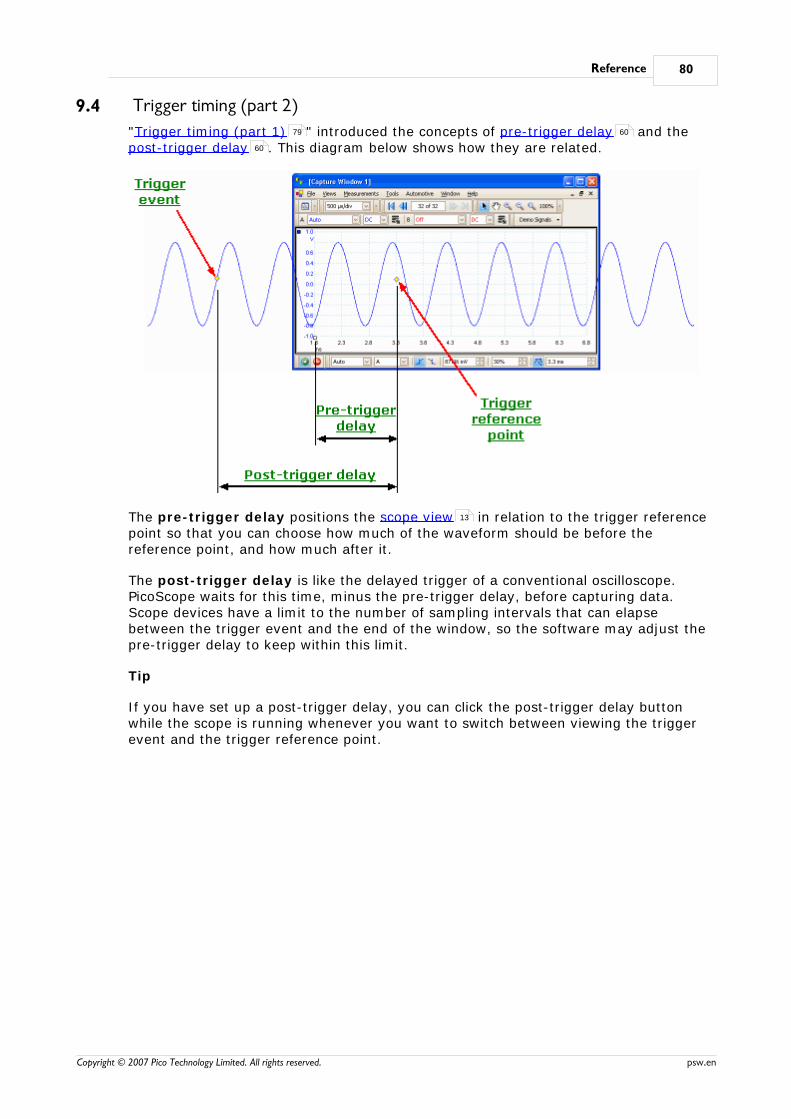
Reference 80
Copyright © 2007 Pico Technology Limited. All rights reserved. psw.en
9.4 Trigger timing (part 2)
"Trigger timing (part 1) " introduced the concepts of pre-trigger delay and thepost-trigger delay . This diagram below shows how they are related.
The pre-trigger delay positions the scope view in relation to the trigger referencepoint so that you can choose how much of the waveform should be before thereference point, and how much after it.
The post-trigger delay is like the delayed trigger of a conventional oscilloscope.PicoScope waits for this time, minus the pre-trigger delay, before capturing data. Scope devices have a limit to the number of sampling intervals that can elapsebetween the trigger event and the end of the window, so the software may adjust thepre-trigger delay to keep within this limit.
Tip
If you have set up a post-trigger delay, you can click the post-trigger delay buttonwhile the scope is running whenever you want to switch between viewing the triggerevent and the trigger reference point.
79 60
60
13

PicoScope 6 User's Guide81
Copyright © 2007 Pico Technology Limited. All rights reserved.psw.en
9.5 Keyboard shortcuts
You can activate most of PicoScope's functions using the menu system, but somefunctions also have keyboard shortcuts. These can save time on tasks that yourepeat often.
Ctrl-C Copy the current view to the Windows clipboard. You can then switch toanother application and paste the contents of the clipboard as a picture.The method for doing this varies, but many applications use the Ctrl-Vkey or a "Paste" button.
Ctrl-D Hand tool. Use to pan the waveform when zoomed in. Equivalent to the"Hand tool" button on the Zooming and Scrolling toolbar.
Ctrl-I Zoom-in tool. Click on the waveform to zoom in. Equivalent to the "Zoom-in tool" button on the Zooming and Scrolling toolbar.
Ctrl-M Marquee zoom tool. Click on the waveform and drag to draw a box (amarquee), and PicoScope will zoom in to make the box fill the view.Equivalent to the "Marquee zoom tool" button on the Zooming andScrolling toolbar.
Ctrl-O Zoom-out tool. Click on the waveform to zoom out. Equivalent to the"Zoom-out tool" button on the Zooming and Scrolling toolbar.
Ctrl-SorEsc
Cancels a zoom or pan mode and restores the pointer to a standardselection tool. Equivalent to the "Normal selection tool" button on the Zooming and Scrolling toolbar.
Ctrl-U Zoom to 100% scale. Restores a view to its normal state. Equivalent tothe "Zoom to 100% scale" button on the Zooming and Scrolling toolbar.
Space bar Starts and stops the scope device.
9.6 Glossary
AC coupling. In this mode, the scope device rejects very low signal frequenciesbelow a few hertz. This allows you to use the full resolution of the scope to measurea.c. signals accurately, ignoring any d.c. offset. You cannot measure the signal levelwith respect to ground in this mode.
AWG. An arbitrary waveform generator (AWG) is a circuit that can generate awaveform of almost any shape. It is programmed with a data file, supplied by theuser, which defines the output voltage at a number of equally spaced points in time. The circuit uses this data to reconstruct the waveform with a specified amplitude andfrequency.
Channel. A scope device has one or more channels, each of which can sample onesignal. High-speed scope devices typically have one BNC connector per channel.
66
66
66
66
66
66
Reference 82
Copyright © 2007 Pico Technology Limited. All rights reserved. psw.en
DC coupling. In this mode, the scope device measures the signal level relative tosignal ground. This shows maximum information about the signal, including d.c. anda.c. components.
ETS. Equivalent Time Sampling. A method of increasing the effective sampling rate ofthe scope by processing multiple captures in software. In a scope view, the programcaptures several cycles of a repetitive signal, then combines the results to produce asingle waveform with higher time-resolution than a single capture. For accurateresults, the signal must be perfectly repetitive and the trigger must be stable.
Graticule. The pattern of broken grey lines in every view. These help you estimatethe amplitude and time or frequency of features on the waveform.
Grid. The arrangement of viewports. The number of grid rows and the number ofgrid columns can each be either 1, 2, 3 or 4.
In focus. PicoScope can display several views, but one view is drawn in strongercolours than the others. This is the view that is in focus. When you click a toolbarbutton, it will usually affect only the view that is in focus. To bring a view into focus,click on it.
Probe. An accessory that attaches to your oscilloscope and picks up a signal to bemeasured. A probe can pick up any form of signal, but it always delivers a voltagesignal to the oscilloscope. PicoScope knows about standard probes, but also allowsyou to define custom probes.
Roll mode. Normally, PicoScope redraws the waveform in a scope view many timesevery second. At timebases slower than 200 ms/div, however, it switches to rollmode. This causes the waveform to move continuously from right to left, with old datadisappearing off the left-hand side and new data being added on the right-hand side.This mode is more convenient for viewing slowly changing data.
Ruler. A vertical or horizontal dashed line that can be dragged into place on awaveform in a scope view. PicoScope displays the signal level, time value or frequencyvalue of all rulers in a Ruler Legend box.
Scope device. A box of electronics that, with the help of the PicoScope software,turns your computer into a PC Oscilloscope.
Tooltip. A label that appears when you move the mouse pointer over some parts ofthe PicoScope screen, such as buttons, controls and rulers.
Trigger. A device that detects when the waveform rises or falls past a preset signallevel. When this event occurs, the program may begin to acquire data.
View. A presentation of data from a scope device. Views may be scope views orspectrum views.
Viewport. A rectangular space in the PicoScope window that can contain one or moreviews, or can be empty.
PicoScope 6 User's Guide83
Copyright © 2007 Pico Technology Limited. All rights reserved.psw.en
Index
..bmp files, saving 23
.csv files, saving 23
.gif files, saving 23
.png files, saving 23
.psdata files, saving 23
.pssettings files, saving 23
.txt files, saving 23
AAC mains power 46
Access 5
Add Measurement dialog 31
Adding a measurement 11, 30, 31
Address 6
Advanced Options menu 51
Advanced trigger types 63
Advanced triggering 60, 62
Arbitrary waveform files 58
Arbitrary waveform generator 56
Axis
horizontal 13, 14
vertical 13, 14
Axis offset 73
Axis scaling 73
Axis scaling controls 51
BBattery power 46
Binary files, exporting 25
Buffer Navigation toolbar 50
CCapture rate 46
Capture Setup toolbar 53
Channel Setup toolbar 50
Clipboard 28
Close file 22
Column auto-width 30
Connect Device dialog 22, 48
Contact information 6
Converter, how to change 70
Copy as image 28
Copy as text 28
Copyright 5
Create New Custom Probe dialog 34
CSV files, exporting 24
Cursor position tool tip 16
Custom grid layout dialog 30
Custom Probe wizard 33
Create New Custom Probe dialog 34
Edit Existing Custom Probe dialog 35
Edit Range dialog 41
Finished dialog 44
Lookup-table Scaling dialog 38
Manual Ranges Setup dialog 40
Probe ID dialog 43
Probe Output Units dialog 36
Range Management dialog 39
Scaling Method dialog 37
Custom probes 20, 32
Custom Probes dialog 32
DDeleting a measurement 11, 30
Demonstration mode 67
Demonstration Signals dialog 67
Demonstration Signals toolbar 67
Display elements 9
Dropout trigger 63
EEdge trigger 63
Edit Existing Custom Probe dialog 35
Edit menu 28
Edit Range dialog 41
Editing a measurement 11, 30
Email addresses 6
Equivalent-time sampling 60
Escape key 81
ETS 60
and Advanced Triggering 62
Exit 22
Exporting data 24
binary format 25
text format 24
FFalling edge button 60
Fax number 6
File menu 22
Fitness for purpose 5
Frequency difference, how to measure 71
Frequency legend 11, 17
Frequency rulers 17

Index 84
Copyright © 2007 Pico Technology Limited. All rights reserved. psw.en
GGeneral dialog 45
Glitches, finding 63
Glossary 81
Graticule 13, 14
Grid
custom layout 30
layout 29
HHand tool 66
Help menu 47
Horizontal axis 13, 14
Hysteresis 65
IImage, saving as 23
Interval trigger 62, 63
Introduction 4
KKeyboard shortcuts 66, 81
LLegal statement 5
Liability 5
Logic trigger 63
Lookup-Table Scaling dialog 38
MMains power 46
Manual Ranges Setup dialog 40
Marquee Zoom tool 66
Matlab 4 files, exporting 25
Measurements
adding 11, 31
deleting 11
editing 11
font size 30
list of types 75
menu 30
table 11
toolbar 52
Measurements, scope 75
Measurements, spectrum 76
Menus 21
Missing events, finding 63
Mission-critical applications 5
NNew features 2
Normal Selection tool 66
Notes area 28
OOffset 73
Open file 22
Oscilloscope 9
PPC Oscilloscope 10
PCO 10
Performance dialog 46
PicoScope 10
how to use 4, 8, 9
version 1
version 6.0 2
Post-trigger delay 79
arrow 12
control 60, 79
Preferences 32
dialog 44
Pre-trigger delay 79
control 60, 79
Print 22
Print preview 22
Probe ID dialog 43
Probe Manager 32
Probe Output Units dialog 36
Probes
custom 20
Progress bar 54
Properties sheet 15
Pulse width trigger 62, 63
RRange Management dialog 39
Reference manual 47
Release notes 3
Reset 'Don't show this again' dialogs 45
Rising edge button 60
Ruler legend 12
Rulers
handles 13, 14
time 13, 14
voltage 13, 14

PicoScope 6 User's Guide85
Copyright © 2007 Pico Technology Limited. All rights reserved.psw.en
SSales email address 6
Sampling rate 53
Save As 22
dialog 23
Save file 22
Scaling 10, 73
Scaling Method dialog 37
Scope measurements
AC volts measurement 75
Burn time measurement 75
Burn voltage measurement 75
Crank RPM measurement 75
Cycle time measurement 75
DC volts measurement 75
Duty cycle measurement 75
Dwell angle measurement 75
Dwell time measurement 75
Fall time measurement 75
Falling rate measurement 75
Frequency measurement 75
High pulse width measurement 75
Injector duration measurement 75
Low pulse width measurement 75
Maximum measurement 75
Minimum measurement 75
Peak burn voltage measurement 75
Peak to peak measurement 75
Rise time measurement 75
Rising rate measurement 75
Scope view 13
Selection tool, normal 66
Signal difference, how to measure 70
Signal Generator
dialog 56
toolbar 56
Signal rulers 13, 14, 19
Software version 1
Space bar 59, 81
Spectrum measurements
Amplitude at peak 76
Frequency at peak 76
Intermodulation Distortion (IMD) 76
Signal to Noise Ratio (SNR) 76
Spurious-free Dynamic Range (SFDR) 76
Total Harmonic Distortion (THD) 76
Total Harmonic Distortion plus Noise (THD+N) 76
Total power 76
Spectrum options
bins 54
dialog 54
display mode 54
scale 54
Spectrum view 14
how to set up 74
Spreadsheet, exporting to 23
Spurious edges, finding 63
Start/Stop toolbar 59
Startup Settings menu 27
Support 5
System requirements 7
TTechnical support email address 6
Telephone number 6
Text files, exporting 24
Text, exporting as 23
Time difference, how to measure 71
Time rulers 13, 14, 17
Timebase controls 53
Toolbars 49
Tools menu 32
Trace 9
Trademarks 5
Trigger
advanced 60, 62
dual-edge 62
interval 62
marker 18
mode control 60
pulse width 62
reference point 79
timing 79
toolbar 60
Triggering
dropout 63
edge 63
glitches 63
interval 63
logic 63
missing events 63
pulse width 63
window 63
UUpgrades 5
Usage 5

Index 86
Copyright © 2007 Pico Technology Limited. All rights reserved. psw.en
VValid edges, finding 63
Version 1
Version 6.0 update 2
Vertical axis 13, 14
Viewports 19
Views 19
how to move 72
menu 29
scope view 13
spectrum view 14
Viruses 5
WWaveform 9, 13
What's new 2
Window function 54
Window functions 78
Window trigger 63
Windows 19
ZZooming and Scrolling toolbar 66

PicoScope 6 User's Guide87
psw.en Copyright © 2007 Pico Technology Limited. All rights reserved.

Pico Technology Ltd
The Mill HouseCambridge Street
St Neots PE19 1QBUnited Kingdom
Tel: +44 (0) 1480 396 395Fax: +44 (0) 1480 396 296Web: www.picotech.com
Copyright © 2007 Pico Technology Limited. All rights reserved.psw.en 10.7.07