PICK-UP/DROP-OFF PILOT · city in the United States by the INRIX Global Traffic Scorecard. ......
35
PICK-UP/DROP-OFF PILOT Initial Assessment & Early Findings
Transcript of PICK-UP/DROP-OFF PILOT · city in the United States by the INRIX Global Traffic Scorecard. ......

PICK-UP/DROP-OFF PILOT Initial Assessment & Early Findings

CONTENTS
Executive summary
Background
How the PU/DO pilot works
Methodology and data analysis
Ongoing learnings and recommendations
Conclusions and recommendations
Appendix
3
6
7
10
18
23
25

EXECUTIVE SUMMARYIn 2018, Boston saw the largest increase in rideshare (e.g., Uber and Lyft) trips in the Commonwealth of Massachusetts, rising to over 100,000 trips per day on average. The next year, the City of Boston was named the #1 most congested city in the United States by the INRIX Global Traffic Scorecard. The City’s pop-ulation and employment hubs are growing rapidly and people are looking for new ways to make their daily trips.
In an effort to better manage congestion in a regulatory environment where the City of Boston has little direct control over ridesharing companies, the City announced a pick-up/drop-off (“PU/DO”) pilot on March 7, 2019.
LOCATION & PARAMETERS
The Boston Transportation Department (BTD) in collaboration with the Mayor’s Office of New Urban Mechanics (MONUM) and the Department of Innovation and Technology (DoIT) installed the PU/DO pilot on two westbound blocks of Boylston St. in the Fenway neighborhood. The pilot dedicated four pre-existing parking spots (two per block) to pick-up/drop-off activity from 5pm to 8am. Signage indicated that during these hours the driver must stay with the vehicle and could only stay in the spot for up to five minutes. Lyft and Uber apps also ‘geofenced’ the PU/DO location, sending ride requests to on those blocks to the zone pick-up spots.
LEARNING OBJECTIVES
The pilot was implemented to understand how the City of Boston could more efficiently use curb space, decrease unsafe driving behaviors such as dou-ble-parking, and improve traffic flow. This report is an initial assessment of
3
the pilot after collecting four months of data, relying on both quantitative and qualitative methods.
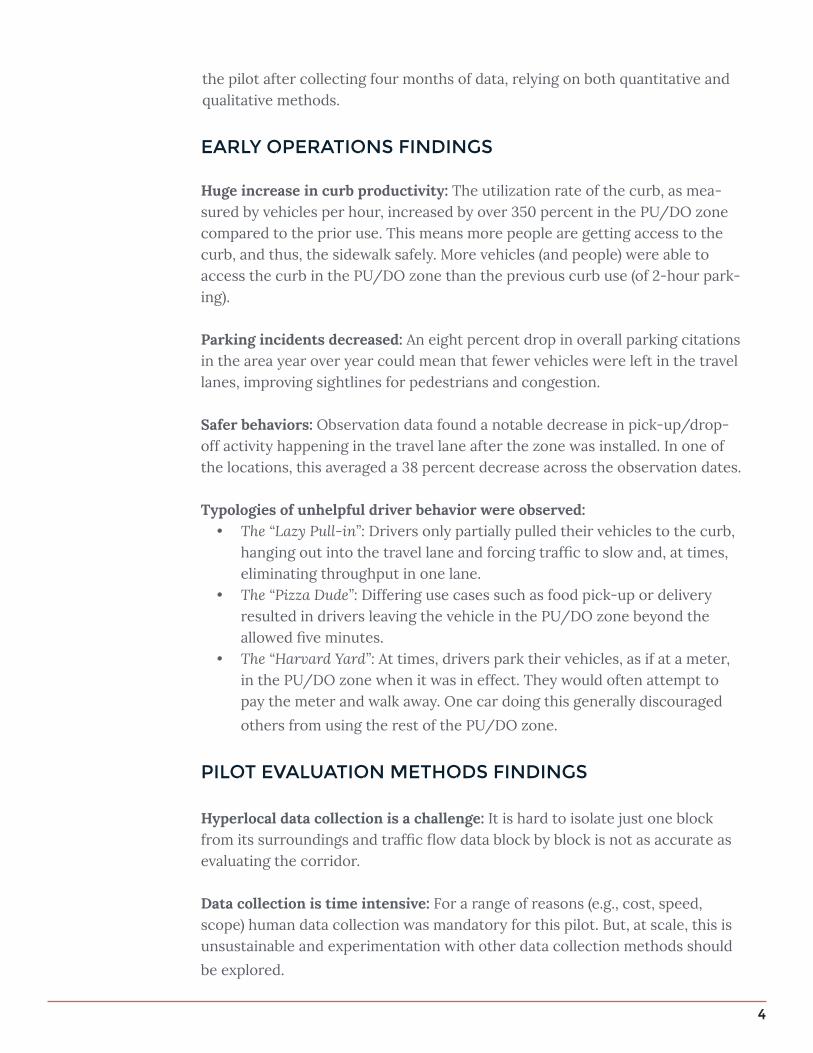
EARLY OPERATIONS FINDINGS
Huge increase in curb productivity: The utilization rate of the curb, as mea-sured by vehicles per hour, increased by over 350 percent in the PU/DO zone compared to the prior use. This means more people are getting access to the curb, and thus, the sidewalk safely. More vehicles (and people) were able to access the curb in the PU/DO zone than the previous curb use (of 2-hour park-ing).
Parking incidents decreased: An eight percent drop in overall parking citations in the area year over year could mean that fewer vehicles were left in the travel lanes, improving sightlines for pedestrians and congestion.
Safer behaviors: Observation data found a notable decrease in pick-up/drop-off activity happening in the travel lane after the zone was installed. In one of the locations, this averaged a 38 percent decrease across the observation dates.
Typologies of unhelpful driver behavior were observed:• The “Lazy Pull-in”: Drivers only partially pulled their vehicles to the curb,
hanging out into the travel lane and forcing traffic to slow and, at times, eliminating throughput in one lane.
• The “Pizza Dude”: Differing use cases such as food pick-up or delivery resulted in drivers leaving the vehicle in the PU/DO zone beyond the allowed five minutes.
• The “Harvard Yard”: At times, drivers park their vehicles, as if at a meter, in the PU/DO zone when it was in effect. They would often attempt to pay the meter and walk away. One car doing this generally discouraged
others from using the rest of the PU/DO zone.
PILOT EVALUATION METHODS FINDINGS
Hyperlocal data collection is a challenge: It is hard to isolate just one block from its surroundings and traffic flow data block by block is not as accurate as evaluating the corridor.
Data collection is time intensive: For a range of reasons (e.g., cost, speed, scope) human data collection was mandatory for this pilot. But, at scale, this is unsustainable and experimentation with other data collection methods should
be explored.
4

CONSIDERATIONS FOR EXPANSION
While the results of the PU/DO location on Boylston Street are not conclusive, there is evidence to suggest that conditions were improved by implementing the zone. The zone boosted curb productivity (people per foot of curb), de-creased some unsafe behaviors, and improved travel speeds. Should the City create additional locations, the following should be considered.
Assessment of new locations• Typologies of pick-up/drop-off activity (e.g., passengers, package deliv-
eries, food deliveries);• Usability and accessibility of the curb space (e.g., sidewalk slope and ma-
terials, furniture zone clutter);• Adjacent use for curb demand;• Bi-directional travel (e.g., placing a PU/DO zone on both sides of the
street);• Wayfinding for people who are visually impaired;
• Placement of PU/DO zone near curb ramps for accessibility.
Driver confusion • Painting the curb and improved signage to create brand identification;• Allow more space for vehicles to pull against the curb (3+ parking spots,
60 feet or more in total length);• Educating drivers and passengers with an outreach campaign;• Utilizing side streets rather than major corridors for PU/DO activity.
5

6
As a part of the Go Boston 2030 planning process, the City of Boston solicited transpor-tation project and policy ideas from the public between 2015 and 2016. These ideas and input helped us develop the Vision and Action Plan released in March 2017. We identified three primary goals and targets: 1) expanding access, 2) improving safety, and 3) ensuring reliability. In addition to these goals, the City developed a list of projects and policies after an extensive public process and needs assessment analysis. The PU/DO pilot touches upon a number of our top priorities, including the Flexible Lanes policy and Neighborhood Mobility microHUBs. The learnings from the PU/DO pilot will serve as building blocks for these larger projects.
It’s an all too familiar sight on the Boston’s streets: A car abruptly stopping in the travel lane to pick-up or drop-off a passenger. At best, this is an annoyance and at worst a major safety concern for the passenger who traverses a trav-el lane and for the others who must unexpect-edly come to a stop. The advent of ridesharing options likely significantly increased this oc-currence, while also making it harder to predict this behavior based upon vehicle markings.
To discourage these unsafe behaviors and improve traffic flow, we hypothesized that we
could more efficiently manage our curb space through a PU/DO zone. On March 7, 2019, May-or Martin J. Walsh announced that the City of Boston would pilot a PU/DO zone program for passenger vehicles, including but not limited to ridesharing services in the Fenway area.
The pilot program has two primary compo-nents: (1) The City installed signage to show that from 5pm to 8am, four metered spaces are reserved for PU/DO activity only. The signage stated that stopping was limited to five minutes and that drivers must remain with their vehi-cles; (2) Ridesharing service providers Uber and Lyft agreed to geofence the blocks immediate-ly to the west and east of Kilmarnock Street. When the user of a ridesharing service requests a ride within the geofenced area, they are directed to the designated PU/DO zone. The area covered by the geofence is limited to one side of the street and only in effect from 5pm to 8am. On March 14, 2019, BTD installed signage and ‘red-capped’ the relevant parking meters to signal that the meters are not in effect at cer-tain times due to parking restrictions. MONUM, BTD, and the Boston Planning & Development Agency (BPDA) collected quantitative and quali-tative pilot data. DoIT supported the pilot’s data collection strategy and analysis.
BACKGROUND

HOW THE PU/DO PILOT WORKS
WHERE & WHEN
The PU/DO pilot was designed for everyday use of the relevant westbound blocks: 1363-1381 Boylston St. (“Tiger Mama” block) and 1323-1341 Boylston St. (“Target” block). The pilot was neither intended nor designed for large-scale, event-based PU/DO activity such as Red Sox game days1.
BTD ran the PU/DO pilot in the Fenway neighborhood on the northside of Boylston Street near Kilmarnock Street. The PU/DO zone consists of four park-ing meters on westbound blocks of Boylston St: two meters on the 1363-1381 Boylston St. block (approximately between Kilmarnock St. and Park Dr.) and two meters on the 1323-1341 Boylston St. block (approximately between Kilmarnock St. and Richard B. Ross Way). The four relevant meters had red domes added to them to indicate that their hours differed from the other meters and signage indicated that from 5pm to 8am they were for PU/DO activity only.
ENFORCEMENT
For approximately the first week and a half after signs were installed, BTD Parking Enforcement assigned two officers to work overtime patrolling the area where the PU/DO zone pilot was located. Other than this period, BTD Parking Enforcement did not change its enforcement strategy for the pilot. Officers regularly patrol this area throughout the evening.
GEOFENCE
The PU/DO pilot is open to a variety of passenger vehicles such as a driver us-ing her personal vehicle to pick up a friend or a driver dropping off a co-worker for her shift. We hypothesized, however, that to maximize usage of the dedicat-ed curb space, Lyft and Uber would have to play a role in the pilot. Geofencing
1 The City of Boston does not have direct regulatory control over Uber and Lyft. Thus, while the pilot was not designed for large-scale game events, it is possible that Uber and Lyft continued to use the zone as one of their PU/DO options for game days.
Regulatory and in-formational signage installed in PU/DO locations
7

(or setting up a virtual perimeter) is a feature that is already deployed within the ridesharing apps at different locations around the City of Boston. For exam-ple, ridesharing app users who visit the Prudential Center will likely notice that the Prudential Center is geofenced and users are encouraged to select a pick-up location from a menu of options. Geofencing is also very common for PU/DO activity at airports across the country.
Lyft and Uber voluntarily agreed to geofence the blocks where the PU/DO zone was located so that no passenger would be required to cross a street to access the zone. Within the geofence, Lyft and Uber directed passengers and drivers to the PU/DO zone. As is customary, if a passenger wanted to be picked up somewhere else, the passenger had the option to contact the driver.
The geofence in both apps appeared for pick-ups. For drop-offs, however, Lyft provides the option to skip the geofence. Uber does not geofence areas for drop-offs. We received feedback from both companies that drivers are less like-ly to adhere to geofenced drop-offs and will follow the instructions of passen-gers instead.
Location of the PU/DO pilot zone; Part of the outreach flyer to local businesses
8

ADDITIONAL OUTREACH
Prior to launch, City staff visited most of the buildings and stores that would be within the geofenced block to inform them of the pilot and handed out relevant information as well as an email address to provide feedback. The City also set up a webpage on boston.gov with basic information about the pilot and made available a document regarding commonly asked questions.
Geofenced area; Source: Google Maps
9

METHODOLOGY AND DATA ANALYSIS OF THE PILOT
QUANTITATIVE DATA SUMMARY
To analyze the correlational impacts on the street before and during the pilot, we looked at several quantitative metrics, including field observations, parking citations, and Waze data.
Waze
Through the Waze Connected Citizens Program, we began collecting and aggregating Waze’s traffic jam and speed data pre- and post-implementation along the Boylston St. corridor both westbound and eastbound. Pre-implemen-tation data was collected beginning on or around January 1, 2019. Recognizing that it would be challenging to attribute any changes in jam or speed data to the PU/DO pilot rather than to another factor such as seasonal change, our team determined that the Waze data could not be considered conclusory or causational. The analysis of pre- and post-implementation data is attached to this report as the Appendix. As noted above, because the PU/DO pilot was neither intended nor designed to be used for large-scale events, Red Sox game days were taken out of the data set analyzed.
Field observations data collection (non-Red Sox game days)
Nine field observation sessions were conducted on non-Red Sox game days--three separate evenings pre-implementation and six separate evenings post-implementation.
During pre-implementation field observation sessions, we recorded data points, including, but not limited to:
• # of pick-ups and drop-offs happening at the curb• # of pick-ups and drop-offs happening in the travel lane
10

During post-implementation field observation sessions, we recorded data points, including, but not limited to:
• # of pick-ups and drop-offs happening at the curb• # of pick-ups and drop-offs happening in the travel lane• # of pick-ups and drop-offs happening in the PU/DO zone
We observed a decrease in pick-ups and drop-offs happening in the travel lane, with the Tiger Mama block seeing the more dramatic decrease. However, as noted below, we also observed a number of operational challenges.
32.8%
29.2% 30.0%
26.1% 25.2%
20.0% 20.8%
25.0%
29.6%
21 28 15 24 31 6 11 11 21
Perc
ent
trav
el la
ne u
sage
Travel lane observations
March 3 July 11June 28June 17May 4April 19April 18March 9March 8
Prior to pick-up/drop-off zone During pick-up/drop-off zone
Prior average: 30.5%
During average: 25.2%
Instances of travel lane blockage for pick-up/drop-off activity (e.g., double-parking) pre- and post-pilot imple-mentation (NOTE: Below the X-axis, we provide the number of travel lane blockages we observed. The Y-axis indicates the percentage of pick-ups/drop-offs that resulted in travel lane blockage).
Target block travel lane usage as a percentage of total usage
11

Instances of travel lane blockage for pick-up/drop-off activity (e.g., double-parking) pre- and post-pi-lot implementation (NOTE: Below the X-axis, we provide the number of travel lane blockages we ob-served. The Y-axis indicates the percentage of pick-ups/drop-offs that resulted in travel lane blockage).
75.7%
59.1%
73.2%
26.0%
38.5%
57.1%
4.6%
20.6%
37.8%
28 39 41 13 20 12 1 7 14
Perc
ent
trav
el la
ne u
sage
Travel lane observations
March 3 July 11June 28June 17May 4April 19April 18March 9March 8
Prior to pick-up/drop-off zone During pick-up/drop-off zone
Prior average: 67.9%
During average: 31.0%
Tiger Mama travel lane usage as a percentage of total usage
The charts above show that for the Target block, before the PU/DO pilot 30.5 percent of observed pick-ups/drop-offs occurred in the travel lane. After the pilot’s implementation, 25.2 percent of observed pick-ups/drop-offs occurred in the travel lane. For the Tiger Mama block, the decrease was even more dra-matic. Prior to the PU/DO pilot, 67.9 percent of pick-ups/drop-offs occurred in the travel lane. After the pilot’s implementation, 31.0 percent occurred in the travel lane. Despite the decrease in double-parking, we observed several chal-lenges, which are detailed in the following section.
Curb productivity
Curb productivity refers to the efficiency with which a given section of curb space facilitates the arrival and departure of people, including those arriving by TNC, taxi, transit, private car drop-off (valet), parked car, or another mode that requires curbside access (e.g., bikeshare, motorcycle, etc.)2 Curb productivity also refers to other uses such as the arrival of goods and services via small to
2 https://www.fehrandpeers.com/wp-content/uploads/2019/01/SF_Curb_Study_2018-10-19_web-download.pdf
12

large commercial vehicles, however for this report we are focusing on the pick-up and drop-off of people.
For this pilot, we measured curb productivity by counting the number of ve-hicles and/or passengers that access the curb over a period of time. In other words, we analyzed vehicle turnover per space. Data on the number of passen-gers could not be collected, therefore the data was collected per vehicle. The number of vehicles accessing the curb for parking were calculated by reviewing parking meter payments and parking duration. The number of vehicles access-ing the curb for PU/DO were calculated through in person observation.
Prior to implementing the pilot program the curb was regulated by metered parking 8am to 8pm Monday to Saturday, with free parking between 8pm to 8am and all day on Sundays. On average the pilot area (two parking spaces) on the Target Block provided access to three vehicles per hour, and on the Tiger Mama Block provided access to two vehicles per hour. The availability of curb space for parked vehicles is limited by the duration that vehicles are permitted to park and the turnover of vehicles based on the length of time that a driver or passenger spends at a destination. Availability also depends on the enforcement of parking regulations and whether a driver believes they will receive a citation for failing to follow regulations, such as overstaying the permitted time.
During the pilot program the curb regulation was adjusted to five minutes for PU/DO between 5pm to 8am Monday to Sunday. This reduced the hours of me-tered parking to 8am to 5pm Monday to Saturday and eliminated free parking with the exception of 8am to 5pm on Sundays. On average the pilot area on the Target Block provided access to fourteen vehicles per hour, and on the Tiger Mama Block provided access to nine vehicles per hour.
This increase in access from three to fourteen vehicles (~367 percent increase
9
14
2
3
0 2 4 6 8 10 12 14 16
Tiger Mama Block
Target Block
Pre-Pilot Metered Parking Pilot 5 Min PU/DO
Vehicle turnover pre- and during pilot
Average number of vehicles served per hour by four spaces along the curb before and during the pilot
13

in productivity) on the Target Block and from two to nine vehicles (~350 per-cent increase in productivity) on the Tiger Mama block demonstrates an im-provement in Curb Productivity. Without access to the curb one could assume the additional vehicles would need to engage in unsafe and illegal behavior to pick-up and drop-off passengers, including stopping in the travel lane and near intersections in no stopping areas and crosswalks.
Parking citations
Working with the Office of the Parking Clerk, we examined the number of over-all tickets issued along certain routes. We could not parse the violations out by violation type as there was no special violation code for citations issued for PU/DO violations. As such, we only examined the overall number of tickets issued in the area.3 BTD Parking Management had actually issued fewer tickets overall for the area where the pilot was. Last year, from March 15, 2018 to June 4, 2018, 1,612 tickets were issued on the routes where the pick-up/drop-off pilot was. In contrast, from March 15, 2019 to June 4, 2019, 1,483 tickets were issued along the same routes. It is important to note that this does not mean that the PU/DO zone caused less citations to be issued in the area.
QUALITATIVE FEEDBACK
Methodology
Over two separate days, we visited abutters on the two affected blocks to con-duct oral surveys and conducted one survey via phone by request. Ten of the organizations abutting the PU/DO pilot zone agreed to participate in the oral survey. For some of the organizations, more than one representative wanted to participate. To ensure that no organization was overrepresented, feedback was divided by organization rather than per person. Although not direct abutters, Fenway Health and Fenway Community Center were contacted post-imple-mentation to ensure that the pilot did not negatively interfere with their oper-ations. When contacted, neither organization reported that the pilot interfered with their operations. We also reached out to stakeholders such as BTD, Boston Police Department, Office of Neighborhood Services, 311, the Age Strong Com-mission, and the Disabilities Commission to provide them an opportunity for feedback. Finally, the City also gathered feedback via email.
3 Further, the exact location of the violation that the enforcement officer wrote down could be varied. Thus, we used route numbers to derive overall ticketing. The route numbers used were C03 and C04.
14

Abutter survey summaries
Overall, a majority of the surveyees had favorable perceptions of the PU/DO pilot. A majority reported observing less double-parking since the pilot began and thought that the size of the geofence was appropriate. Surveyees were generally split on whether four spaces was the right number of spaces for the zone or whether it should be expanded. One surveyee of an organization stated that the pilot should be stopped. Eight surveyees reported that they had not received feedback from people with mobility impairments or older adults. One mentioned that a person in a wheelchair appeared to look annoyed while wait-ing for a ride in the restaurant as it was raining outside. One reported that an older woman appeared to be confused by the geofence and location of the pilot zone. Surveyees were also given an opportunity to provide general feedback or observations. Two reported observing that streets adjacent to the pilot zone--Kilmarnock St. and Richard B. Ross Way--appeared to have cleared up. One suggested better signage for passengers. One suggested that there should be better outreach to populations who may not understand ridesharing apps. Two reported that vehicles did not seem to want to use the PU/DO zone and thus stopped on the other side of the street.
4
4 As mentioned above, for some of the organizations, more than one representative wanted to participate. To ensure that no organization was overrepresented, feedback was divided by organization rather than per person. Consequently, 0.5 generally indi-cates that there was a split in opinion within an organization.
15
Reported perceptions that the pilot has helped lessen double-parking4 Size of the pilot
6.5
3.5
Since pilotbegan, there's
been lessdouble-parking
Pilot hasnot lessened
double-parking
54.5
0.5
The size of thePU/DO zone
should beexpanded
The size ofPU/DO zone is
just right
The PU/DO pilotshould bestopped

Ridesharing companies’ feedback
Lyft did not report any red flags (e.g., customer complaints, safety concerns) as-sociated with the pilot. Uber also did not report any red flags. Uber conducted a comparison of the PU/DO zone block with a similar block in the area without a PU/DO zone. The pilot kicked off at the start of the baseball season, which usually correlates with increased instances of friction in the hours immediately before and after games due to significant spikes in demand. However, in this case, Uber found that the increase in friction-related instances was three times less than in the comparison site.
Summary of general feedback received
To date, there appears to have been approximately a dozen or so constituent emails sent to various city departments regarding the pilot. When the pilot was first announced and implemented, most emails were negative in tone or ex-pressed confusion about how far people would have to travel to get to the pilot zone. Of note among the negative feedback were concerns for women, espe-cially in the evening, as well as for persons with disabilities. At least one email received suggested bringing a pilot zone to South Boston. Notably, during BTD’s FY20 Budget City Council hearing, there appeared to be interest from a City Councilor on potentially bringing PU/DO zone(s) to neighborhoods such as the North End5.
5 May 7, 2019 City Council Hearing, https://www.cityofboston.gov/citycouncil/cc_vid-eo_library.asp?id=12510 (1:41-1:43).
16
9
1
The geofenceis just right
The geofenceis too big
6.5
0.51 1 1
Generallypositive
Ineffective No opinion Not awareof pilot
Split--somepeople usethe zone/other don't
Size of the geofence Overall effectiveness

Operational feedback At the time of writing, neither BTD Parking Management nor 311 reported receiving complaints about the pilot. BTD Parking Management did receive feedback from parking enforcement officers. In particular, BTD Parking Man-agement reported that generally drivers appeared to be using the PU/DO zone correctly. However, food delivery was reported to still cause traffic issues.
17

ONGOING LEARNINGS AND RECOMMENDATIONS
DESIGN LEARNINGS
Curb space design and furniture zone clutter
As the City’s thinking evolves on curb space management, it should be mindful of balancing transportation demand, public realm interventions, and access to the curb. In other words, comprehensive curb management should include furniture zone management. For example, while both blocks’ sidewalks were in relatively good condition, there was a difference in congestion of the furniture zone/curb space. While the 1323-1341 Boylston St. furniture zone was relatively flat and clear, the 1363-1381 Boylston St. furniture zone was considerably less so, with items such as raised tree pits and bicycle racks. Partnering with the Disabilities Commission, we identified issues for analysis should the City pro-ceed with a future pilot: (a) whether the curb space/sidewalk are flat (i.e., not an uneven surface); and (b) whether there is sufficient space for a car door to open for a wheelchair lift to be comfortably deployed. As the City continues to practice curb management techniques, the City should consider remix-able in-frastructure and public realm interventions. For example, the City can consider installing public realm interventions that can easily be moved or transferred to different areas.
18

Driver behavior: The “Lazy Pull-in”
During field observation sessions at the Target block, we observed drivers partially pulling into the PU/DO zone, rather than fully aligning with the curb. Although cars traveling behind such vehicles may not have had to come to a complete stop, such cars generally still had to slow down considerably and ma-neuver around, at times limiting traffic flow to just one lane.
19

Parking + general driver confusion: The “Harvard Yard”
During field observation data collection sessions, we observed vehicles con-tinuing to park in the PU/DO zone after 5pm. When a vehicle was parked in the PU/DO zone, we generally observed less utilization of the PU/DO zone and/or some queuing to use the zone. We also, at times, observed drivers pulling up to the curb and appearing to be confused as to whether or not they could park in the zone. At other times, we observed drivers using the PU/DO zone for PU/DO activity, but far exceeding the five minute time limit.
Wayfinding Partnering with the Disabilities Commission, we quickly learned that a best practice for digital wayfinding within an app was to ensure that the location of the PU/DO zone was as specific as possible. For example, rather generically listing “Pick-Up Zone” as the location, it was more useful to have the app list a specific business that the PU/DO zone was in front of. We were able to incor-porate this feedback and ensure that the specific locations were listed in the ridesharing apps for passengers.
We recommend more work and exploration on physical wayfinding for PU/DO zones as outlined further in the next section.
20

Differing use cases: The “Pizza Dude”
As noted above, drivers conducting food delivery and pick-up were observed using the zone. Such drivers generally exited and left their vehicles for far lon-ger than the allotted five minutes. This behavior often had a cascading effect by preventing others from quickly accessing the PU/DO zone.
OPERATIONAL LEARNINGS
Data collection
The City experienced challenges accessing and collecting hyperlocal data such as block-by-block volume of vehicles stopping to pick-up/drop-off passen-gers, number of passengers served, location of pick-ups/drop-offs, typologies of pick-ups/drop-offs (e.g., passenger pick-up/drop-off versus food delivery versus freight delivery). The datasets either did not exist on a holistic level or owners of those datasets did not want to provide the City direct access to them. The City relied heavily on a boots-on-the-ground approach and created its own dataset through staff members directly observing and tallying vehicles. Although this provided the City a means to evaluate the pilot, the approach is not a scalable one for quantitatively diagnosing corridors where another PU/DO zone might address certain traffic issues or evaluating the impact of install-ing a PU/DO zone.
21

Revenue: Pricing the curb
Currently, because the PU/DO zone is in effect from 5pm to 8am, the City of Boston loses about three hours of parking revenue at each of the four meters. With the new performance parking meter pricing, this amounts to approx-imately $30.00 a day, Monday through Saturday. Although this is a nominal amount, should the City decide to scale the program, the City should be cog-nizant that it could potentially lose revenue. Furthermore, implementation of the pilot PU/DO zone took a considerable amount of staff time. Consequently, should the PU/DO zone program scale, the City of Boston should determine whether it should potentially charge for the program. If it does decide to charge for the program, it should determine how to do so in an equitable manner, so that no neighborhood that wants and needs a PU/DO zone is priced out of the service.
KEY TAKEAWAYS
• The City experienced challenges collecting hyperlocal data to locate and evaluate the pilot.
• Any future PU/DO pilot should take into consideration, at minimum, the following factors:
° Typologies of pick-up/drop-off activity (e.g., passengers, package deliveries, food deliveries, etc.)
° Usability of the curb space (e.g., smoothness of the sidewalk, fur-niture zone congestion)
° Actual demand for the curb and at which location(s) (e.g., where do drivers tend to stop to pick-up/drop-off passengers or prod-ucts? What is the volume?)
° Addressing all directions of travel (e.g., placing a PU/DO zone on both the eastbound and westbound blocks)
22

CONCLUSION AND RECOMMENDATIONSThe City has learned a great deal regarding PU/DO pilot and we make the following recommendations that could help decrease confusion and improve proper utilization.
PAINT AND SIGNAGE
Painting the curb a different color to indicate that the space is not solely for parking may encourage drivers to fully use the allocated curb space for PU/DO activity. Better signage that face the sidewalk, so passengers could more easily identify the PU/DO zone could also help decrease wayfinding confusing.
EXPAND THE CURRENT PU/DO ZONE ON BOYLSTON STREET
Because of the observations of queuing along with the congested furniture zone noted above, BTD should consider expanding the current PU/DO zone. BTD can also consider installing a PU/DO zone across the street from the current zone to address inbound traffic.
DRIVER AND PASSENGER EDUCATION/OUTREACH Airports across the country implement PU/DO zone such that many travellers and drivers expect to see a PU/DO zone. Even if drivers and travelers do not expect to use a PU/DO zone, airports typically install frequent signage to direct passengers and drivers to PU/DO zone locations. Less common is a PU/DO zone on an actual city block, which impacts passenger and driver expectations. For a future pilot or scaled-up program, the City of Boston should consider ask-ing community partners and participating transportation services to assist with informative outreach to customers, drivers, and neighbors of the PU/DO zone locations and rules. Specifically, outreach/education initiatives could include:
• Posting wayfinding signage within stores to show PU/DO zone location
23

and its hours of operation;• Informing TNC, taxi, commercial delivery, and other drivers PU/DO zone
location and its hours of operation• Working with TNC and taxi companies to educate riders and drivers on
the PU/DO signage through in-app notification and driver communica-tion channels.
EXPLORE USING SIDE STREETS
Several stakeholders suggested using side streets for PU/DO zone rather than already busy and congested main streets. For this to work, clear wayfinding sig-nage--both digital and physical--must be implemented as it may not be intui-tive for passengers and drivers to use side streets for pick-up/drop-off activ-ity. Furthermore, every effort should be made to ensure that the paths to side street PU/DO zone are safe and easily traversable. For example, the City can consider whether the paths to and on the side street PU/DO zones are well-lit.
ACCESSIBILITY
Any future PU/DO pilot should consider the usability and accessibility of the curb space (e.g., sidewalk slope and materials, furniture zone clutter). For ex-ample, there should be an analysis as to whether there is sufficient space for a car door to open for a wheelchair lift to be comfortably deployed.
FUTURE PILOT LOCATION CONSIDERATIONS Community support and willingness to share block-by-block expertise are paramount to any future PU/DO pilots. The City has received considerable support and interest of the Allston and Seaport neighborhoods. Furthermore, the City would benefit from implementing and evaluating a PU/DO pilot that is designed to reduce conflicts between cars and cyclists, such as with an unpro-tected bicycle lane. Additional locations should again be mindful of time of day activity volumes to maximize the productivity of the curb throughout the day.
NOTE: We’d like to especially extend a thank you to Liren Ma for his excellent and expert assistance with data collection.
24

APPENDIX
BASIC SUMMARY
• Used Waze traffic data to compare average speed and travel delays on Fenway’s Boylston Street during the PU/DO pilot to speed and delays during the same time frame for the previous 2.5 months (10 weeks).
° Average speed = Average mph speed along the route, calculat-ed by hour. Waze provides the average time it takes to cross the route in seconds and the length of the route in meters.
° Average jam level = Average travel delay along the route, calculat-ed by hour. Waze defines ‘jams’ as traffic slowdown information generated by the service, based on a user’s location and speed. Jam levels range from 0 (free flow traffic) to 4 (standstill traffic).
• Speed and jam level data is reported ~every two minutes and we pull it ~every five minutes.
• Both pilot blocks are on the westbound side of Boylston Street, but we examined speed and travel delays on both sides of the street (eastbound and westbound), split by city block.
• In the graphics below, the pilot blocks are highlighted in light gray and takeaways (bullet points under the images) are focused on the pilot blocks.
DATA COLLECTION WINDOW
• Pre-pilot data = December 30, 2018 through March 13, 2019• Pilot data = March 14, 2019 through August 20, 2019
° Red Sox home game dates have been filtered out of the analysis• The graphs only display data for hours that the PU/DO zone is active
(5pm-8am), split into evening (5pm-11:59pm) and morning (12am-7:59am) hours.
25

ASSESSMENT
• It is tough to account for how seasonal change in data collection plays into this, due to the limited pre-pilot data.
• Decreased ‘jams’ are ideal, but no change means that the pilot did not have a negative effect on traffic in the area.
• It is unclear whether decreased or increased speeds are more ideal; slow-er speeds are typically thought to indicate higher congestion, but can also be viewed as safer in a dense, urban environment.
• For most observations, the traffic was rated as free flowing (0), causing an extremely low average in most cases.
26

Pilot block takeaways
• Slight increase in average speeds from 5pm-7:59pm• Slight decrease in average speeds later in the evening• Detected differences are so slight that it is difficult to draw conclusions
from them
27

Pilot block takeaways
• While it might look like the pilot blocks experienced very different effects (the Target block experienced a slight decrease in jam levels in the eve-nings, while the Tiger Mama block experienced a general increase), the detected differences are so slight that it is difficult to draw conclusions from them
28

Pilot block takeaways
• The average speed change fluctuated throughout the evening, but the detected differences are so slight that it is difficult to draw conclusions from them
• Note that these observations are on the opposite side of the street from the pilot
29

Pilot block takeaways
• Both pilot blocks experienced a slight decrease in jam levels throughout the evening, except for the slight increase at 8-8:59pm and 11-11:59am
• Note that these observations are on the opposite side of the street from the pilot
30

Pilot block takeaways
• Fluctuating speed changes observed for the Target block throughout the morning
• Decrease in speeds from 2-7:59am for Tiger Mama block• Detected differences are so slight that it is difficult to draw conclusions
from them
31

Pilot block takeaways
• Average jam level decreased on the westbound side of Boylston St from 5am-8am
• Largest difference seen from Kilmarnock St to Park Drive (Tiger Mama block)
• No significant changes seen from 12am-5am
32

Pilot block takeaways
• Any detected differences are so slight that it is difficult to draw conclu-sions from them
• Note that these observations are on the opposite side of the street from the pilot
33

Pilot block takeaways
• No significant changes in jam levels from 12am-6am eastbound along Boylston St for most blocks
• Pilot blocks saw slight increase in average jam leves from 7-7:59am while Richard B Ross to Jersey St saw greatly decreased average jam levels
• Note that these observations are on the opposite side of the street from the pilot
34