PI Server 2012 - OSIsoftcdn.osisoft.com/corp/en/docs/whitepapers/WP_HighSpeedData... · The OSIsoft...
23
November 2012 PI Server 2012 Smart Grid High-Speed Data Management on Dell Reference Architecture
Transcript of PI Server 2012 - OSIsoftcdn.osisoft.com/corp/en/docs/whitepapers/WP_HighSpeedData... · The OSIsoft...

November 2012
PI Server 2012 Smart Grid High-Speed Data Management
on Dell Reference Architecture

PI Server 2012
© Copyright 2012 OSIsoft, LLC. | 777 Davis Street, San Leandro, CA 94577 | www.osisoft.com 2
TABLE OF CONTENTS
1 ABSTRACT 3
2 SYSTEM OVERVIEW 4 2.1 Dell SRA Hardware and Storage 4 2.2 PI System Configuration 6
3 PERFORMANCE VALIDATION AND BENCHMARKING 7 3.1 Write Performance 7 3.2 Read Performance 8
4 CONCLUSIONS 15
5 APPENDIX A: THEORETICAL IOPS CAPACITY 16
6 APPENDIX B: SELECT PERFMON SCREENSHOTS 18
7 ABOUT OSISOFT, LLC 21

PI Server 2012
© Copyright 2012 OSIsoft, LLC. | 777 Davis Street, San Leandro, CA 94577 | www.osisoft.com 3
1 ABSTRACT
This whitepaper summarizes performance testing done by OSIsoft engineers on Dell Solution Reference Architecture (SRA) for Smart Grid Data Management, which was based on data from Phasor Measurement Units (PMU) stored and handled by the PI System™ from OSIsoft, LLC. The OSIsoft products used in this benchmark were PI Server™ 2012, PI Interface for IEEE C37.118, PI Buffer Subsystem and several proprietary simulators for both generating and extracting PMU data. It was established that PI Server 2012 on Dell’s SRA brings superior performance for grid monitoring applications where tens to hundreds of PMUs are required to reliably monitor and manage a large distribution area. Specifically, PI Server 2012 was benchmarked on this hardware with archiving data rates in excess of 500,000 events per second (EPS), while simultaneously processing up to 20,000,000 EPS for historical data analysis. Dell hardware solutions and the PI System offer many scalability and deployment options beyond the specific configuration described in this benchmark. Please consult Dell and OSIsoft representatives to evaluate your specific needs and obtain a personalized recommendation.

PI Server 2012
© Copyright 2012 OSIsoft, LLC. | 777 Davis Street, San Leandro, CA 94577 | www.osisoft.com 4
2 SYSTEM OVERVIEW
The system was set up to simulate a fleet of over 230 PMUs configured to generate data samples at frequencies staggered between 60Hz, 120Hz and 240Hz. Most PMU simulators were running at 60Hz, while 120Hz and 240Hz were chosen to confirm higher frequencies could be handled equally well. Each simulated PMU was configured to generate 57 distinct measurements that were captured into PI Points by a collection of 9 PI Interface™ nodes running copies of the PI Interface for IEEE C37.118. Data from the PI Interfaces was then handed over to the Buffer Subsystem for final distribution to a 2-node PI Collective™ over a dedicated 1 GB network. The data writes reaching the Snapshot Subsystem of each PI Collective node was between 510K EPS and 800K EPS, while the data rate into the Archive Subsystem (i.e. archiving rate) was measured between 425K EPS and 680K EPS, as a result of 15-20% data compression. From a baseline write load, tests were launched to evaluate the system recovery time from an outage (planned or unexpected), as well as a complex set of read simulations. All read tests were performed from remote computers over a dedicated 10 GB network.
2.1 Dell SRA Hardware and Storage
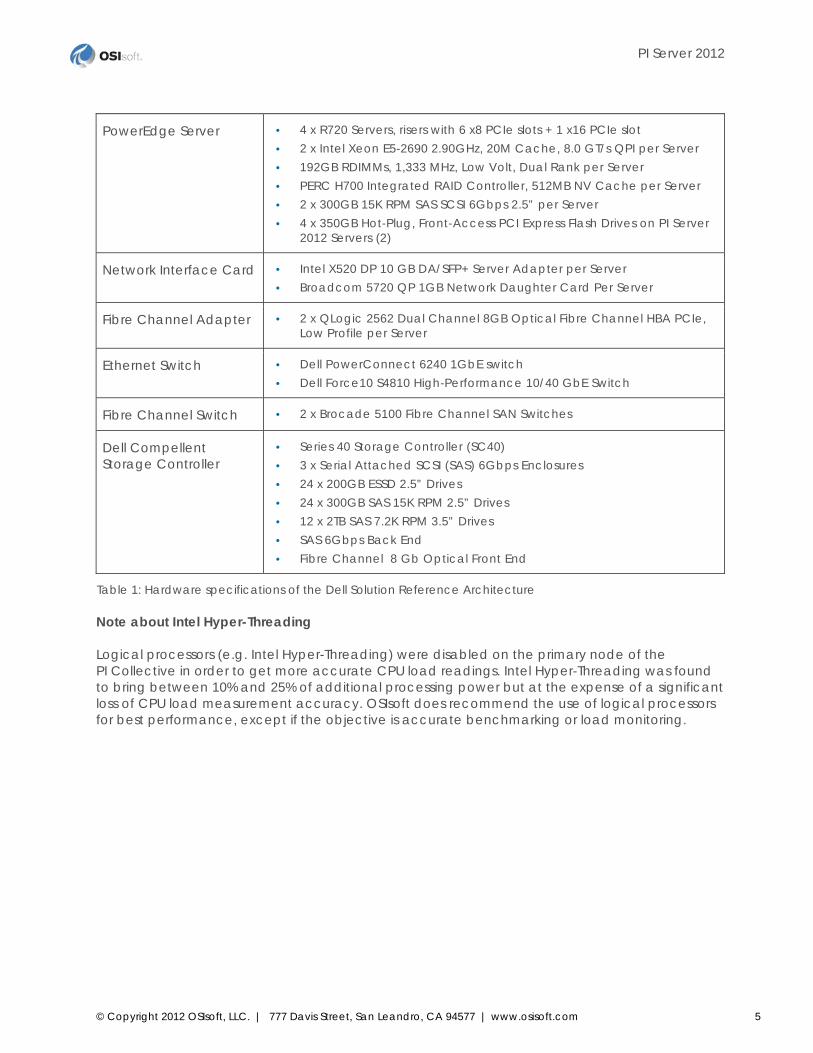
Table 1 below summarizes the hardware component in Dell’s SRA for SmartGrid Data Management, which was made available to OSIsoft in the course of several weeks (July-September 2012). OSIsoft did not alter or customize these hardware components for the purpose of this test.
PI Server 2012
© Copyright 2012 OSIsoft, LLC. | 777 Davis Street, San Leandro, CA 94577 | www.osisoft.com 5
PowerEdge Server • 4 x R720 Servers, risers with 6 x8 PCIe slots + 1 x16 PCIe slot • 2 x Intel Xeon E5-2690 2.90GHz, 20M Cache, 8.0 GT/s QPI per Server • 192GB RDIMMs, 1,333 MHz, Low Volt, Dual Rank per Server • PERC H700 Integrated RAID Controller, 512MB NV Cache per Server • 2 x 300GB 15K RPM SAS SCSI 6Gbps 2.5” per Server • 4 x 350GB Hot-Plug, Front-Access PCI Express Flash Drives on PI Server
2012 Servers (2)
Network Interface Card • Intel X520 DP 10 GB DA/SFP+ Server Adapter per Server • Broadcom 5720 QP 1GB Network Daughter Card Per Server
Fibre Channel Adapter • 2 x QLogic 2562 Dual Channel 8GB Optical Fibre Channel HBA PCIe, Low Profile per Server
Ethernet Switch • Dell PowerConnect 6240 1GbE switch • Dell Force10 S4810 High-Performance 10/40 GbE Switch
Fibre Channel Switch • 2 x Brocade 5100 Fibre Channel SAN Switches
Dell Compellent Storage Controller
• Series 40 Storage Controller (SC40) • 3 x Serial Attached SCSI (SAS) 6Gbps Enclosures • 24 x 200GB ESSD 2.5” Drives • 24 x 300GB SAS 15K RPM 2.5” Drives • 12 x 2TB SAS 7.2K RPM 3.5” Drives • SAS 6Gbps Back End • Fibre Channel 8 Gb Optical Front End
Table 1: Hardware specifications of the Dell Solution Reference Architecture Note about Intel Hyper-Threading Logical processors (e.g. Intel Hyper-Threading) were disabled on the primary node of the PI Collective in order to get more accurate CPU load readings. Intel Hyper-Threading was found to bring between 10% and 25% of additional processing power but at the expense of a significant loss of CPU load measurement accuracy. OSIsoft does recommend the use of logical processors for best performance, except if the objective is accurate benchmarking or load monitoring.

PI Server 2012
© Copyright 2012 OSIsoft, LLC. | 777 Davis Street, San Leandro, CA 94577 | www.osisoft.com 6
2.2 PI System Configuration
Installed Software PI Interfaces (9 x VM nodes)
• Windows Server® 2008 R2 SP1 • OSIsoft PMU Simulator • PI Interface for IEEE C37.118 version 1.0.5.11 • PI Buffer Subsystem version 3.4.380.79 • PI API™ version 1.6.8.12 • PI SDK™ version 1.4.0.416
PI Collective (2 x R720 nodes)
• Windows Server 2008 R2 SP1 • PI Server 2012 RC3, version 3.4.390.15
• C: (RAID1) binaries and DAT files • E: (RAID0) recent archives and event queues, up to 1.2TB • H/I: (SAN) older archives, 20TB total capacity
• PI API version 1.6.8.12 • PI SDK version 1.4.0.416
Table 2: Microsoft® and OSIsoft products installed on Dell SRA Sizing and Tuning The following parameters were changed from the default PI API/PI Buffer Subsystem settings:
• BUF1SIZE=2000000, BUF2SIZE=2000000 (bytes) Size of the PI API shared memory segments
• MAXTRANSFEROBJS=10000 (events) Maximum number of events per network write (RPC payload)
• SENDRATE=10 (milliseconds) Maximum time interval (latency) between network writes
The Archive Subsystem was configured with 8GB archive files that were automatically created on the E: drive (Flash Drives/RAID0) for approximately 14K active PI Points. The PI Event Queue was also located on the E: drive with the default file size (64 MB) and page size (64 KB). The following parameters were changed from the default PI Server settings:
• ARCMAXCOLLECT=2147483647 Maximum historical data collection (events) per PI Point per call
• PIARCHSS_THREADCOUNT,64 Number of PI Archive Subsystem worker threads (readers)
• PISNAPSS_THREADCOUNT,16 Number of PI Snapshot Subsystem worker threads (writers)
All other parameters were left at their default value.
PI Server 2012
© Copyright 2012 OSIsoft, LLC. | 777 Davis Street, San Leandro, CA 94577 | www.osisoft.com 7
3 PERFORMANCE VALIDATION AND BENCHMARKING
3.1 Write Performance
PMU data was first recorded to 8GB archive files located on the PCIe Flash Drives (E:) since it offered the highest IOPS capacity (see Appendix A). These archive files were then moved every night to the multi-tier Compellent SAN used for permanent storage. The PI Server write activity alone could not challenge the bandwidth and throughput from the Flash Drives, as Windows consistently reported E: above 95% idle without a read load. Another evidence of excessive IO resources from the E: drive was with archive shifts, which were performed and completed in less than 10 seconds, without affecting E: below 80% idle (see Archive Shifting section below). Additional tests confirmed the PI Server could use the Compellent SAN (H:/I: drives), or even the SAS RAID1 (C: drive) to safely store all PMU data, as long as no or a moderate read activity was present.
3.1.1 Nominal Data Collection
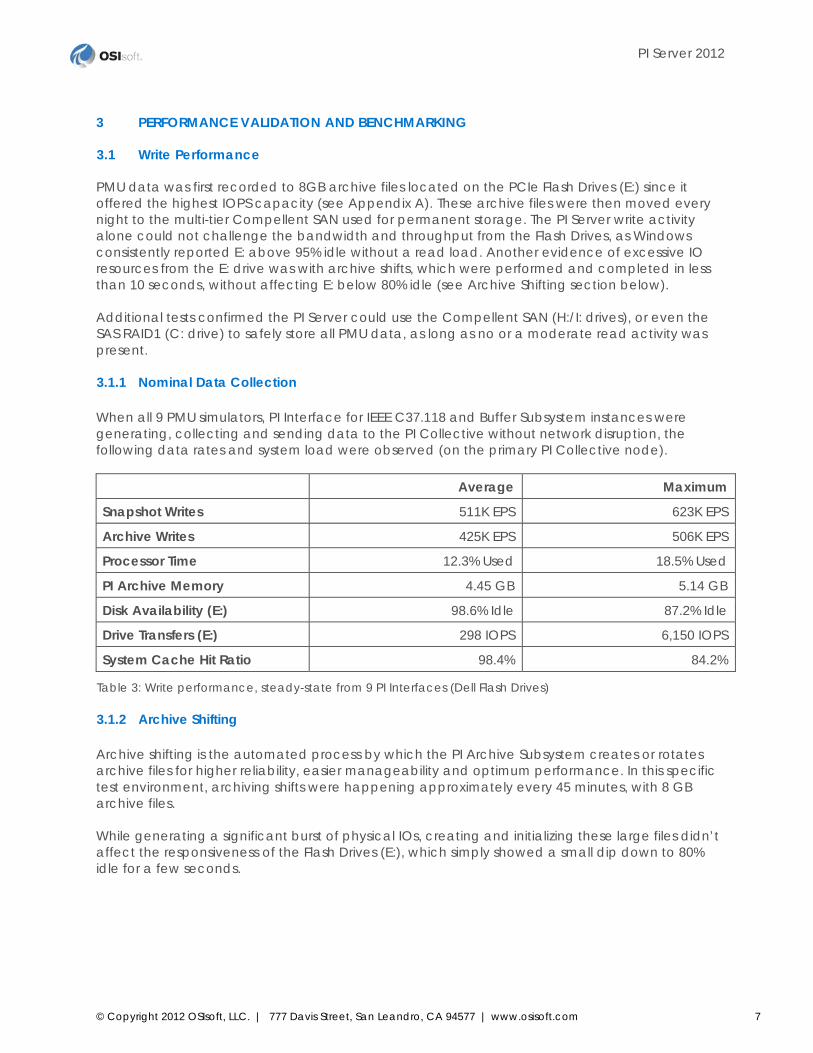
When all 9 PMU simulators, PI Interface for IEEE C37.118 and Buffer Subsystem instances were generating, collecting and sending data to the PI Collective without network disruption, the following data rates and system load were observed (on the primary PI Collective node). Average Maximum
Snapshot Writes 511K EPS 623K EPS
Archive Writes 425K EPS 506K EPS
Processor Time 12.3% Used 18.5% Used
PI Archive Memory 4.45 GB 5.14 GB
Disk Availability (E:) 98.6% Idle 87.2% Idle
Drive Transfers (E:) 298 IOPS 6,150 IOPS
System Cache Hit Ratio 98.4% 84.2%
Table 3: Write performance, steady-state from 9 PI Interfaces (Dell Flash Drives)
3.1.2 Archive Shifting
Archive shifting is the automated process by which the PI Archive Subsystem creates or rotates archive files for higher reliability, easier manageability and optimum performance. In this specific test environment, archiving shifts were happening approximately every 45 minutes, with 8 GB archive files. While generating a significant burst of physical IOs, creating and initializing these large files didn’t affect the responsiveness of the Flash Drives (E:), which simply showed a small dip down to 80% idle for a few seconds.

PI Server 2012
© Copyright 2012 OSIsoft, LLC. | 777 Davis Street, San Leandro, CA 94577 | www.osisoft.com 8
Average Maximum
Archive Shift Time 10 Seconds 11 Seconds
Processor Time 20.3% Used 26.9% Used
PI Archive Memory 4.5 GB 4.5 GB
Disk Availability (E:) 78.7% Idle 75.6% Idle
Drive Transfers (E:) 14,014 IOPS 14,910 IOPS
System Cache Hit Ratio N/A N/A
Table 4: Archive shifting performance against Dell Flash Drives
3.1.3 Network Outage Recovery
After shutting down the primary PI Server node for several minutes to simulate downtime or a network outage, the PI Server was restarted to measure how fast buffered data would be recovered before reaching steady state. We observed an increased data rate of more than 32% (from the nominal rate) for both the Snapshot and Archive data rates, while the IO load was still barely affecting the availability of the Flash Drives. Since the 1 GB network was far from being saturated, the excess IO capacity indicated that potential bottlenecks exist with the PI Interfaces nodes (specifically the Buffer Subsystem) rather than on the server side. Average Maximum
Snapshot Writes 677K EPS 799K EPS
Archive Writes 563K EPS 677K EPS
Processor Time 16.2% Used 27.8% Used
PI Archive Memory 4.45 GB 5.14 GB
Disk Availability (E:) 98.4% Idle 75.6% Idle
Drive Transfers (E:) 503 IOPS 15,259 IOPS
System Cache Hit Ratio 91.2% 72.3%
Table 5: Write performance, recovering from 9 PI Interface nodes (Dell Flash Drives)
3.2 Read Performance
In order to obtain realistic results, all read tests were performed on top of the baseline load described under “Nominal Data Collection” above. No read tests were performed while the PI Server was idle. Unless otherwise noted, a single-threaded C++ client (pievents.exe) was used to simulate client application extracting raw (compressed) or summarized (pre-processed) historical data. This simulator can mimic typical calls made by PI Clients™ such as PI DataLink™, PI ProcessBook™ or PI Coresight™, without the overhead of a GUI layer. In order to maximize the 16 physical cores in the PI Server computers, an average of 32 instances of PIEVENTS were used concurrently.
PI Server 2012
© Copyright 2012 OSIsoft, LLC. | 777 Davis Street, San Leandro, CA 94577 | www.osisoft.com 9
A time range of 12 hours was used in all cases, which corresponds to 2.5M to 6M events per point, depending on sampling rate and compression. The maximum data volume per test never exceeded 128 GB, which is less than the 192 GB of installed RAM. This data volume was carefully chosen so that each test could be repeated in order to study the effects of the Windows File System Cache and PI Archive read cache on query performance. In all cases, the client simulator was executed remotely against the primary PI Server node, over a dedicated (idle) 10 GB network link.
3.2.1 Raw Data Extraction
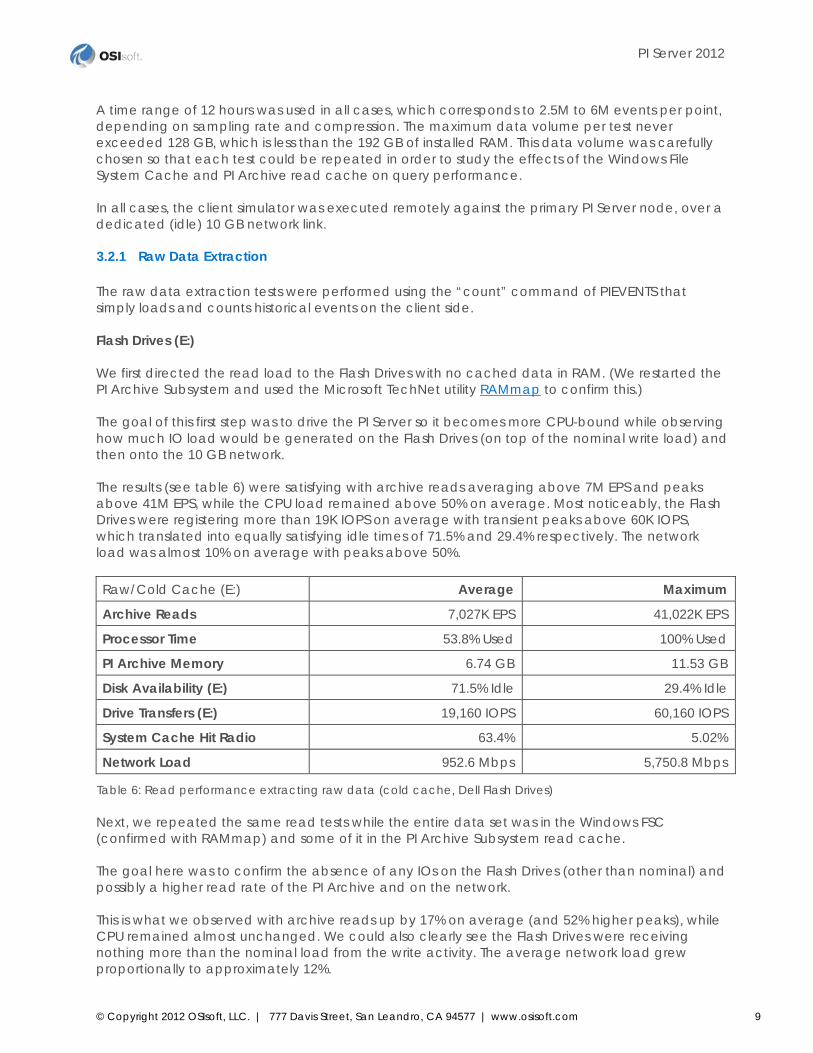
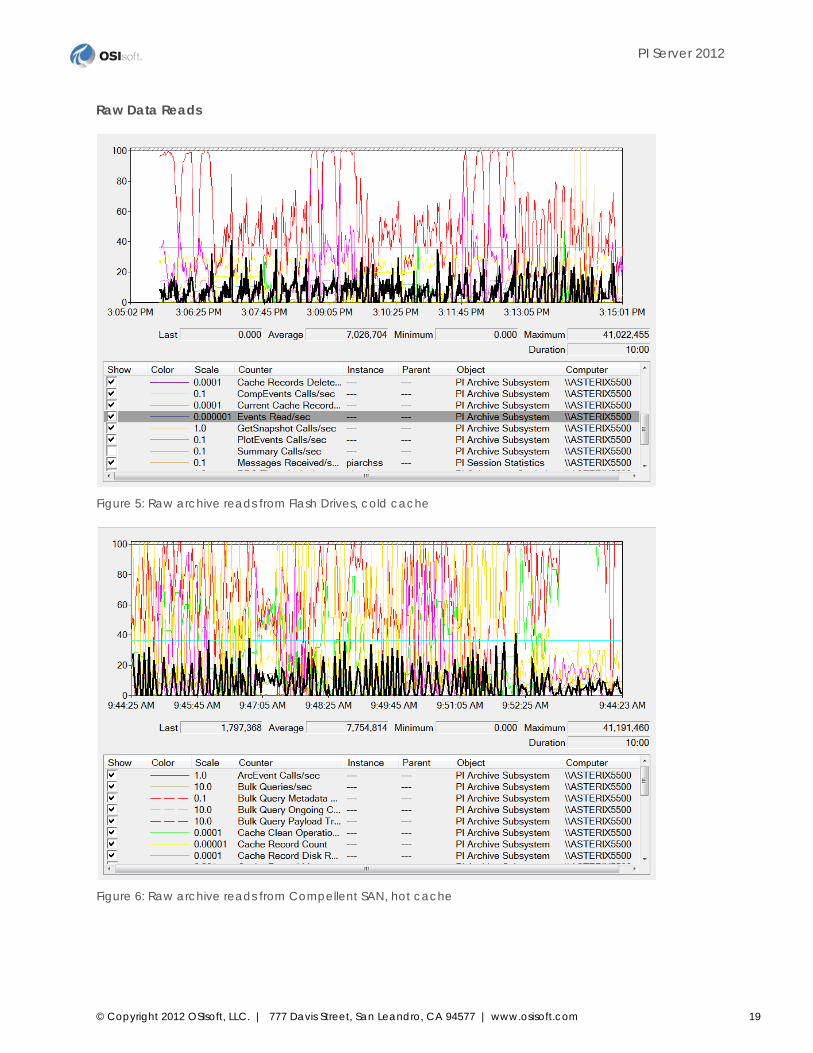
The raw data extraction tests were performed using the “count” command of PIEVENTS that simply loads and counts historical events on the client side. Flash Drives (E:) We first directed the read load to the Flash Drives with no cached data in RAM. (We restarted the PI Archive Subsystem and used the Microsoft TechNet utility RAMmap to confirm this.) The goal of this first step was to drive the PI Server so it becomes more CPU-bound while observing how much IO load would be generated on the Flash Drives (on top of the nominal write load) and then onto the 10 GB network. The results (see table 6) were satisfying with archive reads averaging above 7M EPS and peaks above 41M EPS, while the CPU load remained above 50% on average. Most noticeably, the Flash Drives were registering more than 19K IOPS on average with transient peaks above 60K IOPS, which translated into equally satisfying idle times of 71.5% and 29.4% respectively. The network load was almost 10% on average with peaks above 50%. Raw/Cold Cache (E:) Average Maximum
Archive Reads 7,027K EPS 41,022K EPS
Processor Time 53.8% Used 100% Used
PI Archive Memory 6.74 GB 11.53 GB
Disk Availability (E:) 71.5% Idle 29.4% Idle
Drive Transfers (E:) 19,160 IOPS 60,160 IOPS
System Cache Hit Radio 63.4% 5.02%
Network Load 952.6 Mbps 5,750.8 Mbps
Table 6: Read performance extracting raw data (cold cache, Dell Flash Drives) Next, we repeated the same read tests while the entire data set was in the Windows FSC (confirmed with RAMmap) and some of it in the PI Archive Subsystem read cache. The goal here was to confirm the absence of any IOs on the Flash Drives (other than nominal) and possibly a higher read rate of the PI Archive and on the network. This is what we observed with archive reads up by 17% on average (and 52% higher peaks), while CPU remained almost unchanged. We could also clearly see the Flash Drives were receiving nothing more than the nominal load from the write activity. The average network load grew proportionally to approximately 12%.

PI Server 2012
© Copyright 2012 OSIsoft, LLC. | 777 Davis Street, San Leandro, CA 94577 | www.osisoft.com 10
Raw/Cold Cache (E:) Average Maximum
Archive Reads 8,230K EPS 62,338K EPS
Processor Time 53.7% Used 100% Used
PI Archive Memory 8.24 GB 13.03 GB
Disk Availability (E:) 98.7% Idle 77.8% Idle
Drive Transfers (E:) 299 IOPS 6,188 IOPS
System Cache Hit Radio 98.9% 1.3%
Network Load 1,118.9 Mbps 5,434.3 Mbps
Table 7; Read performance extracting raw data (hot cache, Dell Flash Drives) The relatively small difference in read performance between the cold versus hot cache is another testament of the enormous IO capacity of the Flash Drives as it’s shifting any possible bottlenecks elsewhere (e.g. CPU). While not tested, we would anticipate even higher read performance with more CPU cores, up to the practical IOPS limit of the Flash Drives. Compellent San (I:) To contrast the read performance from the Flash Drives, which were never saturated, we repeated the same read simulations against a set of archive files on the Compellent SAN (I:). As in the previous test, we first performed the raw archive reads with no cached data in RAM. The table 8 below shows the PI Server was clearly IO bound (I: drive being near 0% idle) with a read rate and CPU load proportionally lower than when extracting data out of the Flash Drives. While slower, the Compellent SAN still delivered on average close to 10K IOPS (16K IOPS peaks) over a single 8Gb fiber-channel path.
Raw/Cold Cache (I:) Average Maximum
Archive Reads 3,698K EPS 25,464K EPS
Processor Time 31.3% Used 74.8% Used
PI Archive Memory 5.34 GB 7.61 GB
Disk Availability (I:) 0.1% Idle 0.01% Idle
Drive Transfers (I:) 9,903 IOPS 16,067 IOPS
System Cache Hit Radio 0.0% 0.0%
Network Load 499.7 Mbps 3,040.9 Mbps
Table 8: Read performance extracting raw data (cold cache, Dell Compellent SAN)

PI Server 2012
© Copyright 2012 OSIsoft, LLC. | 777 Davis Street, San Leandro, CA 94577 | www.osisoft.com 11
Next, we repeated the same read test with a hot cache, hoping this time for much higher archive reads as the system would not be limited by its IOPS capacity. The numbers in table 3.4 below confirmed our expectations, with an archive read throughput up by 110% on average at more than 7.7M EPS, while the Compellent SAN was practically idle the entire time.
Raw/Cold Cache (I:) Average Maximum
Archive Reads 7,755K EPS 41,191K EPS
Processor Time 60.8 % Used 100 % Used
PI Archive Memory 9.1 GB 16.69 GB
Disk Availability (I:) 99.8 % Idle 88.9 % Idle
Drive Transfers (I:) <1 IOPS 4 IOPS
System Cache Hit Radio 100 % 100 %
Network Load 1,067.8 Mbps 3,296.2 Mbps
Table 9: Read performance extracting raw data (hot cache, Dell Compellent SAN)
3.2.2 Summarized Data Extractions
The summarized data extraction tests were performed using the “average” command of PIEVENTS, which asks the server to calculate and return the average of all values in a given time range. This test is interesting in that little data is returned to the client, but the same amount of archive data has to be loaded and processed by the PI Archive Subsystem on the server side. Our goal and expectation was to achieve the highest disk IO and/or CPU load with this kind of test, which is closer to what most PI Client applications do in the real world. As an example, PI ProcessBook, PI Coresight or PI WebParts™ don’t ask for raw values to plot them on a graph. Instead, these applications ask the server for a smaller data set that takes into account the number of visible pixels on the screen. Similarly, PI DataLink does not ask for millions of raw values, but instead provides filter criteria that will cut the result set down to hundreds or thousands of data points. Flash Drives (E:) We started our summarized read tests on the Flash Drives (E:) hoping to achieve the highest read throughput. Table 10 below shows the PI Server very close to maxing out CPU resources even though the Windows FSC was entirely cold. Consequently, this is when we achieved the highest IOPS load on the Flash Drives with an average over 31K IOPS and peaks above 76K IOPS (during peak read throughput of 47M+ EPS). This IO load brought the average idle time of the Flash Drives down to less than 60% and a minimum of 22.5%.

PI Server 2012
© Copyright 2012 OSIsoft, LLC. | 777 Davis Street, San Leandro, CA 94577 | www.osisoft.com 12
While not tested, we believe the remaining IO capacity of the Flash Drives could be successfully used for archive shifts, online backups or other IO-intensive operations without affecting the overall system responsiveness.
Summarized/Cold Cache (E:) Average Maximum
Archive Reads 14,584K EPS 47,174K EPS
Processor Time 80.6 % Used 100 % Used
PI Archive Memory 8.58 GB 14.76 GB
Disk Availability (E:) 59.8 % Idle 22.5 % Idle
Drive Transfers (E:) 31,248 IOPS 76,396 IOPS
System Cache Hit Radio 69.0 % 0.0 %
Network Load 0.12 Mbps 7.89 Mbps
Table 10: Read performance extracting summarized data (cold cache, Dell Flash Drive) As expected, the IO load on the Flash Drives was reduced down to the nominal write load of approximately 300 IOPS and 99% idle.
Summarized/Cold Cache (E:) Average Maximum
Archive Reads 18,467K EPS 41,168K EPS
Processor Time 86.4 % Used 100 % Used
PI Archive Memory 10.97 GB 16.68 GB
Disk Availability (E:) 98.7 % Idle 90.7 % Idle
Drive Transfers (E:) 270 IOPS 1,590 IOPS
System Cache Hit Radio 100 % 100 %
Network Load 0.14 Mbps 4.58 Mbps
Table 11: Read performance extracting summarized data (hot cache, Dell Flash Drives) Compellent SAN (I:) To finish the summarized read tests, we wanted to compare the Flash Drives’ performance against the Compellent SAN with the same amount of historical data. Our goal here was to confirm we could approach the read throughput of the Flash Drives if enough RAM was available to cache the contents of archive files.
PI Server 2012
© Copyright 2012 OSIsoft, LLC. | 777 Davis Street, San Leandro, CA 94577 | www.osisoft.com 13
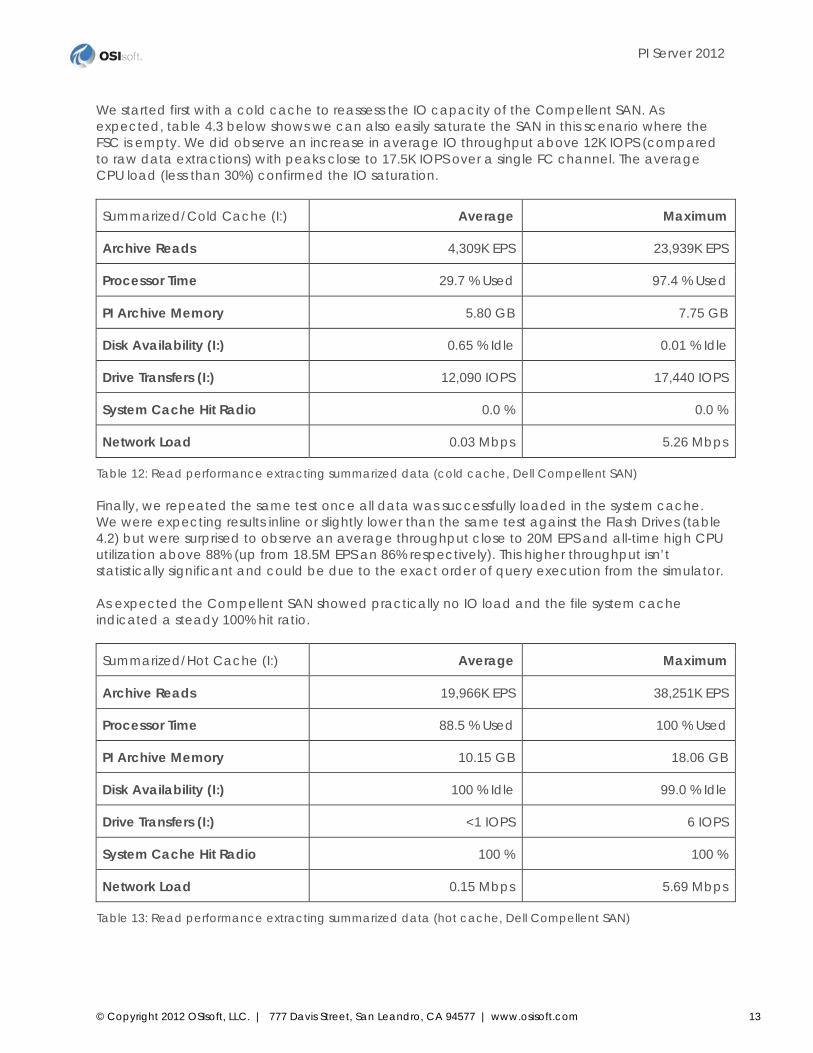
We started first with a cold cache to reassess the IO capacity of the Compellent SAN. As expected, table 4.3 below shows we can also easily saturate the SAN in this scenario where the FSC is empty. We did observe an increase in average IO throughput above 12K IOPS (compared to raw data extractions) with peaks close to 17.5K IOPS over a single FC channel. The average CPU load (less than 30%) confirmed the IO saturation.
Summarized/Cold Cache (I:) Average Maximum
Archive Reads 4,309K EPS 23,939K EPS
Processor Time 29.7 % Used 97.4 % Used
PI Archive Memory 5.80 GB 7.75 GB
Disk Availability (I:) 0.65 % Idle 0.01 % Idle
Drive Transfers (I:) 12,090 IOPS 17,440 IOPS
System Cache Hit Radio 0.0 % 0.0 %
Network Load 0.03 Mbps 5.26 Mbps
Table 12: Read performance extracting summarized data (cold cache, Dell Compellent SAN) Finally, we repeated the same test once all data was successfully loaded in the system cache. We were expecting results inline or slightly lower than the same test against the Flash Drives (table 4.2) but were surprised to observe an average throughput close to 20M EPS and all-time high CPU utilization above 88% (up from 18.5M EPS an 86% respectively). This higher throughput isn’t statistically significant and could be due to the exact order of query execution from the simulator. As expected the Compellent SAN showed practically no IO load and the file system cache indicated a steady 100% hit ratio.
Summarized/Hot Cache (I:) Average Maximum
Archive Reads 19,966K EPS 38,251K EPS
Processor Time 88.5 % Used 100 % Used
PI Archive Memory 10.15 GB 18.06 GB
Disk Availability (I:) 100 % Idle 99.0 % Idle
Drive Transfers (I:) <1 IOPS 6 IOPS
System Cache Hit Radio 100 % 100 %
Network Load 0.15 Mbps 5.69 Mbps
Table 13: Read performance extracting summarized data (hot cache, Dell Compellent SAN)

PI Server 2012
© Copyright 2012 OSIsoft, LLC. | 777 Davis Street, San Leandro, CA 94577 | www.osisoft.com 14
This concluded our read testing on Dell SRA hardware. A significant number of additional tests could be performed to model specific query workloads, network topology and/or PI Client deployments. As mentioned in the introduction, this benchmark simply focused on the core time-series function of PI Server 2012 with high-density data.

PI Server 2012
© Copyright 2012 OSIsoft, LLC. | 777 Davis Street, San Leandro, CA 94577 | www.osisoft.com 15
4 CONCLUSIONS
From the results of this benchmark on Dell Solution Reference Architecture (SRA), we identified or confirmed three critical performance aspects of PI Server 2012 when given the task of high-speed data management, such as high-frequency data from Phasor Measurement Units (PMU). Write Throughput 1. The write load can be safely distributed across many PI Interface nodes for maximum
performance and reliability. With the released PI Buffer Subsystem and PI Interface for IEEE C37.118 we observed sustained data rates of 57K EPS (per collective member) with a recovery rate above 75K EPS on a near-zero latency network (1Gb bandwidth). Note that data rates may vary significantly with higher network latencies.
2. Tests showed that a sustained archiving rate around 500K EPS can be achieved with all
types of server-grade storage. The Snapshot (memory) data rates can be significantly higher depending on network and CPU resources needed to perform data compression and queuing.
Read Throughput 1. Impressive amounts of random-IO disk reads can be sustained by Dell Flash Drives, in
addition to a nominal write load. On this type of storage, PI Server 2012 was observed generating a sustained load above 31K IOPS (76K IOPS peak), which translated into a sustained read throughput of 15M EPS (47M EPS peak), with no help from the system cache.
2. That being said, the read throughput of PI Server 2012 heavily benefits from large amounts
of RAM, even with high-throughput storage such as Dell Flash Drives. With hot data loaded in the system cache, PI Server 2012 was measured processing historical data at nearly 20M EPS while exhausting the resources from 16 physical CPU cores (Intel Xeon E5-2690).
Overall Scalability 1. While Dell SRA provides a unique and balanced level of hardware resources for PI Server
2012, we observed conclusive evidence the software could scale further up if needed. Specifically, we believe additional CPU cores and/or RAM could increase the read throughput beyond what was measured in this benchmark.
2. While this benchmark was performed with a PI High Availability™ (PI HA) system (2-member
PI Collective), we didn’t take advantage of scaling out the read workload from client applications. Assuming enough network resources, near-linear scalability can be accomplished by parallelizing reads across several PI Collective nodes.

PI Server 2012
© Copyright 2012 OSIsoft, LLC. | 777 Davis Street, San Leandro, CA 94577 | www.osisoft.com 16
5 APPENDIX A: THEORETICAL IOPS CAPACITY
The theoretical IOPS capacity as measured by IOmeter (iometer.org) with 1KB random access mixing 2/3 read and 1/3 write operations is shown below for both the Flash Drives and Compellent SAN. Flash Drives The Flash Drives demonstrated an impressive amount of raw IOPS with relatively short IO queues. The most satisfying part of this performance curve is the near-linear scalability of IOPS v.s queue length (up to the satuation point between 32 and 64 pending IOs).
Target Queue Length
4 x PCLe FlashDrive 350GB – RAID0
IOPS Read/sec Writes/sec
1 6,790 4,600 2,264
2 12,725 8,540 4,216
4 23,490 15,856 7,820
8 42,956 28,968 14,240
16 79,450 53,696 26,452
32 134,275 90,620 44,640
64 128,500 84,840 41,792
128 125,800 82,992 40,860
Table 14: Flash Drives IOPS Capacity with small-block random IOs
Figure 1: Flash Drives IOPS Capacity with small-block random IOs

PI Server 2012
© Copyright 2012 OSIsoft, LLC. | 777 Davis Street, San Leandro, CA 94577 | www.osisoft.com 17
Compellent SAN (single channel) The performance profile of Compellent SAN for small-block random IOs was very different, showing a slowing growing IOPS throughput up to 256-512 pending IOs and a nice plateau above that. From this measurement, Compellent SAN seems to thrive on very deep IO queues.
Target Queue Length
24 x SSD 200GB + 24 x 15K 300GB + 12 x 7.2K 2TB
IOPS Read/sec Writes/sec
1 2,635 1,799 886
2 5,041 3,366 1,647
4 8,125 5,456 2,670
8 10,560 7,022 3,477
16 12,170 8,144 4,023
32 14,920 10,061 4,935
64 18,580 12,521 6,139
128 21,980 14,751 7,275
256 24,280 16,198 7,997
512 24,664 16,505 8,144
1024 24,600 16,484 8,092
Table 15: Compellent SAN IOPS Capacity with small-block random IQs
Figure 2: Compellent SAN IOPS Capacity with small-block random IOs
0
5,000
10,000
15,000
20,000
25,000
30,000
1 2 4 8 16 32 64 128 256 512 1024
IOPS
Reads/sec
Writes/sec

PI Server 2012
© Copyright 2012 OSIsoft, LLC. | 777 Davis Street, San Leandro, CA 94577 | www.osisoft.com 18
6 APPENDIX B: SELECT PERFMON SCREENSHOTS
Data Writes recovering from Network Outage
Figure 3: Snapshot and Queue Event Rates (PI Interface recovery)
Figure 4: Archived and Flushed Event Rates (PI Interface recovery)
PI Server 2012
© Copyright 2012 OSIsoft, LLC. | 777 Davis Street, San Leandro, CA 94577 | www.osisoft.com 19
Raw Data Reads
Figure 5: Raw archive reads from Flash Drives, cold cache
Figure 6: Raw archive reads from Compellent SAN, hot cache

PI Server 2012
© Copyright 2012 OSIsoft, LLC. | 777 Davis Street, San Leandro, CA 94577 | www.osisoft.com 20
Summarized Data Reads
Figure 7: Summarized archive reads from Flash Drives, cold cache
Figure 8: Summarized archive reads from Compellent SAN, hot cache

PI Server 2012
© Copyright 2012 OSIsoft, LLC. | 777 Davis Street, San Leandro, CA 94577 | www.osisoft.com 21
7 ABOUT OSISOFT, LLC
OSIsoft (www.osisoft.com) delivers the PI System, the industry standard in enterprise infrastructure, for management of real-time data and events. With installations in 110 countries spanning the globe, the PI System is used in manufacturing, energy, utilities, life sciences, data centers, facilities and the process industries. This global installed base relies upon the PI System to safeguard data and deliver enterprise-wide visibility into operational, manufacturing and business data. The PI System enables users to manage assets, mitigate risks, comply with regulations, improve processes, drive innovation, make business decisions in real-time and to identify competitive business and market opportunities. Founded in 1980, OSIsoft is headquartered in San Leandro, California, with operations worldwide and is privately held.

PI Server 2012
© Copyright 2012 OSIsoft, LLC. | 777 Davis Street, San Leandro, CA 94577 | www.osisoft.com 22
Change History Revision Author Date Comment
1a Denis Vacher September 17, 2012 First draft submitted for review
1b Denis Vacher September 18, 2012 Included suggestions and corrections from Jay Lakumb and Andy Tran

All companies, products and brands mentioned are trademarks of their respective trademark owners.
For more information please visit www.osisoft.com
Authors and Contributors:
Denis Vacher, PI Server Team (OSIsoft) Greg Holt, PI Server Team (OSIsoft)
Dave Rogers, PI Server Team (OSIsoft) Ivan Yudhi, Field Service Engineering (OSIsoft)
Andy Tran, Solutions Architecture (Dell)
A white paper produced by: