Phytotoxicity and Efficacy of Fascination (6-Benzyl
13
Phytotoxicity and Efficacy of Fascination (6-Benzyl Adenine + Gibberellic Acid) for Enhanced Branching of Mexican Sage (Salvia leucantha) By Heiner Lieth, Director Linda Dodge Shannon Still Lea Ragaini Ron Lane Jackie Fortunko Project: Interregional Research Project #4 Project Number 23211A - July 22, 2004 Acknowledgements: Ahmet Gulcu Donors/Supporters: CDFA Minor Crops Research Grant, Project 2: Enhancement of the Western Region IR-4 Program to Address California Needs Green Leaf Perennials, Lancaster, PA UC Davis Environmental Horticulture IR4 Center Department of Environmental Horticulture University of California One Shields Ave. Davis, CA 95616 http://envhort.ucdavis.edu/ir4
Transcript of Phytotoxicity and Efficacy of Fascination (6-Benzyl

Phytotoxicity and Efficacy of Fascination (6-Benzyl Adenine + Gibberellic Acid)
for Enhanced Branching of Mexican Sage (Salvia leucantha)
By
Heiner Lieth, Director
Linda Dodge Shannon Still Lea Ragaini Ron Lane
Jackie Fortunko
Project: Interregional Research Project #4 Project Number 23211A - July 22, 2004
Acknowledgements: Ahmet Gulcu Donors/Supporters: CDFA Minor Crops Research Grant, Project 2: Enhancement of the Western
Region IR-4 Program to Address California Needs Green Leaf Perennials, Lancaster, PA
UC Davis Environmental Horticulture IR4 Center Department of Environmental Horticulture University of California One Shields Ave. Davis, CA 95616 http://envhort.ucdavis.edu/ir4
Heiner
Text Box
Reports, Limited #88

PR.NO.: 23211A TRIAL: 1 DATE: 7/22/04
2
IR-4 ORNAMENTAL DATA REPORTING FORM (Please type or print) 1. INVESTIGATOR (Name, Address, Phone#):
Dr. Heiner Lieth Department of Environmental Horticulture University of California One Shields Ave. Davis, CA 95616 Ph 530-752-7198 FAX 530-752-1819 Email: [email protected]
LOCATION OF TRIAL: TRIAL TYPE:(check one) FIELD CONTAINER X GREENHOUSE INTERIORSCAPE
2. PESTICIDE:
COMMON NAME: 6-Benzyl Adenine + Gibberellic Acid A4 A7 FORMULATION: 1.8% + 1.8% (w/w)
BATCH NO.: PRODUCT: Fascination EPA REG. NO. 27135 MFG: Valent
3. USE INFORMATION: COMMON NAME SCIENTIFIC NAME
PLANT: Mexican Sage Salvia leucantha REASON: enhanced branching of potted crops SOIL TYPE OR TYPE OF POTTING MIX: UC Mix
% SAND 35 % SILT % CLAY % OM 65 % pH 6.5 SEEDING DATE EMERGENCE DATE TRANSPLANTING DATE 4/23/04 PLANT OR POT SPACING 6” ROW SPACING 6” POT SIZE 6-inch PLOT SIZE 50 sq. ft. EXPERIMENTAL DESIGN randomized complete block NO.OF REPS 9
(3 blocks) 4. APPLICATION PARAMETERS:
TYPE OF APPLICATION: foliar NO. OF APPLICATIONS 2 APPLICATION TYPE manual spray bottle
NOZZLE TYPE/SIZE NOZZLE PRESSURE DELIVERY RATE CALIBRATION DATE(S)
5. APPLICATION SUMMARY:
APPL.DATE
RATES (ppm)*
GROWTH STAGE
6/10/04
0, 125 (0.5X), 250 (1X), 500 (2X)
7 weeks post-transplant
7/01/04
0, 125 (0.5X), 250 (1X), 500 (2X)
10 weeks post-transplant
*Be sure to provide units

PR.NO.: 23211A TRIAL: 1 DATE: 7/22/04
3
IR-4 ORNAMENTAL DATA REPORTING FORM (Please type or print) 6. RAINFALL/IRRIGATION RECORDS:
INCLUDE RAINFALL/IRRIGATION INFORMATION (printouts, IR-4 forms, etc.) Plants were watered as needed (at least once daily) with half-strength Hoagland’s solution
7. OTHER PESTICIDES, FERTILIZER, LIME AND ADJUVANTS USED:
PRODUCT Flagship + Conserve AMOUNT DATE 6/14/04 PRODUCT Orthene + Sanmite AMOUNT DATE 6/23/04 PRODUCT Orthene + Heritage AMOUNT DATE 6/30/04 PRODUCT Talstar F AMOUNT DATE 7/08/04 PRODUCT Pylon AMOUNT DATE 7/21/04
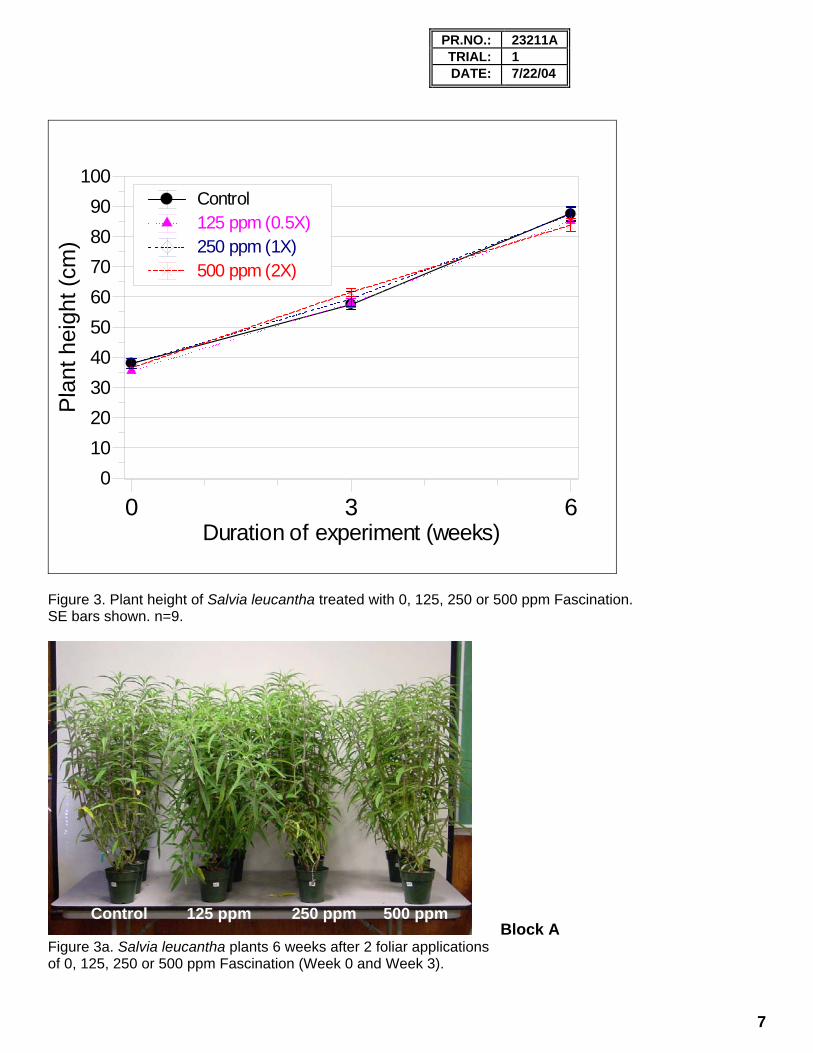
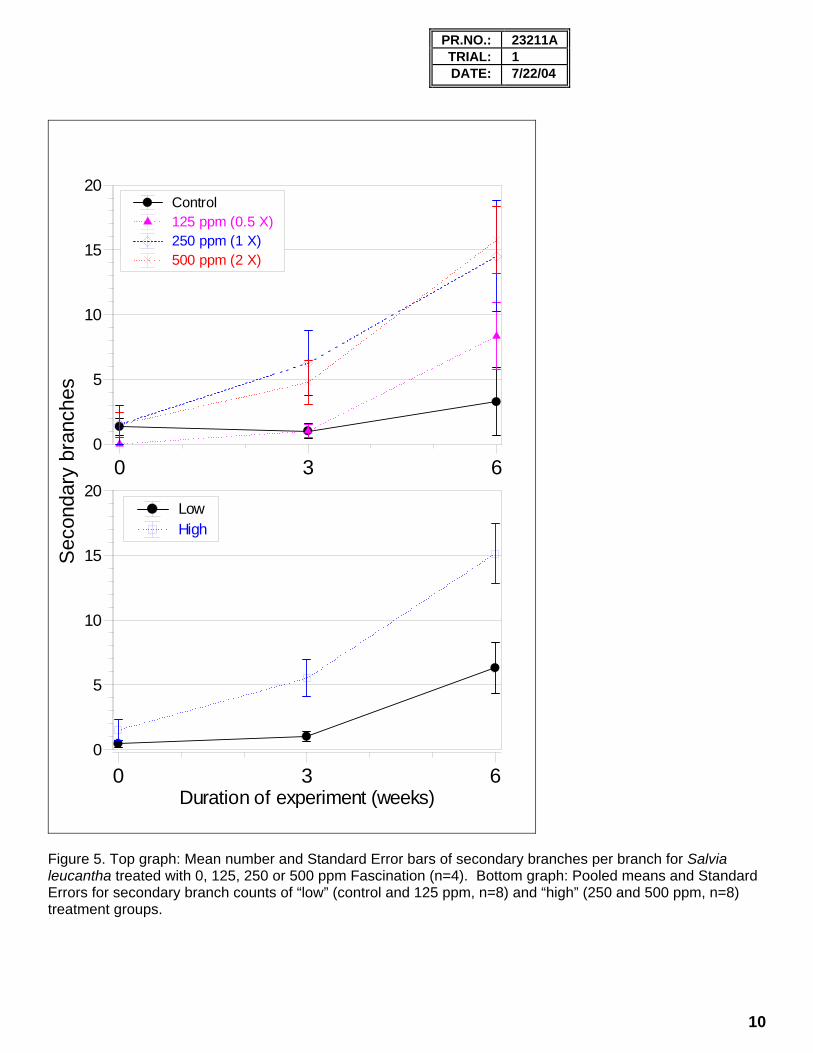
8. NARRATIVE SUMMARY OF METHODS AND RESULTS: (Use more pages if needed) Materials and Methods Plant Material and Culture. Young plants of Salvia leucantha were received from Yoder Bros. on 4/12/04. These were transplanted to 4-inch pots containing UC Mix on 4/23/04 and maintained in a greenhouse under natural day length for 7 weeks until the experiment began on June 10, 2004. Prior to the experiment, the plants were pruned and repotted into 6-inch pots. For the experiment, the plants were transferred to a greenhouse under natural day length with day/night temperatures of 82°F/62°F (28°C/17°C) (Figure 1). The plants were watered as needed (at least once daily) during the 6-week experiment with half-strength Hoagland’s solution. Applications of pesticides as part of a normal pest management program were made as needed (see No. 7 above). Experimental Procedure. Thirty-six plants were randomly chosen and individually tagged for treatment with 0, 125 ppm (0.5X), 250 ppm (1X) or 500 ppm (2X) Fascination with 9 replicates per treatment. These dosages were prescribed in an IR4 Fascination protocol dated 6/04 (Appendix A). The plants received the first of two foliar spray applications of the designated treatments on June 10, 2004 using manual spray bottles to spray leaves to runoff. The second application was made 21 days later on July 1, 2004. The plants were arranged in a randomized complete block design with 3 blocks and 3 treatment replicates per block. Phytotoxicity and efficacy measurements were taken at day 0 (June 10, 2004), day 21 (July 1, 2004) and day 42 (July 22, 2004). Phytotoxicity evaluations were based on a numerical rating scale of 0 (no injury) to 10 (complete kill) (Table 1). Efficacy measurements consisted of overall plant height (cm) and width (cm) and the number of secondary branches on one tagged branch per plant was counted on 4 randomly chosen replicates per treatment. Statistical Analysis. The data were analyzed using Proc GLM of the Statistical Analysis System (SAS). The phytotoxicity and change in mean value from the starting plant height and width were analyzed for significant differences using t-tests. Data were also analyzed by grouping control and 125 ppm (“low”) and 250 and 500 ppm (“high”) for comparison with the same statistical procedures. Results Phytotoxicity. Fascination at all rates tested produced no phytotoxicity on plants of Salvia leucantha (Figure 2, Appendix B). The recorded plant damage values were due to chlorosis of lower leaves which occurred equally in all treatment groups and control. Efficacy. Fascination did not affect height of Salvia leucantha at 3 or 6 weeks as compared to control (Figures 3 and 3a, Table 2). Fascination at all rates had no effect on S. leucantha plant width (Figure 4, Table 2) at 3 or 6 weeks as compared to control (0 ppm). When comparing “high” against “low”, we find that the “high” treatments had significantly more secondary branches than the “low” treatments at both 3 and 6 weeks (Figure 5, Appendix C).
PR.NO.: 23211A TRIAL: 1 DATE: 7/22/04
4
Discussion Phytotoxicity. Fascination did not cause phytotoxicity symptoms on Salvia leucantha at any of the tested application rates. Efficacy. Fascination at rates of 250 ppm (1X) and 500 ppm (2X) increased secondary branching on S. leucantha at 3 weeks. No differences in branching were discernable at 6 weeks but this is due to the small sample size and variation in observations. When treatments are grouped into “low” (control and 125 ppm) and “high” (250 ppm and 500 ppm), we do observe significant increases in secondary branch counts for the “high” group at both 3 and 6 weeks. This indicates that Fascination is effective for increasing branching, but does so without affecting the overall volume of the plant. 9. GOOD RESEARCH PRACTICE STATEMENT:
I acknowledge that I have read and followed the IR-4 Research protocol and completed this trial following good agricultural practice, or reported any deviations (note any changes from authorized protocol in narrative).
SIGNATURE DATE PRINCIPAL INVESTIGATOR
PR.NO.: 23211A TRIAL: 1 DATE: 7/22/04
5
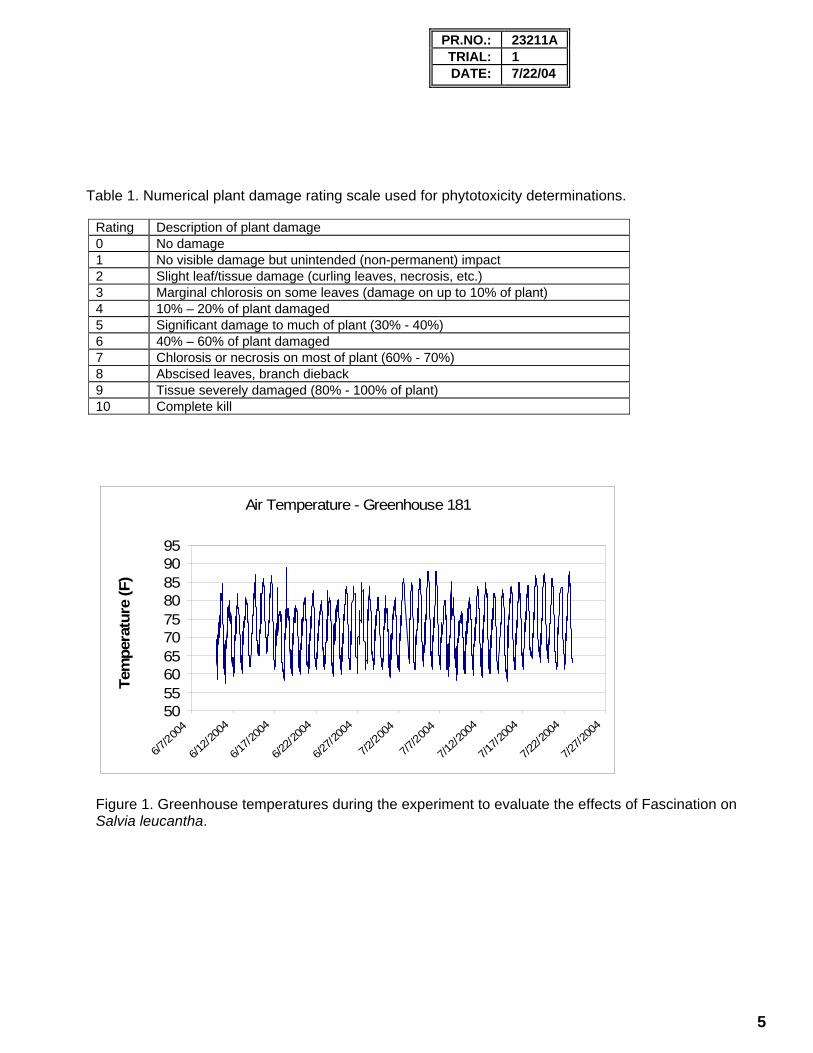
Table 1. Numerical plant damage rating scale used for phytotoxicity determinations.
Rating Description of plant damage 0 No damage 1 No visible damage but unintended (non-permanent) impact 2 Slight leaf/tissue damage (curling leaves, necrosis, etc.) 3 Marginal chlorosis on some leaves (damage on up to 10% of plant) 4 10% – 20% of plant damaged 5 Significant damage to much of plant (30% - 40%) 6 40% – 60% of plant damaged 7 Chlorosis or necrosis on most of plant (60% - 70%) 8 Abscised leaves, branch dieback 9 Tissue severely damaged (80% - 100% of plant) 10 Complete kill
Air Temperature - Greenhouse 181
50556065707580859095
6/7/200
4
6/12/2
004
6/17/2
004
6/22/2
004
6/27/2
004
7/2/200
4
7/7/200
4
7/12/2
004
7/17/2
004
7/22/2
004
7/27/2
004
Tem
pera
ture
(F)
Figure 1. Greenhouse temperatures during the experiment to evaluate the effects of Fascination on Salvia leucantha.

PR.NO.: 23211A TRIAL: 1 DATE: 7/22/04
6
0123456789
10
Phy
toto
xic i
ty in
dex
0 3 6Duration of experiment (weeks)
Control125 ppm (0.5X)250 ppm (1X)500 ppm (2X)
Figure 2. Phytotoxicity Index for Salvia leucantha treated with 0, 125, 250 or 500 ppm Fascination. SE bars shown. n=9. See Table 1 for explanation of values.
Table 2. Average increase (cm) of height and width for plants in the control and Fascination treatments for Salvia leucantha. Different letters within a column indicate significant differences between different treatments (P < 0.05). Means ± SE (n=9).
Height increase (cm) Width increase (cm) over 3 weeks over 6 weeks over 3 weeks over 6 weeks Control 19.56 ± 1.75 a 49.44 ± 2.15 a 20.11 ± 1.23 a 33.22 ± 1.83 a 125 ppm 22.56 ± 1.55 ab 49.67 ± 0.93 a 25.11 ± 1.24 a 36.00 ± 1.91 a 250 ppm 21.44 ± 2.45 ab 49.44 ± 2.51 a 21.56 ± 1.33 a 34.33 ± 1.97 a 500 ppm 25.11 ± 1.33 b 47.33 ± 2.11 a 21.22 ± 2.14 a 34.00 ± 2.19 a
PR.NO.: 23211A TRIAL: 1 DATE: 7/22/04
7
0102030405060708090
100
Pla
nt h
eigh
t (cm
)
0 3 6Duration of experiment (weeks)
Control125 ppm (0.5X)250 ppm (1X)500 ppm (2X)
Figure 3. Plant height of Salvia leucantha treated with 0, 125, 250 or 500 ppm Fascination. SE bars shown. n=9.
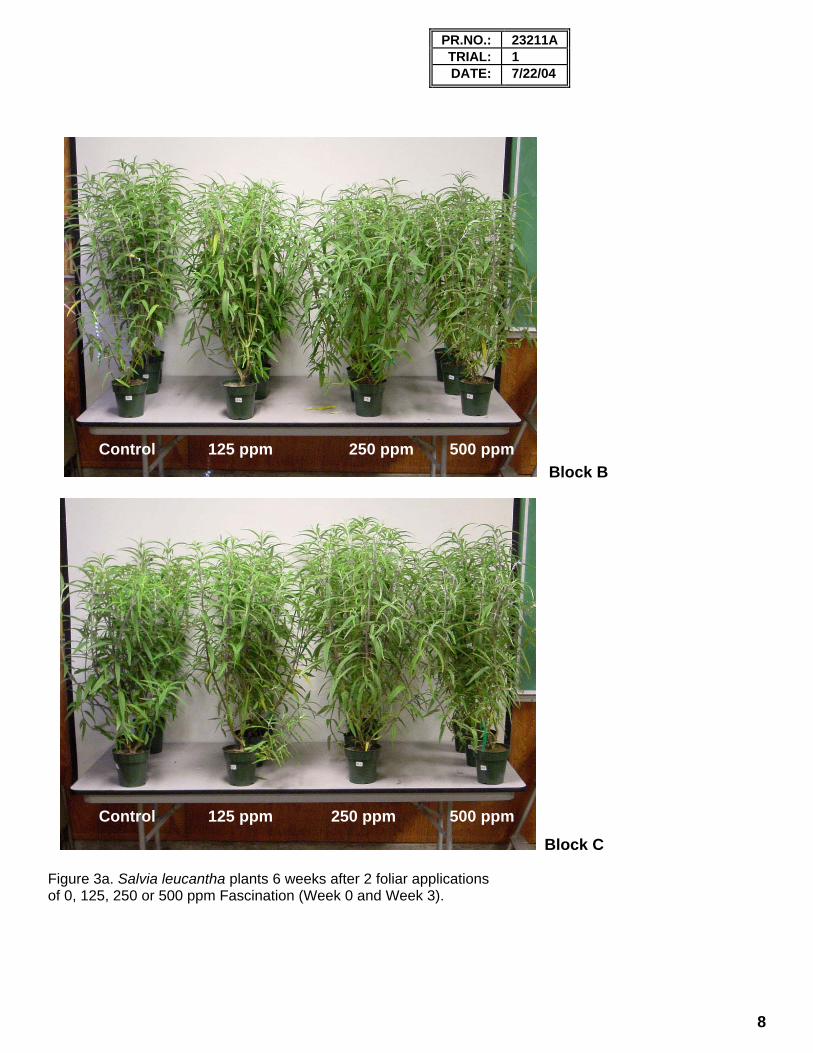
Block A Figure 3a. Salvia leucantha plants 6 weeks after 2 foliar applications of 0, 125, 250 or 500 ppm Fascination (Week 0 and Week 3).
Control 125 ppm 250 ppm 500 ppm
PR.NO.: 23211A TRIAL: 1 DATE: 7/22/04
8
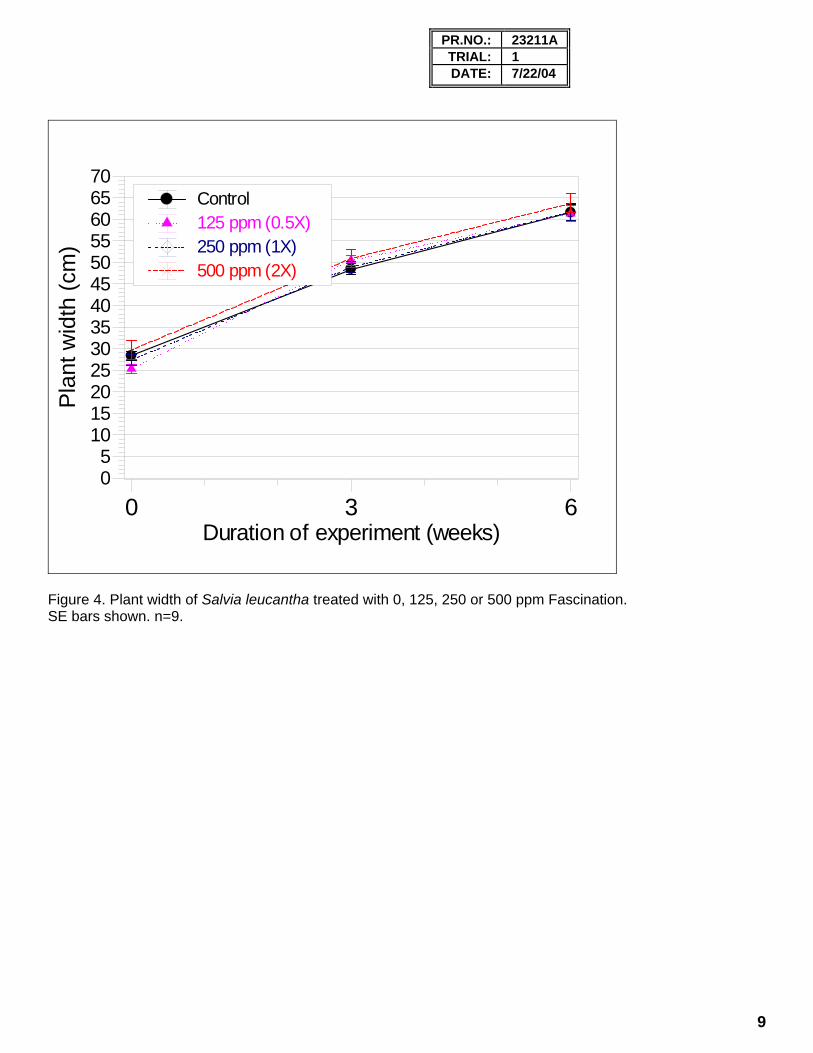
Block B
Block C Figure 3a. Salvia leucantha plants 6 weeks after 2 foliar applications of 0, 125, 250 or 500 ppm Fascination (Week 0 and Week 3).
Control 125 ppm 250 ppm 500 ppm
Control 125 ppm 250 ppm 500 ppm
PR.NO.: 23211A TRIAL: 1 DATE: 7/22/04
9
05
10152025303540455055606570
Pla
nt w
idth
(cm
)
0 3 6Duration of experiment (weeks)
Control125 ppm (0.5X)250 ppm (1X)500 ppm (2X)
Figure 4. Plant width of Salvia leucantha treated with 0, 125, 250 or 500 ppm Fascination. SE bars shown. n=9.
PR.NO.: 23211A TRIAL: 1 DATE: 7/22/04
10
0
5
10
15
20
0
5
10
15
20
0 3 6Duration of experiment (weeks)
0 3 6
LowHigh
Control125 ppm (0.5 X)250 ppm (1 X)500 ppm (2 X)
Sec
onda
ry b
ranc
hes
Figure 5. Top graph: Mean number and Standard Error bars of secondary branches per branch for Salvia leucantha treated with 0, 125, 250 or 500 ppm Fascination (n=4). Bottom graph: Pooled means and Standard Errors for secondary branch counts of “low” (control and 125 ppm, n=8) and “high” (250 and 500 ppm, n=8) treatment groups.
PR.NO.: 23211A TRIAL: 1 DATE: 7/22/04
11
Appendix A: GROWTH ENHANCEMENT OF ORNAMENTAL PLANTS WITH FOLIAR APPLICATIONS OF 6-BENZYL ADENINE + GIBBERELLIC ACID (FASCINATION) Date: 6/04 Ornamental Protocol Number: 670 General label directions: Refer to product label or Technical Bulletin. Research program: Pest(s)/Plants – Plants other than labeled species. Pesticide (common name and trade name): Refer to treatment list shown below. For label, material & if needed, spray surfactant contact: Valent USA, Joe Chamberlin, 770-985-0303, [email protected]
Plot size (must be adequate to reflect actual use condition) Replicates Minimum of 4 Treatment Units Controls (untreated controls to be included in all experiments)
Application: FASCINATION Dosages - 1/2x 125 ppm or 0.125 pt/5 gal.
1x 250 ppm or 0.25 pt/5 gal. 2x 500 ppm or 0.5 pt/5 gal.
Active Ingredient: 6-benzyl adenine + gibberellic acid (FASCINATION). Volume - Minimum of 100 gal/A. Timing - 2 Applications, 21 day spray interval. Record number of branches and length, then increased branching, increased extension and crop safety at 7, 14, 21 (then 2
nd appl.), 28 and 42 DAT.
Reports: Method of application: Treatments should be applied according to product label instructions. application equipment consistent with
conventional commercial equipment. Report completely on experimental design and method of application. Report plant size height x width before treatment and throughout the experiment.
Weather – Maintain temperature and precipitation (including irrigation) data. Soil type – Identify soil type used in experimental area. Product – When submitting data, include EPA registration number of product used. Efficacy – Data should include percent control as well as an indication that infestation was light, heavy, etc. Record all application and evaluation dates. Phytotoxicity – Record phytotoxicity data at all rates. Use a 0-10 scale. 0 = No Phytotoxicity 10 = complete kill. Please direct questions to: Dr. Robert M. Herrick, IR-4 Project, 681 US Highway #1 South, North Brunswick, NJ Phone: (732) 932-9575, Ext. 629.
PR.NO.: 23211A TRIAL: 1 DATE: 7/22/04
12
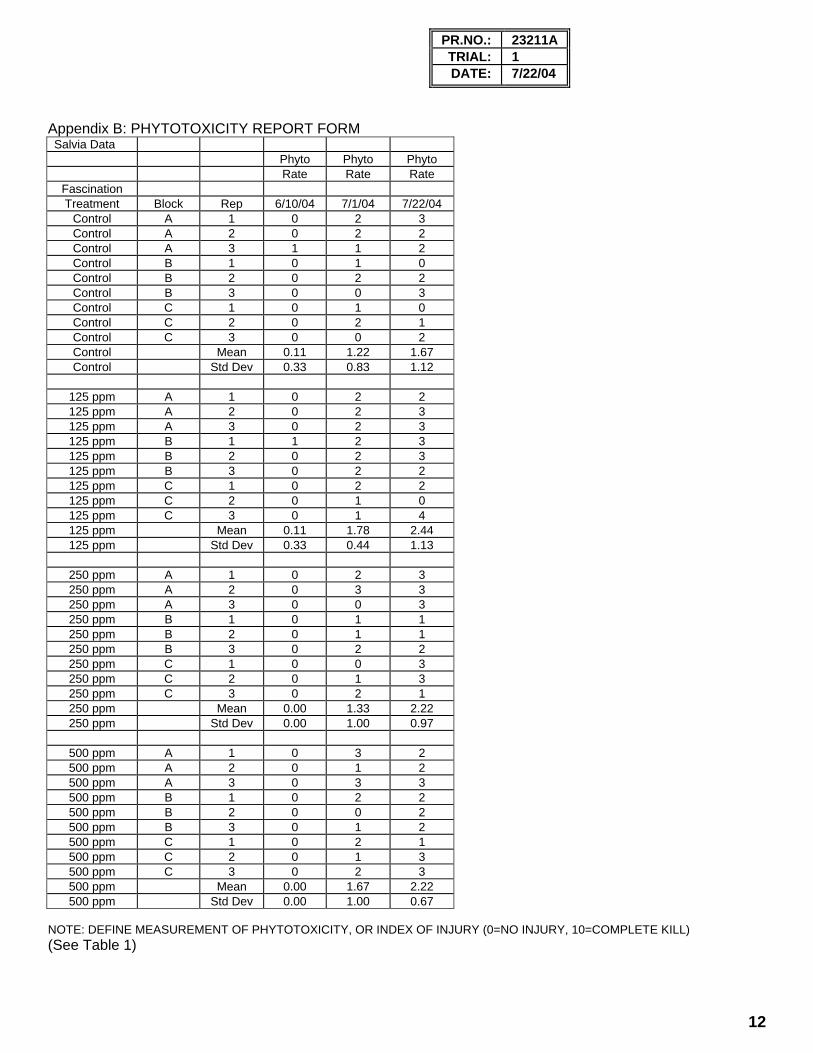
Appendix B: PHYTOTOXICITY REPORT FORM Salvia Data Phyto Phyto Phyto
Rate Rate Rate Fascination Treatment Block Rep 6/10/04 7/1/04 7/22/04
Control A 1 0 2 3 Control A 2 0 2 2 Control A 3 1 1 2 Control B 1 0 1 0 Control B 2 0 2 2 Control B 3 0 0 3 Control C 1 0 1 0 Control C 2 0 2 1 Control C 3 0 0 2 Control Mean 0.11 1.22 1.67 Control Std Dev 0.33 0.83 1.12
125 ppm A 1 0 2 2 125 ppm A 2 0 2 3 125 ppm A 3 0 2 3 125 ppm B 1 1 2 3 125 ppm B 2 0 2 3 125 ppm B 3 0 2 2 125 ppm C 1 0 2 2 125 ppm C 2 0 1 0 125 ppm C 3 0 1 4 125 ppm Mean 0.11 1.78 2.44 125 ppm Std Dev 0.33 0.44 1.13
250 ppm A 1 0 2 3 250 ppm A 2 0 3 3 250 ppm A 3 0 0 3 250 ppm B 1 0 1 1 250 ppm B 2 0 1 1 250 ppm B 3 0 2 2 250 ppm C 1 0 0 3 250 ppm C 2 0 1 3 250 ppm C 3 0 2 1 250 ppm Mean 0.00 1.33 2.22 250 ppm Std Dev 0.00 1.00 0.97
500 ppm A 1 0 3 2 500 ppm A 2 0 1 2 500 ppm A 3 0 3 3 500 ppm B 1 0 2 2 500 ppm B 2 0 0 2 500 ppm B 3 0 1 2 500 ppm C 1 0 2 1 500 ppm C 2 0 1 3 500 ppm C 3 0 2 3 500 ppm Mean 0.00 1.67 2.22 500 ppm Std Dev 0.00 1.00 0.67
NOTE: DEFINE MEASUREMENT OF PHYTOTOXICITY, OR INDEX OF INJURY (0=NO INJURY, 10=COMPLETE KILL) (See Table 1)

PR.NO.: 23211A TRIAL: 1 DATE: 7/22/04
13
Appendix C: EFFICACY REPORT FORM Salvia Data Plant Plant Plant Plant Plant Plant
Height Height Height Width Width Width # Branches # Branches # Branches Fascination (cm) (cm) (cm) (cm) (cm) (cm) Treatment Block Rep 6/10/2004 7/1/2004 7/22/2004 6/10/2004 7/1/2004 7/22/2004 6/10/2004 7/1/2004 7/22/2004
Control A 1 38 58 87 23 51.25 63.25 2 2 11 Control A 2 40 60.5 80.5 27.75 45 54.25 Control A 3 37.5 61 91.5 31.75 53 58.75 Control B 1 44.5 64.5 96 31.25 42 57.75 0 0 0 Control B 2 38.5 61.5 96.5 27.5 52.5 58.25 Control B 3 40 50.5 85 25.5 48.5 58.5 0 0 Control C 1 34 53 79 32.5 46 67 2 2 2 Control C 2 35 56.5 87.5 28 47.5 71.5 Control C 3 32.5 49.5 81.5 25.75 49 63.5 Control Mean 37.78 57.22 87.17 28.11 48.31 61.42 1.33 1.00 3.25 Control Std Dev 3.63 5.24 6.44 3.19 3.63 5.37 1.15 1.15 5.25
125 ppm A 1 34 57 79 20.25 51.5 70.5 0 3 12 125 ppm A 2 35 57 86 27.75 55.75 65.25 0 2 18 125 ppm A 3 35 55 84.5 27.5 48.75 64.75 0 0 6 125 ppm B 1 34.5 60.5 85.5 28.25 53.25 55.25 125 ppm B 2 40 66.5 86 25 52.75 60 125 ppm B 3 35.5 50.5 85 27.5 47.25 58.5 0 0 0 125 ppm C 1 36.5 60 86.5 23.75 48 52 125 ppm C 2 35 60 88.5 25.25 51.75 64 0 0 4 125 ppm C 3 32 54 82.5 21.5 44 61 0 1 10 125 ppm Mean 35.28 57.83 84.83 25.19 50.33 61.25 0.00 1.00 8.33 125 ppm Std Dev 2.15 4.60 2.72 2.89 3.62 5.61 0.00 1.26 6.38
250 ppm A 1 35.5 51 89 31 51.5 63.25 6 12 24 250 ppm A 2 32.5 47 85.5 30 52.5 65.75 250 ppm A 3 46.5 66 92 22 40.5 56 250 ppm B 1 35.5 56.5 81.5 30.5 49 71.25 0 0 4 250 ppm B 2 31 55 71 23 49 62.5 250 ppm B 3 36 61 85 30 52.25 54.75 0 8 12 250 ppm C 1 37 64.5 94.5 27 51.75 67.75 0 5 18 250 ppm C 2 42 63 93.5 23.5 47.25 57 250 ppm C 3 42.5 69 92 27.75 44.75 55.5 250 ppm Mean 37.61 59.22 87.11 27.19 48.72 61.53 1.50 6.25 14.50 250 ppm Std Dev 5.05 7.32 7.46 3.53 4.02 6.00 3.00 5.06 8.54
500 ppm A 1 40.5 66 86 41.75 48 58.5 4 8 23 500 ppm A 2 39.5 62.5 87.5 21.25 52.5 62.25 500 ppm A 3 32 63.5 84.5 26.75 58 64 500 ppm B 1 33 52.5 73 32.25 57 79.5 500 ppm B 2 33.5 63.5 89.5 25.25 59.5 58.5 500 ppm B 3 37 62 79 31.5 47.25 64.25 0 0 12 500 ppm C 1 34 58 76 32.25 48.75 61.25 2 6 12 500 ppm C 2 37 59.5 86 35.25 43.75 65 0 5 16 500 ppm C 3 39.5 63.5 90.5 20.5 42 59 500 ppm Mean 36.22 61.22 83.56 29.64 50.75 63.58 1.50 4.75 15.75 500 ppm Std Dev 3.19 4.03 6.14 6.86 6.33 6.48 1.91 3.40 5.19