Phytoplankton in the Surface Layers of the South China Sea...
15
Southeast Asian Fisheries Development Center 220 Phytoplankton in the Surface Layers of the South China Sea, Area III: Western Philippines Fe Farida A. Bajarias Bureau of Fisheries and Aquatic Resources, 860 Arcadia Bldg., Quezon Ave., Quezon City, Philippines ABSTRACT Phytoplankton in the surface layers of South China Sea, Western Philippines were investigated for species composition, distribution and abundance. Thirty one stations were sampled during the cruise of M/V SEAFDEC to South China Sea along latitudes 8° to 20°N and longitudes 115° to 121°E from April 15 to May 11,1998. In each station, water samples at the surface and at depths of 20, 40 and 60-m were collected by a 20-liters capacity Van-Dorn water sampler. Results of the phytoplankton analysis yielded a total of 56 taxa. These included 3 species of blue-green algae; 1 genus of Chrysophytes; 32 genera of diatoms and 20 genera of dinoflagellates. The phytoplankton assemblage was dominated by Bacillariophyceae or diatoms which accounted for 73% of the total standing stock. The top 5 most dominant representatives were Chaetoceros spp (962 cells/L); Bacteriastrum spp (587 cells/L); Rhizosolenia spp (349 cells/L); Thalassiothrix spp (314 cells/L) and Leptocylindrus danicus (162 cells/L). Chaetoceros spp occurred in almost all stations sampled. Dinoflagellates ranked second in terms of abundance (16%) although they were sporadic and in smaller densities. The top 5 most dominant representatives were Ceratium spp (249 cells/L); Podolampas spp (91 cells/L); Gonyaulax spp (63 cells/L); Dinophysis spp (55 cells/L) and Scrippsiella spp (46 cells/L). Blue-green algae or cyanophyceae accounted for 11% of the total standing crop and the most dominant species were Pelagothrix clevei (357 cells/L) and Trichodesmium thiebautii (153 cells/L). Less than 1% of the total standing crop is attributed to Chrysophytes represented by Dictyocha spp. Phytoplankton densities in the surface waters (0-m layer) was nominal compared to the other 3 strata/layers (20; 40 and 60-m). Phytoplankton densities increased with depth. Abundant concentrations of phytoplankton coincided with the fluorescence maxima and maximum concentrations of nutrients. Trichodesmium thiebautii was dominant and formed patches in the surface and near- surface waters along the coast of northern Luzon or near the entrance of Luzon Strait where low water temperatures were recorded and high concentrations of dissolved nutrients were noted, while Pelagothrix clevei was also observed to form patches at the surface and near-surface waters along the southern coast near the entrance of Sulu Sea where low water temperatures were recorded and high salinities and maximum concentrations of dissolved nutrients were observed. Abundant concentrations of diatoms composed mostly of several species of Chaetoceros; Bacteriastrum; Rhizosolenia; Thalassiotrix and Leptocylindrus were observed along and/or near
Transcript of Phytoplankton in the Surface Layers of the South China Sea...

Southeast Asian Fisheries Development Center
220
Phytoplankton in the Surface Layers of
the South China Sea, Area III: Western Philippines
Fe Farida A. Bajarias
Bureau of Fisheries and Aquatic Resources, 860 Arcadia Bldg., Quezon Ave., Quezon City, Philippines
ABSTRACT
Phytoplankton in the surface layers of South China Sea, Western Philippines wereinvestigated for species composition, distribution and abundance.
Thirty one stations were sampled during the cruise of M/V SEAFDEC to South ChinaSea along latitudes 8° to 20°N and longitudes 115° to 121°E from April 15 to May 11,1998. Ineach station, water samples at the surface and at depths of 20, 40 and 60-m were collected by a20-liters capacity Van-Dorn water sampler.
Results of the phytoplankton analysis yielded a total of 56 taxa. These included 3species of blue-green algae; 1 genus of Chrysophytes; 32 genera of diatoms and 20 genera ofdinoflagellates.
The phytoplankton assemblage was dominated by Bacillariophyceae or diatoms whichaccounted for 73% of the total standing stock. The top 5 most dominant representatives wereChaetoceros spp (962 cells/L); Bacteriastrum spp (587 cells/L); Rhizosolenia spp (349 cells/L);Thalassiothrix spp (314 cells/L) and Leptocylindrus danicus (162 cells/L). Chaetoceros sppoccurred in almost all stations sampled.
Dinoflagellates ranked second in terms of abundance (16%) although they were sporadicand in smaller densities. The top 5 most dominant representatives were Ceratium spp (249cells/L); Podolampas spp (91 cells/L); Gonyaulax spp (63 cells/L); Dinophysis spp (55 cells/L)and Scrippsiella spp (46 cells/L).
Blue-green algae or cyanophyceae accounted for 11% of the total standing crop and themost dominant species were Pelagothrix clevei (357 cells/L) and Trichodesmium thiebautii (153cells/L).
Less than 1% of the total standing crop is attributed to Chrysophytes represented byDictyocha spp.
Phytoplankton densities in the surface waters (0-m layer) was nominal compared to theother 3 strata/layers (20; 40 and 60-m). Phytoplankton densities increased with depth. Abundantconcentrations of phytoplankton coincided with the fluorescence maxima and maximumconcentrations of nutrients.
Trichodesmium thiebautii was dominant and formed patches in the surface and near-surface waters along the coast of northern Luzon or near the entrance of Luzon Strait where lowwater temperatures were recorded and high concentrations of dissolved nutrients were noted,while Pelagothrix clevei was also observed to form patches at the surface and near-surfacewaters along the southern coast near the entrance of Sulu Sea where low water temperatureswere recorded and high salinities and maximum concentrations of dissolved nutrients wereobserved.
Abundant concentrations of diatoms composed mostly of several species of Chaetoceros;Bacteriastrum; Rhizosolenia; Thalassiotrix and Leptocylindrus were observed along and/or near

Proceedings of the SEAFDEC Seminar on Fishery Resourcesin the South China Sea, Area III: Western Philippines
221
the coastlines, while in stations offshore, minimal density was noted.Several species of dinoflagellates in low densities were observed in stations going offshore.The paper closes with a brief discussion of the general distribution pattern exhibited by
the phytoplankton.
Key words: Western Philippines: SCS, phytoplankton, species composition,abundance, distribution, surface layer
Introduction
Investigating the biological characteristics, particularly phytoplankton, of the watersoff the northwest coast of the Philippines is necessary because the region is of paramountimportance to the country’s fisheries.
The waters off the northwest coast of the Philippines, which joins the South China Sea ischaracterized by the complex hydrography. There is the northward flowing warm current, theKuroshio; equatorial current; southward contour current and eddies. The region is part andparcel of the South China Sea ecosystem. There are three important features of South China Seawhich requires investigation. It harbors the highest marine biodiversity on earth. It is hypothesizedto play a critical support system to surrounding shelf habitats by providing a rich source ofpelagic propagules of fish and invertebrates [ McManus (1994) ]. South China Sea, like otherlarge-scale bodies of water, interacts in the global ocean-atmosphere interactions to bring aboutclimate variability. It is the largest marginal sea in the Indo-West Pacific region. The circulationpattern exhibits strong seasonal variability driven by the Asian Monsoon system (considered tobe the strongest monsoon system in the world), and is influenced by the numerous island chainsand archipelagos of Indonesia and Philippines, all of which partially isolates the South ChinaSea from the Western Pacific circulation regime [ Wyrtki (1961) ].
The region is less studied since it is exposed to the monsoons, hence oceanographic andbiological information are scant. However, the area adjacent to southwest Taiwan is extensivelystudied. Chu (1982); Fan (1982) and Lin et al. (1986) as cited by Huang et al (1988) haveextensively studied the movements of waters, while phytoplankton species and their distributionoff southwestern Taiwan was reported by Huang (1986); Huang (1988) and Huang and Huang(1987) as cited by Huang et al. (1988). Phytoplankton taxonomy, distribution and occurrencealong the coastal waters of northwestern Luzon was studied by Relon (1985).
Phytoplankton study in the waters off the northwest coast of the Philippines is necessaryfor a better understanding of the hydrographic feature and its influence on the organisms aroundthe region. Estimates of the plankton abundance, distribution and productivity is essential toassess the overall status of the region.
The present study on phytoplankton obtained during the cruise of M/V SEAFDEC alonglatitudes 8º to 20ºN and longitudes 115º to 121ºE in April-May,1998, describes the speciescomposition, distribution and abundance of phytoplankton in the surface layers. A brief discussionon the general vertical and horizontal distribution patterns exhibited by the phytoplankton isalso presented.
Materials and Methods
Thirty one stations [ Fig. 1 ] were surveyed during the cruise of M/V SEAFDEC on April15 to May 11,1998. Water samples for physico-chemical analysis were collected by a rosette

Southeast Asian Fisheries Development Center
222
sampler with attached CTD. Temperature and salinity were recorded using CTD.At each station, water samples at the surface and at depths of 20, 40, and 60-m were
collected separately with a 20-liter capacity Van-Dorn water sampler. Twenty liters of watersamples were filtered using a 20-µm mesh size net and 250-ml of the water sample wereconcentrated and stored in Nalgene plastic bottles. Phytoplankton samples were fixed with 10%formalin solution. Phytoplankton samples were examined under a light microscope andidentification and enumeration were based on the works of [ Fukuyo et al. (1994); Taylor (1979);Yamaji (1969); Subrahmanyan (1963) and Taylor (1963) ].
Phytoplankton density estimations were done on a 1-ml aliquot part of the sample in aSedgewick-rafter counting chamber. Cell density was determined and expressed in cells perliter. For blue-green algae, density was expressed in filaments per liter. The number of cells perliter is calculated after making an adjustment on the volume of water samples concentrated. Theinitial sample volume (V
1) was 20-liters which was filtered in a 20-µm mesh size net and then
concentrated to 25-ml (V2), from which a subsample of 1-ml (V
3) was taken.
The number of cells per liter is obtained by the formula:
Number of cells/liter = number of cells counted X (V2/V
3)
V1
where: V
1 = initial sample volume (20-liters)
V2 = concentrated sample
V3
= subsample taken/analyzed
The mean density values of phytoplankton species were utilized for the computation ofspecies diversity indices. The following formulae were used [ Odum (1971]:
Shannon’s Index of General Diversity:H = -Σ[ (ni/N) x log (ni/N)where:ni = mean density of each speciesN = total densitySimpson’s Index of Dominance:C = Σ(ni/N)2where:ni = mean density of each speciesN = total density values of all species
Pielou’s Evenness Index:E = H/logSwhere:S = number of speciesH = Shannon’s index of general diversity
Phytoplankton were identified to genus level and whenever possible they were identifiedup to species level.
Vertical profiles of cell density and biomass (fluorescence) were plotted for comparisonacross stations and depths. Only 19 stations were utilized in the comparison since the fluorometerused in recording the fluorescence malfunctioned.
For composition analysis, dominant forms of phytoplankton were group into 3 categories:

Proceedings of the SEAFDEC Seminar on Fishery Resourcesin the South China Sea, Area III: Western Philippines
223
Bacillariophyceae, Cyanophyceae and Dinophyceae. Vertical profiles of cell densities acrossdepths in each station were prepared. Since the phytoplankton composition in the study area ishighly diverse, and most of them occurred only in very small number/density, only the top 5most dominant forms were included in the analysis/interpretation.
Results
Phytoplankton Assemblage
Table 1 presents the composition of phytoplankton found and identified from the 124water samples collected during the cruise of M/V SEAFDEC in the South China Sea: WesternPhilippines from April 15 to May 12,1998. There were 4 classes identified, they are:Bacillariophyceae, Cyanophyceae, Chrysophyceae and Dinophyceae.
The assemblage of phytoplankton in the study area contained a total of 56 taxa. Theseincluded 3 species of blue-green algae; 1 genus of Chrysophytes; 32 genera of diatoms and 20genera of dinoflagellates. Most of them are warm-water species and recorded as inhabitants ofthe Kuroshio of the East China Sea, and off Japan [ Yamaji (1969) ] and the South WesternIndian Ocean [ Taylor (1963) ].
Relative abundance of phytoplankton in the region is shown in [ Fig. 1a]. Likewise, thetop 5 most dominant forms were presented in [ Fig. 2 ].
Bacillariophyceae or diatoms accounted for 73% of the total standing crop. The top 5most dominant representatives of diatoms were Chaetoceros spp ( 962 cells/L or 40%);
20̊
18̊
16̊
14̊
12̊
10̊
N
LUZON
MINDORO
PALAWAN
Sulu Sea
South
China
Sea
Pacific
Ocean
San fernando
SubicManila
Currimao
5 4 3
12 11 10 9
19 18 17 16
20 21 22 23
28 29 30
31
27 26 25 24
13 14 15
6 7 8
E115̊ 117̊ 119̊ 121̊ 123̊
Fig. 1. Stations for phytoplankton sampling

Southeast Asian Fisheries Development Center
224
73%
11%0%
16%
Bacillariophyceae Cyanophyceae Chrysophyceae Dinophyceae
Fig. 1a. Relative abunadce of phytoplankton in the SCS: Western Philippines.
Bacteriastrum spp ( 587 cells/L or 25% ); Rhizosolenia spp ( 349 cells/L or 15% ); Thalassiothrixspp (314 cells/L or 13% ) and Leptocylindrus danicus (162 cells/L or 7%).
Dinophyceae or dinoflagellates contributed 16% to the total standing crop ofphytoplankton, and the top 5 most dominant were Ceratium spp(249 cells/L or 49% ); Podolampasspp ( 91 cells/L or 18%); Gonyaulax spp ( 63 cells/L or 13%); Dinophysis spp ( 55 cells/L or11%) and Scrippsiella spp ( 46 cells/L or 9%).
Cyanophyceae or blue-green algae accounted for 11% of the total standing crop and themost dominant species were Pelagothrix clevei ( 357 cells/L or 70% ) and Trichodesmiumthiebautii ( 153 cells/L or 30% ).
Less than 1% of the total standing crop is attributed to Chrysophytes represented byDictyocha spp.
Distribution
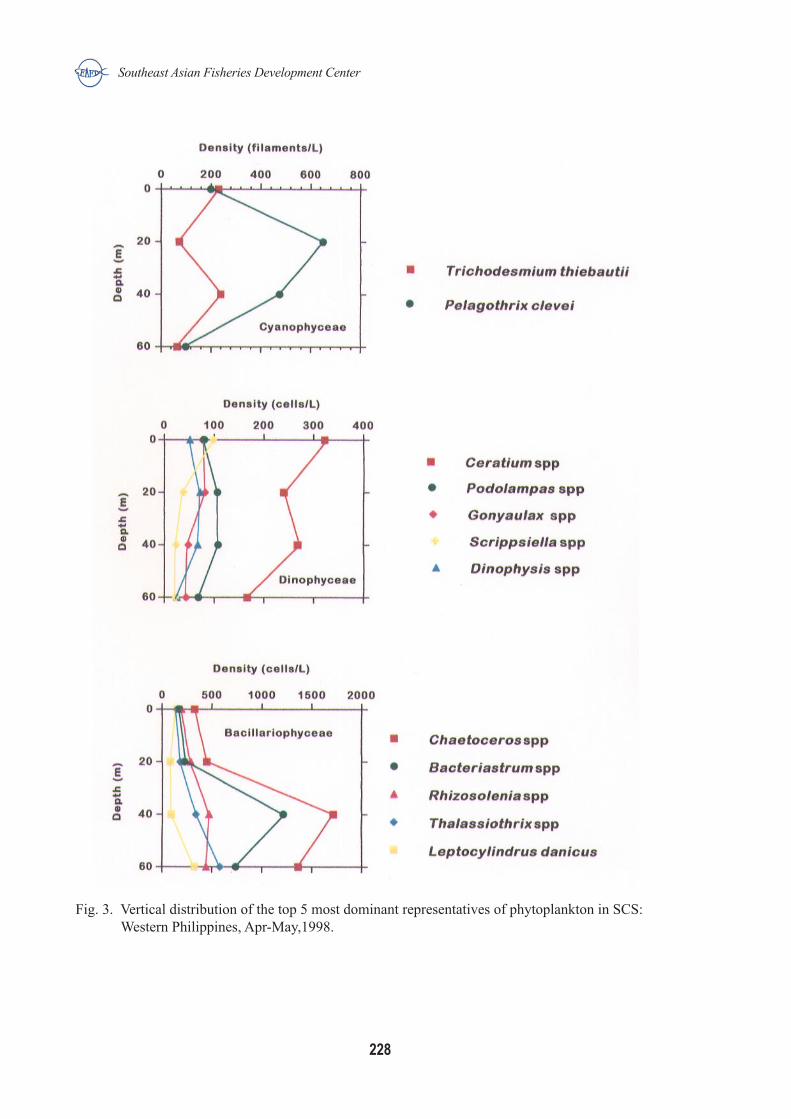
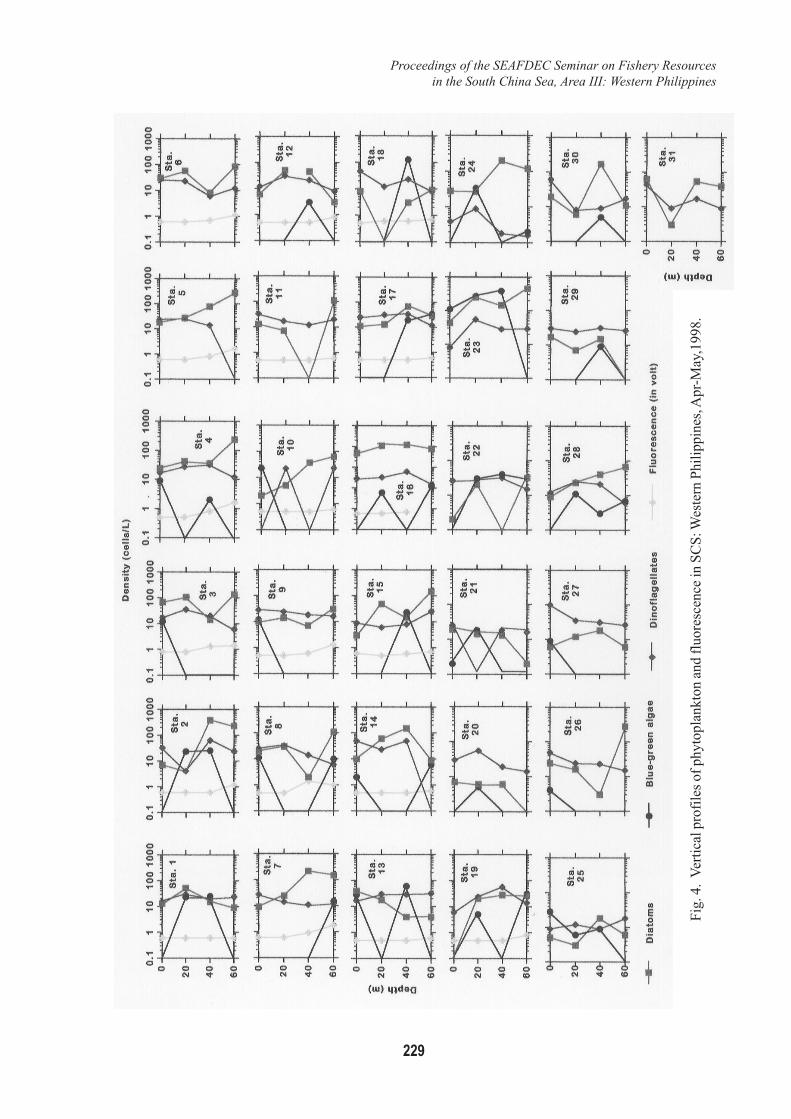
The vertical profiles of phytoplankton in the study area is illustrated in [Fig. 4] and [ Fig.3 ] shows the vertical distribution profiles of the top 5 most dominant representatives ofphytoplankton.
Phytoplankton densities in the surface waters ( 0-m layer ) was nominal compared to theother 3 strata/layers ( 20, 40 & 60-m ). In all the 31 stations sampled, it was observed thatphytoplankton density increases with depth. Phytoplankton density is greatest at the 60-m stratum/layer where the maximum fluorescence is also noted.
The most significant component of the phytoplankton community is the diatoms orBacillariophyceae. A well-defined pattern in the distribution of diatoms in the water column isobserved. Concentrations of diatoms increased with depth with the greatest concentrationsobserved at depths between 20 and 40-m. Station adjacent to the coast of northern Luzon ( Sta.3 ) and stations near the coast south of Manila ( Sta. 16, 23 &24 ) had high concentrations of

Proceedings of the SEAFDEC Seminar on Fishery Resourcesin the South China Sea, Area III: Western Philippines
225
Division: Chrysophyta Division: Cyanophyta Class : Bacillariophyceae Class: Cyanophyceae Order: Centrales Order: Nostocales Family: Skeletonemaceae Family: Oscillatoriaceae1. Skeletonema spp 1. Trichodesmium thiebautii2. Stephanopyxis palmeriana 2. Pelagothrix clevei Family: Leptocylindraceae Family: Nostocaceae1. Dactyliosolen mediterraneus 1. Nostoc spp2. Leptocylindrus danicus3. Guinardia flaccida Class: Chrysophyceae
Order: Dictyotales Family: Corethronaceae Family: Dictyochaeae1. Corethron pelagicum 1. Dictyocha spp
Family: Thalassiosiraceae Division: Pyrrophyta1. Thalassiosira spp Class: Dinophyceae
Order: Prorocentrales Family: Coscinodiscaceae Family: Prorocentraceae1. Asterolampra marylandica 1. Prorocentrum spp2. Asteromphalus cleavenus 3. Coscinodiscus spp Order: Dinophysiales4. Planktoniella sol Family: Amphisoleniaceae
1. Amphisolenia spp Family: Rhizosoleniaceae1. Rhizosolenia spp
Family: Dinophysiaceae Family: Bacteriastraceae 1. Dinophysis spp1. Bacteriastrum spp 2. Ornithocercus spp
3. Histioneis spp Family: Chaetoceraceae 4. Citharistes apstenii1. Chaetoceros spp
Order: Peridiniales Family: Biddulphiaceae Family: Pyrophacaceae1. Biddulphia spp 1. Pyrophacus spp2. Cerataulina spp3. Climacodinium spp Family: Peridiniaceae4. Ditylum sol 1. Diplopsalis sp.5. Eucampia zoodiacus 2. Protoperidinium spp6. Hemiaulus spp 3. Scrippsiella spp7. Streptotheca thamensis 4. Zygabikodinium lenticulatum8. Triceratium arcticum
Family: Gonyaulacaceae Order: Pennales 1. Amphidoma sp. Family: Fragilariaceae 2. Gonyaulax spp1. Fragilaria spp 2. Thalassiothrix spp Family: Ceratocoryaceae
1. Ceratocorys spp Family: Tabellariaceae1. Rhabdomena adriaticum Family: Ceratiaceae
1. Ceratium spp Family: Achnanthaceae1. Coconeis pseudomargarita Family: Oxytoxaceae
1. Oxytoxum spp Family: Naviculaceae1. Amphipora gigantea Family: Cladopyxidaceae2. Amphora lineolata 1. Cladophyxis brachiolata3. Navicula spp4. Pleurosigma spp Family: Podolampadaceae
1. Podolampas spp Family: Nitzschiaceae1. Bacillaria paradoxa Family: Goniodomataceae2. Nitzschia spp 1. Goniodoma spp
Order: Phytodiniales Family: Pyrocystaceae1. Pyrocystis spp
Table 1. List of Phytoplankton from the Surface Layer of South China Sea: Western Philippines, Apr-May,1998.

Southeast Asian Fisheries Development Center
226
Table 2. Phytoplankton Density in South China Sea: Western Philippines, Apr-May,1998.

Proceedings of the SEAFDEC Seminar on Fishery Resourcesin the South China Sea, Area III: Western Philippines
227
Fig. 2. Percentage composition of the top 5 most dominant representatives of phytoplankton in SCS:Western Philippines, Apr-May,1998.
BACILLARIOPHYCEAE
40%
25%
15%
13%7%
Chaetoceros spp Bacteriastrum spp Rhizosolenia sppThalassiotrix spp Leptocylindrus danicus
DINOPHYCEAE
18%
13%
11%
49%
9%
Ceratium spp Podolampas spp Gonyaulax spp
Dinophysis spp Scripsiella spp
CYANOPHYCEAE
70%
30%
Trichoceros thiebautii Pelagothrix cleveii
Southeast Asian Fisheries Development Center
228
Fig. 3. Vertical distribution of the top 5 most dominant representatives of phytoplankton in SCS:Western Philippines, Apr-May,1998.
Proceedings of the SEAFDEC Seminar on Fishery Resourcesin the South China Sea, Area III: Western Philippines
229
Fig.
4.
Ver
tical
pro
file
s of
phy
topl
ankt
on a
nd fl
uore
scen
ce in
SC
S: W
este
rn P
hilip
pine
s, A
pr-M
ay,1
998.
Southeast Asian Fisheries Development Center
230
diatoms with maximum cell densities recorded at the stations along the coast of Subic and nearthe coast south of Manila ( Sta. 16 & 24 ) with cell densities of 1,210 cells/L and 1,985 cells/L, respectively. The most dominant forms of diatoms observed were Rhizosolenia spp;Bacteriastrum spp and Chaetoceros spp. They were abundant in almost all the stations, exceptat Sta. 15 which was dominated only by Rhizosolenia spp. Chaetoceros spp occurred in almostall the stations sampled with an average cell density of 1,363 cells/L, with the greatest densitynoted along the coast of Lubang Island ( Sta. 24 ). Chaetoceros spp; Bacteriastrum spp andRhizosolenia spp exhibited a similar pattern in the vertical distribution in the water column.Their cell concentrations increased with depth, with the maximum concentrations observed at40-meters depth and at a depth of 60-m and below, it diminished. Thalassiothrix spp andLeptocylindrus danicus also exhibited a similar pattern. Cell concentrations increased withincreasing depth with the highest concentrations recorded at 60-m layer.
Dinoflagellates or dinophyceae ranked second in terms of abundance ( 16% ) among thephytoplankton community observed in the study area. They occurred sporadically in nominaldensities. However, high cell density was noted in Sta. 30 and high concentrations occurredbetween depths of 20 and 40-m. Above and below these depths, concentration decreased.
Cyanophyceae or blue-green algae shared 11% in the total standing crop of thephytoplankton community. A distinct pattern in the distribution was noted. High concentrationswere observed at 40-m, and below this depth, blue-green algae were absent. Trichodesmiumthiebautii and Pelagothrix clevei both formed patches in the surface and near-surface waters.Abundant patches of Trichodesmium thiebautii were observed in the stations along the coast ofnorthern Luzon (Stations 1 & 2), a region adjacent to the Kuroshio regime; while Pelagothrixclevei formed abundant patches in stations along the coast south of Manila (Stations 23 & 24).
Correlation of phytoplankton density and fluorescence across stations and depths werepresented in Figure 4.
The highest fluorescence was registered at station 7 at a depth of 60-m and this wasattributed to the abundant concentrations of diatoms.
Occurrence of diatoms in high densities were found between depths of 20 and 60-m,with the maxima observed between 40 and 60-m. A good correlation between cell densities andfluoresecence was noted.
Dinoflagellates in nominal concentration occurred sporadically in the study area, but arelatively higher concentration (180 cells/L) was recorded at station 30. There was no distinctrelationship between dinoflagellates densities and fluorescence.
Diversity
Figure 5 shows the species diversity indices of the phytoplankton community. The averageindex of species diversity (i.e. Shannon index of general diversity) of phytoplankton in almostall stations were high, with the highest observed in Station 16 (4.52). The stations which registeredlow index of species diversity were 2, 15, 19, 21 & 25, with the lowest noted in Station 2.Meanwhile, low index of evenness was determined in stations where low index of species diversityoccurred, with the lowest noted also in Station 2. The Shannon Index of General Diversityindicates the species richness in a given area. The higher the Shannon Index, the more speciespresent, thus the higher biodiversity. Evenness, on the other hand, indicates the equitability ofthe species in terms of importance values (i.e. plankton densities) in the area. Higher evennessvalues suggest a more or less equal distribution of individuals across species, thus more diverseplankton community. Except for 2 stations, all the stations sampled have high biodiversity. Thedominance index indicates the presence of dominant species, that is, the higher the dominance

Proceedings of the SEAFDEC Seminar on Fishery Resourcesin the South China Sea, Area III: Western Philippines
231
index, the lower the diversity. Only stations 2 & 21 have high index of dominance, with Station21 showing the highest value (5.52). Higher values of dominance index in stations 2 & 21 wereattributed to the dense patches of Trichodesmium thiebautii and Pelagothrix clevei, respectively.
Discussion
The standing stock of phytoplankton in the study area was 4,542 cells/L. Theconcentrations increased with depth, with the greatest concentrations observed at 60-m andincreased toward the coast. Vertical and spatial heterogeneities were apparent.
Higher density of phytoplankton were observed at stations along and/or near the coastwhile low densities were noted at stations offshore and the standing stock of phytoplanktonmaxima usually occurred considerably at deeper strata (40-60-m). This condition is typical fortropical waters such as the Western Philippines: South China Sea.
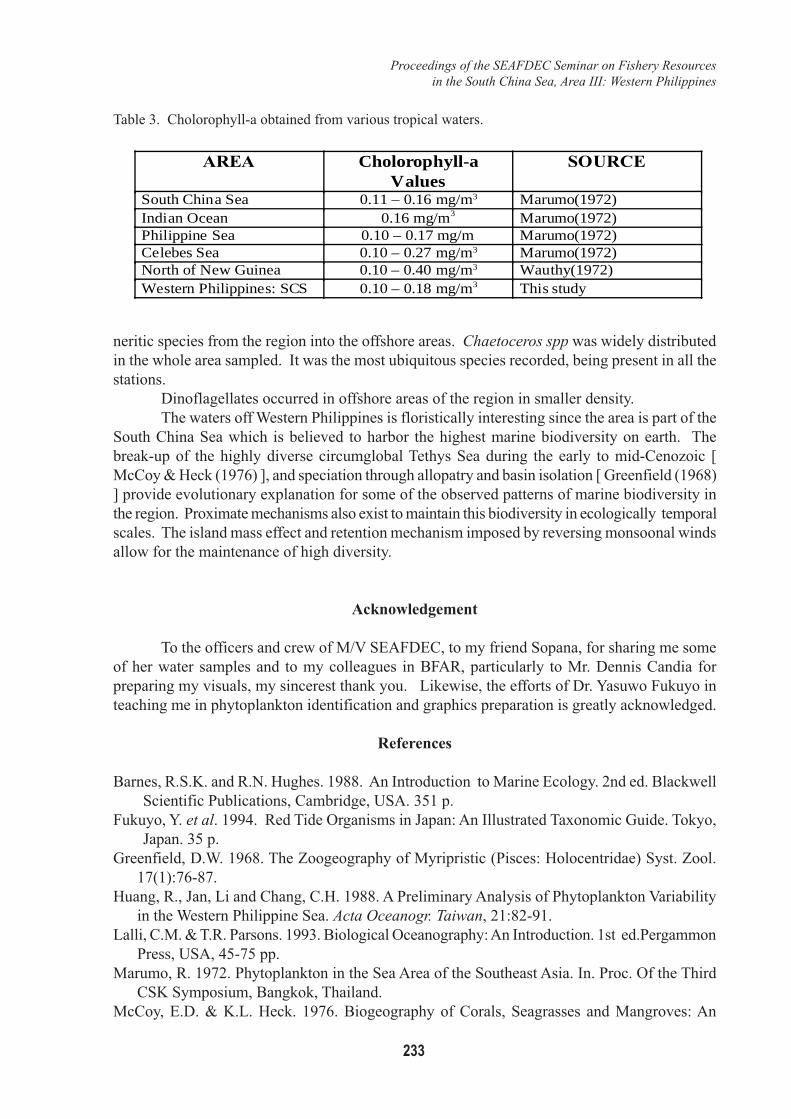
Table 3 shows the comparison of chlorophyll-a determined from the different tropicalwaters.
[ Marumo (1972) ] determined the chlorophyll-a from South China Sea, Indian Ocean,Philippine Sea and Celebes Sea which ranged from 0.11-0.16 mg/m3 ; 0.10-0.17 mg/m3 ; and0.10-0.27 mg/m3 respectively. [ Wauthy (1972) ] calculated the chlorophyll-a of the watersNorth of New Guinea and the Chl-a ranged from 0.10-0.40 mg/m3. Wauthy(1972) observed thatthe surface layer which is above the maxima, is typically poor offshore (<.10mg/m3) and richerin the inland Bismark Sea with high values near New Guinea coast (>.40mg/m3). On the otherhand, the result of the present study is comparable to the findings of the above-cited authors,with the surface layer also typically poor offshore (.10 mg/m3) and rich along the coast south ofManila (.18 mg/m3).
Spatial and temporal variations in plankton are seen to be strongly correlated with physicaloceanographic processes and mediated by biological-physical interactions rather than purelybiological forcing functions [ Barnes, R.S.K. & R.N. Hughes (1968) ]. Solar radiation andessential nutrient availability are the dominant physical factors that control phytoplanktonproduction in the sea [ Lalli, C.M. & T.R. Parsons (1993) ].
Dissolved nutrients in the study area were investigated by Montojo (this volume) and hefound out that homogeneous water mass was almost devoid of nutrients particularly nitrate,nitrite and phosphate. Montojo (this volume) also observed that stations located near the entranceof Luzon Strait and Sulu Sea were rich in nutrients and the maxima were noted in these stations.Likewise, abundant concentrations of phytoplankton coincided with the high nutrientconcentrations. High concentrations of phytoplankton were also found in stations where highconcentrations of nutrients were observed.
The species composition of diatoms is similar to that reported by Huang (1986) andRelon (1985) off Southwestern Taiwan and coastal waters of Northern Luzon, respectively.Marumo (1972) studied the standing crop and phytoplankton community in the Southeast AsianSeas and his findings conformed to the findings of this present study.
Dense concentrations of phytoplankton, chiefly diatoms, were present at all inshore areassampled.
In the northern coast, near the entrance of Luzon Strait, the population composed apronounce admixture of oceanic species with the neritic subtropical and eurythermal species.Such species as Trichodesmium thiebautii, Climacodinium spp, Eucampia zoodiacus and Ditylumsol, common in subtropical waters were frequently present at stations close to the coast,presumably due to its close proximity to the Kuroshio regime. There was a marked spread of

Southeast Asian Fisheries Development Center
232
Fig. 5. Phytoplankton species diversity indices
00.5
11.5
22.5
33.5
44.5
5
1 3 5 7 9 11 13 15 17 19 21 23 25 27 29 31
Station
0-m 20-m 40-m 60-m
0
1
2
3
4
5
6
1 3 5 7 9 11 13 15 17 19 21 23 25 27 29 31
Station
0-m 20-m 40-m 60-m
0
0.5
1
1.5
2
2.5
3
3.5
4
1 3 5 7 9 11 13 15 17 19 21 23 25 27 29 31
Station
0-m 20-m 40-m 60-m
Proceedings of the SEAFDEC Seminar on Fishery Resourcesin the South China Sea, Area III: Western Philippines
233
neritic species from the region into the offshore areas. Chaetoceros spp was widely distributedin the whole area sampled. It was the most ubiquitous species recorded, being present in all thestations.
Dinoflagellates occurred in offshore areas of the region in smaller density.The waters off Western Philippines is floristically interesting since the area is part of the
South China Sea which is believed to harbor the highest marine biodiversity on earth. Thebreak-up of the highly diverse circumglobal Tethys Sea during the early to mid-Cenozoic [McCoy & Heck (1976) ], and speciation through allopatry and basin isolation [ Greenfield (1968)] provide evolutionary explanation for some of the observed patterns of marine biodiversity inthe region. Proximate mechanisms also exist to maintain this biodiversity in ecologically temporalscales. The island mass effect and retention mechanism imposed by reversing monsoonal windsallow for the maintenance of high diversity.
Acknowledgement
To the officers and crew of M/V SEAFDEC, to my friend Sopana, for sharing me someof her water samples and to my colleagues in BFAR, particularly to Mr. Dennis Candia forpreparing my visuals, my sincerest thank you. Likewise, the efforts of Dr. Yasuwo Fukuyo inteaching me in phytoplankton identification and graphics preparation is greatly acknowledged.
References
Barnes, R.S.K. and R.N. Hughes. 1988. An Introduction to Marine Ecology. 2nd ed. BlackwellScientific Publications, Cambridge, USA. 351 p.
Fukuyo, Y. et al. 1994. Red Tide Organisms in Japan: An Illustrated Taxonomic Guide. Tokyo,Japan. 35 p.
Greenfield, D.W. 1968. The Zoogeography of Myripristic (Pisces: Holocentridae) Syst. Zool.17(1):76-87.
Huang, R., Jan, Li and Chang, C.H. 1988. A Preliminary Analysis of Phytoplankton Variabilityin the Western Philippine Sea. Acta Oceanogr. Taiwan, 21:82-91.
Lalli, C.M. & T.R. Parsons. 1993. Biological Oceanography: An Introduction. 1st ed.PergammonPress, USA, 45-75 pp.
Marumo, R. 1972. Phytoplankton in the Sea Area of the Southeast Asia. In. Proc. Of the ThirdCSK Symposium, Bangkok, Thailand.
McCoy, E.D. & K.L. Heck. 1976. Biogeography of Corals, Seagrasses and Mangroves: An
AREA Cholorophyll-aValues
SOURCE
South China Sea 0.11 – 0.16 mg/m3 Marumo(1972)Indian Ocean 0.16 mg/m3 Marumo(1972)Philippine Sea 0.10 – 0.17 mg/m Marumo(1972)Celebes Sea 0.10 – 0.27 mg/m3 Marumo(1972)North of New Guinea 0.10 – 0.40 mg/m3 Wauthy(1972)Western Philippines: SCS 0.10 – 0.18 mg/m3 This study
Table 3. Cholorophyll-a obtained from various tropical waters.

Southeast Asian Fisheries Development Center
234
Alternative to the Center of Origin Concept. Syst. Zool., 25:201-210.McManus, J.W. 1985. Marine Speciation, Tectonics and Sea Level Changes in Southeast Asia.
Proc. 5th Int. Coral Reef Symposium. Tahiti, 133-138 p.Montojo, U.M. 2000. Dissolve Nutrients in Western Philippines: South China Sea. (this volume)Odum, E.P. 1971. Fundamentals of Ecology. 3rd ed. W.B. Saunders Co., Philadelphia, 574 p.Relon, M.D. 1985. Phytoplankton Studies in Northwestern Luzon, Phil. Ph. D. Thesis, University
of Santo Tomas, Phil. 90 p.Taylor, F.J.R. 1976. Dinoflagellates from the International Indian Ocean Expedition. Bibliotheca
Botanica. Strutgart.Taylor, F.J.R. 1965. Phytoplankton of the South Western Indian Ocean. Nova Hedmigia, Beth.
12(314):433-476.Yamaji, I. 1969. Illustrations of the Marine Plankton of Japan. 337 p.Wauthy, B. 1972. Phytoplankton and Circulation North of New Guinea in Summer 1971. In
Proc. of the Third CSK Symposium, Bangkok, Thailand.Wyrtki, K. 1961. Preliminary Oceanography of the Southeast Asian Waters. NAGA Report vol.
2, Scripps Institute of Oceanography, La Jolla, Calif.