Phytoplankton and zooplankton seasonal dynamics in a ...botha/Murell and Lores 2004.pdf ·...
12
Phytoplankton and zooplankton seasonal dynamics in a subtropical estuary: importance of cyanobacteria MICHAEL C. MURRELL* AND EMILE M. LORES US ENVIRONMENTAL PROTECTION AGENCY, NHEERL, GULF ECOLOGY DIVISION,1 SABINE ISLAND DR., GULF BREEZE, FL 32561, USA *CORRESPONDING AUTHOR: [email protected] A seasonal study of phytoplankton and zooplankton was conducted from 1999 to 2001 in Pensacola Bay, Florida, USA, to further the understanding of pelagic food webs in sub-tropical estuaries. Monthly measurements included size-fractionated chlorophyll (whole water, <5 "m, <20 "m), net- and picophytoplankton composition analyzed using microscopy, flow cytometry, and HPLC pigment analysis. Additionally, zooplankton abundance and dry weight were determined from net tows. The results show a phytoplankton community dominated by the small size fraction (<5 "m), especially during the warm periods. The <5 "m chlorophyll fraction was strongly correlated with cyanobacterial abundance and zeaxanthin. Cyanobacteria (cf. Synechococcus) abundance peaked during summer in the upper estuary, typically exceeding 3 10 9 L 1 , and was strongly correlated with temperature. Cyanobacteria abundance at the freshwater end of the Bay (in the Escambia River) was very low, suggesting that cyanobacteria were not delivered via freshwater. Two pigmentation types of cyanobacteria were observed. Phycoerythrin-containing cells (PE-rich) were more abundant at the marine end, while phycocyanin-containing cells (PC- rich) were more abundant in the upper estuary. The larger algae (>5–10 "m) were predominantly composed of diatoms, followed by chlorophytes, cryptophytes and dinoflagellates. The three most abundant genera of diatoms were Thalassiosira, Pennales and Cyclotella. Zooplankton biomass averaged 12.2 "gCL 1 , with peak biomass occurring during May (~30 "gCL 1 ). Zooplankton abundance averaged 16.7 ind. L 1 , peaking at 30 ind. L 1 during May. During the summer, the zooplankton community shifted from the ubiquitous Acartia tonsa towards Oithona sp. The increase in Oithona coincided with increases in picophytoplankton and may reflect the changing food resources available to zooplankton. Thus, the trophic implications of cyanobacterial dominance in sub-tropical estuaries need to be more fully assessed. INTRODUCTION There is growing evidence that human activities are chan- ging the distribution and movement of major nutrient elements in the landscape resulting in increased nutrient loading to receiving waters (NRC, 2000). Bottom-up con- trols, such as changes in nutrient loading, can alter the species composition of primary producers (Stolte et al., 1994; Ingrid et al., 1996; Roelke et al., 1999). Top-down grazing controls can also alter phytoplankton community composition (Micheli, 1999) and size structure (Hansen et al., 1994; Mousseau, 1998; Cottingham, 1999; Sipura et al., 2003). Such shifts in the primary producer community are likely to cascade through the food web, altering consumer food-web dynamics, and thus the flow of carbon and energy through a system. It is therefore critical to under- stand better the linkages between nutrient loading to coastal waters and the ecosystem response. The environmental forcings that control plankton dynamics in sub-tropical Gulf of Mexico estuaries are little-studied compared with temperate Atlantic estu- aries. Sub-tropical waters have a warmer temperature regime, including long periods of warm temperatures (>28 C for 3–5 months), and are more frequently impacted by large rainfall events such as tropical storms and hurricanes (Solis and Powell, 1999). Except for very large river systems (e.g. Mississippi–Atchafalaya), JOURNAL OF PLANKTON RESEARCH j VOLUME 26 j NUMBER 3 j PAGES 371–382 j 2004 doi: 10.1093/plankt/fbh038, available online at www.plankt.oupjournals.org Journal of Plankton Research Vol. 26 No. 3
Transcript of Phytoplankton and zooplankton seasonal dynamics in a ...botha/Murell and Lores 2004.pdf ·...

Phytoplankton and zooplanktonseasonal dynamics in a subtropicalestuary: importance of cyanobacteria
MICHAEL C. MURRELL* AND EMILE M. LORES
US ENVIRONMENTAL PROTECTION AGENCY, NHEERL, GULF ECOLOGY DIVISION, 1 SABINE ISLAND DR., GULF BREEZE, FL 32561, USA
*CORRESPONDING AUTHOR: [email protected]
A seasonal study of phytoplankton and zooplankton was conducted from 1999 to 2001 in
Pensacola Bay, Florida, USA, to further the understanding of pelagic food webs in sub-tropical
estuaries. Monthly measurements included size-fractionated chlorophyll (whole water, <5 �m,<20 �m), net- and picophytoplankton composition analyzed using microscopy, flow cytometry, and
HPLC pigment analysis. Additionally, zooplankton abundance and dry weight were determined
from net tows. The results show a phytoplankton community dominated by the small size fraction
(<5 �m), especially during the warm periods. The <5 �m chlorophyll fraction was strongly
correlated with cyanobacterial abundance and zeaxanthin. Cyanobacteria (cf. Synechococcus)
abundance peaked during summer in the upper estuary, typically exceeding 3 � 109 L�1, and
was strongly correlated with temperature. Cyanobacteria abundance at the freshwater end of the Bay
(in the Escambia River) was very low, suggesting that cyanobacteria were not delivered via
freshwater. Two pigmentation types of cyanobacteria were observed. Phycoerythrin-containing
cells (PE-rich) were more abundant at the marine end, while phycocyanin-containing cells (PC-
rich) were more abundant in the upper estuary. The larger algae (>5–10 �m) were predominantlycomposed of diatoms, followed by chlorophytes, cryptophytes and dinoflagellates. The three most
abundant genera of diatoms were Thalassiosira, Pennales and Cyclotella. Zooplankton biomass
averaged 12.2 �g C L�1, with peak biomass occurring during May (~30 �g C L�1).
Zooplankton abundance averaged 16.7 ind. L�1, peaking at 30 ind. L�1 during May. During
the summer, the zooplankton community shifted from the ubiquitous Acartia tonsa towards Oithona
sp. The increase in Oithona coincided with increases in picophytoplankton and may reflect the
changing food resources available to zooplankton. Thus, the trophic implications of cyanobacterial
dominance in sub-tropical estuaries need to be more fully assessed.
INTRODUCTION
There is growing evidence that human activities are chan-
ging the distribution and movement of major nutrient
elements in the landscape resulting in increased nutrient
loading to receiving waters (NRC, 2000). Bottom-up con-
trols, such as changes in nutrient loading, can alter the
species composition of primary producers (Stolte et al.,
1994; Ingrid et al., 1996; Roelke et al., 1999). Top-down
grazing controls can also alter phytoplankton community
composition (Micheli, 1999)andsize structure (Hansen et al.,
1994; Mousseau, 1998; Cottingham, 1999; Sipura et al.,
2003). Such shifts in the primary producer community are
likely to cascade through the food web, altering consumer
food-web dynamics, and thus the flow of carbon and
energy through a system. It is therefore critical to under-
stand better the linkages between nutrient loading to
coastal waters and the ecosystem response.
The environmental forcings that control plankton
dynamics in sub-tropical Gulf of Mexico estuaries are
little-studied compared with temperate Atlantic estu-
aries. Sub-tropical waters have a warmer temperature
regime, including long periods of warm temperatures
(>28�C for 3–5 months), and are more frequently
impacted by large rainfall events such as tropical storms
and hurricanes (Solis and Powell, 1999). Except for
very large river systems (e.g. Mississippi–Atchafalaya),
JOURNAL OF PLANKTON RESEARCH j VOLUME 26 j NUMBER 3 j PAGES 371–382 j 2004
doi: 10.1093/plankt/fbh038, available online at www.plankt.oupjournals.org
Journal of Plankton Research Vol. 26 No. 3

freshwater flows tend to have a muted seasonality; high
flow events can occur almost any time of year. These
characteristics tend to make sub-tropical estuarine
hydrodynamics less predictable than temperate estuaries.
There are few data documenting the phytoplankton
community composition in Gulf coast estuaries (e.g.
Livingston, 2001, 2003). One study examined the
abundance and species composition of larger phyto-
plankton (>5 mm) in Pensacola Bay (Livingston, 2001),
concluding that the community exhibited relatively low
species richness and tended to be dominated by bloom-
forming species (Cyclotella choctawhatcheeana, Prorocentrum
minimum and Heterosigma akashiwo). That study was
restricted to the larger phytoplankton community, and
therefore did not take into account the contribution of
picophytoplankton, despite growing evidence from other
estuaries of the numerical and functional importance of
cyanobacteria (Pinckney et al., 1998; Phlips et al., 1999).
Cyanobacteria have not been enumerated in this
region of the Gulf of Mexico coast. While the import-
ance of cyanobacteria and other picophytoplankton are
well documented in the open oceans, their importance in
estuaries is less well studied. Many studies have found
high abundances of cyanobacteria, but their contribu-
tion to the total phytoplankton community is usually
relatively small (Pinckney et al., 1998; Ning et al., 2000).
A notable exception to this pattern was reported from
Florida Bay, where cyanobacterial abundances peaked
at 5 � 109 cells L–l and appeared to dominate the
phytoplankton community (Phlips et al., 1999).
The complex nature of the trophic linkages between
phytoplankton and zooplankton communities is of broad
and sustained interest to the scientific community, yet little
is known of the zooplankton in Gulf of Mexico estuaries in
general and Pensacola Bay in particular. One study (Lores
et al., 2002) reported zooplankton abundance in Pensacola
Bay averaging 3.1 L�1, and found higher abundances in
the bay proper compared with the adjacent tidal bayous.
An earlier study (Dye, 1987) reportedmuch higher average
zooplankton abundances of 38 L�1 in Pensacola Bay. Both
studies noted the predominance of Acartia tonsa; other taxa
included the cyclopoid copepod, Oithona colcarva, the clado-
cerans Podon and Evadne, the rotifers Brachionus and Synch-
aeta, and the larvaceanOikopleura sp. In nearby Perdido Bay,
zooplankton abundances averaged ~2 L�1 and ranged
from<1.0 to 28 L�1 (Livingston, 2001). To our knowledge,
these are the only zooplankton data from the region.
The purpose of this study was to examine seasonal
patterns in phytoplankton and zooplankton in Pensacola
Bay to develop a more comprehensive picture of the
biomass of the major plankton groups, and to give insight
into likely trophic pathways. This study augments previous
and ongoing process-oriented studies, and will help to
develop a clearer understanding of the processing of nutri-
ents and organic matter in such sub-tropical estuaries.
METHOD
Study area
Pensacola Bay is a moderately sized (370 km2), shallow
(mean depth 3 m) system located in northwestern Florida,
USA (Figure 1), classified as a micro-tidal, partially-
stratified, drowned river valley estuary (Schroeder and
Wiseman, 1999). Tides are predominantly diurnal with a
mean amplitude of 0.5 m. About 80% of the freshwater
flows into the western side of the system from the
Escambia River into the Escambia Bay, with an annual
mean discharge of �200 m3 s�1. The remaining 20% of
the surface flow comes from the Blackwater, Yellow, and
East Rivers, all emptying into the East Bay. The Escambia
River is alluvial with a watershed area of 9900 km2 drain-
ing a landscape of pine forests (74%), croplands (12%),
pastures (7%) and urban development (2%). River con-
centrations of total N averages 39 mM (range 14–107) and
total P averages 1.2 mM (range 0.3–4.8) (Alexander et al.,
1996). Escambia and East Bays converge into Pensacola
Bay proper, which exchanges with the Gulf of Mexico
through a narrow deep pass at the western end of
Pensacola Bay and Santa Rosa Sound. The mean water
residence time for the entire system is ~25 days (Solis and
Powell, 1999), although this estimate is not well con-
strained. Unlike many temperate estuaries, phosphorus
appears to frequently limit phytoplankton growth (Murrell
et al., 2002a), a frequently observed feature of Gulf coast
estuaries (Myers and Iverson, 1981; Flemer et al., 1998;
Mortazavi et al., in preparation).
Field collection
This study was conducted from June 1999 through
November 2001 at five stations oriented along the salinity
gradient from Escambia River to Pensacola Bay proper
(Figure 1). Nutrient and hydrodynamic conditions during
that period are detailed elsewhere (Murrell et al., in pre-
paration). Samples were collected from surface waters
using a Van Dorn bottle, and stored in acid-cleaned poly-
ethylene bottles for laboratory processing within 2–3 h.
As stratification was frequently evident, surface samples
cannot be considered representative of the water column
at a given site but of the salinity regime.
Chlorophyll
Samples for size-fractionated chlorophyll were pre-
screened through 5 or 20 mmNitex mesh before collecting
onto filters. Whole water and size fractionated chlorophyll
JOURNAL OF PLANKTON RESEARCH j VOLUME 26 j NUMBER 3 j PAGES 371–382 j 2004
372

concentrations were determined by filtering 100–200 mL
of water onto 25 mm Whatman GF/F filters using gentle
vacuum (<250 mmHg). The filters were frozen at �70�Cuntil analysis. Chlorophyll was extracted in 10 mL of
buffered methanol ( Jeffrey et al., 1997), sonicated with a
micro-probe sonicator (50 W, 30 s); fluorescence was
measured with a Turner Designs TD 700 fluorometer
equipped with excitation and emission filters developed
by Welschmeyer (Welschmeyer, 1994). The fluorometer
was calibrated using commercially available chlorophyll a
standards (Sigma Chemicals).
HPLC pigments
Samples for phytoplankton accessory pigments were col-
lected as described for total chlorophyll except that larger
volumes (200–500 mL) were filtered. The filtered cells
were extracted in 2 mL of acetone and micro-probe soni-
cated (50 W, 30 s). The extracts were analyzed on a
Hewlett Packard 1090 HPLC with a tertiary gradient
elution system, a 250 � 4 mm Spherisorb 5 mm ODS
2 column, and absorbance (350–500 nm) was measured
using a photodiode array detector (Wright et al., 1991).
The nominal detection limit for each pigment was 0.05 mgmL�1 in the extract. The instrument was calibrated using
standards for chlorophyll a, chlorophyll b, chlorophyll c1
and c2, alloxanthin, butanoyloxyfucoxanthin, diadino-
xanthin, diatoxanthin, divinyl pheophorphyrin a5, fucoxan-
thin, 190-hexanoyloxyfucoxanthin, lutein, monadoxanthin,
myxoxanthophyll, neoxanthin, nostoxanthin, peridinin,
prasinoxanthin, violaxanthin, and zeaxanthin. The instru-
ment was calibrated using commercial pigment standards
(Sigma Chemicals and VKI, Denmark). Given the differ-
ence in extraction protocols, the fluorometric method for
Chl a (described above) was considered quantitative, while
the HPLC method provided a qualitative measure of the
pigment composition.
Phytoplankton taxonomy
For phytoplankton taxonomic analysis, 100 mL samples
were fixed with 2% formaldehyde, followed by 1% acid
Fig. 1. Map of Pensacola Bay system showing sampling locations.
M. C. MURRELL AND E. M. LORES j PHYTOPLANKTON AND ZOOPLANKTON IN PENSACOLA BAY
373
Lugols. The samples were concentrated by settling in
Utermohl chambers for 1 h mm�1 of column depth.
Typically, 5–10 mL of water sample was settled; phyto-
plankton were counted and identified at 450� to the
lowest possible taxon using appropriate keys (e.g.
Tomas, 1997). A minimum of 100 microscope fields,
or 100 individuals of the most dominant taxa were
counted, whichever came first. This method was consid-
ered quantitative for the larger (>5–10 mm) phytoplank-
ton taxa.
Cyanobacteria abundance
Water samples (20 mL) were fixed in 2% final concentra-
tion formaldehyde (pre-filtered through 0.2 mm syringe
filter). Within several days of collection, 1–2 mL was
filtered onto black, 0.2 mm polycarbonate membrane filters
and mounted on microscope slides sandwiched between
layers of low-fluorescing immersion oil (Hobbie et al.,
1977). The cells were enumerated with a NikonMicrophot
epifluorescence microscope at 1250� equipped with a
green excitation (510–560 nm) and red emission (590 nm
LP) filter combination. A minimum of 300 cells was
counted distributed over at least 10 microscope fields (typi-
cally 20–40). Duplicate samples were periodically counted
and the coefficient of variation among replicates averaged
7.1% (n = 15). Cyanobacteria were distinguishable based
upon their fluorescence characteristics: phycoerythrin-con-
taining cells (PE-rich) fluoresced orange while phycocya-
nin-containing cells (PC-rich) fluoresced a deep red color.
The relative abundance of PE-rich and PC-rich cells was
measured on 20 samples from July to Oct 2000 using flow
cytometry (Beckman FACSCaliber) excited with blue
argon (488 nm) and red diode (635 nm) lasers, and emis-
sion measured in the orange (564–606 nm) and red
(653–669 nm) wavelengths. Additionally, six of these sam-
ples were visually scored as PE-rich or PC-rich using
epifluorescence microscopy.
Cyanobacteria isolation and culture
Cyanobacterial strains were isolated from Pensacola Bay
waters of salinity 15–20 p.s.u. as follows. Bay water was
pre-screened through a 5 mm filter to exclude larger
phytoplankton, enriched with nutrients [SN media, sali-
nity 20 p.s.u. (Waterbury et al., 1986)], and placed in a
lighted incubator (25�C, �100 mmol quanta m�2 s�1,
24 h light). After several days of growth, 200 mL aliquots
of this mixed assemblage was distributed into 12 wells of
a 72 well micro-titre plate. The aliquots were serially
diluted through seven series for a maximum dilution of
�10�9 and replaced into the incubator for several weeks.
Growth was observed (by change in color) in 10 of 12
wells of series 6, no growth was evident in any well of
series 7. The ten positive series 6 wells were transferred
into 10 mL of fresh media. After growth, all isolates were
examined microscopically and by flow cytometry; two
isolates contained pure PE-rich cells, and one isolate
contained pure PC-rich cells. The chlorophyll content
of one of the PE-rich isolates and the PC-rich isolate was
further characterized, by simultaneous chlorophyll and
cell abundance analysis, of three replicate cultures of
each strain grown in 500 mL Pyrex Erlenmeyer flasks,
and harvested during exponential growth.
Zooplankton
Zooplankton net tows were collected from November
1999 to November 2001 at four sites with a flow-meter
equipped (General Oceanics, Miami, FL), 0.5 m diameter,
153 mm net. The net was towed for 3 min at �1 m s�1 at
0.5–1 m below the surface. To examine replicability, a
second tow was taken at a single randomly-chosen site on
each date. Net contents were washed down and strained
through a 5 mm sieve to remove ctenophores and placed
on ice for return to the laboratory. For dry weight analysis,
a 10–50 mL sub-sample was removed with a Hensen-
Stempel pipette, desalted by washing with deionized
water over a 100 mm mesh, and transferred into pre-
weighed drying tins. The samples were dried at 70�C for
24–48 h and re-weighed. The remaining sample was pre-
served with 10% formalin for taxonomic identification and
abundance measurements (see below). Zooplankton dry
weight was converted to carbon biomass using a factor
of 0.4, and secondary production was calculated using
the temperature-dependent relationship of Huntley and
Lopez (Huntley and Lopez,1992),
P ¼ B � 0:0445 e0:111 � T
where P is zooplankton production in mg C L�1 day�1,
B is zooplankton biomass in mg C L�1 and T is water
temperature in �C.Zooplankton total abundance and taxonomic analysis
was conducted on samples collected from November
1999 to November 2001, including 10 samples from
replicate tows. The formalin-fixed samples were stained
with Rose Bengal, washed over a 63 mm mesh to remove
fixative, and re-diluted into sufficient water to obtain a
workable counting density. One mL aliquots were
pipetted from the shaken sample, transferred into a
counting chamber, and examined using a compound
microscope. This process was repeated until a minimum
of 200 individuals was counted and identified to the
lowest possible taxon. In order to make zooplankton
data comparable with measures of other variables, abun-
dance and biomass are reported as individuals (ind.) L�1
JOURNAL OF PLANKTON RESEARCH j VOLUME 26 j NUMBER 3 j PAGES 371–382 j 2004
374

and mg C L�1, respectively, rather than the more tradi-
tional units of ind. m�3 and mg C m�3.
RESULTS
Chlorophyll
During this study, chlorophyll concentrations (measured
fluorometrically) ranged from 1 to 26 mg L�1, averaging
6.8� 5.8 mg L�1 (mean� SD) (Figure 2). Peak concentra-
tions occurred during summer. In general, chlorophyll was
lower during 1999–2000 than in 2001. The minimum
chlorophyll concentrations were typically observed at the
Escambia River site (station 1). The size-fractionation data
suggest that, on average, over 70% of the chlorophyll was
associated with cells of <5 mm, however, the seasonal
peaks also included increases in the larger size fractions.
The <5 mm size fraction exhibited strong seasonality being
highest during summer ( June–October), often 70–90% of
total chlorophyll.
Cyanobacteria
Cyanobacteria were enumerated from June 1999 to
November 2001 on a total of 105 samples. Cyanobacterial
abundance exhibited a striking seasonality (Figure 3A) that
correlated strongly with water temperature (r = 0.61, P <<
0.0001, n = 105). The cyanobacteria observed were clearly
of estuarine origin given that, in the Escambia River,
abundances were one or more orders of magnitude lower
than at the nearest estuarine site (�2 km away). Cyano-
bacterial abundance also correlatedwith the<5mmchloro-
phyll size fraction (r = 0.77, P << 0.0001, n = 105); the
slope of Model II geometric mean regression was 3.42 and
the intercept was near zero (Figure 3B). Using this slope
factor suggests that cyanobacterial chlorophyll ranged
from 1.1 to 15.7 mg L�1, averaging >70% of the total
1999 2000 2001
0
10
20
Jun Sep Dec Mar Jun Sep Dec Mar Jun Sep Dec
Ch
loro
ph
yll (
µg L
−1)
Ch
loro
ph
yll (
µg
L−1
)C
hlo
rop
hyll (
µg
L−1
)C
hlo
rop
hyll (
µg L
−1)
Ch
loro
ph
yll (
µg
L−1
)
> 20 µM
5 - 20 µm
<5 µm
Station 1
0
10
20
Jun Sep Dec Mar Jun Sep Dec Mar Jun Sep Dec
Station 3
0
10
20
Jun Sep Dec Mar Jun Sep Dec Mar Jun Sep Dec
Station 2
0
10
20
Jun Sep Dec Mar Jun Sep Dec Mar Jun Sep Dec
Station 4
0
10
20
Jun Sep Dec Mar Jun Sep Dec Mar Jun Sep Dec
Station 5
Fig. 2. Size fractionated chlorophyll concentrations measured inPensacola Bay at five sites, from June 1999 through November 2001.The >20 mm fraction was calculated as the difference between the totaland the <20 mm fractions; the 5–20 mm fraction was calculated as thedifference between the <20 mm and the <5 mm fractions. The verticallines indicate the estimated contribution of cyanobacteria to totalchlorophyll, based on cell counts (see Figure 3).
0
1
2
3
4
5
Jun 99 Dec 99 Jun 00 Dec 00 Jun 01 Dec 01
0
10
20
30
A
B
Tem
pera
ture
(°C
)
12345Temp
0
5
10
15
0 1 2 3 4 5
Cyanobacterial Abundance (X 109 L-1)
Cyan
ob
acte
rial A
bu
nd
an
ce (
X 1
09 L
-1)
Ch
loro
ph
yll,
<5 µ
m (
µg
L-1
)
Y = 3.42X - 0.16
Fig. 3. (A) Cyanobacterial abundance in Pensacola Bay measuredfrom June 1999 to Nov 2001 at the five sampling sites (see legend).Note the strong coherence of abundance with water temperature(heavy solid line), and the relatively low abundances in the EscambiaRiver (site 1, diamonds). (B) Regression of the <5 mm chlorophyllfraction and cyanobacterial abundance, when cyanobacterial abun-dances reached a threshold of 1 � 109 L�1. The regression (ModelII, geometric mean) equation was used to calculate cyanobacterialcontribution to bulk chlorophyll (see Figure 2).
M. C. MURRELL AND E. M. LORES j PHYTOPLANKTON AND ZOOPLANKTON IN PENSACOLA BAY
375

chlorophyll (Figure 2). At times, the estimated cyanobac-
terial contribution to bulk chlorophyll exceeded the small
size fraction.
There were clear differences in fluorescence charac-
teristics of the cyanobacteria detectable with both
epifluorescence microscopy and flow cytometry. With
epifluorescence microscopy under green excitation,
cells rich in phycocyanin or allophycocyanin (PC-rich)
fluoresced a deep red color, whereas cells rich in phy-
coerythrin (PE-rich) fluoresced orange. This distinction
in cell types was also evident using flow cytometry when
excited with blue argon (488 nm) and red diode lasers
(635 nm) and emission measured in the orange (564–
606 nm) and red (653–669 nm). A clear spatial pattern
was evident in the distribution of PC-rich and PE-rich
cells, which when plotted against salinity (Figure 4),
showed that PC-rich cells were 8 to 10-fold more abun-
dant in the upper estuary, while PE-rich cells were more
abundant in the lower estuary. There was a sharp transi-
tion in dominance from PC-rich to PE-rich at salinities
of �20–25 p.s.u., a pattern less pronounced with flow
cytometry than with microscopy.
Cultured isolates of PE-rich and PC-rich cyanobac-
teria were analyzed for chlorophyll content and cell
abundance under exponential growth conditions. Both
strains were small (1–2 mm), unicellular, and coccoid to
rod-shaped, similar to open-ocean Synechococcus sp. and
the majority of cyanobacteria observed in Pensacola Bay
water samples. The cultures were very distinctive in
color; the PE-rich culture had a red–orange tint while
the PC-rich culture had a green tint. However, both
strains had similar cellular chlorophyll content; PC-rich
cells contained 3.1 � 0.3 fg Chl cell�1 (n = 3) and PE-
cells contained 3.2 � 0.2 fg Chl cell�1 (n = 3).
HPLC pigments
HPLC pigments were analyzed from 66 samples col-
lected at all fives sites from June 1999 to Nov 2000
(Figure 5). The most frequently measured pigments
were Chl a (100%), fucoxanthin (74%), zeaxanthin
(47%), Chl c (39%), diadinoxanthin (30%), and peridinin
(8%). Zeaxanthin concentration was correlated with cya-
nobacterial abundance (r = 0.71, P < 0.001, n = 31)
(Figure 6), increasing in the spring/summer and declin-
ing in the autumn. Chl c, diadinoxanthin and fuco-
xanthin increased in the fall and decreased in the spring.
Alloxanthin, representing cryptophytes, was found occa-
sionally, though always in low concentration, and ex-
hibited no consistent temporal or spatial patterns.
Phytoplankton taxonomy
A total of 38 samples from two stations (2 and 5) were
analyzed for phytoplankton taxonomy from July 1999 to
June 2001. The abundance and taxonomic patterns
were very similar at the two sites, so the data were
averaged for each sampling date (Figure 7). Diatoms
were the most abundant taxa (Figure 7A), generally
0.1
1
10
0 5 10 15 20 25 30
Salinity
PC
-:P
E-r
ich
ce
lls
Flow Cytometry
Microscopy
Fig. 4. Ratio of PC-rich to PE-rich cyanobacteria with respect tosalinity in Pensacola Bay from July to October 2000. The curve wasfitted by eye. PE-rich cells were distinguished from PC-rich cells bytheir characteristic orange fluorescence. Samples were analyzed by flowcytometry (circles) and/or epi-fluorescence microscopy (triangles).
10
20
30
Jun Sep Dec Mar Jun Sep
HP
LC
pig
men
ts (
µg
L1)
PeridininDiadinoxanthinChlorophyll cZeathanthinFucoxanthinChlorophyll a
A
0.0
0.2
0.4
0.6
0.8
1.0
Jun Sep Dec Mar Jun Sep
HP
LC
pig
men
ts (
%)
B
1999 2000
Fig. 5. Accessory pigments determined by HPLC analysis from June1999 to Nov 2000, showing the six pigments in highest concentration.Each point represents a mean of four analyses, one from each of thefour estuarine stations (stations 2–5), shown as (A) absolute concentra-tion in mg L�1, and (B) relative contribution to total pigments.
JOURNAL OF PLANKTON RESEARCH j VOLUME 26 j NUMBER 3 j PAGES 371–382 j 2004
376

representing over 50% of total abundance (Figure 7B),
and accounted for the three most abundant taxa (Table I).
Total abundances averaged 0.60� 0.39� 106 L�1 (mean
� SE), peaking at 1.6 � 106 L�1 during June 1999. In
January 2001, when total abundance was low (<0.5� 106
L�1), dinoflagellates comprised 70% of total abundance,
mostly Prorocentrum minimum. Chlorophytes (cf. Chlorella)
represented �50% in the spring of 2001, with abundances
of 0.2 � 106 L�1. Cryptophytes were most abundant
during spring and summer, with abundances averaging
about 0.05 � 106 L�1.
Zooplankton
A total of 107 zooplankton samples were collected from
November 1999 to November 2001 at the four estuarine
sites (2, 3, 4 and 5). Six samples were excluded from
analysis due to a malfunctioning flowmeter, but for the
remainder of the samples, the tow volume averaged
21.6� 5.8m3 (mean� standard deviation). The variability
among replicates was relatively small; the average percent-
age difference among duplicate tows was 16% (n = 18) for
dry weight and 13% (n = 9) for total abundance. Within-
date variability in zooplankton biomass among stations
was also relatively small with an average coefficient of
variation of 32%, and only weakly correlated with salinity
(r = 0.17, P = 0.12, n = 81). Based on the lack of strong
spatial patterns, and to examine system-wide seasonal pat-
terns, zooplankton biomass was averaged across the four
stations for each date (Figure 8). Zooplankton biomass
ranged from 1.4 to 34.1 mg C L�1, averaging 12.2 �8.5 mg C L�1. Generally, biomass minima occurred during
winter (Feb–Mar) and maxima occurred during May of
both years. Calculated zooplankton production ranged
from 0.3 to 27.5 mg C L�1 day�1 and tracked zooplankton
biomass except during winter, when productionwas almost
nil due to low temperatures. The very low abundances
observed during March and April 2001 coincided with a
large rain event in thewatershed, whenEscambiaRiver flow
exceeded 1000 m3 s�1, about 3-fold higher than normal.
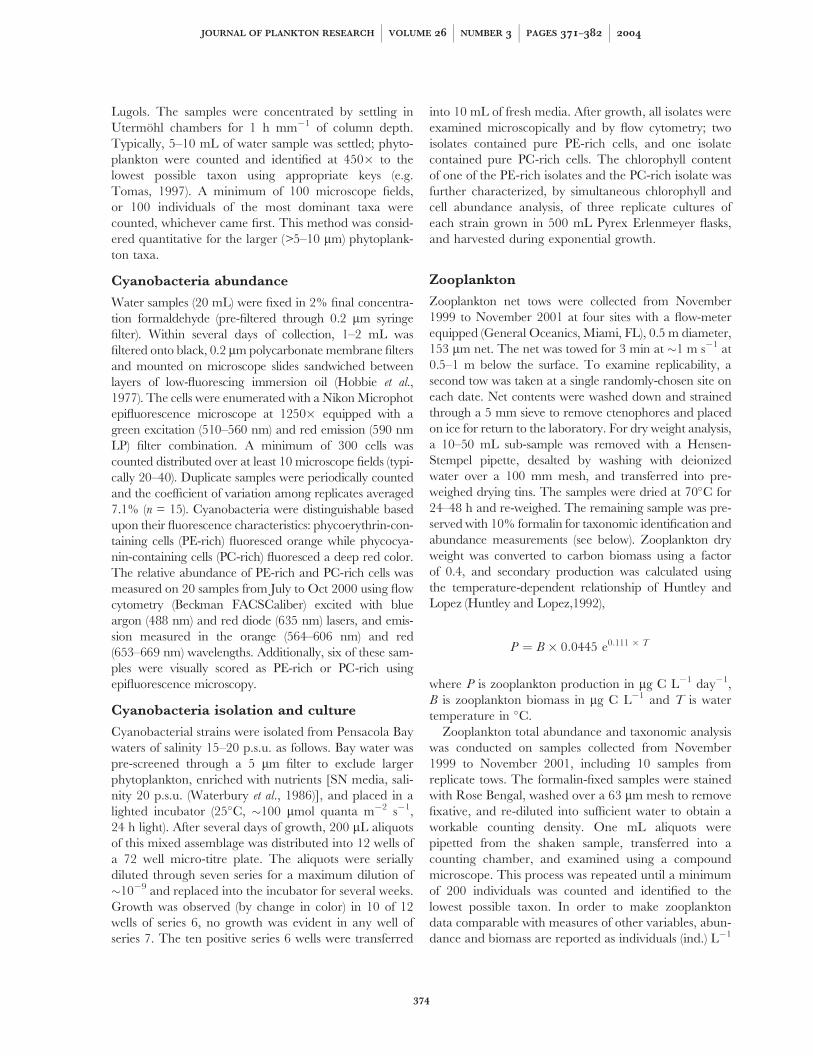
Zooplankton total abundance and taxonomic analysis
was conducted on a subset of 58 samples taken from
November 1999 to November 2000 (Figure 9). Total
abundance ranged from 2.7 to 45.5 ind. L�1 and aver-
aged 16.9 � 9.9 ind. L�1 (mean � SD). The dominant
taxon was Acartia tonsa, which averaged 54% (range
20–96%) of total abundance over the time series. Other
major taxa included the cyclopoid copepod, Oithona sp.
(15%), larval barnacles Balanus sp. (7%), the larvacean
Oikopleura sp. (5%) and the cladoceran Podon sp. (4%).
A. tonsa peaked during spring in both relative (69%) and
absolute abundance (16 ind. L�1), while Oithona sp.
peaked during summer when it comprised 30% of total
zooplankton, and reached average abundances of
5.9 ind. L�1. The larvacean, Oikopleura sp. was common
in the summer to early fall (average 1.2 ind. L�1).
Another calanoid periodically observed was Clausicalanus
furcatus, which reached high abundances during July
2000 at station 5 (Figure 9).
The relationship between zooplankton total abun-
dance and carbon biomass showed a strong positive
correlation (r = 0.70, P < 0.01, n = 43). In order to
0
1
2
3
4
0 1 2 3 4Cyanobacterial Abundance (X 109 L−1)
Zeaxan
thin
(µ
g L
−1)
Y = 0.98X + 0.41
R2 = 0.50
Fig. 6. Relationship between zeaxanthin and cyanobacterial abun-dance. The Model II (major axis) regression line is plotted. The slopesuggests zeaxanthin content of cyanobacteria of 1 fg cell�1.
0.0
0.5
1.0
1.5
Jun Sep Dec Mar Jun Sep Dec Mar Jun
Ph
yto
pla
nk
ton
Ab
un
(X
10
6 l
−1)
EuglenophytesDinoflagellatesCryptophytesChlorophytesDiatoms
A
1999 2000 2001
0%
25%
50%
75%
100%
Jun Sep Dec Mar Jun Sep Dec Mar Jun
Ph
yto
pla
nk
ton
% A
bu
n
B
Fig. 7. Net phytoplankton abundance by major taxonomic groups.Values plotted are the mean abundance from two sites, including theupper bay (station 2) and lower bay (station 5). Values are plotted as (A)total abundance and (B) percentage abundance.
M. C. MURRELL AND E. M. LORES j PHYTOPLANKTON AND ZOOPLANKTON IN PENSACOLA BAY
377

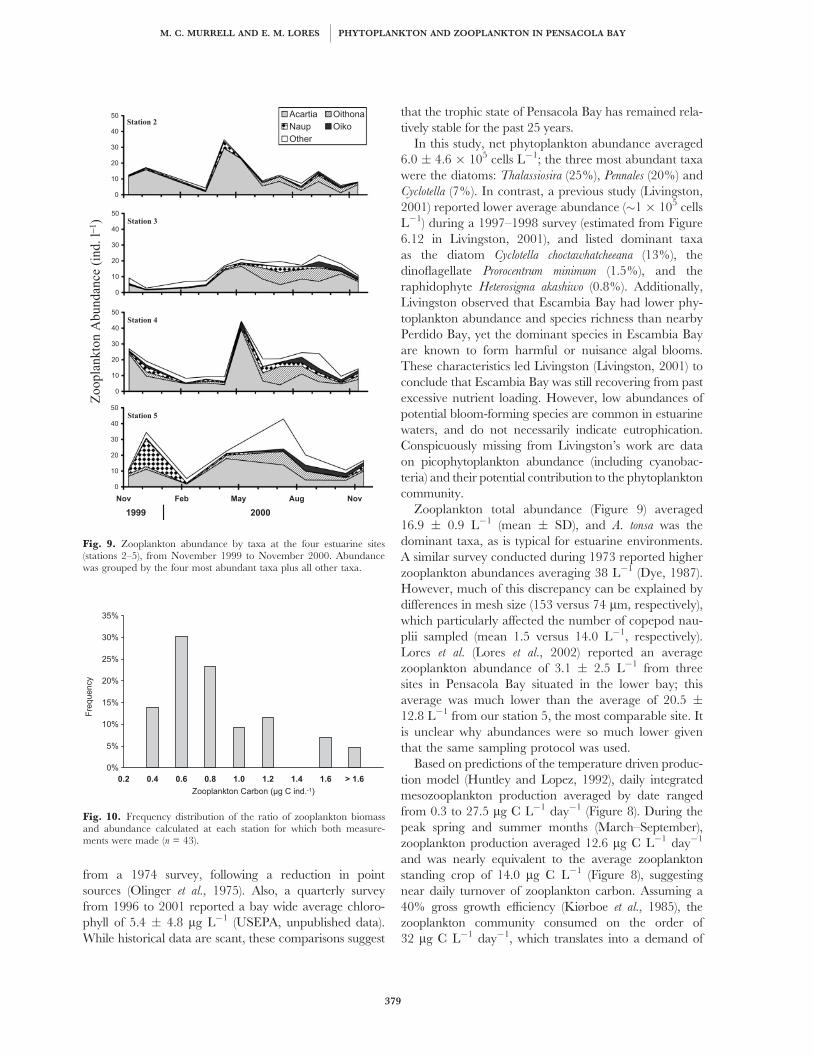
examine the size structure of the zooplankton commu-
nity over the study period, we used the ratio of zoo-
plankton carbon biomass to total abundance to estimate
the carbon content per individual. The carbon content
ranged from 0.2 to 3.2 mg C ind.�1, with an overall
median of 0.66 mg C ind.�1 (Figure 10). There was a
trend towards increasing median size, from 0.54 to
0.89 mg C ind.�1, with increasing salinity, although the
linear regression against salinity was not statistically sig-
nificant (P = 0.52).
DISCUSSION
The purpose of this study was to examine seasonal
patterns in phytoplankton and zooplankton in Pensacola
Bay to develop a more comprehensive understanding of
the biomass of the major plankton groups, and to pro-
vide insight into likely trophic pathways. Little is known
of the phytoplankton or zooplankton dynamics in Gulf
of Mexico estuaries in general and Pensacola Bay in
particular. Previous research in Pensacola Bay has been
motivated by occurrences of eutrophication-associated
summer fish kills, largely attributable to industrial point
sources (Olinger et al., 1975). In the present study, chloro-
phyll concentrations averaged 6.8 � 5.1 mg L�1 (mean
� SD), suggesting a system of a moderate trophic state.
Similar averages of 6.7 mg L�1 and 6.0 mg L�1 in upper
and lower Escambia Bay respectively were reported
Table I: List of most abundant phytoplankton identified to lowest possible taxa from Pensacola Bay
Group Taxa Abundance % % Peak Date
abundance occurrence abundance
Diatom Thalassiosira 150 25.3% 71% 1477 12-Apr-00
Diatom Pennales 119 20.1% 95% 1443 30-Jun-99
Diatom Cyclotella 43 7.3% 92% 195 9-Feb-00
Chlorophyte Chlorella 35 5.9% 100% 82 8-May-01
Cryptophyte Chroomonas 31 5.3% 79% 230 8-May-01
Dinoflagellate Prorocentrum 24 4.0% 76% 287 16-Jan-01
Diatom Thalassionema 23 3.8% 34% 466 30-Jun-99
Diatom Fragilariaceae 21 3.5% 58% 191 14-Nov-00
Chlorophyte Chlorophyceae 19 3.2% 71% 60 8-May-01
Chlorophyte Chlorococcaceae 16 2.6% 37% 55 10-Jun-01
Diatom Nitzschia 19 3.2% 87% 118 14-Nov-00
Dinoflagellate Gymnodinium 12 2.1% 66% 94 7-Dec-99
Diatom Chaetoceros 12 2.0% 37% 56 14-Nov-00
Diatom Coscinodiscus 9.3 1.6% 66% 82 30-Jun-99
Cryptophyte Plagioselmis 5.1 0.9% 34% 25 9-May-00
Chlorophyte Chlamydomonas 4.3 0.7% 55% 32 8-May-01
Diatom Navicula 3.2 0.5% 55% 17 30-Jun-99
Cryptophyte Cryptophyceae 3.0 0.5% 29% 21 8-May-01
Diatom Skeletonema 2.9 0.5% 13% 45 14-Nov-00
Chlorophyte Selenastrum 2.8 0.5% 34% 28 3-Aug-99
Cyanophyte Lyngbya 2.8 0.5% 39% 24 10-Apr-01
All other taxa 35.7 6.0%
Average abundance (� 103 L�1), relative % abundance, % occurrence (n = 38 samples), peak abundance, and the date of peak abundance.
0
10
20
30
40
50
Sep Dec Mar Jun Sep Dec Mar Jun Sep Dec
Zo
op
lan
kto
n B
iom
ass (
µg C
l−1
)
Zo
op
lan
kto
n P
rod
uc
tio
n (
µg C
l−1
d−1
)
Biomass
Production
1999 2000 2001
Fig. 8. Zooplankton biomass (mg C L�1) based on dry weight analysis(solid circles), and estimated production (open circles). Error barsrepresent standard deviations of samples taken at the four estuarinestations (stations 2–5).
JOURNAL OF PLANKTON RESEARCH j VOLUME 26 j NUMBER 3 j PAGES 371–382 j 2004
378
from a 1974 survey, following a reduction in point
sources (Olinger et al., 1975). Also, a quarterly survey
from 1996 to 2001 reported a bay wide average chloro-
phyll of 5.4 � 4.8 mg L�1 (USEPA, unpublished data).
While historical data are scant, these comparisons suggest
that the trophic state of Pensacola Bay has remained rela-
tively stable for the past 25 years.
In this study, net phytoplankton abundance averaged
6.0 � 4.6 � 105 cells L�1; the three most abundant taxa
were the diatoms: Thalassiosira (25%), Pennales (20%) and
Cyclotella (7%). In contrast, a previous study (Livingston,
2001) reported lower average abundance (�1 � 105 cells
L�1) during a 1997–1998 survey (estimated from Figure
6.12 in Livingston, 2001), and listed dominant taxa
as the diatom Cyclotella choctawhatcheeana (13%), the
dinoflagellate Prorocentrum minimum (1.5%), and the
raphidophyte Heterosigma akashiwo (0.8%). Additionally,
Livingston observed that Escambia Bay had lower phy-
toplankton abundance and species richness than nearby
Perdido Bay, yet the dominant species in Escambia Bay
are known to form harmful or nuisance algal blooms.
These characteristics led Livingston (Livingston, 2001) to
conclude that Escambia Bay was still recovering from past
excessive nutrient loading. However, low abundances of
potential bloom-forming species are common in estuarine
waters, and do not necessarily indicate eutrophication.
Conspicuously missing from Livingston’s work are data
on picophytoplankton abundance (including cyanobac-
teria) and their potential contribution to the phytoplankton
community.
Zooplankton total abundance (Figure 9) averaged
16.9 � 0.9 L�1 (mean � SD), and A. tonsa was the
dominant taxa, as is typical for estuarine environments.
A similar survey conducted during 1973 reported higher
zooplankton abundances averaging 38 L�1 (Dye, 1987).
However, much of this discrepancy can be explained by
differences in mesh size (153 versus 74 mm, respectively),
which particularly affected the number of copepod nau-
plii sampled (mean 1.5 versus 14.0 L�1, respectively).
Lores et al. (Lores et al., 2002) reported an average
zooplankton abundance of 3.1 � 2.5 L�1 from three
sites in Pensacola Bay situated in the lower bay; this
average was much lower than the average of 20.5 �12.8 L�1 from our station 5, the most comparable site. It
is unclear why abundances were so much lower given
that the same sampling protocol was used.
Based on predictions of the temperature driven produc-
tion model (Huntley and Lopez, 1992), daily integrated
mesozooplankton production averaged by date ranged
from 0.3 to 27.5 mg C L�1 day�1 (Figure 8). During the
peak spring and summer months (March–September),
zooplankton production averaged 12.6 mg C L�1 day�1
and was nearly equivalent to the average zooplankton
standing crop of 14.0 mg C L�1 (Figure 8), suggesting
near daily turnover of zooplankton carbon. Assuming a
40% gross growth efficiency (Kiørboe et al., 1985), the
zooplankton community consumed on the order of
32 mg C L�1 day�1, which translates into a demand of
Zoo
plan
kton
Abu
ndan
ce (
ind.
l−1)
0
10
20
30
40
50 Acartia Oithona
Naup Oiko
Other
Station 2
0
10
20
30
40
50
Station 3
0
10
20
30
40
50
Station 4
0
10
20
30
40
50
Nov Feb May Aug Nov
Station 5
1999 2000
Fig. 9. Zooplankton abundance by taxa at the four estuarine sites(stations 2–5), from November 1999 to November 2000. Abundancewas grouped by the four most abundant taxa plus all other taxa.
0%
5%
10%
15%
20%
25%
30%
35%
0.2 0.4 0.6 0.8 1.0 1.2 1.4 1.6 > 1.6
Zooplankton Carbon (µg C ind.-1)
Fre
qu
en
cy
Fig. 10. Frequency distribution of the ratio of zooplankton biomassand abundance calculated at each station for which both measure-ments were made (n = 43).
M. C. MURRELL AND E. M. LORES j PHYTOPLANKTON AND ZOOPLANKTON IN PENSACOLA BAY
379

about 1 mg Chl L�1 day�1, based on a Chl:C ratio of 0.03
(Cloern et al., 1995). This demand could readily bemet with
the observed chlorophyll concentrations of 5–10 mg L�1,
except that during summer, about 90% of this bio-
mass is contained in the cyanobacterial fraction, and not
directly consumable by zooplankton. Adult Acartia sp. can-
not efficiently filter particles <4 mm, and even the naupliar
stages are limited to particles >2 mm (Nival and Nival,
1976; Berggreen et al., 1988; Hansen et al., 1994). For
Acartia to be successful in this sort of environment, they
likely exert a strong grazing pressure on the larger, but
relatively scarce, phytoplankton taxa, as well as the micro-
zooplankton (Lonsdale et al., 1996; Sipura et al., 2003).
Other studies conducted in Pensacola Bay have confirmed
that microzooplankton are important grazers of phyto-
plankton (Murrell et al., 2002b), including the cyanobacteria
( Juhl and Murrell, in review) and that microzooplankton
are an important resource to mesozooplankton (Sipura
et al., 2003). Thus, in estuaries dominated by picoplankton,
it is likely that the trophic pathway to mesozooplankton
production is relatively inefficient and it is possible
that mesozooplankton become food limited during these
times.
A central finding of this study was the striking sum-
mertime peak in cyanobacteria abundance, reaching
3 � 109 L�1 (Figure 3), which strongly covaried with
the small chlorophyll size fraction (Figure 3B) and with
zeaxanthin concentration (Figure 6). The cyanobacteria
were small (1–2 mm) and typically were observed as
single cells, but occasionally occurred in small clumps
of 10–20 cells. Preliminary molecular characterization
by terminal restriction fragment length polymorphism
(TRFLP) analysis of PCR-amplified rpoC genes indicated
that the cyanobacteria belong to the genus Synechococcus
and that relatively few types of cyanobacteria occurred
in ambient water samples ( J. Collier, SUNY Stony
Brook, personal communication).
Cyanobacterial abundances have been reported in
estuaries and coastal bays, including the Florida Bay
(Phlips et al., 1999), the Mississippi–Atchafalaya river
plume (Dortch, 1998), the Chesapeake Bay (Malone
et al., 1991; Marshall and Nesius, 1996), the Neuse
River estuary (Pinckney et al., 1998), the San Francisco
Bay (Ning et al., 2000), and the York River estuary (Sin
et al., 2000). Cyanobacteria abundances in these estuaries
vary considerably, but in general warmer estuaries tend to
have the higher abundances.
At present, we do not have comprehensive estimates of
cyanobacterial productivity in Pensacola Bay, but results
from dilution experiments show that the maximum
specific growth rate of cyanobacteria is 1–1.5 day�1 during
summer and is strongly linked to temperature ( Juhl and
Murrell, in review). Similar specific growth rates of
1.1 day�1 were observed during summer in Chesapeake
Bay (Affronti and Marshall, 1994). Carpenter and
Campbell (Carpenter and Campbell, 1988) reported
peak specific growth rates of 1.08 day�1 (reported as
1.56 divisions day�1) in Long Island Sound, and that
cyanobacterial productivity peakedduringAugust.Temper-
ature dependence of cyanobacterial growth rate appears
particularly strong, being repeatedly noted in estuarine
(Carpenter and Campbell, 1988; Ray et al., 1989; Iriarte
and Purdie, 1994) and oceanic environments (Li, 1998).
Based on these observations, it is clear that estuarine
cyanobacteria actively grow during warm periods, and
thus significantly contribute to bulk productivity, probably
in proportion to their relative biomass.
Our empirical approach of estimating cyanobacterial
chlorophyll content (Figure 3B) cannot account for vari-
ation caused by different growth and light conditions.
For example, Kana and Glibert (Kana and Glibert,
1987) cultured Synechococcus in varying light conditions,
and found a 3-fold variation in cyanobacterial chloro-
phyll content (range of 1.3–3.7 fg Chl cell�1). Similarly,
Moore et al. (Moore et al., 1995) reported cyanobacterial
chlorophyll content of 4 fg Chl cell�1 for cultured Syne-
chococcus in high light. It is also likely that the cyanobac-
terial chlorophyll content will vary with nutrient status;
nutrient starved cells should have less chlorophyll than
nutrient-replete cells. We have successfully isolated PC-
rich and PE-rich cyanobacteria from Pensacola Bay and
found that both PC-rich and PE-rich isolates contained
about 3.1 fg Chl cell�1, when grown in moderate light,
nutrient-replete conditions. The coherence among these
estimates suggests that the empirical factor of 3.5 fg Chl
cell�1 used here was probably reasonable.
We observed at least two distinct types of cyanobac-
teria in our samples, PC-rich and PE-rich, and there was
a clear spatial gradient with PC-rich cells dominant in
the upper estuary. A similar pattern of dominance has
been observed in other estuaries. For example, in the
York River estuary, PC-rich cells were up to 8-fold more
abundant than PE-rich cells (Ray et al., 1989). In the
Hudson River, PC-rich cells predominated to the ap-
parent exclusion of PE-rich cells (Collier, 2000). In
Mississippi–Atchafalaya plume waters in the Gulf of
Mexico, Dortch (Dortch, 1998) found PC-rich cells
more abundant than PE-rich cells at lower salinities. It
is currently unclear what drives this apparent salinity
pattern, but it may be a physiological adaptation to
lower salinity, or other variables expected to covary
with salinity in estuarine environments (i.e. nutrients,
light). Future studies directed at the comparative phy-
siology of PC-rich versus PE-rich cyanobacteria using
cultured or field populations would improve our under-
standing of these observed distributions.
JOURNAL OF PLANKTON RESEARCH j VOLUME 26 j NUMBER 3 j PAGES 371–382 j 2004
380

While cyanobacteria abundance has been reported
from many estuaries, their contribution to total phyto-
plankton biomass is less frequently quantified. Averaged
over this time series (excluding station 1), cyanobacteria in
Pensacola Bay represented 43% of total chlorophyll, and
this fraction was usually well over 90% during summer
(Figure 2). In other estuaries where this estimate has been
made, their contribution appears to be much smaller. For
example, in San Francisco Bay cyanobacteria were a rela-
tively small component of total chlorophyll (Ning et al.,
2000), averaging 15% (maximum 38%). In the Neuse
River estuary, cyanobacteria represented 18% of total
chlorophyll based on HPLC pigment analysis (Pinckney
et al., 1998). In the York River estuary, picophytoplankton
comprised 7% of chlorophyll over an annual cycle, peak-
ing at 14% during summer (Ray et al., 1989). In Kiel Bight,
Jochem ( Jochem, 1988) reported that cyanobacteria
contributed up to 52% of the total chlorophyll during
summer, but presented no data during other seasons. In
Southampton estuary, Iriarte and Purdie (Iriarte and
Purdie, 1994) found that cyanobacteria contributed 10%
or less to bulk chlorophyll. Based on a survey of the
available literature, they further argued that the picoplank-
ton contribution to bulk chlorophyll is only dominant in
oligotrophic environments with chlorophyll levels from
0.5 to 1 mg L�1, and that their importance diminishes
with increasing trophic state, ultimately contributing <5%
when chlorophyll concentrations exceed 5 mg L�1. While
this pattern may hold for temperate estuaries, Pensacola
Bay and similar sub-tropical systems such as Florida Bay
(Phlips et al., 1999) do not fit this pattern. Clearly, the role
of cyanobacteria in tropical and sub-tropical estuaries
needs further clarification.
In summary, this study described the phytoplankton
and zooplankton composition in Pensacola Bay, Florida, a
sub-tropical estuary in the northern Gulf of Mexico. We
observed remarkably high abundances of cyanobacteria in
Pensacola Bay during three summer periods from 1999 to
2001 (Figure 3A), and that cyanobacteria appeared to
dominate the chlorophyll biomass during these periods
(Figures 2 and 3B). The HPLC data supported this inter-
pretation, showing high relative concentrations of the
diagnostic pigment zeaxanthin (Figure 5) and a strong
coherence between zeaxanthin and cyanobacterial abun-
dance (Figure 6). The zooplankton were dominated by
Acartia tonsa, typical of temperate estuaries, andmay become
food-limited during periods of cyanobacterial dominance.
ACKNOWLEDGEMENTS
This study was made possible by the excellent field and
laboratory support provided by George Craven, Mike
Marcovich, Jim Patrick, Bob Quarles, Lisa Smith and
Roman Stanley. Zooplankton taxonomy data were pro-
vided by Barry Vittor and Associates, Inc, Mobile, AL.
Phytoplankton taxonomic data were analyzed by Elizabeth
Miller, Florida Department of Environmental Protection,
Pensacola, FL. Discussions with Jane Caffrey, Andy Juhl,
and Jim Hagy improved the manuscript. Helpful com-
ments on previous drafts of the manuscript were provided
by Rick Greene, Dick Snyder and two anonymous
reviewers. Contribution No. 1190 US EPA, Gulf Breeze,
FL, USA.Mention of trade names or commercial products
does not constitute endorsement by the US EPA.
REFERENCES
Affronti, L. F. and Marshall, H. G. (1994) Using frequency of dividing
cells in estimating autotrophic picoplankton growth and productivity
in the Chesapeake Bay. Hydrobiologia, 284, 193–203.
Alexander, R. B., Ludtke, A. S., Fitzgerald, K. K. and Schertz, T. L.
(1996) Data from selected U. S. Geological Survey national stream
water-quality monitoring networks (WQN), Open File Report,
96–337, United States Geological Survey, Washington, DC.
Berggreen, U., Hansen, B. and Kiørboe, T. (1988) Food size spectra,
ingestion and growth of the copepod Acartia tonsa during develop-
ment: implications for determination of copepod production. Mar.
Biol., 99, 341–352.
Carpenter, E. J. and Campbell, L. (1988) Diel patterns of cell division
and growth rates of Synechococcus spp. in Long Island Sound. Mar.
Ecol. Prog. Ser., 47, 179–183.
Cloern, J. E., Grenz, C. and Vidergar-Lucas, L. (1995) An empirical
model of the phytoplankton:carbon ratio—the conversion factor
between productivity and growth rate. Limnol. Oceanogr., 40, 1313–1321.
Collier, J. L. (2000) Flow cytometry and the single cell in phycology.
J. Phycol., 36, 628–644.
Cottingham, K. L. (1999) Nutrients and zooplankton as multiple stres-
sors of phytoplankton communities: evidence from size structure.
Limnol. Oceanogr., 44, 810–827.
Dortch, Q. (1998) Phytoplankton characteristics. In Murray, S. P. (ed.),
An Observational Study of the Mississippi–Atchafalaya Coastal Plume. U. S.
Department of the Interior, Minerals Management Service, MMS
98–0040, Ch. VII, pp. 239–268.
Dye, L. C. (1987) Surface and near surface zooplankton collected
during 1973 in Escambia Bay and East Bays, northwest Florida.
MS Thesis, University of West Florida, Pensacola, FL.
Flemer, D. A., Livingston, R. J. and McGlynn, S. E. (1998) Seasonal
growth stimulation of sub-temperate estuarine phytoplankton to
nitrogen and phosphorus: an outdoor microcosm experiment. Estu-
aries, 21, 145–159.
Hansen, B., Bjornsen, P. K. andHansen, P. J. (1994) The size ratio between
planktonic predators and their prey. Limnol. Oceanogr., 39, 395–403.
Hobbie, J. E., Paley, R. J. and Jasper, S. (1977) Use of nuclepore filters
for counting bacteria by epifluorescence microscopy. Appl. Env.
Microbiol., 33, 1225–1228.
Huntley, M. E. and Lopez, M. D. G. (1992) Temperature-dependent pro-
duction of marine copepods: a global synthesis. Am. Nat., 140, 201–242.
Ingrid, G., Andersen, T. and Vadstein, O. (1996) Pelagic food webs
and eutrophication of coastal waters: impact of grazers on algal
communities. Mar. Pollut. Bull., 33, 22–35.
M. C. MURRELL AND E. M. LORES j PHYTOPLANKTON AND ZOOPLANKTON IN PENSACOLA BAY
381
Iriarte, A. and Purdie, D. A. (1994) Size distribution of chlorophyll a
biomass and primary production in a temperate estuary (Southampton
Water): the contribution of photosynthetic picoplankton. Mar. Ecol.
Prog. Ser., 115, 283–297.
Jeffrey, S. W., Mantoura, R. F. C. and Wright, S. W. (1997) Phyto-
plankton pigments in oceanography: guidelines to modern methods.
UNESCO Publishing, Paris.
Jochem, F. (1988) On the distribution and importance of picocyano-
bacteria in a boreal inshore area (Kiel Bight, Western Baltic).
J. Plankton Res., 10, 1009–1022.
Kana, T. M. and Glibert, P. M. (1987) Effect of irradiances up to
2000 mE m�2 s�1 on marine Synechococcus WH7803, I. Growth,
pigmentation, and cell composition. Deep-Sea Res., 34, 479–495.
Kiørboe, T., Mohlenberg, F. and Hamburger, K. (1985) Bioenergetics
of the planktonic copepod Acartia tonsa: relation between feeding,
egg production and respiration, and composition of specific dynamic
action. Mar. Ecol. Prog. Ser., 26, 85–97.
Li, W. (1998) Annual average abundance of heterotrophic bacteria and
Synechococcus in surface ocean waters. Limnol. Oceanogr., 43, 1746–1753.
Livingston, R. J. (2001) Eutrophication Processes in Coastal Systems. CRC
Press, Boca Raton, FL.
Livingston, R. J. (2003) Trophic Organization in Coastal Systems. CRC
Press, Boca Raton, FL.
Lonsdale, D. C., Cosper, E. M., Kim, W.-S., Doall, M., Divadeenam, A.
and Jonasdottir, S. H. (1996) Food web interactions in the plankton
of Long Island bays, with preliminary observations on brown tide
effects. Mar. Ecol. Prog. Ser., 134, 247–263.
Lores, E. M., Lewis, M. A. and Malaeb, Z. A. (2002) Spatial and
temporal variability in zooplankton community dynamics in three
urbanized bayous of the Pensacola Bay system, Florida, USA. Gulf
Caribbean Res., 14, 1–11.
Malone, T. C., Ducklow, H. W., Peele, E. R. and Pike, S. E. (1991)
Picoplankton carbon flux in Chesapeake Bay. Mar. Ecol. Prog. Ser.,
78, 11–22.
Marshall, H. G. and Nesius, K. K. (1996) Phytoplankton composition
in relation to primary production in Chesapeake Bay. Mar. Biol.,
125, 611–617.
Micheli, F. (1999) Eutrophication, fisheries, and consumer-resource
dynamics in marine pelagic ecosystems. Science, 285, 1396–1398.
Moore, L., Goericke, R. and Chisholm, S. (1995) Comparative phy-
siology of Synechococcus and Prochlorococcus: influence of light and
temperature on growth, pigments, fluorescence and absorptive prop-
erties. Mar. Ecol. Prog. Ser., 116, 259–275.
Mousseau, L., Fortier, L. and Legendre, L. (1998) Annual production
of fish larvae and their prey in relation to size fractionated primary
production (Scotian shelf, NW Atlantic). ICES Journal of Marine
Science, 55, 44–57.
Murrell, M. C., Stanley, R. S., Lores, E. M., DiDonato, G. T., Smith,
L. M. and Flemer, D. A. (2002a) Evidence that phosphorus limits
phytoplankton growth in a Gulf of Mexico estuary: Pensacola Bay,
FL, USA. Bull. Mar. Sci., 70, 155–167.
Murrell, M. C., Stanley, R. S., Lores, E. M., DiDonato, G. T. and Flemer,
D. A. (2002b) Linkage between microzooplankton grazing and phyto-
plankton growth in a Gulf of Mexico estuary. Estuaries, 25, 19–29.
Myers, V. B. and Iverson, R. L. (1981) Phosphorus and nitrogen
limited phytoplankton productivity in northeastern Gulf of Mexico
coastal estuaries. In Neilson, B. J. and Cronin, L. E. (eds), Estuaries
and Nutrients. Humana Press, Clifton, NJ.
Ning, X., Cloern, J. E. and Cole, B. E. (2000) Spatial and temporal
variability of picocyanobacteria Synechococcus sp. in San Francisco
Bay. Limnol. Oceanogr., 45, 695–702.
Nival, P. and Nival, S. (1976) Particle retention efficiencies of an
herbivorous copepod, Acartia clausi (adult and copepodite stages):
effects on grazing. Limnol. Oceanogr., 21, 24–38.
NRC (2000) Clean Coastal Waters: Understanding the Effects of Nutrient
Pollution. National Academy Press, Washington, DC.
Olinger, L. W., Rogers, R. G., Fore, P. L., Todd, R. L., Mullins, B. L.,
Bisterfield, F. T. and Wise, L. A. (1975) Environmental and Recovery
Studies of Escambia Bay and the Pensacola Bay System, Florida. US Envir-
onmental Protection Agency, Atlanta.
Phlips, E. J., Badylak, S. and Lynch, T. C. (1999) Blooms of picoplank-
tonic cyanobacterium Synechococcus in Florida Bay, a subtropical
inner-shelf lagoon. Limnol. Oceanogr., 44, 1166–1175.
Pinckney, J. L., Paerl, H. W., Harrington, M. B. and Howe, K. E.
(1998) Annual cycles of phytoplankton community-structure and
bloom dynamics in the Neuse River Estuary, North Carolina. Mar.
Biol., 131, 371–381.
Ray, T. R., Haas, L. W. and Sieracki, M. E. (1989) Autotrophic
picoplankton dynamics in a Chesapeake Bay sub-estuary. Mar.
Ecol. Prog. Ser., 52, 273–285.
Roelke, D. L., Eldridge, P. M. and Cifuentes, L. A. (1999) A model of
phytoplankton competition for limiting and nonlimiting nutrients:
implications for development of estuarine and nearshore manage-
ment schemes. Estuaries, 22, 92–104.
Schroeder, W. W. and Wiseman, W. J. (1999) Geology and hydrody-
namics of Gulf of Mexico Estuaries. In Bianchi, T. S., Pennock, J. R.
and Twilley, R. R. (eds), Biogeochemistry of Gulf of Mexico Estuaries.
John Wiley and Sons, Inc., New York, pp. 3–28.
Sin, Y., Wetzel, R. L. and Anderson, I. C. (2000) Seasonal variations of
size-fractionated phytoplankton along the salinity gradient in the
York River estuary, Virginia (USA). J. Plankton Res., 22, 1945–1960.
Sipura, J., Lores, E. M. and Snyder, R. A. (2003) Effect of copepods
on estuarine microbial plankton in short-term microcosms. Aquat.
Microb. Ecol., 33, 181–190.
Solis, R. S. and Powell, G. L. (1999) Hydrography, mixing characteristics,
and residence times of Gulf of Mexico Estuaries. In Bianchi, T. S.,
Pennock, J. R. and Twilley, R. R. (eds), Biogeochemistry of Gulf of Mexico
Estuaries, John Wiley and Sons, Inc., New York, pp. 29–62.
Stolte, W., McCollin, T., Noordeloos, A. A. M. and Riegman, R. (1994)
Effect of nitrogen source on the size distribution within marine phyto-
plankton populations. J. Exp. Mar. Biol. Ecol., 184, 83–97.
Tomas, C. R. (ed.) (1997) Identifying Marine Phytoplankton. Academic
Press, San Diego.
Waterbury, J. B., Watson, S. W., Valois, F. W. and Franks, D. G.
(1986) Biological and ecological characterization of the marine
unicellular cyanobacterium Synechococcus. In Platt, T. and
Li, W. K. W. (eds), Photosynthetic Picoplankton. Department of Fisheries
and Oceans, Ottawa, Canada, pp. 71–120.
Welschmeyer, N. A. (1994) Fluorometric analysis of chlorophyll-a in
the presence of chlorophyll-b and phaeopigments. Limnol. Oceanogr.,
39, 1985–1992.
Wright, S. W., Jeffery, S. W., Mantoura, R. F. C., Llewellyn, C. A.,
Bjornsen, P. K., Repeta, D. and Welschmeyer, N. (1991) Improved
HPLC method for the analysis of chlorophylls and carotenoids from
marine phytoplankton. Mar. Ecol. Prog. Ser., 77, 183–196.
Received on August 28, 2003; accepted on January 14, 2004
JOURNAL OF PLANKTON RESEARCH j VOLUME 26 j NUMBER 3 j PAGES 371–382 j 2004
382