PHYTOCHEMICAL AND BIOLOGICAL INVESTIGATION OF...
184
PHYTOCHEMICAL AND BIOLOGICAL INVESTIGATION OF MEDICINAL PLANTS THESIS SUBMITTED TO THE TAMILNADU DR. M.G. R. MEDICAL UNIVERSITY, CHENNAI, FOR THE AWARD OF THE DEGREE OF DOCTOR OF PHILOSOPHY Submitted by B. GEETHA, M. Pharm.., Under the Guidance of Dr. SHRISHAILAPPA BADAMI, M. Pharm., Ph.D. DECEMBER 2010 DEPARTMENT OF PHARMACEUTICAL CHEMISTRY J. S. S. COLLEGE OF PHARMACY OOTACAMUND - 643 001, TAMILNADU, INDIA
Transcript of PHYTOCHEMICAL AND BIOLOGICAL INVESTIGATION OF...
PHYTOCHEMICAL AND BIOLOGICAL INVESTIGATION OF MEDICINAL PLANTS
THESIS SUBMITTED TO THE TAMILNADU DR. M.G. R. MEDICAL
UNIVERSITY, CHENNAI, FOR THE AWARD OF THE DEGREE OF
DOCTOR OF PHILOSOPHY
Submitted by
B. GEETHA, M. Pharm..,
Under the Guidance of
Dr. SHRISHAILAPPA BADAMI, M. Pharm., Ph.D.
DECEMBER 2010
DEPARTMENT OF PHARMACEUTICAL CHEMISTRY J. S. S. COLLEGE OF PHARMACY
OOTACAMUND - 643 001, TAMILNADU, INDIA

Dr. Shrishailappa Badami Professor
CERTIFICATE
This is to certify that the thesis entitled “Phytochemical and biological
investigation of medicinal plants” submitted by Mrs. B. Geetha, to The
Tamilnadu Dr. M. G. R. Medical University, Chennai, for the award of the Degree
of Doctor of Philosophy in Pharmaceutical Sciences, is a record of the independent
research work carried out by her at J. S. S. College of Pharmacy, Ootacamund,
under my supervision, during 2006-2010. I also certify that this thesis or any part
thereof has not formed the basis for the award of any other research degree, of this
or any other University, previously.
Dr. Shrishailappa Badami
Research Supervisor

CERTIFICATE
This is to certify that the thesis entitled “Phytochemical and biological investigation of
medicinal plants” submitted by Mrs. B. Geetha, to The Tamilnadu Dr. M. G. R.
Medical University, Chennai, for the award of the Degree of Doctor of Philosophy in
Pharmaceutical Sciences, is based on the research work carried out by her under the
supervision of Dr. Shrishailappa Badami, Professor, J. S. S. College of Pharmacy,
Ootacamund. The thesis or any part thereof has not formed the basis for the award of
any other research degree, of this or any other University, previously.
Principal
DECLARATION I hereby declare that the thesis entitled “Phytochemical and
biological investigation of medicinal plants” submitted by me to
The Tamilnadu Dr. M. G. R. Medical University, Chennai, for the award
of the Degree of Doctor of Philosophy in Pharmaceutical Sciences, is
the result of my original and independent work carried out at J. S. S.
College of Pharmacy, Ootacamund, under the supervision of
Dr. Shrishailappa Badami, Professor, J. S. S. College of Pharmacy,
Ootacamund. The thesis or any part thereof has not formed the basis
for the award of any degree, diploma, associateship, fellowship, or any
other similar title, of this or any other University, previously.
(B. Geetha)

ACKNOWLEDGEMENT
I wish to place my deep sense of gratitude, regards and thanks to my guide
Dr. Shrishailappa Badami, Professor, Department of Pharmaceutical chemistry,
for his innovative thoughts, enthusiasm, which inspired me to do my research
work. His advice, valuable guidance, teaching skills and encouragement have
made me to put all my efforts to build my abilities and skills in my career. His
nobleness, lateral thinking and innovative ideas helped me to bring out the best in
me and strongly backed me throughout the completion my thesis work.
I whole heartedly thank Dr. B. Suresh, Vice Chancellor, JSS University Mysore
and Dr. K. Elango, Principal, for providing the infrastructure and helping me all
through my research work.
I am grateful to Dr. S. Ravi, Head, Department of Chemistry, Karpagam College
of Arts and Science, Coimbatore for his valuable guidance in elucidating the
structures of isolated compounds.
It is great pleasure to thank Dr. S. Shankar, Dr. M. J. Nanjan, Dr. M. J. N.
Chandrasekhar, Dr. S. N. Meyyanathan, Mr. B. R. Prashanthkumar, Mrs.
Jubie, Mrs. Gowramma and Mrs. Gomathi for their support during my work.
I thank Dr. M. N. Satishkumar, Mr. Shanish Antony and other PG students of
Department of Pharmacology, JSS College of Pharmacy for their guidance and
help in animal activity. I am thankful to Dr. S. P. Dhanapal, Dr. P. Vijayan and
Mrs. Srividhya, for their good support.
I wholeheartedly thank my good friends Ms. Maithili, Mrs. Jaishree,
Mr. Mahendran and Ms. Padmavathy for their timely help. Without their help, I
would not have completed my thesis. I am very thankful to my
best friends Mrs. Gandhimathi, Mrs. Bagyalakshmi, Mrs. Beena and
Mrs. Allimalarkodi for their encouragement during my research work. I extend
my thanks to my beloved friends Mrs. Krishnaveni, Ms. Subhashini and
Mrs. Kasthuri for their great affection and warm friendship. I am happy to thank
the support and affection given my Mrs. Sukumari and two great little masters
Chaitanya and Vikash, for their kindness during my thesis preparation. I am
extending my thanks to my research friends Aruna, Pandian,
Lakshminarashimaiah and all PG students of Pharmaceutical chemistry for
their kind support. I also thank Ms .Suja and Ms.Sujatha for their help and
kindness.
I would like to thank Mr. S. Puttarajappa, Superintendent, for his cooperation
and support and non-teaching faculty of the institution, Mr. Sukumar,
Mr. Mahadevaswamy, Mr. Lingaraj, Mr. A. Venkatesh, Mr. Ramachandra,
Mr. Nagendrappa and Mr. Shivakumar for their help during the work.
I thank Principal and Staff of R. V. S. College of Pharmaceutical sciences,
Coimbatore for their kind support.
I also thank AICTE for giving me an opportunity through Quality Improvement
Programme for doing my full time Ph.D. programme.

I take this opportunity with pride and gratification to express the feeling of thanks
and acknowledge the support of all the people who helped throughout the
materialization of this research work. It is with immense pleasure, from the
bottom of my heart I thank my beloved husband Mr. Saravanakumar who is
behind all my accomplishments. His affection, support and continuous
encouragement have enabled me to go through every phase of my graduate life
successfully I totally appreciate and thank my dearest understanding son Harish,
my parents, brother Mr. Thangaraj and sister in law Sathya, my parents-in-laws,
my cousin sister Mrs. Sheela and cousin brothers Arun and Anand, grandma,
for their patience, kindness and good wishes that has helped me to sustain
throughout my doctoral studies. I thank God for making my mind towards a
meaningful life and to make a small contribution to the science.
Above all, my sincere Pranams to our most revered His Holiness Jagadguru Sri Sri
Shivarathri Deshikendra Mahaswamiji of Sri Suttur Mutt, Mysore.
Finally, I thank everyone who directly or indirectly supported me during the
course of my research work.
B. Geetha

CONTENTS
CHAPTER TITLES PAGE
1. Introduction 1-12
2. Scope and plan of work 13-17
3. Plant profile and literature review 18-20
4. Materials and methods 21-75
5. Results 76-139
6. Discussion 140-152
7. Summary and conclusion 153-158
Bibliography
Annexure

Introduction
1
Plants have been always an integral part of the ancient culture of India, China
and Egypt as medicine and their importance even dates back to the Neanderthal
period . These medicines initially took the form of crude drugs such as tinctures,
teas, poultices, powders, and other herbal formulations (Samuelsson, 2004). The
applications of plant based formations for various ailments and their methods of
preparation were passed through oral history during ancient periods. Eventually
information regarding medicinal plants was recorded in herbals which are
providing lot of opportunities to explore and isolate unknown plant components.
India represented by rich culture, traditions and natural biodiversity, offers a
unique opportunity for drug discovery researchers. This knowledge-based
country is well recognized for its heritage of the world’s most ancient traditional
system of medicine, Ayurveda. Even, Dioscorides who influenced Hippocrates is
thought to have taken many of his ideas from India (Gurib-Fakim, 2006). India
is a major resource of medicinal plants, two of the 18 hotspots of plant
biodiversity in the world namely the Eastern Himalayas and the Western Ghats
are found in India. Interestingly, India ranks seventh among the 16 mega diverse
countries, where 70% of the world’s species occurs collectively. The natural
resources found in India are exorbitant accounting for rich flora of endemic plant
species consisting of 5725 angiosperms, 10 gymnosperms, 193 pteridophytes,
678 bryophytes, 260 liverworts, 466 lichens, 3500 fungi and 1924 algae
(Sanjappa, 2005). Unfortunately, only 65% of the flora of the country has been
surveyed so far due to inaccessibility to tough terrains. It is estimated that around
2,50,000 flowering plant species are reported to occur globally. Approximately

Introduction
2
half (1,25,000) of these are found in the tropical forests. They continue to
provide natural product chemists with invaluable compounds for the
development of new drugs. The potential for finding new compounds is
enormous as till date only about 1% of tropical species have been studied for
their pharmaceutical potential. Hence, natural products are considered to be a
treasure for the phytochemists.
In more recent history, the use of plant based medicines has involved the
isolation of active compounds. It has its beginning with the isolation of
morphine from opium in the early 19th century (Kinghorn, 2001; Samuelsson,
2004). Isolation and characterization of pharmacologically active compounds
from medicinal plants continue till today. The techniques for the utilization of
plant medicines have been improved to a greater extent in recent years. Various
drug discovery techniques have been applied for the standardization of herbal
medicines, to elucidate analytical marker compounds. Drug discovery from
medicinal plants includes numerous fields of inquiry and various methods of
analysis. The process typically begins with a botanist, ethnobotanist,
ethnopharmacologist, or plant ecologist. The primary activity involves the
identification and collection of plant(s) of interest. Collection is based on the
species with known biological activity for which active compound(s) have not
been isolated (e.g., traditionally used herbal remedies) or may involve taxa
collected randomly for a large screening program giving respect to the
intellectual property rights of a given country where plant(s) of interest are
collected (Baker et al., 1995). In the next step, Phytochemists (natural product
Introduction
3
chemists) prepare extracts from the plant materials, subject these extracts to
biological screening in pharmacologically relevant assays, and commence the
process of isolation and characterization of the active compound(s) through
bioassay-guided fractionation. Finally the isolated compounds subjected to
appropriate screening techniques for the determination of physiologically
relevant targets by molecular biologists.
There are two types of plant chemicals, primary metabolites such as sugars,
proteins, amino acids, chlorophylls etc. The other category of chemicals is called
secondary metabolites, which includes alkaloids, terpenoids, saponins and
phenolic compounds. These chemicals exert a significant physiological effect on
the mammalian system. Secondary metabolites from natural sources have been
elaborated within living systems and they are often perceived as showing more
“drug-likeness and biological friendliness than totally synthetic molecules”
(Koehn and Carter, 2005) making them good candidates for further drug
development (Balunas and Kinghorn, 2005; Drahl et al., 2005).
The global market for plant-derived drugs was worth an estimated $18 billion in
2005. It is expected this figure to grow to nearly $19 billion in 2006 and more
than $26 billion by 2011, at an average annual growth rate (AAGR) of 6.6%
between 2006 and 2011.The U.S. accounts for 50% of the global plant-derived
drug market and is expected to grow faster than other markets at an AAGR of
7.5% per year vs. 5.3% .A total of 26 plant-based drugs were approved/launched
Introduction
4
during 2000–2006, which also include novel molecule-based drugs like
Galanthamine HBr (Reminyl1), Miglustat (Zavesca1) and Nitisinone (Orfadin1).
Despite the recent interest in molecular modeling, combinatorial chemistry, and
other synthetic chemistry techniques by pharmaceutical companies and funding
organizations, natural products, and particularly medicinal plants, remain an
important source of new drugs, new drug leads, and new chemical entities
(NCEs) (Newman et al., 2000, 2003; Butler, 2004). Nature has evolved over
time to produce a bewildering diversity of secondary metabolites. The large
proportion of natural products in drug discovery has stemmed from the diverse
structures and the intricate carbon skeletons of natural products. Natural products
interrogate a different area of chemical space than synthetic compounds. There
are significant differences in the molecular architecture produced by nature when
compared to the synthetic molecules of medicinal chemistry (Ganesan,
2004 ;Grabowski and Schneider 2007; Ortholand and Ganesan, 2004). Although
both aim to produce biologically active matter, biosynthesis operates under a
different set of constraints and guiding principles than the synthetic organic
chemist. In nature, a very parsimonious set of building blocks is utilized,
whereas we have access to tens of thousands of commercially available
chemicals. As a consequence, we achieve numbers by repeating a reliable
sequence of reactions over and over again while changing the input. Nature, on
the contrary, diversifies by taking its limited building blocks and partitioning
them into a multitude of pathways. Further differences occur in the type of
synthetic transformation performed. Nature is oxophilic, and has developed
Introduction
5
enzymes that exquisitely accomplish site-selective C–H activation (Chen and
White, 2007; Hartwig et al., 2005) to introduce oxygen and discriminate between
numerous functional groups at different oxidation levels.
Natural products offer large structural diversity (Clardy and Walsh, 2004), and
modern techniques for separation, structure elucidation, screening and
combinatorial synthesis (Corcoran and Spraul, 2003; Steinbeck, 2004; Ganesan,
2002) have led to revitalization of plant products as sources of new drugs. The
importance of plant based drugs, the introduction of herbals in the form of
nutraceuticals and dietary supplements are also changing the current trend
dominated by synthetic drugs to plant-based drug market (Cardellina, 2002;
Raskin, 2002). Hence, in the present study we were interested in natural products
research.
There are over 200 species of Strobilanthes nearly all in Asia and over 150
occurs in India, especially in Western Ghats and Nilgiris alone claims more than
thirty species. Many of the species flower at longer intervals such as between six
and twelve years, usually and in some even after 35 years. There exists a strong
chemotaxonomical relationship among the genus. The most common and best
known species Strobilanthes Kunthianus (kurinji), which has the flowering cycle
once in twelve years, has not been studied so far chemically and biologically.
Hence, we were interested to find out the phytoconstituents present in the plant
and subject its extracts for biological investigations.
Introduction
6
Free radicals are chemical species, which contains one or more unpaired
electrons due to which they are highly unstable and cause damage to other
molecules by extracting electrons from them in order to attain stability. Free
radicals may be involved in the etiology of ageing, inflammation, arthritis,
diabetes, cancer and cardiovascular diseases. Oxygen is the molecule of life for
aerobic creatures. Oxygen is not only fundamentally essential for energy
metabolism and respiration, but it has been implicated in many diseases and
degenerative conditions. Reactive oxygen species (ROS) formed in vivo, such as
superoxide anion, hydroxyl radical and hydrogen peroxide, are highly reactive
and potentially damaging transient chemical species. The ROS play an important
role in the pathogenesis of various serious diseases, such as neurodegenerative
disorders, cancer, cardiovascular diseases, atherosclerosis, cataracts, and
inflammation (Aruoma, 1998; Kris- Etherton et al., 2004). These are
continuously produced in the human body, as they are essential for energy
supply, detoxification, chemical signaling and immune function.
Mammalian cells possess elaborate defense mechanisms for radical
detoxification. Key metabolic steps are the superoxide dismutase (SOD)
catalysis of the dismutation of superoxide to hydrogen peroxide and oxygen, and
the conversion of H2O2 into water and oxygen by catalase (CAT) and glutathione
peroxidase (GPX), which destroys toxic peroxides. In addition to antioxidant
enzymes, several small-molecule antioxidants play important roles in the
antioxidant defense systems. These can be divided into compounds made in vivo,
and compounds obtained from diet. Glutathione, bilirubin, and melatonin are

Introduction
7
examples of the former, and vitamins such as α-tocopherol, β-carotene, and
ascorbic acid and micronutrient elements such as zinc and selenium are
examples of the latter (Halliwell and Gutteridge, 1998). Antioxidants are vital
substances which possess the ability to protect the body from damage caused by
free radical induced oxidative stress (Ozsoy et al., 2008). Many synthetic
antioxidants such as butylated hydroxyl anisole (BHA) and butylated hydroxyl
toluene (BHT) are very effective and are used for industrial processing but they
possess potential health risk and toxic properties to human health and should be
replaced with natural antioxidants.
Natural products now have received special attention as dietary supplements
because of their potent antioxidant activity. Most beneficial health effects are
attributed to their capacity to transfer electrons to free radicals, chelate metal
catalysts, activate enzyme system, reduce α-tocopherol radicals and have
capacity to inhibit LDL oxidation (Heim et al., 2002). Ascorbic acid, which is
very common in various plants, has ability to act as reducing agent. Vitamin C is
effective to some extent in maintaining levels of antioxidant in plasma and liver
and reduced glutathione when supplemented to alloxan induced diabetic rats
(Garg et al., 1997). As correlation of free radicals and various diseases is
obvious, demand for herbal antioxidant is on high. Many of the phytonutrients
produced by plant secondary metabolism are excellent antioxidants. Examples
are carotenoids as lutein, beta-carotene, lycopene, and zeaxanthin; flavonoids as
apigenin, catechin, gentisein, kaempferol, myricetin, quercetin and rutin;
phenolic compounds as caffeic acid, ellagic acid, ferulic acid, gallic acid, para-

Introduction
8
amino benzoic acid; triterpenoid saponins as ginsenosides glycyrrhizin;
diterpenes as ginkgolide A, ginkgolide B, and ginkgolide C, and sesquiterpene
bilobade. The leaves of S. crispus have been reported to possess potent
antioxidant activity (Ismail et al., 2000; Rahmat et al., 2006). However, so far no
antioxidant activity has been carried out for S. kunthianus. Hence, in the present
study we were interested to evaluate the extracts of the plant for their antioxidant
potentials.
Inflammation is the body’s response to infection, tissue injury or invasion by
microorganisms and its main purpose is to remove the cause (e.g., the invading
microorganism or the irritating agent) and promote the regeneration of the tissue
that was injured. There are many inflammatory mediators that participate in the
regulation of inflammatory response. They include vascular amines, metabolites
of arachidonic acid (prostaglandin, leukotriene and lipoxin), cytokines
(interlukin-1β, interlukin-6β and tumor necrosis factor-α), platelet activating
factor, neuropeptides and nitric oxide, all of which are released from cells. Also,
generating inflammatory mediators are complementary systems including the
kinin system, the clotting system and the fibrinolytic system.
Pain can be simply defined as undesirable physical or emotional experiences.
Pain is the most common reason that individuals seek medical attention. It can
be divided into two types, acute pain and chronic pain. Acute pain serves as a
warning system to remove oneself from particular pain stimuli. Chronic pain can
exist for undefined times and undefined reasons and seems to serve no clear
purpose.

Introduction
9
Drugs which are in use presently for the management of pain and inflammatory
conditions are either narcotics e.g. opioids or non-narcotics e.g. salicylates and
corticosteroids e.g. hydrocortisone. All of these drugs possess well known side
and toxic effects. Moreover, synthetic drugs are very expensive to develop and
whose cost of development ranges from 0.5 to 5 million dollars. On the contrary
many medicines of plant origin had been used since long time without any
adverse effects. It is well established that ROS play a prominent role in the
stimulation, propagation and maintenance of both acute and chronic
inflammatory processes as well as pain causing tissue damage (Ilavarasan et al.,
2006). These adverse effects due to pain and excessive inflammation has been
shown to be reduced by the use of suitable antioxidants either by preventing the
formation of oxygen free radicals or by scavenging them before they react with
sites such as unsaturated lipids in the cell membrane. The plant S. cusia
commonly known as banlangen reported to possess antipyretic, antiviral, anti-
inflammatory and antiinfluenza activities (Ho and Chang, 2002). The root
extracts of S. callosus were reported for anti-inflammatory activity. However, no
work has been carried out to evaluate the anti-inflammatory and analgesic
activities of S. kunthianus, though the genus has been reported for the treatment
of such disorders. Hence, in the present study, the potent antioxidant extracts
were tested for in vivo anti-inflammatory and analgesic studies.
Liver has a pivotal role in regulation of physiological processes. It is involved in
several vital functions such as metabolism, secretion and storage. Furthermore,

Introduction
10
detoxification of a variety of drugs and xenobiotics occurs in liver. The bile
secreted by the liver has, among other things, an important role in digestion.
Liver diseases are among the most serious ailment. They may be classified as
acute or chronic hepatitis (inflammatory liver diseases), hepatosis (non
inflammatory diseases) and cirrhosis (degenerative disorder resulting in fibrosis
of the liver).
Liver diseases are mainly caused by toxic chemicals (certain antibiotics,
chemotherapeutics, peroxidised oil, aflatoxin, carbon-tetrachloride, chlorinated
hydrocarbons, etc.), excess consumption of alcohol, infections and
autoimmune/disorder. Most of the hepatotoxic chemicals damage liver cells
mainly by inducing lipid peroxidation and other oxidative damages in liver
(Recknagel, 1983; Wendel et al., 1987; Dianzani et al., 1991; Hiroshi et al.,
1987). One among them is carbon tetrachloride (CCl4) (Kodavanti et al., 1989).
Reductive dehalogenation of CCl4 by the P450 enzyme system to the highly
reactive trichloromethyl radical initiates the process of lipid peroxidation which
is considered to be the most important mechanism in the pathogenesis of liver
damage induced by CCl4 (Demirdag et al., 2004). Trichloromethyl radical can
even react with sulfhydrylgroups of glutathione (GSH) and protein thiols. In
addition, CCl4 also alters the antioxidant profile of the liver including the
antioxidant enzymes like superoxide dismutase (SOD), catalase (CAT),
glutathione peroxidase (GPx), glutathione reductase (GR), and
glutathionetransferase (GST). Enhanced lipid peroxidation produced during the
liver microsomal metabolism of ethanol may result in hepatitis and cirrhosis
Introduction
11
(Smuckler, 1975). It has been estimated that about 90% of the acute hepatitis is
due to viruses. The major viral agents involved are Hepatitis B, A, C, D (delta
agents), E and G. Of these, Hepatitis B infection often results in chronic liver
diseases and cirrhosis of liver. Primary liver cancer has also been shown to be
produced by these viruses. It has been estimated that approximately 14-16
million people are infected with this virus in South east Asia region and about
6% of the total population in the region are carriers of this virus. A vaccine has
become available for immunization against Hepatitis B virus. Hepatitis C and
Hepatitis E infections are also common in countries of South East Asia region
(WHO, 1997).
In spite of the tremendous advances made in allopathic medicine, no effective
hepatoprotective medicine is available. Plant drugs are known to play a vital role
in the management of liver diseases. There are numerous plants and polyherbal
formulations claimed to have hepatoprotective activities. Nearly 150
phytoconsitituents from 101 plants have been aimed to possess liver protecting
activity (Doreswamy and Sharma, 1995). At the same time, surprisingly, we do
not have readily available satisfactory plant drugs/formulations to treat severe
liver disease.
The antioxidant activity or the inhibition of the generation of free radicals is
important in providing protection against hepatic damage. A number of plants
have been shown to possess the hepatoprotective activity by improving
antioxidant properties (Shahjahan et al., 2004). S. crispus has been used as

Introduction
12
antidiabetic, antilytic, laxative, anti AIDS, antileukemic and hepatitis (Sunarto,
1977; Kusumoto et al., 1992; Ismail et al., 2000; Jaksa et al., 2004; Yogespriya
et al., 2005). However, no work has been carried out to evaluate the
hepatoprotective effect of S. kunthianus, though the gene has been reported for
the treatment of hepatic disorders. Hence, in the present study we also aimed to
investigate the potent extract for in vivo hepatoprotective and antioxidant
activities.

Scope, Objective and Plan of work
13
Natural products, including plants, animals and minerals have been the basis of
treatment of human diseases. History of medicine dates back practically to the
existence of human civilization. The current accepted modern medicine or
allopathy has gradually developed over the years by scientific and observational
efforts of scientists. However, the basis of its development remains rooted in
traditional medicine and therapies. The history of medicine includes many
ludicrous therapies. Nevertheless, ancient wisdom has been the basis of modern
medicine and will remain as one important source of future medicine and
therapeutics. Pharmacognostical studies serve as an important tool in plant
identification. Detailed microscopic evaluation will be of immense importance in
the standardization of plant materials. Isolation of phytoconstituents from the
active extracts helps in many ways in plant research. These constituents can
serve as marker compounds for their standardization. The determination of the
biological activities helps in developing these compounds into drugs or lead
molecules for further drug development.
Species of Strobilanthes grow wild on the Nilgiri ranges between 6000 to 7000
feet. The genus Strobilanthes is known for its various biological activities
(Sunarto, 1977; Kusumoto et al., 1992; Ismail et al., 2000; Jaksa et al., 2004;
Rahmat et al., 2006; Nair et al., 1988). S. kunthianus (Neelakurinji) is a shrub in
the grasslands of Western Ghats in India. The Nilgiris, which literally means the
blue mountains got its name from the purplish blue flowers of Neelakurinji that
blossoms gregariously once in twelve years. Lupeol has been isolated from the
Scope, Objective and Plan of work
14
whole plant. Except this study, so far no phytochemical investigations were
carried out. Hence, in the present study the isolation of phytoconstituents from
S. kunthianus was aimed.
In a situation of oxidative stress, reactive oxygen species (ROS) such as
superoxide (O2•-, OOH•), hydroxyl (OH•) and peroxyl (ROO•) radicals are
generated. The ROS play an important role in the pathogenesis of various serious
diseases, such as neurodegenerative disorders, cancer, cardiovascular diseases,
atherosclerosis, cataracts, inflammation etc., Antioxidants are molecules which
can safely interact with free radicals and terminate the chain reaction before vital
molecules are damaged. Several synthetic antioxidants such as butylated
hydroxyl anisole (BHA), butylated hydroxy toluene (BHT), and tert-
butylhydroquinone (TBHQ) may be inappropriate for chronic human
consumption, because of their toxic properties for human health and
environment (Ito et al., 1986; Stich, 1991). The use of traditional medicine is
widespread and plants still represent a large source of natural antioxidants that
might serve as leads for the development of novel drugs. Hence, in the present
study in vitro antioxidant activity of the extracts were carried out. Several anti-
inflammatory and analgesics have recently been shown to have an antioxidant
and/or radical scavenging mechanism as part of their activity.
Liver is the most important organ concerned with the biochemical activities in
the human body. It has great capacity to detoxicate toxic substances and
synthesize useful principles. Therefore, damage to the liver inflicted by

Scope, Objective and Plan of work
15
hepatotoxic agents is of grave consequences. Hepatitis is one of the most
prevalent diseases in the world and drug related hepatotoxicity is the leading
cause of acute liver failure among patients referred for liver transplantation.
Despite the fact that hepatic problems are responsible for a significant number of
liver transplantations and deaths recorded worldwide, available
pharmacotherapeutic options for liver diseases are very limited and there is a
great demand for the development of new effective drugs. Therefore, herbal
products and traditional medicines with better effectiveness and safe profiles are
needed as a substitute for chemical therapeutics.
The plant S. cusia commonly known as banlangen reported to possess
antipyretic, antiviral, anti-inflammatory and antiinfluenza activities (Ho and
Chang, 2002). S. Crispus has been used as antidiabetic, antilytic, laxative, anti
AIDS, antileukemic and hepatitis (Sunarto, 1977; Kusumoto et al., 1992; Ismail
et al., 2000; Jaksa et al., 2004; Yogespiriya et al., 2005). The root extracts of
S. callosus were reported for anti-inflammatory activity. Hence, in the present
study, potent extracts of S. kunthianus was screened for in vivo anti-
inflammatory, analgesic, hepatoprotective and antioxidant activities.
OBJECTIVES OF THE WORK
• To select a plant based on their chemotaxonomy and ethnomedical uses.
• Collection and extraction.
• Evaluation of macroscopy, microscopical characters and
physicochemical constants of the selected plant.

Scope, Objective and Plan of work
16
• To isolate phytoconstituents from the extracts and their characterization
by spectral methods.
• To screen the extracts for cytotoxic activity by using in vitro methods.
• To screen the extracts for antioxidant activity by using various in vitro
methods.
• To screen the potent extracts for their in vivo antioxidant, analgesic, anti
inflammatory and hepatoprotective activities.
PLAN OF THE WORK
Phase-I: Pharmacognostical studies
• Collection, processing and authentication of S. Kunthianus
• Macroscopical study
• Microscopical study
• Physicochemical constants
Phase-II: Phytochemical studies of the extracts
• Preparation of extracts
• Qualitative phytochemical analysis
• Estimation of total phenol content
Phase-III: Isolation and characterization of phytoconstituents
• Column chromatography
• Spectral study: UV, 1H NMR, 13C NMR, EIMS and ESIMS.

Scope, Objective and Plan of work
17
Phase-IV: In vitro antioxidant activity
• DPPH radical scavenging method
• Nitric oxide radical inhibition assay
• Scavenging of ABTS radical cation assay
• Hydrogen peroxide scavenging method
• Hydroxyl radical scavenging by p-NDA and deoxyribose methods
• Total antioxidant capacity by phosphomolybdenum method.
Phase-V: In vitro cytotoxicity studies
• Microculture tetrazolium (MTT) assay
• Sulphorhodamine B (SRB) assay.
Phase-VI: Pharmacological screening of the active extracts of S. kunthianus
• Acute toxicity studies.
• Acute anti-inflammatory studies of crude methanol extracts by using
carrageenan, formalin and histamine induced rat paw edema methods.
• Chronic anti-inflammatory studies of potent extract by using cotton pellet
method.
• Analgesic activity of crude methanol extracts by hot plate and tail
immersion methods.
• In vivo hepatoprotective and antioxidant activities of potent extract.

Plant Profile and Literature Review
18
Strobilanthes Kunthianus Botanical name : Strobilanthes Kunthianus Nees T Anders Family : Acanthaceae Synonyms : Phlebophyllum Kunthianus Strobilanthes Kunthiana Strobilanthes Nilgirianthsis Phlebophyllum Kunthianus Vernacular Names : Tamil – Neelakurinji, kurinji Distribution : It is found in Western Ghats, The Nilgiris
and the Palnis, and the hills of Kerala above
1800 m on grassy downs.
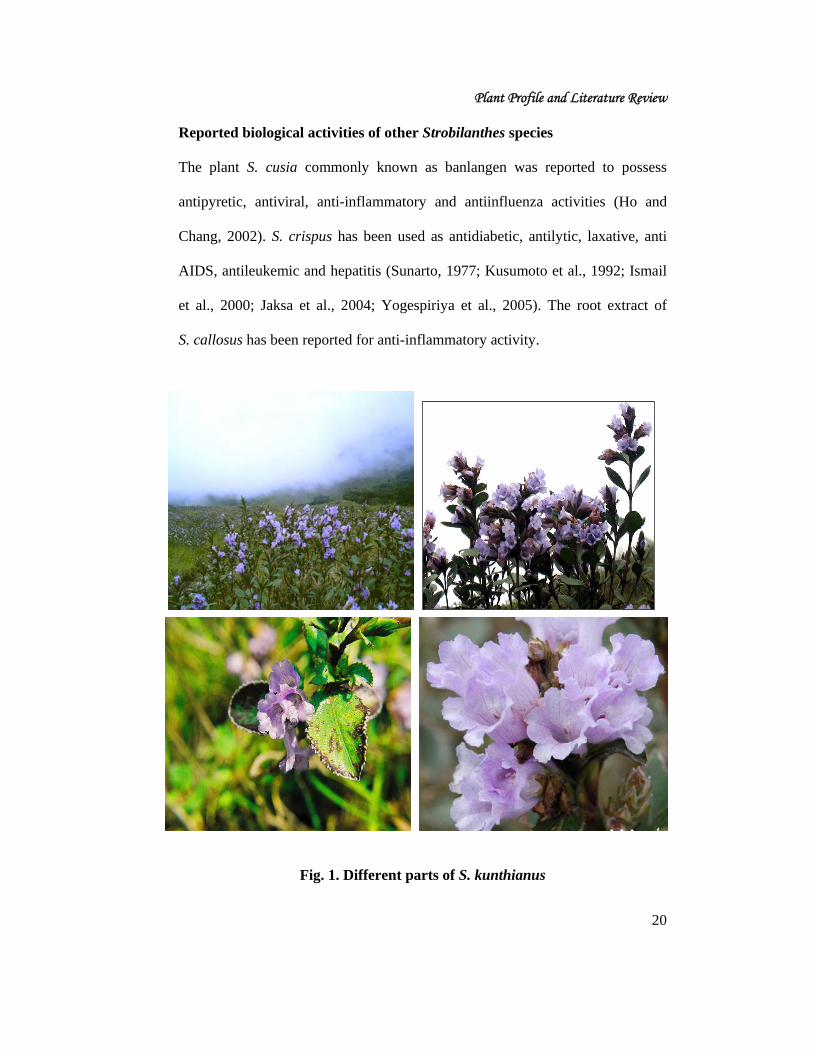
Description : Bushy shrub, 1- 2 m high, in stray clumps or gregarious; stems
numerous, erect, quadrangular; nodes prominent. Leaves elliptic-ovate, ca 5 x
2.5 cm, acute at base, crenate-serrate at margin, acute at apex, coriaceous,
scabrid above, white-villous between veins beneath; secondary veins 8 or 9
pairs, prominent; petioles ca 5 mm long. Inflorescences spikes, uninterrupted,
sometimes branched, ca 8 cm long, supported by leafy bracts, white-villous;
bracts elliptic-ovate, ca 1.2 cm long, acute at apex, white villous, floccose at
margin and middle. Calyx ca 1.2 cm long, floccose-villous; segments linear-
lanceolate, connate almost half way from base. Corolla tubular ventricose
portion gradually expanding from base, hairy inside; lobes 5, orbicular, entire.
Stamens 2, included, monodelphouus; filaments ca 7 mm long, pilose; stamina
Plant Profile and Literature Review
19
sheath extending just above cylinder base. Ovary glabrous but hairy at tip; style
ca 1.5 cm long, included, hairy. Capsules oblong, ca 1.2 cm long, 4-seedded;
seeds orbitular; ca 1.5 mm, complanate, densely hairy and hairs spreading when
wet except on basal circular areole (Venu, 2006).
Parts used : Root, stem, leaves and flowers Ethnomedical information : No ethnomedical information available.
Chemical constituents and biological properties : Lupeol has been isolated from the whole plant. No biological activities are reported.
Other Strobilanthes species
S. crispus, S. callosus, S. ixocephala, S. auriculatus, S. discolor,
S. cusia, S. cuspidatus, S. foliosus, S. consanguineus, S. gossypinus, S.
pulneyensis, S. perrottetianus, S. papillous, S. neilgherrensis, S. wightianus, S.
urceolaris, S. sessilis, S. asper, S. zenkerianus, S. mincranthus, S. luridus, S.
homotropus, S. violaceus and S. amabilis (Fyson, 1977; Anonymous, 1989).
Reported chemical constituents from other Strobilanthes species
Lupeol was isolated from S. callosus and S. ixiocephala (Agarwal and
Rangari, 2003). Trypanthrin, indigo and indirubin were found in S. cusia
(Liau et al., 2007). Caffeic acid, p-hydroxy benzoic acid, p-voumeric acid,
vanilic acid, gentinic acid, ferulic acid, syryngic acid, β-sitosterol and
stigmasterol were isolated from S. crispus (Rahmat et al., 2006; Soediro et al.,
1983; 1987).
Plant Profile and Literature Review
20
Reported biological activities of other Strobilanthes species
The plant S. cusia commonly known as banlangen was reported to possess
antipyretic, antiviral, anti-inflammatory and antiinfluenza activities (Ho and
Chang, 2002). S. crispus has been used as antidiabetic, antilytic, laxative, anti
AIDS, antileukemic and hepatitis (Sunarto, 1977; Kusumoto et al., 1992; Ismail
et al., 2000; Jaksa et al., 2004; Yogespiriya et al., 2005). The root extract of
S. callosus has been reported for anti-inflammatory activity.
Fig. 1. Different parts of S. kunthianus

Materials and methods
21
4.1. INSTRUMENTS
Autoanalyser:
Merck Microlab 200, manufactured by M/s Vital Scientific N. V.,
Darmslandt, The Netherlands.
Centrifuge:
Remi centrifuge and R-8c Laboratory centrifuge, Remi Motors Ltd.,
Mumbai, India
Elisa Reader:
Bio-Rad Laboratories Inc, California, USA, model 550.
Fourier Transform Infrared:
1600 Series FT-IR, Perkin Elmer (India) Pvt. Ltd., India.
Homogenizer:
Elvenjan homogenizer, Remi Motors Ltd., Mumbai.
Melting Point Apparatus:
Lab India, Mumbai.
NMR:
DDR X – 500 MHz – Bruker Daltonics, Karsruhe, Germany.
Rotary Evaporator:
Rotavapor R-205, Buchi Laboratory Equipments, Flawil, Switzerland.
Rotary Microtome:
Leica RM 2135, Leica Microsystem GmbH, Nussloch, Germany.
Spectrophotometer:
Shimadzu 160-A UV-VIS, Koyoto, Japan.
Materials and methods
22
4.2. CHEMICALS
2,2′-Diphenyl-1-picryl hydrazyl (DPPH), 2,2′-Azino-bis (3-ethylbenzo-
thiazoline-6-sulfonic acid) diammonium salt (ABTS), 3-(4, 5–Dimethyl thiazol–
2–yl)–5–diphenyl tetrazolium bromide (MTT), Sulphorhodamine B (SRB) were
obtained from Sigma Aldrich Co, St Louis, USA. p–Nitroso dimethyl aniline (p–
NDA) and Rutin were obtained from Acros Organics, New Jersy, USA.
Naphthyl ethylene diamine dihydrochloride (NEDD) was obtained from Roch–
Light Ltd., Suffolk, UK. Ascorbic acid and Butylated hydroxy anisole (BHA)
were obtained from S.D. Fine Chem, Ltd., Biosar, India. Sulphanilic acid, 2-
Deoxy-D-ribose, Minimal essential medium (MEM) and minimal essential
medium without phenol red (MEM-PR) were procured from Hi-media
Laboratories Ltd., Mumbai. Gallic acid, Thiobarbituric acid, Trichloroacetic
acid, Ethylenediaminetetra aceticacid (EDTA) and Adrenaline were procured
from Loba Chemie Indo Austrand Co., Mumbai. Aspartate aminotransferase
(ASAT), Alanine aminotransaminase (ALAT) and Alkaline phosphatase (ALP)
diagnostic kits were obtained from Span Diagnostic Ltd., Surat, India.
Aluminium backed high performance thin layer chromatography (HPTLC)
plates coated with 0.2 mm layers of silica gel 60 F254 plates and other diagnostic
kits were obtained from E–Merck Ltd., Mumbai. Silymarin was obtained from
Ranbaxy India Ltd, New Delhi. Ibuprofen was procured from Overseas Pharma,
Bangalore. Commercial animal feed was purchased from Sai Durga Feeds and
Food, Bangalore. All chemicals used were of analytical grade.

Materials and methods
23
4.3. COLLECTION AND EXTRACTION
4.3.1. Collection and authentication
The whole plant of S. kunthianus was collected from Thalaikuntha region, near
Ootacamund, Nilgiris district, Tamilnadu, India. The plant was identified and
authenticated at Botanical Survey of India, Coimbatore.
4.4. PHARMACOGNOSTICAL EVALUATION
4.4.1. Anatomical studies
The different organs viz., root, stem, leaf and flowers of S. kunthianus were cut
and removed from fresh healthy plants and fixed in FAA (formalin-5 ml + acetic
acid-5 ml + 70% ethanol-90 ml). After 24 h of fixing, the specimens were
dehydrated with graded series of tertiary-butyl alcohol as per the schedule (Sass,
1940). Infiltration of the specimens were carried out by gradual addition of
paraffin wax (m.p. 58-60 oC) until TBA solution attained super saturation. The
specimens were cast into paraffin blocks.
4.4.2. Sectioning
The paraffin embedded specimens were sectioned with the help of Rotary
microtome. The thickness of the sections was 10-12 μm. Dewaxing of the
sections was done by customary procedure (Johansen, 1940). The sections were
stained with toluidine blue (O’Brien et al, 1964). Since toluidine blue is a
polychromatic stain, the staining results were remarkably good and some
cytochemical reactions were also obtained. The dye rendered pink color to the
Materials and methods
24
cellulose walls, blue to the lignified cells, dark green to suberin, violet to the
mucilage, blue to the protein bodies etc., wherever necessary sections were also
stained with safranin, fast green and IKI (for starch).
For studying the stomatal morphology, venation pattern and trichome
distribution, paradermal sections (section taken parallel to the surface of leaf) as
well as clearing of leaf with 5% sodium hydroxide or epidermal peeling by
partial maceration employing Jeffrey’s maceration fluid were prepared (Sass,
1940). Glycerin mounted temporary preparations were made for
macerated/cleared materials. Powdered materials of different parts were cleared
with sodium hydroxide and mounted in glycerin medium after staining. Different
cell components were studied and measured.
4.4.3. Photomicrographs
Microscopic descriptions of tissues are supplemented with micrographs
wherever necessary. Photographs of different magnifications were taken with
Nickon labphoto 2 microscopic units. For normal observations bright field was
used. For the study of crystals, starch grains lignified cells, and polarized light
was employed. Since these structures have birefringent property, under polarized
light they appear bright against dark back ground. Magnifications of the figures
are indicated by the scale-bars. Descriptive terms of the anatomical features are
as given in the standard anatomy textbooks (Easu, 1964 and1979).

Materials and methods
25
4.5. EXTRACTION
4.5.1. Pre-extraction
The whole plant was washed thoroughly with water and separated into different
parts viz stem, leaves, flowers and roots. These were shade dried and powdered
separately using a mechanical blender before extraction.
4.5.2. Successive extraction
The powdered root and stem of S. kunthianus (500 g) were extracted
successively with 2.5 l each of petroleum ether, chloroform, ethyl acetate and
methanol in a Soxhlet apparatus separately for 18-20 h. The extracts were
concentrated in a rotary evaporator under reduced pressure at 35-40 oC and
stored at 4 oC in a refrigerator till further use.
4.5.3. Cold maceration
The powdered leaves and flowers (250 g) were extracted with 1.5 l of methanol
by cold maceration separately by agitation for 7 days and filtered. The mass was
squeezed out and again subjected for remaceration for 7 days and filtered off.
The combined filtrate was concentrated as above.
4.5.4. Crude extraction
The powdered root, stem, leaves and flowers of S. kunthianus (500 g) were
extracted separately with 2.5 l of methanol in a Soxhlet apparatus for 18-20 h.
The extracts were concentrated as above.

Materials and methods
26
4.6. PHYTOCHEMICAL SCREENING
A systematic and complete study of crude drugs should include a complete
investigation of both primary and secondary metabolites derived from plant
metabolism. The different qualitative chemical tests are to be performed for
establishing profiles of given extracts for their nature of chemical composition.
All the extracts obtained as above were tested for the following qualitative
chemical tests for the identification of various phytoconstituents (Harborne,
1984 ; Kokate, 1997).
Tests for carbohydrates:
Molisch’s test, Fehling’s test, Benedict’s test and Barfoed’s test.
Tests for alkaloids:
Mayer’s test, Dragendorff’s test, Wagner’s test and Hager’s test.
Tests for steroids and sterols:
Libermann Burchard’s test and Salkowski test.
Tests for glycosides:
Legal’s test, Baljet’s test, Borntrager’s test and Keller-Kiliani test.
Tests for saponins:
Foam test and hemolysis test.
Test for flavonoids:
Shinoda test.
Tests for tannins:
Lead acetate test and gelatin test.
Test for triterpenoids:
Tin and thionyl chloride test.
Tests for proteins and amino acids:
Biuret test, Ninhydrin test and Xanthoproteic test.

Materials and methods
27
4.7. ESTIMATION OF TOTAL PHENOL CONTENT
Total phenol content of the extracts was determined by using Folin-Ciocalteau
method (Spanos and Wrolstad, 1990). This test is based on the oxidation of
phenolic groups with phosphomolybdic and phosphotungstic acids. After
oxidation, the green blue complex formed was measured at 750 nm.
4.7.1. Chemicals and Reagents
Commercially available Folin-Ciocalteu reagent was diluted (1:10) with distilled
water and used. 20.25 g of sodium carbonate was dissolved in 100 ml of distilled
water and used (0.7 M).
4.7.2. Preparation of test and standard solutions
The plant extracts (50 mg each) were dissolved separately in 50 ml of methanol.
These solutions were serially diluted with methanol to obtain lower dilutions.
Gallic acid monohydrate (50 mg) was dissolved in 50 ml of distilled water. It
was serially diluted with water to obtain lower dilutions.
4.7.3. Procedure
In a test tube, 200 μl of the extract (1 mg/ml to 0.1 mg/ml) was mixed with 1 ml
of Folin-Ciocalteu reagent and 800 μl of sodium carbonate. After shaking, it was
kept for 2 h for reaction. The absorbance was measured at 750 nm. Using gallic
acid monohydrate, standard curve was prepared and linearity was obtained in the
range of 10-50 μg/ml. Using the standard curve, the total phenol content of the
extract was determined and expressed as gallic acid equivalent in mg/g of the
extract.

Materials and methods
28
4.8. ISOLATION AND CHARACTERIZATION OF PHYTOCONSTITUENTS
Isolation is a part of natural product chemistry, through which it is possible to
separate components. The biologically active ones can be incorporated as
ingredients in the modern system of medicine. The column chromatographic
technique (adsorption chromatography) is widely used for the separation,
isolation and purification of the natural products. The principle involved in this
is the adsorption towards the adsorbent packed in the column. By changing the
polarity of the mobile phase, the separation can be achieved by column
chromatography. Characterization of the isolated compounds can be carried out
by different analytical techniques like UV, IR, NMR and Mass spectroscopy
(MS).
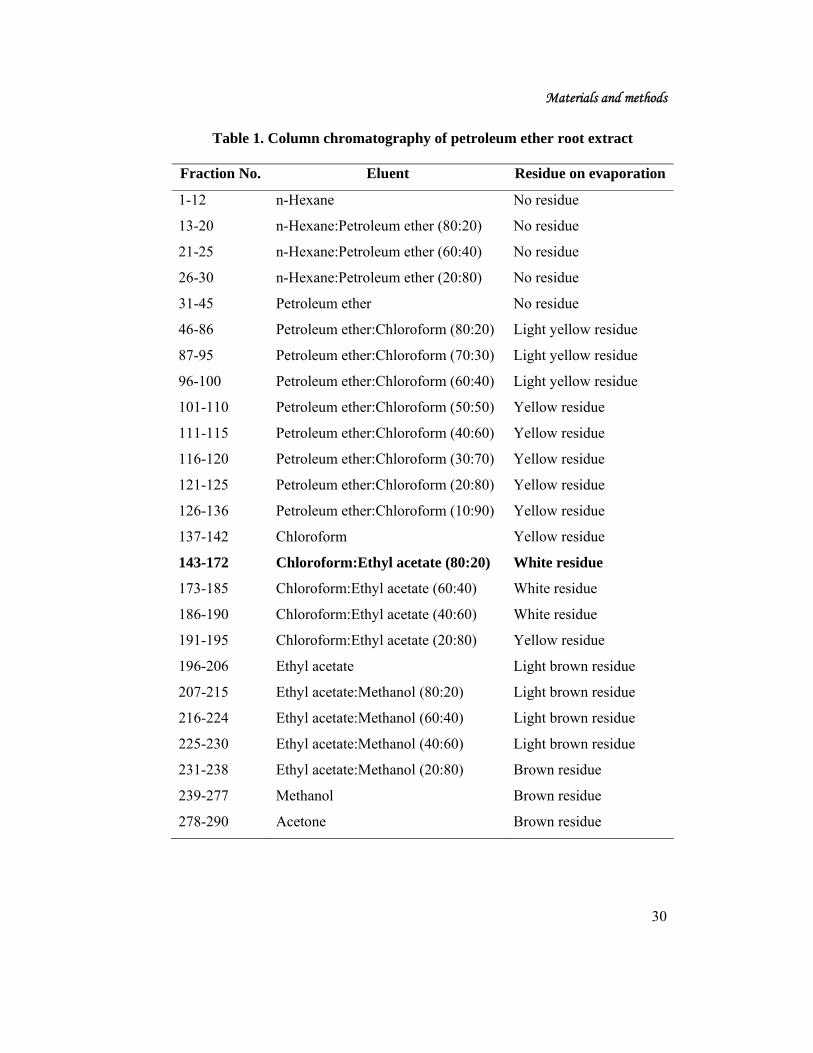
4.8.1. Column chromatography of petroleum ether root extract
The petroleum ether root extract (6 g) was chromatographed over silica gel
60-120 mesh of column length 60 cm and diameter 3 cm. Elution was carried out
with solvents and solvent mixtures of increasing polarities. The fractions were
collected in 25 ml portions and monitored on TLC and the fractions showing
similar spots were combined (Table 1). The fractions 143-172 eluted with
chloroform:ethyl acetate (80:20) gave a white precipitate which showed two
major spots on TLC. Hence, it was subjected for recolumn chromatography to
isolate the two compounds. The remaining fractions were not worked out
because of lower yields.

Materials and methods
29
4.8.1.1. Recolumn chromatography of fractions 143-172
The white precipitate (3.2 g) obtained from fractions 143-172 was further
chromatographed over silica gel 100-200 mesh of column length 50 cm and
diameter 3 cm. Elution was carried out with solvents and solvent mixtures of
increasing polarities. The fractions were collected in 10 ml portions and
monitored on TLC (Table 2). The fractions 25–48 eluted with petroleum ether:
acetone (90:10) gave a white residue and showed single spot with tailing.
Repeated recrystallisation in methanol yielded colorless needle shaped crystals
which showed a single spot on TLC with petroleum ether: acetone
(85:15). TLC studies were carried out in different solvent systems to prove the
homogeneity (Table 10). It was designated as compound 1 (GS1, yield 1.4 g,
23.33%). The next fraction 49-56 which gave colourless white residue was
washed several times with petroleum ether and on recrystallisation in chloroform
yielded a colorless compound and its homogeneity was confirmed by TLC
studies, designated as compound 2 (GS2, yield 0.31 g, 5.17%). Compounds 1
and 2 were subjected to physical and spectral studies for confirming their purity
and characterization. The remaining fractions were not worked out because of
lower yields.
Materials and methods
30
Table 1. Column chromatography of petroleum ether root extract
Fraction No. Eluent Residue on evaporation
1-12
13-20
21-25
26-30
31-45
46-86
87-95
96-100
101-110
111-115
116-120
121-125
126-136
137-142
143-172
173-185
186-190
191-195
196-206
207-215
216-224
225-230
231-238
239-277
278-290
n-Hexane
n-Hexane:Petroleum ether (80:20)
n-Hexane:Petroleum ether (60:40)
n-Hexane:Petroleum ether (20:80)
Petroleum ether
Petroleum ether:Chloroform (80:20)
Petroleum ether:Chloroform (70:30)
Petroleum ether:Chloroform (60:40)
Petroleum ether:Chloroform (50:50)
Petroleum ether:Chloroform (40:60)
Petroleum ether:Chloroform (30:70)
Petroleum ether:Chloroform (20:80)
Petroleum ether:Chloroform (10:90)
Chloroform
Chloroform:Ethyl acetate (80:20)
Chloroform:Ethyl acetate (60:40)
Chloroform:Ethyl acetate (40:60)
Chloroform:Ethyl acetate (20:80)
Ethyl acetate
Ethyl acetate:Methanol (80:20)
Ethyl acetate:Methanol (60:40)
Ethyl acetate:Methanol (40:60)
Ethyl acetate:Methanol (20:80)
Methanol
Acetone
No residue
No residue
No residue
No residue
No residue
Light yellow residue
Light yellow residue
Light yellow residue
Yellow residue
Yellow residue
Yellow residue
Yellow residue
Yellow residue
Yellow residue
White residue
White residue
White residue
Yellow residue
Light brown residue
Light brown residue
Light brown residue
Light brown residue
Brown residue
Brown residue
Brown residue

Materials and methods
31
Table 2. Recolumn chromatography of fractions 143-172
Fraction No. Eluent Residue on evaporation
1-5
6-12
13-18
19-24
25-48
49-56
57-60
61-65
66-71
72-75
76-80
81-85
86-90
Petroleum ether
Petroleum ether: Acetone (98:2)
Petroleum ether: Acetone (96:4)
Petroleum ether: Acetone (92:8)
Petroleum ether: Acetone (90:10)
Petroleum ether: Acetone (88:12)
Petroleum ether: Acetone (86:14)
Petroleum ether: Acetone (84:16)
Petroleum ether: Acetone (82:18)
Petroleum ether: Acetone (80:20)
Petroleum ether: Acetone (60:40)
Petroleum ether: Acetone (20:80)
Acetone
No residue
No residue
No residue
No residue
White residue
White residue
White residue
White residue
White residue
Brown residue
Brown residue
Brown residue
No residue
4.8.2. Column chromatography of petroleum ether stem extract
The petroleum ether stem extract (5.6 g) was chromatographed over silica gel
100-200 mesh of column length 100 cm and diameter 1.2 cm. Elution was
carried out with solvents and solvent mixtures of increasing polarities. The
fractions were collected in 50 ml portions and monitored on TLC and the
fractions showing similar spots were combined (Table 3). The fractions 46-64,
on elution with chloroform: ethyl acetate (60:40) yielded a yellow residue (2.1 g)

Materials and methods
32
which showed on TLC single spot with tailing. On repeated recrystallisation
with methanol it gave a colorless needle shaped crystalline compound and its
homogeneity was proved by TLC studies and designated as compound 3 (PES 1,
yield 0.9 g, 16.07%). This compound was subjected to physical and spectral
studies for confirming the purity and characterization. The remaining fractions
were not worked out because of lesser yields.
Table 3. Column chromatography of petroleum ether stem extract
Fraction No. Eluent Residue on evaporation
1-4
5-10
11-20
21-26
27-31
32-38
39-42
43-45
46-64
65-71
72-75
76-79
80-81
82-88
89-92
93-104
n-Hexane
n-Hexane:Petroleum ether (50:50)
Petroleum ether
Petroleum ether:Chloroform (80:20)
Petroleum ether:Chloroform (60:40)
Petroleum ether:Chloroform (20:80)
Chloroform
Chloroform:Ethyl acetate (80:20)
Chloroform:Ethyl acetate (60:40)
Chloroform:Ethyl acetate (40:60)
Chloroform:Ethyl acetate (20:80)
Ethyl acetate
Ethyl acetate:Methanol (80:20)
Ethyl acetate:Methanol (60:40)
Ethyl acetate:Methanol (20:80)
Methanol
No residue
No residue
No residue
Colourless residue
Colourless residue
Light yellow residue
Light yellow residue
Yellow residue
Yellow residue
Light brown residue
Light brown residue
Light brown residue
Brown residue
Brown residue
Brown residue
Brown residue

Materials and methods
33
4.8.3. Column chromatography of chloroform stem extract
The chloroform stem extract (2.5 g) was chromatographed over silica gel 100-
200 mesh of column length 100 cm and diameter 1.2 cm. Elution was carried out
with solvents and solvent mixtures of increasing polarities. The fractions were
collected in 25 ml portions and monitored on TLC and the fractions showing
similar spots were combined (Table 4). The fractions 25-55 eluted with
petroleum ether: chloroform (80:20) gave a light green residue. On repeated
washing with acetone, it yielded a colourless residue. The colourless residue was
dissolved in minimum quantity of chloroform and filtered off. The filtrate on
evaporation yielded a white semisolid compound, which on repeated washing
with acetone and recrystallisation with chloroform yielded a colorless residue
and its homogeneity was confirmed with various solvent systems by TLC and
designated as compound 4 (SC 1, yield 0.016 g, 0.64%). This compound was
subjected to physical and spectral studies for confirming the purity and
characterization. The remaining fractions were not worked out because of lesser
yields.

Materials and methods
34
Table 4. Column chromatography of chloroform stem extract
Fraction
No. Eluent Residue on evaporation
1-24
25-55
56-66
67-87
88-90
91-95
96-101
102-110
111-119
120-126
127-147
148-151
152-158
159-165
166-180
181-185
186-195
Petroleum ether
Petroleum ether:Chloroform (80:20)
Petroleum ether:Chloroform (60:40)
Petroleum ether:Chloroform (40:20)
Petroleum ether:Chloroform (20:80)
Chloroform
Chloroform:Ethyl acetate (80:20)
Chloroform:Ethyl acetate (60:40)
Chloroform:Ethyl acetate (40:60)
Chloroform:Ethyl acetate (20:80)
Ethyl acetate
Ethyl acetate:Methanol (80:20)
Ethyl acetate:Methanol (60:40)
Ethyl acetate:Methanol (40:60)
Ethyl acetate:Methanol (20:80)
Methanol
Acetone
Colourless sticky residue
Light green residue
Yellow residue
Dark yellow residue
No residue
Green residue
Green residue
Green residue
Light green residue
No residue
Dark green residue
Light yellow residue
Yellow sticky residue
No residue
Light yellow residue
yellow residue
No residue

Materials and methods
35
4.8.4. Column chromatography of macerated methanol flower extract
The macerated methanol flower extract (6 g) was chromatographed over silica
gel 60-120 mesh of column length 50 cm and diameter 3 cm. Elution was carried
out with solvents and solvent mixtures of increasing polarities. The fractions
were collected in 50 ml portions and monitored on TLC and the fractions
showing similar spots were combined (Table 5). The fractions 59-76 eluted with
chloroform: ethyl acetate (60:40) gave a yellow residue and showed one major
spot along with other minor impurities on TLC. Repeated recrystallisation with
chloroform: methanol (90:10) gave a colorless compound. The colorless
compound showed a single spot in petroleuem ether: ethyl acetate (88:12) and
was further proved for its homogeneity with different solvent systems by TLC
and designated as compound 5 (GSMES3, yield 0.015 g, 0.25%).
The fractions 89-95 eluted with ethyl acetate gave a brown residue. On washing
with acetone, followed by methanol washing it gave a white crystalline
compound. The white crystalline compound which showed a single spot with
TLC by using different solvent systems was designated as compound 6 (G1,
yield 0.012 g, 0.20%). These compounds were subjected to physical and spectral
studies for confirming their purity and characterization. The remaining fractions
were not worked out because of lesser yields.

Materials and methods
36
Table 5. Column chromatography of macerated methanol flower extract
Fraction No. Eluent Residue on evaporation
1-5
6-10
11-16
17-20
21-42
43-58
59-76
77-88
89-95
96-115
116-121
122-128
129-149
150-161
Petroleum ether
Petroleum ether:Chloroform (80:20)
Petroleum ether:Chloroform (60:40)
Petroleum ether:Chloroform (20:80)
Chloroform
Chloroform:Ethyl acetate (80:20)
Chloroform:Ethyl acetate (60:40)
Chloroform:Ethyl acetate (20:80)
Ethyl acetate
Ethyl acetate:Methanol (80:20)
Ethyl acetate:Methanol (60:40)
Ethyl acetate:Methanol (20:80)
Methanol
Acetone
No residue
No residue
No residue
Light yellow residue
Light yellow residue
Yellow residue
Yellow residue
Colourless residue
Light brown residue
Reddish brown residue
Reddish brown residue
Reddish brown residue
Dark brown residue
No residue
4.8.5. Column chromatography of crude methanol flower extract
The crude methanol flower extract (50 g) was chromatographed over silica gel
60-120 mesh of column length 60 cm and diameter 10 cm. Elution was carried
out with solvents and solvent mixtures of increasing polarities. The fractions
were collected in 100 ml portions and monitored on TLC and the fractions
showing similar spots were combined (Table 6).

Materials and methods
37
The fractions 11-30 eluted with petroleum ether: chloroform (50:50) gave a
colorless residue which on purification with acetone gave a fluffy white
precipitate and its homogeneity was checked by TLC in n-hexane: ethyl acetate
(65:35) and was further confirmed with different solvent systems by TLC. It was
designated as compound 7 (CMF1, yield 0.012 g, 0.02%).
The fractions 31-50 eluted in chloroform were mixed together, evaporated to a
minimal volume and then added acetone. White amorphous sticky residue was
obtained. Repeated washing with acetone and recrystallisation with chloroform
yielded a colorless precipitate, showed a single spot on TLC in n-hexane: ethyl
acetate (50:20) and it was designated as compound 8 (CMF 2, yield 0.01 g,
0.02%).
The fractions 148-189 eluted with ethyl acetate: methanol (60:40) gave a sticky
brown residue. This was washed several times with methanol and repeatedly
recrystallized with water. A reddish brown compound was obtained. Its
homogeneity was checked with chloroform: methanol: water (8:2:0.1) and
designated as compound 9 (CMF 5, yield 0.025 g, 0.05%). These compounds
were subjected to physical and spectral studies for confirming their purity and
characterization. The remaining fractions were not worked out because of lesser
yields and mixtures of compounds.

Materials and methods
38
Table 6. Column chromatography of crude methanol flower extract
Fraction No. Eluent Residue on evaporation
1-10
11-30
31-50
51-60
61-70
71-80
81-100
101-115
116-122
123-128
129-135
136-147
148-189
190-199
200-220
221-230
231-250
251-310
Petroleum ether
Petroleum ether:Chloroform (50:50)
Chloroform
Chloroform:Ethyl acetate (90:10)
Chloroform:Ethyl acetate (80:20)
Chloroform:Ethyl acetate (70:30)
Chloroform:Ethyl acetate (60:40)
Chloroform:Ethyl acetate (20:80)
Ethyl acetate
Ethyl acetate:Methanol (90:10)
Ethyl acetate:Methanol (80:20)
Ethyl acetate:Methanol (70:30)
Ethyl acetate:Methanol (60:40)
Ethyl acetate:Methanol (50:50)
Ethyl acetate:Methanol (40:60)
Ethyl acetate:Methanol (20:80)
Methanol
Acetone
No residue
Colourless residue
Colourless residue
Light yellow residue
Yellow residue
Yellow residue
Yellow residue
Yellow residue
Yellow residue
Brown residue
Brown residue
Brown residue
Brown residue
Dark brown residue
Dark brown residue
Dark brown residue
Dark brown residue
Dark brown residue
4.8.6. Isolation by solvent-solvent extraction
The macerated methanol leaves extract (7 g) was fractionated with petroleum
ether (500 ml). The petroleum ether layer was separated and evaporated. A
colourless semisolid residue was obtained which on repeated washing with
acetone and recrystallization with chloroform gave a colourless precipitate. Its
homogeneity was checked with various solvent systems by TLC and designated
as compound 10 (ML 1, yield 0.01 g, 0.14%). This compound was subjected to
physical and spectral studies for confirming its purity and characterization.

Materials and methods
39
4.9. IN VITRO ANTIOXIDANT ACTIVITY
The in vitro methods for antioxidant activity are based on inhibition of free
radicals. Samples were added to a free radical-generating system and inhibition
of the free radical action was measured. This inhibition is related to antioxidant
activity of the sample. Methods vary greatly as to the generated radical, the
reproducibility of the generation process and the end point that is used for the
determination.
Even though in vitro methods provide a useful indication of antioxidant
activities, data obtained from in vitro methods are difficult to apply to biological
systems and do not necessarily predict a similar in vivo antioxidant activity. All
the methods developed have strengths and limitations and hence a single
measurement of antioxidant capacity usually is not sufficient. A number of
different methods may be necessary to adequately assess in vitro antioxidant
activity of a specific compound or antioxidant capacity of a biological fluid.
In the present study, all the extracts were therefore, tested for their in vitro
antioxidant activity using several standard methods. The absorbance was
measured spectrophotometrically against the corresponding blank solution. The
percentage inhibition was calculated by using the formula,
Percentage inhibition = 100controlOD
sample OD - control OD X
IC50, values, the concentration of the samples required to scavenge 50% of free
radicals, were calculated.

Materials and methods
40
4.9.1. DPPH assay
The DPPH free radical is reduced to a corresponding hydrazine when it reacts
with hydrogen donors. The DPPH radical is purple in colour and upon reaction
with an hydrogen donor changes to yellow in colour. It is a discoloration assay,
which is evaluated by the addition of the antioxidant to a DPPH solution in
ethanol or methanol and the decrease in absorbance is measured at 490 nm.
4.9.1.1. Reagents
4.9.1.1.1. DPPH solution (100 μM)
Accurately 22 mg of DPPH was weighed and dissolved in 100 ml of methanol.
From this stock solution, 18 ml was diluted to 100 ml with methanol to obtain
100 μM DPPH solution.
4.9.1.1.2. Preparation of extract solutions
Accurately 21 mg of each of the extracts were weighed and dissolved in 1 ml of
freshly distilled DMSO separately to obtain solutions of 21 mg/ml concentration.
These solutions were serially diluted separately to obtain lower concentrations.
NO2
NO2
O2N N
N
..
Ph
Ph
+ R- OH
NO2
NO2
O2N N
N Ph
Ph
H
+ R-O.
Stable phenoxy radical
Purple DPPH(2,2 diphenyl-1-picryl hydrazyl) Yellow

Materials and methods
41
4.9.1.1.3. Preparation of standard solutions
Accurately 10 mg each of ascorbic acid and rutin were weighed and dissolved in
0.95 ml of freshly distilled DMSO separately to obtain 10.5 mg/ml
concentration. These solutions were serially diluted with DMSO to get lower
concentrations.
4.9.1.2. Procedure
The assay was carried out in a 96 well microtitre plate. To 200 μl of DPPH
solution, 10 μl of each of the extract or standard solution was added separately in
wells of the microtitre plate. The plates were incubated at 37oC for 30 min and
the absorbance of each solution was measured at 490 nm (Hwang et al., 2001),
using ELISA reader.
4.9.2. Scavenging of nitric oxide radical
Sodium nitroprusside in aqueous solution at physiological pH, spontaneously
generates nitric oxide, which interacts with oxygen to produce nitrite ions, which
can be estimated by the use of modified Griess Ilosvay reaction (Garrat, 1964).
In the present investigation, Griess Ilosvay reagent was modified by using
naphthyl ethylene diamine dihydrochloride (0.1% w/v) instead of 1-
napthylamine (5%). Nitrite ions react with Griess reagent, which forms a purple
azo dye. In presence of test components, likely to be scavengers, the amount of
nitrite ions will decrease. The degree of decrease in the formation of purple azo
dye will reflect the extent of scavenging. The absorbance of the chromophore
formed is measured at 540 nm.

Materials and methods
42
HNO2 SO3HH2N SO3HN2
NH NH2SO3HN2
NH NH2NNHO3S
Nitrous acidSulfanilic acid Diazonium salt
1-Naphthyl ethylene diamine dihydrochloride
Diazonium salt
Azodye (Purple coloured )
4.9.2.1. Reagents
4.9.2.1.1. Sodium nitroprusside solution (10 mM)
Accurately 0.30 g of sodium nitroprusside was weighed and dissolved in
distilled water and the volume was made up to 100 ml in a volumetric flask.
4.9.2.1.2. Naphthyl ethylene diamine dihydrochloride (NEDD, 0.1%)
Accurately 0.1 g of NEDD was weighed and dissolved in 60 ml of 50% glacial
acetic acid by heating and the volume was made up to 100 ml with distilled
water in a volumetric flask.
Sodium Nitroprusside
Aqueous soln NONitric oxide
NONitric oxide
DissolvedO2/Water HNO3 + HNO2
Nitricacid
Nitrousacid

Materials and methods
43
4.9.2.1.3. Sulphanilic acid reagent (0.33% w/v)
Accurately 0.33 g of sulphanilic acid was weighed and dissolved in 20% glacial
acetic acid by heating and the volume was made up to 100 ml in a volumetric
flask.
4.9.2.1.4. Preparation of extract and standard solutions
These solutions were prepared as described under DPPH assay.
4.9.2.2. Procedure
The reaction mixture (6 ml) containing sodium nitroprusside (10 mM, 4 ml),
phosphate buffer saline (PBS, pH 7.4, 1 ml) and extract or standard (1ml) in
DMSO at various concentrations was incubated at 25oC for 150 min. After
incubation, 0.5 ml of the reaction mixture containing nitrite ion was removed, 1
ml of sulphanilic acid reagent was added to this, mixed well and allowed to stand
for 5 min for completion of diazotisation. Then, 1 ml of NEDD was added,
mixed and allowed to stand for 30 min in diffused light. A pink coloured
chromophore was formed. The absorbance was measured at 540 nm (Marcocci
et al., 1994).
4.9.3. Scavenging of ABTS radical cation assay
ABTS assay is relatively a recent one, which involves a more drastic radical,
chemically produced and is often used for screening complex antioxidant
mixtures such as plant extracts, beverages and biological fluids. The solubility in
both the organic and aqueous media and the stability in a wide pH range raised
the interest on the use of ABTS•+ for the estimation of the antioxidant activity
(Nenadis et al., 2004).

Materials and methods
44
4.9.3.1. Preparation of extract and standard solutions
Accurately 13.5 mg of each of the extracts and the standards, ascorbic acid and
rutin were weighed separately and dissolved in 2 ml of freshly distilled DMSO.
These solutions were serially diluted with DMSO to obtain lower dilutions.
4.9.3.2. Procedure
Accurately 54.8 mg of ABTS was weighed and dissolved in 50 ml of distilled
water (2 mM). Potassium persulphate (17 mM, 0.3 ml) was then added. The
reaction mixture was left to stand at room temperature overnight in dark before
usage. To 0.2 ml of various concentrations of the extracts or standards, 1.0 ml of
distilled DMSO and 0.16 ml of ABTS solution were added to make the final
volume to 1.36 ml. Absorbance was measured after 20 min at 734 nm (Re et al.,
1999).
N
C
S-O3S
Et
N N
N
S SO3-
Et
.. ..
N
C
S-O3S
Et
N N
N
S SO3-
Et
+ +
ABTS radical cation
K2S2O8

Materials and methods
45
F e 2 + + E D T A + O 2 Fe3+ + EDTA + O2-
2 O 2 - + 2 H + H2O2 + O2
F e 2 + + ED T A + H 2 O 2 OH- + OH + Fe3+-EDTA
O H + D e o x y r i b o s e Fragments H 2 C
C H O
C H O TBA/TCA
Malondialdehyde
4.9.4. Scavenging of hydroxyl radical by deoxyribose method
The sugar deoxyribose (2-deoxy-D-ribose) is degraded on exposure to hydroxyl
radical generated by irradiation or by Fenton systems. If the resulting complex
mixture of products was heated under acidic conditions, malondialdehyde
(MDA) is formed and may be detected by its ability to react with thiobarbituric
acid (TBA) to form a pink chromogen (Barry et al., 1987).
4.9.4.1. Preparation of extract and standard solutions
Accurately 16 mg of each of the extracts and standard BHA were weighed and
separately dissolved in 2 ml of freshly distilled DMSO. These solutions were
serially diluted with DMSO to obtain lower dilutions.
CHO
CHO
+ 2 SN
N
O
OH
H
Thiobarbituric acid
HN
NH
S
HC
HC
HC
NH
NH
O
O
O
O S
TBARS added pink chromogen

Materials and methods
46
4.9.4.2. Procedure
Various concentrations of the extracts or standard in DMSO (0.2 ml) were added
to the reaction mixture containing deoxyribose (3 mM, 0.2 ml), ferric chloride
(0.1 mM, 0.2 ml), EDTA (0.1 mM, 0.2 ml), ascorbic acid (0.1 mM, 0.2 ml) and
hydrogen peroxide (2 mM, 0.2 ml) in phosphate buffer (pH 7.4, 20 mM) to give
a total volume of 1.2 ml. The solutions were then incubated for 30 min at 37 ºC.
After incubation, ice-cold trichloro acetic acid (0.2 ml, 15% w/v) and
thiobarbituric acid (0.2 ml, 1% w/v) in 0.25N HCl were added. The reaction
mixture was kept in a boiling water bath for 30 min, cooled and the absorbance
was measured at 532 nm (Halliwell et al., 1987).
4.9.5. Scavenging of hydroxyl radical by p-NDA method
Hydroxyl radical was measured by the inhibition of p-nitrosodimethyl aniline
(p-NDA) bleaching (Elizabeth and Rao, 1990) by hydroxyl radical. Hydroxyl
radical is generated through Fenton reaction. In this reaction, iron-EDTA
complex reacts with hydrogen peroxide in presence of ascorbic acid to generate
hydroxyl radical, which can bleach p-NDA specifically. Hydroxyl radical shows
scavenging activity by inhibition of bleaching and percentage of scavenging as
absorbance is measured at 440 nm.
Fe3+ + EDTA Fe3+-EDTA complex
Fe3+-EDTA complex + Ascorbate Fe2+-EDTA complex + Oxidized Ascorbate
+ OH OH-+Fe2+-EDTA complex + H2O2 Fe3+-EDTA
(Fe3+ + O2- Fe2+ + O2)

Materials and methods
47
4.9.5.1. Preparation of extract and standard solutions
Accurately 30 mg of each of the extracts and the standard rutin were weighed
and dissolved separately in 5 ml of freshly distilled DMSO. These solutions
were serially diluted with DMSO to obtain lower dilutions.
4.9.5.2. Procedure
Various concentrations of the extracts or standard in distilled DMSO (0.5 ml)
were added to a solution mixture containing ferric chloride (0.1 mM, 0.5 ml),
EDTA (0.1 mM, 0.5 ml), ascorbic acid (0.1 mM, 0.5 ml), hydrogen peroxide
(2 mM, 0.5 ml) and p-NDA (0.01 mM, 0.5 ml) in phosphate buffer (pH 7.4, 20
mM), to produce a final volume of 3 ml. Sample blank was prepared by adding
0.5 ml of sample and 2.5 ml of phosphate buffer. Absorbance was measured at
440 nm (Elizabeth and Rao, 1990).
4.9.6. Scavenging of hydrogen peroxide
Hydrogen peroxide is generated in vivo by several oxidase enzymes. There is
increasing evidence that hydrogen peroxide, either directly or indirectly via its
reduction product hydroxyl radical (OH•) causes severe damage to biological
systems. In this method, when a scavenger is incubated with hydrogen peroxide,
the decay or loss of hydrogen peroxide can be measured spectrophotometrically
at 230 nm (Jayaprakasha et al., 2004).
4.9.6.1. Preparation of extract and standard solutions
Accurately 30 mg of each of the extracts and the standard rutin were weighed
and dissolved separately in 5 ml of methanol. These solutions were serially
diluted with methanol to obtain lower dilutions.
Materials and methods
48
4.9.6.2. Procedure
A solution of hydrogen peroxide (20 mM) was prepared in phosphate buffered
saline (PBS, pH 7.4). Various concentrations of 1 ml of the extracts or standards
in methanol were added to 2 ml of hydrogen peroxide solution in PBS. The
absorbance was measured at 230 nm after 10 min.
4.9.7. Evaluation of Total Antioxidant capacity of the extracts
The total antioxidant capacity was determined by phosphomolybdenum method
and is based on the reduction of Mo (VI) to Mo (V) by the antioxidant
compounds and the formation of a green Mo (V) complex which has the
maximal absorption at 695 nm.
4.9.7.1. Preparation of test and standard solutions
Weighed accurately 55 mg of each extracts and the standard, ascorbic acid and
dissolved in 5 ml of DMSO. The lower dilutions were made serially with
DMSO.
4.9.7.2. Procedure
An aliquot of 0.1 ml of the sample solution containing a reducing species
in DMSO was combined in an Eppendorff tube with 1 ml of reagent
solution (0.6 M sulphuric acid, 28 mM sodium phosphate, and 4 mM
ammonium molybdate). The tubes were capped and incubated in water bath
at 95 °C for 90 min. The samples were cooled to room temperature, and the
absorbance of each solution was measured at 695 nm. The total
antioxidant capacity was expressed as mM equivalent of ascorbic acid
(Huong et al.,1998).

Materials and methods
49
4.10. IN VITRO CYTOTOXICITY STUDIES
Drug development programmes involve pre-clinical screening of a vast numbers
of chemicals for their specific and non-specific cytotoxicity against many types
of cells. Use of in vitro assay systems for the screening of potential anticancer
agents has been a common practice almost since the beginning of cancer
chemotherapy in 1946. The National Cancer Institute now routinely measures
the growth inhibitory properties of every compound under test against a panel of
60 human tumor cell lines which are representative of major human tumor types.
There are a number of advantages in in vitro testing, using cell cultures which
include analysis of species specificity, feasibility of using only small amounts of
test substances, and facility to do mechanistic studies. A novel anticancer drug
should possess cytotoxicity at low concentrations against cancerous cell lines
and should be safe against normal cell lines even at higher concentrations. All
the extracts were tested for cytotoxicity by MTT and SRB assays.
4.10.1. Preparation of test solutions
Each extract was weighed separately, dissolved in distilled dimethyl sulphoxide
(DMSO) and the volume was made up to 10 ml with MEM/DMEM, pH 7.4,
supplemented with 2% inactivated FBS/NBCS (maintenance medium) to obtain
a stock solution of 1 mg/ml concentration, sterilized by filtration and stored at -
20°C till use. Serial dilution of two folds of the extracts was prepared from the
stock solution to obtain lower concentrations.

Materials and methods
50
4.10.2. Cell lines and culture medium
Vero (normal African Green Monkey Kidney), HEp-2 (human laryngeal
epithelial carcinoma) cell cultures were procured from National Centre for Cell
Sciences (NCCS), Pune, India., and HeLa (Epithelial human cervix cancer) from
V.P. Chest Institute, New Delhi, India and Stock cells of all cell lines were
cultured in DMEM supplemented with 10% inactivated FBS/NBCS, penicillin
(100 IU/ml), streptomycin (100 μg/ml) and amphotericin B (5 μg/ml) in a
humidified atmosphere of 5% CO2 at 37 °C until confluent. The cells were
dissociated with TPVG solution (0.2% trypsin, 0.02% EDTA, 0.05% glucose in
PBS). The stock cultures were grown in 25 cm2 flat bottles and all experiments
were carried out in either 96 or 6 well microtitre plates.
4.10.3. Determination of mitochondrial synthesis by MTT assay
The ability of the cells to survive a toxic insult has been the basis of most
cytotoxicity assays. This assay is based on the assumption that dead cells or
their products do not reduce tetrazolium. The assay depends both on the number
of cells present and on the mitochondrial activity per cell. The cleavage of MTT
to a blue formazan derivative by living cells is clearly a very effective principle
on which the assay is based.
The principle involved is the cleavage of tetrazolium salt, 3-(4, 5 dimethyl
thiazole-2-yl)-2, 5-diphenyl tetrazolium bromide (MTT), into a blue coloured
product (formazan) by mitochondrial enzyme succinate dehydrogenase. The
number of cells is known to be proportional to the extent of formazan production
by the cells used (Francis and Rita, 1986).
Materials and methods
51
4.10.3.1. Procedure
The monolayer cell culture was trypsinized and the cell count adjusted to
1.0 x 10⁵ cells/ml using MEM/DMEM medium containing 10% NBCS. To each
well of the 96 well microtitre plate, 0.1 ml of the diluted cell suspension
(approximately 10,000 cells) was added. After 24 h, when a partial monolayer
was formed, the supernatant was flicked off, the monolayer washed once with
medium. Different extracts (100 μl each) were added to the cells in microtitre
plates. The plates were then incubated at 37oC for 3 days in 5% CO2
atmosphere, microscopic examination was carried out and observations were
noted every 24 h. After 72 h, the extract solutions in the wells were discarded
and 50 μl of MTT in MEM – PR (Minimum essential medium without phenol
red) was added to each well. The plates were gently shaken and incubated for 3 h
at 37oC in 5% CO2 atmosphere. The supernatant was removed, 50 μl of propanol
was added and the plates were gently shaken to solubilize the formed formazan.
The absorbance was measured using a microplate reader at the wavelength of
540 nm. The percentage growth inhibition was calculated using the following
formula and CTC50 (concentration of drug or test extract needed to inhibit cell
growth by 50%) values were generated from the dose-response curves for each
cell line.
% Growth Inhibition = 100 – ⎥⎦
⎤⎢⎣
⎡100
group control of ODMean group test individual of ODMean X
The pattern of all the cell lines as a group is used to rank compounds as toxic or
non-toxic.

Materials and methods
52
4.10.4. Determination of total cell protein content by Sulforhodamine B
(SRB) assay
SRB is a bright pink aminoxanthine dye with two sulfonic groups. Under mild
acidic conditions, SRB binds to protein basic amino acid residues in trichloro
acetic acid (TCA) fixed cells to provide a sensitive index of cellular protein
content that is linear over a cell density range of at least two orders of
magnitude.
Color development in SRB assay is rapid, stable and visible. The developed
color can be measured over a broad range of visible wavelength in either a
spectrophotometer or a 96 well plate reader. When TCA-fixed and SRB stained
samples are air-dried, they can be stored indefinitely without deterioration
(Philip et al., 1990).
4.10.4.1. Procedure
The monolayer cell culture was trypsinized and the cell count was adjusted to
1.0 x 10⁵ cells/ml using medium containing 10% new born calf serum. To each
well of the 96 well microtitre plate, 0.1 ml of the diluted cell suspension
(approximately 10,000 cells) was added. After 24 h, when a partial monolayer
was formed, the supernatant was flicked off, washed the monolayer once with
medium and 100 μl of different extracts were added to the cells in microtitre
plates. The plates were then incubated at 37 oC for 3 days in 5% CO2
atmosphere, microscopic examination was carried out and observations were
Materials and methods
53
recorded every 24 h. After 72 h, 25 μl of 50% trichloro acetic acid was added to
the wells gently in such a way that it forms a thin layer over the extract to form
an over all concentration of 10%. The plates were incubated at 4 oC for 1 h. The
plates were flicked and washed five times with water to remove traces of
medium, extract and serum, and air-dried. They were stained with SRB for
30 min. The unbound dye was then removed by rapidly washing four times with
1% acetic acid. The plates were then air-dried. Tris base (10 mM, 100 μl) was
then added to the wells to solubilise the dye. The plates were shaken vigorously
for 5 min. The absorbance was measured using microplate reader at a
wavelength of 540 nm. The percentage growth inhibition was calculated using
the same formula used for MTT assay and the CTC50 values were calculated.
4.11. PHARMACOLOGICAL SCREENING OF CRUDE METHANOL
EXTRACTS
4.11.1. Animals
Wistar albino rats weighing 180-220 g were obtained from the animal house of
J. S. S. College of Pharmacy, Ootacamund. All the animals were kept under
standard laboratory conditions with 12 ± 1 h light-dark cycle. Animals were
provided with standard rat feed (Sai Durga Feeds and Foods, Bangalore, India)
and water ad libitum.

Materials and methods
54
4.11.2. Acute toxicity studies of the crude methanol extracts
An acute oral toxicity study in rats was carried out as per OECD-423 guidelines.
A maximum dose of 2000 mg/kg bw of the crude methanol extracts of flower,
stem, root and leaves were administered orally to various groups of rats
containing ten in each group. The animals were observed for mortality, clinical
signs and body weight changes daily for a period of 15 days and at the end of the
study period, all the animals were subjected to gross necropsy.
4.12. ACUTE ANTI-INFLAMMATORY ACTIVITY BY THREE
DIFFERENT MODELS
The crude methanol extracts of flower, stem, root and leaves showed potent
activity in most of the in vitro antioxidant methods. Hence, in the present study
we were interested to screen these extracts for in vivo anti-inflammatory and
analgesic studies.
The crude methanol extracts of flower, stem, root and leaves were screened for
acute anti-inflammatory studies using standard experimental models.
Carrageenan-induced paw edema is a standard and most commonly used
technique to screen the anti-inflammatory activity. It is expected that after tissue
injury, the animal will display spontaneous pain behaviour. This peripheral
hypersensitivity or pain perception can be explained on the basis of local release
of various inflammatory mediators i.e. bradykinin, prostaglandins or cytokines
which can activate and sensitize the peripheral nerve endings. The most widely
used primary test to screen new anti-inflammatory agents measures the ability

Materials and methods
55
of a compound to reduce local edema induced in the rat paw by injection of an
irritant agent. This edema depends on the participation of kinins and
polymorphonuclear leukocytes with their proinflammatory factors including
prostaglandins. The development of edema in the paw of the rat after the
injection of carrageenan has been described as a biphasic event. The initial
phase, observed around 1 h, is attributed to the release of histamine and
serotonin; the second, accelerating phase of swelling is due to the release of
prostaglandin-like substances. (Winter et al., 1962).
It is well known that inhibition of formalin-induced edema in rats is one of the
most suitable test procedures to screen anti-arthritic and anti-inflammatory
agents as it closely resembles human arthritis. Histamine plays an important role
in the effector phase of delayed-type hypersensitivity, which has been known to
be involved in many inflammation disorders such as hepatitis and arthritis.
4.12.1. Preparation of Extract
The crude methanol extracts of flower, stem, root and leaves (1 g) were
suspended separately in 0.5% sodium CMC. These suspensions were
administered orally to the animals with the help of intragastric catheter. Based on
the acute toxicity studies, the minimum dose level of extracts at 100 and
200 mg/kg bw were selected.
4.12.2. Preparation of standard and phlogistic agents
Ibuprofen (100 mg) was suspended in 10 ml of 0.5% w/v sodium CMC and
administered orally to the animals with the help of an intragastric catheter at the
Materials and methods
56
dose of 100 mg/kg body weight. Suspensions or solutions of carrageenin,
formalin and histamine were prepared separately in phosphate buffer solution
and used for inducing inflammation.
4.12.3. Standard drug and extract administration
The animals were randomly divided into ten groups of six animals each. Group I
received 0.5% sodium CMC at the dose of 2 ml/kg bw. Group II served as
positive control and was treated with ibuprofen at 100 mg/kg bw. Groups III and
IV were treated with crude methanol flower extract at 100 and 200 mg/kg bw,
respectively. Groups V and VI were treated with crude methanol root extract at
100 and 200 mg/kg bw, respectively. Groups VII and VIII were treated with
crude methanol stem extract at 100 and 200 mg/kg bw, respectively. Groups IX
and X were treated with crude methanol leaves extract at 100 and 200 mg/kg
bw, respectively. For all experiments, the same protocol of treatment was
followed.
4.12.4. Procedure
The initial hind paw volume of rats was determined volumetrically by using a
plethysmometer (Kulkarni 1999; Vasudevan et al., 2006). In separate sets of rats,
a solution of carrageenan in saline (1%, 0.1 ml/rat), formalin (1%, 0.1 ml/rat) or
histamine (0.1%, 0.1 ml/rat) were injected subcutaneously into the right hind
paw 30 min after the above treatments. The animals in the control group
received the vehicle only. Paw volumes were measured up to 3 h at intervals of
0, 1, 2 and 3 h and percent increase in edema between the control and treated

Materials and methods
57
groups were compared. The percentage inhibition of edema was calculated by
using the following formula (Arul et al., 2005).
Percentage inhibition = 100control Vo) -(Vt
treatedVo) -(Vt - control Vo) -(Vt X
4.12.5. Statistical analysis
Data are expressed as mean ± S E M. One way ANOVA was applied for the
analysis of the results. Subsequently, multiple comparisons were made using the
Dunnet’s multiple rang test; p <0.05 was considered as significant.
4.13. SUB CHRONIC ANTI-INFLAMMATORY ACTIVITY
4.13.1. Cotton pellet-induced granuloma
Among the extracts screened for acute anti-inflammatory study, the crude
methanol flower extract which showed maximum activity was screened for sub
chronic anti-inflammatory studies by cotton pellet granuloma model. The cotton
pellet granuloma is the model of chronic inflammation and the dry weight has
been shown to correlate with the amount of granuloma matous tissue formed
(Swingle and Shideman, 1972).
Inflammation was induced by implanting sterile cotton pellets weighing 20.0 ±
1.0 mg in the groin region of the rat under light ether anaesthesia. The animals
were randomly divided into five groups of six animals each Group I was control
and given only vehicle (saline). Group II was treated with standard Ibuprofen
(100 mg/kg bw). Groups III, IV and V were treated with crude methanol flower
Materials and methods
58
extract at three dose levels (100,150, and 200 mg/kg bw) orally for 7 days. All
the animals were sacrificed on the eighth day with an over dose of ether. The
pellet and the surrounding granuloma were dissected out carefully and dried
overnight in an oven at 60 ºC to a constant weight. The weight of the granuloma
tissue was obtained by determining the difference between the initial (20 mg)
and the final weight of the cotton pellet with its attached granulomatous tissue.
The mean weight of the granuloma tissue formed in each group and the
percentage inhibition were determined. The statistical analysis as described in
4.12.5 was carried out.
4.14. ANALGESIC ACTIVITY BY HOT PLATE AND TAIL
IMMERSION METHODS
The crude methanol extracts of flower, stem, root, leaves and standard ibuprofen
(1 g) were suspended separately in 0.5% sodium CMC. These suspensions were
administered orally to the animals with the help of intragastric catheter, at the
doses of 100 and 200 mg/kg bw doses for extracts and 100 mg/kg bw for
standard, respectively.
The animals were randomly divided into ten groups of six animals each. Group I
was control and received 0.5% sodium CMC at the dose of 2 ml/kg bw. Group II
served as positive control and was treated with ibuprofen at 100 mg/kg bw.
Groups III and IV were treated with crude methanol flower extract at 100 and
200 mg/kg bw, respectively. Groups V and VI were treated with crude methanol

Materials and methods
59
root extract at 100 and 200 mg/kg bw, respectively. Groups VII and VIII were
treated with crude methanol stem extract at 100 and 200 mg/kg bw, respectively.
Groups IX and X were treated with crude methanol leaves extract at 100 and 200
mg/kg bw, respectively. All these treatments were given orally 30 min prior to
the test.
4.14.1. Hot plate method In the Eddy’s hot plate method (Kulkarni, 1999), the rats were treated and placed
on Eddy’s hot plate kept at a temperature of 55 ± 0.5 ºC. A cut off period of
15 sec was observed to avoid damage to the paw. Reaction time and the type of
response were noted using a stopwatch. The response is in the form of jumping,
withdrawal of the paws or licking of the paws. The latency was recorded before
and after 0, 30, 60, 90 and 120 min following the oral administration of the
treatments. The percentage protection was calculated using the formula.
Protection (%) = (t/c-1) ×100,
Where, t = reaction time of treated group and c = reaction time of control group.
4.14.2. Tail immersion method
In the tail immersion method, the tails of the rats were cleaned with spirit, 5 cm
of the end of the rat tail was immersed in warm water maintained at 55 ± 0.5 ºC.
The tail withdrawal reflex was recorded before and after 0, 1, 2 and 3 h
following the treatments. The percent protection was calculated by using the
formula mentioned above. The statistical analysis as described in 4.12.5 was
carried out.
Materials and methods
60
4.15. IN VIVO ANTIOXIDANT AND HEPATOPROTECTIVE
ACTIVITIES OF CRUDE METHANOL FLOWER EXTRACT
Liver is an important organ actively involved in the metabolism, detoxification
and secretory functions in the body and its disorders are numerous with no
effective remedies. Herbs are known to play a vital role in the management of
various liver disorders. Ayurveda, the ancient system of Indian medicine,
identified liver diseases and recommended a number of herbal remedies
(Chatterjee, 2000). Carbon tetrachloride (CCl4) induced hepatic injury model
was used for hepatoprotective drug screening. The principle causes of carbon
tetrachloride induced hepatic damage are free radical mediated lipid peroxidation
leading to disruption of biomembrane, dysfunction of cells and tissues,
decreased levels of antioxidant enzymes and generation of free radicals (Castro
et al., 1974; Poli, 1993). The antioxidant activity involving inhibition of the
generation of free radicals is important in providing protection against hepatic
damage.
Several plants have been reported for their hepatoprotective property by
improving antioxidant status. Among them silymarin, a plant derived medicine
obtained from the fruits of Silybum marianum is approved for use in liver
cirrhosis and alcoholic liver diseases (Sallar et al., 2001). Among the extracts
tested for in vivo anti-inflammatory and analgesic activities, the crude methanol
flower extract showed potent activity. Hence, it was screened for evaluating in
vivo antioxidant and hepatoprotective properties.

Materials and methods
61
4.15.1. Preparation of extracts and standard
The crude methanol flower extract suspension were prepared in 0.3% sodium
carboxy methyl cellulose (CMC) in distilled water. Standard silymarin (100
mg/ml) suspension was also prepared in 0.3% sodium CMC. The suspensions
were administered orally to the animals with the help of an intragastric catheter.
4.15.2. Procedure
The rats were divided into six groups containing six animals in each group.
Group I was served as control and group II as CCl4 treated. Both these groups
were received sodium CMC (0.3%, 5 ml/kg bw). Groups III, IV and V animals
were treated with crude methanol flower extract at the dose levels of 100, 150
and 200 mg/kg bw. Group VI was treated with the standard drug silymarin at
100 mg/kg bw. All these treatments were given orally for eight days. On the last
day of the treatment, all the animals except the normal group I and the extract
alone treated group II were received a single dose of CCl4 in liquid paraffin
(1:1), 1 ml/kg bw intraperitoneally after 1 h of the vehicle, extract or standard
treatments.
On the ninth day, the animals were anesthetized by anesthetic ether and blood
was collected from the abdominal artery and kept for 30 min at 4 ºC. Serum was
separated by centrifugation at 2500 rpm for 15 min at 4 ºC and used for the
biochemical estimations. Serum marker enzymes such as ASAT, ALAT, ALP,
TGL, CR, TP, TC, TB and albumin were measured in an autoanalyzer using
Materials and methods
62
Ecoline kits. Superoxide dismutase (SOD, Misra and Fridovich, 1972), catalase
(CAT, Beers and Sizer, 1952) and thiobarbituric acid reactive substances
(TBARS, Ohkawa et al., 1979) were measured spectrophotometrically.
After the collection of blood samples, the liver and kidney were excised, rinsed
in ice-cold normal saline, followed by cold 0.15 M potassium chloride (pH 7.4)
and blotted dry. A 10% w/v homogenate was prepared in 0.15 M potassium
chloride buffer with Elvenjan homogenizer fitted with Teflon plunger and
centrifuged at 2500 rpm for 15 min at 4 ºC. The supernatants were used for the
estimation of CAT, SOD and TBARS in both liver and kidney. A portion of the
liver and kidney tissues were fixed in 10% formalin, cut into 5 μm thick sections
and stained using heamatoxylin-eosin and histopathological observations were
made.
4.15.3. Estimation of antioxidant parameters
4.15.3.1. Estimation of CAT
CAT (EC 1.11.1.6) is an enzyme present in the cells of plants, animals and
aerobic (oxygen requiring) bacteria (Mates et al., 1999). Catalase is located in a
cell organelle called the peroxisome. In animals, catalase is present in all major
body organs. The role of catalase is to scavenge hydrogen peroxide and prevent
oxidative damage in the cell. Catalase is a heme containing protein that can
convert hydrogen peroxide to water and oxygen in a two-step reaction cycle. In
the first step, one molecule of hydrogen peroxide is converted to water. The
Materials and methods
63
catalytic cycle begins with the oxidation of the ferric heme by hydrogen
peroxide to form the ferryl-oxo porphyrin/protein radical intermediate
(compound 1). The catalase cycle is completed by the reduction of compound 1
to the ferric enzyme by hydrogen peroxide, resulting in production of molecular
oxygen (Li and Goodwin, 1999).
4.15.3.2. Chemicals and reagents
4.15.3.2.1. Hydrogen peroxide (7.5 mM)
1.043 ml of 30% w/w H2O2 was made up to 100 ml with sodium chloride and
EDTA solution (9 g of NaCl and 29.22 mg of EDTA dissolved in 1 L distilled
water).
4.15.3.2.2. Potassium phosphate buffer (65 mM, pH 7.8)
2.2 g of potassium dihydrogen phosphate and 11.32 g of dipotassium hydrogen
phosphate were dissolved in 250 ml and 1 L distilled water, respectively and
mixed together. The pH was adjusted to 7.8 with KH2PO4.
4.15.3.2.3. Sucrose Solution
10.95 g of sucrose was dissolved in 100 ml of distilled water.
4.15.3.3. Procedure
2.25 ml of potassium phosphate buffer (65 mM, pH 7.8) and 100 μl of the serum
or tissue homogenate or sucrose (0.32 M) were incubated at 25 °C for 30 min.
H2O2 (0.65 ml, 75 mM) was added to initiate the reaction. The change in
absorption at 240 nm was measured for 2-3 min, and dy/dx for 1 min for each

Materials and methods
64
assay was calculated and the results were expressed as CAT units/mg of tissue
(Beers and Seizer, 1952).
4.15.4. Estimation of SOD
One of the most effective intracellular enzymatic antioxidants is superoxide
dismutase (SOD) (EC 1.15.1.1). Superoxide dismutase is the antioxidant enzyme
that catalyzes the dismutation of O2• − (free radical) to O2 and to the less reactive
species H2O2. While this enzyme was isolated as early as 1939, it was only in
1969 that McCord and Fridovich proved the antioxidant activity of SOD
(Mc Cord and Fridovich., 1969).
Superoxide dismutase exists in several isoforms, differing in the nature of active
metal centre and amino acid constituency, as well as their number of subunits,
cofactors and other features. In humans there are three forms of SOD: cytosolic
Cu, Zn-SOD and mitochondrial Mn-SOD, and extracellular SOD (EC-SOD)
(Landis and Tower, 2005). SOD destroys O2•− with remarkably high reaction
rates, by successive oxidation and reduction of the transition metal ion at the
active site in a “Ping-Pong” type mechanism (Mates et al., 1999).
Under physiological conditions, a balance exists between the level of reactive
oxygen species (ROS) produced during normal cellular metabolism and the level
of endogenous antioxidants, which serve to protect tissues from oxidative
damage. Disruptions of this balance (either through increased production of ROS
or decreased levels of antioxidants) produce a condition known as oxidative
stress and leads to a variety of pathological conditions. To protect against
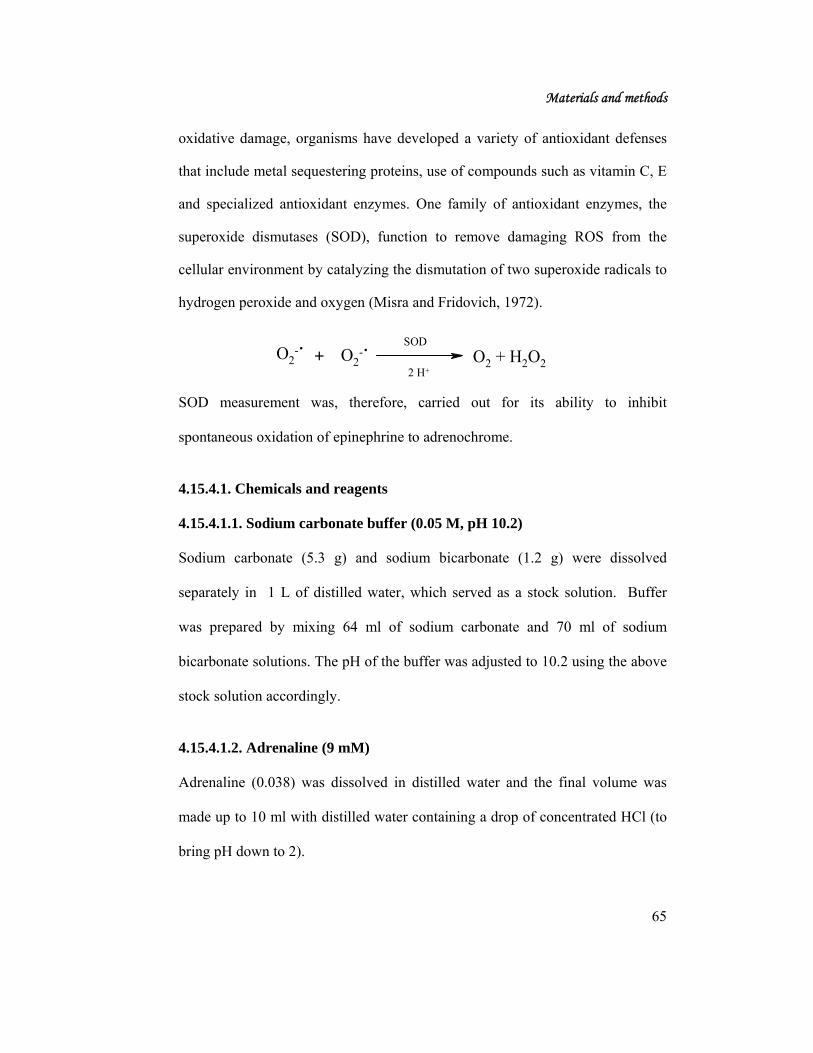
Materials and methods
65
oxidative damage, organisms have developed a variety of antioxidant defenses
that include metal sequestering proteins, use of compounds such as vitamin C, E
and specialized antioxidant enzymes. One family of antioxidant enzymes, the
superoxide dismutases (SOD), function to remove damaging ROS from the
cellular environment by catalyzing the dismutation of two superoxide radicals to
hydrogen peroxide and oxygen (Misra and Fridovich, 1972).
SOD measurement was, therefore, carried out for its ability to inhibit
spontaneous oxidation of epinephrine to adrenochrome.
4.15.4.1. Chemicals and reagents
4.15.4.1.1. Sodium carbonate buffer (0.05 M, pH 10.2)
Sodium carbonate (5.3 g) and sodium bicarbonate (1.2 g) were dissolved
separately in 1 L of distilled water, which served as a stock solution. Buffer
was prepared by mixing 64 ml of sodium carbonate and 70 ml of sodium
bicarbonate solutions. The pH of the buffer was adjusted to 10.2 using the above
stock solution accordingly.
4.15.4.1.2. Adrenaline (9 mM)
Adrenaline (0.038) was dissolved in distilled water and the final volume was
made up to 10 ml with distilled water containing a drop of concentrated HCl (to
bring pH down to 2).
O2-. O2
-.+ O2 + H2O2 SOD
2 H+

Materials and methods
66
Adrenaline being sensitive, the vial was kept covered with aluminum foil at all
times.
4.15.4.1.3. Sucrose (0.32 M) solution
Sucrose (10.96 g) was dissolved in distilled water and the volume was made up
to 100 ml.
4.15.4.2. Procedure
Sodium carbonate buffer (2.8 ml, 0.05 mM) and 0.1 ml of serum or tissue
homogenate or sucrose (blank) was incubated at 30 ºC for 45 min. The
absorbance was then adjusted to zero to sample. The reaction was then initiated
by adding 10 μl of adrenaline solution (9 mM). The change in absorbance was
recorded at 480 nm for 8-12 min. The temperature was maintained at 30ºC
throughout the assay. Similarly, SOD calibration curve was prepared by taking
10 unit/ml as standard solution. One unit of SOD produced approximately 50%
inhibition of auto-oxidation of adrenaline. The results were expressed as unit (U)
of SOD activity/mg of tissue (Saggu et al., 1989).
4.15.5. Estimation of TBARS
Lipid peroxidation is commonly regarded as a deleterious process (Sevanian and
Ursini, 2000), leading to structural modification of complex lipid protein
assemblies, such as biomembranes and lipoproteins, and is usually associated
with cellular malfunction. During lipid peroxidation, a polar oxygen moiety is
introduced into the hydrophobic tails of unsaturated fatty acids. This process is

Materials and methods
67
of dual consequence: the presence of hydroperoxy group disturbs the
hydrophobic lipid/lipid and lipid/protein interactions, which leads to structural
alterations of biomembranes and lipoproteins; hydroperoxy lipids are sources for
the formation of free radicals. When free radicals are generated, they can attack
polyunsaturated fatty acids in cell membrane leading to a chain of chemical
reactions called lipid peroxidation. As the fatty acid is broken down, the
hydrocarbon gases and aldehyde are formed. The most common method used to
assess malondialdehyde (MDA) is the thiobarbituric acid (TBARS) assay
(Halliwell and Chirico, 1993).
4.15.5.1. Chemicals and reagents
4.15.5.1.1. Thiobarbituric acid solution
Thiobarbituric acid (0.8 g) was dissolved in distilled water and the volume was
made up to 100 ml. The pH was adjusted to 7.4 with 1 N NaOH/0.1 N HCl
solutions.
4.15.5.1.2. Acetic acid solution
Acetic acid (20 ml) was dissolved in distilled water and the volume was made up
to 100 ml with distilled water. The pH was adjusted to 3.5 with 1 N NaOH/0.1
N HCl solution.
4.15.5.1.3. Sodium lauryl sulfate solution
Sodium lauryl sulfate (8.1 g) was dissolved in distilled water and the volume
was made up to 100 ml with distilled water.

Materials and methods
68
4.15.5.2. Procedure
To 1 ml of serum or tissue homogenate, 0.2 ml of sodium lauryl sulfate solution
(8.1%), 1.5 ml of 20% acetic acid (pH 3.5) and 1.5 ml of thiobarbituric acid
solution (0.8% w/v, pH 7.4) were added. This incubation mixture was made up
to 5.0 ml with double distilled water and then heated in boiling water bath for
30 min. After cooling, the red chromogen was obtained and centrifuged at
4000 rpm for 10 min. The supernatant was taken and its absorbance was
measured at 532 nm. 1, 1, 3, 3 - Tetraethoxy propane (TEP) was used as external
standard. The results were expressed as nM of MDA/mg of wet tissue or ml of
serum using molar extension co-efficient of the chromophore (1.56 x 10⁵ M-1
cm-1). Similarly, the calibration curve was prepared for TEP and the results were
expressed as nM of MDA/mg of tissue (Ohkawa et al., 1979).
nM of MDA/mg of tissue or ml of serum = 310kenextract taofVolume105.56
100 homogenate of Volume OD X××
××
4.15.6. Estimation of hepatoprotective parameters
Biochemical estimations in serum were carried out by using Ecoline diagnostic
kits.
4.15.6.1. Assay of ASAT
ASAT catalyzes the following reactions:
2-Oxoglutarate + L-aspartate Glutamate + Oxaloacetate
Oxaloacetate + NaDH + H+ Malate + NAD+
ASAT
MD

Materials and methods
69
Where, MD is malatedehydrogenase. The rate of NADH consumption was
measured spectrophotometrically at 340 nm and is directly proportional to the
ASAT activity in the sample. ASAT level was expressed as U/L.
4.15.6.1.1. Procedure
Reagents 1 and 2 of Ecoline diagnostic kit for ASAT were mixed at the ratio of
4:1 and the temperature was maintained at 30 ºC. To 50 µl of the sample, 0.5 ml
of the reagent solution was added and mixed. After 1 min, the decrease in
absorbance was measured every min for 3 min at 340 nm.
Enzyme activity [U/I] = (∆ A/ min) x 2143, Where, ∆ A is the decrease in
absorbance per min.
4.15.6.2. Assay of ALAT
ALAT catalyzes the following reactions:
where, LDH is lactate dehydrogenase. The rate of NADH consumption was
measured spectrophotometrically at 340 nm and this is directly proportional to
ALAT activity in the sample. ALAT level was expressed as U/L.
4.15.6.2.1. Procedure
Reagents 1 and 2 of Ecoline diagnostic kit for ALAT were mixed at the ratio of
4:1 and the temperature was maintained at 30 ºC. To 50 µl of the sample, 0.5 ml
of the reagent solution was added and mixed. After 1 min, the decrease in
absorbance was measured every min for 3 min at 340 nm.
2-Oxoglutarate + L-Alanine Glutamate + Pyruvate
Pyruvate + NaDH + H+ Lactate + NAD+
ALAT
LDH

Materials and methods
70
Enzyme activity [U/I] = (∆ A/ min) x 2143, where, ∆ A is the decrease in
absorbance per min.
4.15.6.3. Assay of ALP
ALP catalyzes by the following reaction:
The rate of increase in 4-nitrophenolate was determined spectrophotometrically
at 405 nm and this is directly proportional to the ALP activity in the sample.
Alkaline phosphatase level in serum, liver and kidney tissue homogenates was
expressed as U/L.
4.15.6.3.1. Procedure
Reagents 1 and 2 of Ecoline diagnostic kit for ALP were mixed at the ratio of
4:1 and the temperature was maintained thermostat at 30 ºC. To 20 µl of the
sample, 1 ml of the reagent solution was added and mixed. After 1 min, the
increase in absorbance was measured every min for 3 min at 405 nm.
Enzyme activity [U/I] = (∆ A/ min) x 2754, where, ∆ A is the increase in
absorbance per min.
4.15.6.4. Estimation of TB
The total bilirubin was determined by coupling with diazotized sulfanilic acid
after the addition of caffeine, sodium benzoate and sodium acetate. Bilirubin
reacts with diazotized sulfanilic acid and forms blue azobilirubin dye in alkaline
Fehling’s solution II. The absorbance is measured at 578 nm. The concentration
of total bilirubin was expressed as mg %.
4-Nitrophenyl phosphate + H2O Phosphate + 4-Nitrophenolate ALP

Materials and methods
71
4.15.6.4.1. Procedure
Reagent 1 and 2 were mixed at the ratio of 4:1. The mixture, known as diazo
solution, was maintained at 30 ºC. To 50 µl of the sample, 50 µl of the diazo
solution and 250 µl of acceleration solution (mixture of caffeine 5%, sodium
benzoate 7.5% and sodium acetate 12.5%) were added and mixed. The reaction
mixture was maintained at room temperature. After 1 h, 250 µl of alkaline
Fehling’s solution II was added and the reaction mixture was incubated at room
temperature for 5 min. The absorbance of the sample and standard were
measured against the reagent blank, after 5 min at 578 nm.
Total Bilirubin (mg %) = (Asample – Ablank) x 27.78,
where, Asample is absorbance of sample and Ablank is absorbance of the blank.
4.15.6.5. Estimation of TGL
Triglycerides catalyze the following reactions;
Where, GK is glycerokinase, GPO is glycerol-3-phosphate oxidase and POD is
peroxidase. The absorbance of the sample and standard were measured against
the blank at 546 nm. The triglyceride levels were expressed as mg/dL.
Triglyceride Glycerol + Fatty AcidLipase
Glycerol + ATP Glycerol-3-Phosphate + ADPGK
Dihydroxy acetone phosphate + H2 O
2 Glycerol-3-Phosphate + O 2
GPO
2 H2
O2
+ Aminoantipyrine + 4 -Chlorophenol Chinonimine + 4H2
OPOD

Materials and methods
72
4.15.6.5.1. Procedure
To 0.10 ml of sample or standard triglyceride (supplied by Ecoline diagnostic
kit), 1.00 ml of the reagent was added, mixed well and incubated for 10 min at
37 ºC. The absorbance of sample and standard were measured against reagent
blank within 60 min at 546 nm.
Triglycerides [mg/dL] = (Asample/Astandard) x Concentration of standard
4.15.6.6. Estimation of TC
Cholesterol and its esters are released from lipoproteins by detergents.
Cholesterol esterase hydrolyzes the esters. In the subsequent enzymatic
oxidation by cholesterol oxidase, H2O2 is liberated. This is converted into the
colored quinoneimine with 4-aminoantipyrine and phenol catalyzed by
peroxidase by following reaction;
Where, CHE is cholesterol esterase, CHO is cholesterol oxidase and POD is
peroxidase. The absorbance of the sample and standard were measured against
the reagent blank at 546 nm. Cholesterol level was expressed as mg/dL.
4.15.6.6.1. Procedure
To 0.10 ml of the sample or standard cholesterol (supplied by Ecoline diagnostic
kit), 1.00 ml of the reagent was added, mixed well and incubated for 5 min at
37ºC and the absorbance of sample and standard were measured at 546 nm
within 60 min.
2H2O2 + Amino antipyrine + Phenol Quinoneimine + 4 H2O2 , POD
Cholesterol ester +H2O Cholesterol + Fatty AcidCHE
Cholesterol + O2 Cholesterol-3-one + H2O2 CHO
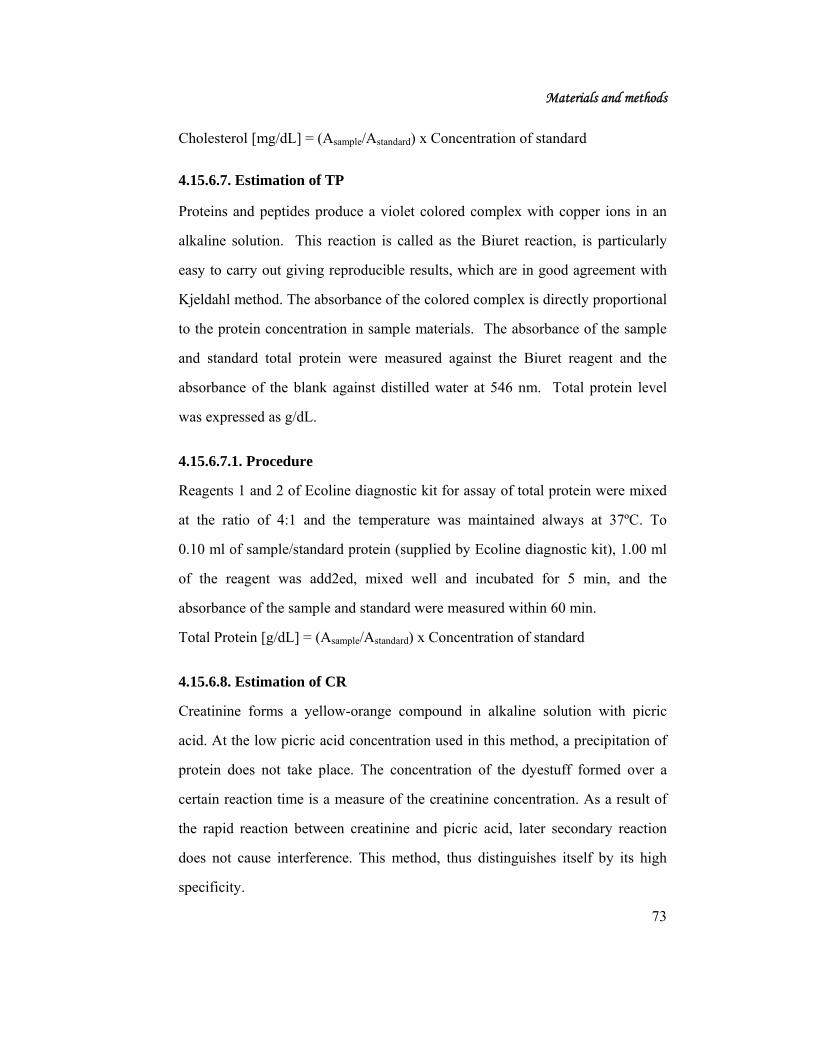
Materials and methods
73
Cholesterol [mg/dL] = (Asample/Astandard) x Concentration of standard
4.15.6.7. Estimation of TP
Proteins and peptides produce a violet colored complex with copper ions in an
alkaline solution. This reaction is called as the Biuret reaction, is particularly
easy to carry out giving reproducible results, which are in good agreement with
Kjeldahl method. The absorbance of the colored complex is directly proportional
to the protein concentration in sample materials. The absorbance of the sample
and standard total protein were measured against the Biuret reagent and the
absorbance of the blank against distilled water at 546 nm. Total protein level
was expressed as g/dL.
4.15.6.7.1. Procedure
Reagents 1 and 2 of Ecoline diagnostic kit for assay of total protein were mixed
at the ratio of 4:1 and the temperature was maintained always at 37ºC. To
0.10 ml of sample/standard protein (supplied by Ecoline diagnostic kit), 1.00 ml
of the reagent was add2ed, mixed well and incubated for 5 min, and the
absorbance of the sample and standard were measured within 60 min.
Total Protein [g/dL] = (Asample/Astandard) x Concentration of standard
4.15.6.8. Estimation of CR
Creatinine forms a yellow-orange compound in alkaline solution with picric
acid. At the low picric acid concentration used in this method, a precipitation of
protein does not take place. The concentration of the dyestuff formed over a
certain reaction time is a measure of the creatinine concentration. As a result of
the rapid reaction between creatinine and picric acid, later secondary reaction
does not cause interference. This method, thus distinguishes itself by its high
specificity.

Materials and methods
74
4.15.6.8.1. Procedure
Buffer solution and picric acid solution from E-Merck diagnostic kit for
creatinine were mixed in the ratio of 1:1 and incubated for about 10 min before
use. To 1 ml of this reagent solution, 0.20 ml of sample/standard was added, and
mixed well. The absorbance was measured exactly after 1 min and 5 min at 492
nm. The concentration of creatinine was calculated by using the following
formula.
Creatinine concentration (mg/dl) = 21
12
AStAStAA
−−
A1 and A2 = absorbance of sample after 1 and 5 min
ASt1 and ASt2 = absorbance of standard after 1 and 5 min.
4.15.6.9. Estimation of albumin
Albumin forms blue-green complex with bromocresol green at slightly acidic
pH, which was measured spectrophotometrically. The absorbance of the sample
nd standard was measured against blank at 540 nm. Albumin levels in serum and
liver and kidney tissue homogenates were expressed as g/dl.
4.15.6.9.1. Procedure
To 1 ml of the reagent solution from E-Merck diagnostic kit for albumin, 100 µl
of the sample or standard was added, mixed well and incubated at 37 ºC for 10
min. The absorbance of the sample and standard was measured against the
reagent blank solution within 60 min. the concentration of albumin was
calculated by using the formula, Albumin (mg/dl) = (As/Astd) x Concentration
of standard, where As = Absorbance of sample and Astd = Absorbance of
standard.

Materials and methods
75
4.15.7. Histopathological studies
On the 9th day of the experiment, from all the animals liver and kidney were
dissected out, cleared off their surrounding tissues and washed with normal
saline. Initially, the materials were fixed in 10% buffered neutral formalin for 48
h and then with bovine solution for 6 h. They were processed for paraffin
embedding. Paraffin blocks were made and sections were taken at 5 µm
thickness using microtome, and placed on microscope slides. These sections
were stained with heamotoxylin and alcoholic eosin. The sections were
examined microscopically for the evaluation of histopathological changes
(Gupta et al., 2004).
4.15.8. Statistical analysis
The significance of the in vivo data was analyzed by one-way ANOVA, followed
by Tukey-Kramer multiple comparison tests and P<0.05 was considered as
statistically significant.

Results
76
5.1. MACROSCOPIC FEATURES
The plant is profusely branched, compared to shrub. Young stem is angular with
four ridges, the leaves are elliptic-lanceolate to obovate, 5 cm long and 3 cm
wide; lamina is thick and coriaceous, dark green and scalerid above, reticulate
and white villous on aseoles below; leaf margin are crenate-serrate; petiole is 1
cm long. Inflorescence is terminal or axillary, branched, unbranched spike. Bract
and bracteoles are prominent, leafy; calyx has 5 sepals, gamosepalous, lobes are
linear and lanceolate. Corolla is pale-blue to manne with 5 petals, gamopetalous,
biloubed. Stamens: two, epipetalous, anthers dithecous, lobes parallel. Ovary is
superior, bicarpellary, syncarpous, two ovules in each carpel. Seeds are densely
hairy.
5.2. MICROSCOPIC FEATURES
5.2.1. Leaf The leaf has thick, prominantly projecting midrib and lateral veins.
The mid rib is 750 µm in vertical planee and 800 µm in horizontal plane. The
mid rib has shallow median depression on the adaxial region; this part of the
midrib has collenchymatous cells. The abaxial part has uneven and undulate
outline; the epidermal layer is thin and continuous comprising of small squarish,
thick walled cells. The ground tissue is parenchymatous; the cells are wide,
angular, thin walled and compact. The vascular strend is small, single and
consist of about eight parallel uniseriate rows of narrow xylem elements and
wide thin phloem elements.
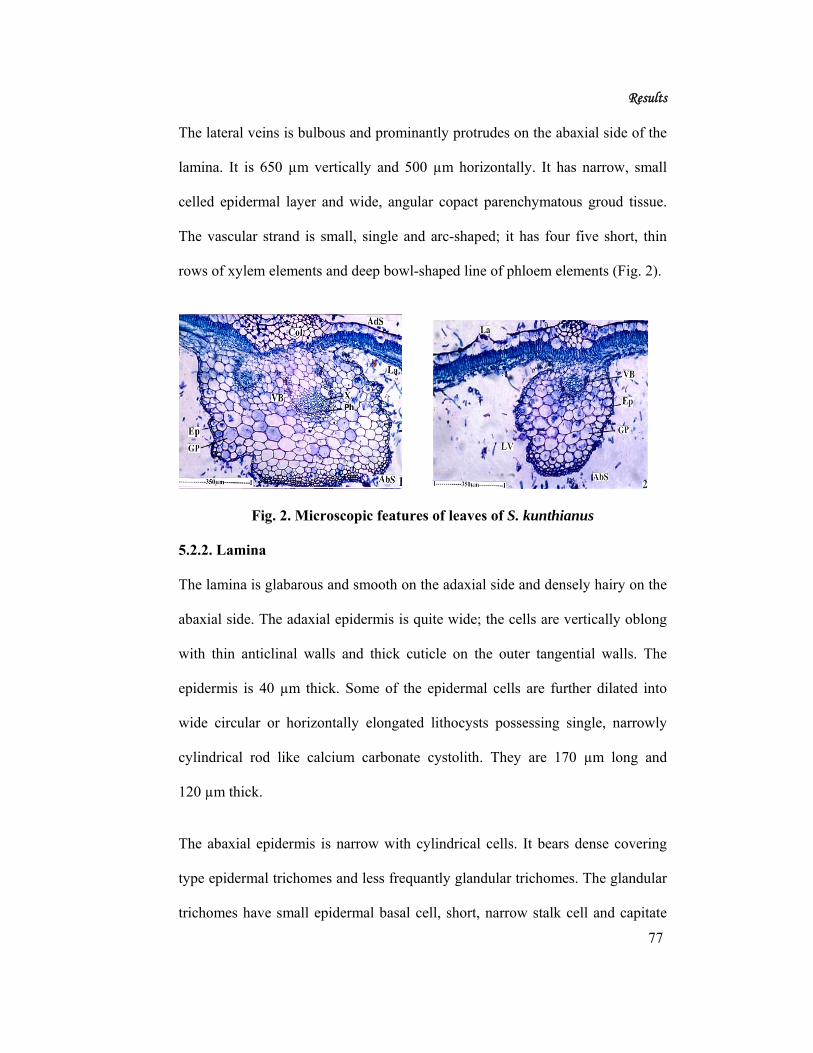
Results
77
The lateral veins is bulbous and prominantly protrudes on the abaxial side of the
lamina. It is 650 µm vertically and 500 µm horizontally. It has narrow, small
celled epidermal layer and wide, angular copact parenchymatous groud tissue.
The vascular strand is small, single and arc-shaped; it has four five short, thin
rows of xylem elements and deep bowl-shaped line of phloem elements (Fig. 2).
Fig. 2. Microscopic features of leaves of S. kunthianus
5.2.2. Lamina
The lamina is glabarous and smooth on the adaxial side and densely hairy on the
abaxial side. The adaxial epidermis is quite wide; the cells are vertically oblong
with thin anticlinal walls and thick cuticle on the outer tangential walls. The
epidermis is 40 µm thick. Some of the epidermal cells are further dilated into
wide circular or horizontally elongated lithocysts possessing single, narrowly
cylindrical rod like calcium carbonate cystolith. They are 170 µm long and
120 µm thick.
The abaxial epidermis is narrow with cylindrical cells. It bears dense covering
type epidermal trichomes and less frequantly glandular trichomes. The glandular
trichomes have small epidermal basal cell, short, narrow stalk cell and capitate

Results
78
type secretory body cells. They have four or eight cells and possess dense
cytoplasam and prominent nuclei. The glandular trichomes are 30-40 µm in
height and 20-30 µm wide. They occur both on the adaxial. and abaxial side of
the lamina. The mesophyll consists of cylindrical compact, narrow pillars of
palisade cells which are 50 µm in height. The spongy parenchyma zone is
narrow comprising of three or four spherical or lobed cells (Fig. 3).
Fig. 3. Microscopic features of lamina of S. kunthianus 5.2.3. Petiole
The petiole is wide pot-shaped in sectional view with flat adaxial side, short
thick lateral wings on the adaxial part. The epidermal cell layer is thin with small
cubical cells. Linear to the epidermal layer are two or three layer of collenchyma

Results
79
at the adaxial side and six or seven layers of collenchyma at the abaxial side. The
ground tissue is parenchymatous, homogeneous and the cells are circular to
angular, thin walled and compact.
These is a single, wide, bowl-shaped vascular strand which consists of
numerous, thin parallel files of angular, thick walled xylem elements lying on
the outer part of the xylem. The petiole is 1.2 mm in vertical and 2.3 mm in
horizontal planes. The vascular strand is 150 µm thick (Fig. 4).
Fig. 4. Microscopic features of petiole of S. kunthianus
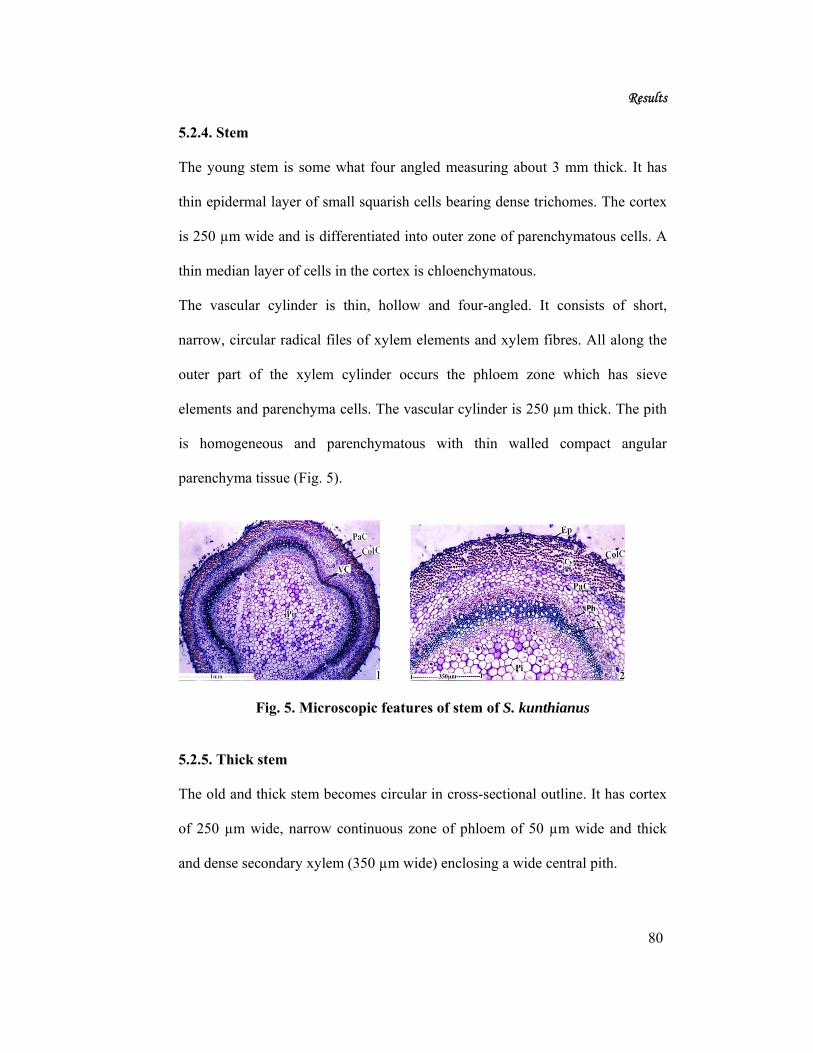
Results
80
5.2.4. Stem
The young stem is some what four angled measuring about 3 mm thick. It has
thin epidermal layer of small squarish cells bearing dense trichomes. The cortex
is 250 µm wide and is differentiated into outer zone of parenchymatous cells. A
thin median layer of cells in the cortex is chloenchymatous.
The vascular cylinder is thin, hollow and four-angled. It consists of short,
narrow, circular radical files of xylem elements and xylem fibres. All along the
outer part of the xylem cylinder occurs the phloem zone which has sieve
elements and parenchyma cells. The vascular cylinder is 250 µm thick. The pith
is homogeneous and parenchymatous with thin walled compact angular
parenchyma tissue (Fig. 5).
Fig. 5. Microscopic features of stem of S. kunthianus
5.2.5. Thick stem
The old and thick stem becomes circular in cross-sectional outline. It has cortex
of 250 µm wide, narrow continuous zone of phloem of 50 µm wide and thick
and dense secondary xylem (350 µm wide) enclosing a wide central pith.

Results
81
The cortex is homogeneous having ellipitical tangentially stretched parenchyma
cells. Secondary phloem has wide angular sieve elements and phloem
parenchyma. Secondary xylem has narrow, circular thick walled vessels; they
are solitary and diffusely distributed. The vessels are up to 20 µm wide. Xylem
fibers are angular in sectional view, thick walled and lignified; they occur in
regular radial rows. Xylem rays are one cell thick and are straight. The rays cell
are also thick walled and lignified (Fig. 6).
Fig. 6. Microscopic features of thick stem of S. kunthianus 5.2.6. Root
The root has rough and uneven outer surface. Periderm is seen at discontinuous
places and it is not continuous. The cortex has outer zone of circular, wide, less
compact parenchyma cells; the liner zone of cortex has wide gaps of empty
chambers and the cells further towards interior are nitaet, elliptical and compact.
Secondary phloem is narrow and continuous. It has large, radial files of phloem
elements (Fig. 7).

Results
82
Fig. 7. Microscopic features of root of S. kunthianus
5.2.7. Secondary xylem
Secondary xylem has dense, diffuse wide, circular vessels distributed among
thick walled fibers. The diameter of the vessels increase gradually towards the
periphery and it measures 40 µm wide. The pith is narrow and nitaet. It is
parenchymatous, comprises of thin walled circular compact cells (Fig. 8).
Fig. 8. Microscopic features of xylem and pith of S. kunthianus

Results
83
5.2.8. Venation
The secondary and tertiary veins are thin and less prominent. The venation
system is obscured blue to dense outgrowth of the epidermal trichomes. The
vein-islets are wide and polygonal in outline. Distinct vein-terminations are not
evident (Fig. 9).
Fig. 9. Microscopic features of vein of S. kunthianus 5.3. POWDER MICROSCOPY
The powder exhibits fibers and vessel elements. The vessel elements are long,
narrowly cylindrical and have long or short tails. The elements are 600-650 µm
long. They have simple, oblique perforatious at the ends. The lateral walls have
wide, circular, alternate pits.
The fibers are liberiforus type, having thick lignified walls. They are narrow
with pointed ends and narrow lumens. The lumen is 10 µm in wide. These are
also septate fibers, which have wide lumen and thin septa; cell inclusions are
often seen in the septate fibers. The septate fibers are 20 µm wide.

Results
84
Cystoliths are frequently seen in the powder. They are narrow, elongated, and
blunt at one end and pointed at other. The surface is warty. The cytolith is 60 µm
thick and 700 µm long (Fig. 10).
Fig. 10. Powder microscopy of S. kunthianus

Results
85
5.4. PHYSICOCHEMICAL CONSTANT
The percentage yield of different types of ash and extractive values of flowers,
root, stem and leaves of S. kunthianus powdered material are given in the
Table 7. The total ash, water soluble ash, sulphated ash and alcohol soluble
extractive values of the leaves of S. kunthianus were found to be high when
compared to the other plant materials. The acid insoluble ash was found to be
high in root and water soluble extractive value in flowers.
Table 7. Physicochemical constants of S. kunthianus
S. No Plant materials
Ash values (% w/w) Extractive values % w/w
Total ash
Acid Insoluble
ash
Water Soluble
ash
Sulphated ash
Alcohol soluble
Water soluble
1 Flower 6.61 ± 0.03
0.08 ± 0.01
1.52 ± 0.14
0.12 ± 0.01
1.02 ± 0.05
10.32 ± 0.08
2 Root 5.10 ± 0.13
2.06 ± 0.02
0.76 ± 0.05
0.23 ± 0.02
1.09 ± 0.04
2.30 ± 0.06
3
Stem 2.99 ± 0.02
1.40 ± 0.02
0.38 ± 0.04
1.11 ± 0.06
0.73 ± 0.05
5.14 ± 0.09
4 Leaf 20.49 ± 0.31
1.06 ± 0.03
4.05 ± 0.10
3.22 ± 0.09
1.64 ± 0.12
3.43 ± 0.03
Average of three determinations, mean ± SEM.
5.5. PRELIMINARY PHYTOCHEMICAL STUDIES
In the Preliminary phytochemical studies, the successive petroleum ether and
chloroform extracts of stem and root were found to contain phenolics, steroids
and triterpenoids. The successive ethyl acetate and methanol extracts of stem
were found to contain flavonoids, glycosides and phenolics. These two solvent
extracts in root showed the presence of glycosides, phenolics, and saponins. The
macerated methanolic leaves extract showed the presence of glycosides,

Results
86
phenolics, steroids, triterpenoids and tannins. Along with these alkaloids,
flavonoids, saponins and tannins were found to be present in macerated and
crude methanol extracts of the flowers. The crude methanol extracts of the stem
and the leaves contain glycosides, phenolics, steroids and triterpenoids. The
crude methanol extract of the root showed the presence of flavonoids, glycosides
and phenolics.
The total phenol content of the crude methanol extract of the flowers was found
to be high among all the extracts i.e. 173.90 ± 1.67. The ethyl acetate extract of
the successive root extract, crude methanol extract of the stem and macerated
methanol extract of the flowers showed the phenol content as 131.40 ± 0.98,
128. 50 ± 0.97 and 125. 60 ± 1.93. The total phenol content in the petroleum
ether extract of the stem and methanol extracts of the leaves were found to be the
lowest (Tables 8 and 9).

Results
87
Table 8. Percentage yield and qualitative phytochemical analysis of successive extracts of stem and
root of S. kunthianus
Extract Nature
% Yield
Phytoconstituents
Alk
aloi
ds
Flav
onoi
ds
Gly
cosi
des
Phen
olic
s
Sapo
nins
Ster
oids
Tri
terp
enoi
ds
Tan
nins
Tot
al P
heno
l
mg/
ga,b
Successive stem extracts
Petroleum ether Greenish yellow powder 3.00 - - - + - + + - 14.66 ± 0.03
Chloroform Dark green sticky 0.95 - - - + - + + - 36.68 ± 1.95
Ethyl acetate Dark green sticky 0.60 - + + + - - - - 29.50 ± 0.98
Methanol Greenish black sticky 2.95 - + + + - - - + 106.30 ± 0.38
Successive root extracts
Petroleum ether Yellowish white powder 3.20 - - - + - + + - 21.25 ± 0.97
Chloroform Pale brown sticky 1.10 - - - + + + + - 56.04 ± 1.02
Ethyl acetate Reddish brown sticky 0.90 - - + + + - + - 131.40 ± 0.98
Methanol Brown semi solid 2.42 - - + + + - - - 102.40 ± 1.92aAverage of six determinations, mean ± SEM , expressed as bgallic acid, equivalent in mg/g of the extract
+ : present , - : absent
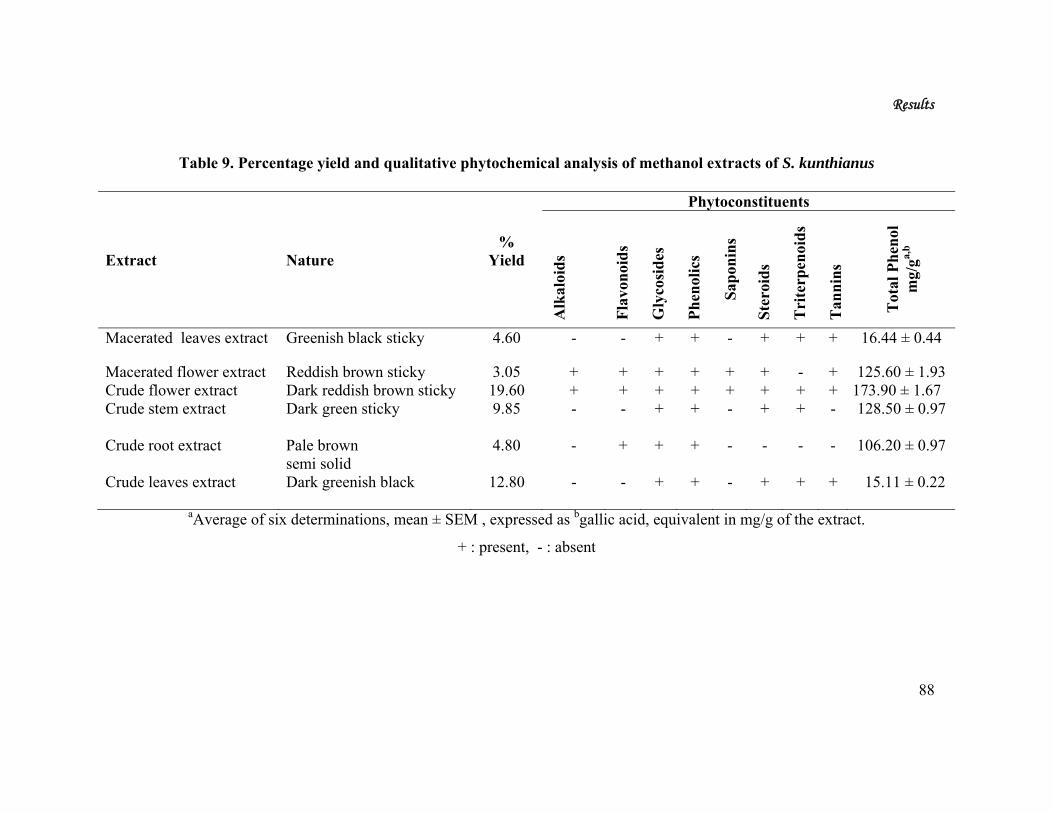
Results
88
Table 9. Percentage yield and qualitative phytochemical analysis of methanol extracts of S. kunthianus
aAverage of six determinations, mean ± SEM , expressed as bgallic acid, equivalent in mg/g of the extract.
+ : present, - : absent
Extract Nature %
Yield
Phytoconstituents
Alk
aloi
ds
Flav
onoi
ds
Gly
cosi
des
Phen
olic
s
Sapo
nins
Ster
oids
Tri
terp
enoi
ds
Tan
nins
Tot
al P
heno
l m
g/ga,
b
Macerated leaves extract Greenish black sticky 4.60 - - + + - + + + 16.44 ± 0.44
Macerated flower extract Reddish brown sticky 3.05 + + + + + + - + 125.60 ± 1.93 Crude flower extract Dark reddish brown sticky 19.60 + + + + + + + + 173.90 ± 1.67 Crude stem extract Dark green sticky 9.85 - - + + - + + - 128.50 ± 0.97
Crude root extract Pale brown
semi solid 4.80 - + + + - - - - 106.20 ± 0.97
Crude leaves extract Dark greenish black 12.80 - - + + - + + + 15.11 ± 0.22

Results
89
5.6. ISOLATION OF PHYTOCONSTITUENTS
5.6.1. Column chromatography of Petroleum ether root and stem extract 5.6.1.1. Compounds 1 and 3 (GS 1, PES 1)
5.6.1.1.1. Homogeneity
The homogeneity of compounds GS 1 and PES 1 were proved by a single spot
on TLC using silica gel G as adsorbent and solvent mixtures of different
polarities as developers. The solvent systems used and the corresponding Rf
values are given in Table 10.
Table 10. TLC profile of compounds GS1 and PES 1
Mobile Phase Solvent ratio Rf value
Chloroform: ethyl acetate 68:32 0.57
Toluene: ethyl acetate 82:18 0.49
Petroleum ether: acetone 85:15 0.30
Dichloromethane: methanol 95:05 0.65
5.6.1.1.2. Color Reaction
The compound exhibited positive response for anisaldehyde-sulfuric acid
reagent indicating its triterpenoid nature.
5.6.1.1.3. Melting point of compound
The melting point of compound was found to be 213 ºC.
5.6.1.1.4. Spectral studies
The 1H NMR spectra displayed a one proton multiplet at δ 3.20 is
assignable to H-3 on the basis of biogenetic analogy (Fig. 11). The 1H/1H-

Results
90
COSY experiment exhibited the coupling between H-3 with H-2α (1.59 ppm)
and H-2β (1.30 ppm) indicating that the hydroxyl group is at C-3 (Fig. 12). The
seven methyl groups resonated at δ 1.70 (H-30), 1.01 (H-28), 0.95 (H-26), 0.93
(H-23), 0.81 (H-27), 0.77 (H-24), and 0.75 (H-25). The presence of two doublets
at δ 4.60 and 4.70 each integrating for one proton was attributed to methylene
group at C-20. The multiplet at δ 2.40 for one proton is assigned to H-18. The
assignments were made based on the HSQC experiments (Fig. 14).
The 13C NMR and INEPT experiments showed the presence of 30 carbon atoms
consisting of six quaternary carbons, six methine, eleven methylene carbons and
seven methyl groups (Fig. 13). The signals at δ 109.31 and 150.98 indicates the
presence of a C=C group out of which one is a quaternary carbon and the other is
a carbon of a vinyl methylene group. The signal at δ 79.04 is attributed to C-3.
The signals at δ 27.95, 19.31, 18.00, 16.17, 16.05, 15.43 and 15.29 were due to
the presence of seven methyl groups in the compound. The other signals in
accordance with the proposed structure of the compound which was identified as
lupeol (Fig. 15).
Fig. 11. 1H NMR of compound GS 1
HO
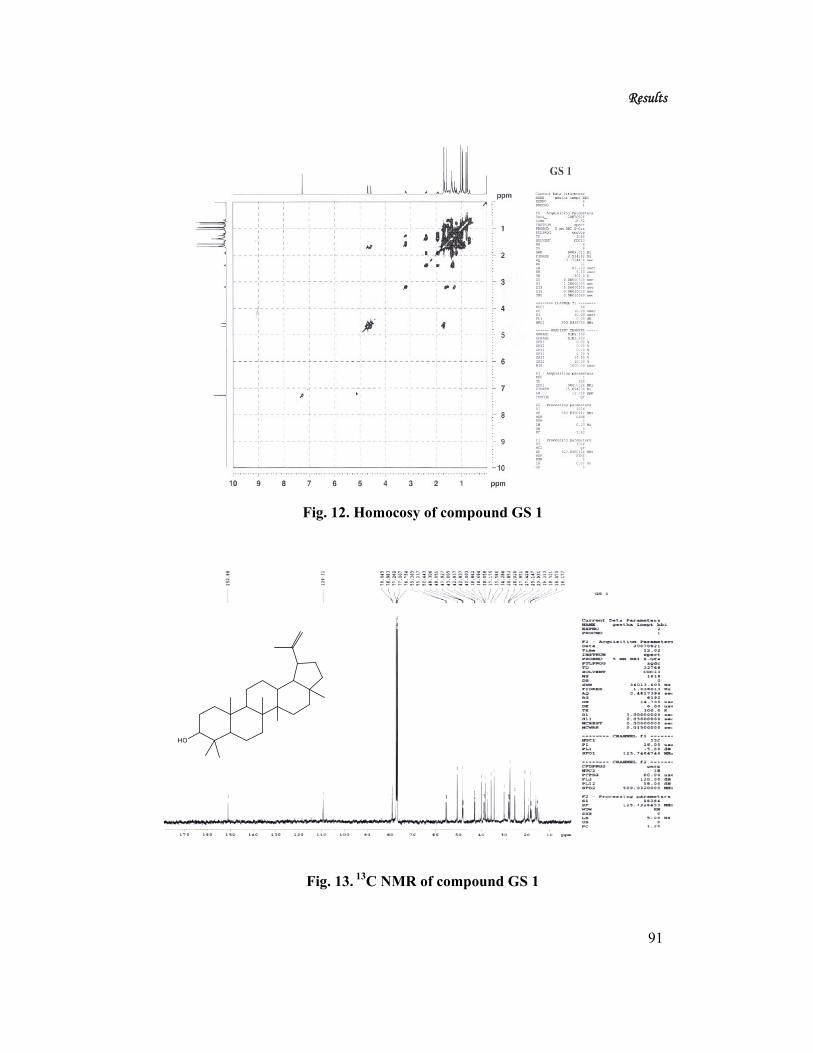
Results
91
Fig. 12. Homocosy of compound GS 1
Fig. 13. 13C NMR of compound GS 1
HO

Results
92
Fig. 14. Heterocosy of compound GS 1
Fig. 15. GS 1 and PES 1 (Lupeol)
HO

Results
93
5.6.1.2. Compound 2 (GS 2)
5.6.1.2.1. Homogeneity
The homogeneity of compound GS 2 was proved by a single spot on TLC using
silica gel G as adsorbent and solvent mixtures of different polarities as
developers. The solvent systems used and the corresponding Rf values are given
in Table 11.
Table 11. TLC profile of compound GS 2
Mobile Phase Solvent ratio Rf value
Chloroform: ethyl acetate 68:32 0.85
Toluene: ethyl acetate 82:18 0.78
Petroleum ether: acetone 85:15 0.62
Dichloromethane: methanol 95:05 0.70
5.6.1.2.2. Color reaction
The compound exhibited positive response for anisaldehyde-sulfuric acid
reagent indicating its triterpenoid nature.
5.6.1.2.3. Melting point of compound
The melting point of compound was found to be 252 ºC.
5.6.1.2.4. Spectral studies
The 1H NMR spectra displayed a one proton multiplet at δ 3.19 is assignable to
H-3 on the basis of biogenetic analogy. The six methyl groups resonated at
δ 1.68 (H-30), 1.02 (H-26), 0.98 (H-23), 0.97 (H-27), 0.82 (H-24) and 0.76
(H-25). The presence of two doublets at δ 4.60 and 4.70 each integrating for one

Results
94
proton were attributed to methylene group at C-20. The multiplet at δ 2.40 for
one proton is assigned to H-18. The pair of doublet signals at δ 3.80 and 3.32
each integrating for one proton was assigned to H-28 (Fig. 16).
The 13C NMR and INEPT experiments showed the presence of 30 carbon atoms
consisting of six quaternary carbons, six methine, twelve methylene carbons and
six methyl groups. The signals at δ 109.68 and 150.98 indicates the presence of
a C=C group out of which one is a quaternary carbon and the other is a carbon of
a vinyl methylene group. The signal at δ 78.98 is attributed to C-3. The signals
at δ 27.97, 19.07, 16.10, 15.97, 15.35 and at δ 14.75 were due to the presence of
six methyl groups in the compound (Fig. 17 and 18). The signal at δ 60.56 is
due to a hydroxy methylene carbon atom (C-28). The other signals are in
accordance with the proposed structure of the compound which was identified as
betulin (Fig. 19).
Fig. 16. 1H NMR of compound GS 2
H O
O H

Results
95
Fig. 17. 13C NMR of compound GS 2
Fig. 18. DEPT of compound GS 2
Fig. 19. GS 2, Betulin
HO
OH
HO
OH
H O
O H

Results
96
5.6.1.3. Column chromatography of chloroform stem extract
5.6.1.3.1. Compound 4 (SC 1)
5.6.1.3.1.1. Homogeneity
The homogeneity of compound SC1 was proved by a single spot on TLC using
silica gel G as adsorbent and solvent mixtures of different polarities as
developers. The solvent systems used and the corresponding Rf values are given
in Table 12.
Table 12. TLC profile of compound SC1
Mobile Phase Solvent ratio Rf value
Petroleum ether: ethyl acetate 90:10 0.47
Chloroform: methanol 98:02 0.69
Petroleum ether: acetone 95:05 0.30
n-hexane: ethyl acetate 80:20 0.51
5.6.1.3.1.2. Melting point of compound
The melting point of compound was found to be 118 ºC.
5.6.1.3.1.3. Spectral studies
In its 1H NMR it showed a triplet at δ 0.93 indicating a methyl group which is
adjacent to a methylene group. There is a strong singlet at δ 1.29 indicating the
presence of a long chain methylene groups. The singlets at δ 2.10 and 2.20
indicate the presence of four methylene groups attached to four carbonyl groups.
The strong singlet at δ 2.70 for 24 protons shows the presence of eight methyl
groups attached to nitrogen atoms (Fig. 20).

Results
97
The 13C NMR spectrum showed a signal at δ 13.99 indicating the presence of
only one methyl group. The signal at δ 29.55 supports above interpretations that
the compound contains long chain methylene carbon atoms. The strong signal at
δ 40.91 confirms the presence of methyl groups attached to nitrogen atom and all
the methyl groups are in the same environment (Fig. 21).
The above data suggests that the compound may contain four N, N-dimethyl
acetamide groups (-CH2-CO-N (CH3)2) attached to two different methylene
groups as shown below.
(CH3)2N-CO-CH2-C- (-CH2-CO-N (CH3)2)
Since all similar groups are in the same environment these groups should be
attached to one carbon atom.
-CH- [C- (-CH2-CO-N (CH3)2)2]2
Two other valencies of this carbon atom have been satisfied by the long chain
methylene groups.
The Mass spectrum indicates that the base peak at m/z 83.44 suggests a
cyclohexane ring system. After that successive peaks differ by a mass unit of
14. The m/z 97.00, 111.29, 125.18, 139.07, 153.00, 166.85, 180.76, 194.70,
208.00, 222.50, 236.41, 250.40, 264.35, 278.18, 292.15, 306.08, 320.02, 334.93
and at 348.93 strongly supporting that the compound contains a long chain
methylene groups (Fig. 22).

Results
98
Fig. 20. 1H NMR spectrum of compound SC 1
Fig. 21. 13C NMR spectrum of compound SC 1
( H 2 C ) 1 1
C
( C H 2 ) 6
C H
( C H
C H 3
C N
O
C
O
N
C
O
N
C
O
N
( H 2 C ) 1 1
C
( C H 2 ) 6
C H
( C H
C H 3
C N
O
C
O
N
C
O
N
C
O
N

Results
99
Fig 22. Mass spectrum of compound SC 1
Based on the above facts the structure was proposed as below (Fig. 23).
Fig. 23. (SC 1) 3,5-bis (dimethyl carbamoyl) methyl-4- (11-cyclo
hexylundecyl)- 4-heptyl- N1,N1,N7,N7tetra methyl heptane diamide
(H2C)11
C
(CH2)6
CH
(CH
CH3
C N
O
C
O
N
C
O
N
C
O
N
(H2C)11
C
(CH2)6
CH
(CH
CH3
C N
O
C
O
N
C
O
N
C
O
N

Results
100
5.6.1.4. Column chromatography of macerated methanol flower extract
5.6.1.4.1. Compound 5 (GSMES 3)
5.6.1.4.1.1. Homogeneity
The homogeneity of compound GSMES 3 was proved by a single spot on TLC
using silica gel G as adsorbent and solvent mixtures of different polarities as
developers. The solvent systems used and the corresponding Rf values are given
in Table 13.
Table 13. TLC profile of compound GSMES 3
Mobile Phase Solvent ratio Rf value
Petroleum ether: chloroform 70:30 0.32
n-hexane: acetone 75:25 0.71
Petroleum ether: ethyl acetate 88:12 0.52
Toluene: ethyl acetate 60:40 0.82
5.6.1.4.1.2. Color Reaction
The compound exhibited positive response for anisaldehyde-sulfuric acid
reagent indicating its triterpenoid nature.
5.6.1.4.1. 3. Melting point of compound: The melting point of compound was
found to be 180 ºC.
5.6.1.4.1.4. Spectral studies
The 1H NMR spectra exhibited two doublets at δ 0.85 and 0.93 (each 3H, H-29
and H-30), and six singlets at δ 1.25 (3H, H-23), 1.16 (3H, H-26), 0.86 (3H, H-
27), 0.84 ( 3H, H-28), 0.82 (3H, H-25) and 0.70 ( 3H, H-24) indicating the
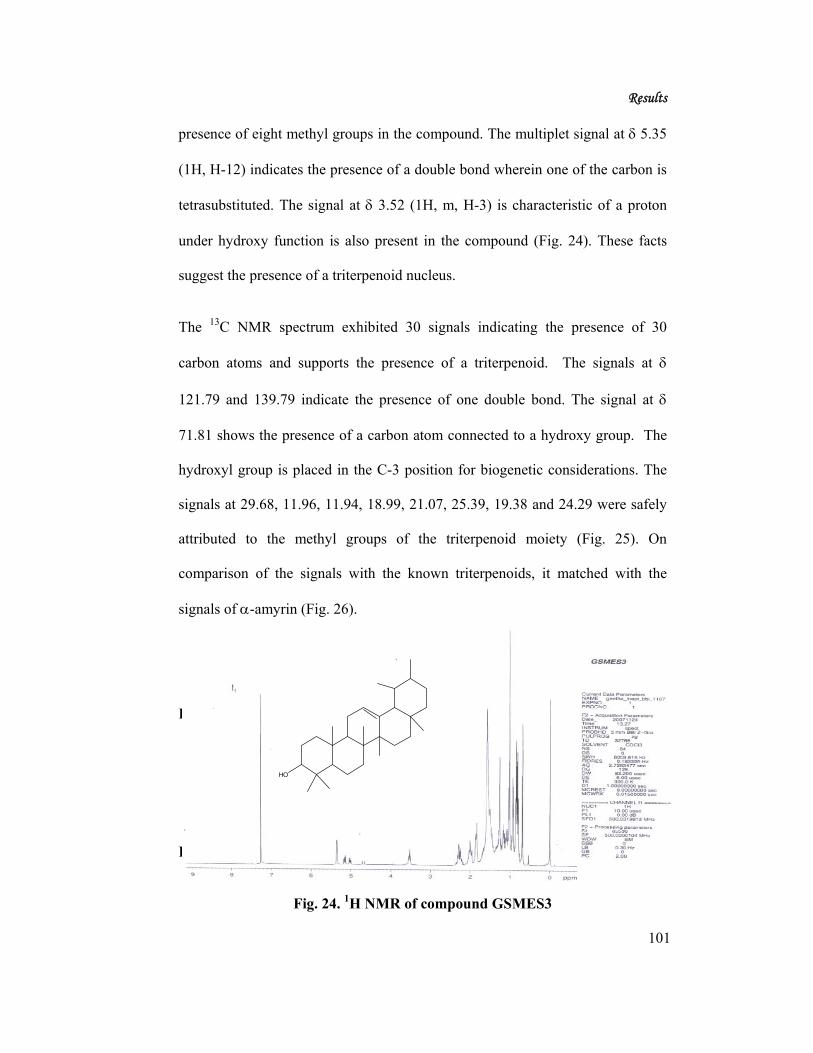
Results
101
presence of eight methyl groups in the compound. The multiplet signal at δ 5.35
(1H, H-12) indicates the presence of a double bond wherein one of the carbon is
tetrasubstituted. The signal at δ 3.52 (1H, m, H-3) is characteristic of a proton
under hydroxy function is also present in the compound (Fig. 24). These facts
suggest the presence of a triterpenoid nucleus.
The 13C NMR spectrum exhibited 30 signals indicating the presence of 30
carbon atoms and supports the presence of a triterpenoid. The signals at δ
121.79 and 139.79 indicate the presence of one double bond. The signal at δ
71.81 shows the presence of a carbon atom connected to a hydroxy group. The
hydroxyl group is placed in the C-3 position for biogenetic considerations. The
signals at 29.68, 11.96, 11.94, 18.99, 21.07, 25.39, 19.38 and 24.29 were safely
attributed to the methyl groups of the triterpenoid moiety (Fig. 25). On
comparison of the signals with the known triterpenoids, it matched with the
signals of α-amyrin (Fig. 26).
Fig 23.
Fig 24.
Fig. 24. 1H NMR of compound GSMES3
HO

Results
102
Fig. 25. 13C NMR of compound GSMES3
Fig. 26. (GSMES 3) α-amyrin
HO
HO

Results
103
5.6.1.4.2. Compound 6 (G 1)
5.6.1.4.2.1. Homogeneity
The homogeneity of compound G 1 was proved by a single spot on TLC using
silica gel G as adsorbent and solvent mixtures of different polarities as
developers. The solvent systems used and the corresponding Rf values are given
in Table 14.
Table 14. TLC profile of compound G 1
Mobile Phase Solvent ratio Rf value
Chloroform: ethyl acetate 10:90 0.42
Toluene: ethyl acetate 20:80 0.61
Petroleum ether: acetone 65:35 0.80
5.6.1.4.2.2. Melting point of compound
The melting point of compound was found to be 132 ºC.
5.6.1.4.2.3. Spectral studies
The 1H NMR spectrum showed two doublet integrating for two protons each at δ
3.88 (H-2α, H-6α), and at 3.61 (H-2β, H-6β). It also exhibited a complex
multiplet of signals centered at δ 3.69 for three protons (H-3, H-4 and H-5).
The downfield signal of the H-4 may be due to the intramolecular hydrogen
bonding of the amino and hydroxyl group protons with each other (Fig. 27).
In the 1H/1H COSY spectrum the H-2α and H-6α protons showed cross peaks
with H-2β and H-6β respectively showing that they mutually couple with each
other. Cross peaks were observed between the H-3, H-4 and H-5 protons with

Results
104
the H-2 and H-6 protons showing that they couple with each other and thereby
suggesting that they are in adjacent positions (Fig. 28).
The 13C NMR spectrum exhibited only three signals indicating a highly
symmetrical environment in the molecule. The signals appeared at δ 63.30,
69.39 and 70.98 suggesting that all the carbon atoms are under hetero atoms (N
or O). The intensity of the peak at δ 63.30 is more than the other two peaks
indicating the presence of more than one carbon atom in that environment (Fig.
29). Further the DEPT 135 spectrum of this compound showed that only one
peak at δ 63.30 (methine carbons) is in the positive side and the other two
(methylene carbons) are in the negative side (Fig. 30).
Fig. 27. 1H NMR of compound G 1

Results
105
Fig. 28. Homocosy of G 1
Fig. 29. 13C NMR of compound G 1

Results
106
Fig. 30. DEPT of compound G 1
Based on the above facts the structure was proposed as below (Fig. 31).
Fig. 31. (G 1) 4-amino-tetrahydro-2H-pyran-3,5-diol

Results
107
5.6.1.5. Column chromatography of crude methanol flower extract
5.6.1.5.1. Compound 7 (CMF 1)
5.6.1.5.1.1. Homogeneity
The homogeneity of compound CMF 1 was proved by a single spot on TLC
using silica gel G as adsorbent and solvent mixtures of different polarities as
developers. The solvent systems used and the corresponding Rf values are given
in Table 15.
Table 15. TLC profile of compound CMF1
Mobile Phase Solvent ratio Rf value
Petroleum ether: chloroform 60:40 0.52
Petroleum ether: ethyl acetate 80:20 0.74
n-hexane: ethyl acetate 65:35 0.47
5.6.1.5.1.2. Color reaction
The isolated compound exhibited positive response for Libermann-Buchard’s
test and Salkowski test, indicating its steroidal nature.
5.6.1.5.1.3. Melting point of compound CMF1
The melting point of compound CMF 1 was found to be 138 ºC.
5.6.1.5.1.4. Spectral studies
1H and 13C NMR: Its NMR spectrum displayed signals for two tertiary methyl
groups at δ 0.70 (s, 3H, C-18) and δ 1.01(s, 3H, C-19, Fig. 32). Three secondary
methyl groups at δ 0.94 (d, 3H, Me-21), 0.82 (d, 3H, Me-26), 0.85 (d, 3H, Me-
27) and a primary methyl group at δ 0.88 (t, 3H, Me-29). The broad multiplet

Results
108
signal at δ 5.35 (1H, m) was attributed to H-6 and the hydroxy methine proton
signal at δ 3.52 (1H, m) was attributed to H-3 for biogenetic considerations.
1H NMR, δ (ppm): 0.70 (s, 3H, C-18). 0.82 (d, 3H, J = 6.4 Hz, Me-26), 0.85 (d,
3H, J = 6.4 HZ, Me- 27), 0.88 (t, 3H, J =7.5 Hz, Me-29), 0.94 (d, 3H, J = 6.5 Hz,
Me-21), 1.01 (s, 3H, C-19), 3.52 (m, 1H, C-3), 5.35 (m, 1H, C-6) (Fig. 32 and
33). The 1H NMR and 13C NMR values are in agreement with β-sitosterol.
Fig. 32. 1H NMR spectrum of compound CMF 1

Results
109
Fig. 33. 13C NMR spectrum of compound CMF 1
Fig. 34. (CMF 1) β- sitosterol
HO
HO
Results
110
5.6.1.5.2. Compound 8 (CMF 2)
5.6.1.5.2.1. Homogeneity
The homogeneity of compound CMF 2 was proved by a single spot on TLC
using silica gel G as adsorbent and solvent mixtures of different polarities as
developers. The solvent systems used and the corresponding Rf values are given
in Table 16.
Table 16. TLC profile of compound CMF 2
Mobile Phase Solvent ratio Rf value
Dichloro methane: acetone 82:18 0.66
n-hexane: ethyl acetate 50:20 0.57
Chloroform: ethanol 90:10 0.46
5.6.1.5.2.2. Melting point of compound CMF 2
The melting point of compound CMF 2 was found to be 87 ºC.
5.6.1.5.2.3. Spectral studies
The 1H NMR exhibits a multiplet at δ 5.3 for one proton indicating that one of
the carbon atoms is tetra substituted. The 13C NMR spectra of the compound
CMF 2 exhibits two signals at δ 118.21 and 142.58 (C-11, C-12) in the
unsaturated region of the spectrum indicating that there is only one double bond
in the compound. In 13C NMR it exhibits signals at δ 75.21 (C-3) and 61.19 (C-
24) indicating two carbon atoms attached to oxygen function. The former signal
at δ 75.21 appears to be a signal of a methine carbon which is esterified.

Results
111
Accordingly, the carbonyl carbon appears at δ 173.76. Consistently, its PMR
signal appears as a multiplet at downfield region δ 4.0 for one proton. The latter
signal at δ 61.19 appears to be of a hydroxy methyl signal. In the PMR spectrum
corresponding methylene protons appears in the downfield region at δ 4.8 (m,
1H, H-24) and 4.5 (m, 1H, H-24) each for one proton. This signal can go down
only if the hydroxyl group is hydrogen bonded with the carbonyl group. Due to
hydrogen bonding it will reduce the electron density in the C-24 carbon and the
signals go downfield. This suggests that the carbonyl group and the hydroxy
methyl group are nearby each other. There is no signal in between δ 40 and 60
in the 13C NMR. The presence of a methyl group in the C-5 position makes the
carbon C-4 electron rich and the signal moves towards up field region and
appears at δ 39.98. For similar reasons the long hydrocarbon chain which
contains the double bond is connected to C-6. Since there is no other functional
group is found in the compound the methyl group at C-11 makes it tetra
substituted. To avoid the signals of C-10 and C-13 to go downfield region
methyl groups were placed at C-9 and C-13 (Fig. 35 and 36). All the other
signals are in accordance with the structure. The mass spectrum also confirms
the long chain hydro carbon (Fig. 37).

Results
112
Fig. 35. 1H NMR spectrum of compound CMF 2
Fig. 36. 13C NMR spectrum of compound CMF 2
O
O
OH
H
O
O
OH
H

Results
113
Fig. 37. Mass spectrum of compound CMF 2
Based on the above facts the structure was proposed as below (Fig. 38).
Fig. 38. (CMF 2) 2-(2-hydroxyethyl)-3-methyl-4-[(E)-3, 4, 6-trimethyl
undec-4-ethyl] cyclohexyl propionate
O
O
OH
H
O
O
OH
H

Results
114
5.6.1.5.3. Compound 9 (CMF 5)
5.6.1.5.3.1. Homogeneity
The homogeneity of compound CMF 5 was proved by a single spot on TLC
using silica gel G as adsorbent and solvent mixtures of different polarities as
developers. The solvent systems used and the corresponding Rf values are given
in Table 17.
Table 17. TLC profile of compound CMF 5
Mobile Phase Solvent ratio Rf value
Chloroform: methanol: water 50:45:5 0.72
Ethyl acetate: methanol 70:30 0.63
Chloroform: methanol: formic acid 60:38:2 0.47
5.6.1.5.3.2. Melting point of compound CMF5
The melting point of compound CMF 5 was found to be 256 ºC.
5.6.1.5.3.3. Spectral studies
The 1H NMR spectrum exhibited a triplet at δ 1.10 and a methylene signal at δ
1.80 showing the presence of the aliphatic short chain system. The strong signal
at δ 2.50 for twelve protons suggests the presence of four methoxy groups. The
signals at δ 7.20 (1H, s, H-5’), 6.41 and 6.34 (d, 2H, H-2’, H-3’), 6.20 (1H, s, H-
6) and at δ 6.07 (1H, s, H-8) supports the presence of the flavanoid moiety. The
signals at δ 5.20 (1H) and 4.70 (2H) showed the presence of three anomeric

Results
115
protons. The complex of signals between δ 3.29 and 3.89 exhibits the presence
of three glucose units (Fig. 39).
The 13C NMR spectrum exhibited two signals at δ 182.32 and 175.15 showing
the presence of two carbonyl groups. The signals at δ 156.84, 159.57 (each for
two carbon atoms), 161.80 and 164.47 indicating the presence of phenolic
carbon atoms and the signals at 115.51, 120.88, 128.05, 102.58, 97.55 and 95.20
suggests the presence of a flavanoid nucleus. The signals at 102.31, 99.98 and
94.93 were characteristic of anomeric carbon atoms. In addition to this a couple
of signals between 60.66 and 80.55 indicate the presence of three glycosidic
moieties. The signals at δ 53.31 (for three carbons) and 59.16 suggest the
presence of four methoxy groups. One of the carbonyl group at δ 182.32 may be
assigned to the flavanoid nucleus. Apart from this the signals at δ 10.52, 33.10,
38.10 and 42.18 along with unassigned carbonyl signal indicates the presence of
a pentanoic acid moiety (Fig. 40 and 41).
The downfield signal at δ 128.04 shows that C-3 is substituted with oxygen
function. It is probable that the glucoside moieties are joined one after another at
C-3. Absence of phenolic protons in the 1H NMR spectrum and presence of
methoxy protons indicate that all the phenolic hydroxyl groups are substituted
with methoxy groups. Since all the positions are satisfied with protons and
methoxy groups, the probability of the attachment of the pentanoic acid group
may not be possible in the flavanoid nucleus. It can be safely placed at the end
of the glucosidic moiety.
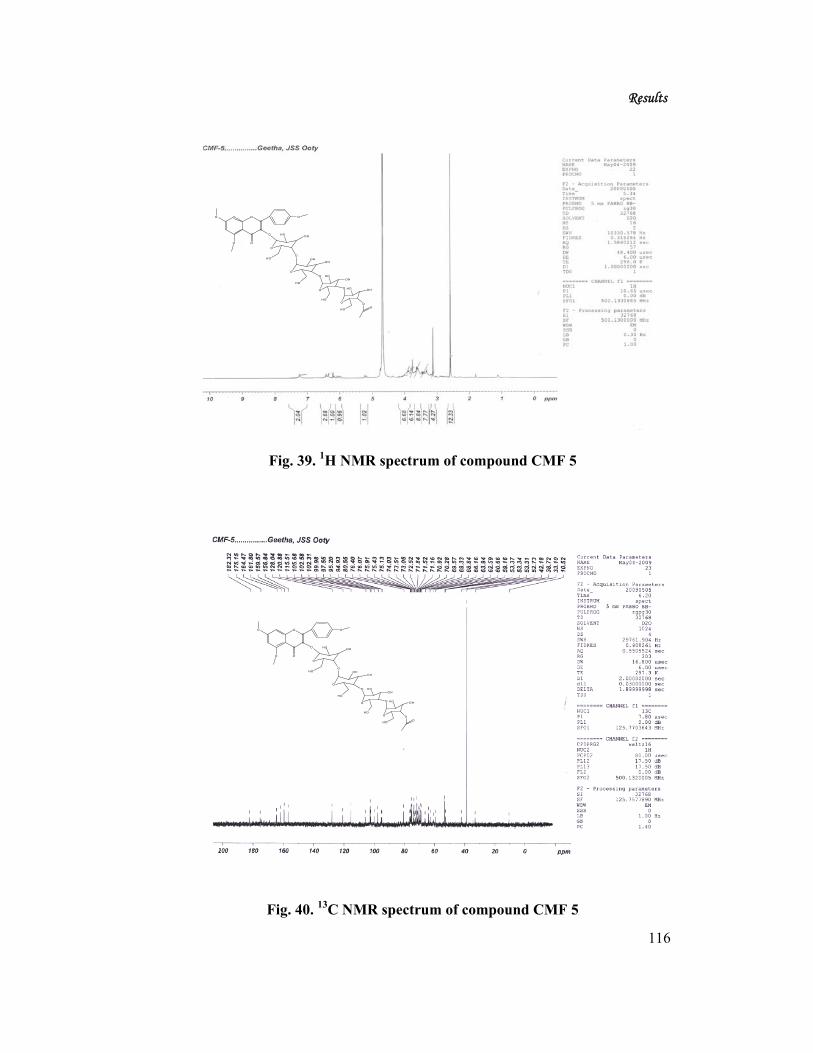
Results
116
Fig. 39. 1H NMR spectrum of compound CMF 5
Fig. 40. 13C NMR spectrum of compound CMF 5
O
O
O
O
O
O
HO
HO OH
O
O
OHO H
O
HO
O
O
HOO H
O
HOO
HO O H
O
HO O
O
O
O
O
O
O
HO
HO O H
O
O
O HO H
O
HO
O
O
HOO H
O
HOO
HO O H
O
HO O

Results
117
Fig. 41. DEPT of compound CMF 5
Hence, the structure was proposed as below (Fig. 42).
Fig. 42. (CMF 5) Flavone glycoside
O
O
O
O
O
O
HO
HO O H
O
O
O HO H
O
HO
O
O
HOOH
O
HOO
HO OH
O
HO O
O
O
O
O
O
O
HO
HO O H
O
O
O HO H
O
HO
O
O
H OO H
O
HOO
HO OH
O
HO O

Results
118
5.6.1.6. Solvent solvent extraction of macerated methanol leaves extract
5.6.1.6.1. Compound 10 (ML 1)
5.6.1.6.1.1. Homogeneity
The homogeneity of compound ML 1 was proved by a single spot on TLC using
silica gel G as adsorbent and solvent mixtures of different polarities as
developers. The solvent systems used and the corresponding Rf values are given
in Table 18.
Table 18. TLC profile of compound ML 1
Mobile Phase Solvent ratio Rf value
n-hexane: ethyl acetate 95:05 0.52
Petroleum ether: chloroform 60:40 0.74
Petroleum ether: ethyl acetate 75:25 0.64
5.6.1.6.1.2. Melting point of compound ML 1
The melting point of compound ML 1 was found to 136 ºC.
5.6.1.6.1.3. Spectral studies
The compound ML-1 in its 1H NMR spectrum exhibits a peak at δ 1.20
characteristic of the secondary and tertiary methyl groups. The strong singlet at
δ 1.60 is characteristic of methylene protons in a ring system. The signal at δ 2.2
is due to the methylene groups attached to a carbonyl group (Fig. 43).
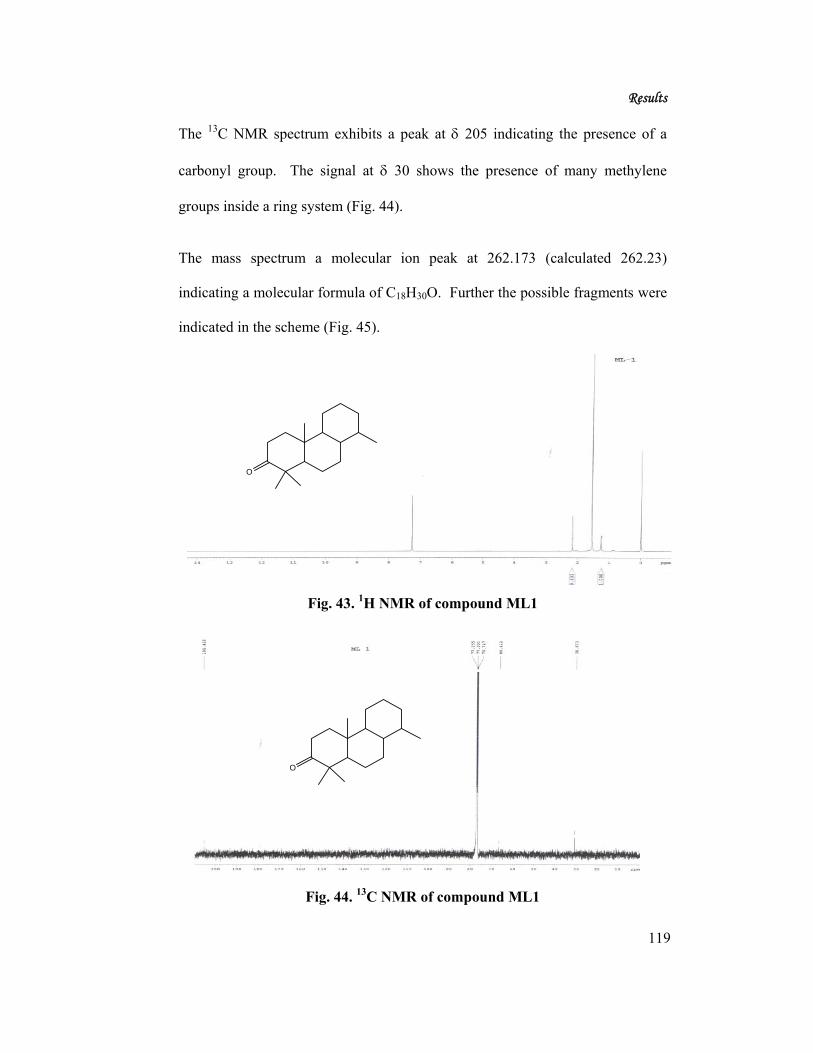
Results
119
The 13C NMR spectrum exhibits a peak at δ 205 indicating the presence of a
carbonyl group. The signal at δ 30 shows the presence of many methylene
groups inside a ring system (Fig. 44).
The mass spectrum a molecular ion peak at 262.173 (calculated 262.23)
indicating a molecular formula of C18H30O. Further the possible fragments were
indicated in the scheme (Fig. 45).
Fig. 43. 1H NMR of compound ML1
Fig. 44. 13C NMR of compound ML1
O
O
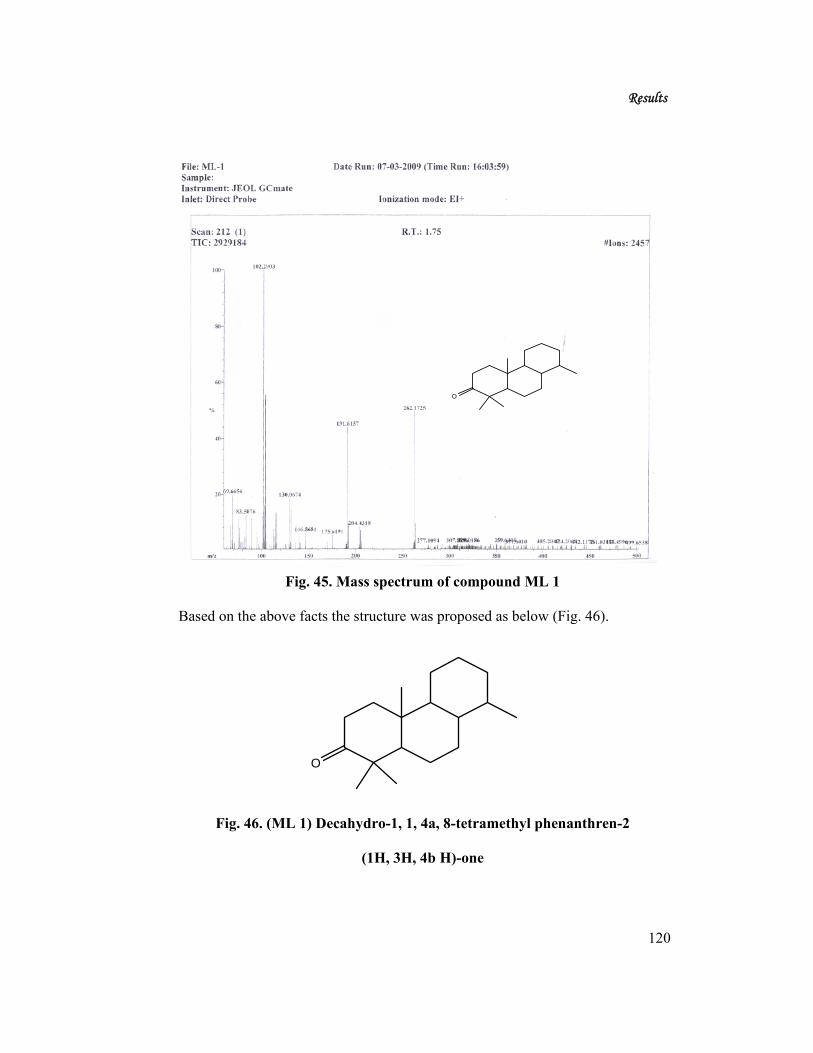
Results
120
Fig. 45. Mass spectrum of compound ML 1
Based on the above facts the structure was proposed as below (Fig. 46).
Fig. 46. (ML 1) Decahydro-1, 1, 4a, 8-tetramethyl phenanthren-2
(1H, 3H, 4b H)-one
O
O

Results
121
5.7. IN VITRO ANTIOXIDANT ACTIVITY
Among the four successive extracts of stem, the ethyl acetate extract showed
potent activity. The IC50 values in the DPPH and ABTS method were found to
be 19.97 ± 1.30 and 20.97 ± 1.74 µg/ml, respectively. However, the extract was
found to be less active than the standards used in all the seven methods (Table
19). Similarly, the ethyl acetate extract of the root showed better antioxidant
activity among the four successive extracts. The IC50 value in the ABTS method
was found to be 4.36 ± 0.38 µg/ml which was found to be less than the standard
ascorbic acid (10.92 ± 0.08 µg/ml) and more than the standard rutin (0.71 ± 0.02
µg/ml). However, in all the other methods the extracts showed high IC50 values
than the standards used indicating its less potency (Table 20).
Among the six methanol extracts, the macerated leaves, crude flowers, stem and
root extracts showed potent antioxidant activity in the ABTS method. The IC50
values were found to be lower than the standard ascorbic acid indicating their
potent activity than the standard ascorbic acid. However, the IC50 values were
found to be high compared to standard rutin indicating their lesser potency. The
crude flower extract also exhibited low IC50 values lower than the standards used
in p-NDA, deoxy ribose and H2O2 methods. The total antioxidant capacity was
also found to be higher than the standard α-tocopherol. The crude stem, root and
leaves extract also showed low IC50 values in H2O2 method which are
comparable to the IC50 values of the standards used. Similar results were
observed in the total anti oxidant capacity method. Except this, in all the other
methods all the extracts showed less activity than the standards used (Table 21).
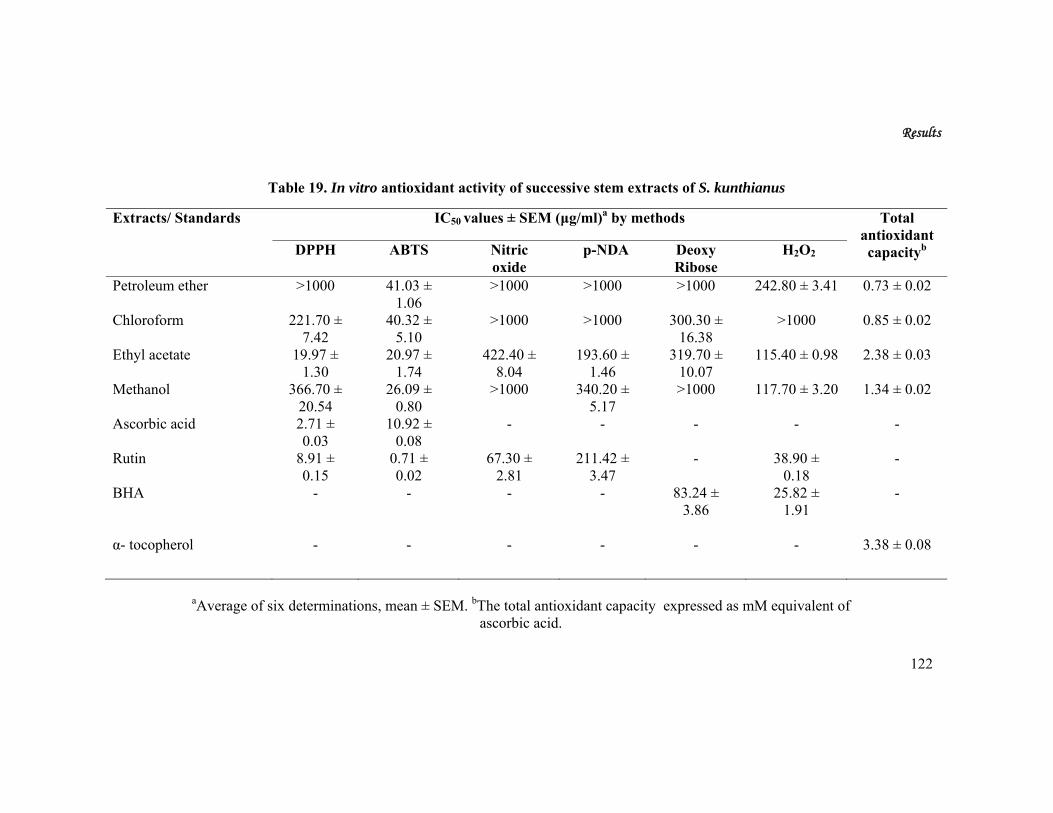
Results
122
Table 19. In vitro antioxidant activity of successive stem extracts of S. kunthianus
aAverage of six determinations, mean ± SEM. bThe total antioxidant capacity expressed as mM equivalent of
ascorbic acid.
Extracts/ Standards IC50 values ± SEM (μg/ml)a by methods Total antioxidant capacityb DPPH ABTS Nitric
oxide p-NDA Deoxy
Ribose H2O2
Petroleum ether >1000 41.03 ± 1.06
>1000 >1000 >1000 242.80 ± 3.41 0.73 ± 0.02
Chloroform
221.70 ± 7.42
40.32 ± 5.10
>1000 >1000 300.30 ± 16.38
>1000 0.85 ± 0.02
Ethyl acetate 19.97 ± 1.30
20.97 ± 1.74
422.40 ± 8.04
193.60 ± 1.46
319.70 ± 10.07
115.40 ± 0.98 2.38 ± 0.03
Methanol 366.70 ± 20.54
26.09 ± 0.80
>1000 340.20 ± 5.17
>1000 117.70 ± 3.20 1.34 ± 0.02
Ascorbic acid 2.71 ± 0.03
10.92 ± 0.08
- - - - -
Rutin 8.91 ± 0.15
0.71 ± 0.02
67.30 ± 2.81
211.42 ± 3.47
- 38.90 ± 0.18
-
BHA - - - - 83.24 ± 3.86
25.82 ± 1.91
-
α- tocopherol - - - - - - 3.38 ± 0.08

Results
123
Table 20. In vitro antioxidant activity of successive root extracts of S. kunthianus
Extracts/ Standards IC50 values ± SEM (μg/ml)a by methods Total antioxidant capacityb DPPH ABTS Nitric
oxide p-NDA Deoxy
Ribose H2O2
Petroleum ether >1000 42.32 ± 2.12 >1000 >1000 >1000 >1000 0.66 ± 0.01
Chloroform
>1000 28.83 ± 0.40 >1000 282.70 ± 4.38
581.70 ± 12.36
123.80 ± 0.90 2.25 ± 0.04
Ethyl acetate 92.52 ± 2.17 4.36 ± 0.38 217.82 ± 5.02 230.30 ± 5.73 224.10 ± 5.58
58.10 ± 0.98 2.99 ± 0.01
Methanol 163.40 ± 3.74 13.24 ± 0.31 825.70 ± 19.51
234.50 ± 5.30 594.30 ± 0.62
113.70 ± 2.27 2.64 ± 0.05
Ascorbic acid 2.71 ± 0.03
10.92 ± 0.08
- - - - -
Rutin 8.91 ± 0.15
0.71 ± 0.02
67.30 ± 2.81
211.42 ± 3.47
- 38.90 ± 0.18
-
BHA - - - - 83.24 ± 3.86
25.82 ± 1.91
-
α- tocopherol - - - - - - 3.38 ± 0.08
aAverage of six determinations, mean ± SEM. bThe total antioxidant capacity expressed as mM equivalent of ascorbic acid.

Results
124
Table 21. In vitro antioxidant activity of methanolic extracts of S. kunthianus
Extracts/ Standards IC50 values ± SEM (μg/ml)a by methods Total
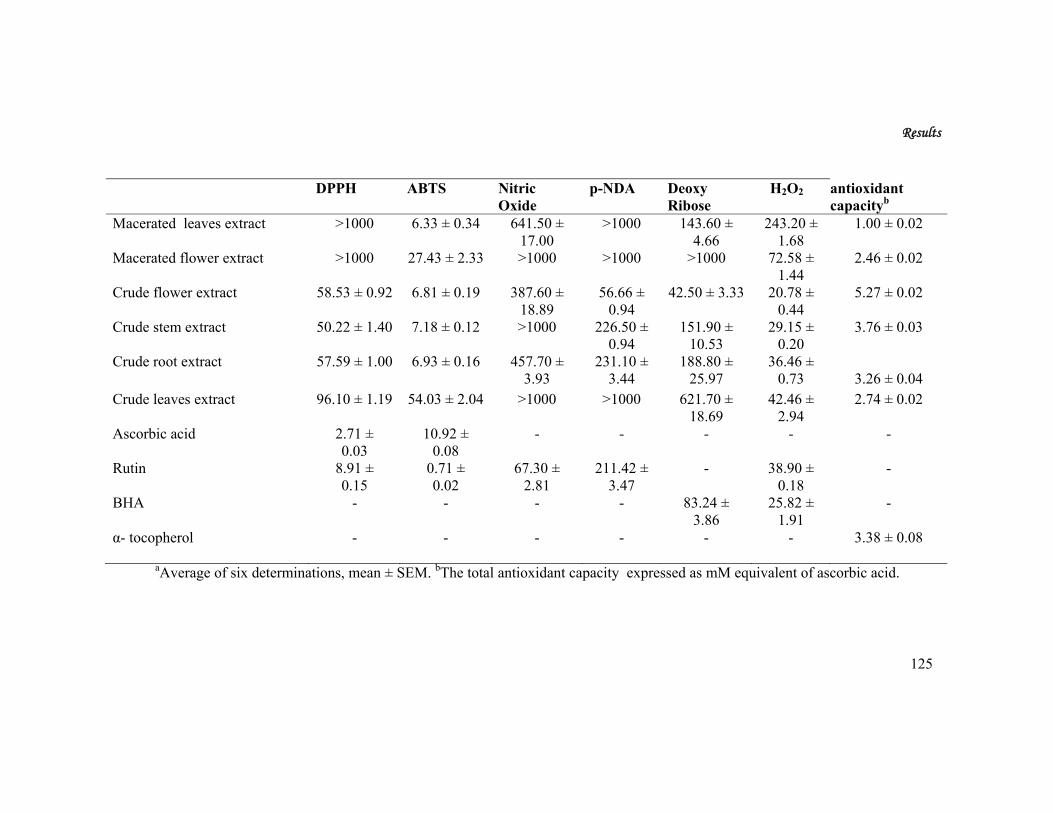
Results
125
aAverage of six determinations, mean ± SEM. bThe total antioxidant capacity expressed as mM equivalent of ascorbic acid.
DPPH ABTS Nitric Oxide
p-NDA Deoxy Ribose
H2O2 antioxidant capacityb
Macerated leaves extract >1000 6.33 ± 0.34 641.50 ± 17.00
>1000 143.60 ± 4.66
243.20 ± 1.68
1.00 ± 0.02
Macerated flower extract >1000 27.43 ± 2.33 >1000 >1000 >1000 72.58 ± 1.44
2.46 ± 0.02
Crude flower extract 58.53 ± 0.92 6.81 ± 0.19 387.60 ± 18.89
56.66 ± 0.94
42.50 ± 3.33 20.78 ± 0.44
5.27 ± 0.02
Crude stem extract 50.22 ± 1.40 7.18 ± 0.12 >1000 226.50 ± 0.94
151.90 ± 10.53
29.15 ± 0.20
3.76 ± 0.03
Crude root extract 57.59 ± 1.00 6.93 ± 0.16 457.70 ± 3.93
231.10 ± 3.44
188.80 ± 25.97
36.46 ± 0.73
3.26 ± 0.04
Crude leaves extract 96.10 ± 1.19 54.03 ± 2.04 >1000 >1000 621.70 ± 18.69
42.46 ± 2.94
2.74 ± 0.02
Ascorbic acid 2.71 ± 0.03
10.92 ± 0.08
- - - - -
Rutin 8.91 ± 0.15
0.71 ± 0.02
67.30 ± 2.81
211.42 ± 3.47
- 38.90 ± 0.18
-
BHA - - - - 83.24 ± 3.86
25.82 ± 1.91
-
α- tocopherol - - - - - - 3.38 ± 0.08

Results
126
5.8. IN VITRO CYTOTOXIC STUDIES
In the cytotoxicity studies, all the extracts of S. kunthianus shown CTC50 values
>100 μg/ml against Hep-2 and HeLa cell lines indicating their weak activity.
There is no cytotoxic effect with normal Vero cell lines indicating their safety.
5.9. PHARMACOLOGICAL SCREENING OF CRUDE EXTRACTS
5.9.1. Acute toxicity study of crude methanol extracts of S. kunthianus
In the acute toxicity studies, the crude methanol extracts of flower, stem, root
and leaves were found to be non toxic and no mortality was observed up to 15
days when administered separately as a single oral dose of up to 2000 mg/kg bw
and there were no gross findings of necropsy.
5.9.2. In vivo anti-inflammatory activity
All the crude methanol extracts were screened for acute anti-inflammatory
studies using standard experimental models.
The effect of the crude methanol extracts of flower, stem, root and leaves and
standard ibuprofen on carrageenan, formalin and histamine induced paw edema
at different time intervals are depicted in Tables 22-24. Oral administration of all
the extracts at 100 and 200 mg/kg bw produced a significant and dose dependent
inhibition paw edema after 1 to 3 h of treatment when compared to control in
carrageenan, formalin and histamine induced paw oedema methods. However,
the values were lesser than the standard ibuprofen when tested at 100 mg/kg bw.

Results
127
Among all the extracts screened for acute anti-inflammatory studies using
carrageenan, formalin and histamine induced methods, the crude methanol
flower extract showed a maximum paw edema inhibition in a dose dependent
manner. In carrageenan induced method, the percentage inhibitions of crude
methanol flower extract at 100 and 200 mg/kg bw after 1 to 3 h were 24.55 ±
1.50 to 42.70 ± 0.82 and 45.50 ± 1.25 to 58.90 ± 0.94, respectively. In formalin
induced paw edema, the percentage inhibitions of crude methanol flower extract
at 100 and 200 mg/kg bw after 1 to 3 h were 21.70 ± 1.17 to 40.50 ± 0.36 and
30.82 ± 0.63 to 50.76 ± 0.66, respectively. In the histamine induced paw edema,
the percentage inhibitions of crude methanol flower extract at 100 and 200
mg/kg bw after 1 to 3 h were found to be 19.92 ± 0.68 to 33.54 ± 0.61 and 30.10
± 0.67 to 52.99 ± 0.63, respectively (Tables 22-24). Hence, the crude methanol
flower extract was screened for sub chronic anti-inflammatory studies using
cotton pellet granuloma model.
In the cotton pellet method, crude methanol flower extract showed a dose
dependent reduction in both the transudative weight and granuloma tissue
formation which was found to be significant (p<0.001), when compared to
control. The percentage inhibition based on dry weight of the granuloma was
found to be 33.35 ± 0.94, 45.60 ± 1.50 and 53.10 ± 1.31 for the three doses 100,
150 and 200 mg/kg bw, respectively. However, anti-inflammatory activity of
crude methanol flower extract was less than the standard ibuprofen at 100 mg/kg
bw (Table 25).

Results
128
5.9.3. Analgesic activity by hot plate and tail immersion methods
In the analgesic activity by hot plate method, the crude methanol extract of
flower, root, stem and leaves increased their response time dose dependently and
significantly, when tested at 100 and 200 mg/kg bw doses. Among the four
extracts the flower extract was found to be more potent. The percentage
protection at 100 mg/kg bw during 30 to 90 min durations ranged between 60.96
to 173.10%. These values at 200 mg/kg bw were found to be 112.92 to 233.30%.
The maximum activity was found to be at 90 min. the leaves extract was found
to be the least potent. However, the standard ibuprofen at 100 mg/kg bw
produced better activity at all the durations than the extracts (Table 26).
In the tail immersiom method, all the extracts at both the doses showed
significant and dose dependant protection indicating their analgesic activity. The
crude methanol flower extract at 200 mg/kg bw showed the maximum activity.
The percentage protection at 1, 2 and 3 h was found to be 104.55, 180.21 and
250.76, respectively. However, the standard ibuprofen at 100 mg/kg bw
exhibited better results than the extracts. The leaves extract was found to be the
least active (Table 27).

Results
129
Table 22. Anti-inflammatory activity of crude methanol extracts of S. kunthianus in carrageenan induced paw oedema method
Treatments
Dose
(mg/kg)
1 h 2 h 3 h Paw volume
(ml) % Inhibition Paw volume
(ml) % Inhibition Paw volume
(ml) % Inhibition
Control - 0.34 ± 0.00 - 0.59 ± 0.00 - 0.73 ± 0.00 -
Ibuprofen 100
0.19 ± 0.01a 43.79 ± 1.71 0.20 ± 0.01b 65.62 ± 0.81 0.21 ± 0.01b 71.69 ± 0.84
Crude flower extract 100 0.26 ± 0.01a 24.55 ± 1.50 0.36 ± 0.00b 38.10 ± 0.72 0.42 ± 0.00b 42.70 ± 0.82
200 0.18 ± 0.00a 45.50 ± 1.25 0.26 ± 0.00b 56.30 ± 0.84 0.30 ± 0.01b 58.90 ± 0.94
Crude root extract
100 0.27 ± 0.01a 21.10 ± 1.70 0.43 ± 0.00b 27.27 ± 0.36 0.45 ± 0.01b 38.59 ±1.14
200 0.23 ± 0.01a 33.43 ± 1.70 0.34 ± 0.01b 42.32 ± 1.02 0.39 ± 0.00b 47.04 ± 0.46
Crude stem extract 100 0.27 ± 0.01a 20.61 ± 1.41 0.44 ± 0.00b 24.43 ± 0.57 0.50 ± 0.00b 31.74 ± 1.08
200 0.22 ± 0.01a 35.41 ± 2.69 0.39 ± 0.00b 34.37 ± 0.73 0.45 ± 0.00b 38.59 ± 0.82
Crude leaves extract
100 0.28 ± 0.01a 16.67 ± 1.78 0.47 ± 0.00b 19.88 ± 1.46 0.51 ± 0.01b 29.91 ± 0.65
200 0.25 ± 0.00a 26.53 ± 0.91 0.41 ± 0.01b 30.39 ± 0.81 0.42 ± 0.01b 42.24 ± 0.65
Values are given as mean ± S.E.M. for groups of six animals each; values are statistically significant at ap<0.01 and bp< 0.001.
Control Vs treated groups.

Results
130
Table 23. Anti-inflammatory activity of crude methanol extracts of S. kunthianus in formalin induced paw edema method
Values are given as mean ± S.E.M. for groups of six animals each; values are statistically significant at ap< 0.001. Control Vs
treated groups.
Treatments
Dose
(mg/kg)
1 h 2 h 3 h Paw volume
(ml) % Inhibition Paw volume
(ml) % Inhibition Paw volume
(ml) % Inhibition
Control - 0.53 ± 0.00 - 0.74 ± 0.01 - 0.86 ± 0.01 -
Ibuprofen 100
0.33 ± 0.00a 38.65 ± 0.81 0.33 ± 0.00a 55.40 ± 0.49 0.33 ± 0.00a 62.02 ± 0.49
Crude flower extract 100 0.40 ± 0.01a 21.70 ± 1.17 0.50 ± 0.00a 31.96 ± 0.58 0.51 ± 0.00a 40.50 ± 0.36
200 0.37 ± 0.00a 30.82 ± 0.63 0.41 ± 0.01a 44.14 ± 0.67 0.42 ± 0.01a 50.76 ± 0.66
Crude root extract
100 0.45 ± 0.00a 15.09 ± 0.69 0.56 ± 0.00a 24.32 ± 0.49 0.56 ± 0.01a 34.49 ± 0.71
200 0.39 ± 0.00a 26.73 ± 0.76 0.46 ± 0.00a 37.83 ± 0.49 0.48 ± 0.00a 44.18 ± 0.42
Crude stem extract 100 0.50 ± 0.00 05.97 ± 0.58 0.65 ± 0.01a 12.39 ± 0.64 0.67 ± 0.01a 21.71 ± 0.58
200 0.46 ± 0.01a 13.83 ± 1.05 0.61 ± 0.00a 18.24 ± 0.58 0.58 ± 0.01a 32.17 ± 0.65
Crude leaves extract
100 0.49 ± 0.00 08.17 ± 0.63 0.60 ± 0.01a 18.46 ± 0.67 0.61 ± 0.00a 29.06 ± 0.43
200 0.45 ± 0.00a 16.05 ± 0.82 0.51 ± 0.01a 31.53 ± 0.75 0.54 ± 0.00a 37.59 ± 0.49

Results
131
Table 24. Anti -inflammatory activity of crude methanol extracts of S. kunthianus in histamine induced paw edema method
Values are given as mean ± S.E.M. for groups of six animals each; values are statistically significant at ap< 0.001. Control Vs treated
groups.
Treatments
Dose (mg/kg)
1 h 2 h 3 h Paw volume (ml)
% Inhibition Paw volume (ml)
% Inhibition Paw volume (ml)
% Inhibition
Control - 0.46 ± 0.01 - 0.65 ± 0.01 - 0.78 ± 0.00 -
Ibuprofen 100
0.28 ± 0.00a 39.48 ± 0.67 0.29 ± 0.00a 55.13 ± 0.47 0.29 ± 0.00a 62.39 ± 0.43
Crude flower extract 100 0.37 ± 0.00a 19.92 ± 0.68 0.47 ± 0.00a 27.18 ± 0.50 0.52 ± 0.00a 33.54 ± 0.61
200 0.32 ± 0.00a 30.10 ± 0.67 0.37 ± 0.00a 43.90 ± 0.66 0.37 ± 0.01a 52.99 ± 0.63
Crude root extract
100 0.41 ± 0.00 11.23 ± 0.67 0.51 ± 0.00a 21.50 ± 0.56 0.58 ± 0.00a 25.40 ± 0.39
200 0.36 ± 0.00a 22.46 ± 0.72 0.43 ± 0.01a 34.36 ± 0.86 0.43 ± 0.00a 45.08 ± 0.51
Crude stem extract 100 0.43 ± 0.00 6.52 ± 0.80 0.55 ± 0.01a 15.13 ± 0.73 0.61 ± 0.01a 20.10 ± 0.43
200 0.39 ± 0.01a 14.50 ± 1.07 0.47 ± 0.00a 27.69 ± 0.56 0.47 ± 0.00a 39.50 ± 0.52
Crude leaves extract
100 0.43 ± 0.00 7.60 ± 0.49 0.55 ± 0.01a 15.10 ± 1.22 0.61 ± 0.00a 22.01 ± 0.40
200 0.38 ± 0.01a 17.6 ± 1.04 0.45 ± 0.00a 30.51 ± 0.62 0.47 ± 0.00a 40.39 ± 0.55
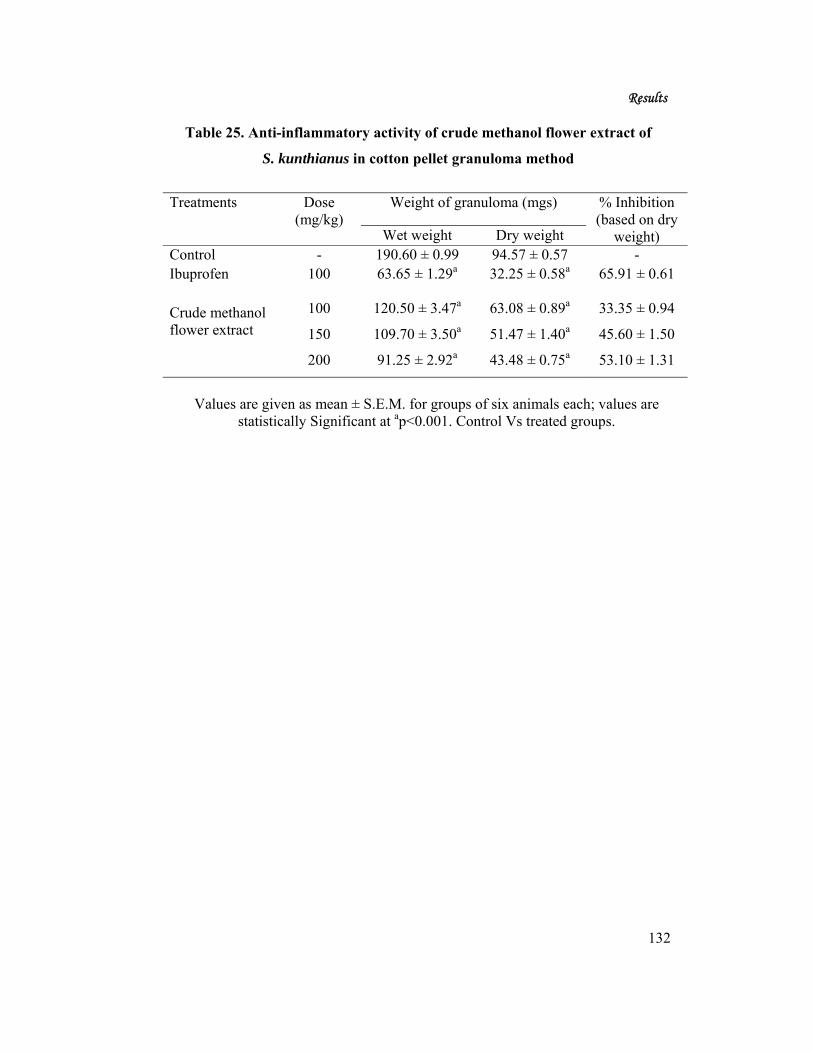
Results
132
Table 25. Anti-inflammatory activity of crude methanol flower extract of
S. kunthianus in cotton pellet granuloma method
Treatments
Dose (mg/kg)
Weight of granuloma (mgs) % Inhibition (based on dry
weight) Wet weight Dry weight Control - 190.60 ± 0.99 94.57 ± 0.57 - Ibuprofen 100 63.65 ± 1.29a 32.25 ± 0.58a 65.91 ± 0.61
Crude methanol flower extract
100 120.50 ± 3.47a 63.08 ± 0.89a 33.35 ± 0.94
150 109.70 ± 3.50a 51.47 ± 1.40a 45.60 ± 1.50
200 91.25 ± 2.92a 43.48 ± 0.75a 53.10 ± 1.31
Values are given as mean ± S.E.M. for groups of six animals each; values are
statistically Significant at ap<0.001. Control Vs treated groups.

Results
133
Table 26. Analgesic activity of crude methanol extracts of S. kunthianus in hot plate method
Values are given as mean ± S.E.M. for groups of six animals each; values are statistically significant at ap<0.01 and bp< 0.001. Control Vs treated groups.
Treatments
Dose
(mg/kg)
Latency period in sec ( % protection) 0 min 30 min 60 min 90 min 120 min
Control - 3.67 ± 0.03 3.56 ± 0.03 3.54 ± 0.04 3.42 ± 0.01 3.66 ± 0.02
Ibuprofen 100
3.92 ± 0.03 10.66 ± 0.08b (199.43)
12.13 ± 0.02b (242.43)
13.25 ± 0.07b (287.43)
13.65 ± 0.04b (272.95)
Crude flower extract 100 3.61 ± 0.03 5.73 ± 0.05b (60.96)
8.34 ± 0.06b (135.59)
9.34 ± 0.07b (173.1)
9.86 ± 0.02b (169.4)
200 3.56 ± 0.03 7.58 ± 0.09b (112.92)
10.41 ± 0.12b (194.07)
11.40 ± 0.07b (233.3)
11.74 ± 0.08b
(220.77) Crude root extract
100 3.55 ± 0.07 4.88 ± 0.02b (37.08)
6.21 ± 0.04b (75.42)
7.37 ± 0.03b (115.5)
7.85 ± 0.02b (114.48)
200 3.51 ± 0.44 6.46 ± 0.11b (84.57)
9.66 ± 0.07b (172.88)
10.06 ± 0.05b (194.15)
10.63 ± 0.05b (190.44)
Crude stem extract 100 3.50 ± 0.04 4.08 ± 0.04b (14.61)
5.75 ± 0.04b (62.43)
6.70 ± 0.03b (95.91)
7.02 ± 0.02b (91.80)
200 3.66 ± 0.44 5.59 ± 0.05b
(57.02) 8.04 ± 0.03b
(127.12) 8.35 ± 0.03b
(144.15) 9.24 ± 0.06b
(152.46) Crude leaves extract
100 3.58 ± 0.04 3.96 ± 0.04a (11.24)
5.26 ± 0.04b (48.59)
6.13 ± 0.02b (79.24)
6.62 ± 0.04b (80.87)
200 3.64 ± 0.05 5.29 ± 0.03b (48.6)
7.13 ± 0.03b (101.41)
7.81 ± 0.05b (128.36)
8.08 ± 0.02b (120.77)
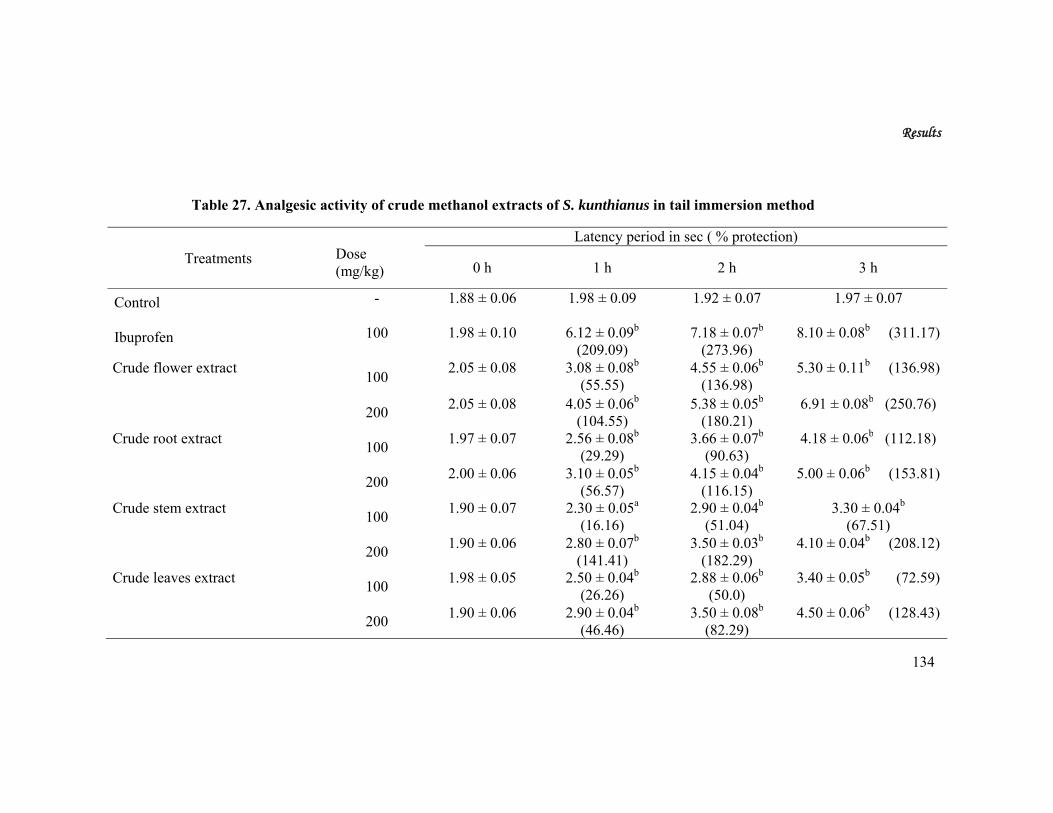
Results
134
Table 27. Analgesic activity of crude methanol extracts of S. kunthianus in tail immersion method
Treatments Dose (mg/kg)
Latency period in sec ( % protection)
0 h 1 h 2 h 3 h
Control - 1.88 ± 0.06 1.98 ± 0.09 1.92 ± 0.07 1.97 ± 0.07
Ibuprofen 100
1.98 ± 0.10 6.12 ± 0.09b (209.09)
7.18 ± 0.07b (273.96)
8.10 ± 0.08b (311.17)
Crude flower extract 100 2.05 ± 0.08 3.08 ± 0.08b (55.55)
4.55 ± 0.06b (136.98)
5.30 ± 0.11b (136.98)
200 2.05 ± 0.08 4.05 ± 0.06b (104.55)
5.38 ± 0.05b (180.21)
6.91 ± 0.08b (250.76)
Crude root extract
100 1.97 ± 0.07 2.56 ± 0.08b
(29.29) 3.66 ± 0.07b
(90.63) 4.18 ± 0.06b (112.18)
200 2.00 ± 0.06 3.10 ± 0.05b (56.57)
4.15 ± 0.04b (116.15)
5.00 ± 0.06b (153.81)
Crude stem extract 100 1.90 ± 0.07 2.30 ± 0.05a (16.16)
2.90 ± 0.04b (51.04)
3.30 ± 0.04b (67.51)
200 1.90 ± 0.06 2.80 ± 0.07b (141.41)
3.50 ± 0.03b (182.29)
4.10 ± 0.04b (208.12)
Crude leaves extract
100 1.98 ± 0.05 2.50 ± 0.04b
(26.26) 2.88 ± 0.06b
(50.0) 3.40 ± 0.05b (72.59)
200 1.90 ± 0.06 2.90 ± 0.04b (46.46)
3.50 ± 0.08b (82.29)
4.50 ± 0.06b (128.43)
Results
135
Values are given as mean ± S.E.M. for groups of six animals each; values are statistically significant at ap<0.01 and bp<0.001. Control Vs treated groups.
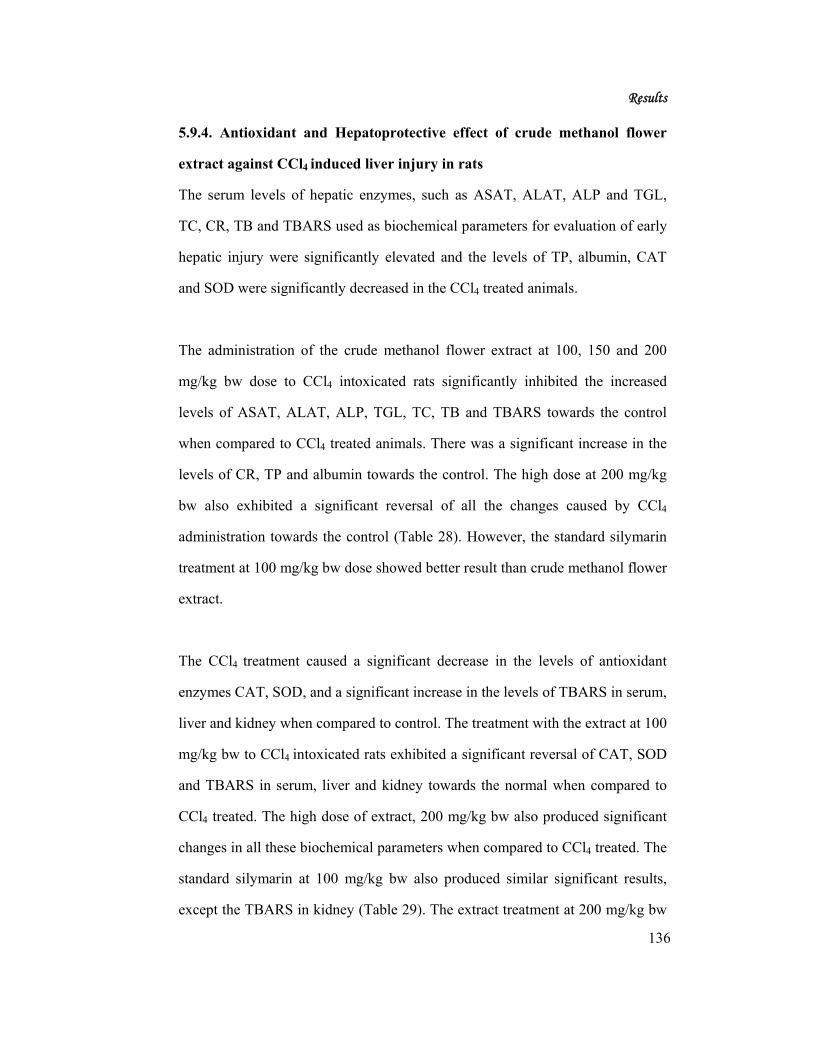
Results
136
5.9.4. Antioxidant and Hepatoprotective effect of crude methanol flower
extract against CCl4 induced liver injury in rats
The serum levels of hepatic enzymes, such as ASAT, ALAT, ALP and TGL,
TC, CR, TB and TBARS used as biochemical parameters for evaluation of early
hepatic injury were significantly elevated and the levels of TP, albumin, CAT
and SOD were significantly decreased in the CCl4 treated animals.
The administration of the crude methanol flower extract at 100, 150 and 200
mg/kg bw dose to CCl4 intoxicated rats significantly inhibited the increased
levels of ASAT, ALAT, ALP, TGL, TC, TB and TBARS towards the control
when compared to CCl4 treated animals. There was a significant increase in the
levels of CR, TP and albumin towards the control. The high dose at 200 mg/kg
bw also exhibited a significant reversal of all the changes caused by CCl4
administration towards the control (Table 28). However, the standard silymarin
treatment at 100 mg/kg bw dose showed better result than crude methanol flower
extract.
The CCl4 treatment caused a significant decrease in the levels of antioxidant
enzymes CAT, SOD, and a significant increase in the levels of TBARS in serum,
liver and kidney when compared to control. The treatment with the extract at 100
mg/kg bw to CCl4 intoxicated rats exhibited a significant reversal of CAT, SOD
and TBARS in serum, liver and kidney towards the normal when compared to
CCl4 treated. The high dose of extract, 200 mg/kg bw also produced significant
changes in all these biochemical parameters when compared to CCl4 treated. The
standard silymarin at 100 mg/kg bw also produced similar significant results,
except the TBARS in kidney (Table 29). The extract treatment at 200 mg/kg bw

Results
137
was found to be almost similar to the standard silymarin in reversing most of the
biochemical parameters towards the control.
Histopathological examination of liver sections of normal animals showed
normal cellular architecture with distinct hepatic cells, sinusoidal spaces and a
central vein (Fig. 47a). The liver sections of the rats of CCl4 treated group
showed disarrangement of normal hepatic cells with high degree of damage,
characterized by the centrilobular necrosis, focal necrosis and bile duct
proliferation (Fig. 47b). The sections of the rats treated with crude methanol
flower extract at 100, 150 and 200 mg/kg bw and intoxicated with CCl4
exhibited less centrilobular necrosis and bile duct proliferation compared to the
CCl4 control (Fig. 47c-e). Dose dependent results were observed and the high
dose (200 mg/kg) showed better activity. The standard silymarin at 100 mg/kg
bw and CCl4 treated animals showed almost normal architecture of the liver with
few centrilobular fatty changes and bile duct proliferation (Fig. 47f).
Kidney sections of CCl4 control group showed high degree of tubulointerstitial
nephritis compared to normal animals showed normal histological appearance
(Fig. 48 b). The sections of the animals belonging to the crude methanol flower
extract at all the doses and the standard silymarin treatment groups showed
normal histological appearance (Fig. 48 c-f). These findings clearly indicate that
the liver and kidney tissues, which were damaged by CCl4 intoxication showed
recovery with the crude methanol flower extract and silymarin treatments.

Results
138
Table 28. Effect of crude methanol flower extract on biochemical parameter in CCl4 induced toxicity in rats
Values are given as mean ± S.E.M. for groups of six animals each; values are statistically significant at bp<0.01, ap< 0.001. CCl4 Vs treated groups. cp<0.001 between CCl4 treated Vs control.
Treatments Dose mg/kg
ASAT ALAT ALP TP TGL TC CR TB Albumin
Control - 97.17 ±
3.27
82.00 ±
2.21
156.50 ±
2.98
6.67 ±
0.21
85.83 ±
2.21
105.30 ±
3.40
0.70 ±
0.04
0.60 ±
0.04
4.32 ±
0.14
CCl4 treated 313.70 ±
3.99c
230.80 ±
3.30c
521.30 ±
3.24c
2.50 ±
0.22c
204.20 ±
3.08c
237.70 ±
3.28c
4.03 ±
0.15c
1.75 ±
0.04c
2.48 ±
0.12c
Silymarin 100 109.20 ±
2.82a
93.33 ±
2.25a
177.80 ±
3.02a
6.50 ±
0.22a
107.50 ±
2.41a
125.50 ±
3.64a
1.05 ±
0.08a
0.80 ±
0.04a
4.02 ±
0.05a
Crude methanol
flower extract + CCl4
100 177.50 ±
3.30a
166.30 ±
3.45a
255.00 ±
4.02a
5.50 ±
0.22a
175.70 ±
2.95a
182.50 ±
2.96a
2.87 ±
0.07a
1.45 ±
0.04a
3.12 ±
0.06 b
150 152.00 ±
3.14a
138.50 ±
2.88a
230.70 ±
4.21a
6.12 ±
0.17a
142.00 ±
2.99a
153.30 ±
1.94a
1.67 ±
0.10a
1.22 ±
0.03a
3.55 ±
0.15a
200 126.80 ±
1.91a
108.70 ±
2.96a
201.70 ±
4.89a
6.67 ±
0.21a
121.50 ±
2.26a
134.00 ±
2.60a
1.17 ±
0.09a
0.83 ±
0.03a
4.18 ±
0.09a

Results
139
Table 29. Effect of crude methanol flower extract of S. kunthianus on SOD, Catalase and TBARS in CCl4 induced toxicity in rats
Treatments Dose
(mg/kg)
SOD (Unit/min/mg of tissue)
Catalase (IU/min/mg of tissue)
LPO (n mole of MDA/mg of tissue)
Serum Liver Kidney Serum Liver Kidney Serum Liver Kidney
Control - 0.36 ±
0.01
0.38 ±
0.01
0.29 ±
0.01
1.35 ±
0.03
4.12 ±
0.05
1.26 ±
0.02
3.49 ±
0.09
4.48 ±
0.06
5.64 ±
0.05
CCl4 treated - 0.17 ±
0.01c
0.24 ±
0.01c
0.12 ±
0.00c
0.36 ±
0.01c
2.27 ±
0.04c
0.93 ±
0.02c
4.50 ±
0.07c
6.77 ±
0.06c
7.20 ±
0.04c
Silymarin 100 0.32 ±
0.01a
0.34 ±
0.01a
0.27 ±
0.00a
1.41 ±
0.01a
3.72 ±
0.07a
1.12 ±
0.02a
3.27 ±
0.06a
4.74 ±
0.06a
5.80 ±
0.04a
Crude methanol flower
extract + CCl4 100
0.22 ±
0.01a
0.28 ±
0.00 b
0.18 ±
0.00a
1.06 ±
0.04a
2.85 ±
0.05a
0.97 ±
0.02
4.03 ±
0.03a
5.78 ±
0.03a
6.91 ±
0.03a
150 0.25 ±
0.01a
0.31 ±
0.00a
0.22 ±
0.00a
1.23 ±
0.02a
3.30 ±
0.06a
1.10 ±
0.02a
3.55 ±
0.02a
5.13 ±
0.04a
6.08 ±
0.02a
200 0.31 ±
0.01a
0.33 ±
0.01a
0.25 ±
0.01a
1.29 ±
0.02a
3.58 ±
0.05a
1.22 ±
0.01a
3.42 ±
0.04a
4.89 ±
0.04a
5.89 ±
0.02a
Values are given as mean ± S.E.M. for groups of six animals each; values are statistically significant at bp<0.05, ap<0.001. CCl4 Vs treated groups. cp<0.001 between CCl4 treated Vs control.

Results
140
Fig. 47. Histopathological changes occurred in the liver after CCl4 intoxication and prevention by the treatment with crude methanol flower extract
(hematoxylin and eosin, 400x). (a) Control (b) CCl4 treated (c) Crude methanol flower extract (100 mg/kg) + CCl4 (d) Crude methanol flower extract (150 mg/kg) + CCl4 (e) Crude methanol flower extract (200 mg/kg) + CCl4 (f)
Silymarin (100 mg/kg) + CCl4.
b
f
d
b
d
f
a
c
e

Results
141
Fig. 48. Histopathological changes occurred in the kidney after CCl4 intoxication and prevention by the treatment with crude methanol flower extract
(hematoxylin and eosin, 400x). (a) Control (b) CCl4 treated (c) Crude methanol flower extract (100 mg/kg) + CCl4 (d) Crude methanol flower extract (150 mg/kg) + CCl4 (e) Crude methanol flower extract (200 mg/kg) + CCl4 (f)
Silymarin (100 mg/kg) + CCl4.
b b
c d
f f
a
d
e

Discussion
140
Plants have been an integral part of the ancient culture of India, China and Egypt
as medicine, and their importance even dates back to the Neanderthal period
(Saklani and Kutty, 2008). Terrestrial plants, especially higher plants, have a long
history of use in the treatment of human diseases. Historical experiences with
plants as therapeutic tools have helped to introduce effective, safe and novel
chemical entities in modern medicine. Biologically active plant-derived chemicals
can be expected to play an increasingly significant role in the commercial
development of new drugs, especially when we consider that most species of
higher plants have never been described, much less surveyed for chemical or
biologically active constituents, and new sources of commercially valuable
materials remain to be discovered (Balandrin et al., 1985). In spite of the current
preoccupation with synthetic chemistry as a vehicle to discover and manufacture
drugs, the potential of plants to disease treatment and prevention is still enormous
(Raskin et al., 2002). Hence, in the present study we were interested in natural
products research.
Species of Strobilanthes grow wild on the Nilgiri ranges between 6000 to 7000
feet. The genus Strobilanthes is known for its various biological activities
(Sunarto, 1977; Kusumoto et al., 1992; Ismail et al., 2000; Jaksa et al., 2004;
Rahmat et al., 2006; Nair et al., 1988). S. kunthianus (Neelakurinji) is a shrub in
the grasslands of Western Ghats in India. The Nilgiris, which literally means the
blue mountains got its name from the purplish blue flowers of Neelakurinji that
blossoms gregariously once in twelve years. Lupeol has been isolated from the
whole plant. Except this study, so far no phytochemical investigations and

Discussion
141
biological activities were carried out. Hence, in the present study we were
interested to carry out detailed phytochemical and biological investigations in
S. kunthianus.
Quality and reproduction of the total spectrum of constituents of the herbal drugs
are extremely important. The herbal raw material often show a natural variability
due to many external influences such as climate, soil quality, harvesting and
drying conditions, with the consequence that the qualitative and quantitative
composition varies from batch to batch from harvest to harvest, in particular. Plant
identity can be achieved by macro and microscopical examination. Microscopical
evaluation is indispensable in the initial identification of herbs, as well as in
identifying small fragments of crude or powdered herbs and detection of foreign
matter and adulterants. Hence, pharmacognostical studies were carried out with a
focus on bringing out diagnostic character will be of immense help in proper
identification, which play an important role in the standardization of plant
materials. A detailed study of microscopic characters of all the parts viz leaves,
flower, stem and root along with the photographs of the special characters taken
during the study serves in identifying the plant. The microscopic features of
leaves, lamina, petiole, stem, root, xylem, pith and vein islet were studied. The
powder microscopy was also studied.
Determination of physicochemical constants is important for the purpose of
evaluation of crude drugs. The total ash, water soluble ash, sulphated ash and
alcohol soluble extractive values of the leaves of S. kunthianus were found to be
Discussion
142
high when compared to the other plant materials. The acid insoluble ash was
found to be high in root and water soluble extractive value in flowers.
Preliminary phytochemical analysis is used for the purpose of evaluation of crude
drugs. The four successive extracts of root and stem and six methanol extracts
were tested for their phytoconstituents. Phenolics, steroids and triterpenoids were
found in successive petroleum ether and chloroform extracts of stem and root.
Glycosides and phenolics were found in ethyl acetate and methanol stem and root
extracts and all the methanol extracts. Phenols are responsible for the majority of
the oxygen capacity in most plant derived products (Aniya et al., 2005). With few
exceptions such as carotene, the antioxidants in food are phenols. Hence the total
phenol content of all the extracts was estimated. The crude methanol flower
extract was found to contain very high total phenol content among all the extracts.
Isolation of natural products from plant constitutes a chemical research project
with potentially significant benefits to mankind. Column chromatography in
phytochemistry is a method to purify individual chemical compounds from
mixtures of compounds. In order to isolate novel bioactive compounds from
extracts column chromatography, studies of six extracts were carried out. The
purity of isolated compound was established by TLC and characterization was
done by spectral analysis viz. NMR and mass spectra.
From the spectral data the compounds isolated and identified from successive
petroleum ether root extract were lupeol and betulin. Lupeol was also isolated
from petroleum ether stem extract. 3,5-bis (dimethyl carbamoyl) methyl-4- (11-

Discussion
143
cyclo hexylundecyl)-4-heptyl- N1,N1,N7,N7tetra methyl heptane diamide was
isolated from chloroform stem extract. α-Amyrin and 4-amino-tetrahydro-2H-
pyran-3,5-diol were isolated from macerated methanol flower extract. β-Sitosterol,
2-(2-hydroxyethyl)-3-methyl-4-[(E)-3, 4, 6-trimethyl undec-4-ethyl] cyclohexyl
propionate and a flavone glycoside were isolated from crude methanol flower
extract. Decahydro-1, 1, 4a, 8-tetramethyl phenanthren-2 (1H, 3H, 4b H)-one was
isolated from macerated methanol leaves extract. Except lupeol all the other
compounds were isolated for the first time from S. kunthianus.
Majority of the diseases/disorders are mainly linked to oxidative stress due to free
radicals (Gutteridgde, 1995). Free radicals are fundamental to any biochemical
process and represent an essential part of aerobic life and metabolism (Tiwari,
2001). The most common reactive oxygen species (ROS) include superoxide (O2.)
anion, hydrogen peroxide (H2O2), peroxyl (ROO-) radicals and reactive hydroxyl
(OH.) radicals. The nitrogen derived free radicals are nitric oxide (NO.) and
peroxynitrite anion (ONOO.). ROS have been implicated in over a hundreds of
diseases states which range from arthritis and connective tissue disorders to
carcinogenesis, aging, physical injury, infection and acquired immunodeficiency
syndrome (Joyce, 1987). In treatment of these diseases, antioxidant therapy has
gained an immense importance. Current research is now directed towards finding
naturally occurring antioxidants of plant origin. Antioxidants have been reported
to prevent oxidative damage by free radical and ROS, and may prevent the
occurrence of disease, cancer and aging. It can interfere with the oxidation process
by reacting with free radicals, chelating, catalytic metals, and also by acting as
oxygen scavengers (Buyukokuroglu et al., 2001; Shahidi and Wanasundara,

Discussion
144
1992). Plant and plant products are being used as a source of medicine since long.
The medicinal properties of plants have been investigated in the recent scientific
developments. throughout the world, due to their potent antioxidant activities, no
side effects and economic viability (Auudy et al., 2003). Flavonoids and phenolic
compounds widely distributed in plants which have been reported to exert
multiple biological effect, including antioxidant, free radical scavenging abilities,
anti-inflammatory, anticarcinogenic. etc. (Miller, 1996). They were also suggested
to be a potential iron chelator (Boyer et al., 1988; Havsteen, 1983). Novel natural
antioxidants from some plants have been extensively studied in the past few years
for their antioxidant and radical scavenging properties. Hence, all the extracts
were screened for in vitro antioxidant activity using different methods.
Among the four successive extracts, the ethyl acetate extract of stem showed
potent activity in ABTS and DPPH methods, root extract in ABTS method. The
root extract showed better activity than the standard ascorbic acid. All the other
extracts showed weak to moderate activities in the other tested methods. Among
the methanol extracts, the macerated leaves, crude flowers, stem and root showed
potent activity in ABTS method and the results were better than the standard
ascorbic acid. In the H2O2 and total antioxidant capacity methods, all the crude
extracts showed potent activity than the standard used. The crude flower extract
was found to show potent activity in p-NDA and deoxyribose methods. However,
the efficiency of each extract differs against free radicals depending on the
particular assay methodology, reflecting their complexity of the mechanisms and
diversity in the chemical nature of phytoconstituents present.

Discussion
145
Many natural products have served as anticancer agents in the treatment and also
as lead compounds for further research. All the extracts were tested for their
cytotoxic activity against Vero, Hep-2 and HeLa cell lines showed weak activity.
A large number of phenolic compounds are known to possess antioxidant activity
(Badami et al., 2003; Le et al., 2004). The total phenol content of most of the
crude extracts was found to be higher. Hence, potent in vitro antioxidant activity
of these extracts might be due to the presence of higher amount of phenolics.
Based on these results, in the present study crude methanol extracts of flowers,
stem, root and leaves were selected for in vivo anti-inflammatory and analgesic
activities.
It is well known that carrageenan induced paw edema is characterized by biphasic
event with involvement of different inflammatory mediators. In the first phase,
chemical mediators such as histamine and serotonin play role, while in second
phase kinin and prostaglandins are involved. Formalin induced paw edema in rats
is one of the most suitable test to screen antiarthritic and anti-inflammatory agents
as it closely resembles human arthritis (Greenwald, 2000). Injection of formalin
subcutaneously in to rat hind paw produces localized inflammation and pain. Thus
formalin induced model is used for evaluating antiproliferative activity. Histamine
is one of the important inflammation mediators and it is a potent vasodilators
substance and increases the vascular permeability (Linardi et al., 2002;
Cuman et al., 2001).

Discussion
146
The crude methanol extracts of flower, root, stem and leaves have been exhibited
potent anti-inflammatory activity in carrageenan, formalin and histamine induced
paw edema methods at 100 and 200 mg/kg bw doses given orally. Among these
crude extracts, the crude methanol flower extract showed better activity from 1-3
h of the treatment in all these methods. This may be due to the inhibition of
inflammation mediators such as prostaglandins, kinin, histamine etc. However, the
standard ibuprofen showed potent activity than the extracts in all the methods.
Hence, in the present study the crude methanol flower extract was selected to
screen for subchronic anti-inflammatory studies.
The cotton pellet granuloma method has been widely employed to assess the
tranudative, exudative and proliferative components of chronic inflammation.The
fluid absorbed by the pellet greatly influences the wet weight of the granuloma
and the dry weight correlates well with the amount of granulomatous tissue
formed (Swingle and Shideman, 1972). Monocyte infiltration and fibroblast
proliferation rather than neutrofil infiltration and exudation take place in chronic
inflammation (Dunne, 1990). Our results revealed that the crude methanol flower
extract at all the doses significantly decreased both wet and dry weights of
granuloma compared to control group in a dose dependent manner. This may be
due to the ability of crude methanol flower extract in reducing the number of
fibroblasts and synthesis of collagen and mucopolysaccharide, which are natural
proliferative agents of granulation of tissue formation.

Discussion
147
Injury of the cells of the mucous membrane may provoke the production of active
oxygen species such as nitrogen monoxide and superoxide anion radicals by
macrophages and neutrophiles permitting into them. Active oxygen species can
directly injure the surrounding cells and extracellular matrices, such as hyaluronic
acid and produce lipid peroxides and metabolites of arachidonic acid (Oyanagui,
1983). Superoxide anion radicals and hydrogen peroxide have important roles in
the inflammatory process (Shingu et al., 1982). Antioxidants, such as SOD and tea
catechins are known to suppress inflammation in a rat arthritis model (Yoshikawa
et al., 1985). Hence, the observed anti-inflammatory activity may be due to
antioxidant activity of crude methanol flower extract. The literature indicates
other species like S. callosus and S. ixiocephala were used in the treatment of
inflammation. Our results prove the anti-inflammatory activity of another plant of
the same species. The precise mechanism through which the extract exerts its
antiedematogenic effects needs to be investigated.
In the present study analgesic activity of crude methanol extracts were evaluated
by hot plate and tail immersion methods. These methods have selectivity for
opioid derived centrally mediated analgesics (Winter et al., 1962). Animals treated
with crude methanol extracts orally at 100 and 200 mg/kg bw doses exhibited
significant increase in the hot plate reaction time and tail withdrawal reflex to hot
water in rats. In both these methods, the effect of crude methanol flower extract at
both the doses was found to be better than other extracts. However, the standard
ibuprofen at 100 mg/kg bw showed maximum percentage protection in both the
methods. Hence, the extracts tested may possess central antinociceptive actions
involving opioid like receptor mediations.

Discussion
148
Liver regulates many important metabolic functions. Hepatic injury is associated
with distortion of these metabolic functions (Wolf, 1999). In absence of a reliable
liver protective drug in the modern system of medicine, a number of medicinal
preparations in Ayurveda, the Indian system of medicine, are recommended for
the treatment of liver disorders (Chatterjee, 2000). Natural remedies from
medicinal plants are considered to be effective and safe alternative treatments for
hepatotoxicity.
Since the changes associated with CCl4 induced liver damage are similar to that of
acute viral hepatitis (Suja et al., 2004), CCl4 mediated hepatotoxicity was chosen
as the experimental model. The ability of a hepatoprotective drug to reduce the
injurious effects or to preserve the normal hepatic physiological mechanisms,
which have been disturbed by a hepatotoxin, is the index of its protective effects
(Yadav and Dixit, 2003). The hepatotoxicity induced by CCl4 is due to its
metabolite CCl3 •, a free radical that alkylates cellular proteins and other
macromolecules with a simultaneous attack on polyunsaturated fatty acids, in the
presence of oxygen, to produce lipid peroxides, leading to liver damage (Bishayee
et al., 1995).
Hepatic cells participate in a variety of metabolic activities and contain a host of
enzymes. In tissues, Asparate amino transferase (ASAT) and Alanine amino
transferase (ALAT) are found in higher concentrations in cytoplasm and ASAT in
particular also exists in mitochondria. In liver injury, the transport function of the
hepatocytes is disturbed, resulting in the leakage of plasma membrane, thereby
Discussion
149
causing an increased enzyme level in serum, and soluble enzymes like ASAT will
also be similarly released. The elevated activities of ASAT and ALAT in serum
are indicative of cellular leakage and loss of functional integrity of cell
membranes in liver (Rajesh and Latha, 2004). Administration of CCl4
significantly raised the serum level of enzymes like ASAT and ALAT in rats.
Oral administration of crude methanol flower extract at a dose of 200 mg/kg bw
caused a decrease in the activity of the above enzymes, which may be a
consequence of the stabilization of plasma membrane as well as repair of hepatic
tissue damage caused by CCl4.
The activity of serum alkaline phosphatase (ALP) was also elevated during CCl4
administration. ALP is excreted normally via bile by the liver. In liver injury due
to hepatotoxin, there is a defective excretion of bile by the liver which is reflected
in their increased levels in serum. Hyperbilirubinaemia is a very sensitive test to
substantiate the functional integrity of the liver and severity of necrosis which
increases the binding, conjugation and excretory capacity of hepatocytes that is
proportional to the erythrocyte degeneration rate (Singh et al., 1998). Suppression
of activity of ALP in serum of rats treated with crude methanol flower extract,
suggest to stabilize biliary dysfunction of rat liver during chronic injury with
CCl4.
The TP levels including albumin levels will be depressed in hepatotoxic
conditions due to defective protein biosynthesis in liver (Clawson, 1989). The
CCl4 intoxication causes disruption and disassociation of polyribosomes on

Discussion
150
endoplasmic reticulum and thereby reducing the biosynthesis of protein. The
pretreatment of crude methanol flower extract restored the proteins synthesis by
protecting the polyribosomes.
Hepatocellular damage causes a modest hypertriglyceridemia (Glickmann and
Sebasin, 1982), which is due to the biochemical changes inferring with the
transport of triglycerides out of liver. The same is evidenced in the CCl4 induced
rats. A significant increase in cholesterol was observed in CCl4 induced rats,
which may be due to the inability of the diseased liver to remove cholesterol from
circulation. The pretreatment with the crude methanol flower extract caused a
significant reversal of the altered TGL and TC levels towards the normal in dose
dependent manner.
A high concentration TB in serum is an indication for increased erythrocyte
degeneration rate (Singh et al., 1998). Due to the liver injury caused by the
hepatotoxin, there is a defective excretion of bile by the liver which is reflected in
their increased levels in serum (Rao, 1973). The pretreatment of crude methanol
flower extract at 200 mg/kg bw effectively reduced the serum TB level towards
the control indicating the increased hepatic capacity.
Hypoalbuminemia is caused by liver diseases and abnormally high levels of CR
indicate possible malfunction or failure of the kidneys. A significant reversal was
observed by the extract treatment towards the normal when compared to CCl4
treated animals indicating the protection of those organs by the extract. It has been
suggested that glycogen serves as an energy buffer capable of providing rapid and

Discussion
151
short-term energy (Brown, 2004). The elevation of depressed glycogen stores by
the crude methanol flower extract in CCl4 treated rats may be attributed to either
an inhibition of hepatic glucose output improvement in plasma insulin levels or by
synthetase responsible for the incorporation of glucose moieties into pre-existing
glycogen chains.
Antioxidant activity or the inhibition of the generation of free radicals is important
in the protection against CCl4 induced hepatopathy (Castro et al., 1974). The body
has an effective defense mechanism to prevent and neutralize the free radical
induced damage. This is proficient by a set of endogenous antioxidant enzymes
such as SOD, and catalase. These enzymes constitute a mutually supportive team
of defense against ROS. In CCl4 induced hepatotoxicity, the balance between
ROS production and these antioxidant defenses may be lost, ‘oxidative stress’
results, which through a series of events deregulates the cellular functions leading
to hepatic necrosis. The reduced activities of SOD and catalase observed point out
the hepatic damage in the rats administered with CCl4 but the treated with 100,
150 and 200 mg/kg of the crude methanol flower extract showed significant
increase in the level of these enzymes, which indicates the in vivo antioxidant
activity of the extract.
The level of lipid peroxide is a measure of membrane damage and alterations in
structure and function of cellular membranes. In the present study, elevation of
lipid peroxidation in the liver of rats treated with CCl4 was observed. The increase
in MDA levels in liver suggests enhanced lipid peroxidation leading to tissue
Discussion
152
damage and failure of antioxidant defense mechanisms to prevent the formation of
excessive free radicals (Ashok Shenoy et al., 2001). Treatment with crude
methanol flower extract significantly reversed these changes. Hence, it is possible
that the mechanism of hepatoprotection of the extract may be due to its
antioxidant action.
The normal architecture of liver was completely lost in rats treated with CCl4 with
the appearance of vacuolated hepatocytes and degenerated nuclei. Vacuolization,
fatty changes and necrosis of hepatocytes were severe in the centrilobular region.
CCl4 poisoning led to excessive formation of deposition of connective tissue and
development of scars. Minimal disruption of the structure of the hepatocyte was
observed in liver tissue of rats intoxicated with CCl4 and treated with crude
methanol flower extract. Kidney sections of CCl4 showed a high degree of
tubulointerstitial nephritis compared to control. The crude methanol extract treated
kidney tissue showed almost normal histological appearance indicating its
hepatoprotective activity. These results compliment the result of biochemical
estimations, where a reversal of effects of CCl4 towards the normal was observed.
Summary and Conclusion
153
The herbal medicines are the major remedy in traditional medicinal system
and are being used in medicinal practice for thousands of years. These have
made a great contribution in maintaining human health. The practice
continues even today because of the biomedical benefits in many parts of the
world. There is phenomenal increase in the demand for the herbal medicines
especially for those which have been scientifically validated. The alarming
rapid rate of species extension which we are currently witnessing due in part
to habitat destruction, lends certain urgency to the quest for plant derived
drugs. Natural product research continues to be an important part of the drug
discovery process. The main advantage of natural products as a source of
lead compounds is the tremendous molecular diversity found in nature.
Hence, we were interested in carrying out natural products research.
Most of the species of Strobilanthes flower only in long intervals, such as
between six and twelve years and in some, even at longer intervals like 35
years. One of the plant best known species S. Kunthianus (Kurinji), flowers
once in twelve years. Interesting results of gregarious flowering of
Strobilanthes increases bees and its vicinity during the flowering period.
Immense quantities of honey become available and the rockbees in common
hill visit the plant. However, so far there is no biological studies have been
carried out on this special plant. So far only Lupeol has been isolated from
the whole plant. Hence in the present study, a detailed evaluation of
phytochemical and biological studies such as antioxidant, anti-inflammatory,
analgesic and hepatoprotective activities were carried out.

Summary and Conclusion
154
The whole plant of S. kunthianus was collected from Thalaikuntha region,
near Ootacamund, Nilgiris district, Tamilnadu, India. The plant was
identified and authenticated at Botanical Survey of India, Coimbatore.
Pharmacognostical evaluation was carried out in order to establish the
identity and to standardize the plant. Morphological and microscopical
characters of leaves, flowers, stem and root were studied. Physicochemical
parameters like total ash, acid insoluble ash, water soluble ash and sulphated
ash values and extractive values like alcohol soluble and water soluble were
determined.
The stem and root of S. kunthianus were successively extracted with
petroleum ether, chloroform, ethyl acetate and methanol. The flowers, stem,
leaves and root were also extracted with methanol to obtain crude extracts by
using Soxhlet method. The leaves and flowers were also subjected for cold
methanol maceration. All the fourteen extracts were concentrated to dryness
under reduced pressure and controlled temperature and the yields were noted.
Preliminary phytochemical analysis was carried out. Glycosides and
phenolics were found in successive ethyl acetate and methanol stem and root
extracts and all the crude methanol extracts. The total phenol content was
estimated by Folin Ciocalteau method in all the fourteen extracts. The crude
methanol flower extract was found to contain very high total phenol content
among all the extracts.
The successive petroleum ether root and stem extracts, chloroform stem
extract, macerated and crude methanol flower extracts were subjected to
Summary and Conclusion
155
column chromatography for the isolation of constituents. The macerated
methanol leaves extract was subjected to solvent-solvent extraction method
to isolate phytoconstituents. Nine compounds were isolated and their purity
was confirmed by TLC using different solvent systems. Based on the spectral
analysis such as IR, NMR and Mass spectral data, the compounds were
characterized. The compounds isolated from the petroleum ether root extract
were lupeol (GS 1) and betulin (GS 2). Lupeol (PES 1) was also isolated
from petroleum ether stem extract. From chloroform stem extract, 3, 5-bis
(dimethyl carbamoyl) methyl-4- (11-cyclo hexyl undecyl)- 4-heptyl-
N1,N1,N7,N7 tetra methyl heptane diamide (SC 1) was isolated. The
compounds α-amyrin (GSMES 3) and 1, 4-amino-tetrahydro-2H-pyran-3, 5-
diol (G 1) were isolated from macerated methanol flower extract. From crude
methanol flower extract, compounds β-sitosterol (CMF 1), 2, 2-(2-
hydroxyethyl)-3-methyl-4-[(E)-3, 4, 6-trimethyl undec-4-ethyl] cyclohexyl
propionate (CMF 2) and flavone glycoside (CMF 5) were isolated. From
macerated methanol leaves extract, the compound decahydro-1, 1, 4a, 8-
tetramethyl phenanthren-2 (1H, 3H, 4b H)-one (ML 1) was isolated. Except
lupeol, all the other eight compounds were isolated for the first time from the
plant.
During the last two decades, there has been a growing interest in studies that
are concerned with prevention of uncontrolled oxidative process leading to
various diseases in living system. Several studies have shown the role of
oxidative stress in the causation and progression of various diseases

Summary and Conclusion
156
including atherosclerosis, carcinogenesis, neurodegenerative diseases,
radiation damage, aging and various other pathological effects. Hence, in the
present study, all the successive extracts of stem and root and six methanol
extracts were screened for in vitro antioxidant activity using seven different
methods.
Among the tested extracts, the ethyl acetate extracts of root and stem showed
potent in vitro antioxidant activity, when compared to ascorbic acid in ABTS
method. These extracts showed better activity than other successive extracts
of root and stem. In case of methanol extracts, the crude extracts showed
good antioxidant activity in ABTS, H2O2, and total antioxidant capacity
methods. The crude methanol flower extract was found to be the most potent
among the methanol extracts.
Many natural products have served as anticancer agents in the treatment and
also has lead compounds for further research. All the extracts were tested for
their cytotoxic activity against Hep-2 and HeLa cell lines. But weak activity
in the tested cell lines indicated their safety inactivity towards cancer cell
lines.
Free radical and reactive oxygen species are well known inducers of cellular
and tissue pathogenesis leading to several human diseases such as cancer,
inflammatory disorders, hepatitis, diabetes mellitus, as well as in aging
process. Many plant species possessing antioxidant activities were served as
protective agents against these diseases. The crude methanol extracts of
flower, stem, root and leaves showed potent in vitro antioxidant activity.
Hence, in the present study, crude methanol extracts were selected for in vivo

Summary and Conclusion
157
anti-inflammatory and analgesic studies. In the acute toxicity studies, all the
four crude methanol extracts were found to be non toxic and no mortality
was observed up to 15 days when given as single oral dose of 2000 mg/kg
bw with no gross necropsy findings.
In vivo acute anti-inflammatory activity was done with carrageenan, formalin
and histamine induced paw edema methods and analgesic activity by hot
plate and tail immersion methods for all the crude extracs at two different
dose levels. The crude methanol flower extract treatment showed the
maximum activity in all the methods among the tested extracts. However,
standard ibuprofen showed potent activity than the extracts. Based on these
results, crude methanol flower extract was selected for sub chronic anti-
inflammatory studies using cotton pellet method. The extract was found to be
active indicating its potency. Hence, this extract was subjected for in vivo
hepatoprotective and antioxidant activities.
The crude methanol flower extract was tested against CCl4 induced liver
injury in rats at 100, 150 and 200 mg/kg bw doses. The administration of
CCl4 caused a significant increase in the levels of ASAT, ALAT, ALP, TGL,
TC, CR, TB and TBARS and decrease in the levels of TP, Albumin, CAT
and SOD in serum. A significant restoration of these values towards the
normal was observed in all the doses of the extract treatment. Similar results
were observed for CAT, SOD and TBARS in both liver and kidney tissues.
These results indicated strong antioxidant and hepatoprotective nature of
crude methanol flower extract. The histopathological examination of liver
and kidney tissues also confirmed these activities.

Summary and Conclusion
158
In conclusion, the present work provides the pharmacognostical and
phytochemical evaluation profiles to identify the plant. From the extracts by
column chromatographic studies, eight compounds were isolated for the first
time from this plant. The in vitro antioxidant and cytotoxicity studies of the
extracts were established by using several standard methods. The in vivo
anti-inflammatory and analgesic activities were established for crude
methanol extracts in different models. The antioxidant and hepatoprotective
properties were established for crude methanol flower extract. Biochemical
and histological evidences were used to prove the activities. Hence, the
present study provides a proof for the strong chemotaxonomical relationship
and similarity of the biological property with the other species of
Strobilanthes.
Objectives achieved
1. Pharmacognostical evaluation profile to identify the plant S. kunthianus was
established.
2. Eight phytoconstituents were isolated for the first time from this plant.
3. Potent extracts were selected from seven standard in vitro antioxidant
activity methods and subjected to in vivo studies.
4. In vivo anti-inflammatory, analgesic, antioxidant and hepatoprotective
activities of the crude methanol flower extract of S. kunthianus was proved.
Scope for further research
There is further scope for research in isolating the other phytoconstituents and to
carry out the other biological properties of the extracts. There is also a need to
establish the mechanism of the observed activities.

Bibliography
Agarwal, R.B., Rangari, V.D., 2003. Antiinflammatory and antiarthritic activities
of Lupeol and α Lupeol isolated from Strobilanthus callosus and
Strbilanthus ixocephala roots.
Aniya, Y., Koyama, T., Miyagi, C., Miyahira, M., Inomata, C., Kinoshita, S.,
et al., 2005. Free radical scavenging and hepatoprotective actions of the
medicinal herb, Crassocephalum crepidioides from the Okinawa Islands.
Biological Pharmaceutical Bulletin 28, 19-23.
Anonymous, 1976. The wealth of India, Raw materials, CSIR, Publication and
Information Directorate, New Delhi.
Arul, V., Miyazaki, S., Dhananjayana, R., 2005. Studies on the anti inflammatory,
antipyretic and analgesic properties of the leaves of Aegle marmelos.
Journal of Ethnopharmacology.4, 159-163.
Aruoma, O.I., 1998. Free radicals, oxidative stress, and antioxidants in human
health and disease. Journal of the American Oil Chemists Society 75, 199–
212.
Ashok Shenoy, K., Somayaji, S.N., Bairy, K.L., 2001. Hepatoprotective effects of
Ginkgo biloba against carbon tetrachloride induced hepatic injury in rats.
Indian Journal of Pharmacology 33, 260–266.
Auudy, B., Ferreira, F., Blasina, F., Lafon, F., Arredondo, F., R. Dajas, R.,.
Tripathi, P.C., 2003. Screening of antioxidant activity of three Indian
medicinal plants, traditionally used for the management of
neurodegenerative diseases. Journal of Ethnopharmacology 84, 131-138.
Bibliography
Badami, S., Mahesh, K.G., Suresh, B., 2003. Antioxidant activity of the ethanolic
extract of Striga orobanchioides. Journal of Ethnopharmacology 85,
227-229.
Baker, J.T., Borris, R.P., Carte, B., Cordell, G.A., Soejarto, D.D., Cragg, G.M.,
et al., 1995. Natural products drug discovery and development: new
perspectives on international collaboration. Journal of Natural Products 58,
1325–1357.
Balandrin, M.F., Klocke, J.A., Wurtele, E.S., Bollinger, W.H., 1985. Natural plant
chemicals: Sources of industrial and medicinal materials. Science 228,
1154–1160.
Balunas, M.J., Kinghorn, A.D., 2005. Drug discovery from medicinal plants. Life
Sciences 78, 431–441.
Barry, H., John, M.C.G., Okeizie, I.A., 1987. The deoxyribose method: a simple
test-tube assay for determination of rate constant for reactions of hydroxyl
radicals. Analytical Biochemistry 165, 215-219.
Beers, R.F., Jr, Sizer, I.W., 1952. A spectrophotometric method for measuring the
breakdown of hydrogen peroxide by catalase. Journal of Biological
Chemistry 195, 133–140.
Bishayee, A., Sarkar, A., Chatterjee, M., 1995. The hepatoprotective activity of
carrot (Daucus carota L) against carbon tetrachloride intoxication in
mouse liver. Journal of Ethnopharmacology 47, 69–74.
Boyer, F., Clark, H.M., and Laroche, A.P., 1988. Reduction and release of ferritin
iron by plant phenolics. Journal of Inorganic Biochemistry 32, 171-181.

Bibliography
Brown, A.M., 2004. Brain glycogen re-awakened. Journal of Neurochemistry 89,
537-552.
Butler, M.S., 2004.The role of natural product chemistry in drug discovery.
Journal of Natural Products 67, 2141-2153.
Buyukokuroglu, M.E., Gulcin, I., Oktay, M., Kufrevioglu, O.I., 2001. In vitro
antioxidant properties of dantrolene sodium. Pharmacology Research 44,
491-495.
Cardellina, J.H., 2002. Challenges and opportunities confronting the botanical
dietary supplement industry. Journal of Natural Products 65, 1073–1084.
Castro, J.A., DeFerreyra, E.C., DeCastro, C.R., Fenoes, O.M., Sasame, H.,
Gillette, J.R., 1974. Prevention of carbon tetrachloride induced necrosis by
inhibitors of drug metabolism–further studies on their mechanism of
action. Biochemical Pharmacology 23, 295-302.
Chatterjee, T.K., 2000. Medicinal plants with hepatoprotective properties. In
Herbal Options. 3rd ed.: Books and Allied (P) Ltd ,, Calcutta 135-137.
Chen, M.S., White, M.C., 2007. A predictably selective aliphatic C–H oxidation
reaction for complex molecule synthesis. Science 318, 783-787.
Clardy, J., Walsh, C., 2004. Lessons from natural molecules. Nature 432, 829–
837.
Clawson, G.A., 1989. Mechanism of carbon tetrachloride hepatotoxicity.
Pathology and Immunopathology Research 8, 104-112.
Corcoran, O., Spraul, M., 2003. LC-NMR-MS in drug discovery. Drug Discovery
Today 8, 624–631.

Bibliography
Cuman, R.K.N., Bersani-Amadio, C.A., Fortes, Z.B., 2001. Influence of Type 2
diabetes on the inflammatory response in rats. Inflammation Research 50,
460-465.
Demirdag, K., Bakcecioglu, I. H., Ozercan, I. H., Ozden, M., Yilmaz, S.,
Kalkan, A., 2004. Role of L-carnitine in the prevention of acute liver
damage induced by carbon tetrachloride in rats. Journal of
Gastroenterology and Hepatology 19, 333–338.
Dianzani, M.U., Muzia, G., Biocca, M.E., Canuto, R.A., 1991. Lipid peroxidation
in fatty liver induced by caffeine in rats. International Journal of Tissue
Reactions 13, 79-85.
Doreswamy, R., Sharma, D., 1995. Plant drugs for liver disorders management.
Indian Drugs 32, 139-144.
Drahl, C., Cravatt, B.F., Sorensen, E. J., 2005. Protein-reactive natural products.
Angewandte Chemie International Edition 44, 5788–5809.
Easu, K., 1964. Plant Anatomy. John Wiley and sons, New York, 767.
Easu, K., 1979.Anatomy of seed Plants. John Wiley and sons, New York, 550.
Elizabeth, K., Rao, M.N.A., 1990. Oxygen radical scavenging activity of
curcumin. International Journal of Pharmaceutics 58, 237-240.
Francis, D., Rita, L., 1986. Rapid colorimetric assay for cell growth and survival:
modifications to the tetrazolium dye procedure giving improved sensitivity
and reliability. Journal of immunological methods 89, 271-277.
Fyson, P.Y., 1932. The Flora of the South Indian Hill Stations 1, Today and
Tomorrows Print and Publishers, New Delhi, 444 - 452.

Bibliography
Ganesan, A., 2002. Recent developments in combinatorial organic synthesis. Drug
Discovery Today 7, 47–55.
Ganesan,A., 2004. Natural products as a hunting ground for combinatorial
chemistry. Current Opinion in Biotechnology 15, 584-590.
Garg, M., Singh, K.P., Bansal, D.D.,1997. Effect of vitamin C supplementation
on oxidative stress in experimental diabetes. Indian Journal of
Experimental Biology 35, 264-266.
Garrat, D.C., 1964. The Quantitative Analysis of Drugs. Chapman and Hall Japan,
3, 456-458.
Glickmann, R.M., Sebesin, S.M., 1982. Lipid metabolism. In : Asias, I.M.,
Schachter D, Popper H, Shafritz DA (Eds). Liver Biology and Pathobiology.
Raven Press. New York.
Grabowski, K., Schneider, G., 2007. Properties and architecture of natural
products revisited. Current Opinion in Chemical Biology 1, 115-127.
Greenwald, R.A., 2000. Animal models for evolution of arthritic drug. Methods
and Findings in Experimental and Clinical Pharmacology 13, 75-83.
Gupta, M., Mazumder, U.K., Sambath Kumar, R., Sivakumar, T., Vamsi, M.L.M.,
2004. Antitumor activity and antioxidant status of Caesalpinia bonducella
against Ehrlich ascites carcinoma in swiss albino mice. Journal of
Pharmacological Sciences 94, 177–184.
Gurib-Fackim,A.,2006. Medicinal plants :Traditions of yesterday and drugs of
tomorrow. Molecular aspects of Medicine 27, 1-93.
Bibliography
Gutteridgde, J.M.C., 1995. Free radicals in disease processes: A complication of
cause and consequence. Free Radicals Research Communications 19, 141-
158.
Halliwell, B., Chirico, S., 1993. Lipid peroxidation - its mechanism, measurement
and significance. American Journal of Clinical Nutrition 57, 715-724.
Halliwell, B., Gutteridge, J.M. C., Aruoma, O. I., 1987. The deoxyribose method:
a simple test-tube assay for determination of rate constants for reactions of
hydroxyl radicals. Analytical Biochemistry 165, 215-219.
Halliwell, B., Gutteridge, J.M.C., 1998. Free Radicals in Biology and Medicine,
3rd ed. Oxford University Press, London.
Harborne, J.B., 1984. Phytochemical Methods. Chapman and Hall, New York
123–175.
Hartwig, J.F., Cook, K.S., Hapke, M.,, Incarvito, C.D., Fan, Y., Webster, C.E.,
et al., 2005. Rhodium boryl complexes in the catalytic terminal
functionalization of alkanes. Journal of American Chemical Society 127,
2538-2552.
Havsteen, B., 1983. Flavonoids, a class of natural products of high
pharmacological potency. Biochemical Pharmacology 30, 1141-1148.
Heim K.E., Tagliaferro, A.R., Bobilya, D.J., 2002. Flavonoids antioxidants:
chemistry, metabolism, and structure activity relationships. Journal of
Nutritional Biochemistry 13, 572-584.
Hiroshi, A., Toshlharu, H., Masahiro, H., Shoji, A., 1987. An alteration in liver
microsomal membrane of the rat following paracetamol overdose. Journal
of Pharmacy and Pharmacology 39, 1047-1049.

Bibliography
Ho, Y.L., Chang, Y.S., 2002.Studies on the antinociceptive, anti-inflammatory
and anti pyretic effects of Isatis indigotica root. Phytomedicine 9, 419-
424.
Huong, N.T.T., Malsumato, K., Kasai, R., Yamasaki, K., Watanabeth., 1998.
In vitro antioxidant activity of Vietnamese ginseng saponin and its
components. Biological and Pharmaceutical Bulletin 21, 978–981.
Hwang, B.Y., Kim, H. S., Lee, J.H., Hong, Y.S., Lee, K.S., Lee, J.J., 2001.
Antioxidant activity of benzoylated flavon-3-ol glycosides from Celastrus
obiculatus. Journal of Natural Products 64, 82-84.
Ilavarasan, R., Mallika, M., Venkataraman, S., 2006. Anti–inflammatory and free
radical scavenging activity of Ricinus communis root extract. Journal of
Ethnopharmacology 103, 478–480.
Ismail, M., Manickam, E., Dania, A., Rahmat, A., Yahaya, A., 2000. Chemical
composition and antioxidant activity of Strobilanthes crispus leaf extract.
Journal of Nutritional Biochemistry 11, 536-542.
Ito, N., Hirose, M., Fukushima, H., Tsuda, T., Shirai, T., Tatenatsu, M. 1986.
Studies on antioxidants: Their carcinogenic and modifying effects on
chemical carcinogens. Food and Chemical Toxicology 24, 1071–1092.
Jaksa, S., Rahmat, A., Obhman, F., Ismail, P., Mansor, S.M., 2004. Cancer
induction and effect of Strobilanthes crispus leaf extract on liver histology
and enzymes changes in rats. Journal of Tropical Plants 5, 187-192.
Jayaprakasha, G.K., Jaganmohan Rao, L., Sakariah, K.K., 2004. Antioxidant
activities of flavidin in different in vitro model systems. Bioorganic and
Medicinal Chemistry 12, 5141-5146.

Bibliography
Johansen, D.A.,1940. Plant Microtechnique. Me Graw Hill Book Co, New
York..523.
Joyce, D.A., 1987. Oxygen radicals in disease. Adverse Drug Reactions Bulletin
127, 476-479.
Kinghorn, A.D., 2001. Pharmacognosy in the 21st century. Journal of Pharmacy
and Pharmacology 53, 135–148.
Kodavanti, P.R., Joshi, U.M., Young, Y.A., Meydrech, E.F., Mehendale, H.M.,
1989. Protection of hepatotoxic and lethal effects of CCl4 by partial
hepatectomy. Toxicology and Pathology, 17, 494–505.
Koehn, F.E., Carter, G.T., 2005. The evolving role of natural products in drug
discovery. Nature review Drug Discovery 4, 206–220.
Kokate, C.K., 1997. Practical Pharmacognosy, Vallabh Prakashan, New Delhi,
India, 107-111.
Kris-Etherton, P.M., Lefevre, M., Beecher, G.R., Gross, M.D., Keen, C.L.,
Etherton, T.D., 2004. Bioactive compounds in nutrition and health-
research methodologies for establishing biological function: the
antioxidant and anti-inflammatory effects of flavonoids on atherosclerosis.
Annual Review of Nutrition 24, 511–538.
Kulkarni, S.K., 1999. Hand Book of Experimental Pharmacology, Vallabh
Prakashan, New Delhi, India, 117-118.
Kushumoto, J.T., Shimadu, N., Kakiuchi, M., Hattori , M., Namba, T., 1992.
Inhibitory effects of Indonesian Plant extracts on reverse transcriptase of
an R.N.A. tumour virus (I). Phytotherapy Research 6, 241-244.

Bibliography
Landis, G.N., Tower, J., 2005. Superoxide dismutase evolution and life span
regulation. Mechanism of Aging and Development 126, 365–379.
Lee, K.J., Woo, E., Choi, C.Y., Shin, D.W., Lee, D.G., You, H.J. et al., 2004.
Protective effect of acteoside on carbon tetrachloride induced hepatotoxicity.
Life Sciences 74, 1051-1064.
Li, Y., Goodwin, D.C., 1999. Vital roles of an interhelical insertion in catalase-
peroxidase bifunctionality. Biochemical and Biophysical Research
communications 318, 970–976.
Liau, B.C., Jong, T.T., Lee, M.R., Chen, S.S., 2007. LP - APCI - MS method for
detection and analysis of trypanthrin, indigo and indirubin in Daginagye
and Banlangen. Journal of Pharmaceutical and Biomedical Analysis 43,
346 - 351.
Linardi, A., Costa, S.K.P., DeSilva, G.R., Antunes, E., 2002. Involvement of
kinins, mast cells and sensory neurons in the plasma exudation and paw
edema induced by Styphylococcal entrotoxin B in the mouse. European
Journal of Pharmacology 399, 235-242.
Marcocci, L., Packer, L., Droy-Lefaix, M. T., Sekaki, A., Gardes-Albert, M.,
1994. Antioxidant actions of Ginkgo biloba extract (EGb 761). Methods in
Enzymology 234, 462–475.
Mates, J.M., Perez-Gomez, C., De Castro, I., 1999. Antioxidant enzymes and
human diseases. Clinical Biochemistry 32, 595–603.
McCord, J.M., Fridovich, I., 1969. Superoxide dismutase – an enzymatic function
of erythrocuprein (hemocuperin). Journal of Biological Chemistry 244,
6049-6055.

Bibliography
Miller, A.L., 1996. Antioxidant flavonoids: Structure, function and clinical usage.
Alternative Medicine Reviews 1, 103-111.
Misra, H.P., Fridovich, I., 1972. The role of superoxide dismutase anion in the
autooxidation of epinephrine and sample assay in superoxide dismutase.
Journal of Biological Chemistry 241, 3170-3175.
Nair, R.B., Ravishankar, B., Vijayan, N.P., Sasikala, C.K., Saraswathy, V.N.,
1988. Anti-inflammatory effect of Strobilanthes heyneanus leaves a
biochemical study. Journal of research in Ayurveda and siddha 9, 49-58.
Nenadis, N., Wang, L., Tsimidou, M., Zhang, H., 2004. Estimation of scavenging
activity of phenolic compounds using the ABTS assay. Journal of
Agricultural and Food Chemistry 52, 4669-4674.
Newman, D.J., Cragg, G.M., Snader, K.M., 2000. The influence of natural
products upon drug discovery. Natural Product Reports 17, 215–234.
Newman, D.J., Cragg, G.M., Snader, K.M., 2003. Natural products as sources of
new drugs over the period 1981-2002. Journal of Natural Products 66,
1022–1037.
O'Brien, T.P., Feder, N., Me Cull, M.E.1964. Polychromatic Staining of Plant
Cell walls by toluidine blue-O.Protoplasma 59, 364-373.
Ohkawa, H., Ohishi, N., Yagi, K., 1979. Assay for lipid peroxides in animal tissue
by thiobarbuturic acid reaction. Analytical Biochemistry 95, 351–358.
Ortholand, J.Y., Ganesan, A., 2004. Natural products and combinatorial,
chemistry - back to the future. Current Opinion in Chemical Biology 8,
271-280.
Bibliography
Oyanagui, Y., 1983. Various actions of active oxygens on inflammatory
processes. Japanese Journal of Inflammation 3, 377-378.
Ozsoy, N., Can, A., Yanardag, R., Akev, N., 2008. Antioxidant activity of Smilax
excelsa L. leaf extracts.Food Chemistry 110, 571–583.
Philip, S., Rista, S., Dominic, S., Anne, M., James, M., 1990. New colorimetric
cytotoxic assay for anti cancer drug screening. Journal of the National
Cancer Institute 82, 1107-1112.
Poli G., 1993. Liver damage due to free radicals. British Medical Bulletin 49, 604-
620.
Rahmat, A., Edvini, S., Ismail., P., Yunthin, T., Abu Bakar, M., 2006. Chemical
constituents, antioxidant activity and cytotoxic effects of essential oil
from Strobilanthes inspus and Lawsonia inermis. Journal of Biological
Sciences 6, 1005-1010.
Rajesh, M.G., Latha, M.S., 2004. Protective effect of Glycyrrhiza glabra Linn. on
carbon tetrachloride-induced peroxidative damage. Indian Journal of
Pharmacology 36, 284–286.
Rao, R.R., 1973. Mechanism of drug induced hepatotoxicity. Indian Journal of
Pharmacology 5, 313–318.
Raskin, I., et al., 2002. Plants and human health in the twenty-first century. Trends
in Biotechnology 20, 522–531.
Re, R., Pellegrini, M., Proteggente, A., Pannala, A., Yang, M., Rice, E.C., 1999.
Antioxidant activity applying an improved ABTS radical cation
decolorisation assay. Free radical Biology and Medicine 26, 1231–1237.
Bibliography
Recknagel, R.O., 1983. A new direction in the study of carbon tetrachloride
hepatotoxicity. Life Sciences 33, 401-408.
Saggu, H., Cooksey, J., Dextr, D., 1989. A selective increase in particulate
superoxide dismutase activity in parkinsonian substania nigra. Journal of
Neurochemistry 53, 692-697.
Saklani, A., Kutty, S.K., 2008. Plant derived compounds in clinical trials. Drug
discovery today 13, 161-171.
Sallar, R., Meier, R., Brignoli R. 2001. The use of silymarin in the treatment of
liver diseases. Drugs 61, 2035-2063.
Samuelsson, G., 2004. Drugs of Natural Origin: a Textbook of Pharmacognosy,
5th Swedish Pharmaceutical Press, Stockholm.
Sanjappa, M., 2005. Plant diversity in India-status, conservation and challenges
(P. Maheshwari Medal Award Lecture). Proceedings of the XXVIII
Conference of Indian Botanical Society, Oct. 24-36, BSI., Dehradum, 5-6.
Sass,J.E.,1940. Elements of Botanical Microtechnique. McGraw Hill Book
Co,New York. 222.
Sevanian, A., Ursini, F., 2000. Lipid peroxidation in membranes and low density
lipoproteins – similarities and differences. Free radical Biology and
Medicine 29, 306-311.
Shahidi, F., and Wanasundara, P.D., 1992. Phenolic antioxidants. Critical Reviews
in Food Science and Nutrition 32, 67-103.

Bibliography
Shahjahan, M., Sabitha, K.E., Jainu, M., Devi, C.S.S., 2004. Effect of Solanum
trilobatum against carbon tetra chloride induced hepatic image in albino
rats. Indian Journal of Medical Research 120, 194-198.
Shingu, M., Todoroki, T., Oribe, M., Tomooka, K., Nobunaga, M., Nakagami, K.,
1982. Study on the mechanism of oxygen radical-induced inflammation.
Japanese Journal of Inflammation 2, 367-368.
Singh, B., Saxena, A.K., Chandan, B.K., Anand, K.K., Suri, O.P., SuriSatti, K.A.,
SuriSatti, N.K., 1998. Hepatoprotective activity of verbenalin on
experimental liver damage in rodents. Fitoterapia 69, 134–140.
Smuckler, E.A., 1975. Alcoholic drink: Its production and effects. Fed Process
34, 2038-2044.
Soediro, I.., Pellecuer, J., Andary, C., Privat, G., 1983. Strobilanthes Crispus (L)
BI.I: Premerikesaan Senyacoann turunan asa, kafeat verbacosid. Acta
pharmaceutical Indonesia VIII, 1-10.
Soediro, I.., Pellecuer, J., Andary, C., Privat, G., 1987. Strobilanthes Crispus (L)
BI.I: Premerikesaan Senyacoann turunan asa, kafeat verbacosid. Acta
pharmaceutical Indonesia XII, 1-7.
Spanos, G.A., Wrolstad, R.E., 1990. Influence of processing and storage on the
phenolic composition of Thompson seedless grape juice. Journal of
Agricultural and Food Chemistry 38, 1565-1571.
Steinbeck, C., 2004. Recent development in automated structure elucidation of
natural products. Natural Product Reports 21, 512–518.
Stich, H. F., 1991. The beneficial and hazardous effects of simple phenolic
compounds. Mutation Research 259, 307–324.

Bibliography
Suja, S.R., Latha, P.G., Pushpangadan, P., Rajasekharan, S., 2004. Evaluation of
hepatoprotective effects of Helminthostachys Zeylanica (L.) Hook against
carbon tetrachloride induced liver damage in wistar rats. Journal of
Ethnopharmacology 92, 61–66.
Sunarto, P.A., 1977. Materia Medica Indonesia 1 st ed. Penerbitan Directorate
Jenderwal Pengawasen Obat dan Makanan Jakarta, 95-99.
Swingle, K.F., Shideman, F.E., 1972. Phases of the inflammatory response to
subcutaneous implantation of a cotton pellet and their modification by
certain anti-inflammatory agents. Journal of Pharmacology and
Experimental Therapeutics 183, 226–234.
Tiwari, A., 2001. Imbalance in antioxidant defence and human diseases: Multiple
approach of natural antioxidants therapy. Current Science 81, 1179-1187.
Vasudevan, M., Gunnam, K. K., Parle, M., 2006. Antinociceptive and anti-
inflammatory properties of Daucus carota seeds extract. Journal of Health
Sciences 52, 598-606.
Venu, P., 2006. Strobilanthes Blume (Acanthaceae) in Peninsular India. The Flora
of India - IV, BSI, Kolkata, 129 - 131.
Wendel, A., Feuersteins, S., Konz, K.H., 1987. Acute paracetamol intoxication of
starved mice leads to lipid peroxidation in vivo. Biochemical
Pharmacology 8, 2051-2053.
WHO, Regional Health Report. 1997. South East Asia Region Viral Hepatitis.
Regional Office for South-East Asia, New Delhi, 45-47.

Bibliography
Winter, C.A., Risley, G.A., Nass, G.W., 1962. Carrageenan-induced edema in
hind paw of the rat as an assay for anti-inflammatory drugs. Proccedings
of the Society of Experimental Biology and Medicine 3, 544-547.
Wolf, P.L., 1999. Biochemical diagnosis of liver diseases. Indian Journal of
Clinical Biochemistry 14, 59–90.
Yadav, N.P., Dixit, V.K., 2003. Hepatoprotective activity of leaves of Kalanchoe
pinnata Pers. Journal of Ethnopharmacology 86, 197–202
Yogespiriya, S., Hanachi, P., Patimah, R., Asmah, R., Fanziah, O., 2005.
Histological study during hepatocarciniogenesis in rats treated with
Strobilanthes crispus extract. Journal of Biological Sciences 2, 153-157.
Yoshikawa, T., Tanaka, H., Kondo, M., 1985. The increase of lipid peroxidation
in rat adjuant arthritis and its inhibition by superoxide dismutase.
Biochemical. Medicine 3, 320-326.

PAPERS COMMUNICATED FOR PUBLICATION
1. Geetha B, Badami S. Pharmacognostical studies of Strobilanthes
kunthianus. (Communicated to Journal of Natural Products Research
and Resources).
2. Geetha B, Badami S. In vitro antioxidant activity of Strobilanthes
kunthianus (Communicated to Indian Drugs).
3. Geetha B, Mahendran S, Badami S, Maithili V. Analgesic and anti-
inflammatory activities of Strobilanthes kunthianus (Communicated to
Indian Journal of Pharmacology).
4. Geetha B, Mahendran S, Badami S, Maithili V. Antioxidant and
hepatoprotective activities of Strobilanthes kunthianus (Communicated
to Indian Journal of Experimental Biology).
5. Geetha B, Ravi S, Badami S. Phytoconstituents from Strobilanthes
kunthianus (Communicated to Indian Journal of Heterocyclic
Chemistry).