PHYSIOLOGICALLY BASED MODELING OF HALON REPLACEMENTS FOR HUMAN
69
PHYSIOLOGICALLY BASED MODELING OF HALON REPLACEMENTS FOR HUMAN SAFETY EVALUATION Allen Vinegar and Gary W. Jepson Air Force Research Laboratory/Operational Toxicology Branch (AFRL/HEST) – ManTech Environmental Technology, Inc. Next-Generation Fire Suppression Technology Program (NGP) Project 3B/1/89 Final Report – Section I of II This research is part of the Department of Defense’s Next-Generation Fire Suppression Technology Program, funded by the DoD Strategic Environmental Research and Development Program (SERDP)
Transcript of PHYSIOLOGICALLY BASED MODELING OF HALON REPLACEMENTS FOR HUMAN

PHYSIOLOGICALLY BASED MODELING OF HALON REPLACEMENTS FOR HUMAN
SAFETY EVALUATION
Allen Vinegar and Gary W. Jepson
Air Force Research Laboratory/Operational Toxicology Branch (AFRL/HEST) – ManTech
Environmental Technology, Inc.
Next-Generation Fire Suppression Technology Program (NGP)
Project 3B/1/89
Final Report – Section I of II
This research is part of the Department of Defense’s Next-Generation Fire Suppression Technology
Program, funded by the DoD Strategic Environmental Research and Development Program
(SERDP)

2
TABLE OF CONTENTS
Page
GENERAL INTRODUCTION……………………...………………………………………………….4
REQUIREMENTS FOR CONDUCTING MONTE CARLO SIMULATIONS FOR ESTABLISHING
SAFE EXPOSURE TIMES FOR POTENTIAL HALON REPLACEMENTS AGENTS….….…..….5
SETTING SAFE ACUTE EXPOSURE LIMITS FOR HALON REPLACEMENT CHEMICALS
USING PHYSIOLOGICALLY-BASED PHARMACOKINETIC MODELING…………………..…10
Abstract………………….…………………………………………………..…………….11
Introduction…………………………………...……………………………..…………….12
Methods………………………………………………..……………………..……………13
Results………..……………………………………………………………...…………….15
Discussion…………………………………………………………………………………16
Acknowledgments.……..……………………………………………………..…………..19
References.………………………………………………………………………………..20
Table I – Parameter Distributions for Monte Carlo Analysis...….…………..…………..25
Table II – Partition Coefficients...…………………………………………..……………26
Table III – Acceptable Human Exposure Times for Halon 1301...………………………27
Table IV – Acceptable Human Exposure Times for CF3I…....…………….……………27
Table V – Acceptable Human Exposure Times for HFC-125……………..…………….27
Table VI – Acceptable Human Exposure Times for HFC-227ea.………….……………28
Table VII – Acceptable Human Exposure Times for HFC-236fa..………..…………….28
Figure Legends….……….………………………………………………...…………….29
Figures…………………………………………………………………..……………31-33
MODELING CARDIAC SENSITIZATION POTENTIAL OF HUMANS EXPOSED TO HALON
1301 OR HALON 1211 ABOARD AIRCRAFT………………………………..…………………….34
Abstract………………………………………………………………………………….35
Introduction………………..…………………………………………………………….36
Materials and Methods...………………………………………………….……………..38
Results………………………….………………………………………….…………….39

3
TABLE OF CONTENTS (continued)
Page
Figures…..………….………………………………………………..……………..42-51
Discussion……………..……………………………………………………...………..52
Acknowledgments………...…………………………………………………..………..52
Literature Cited…….…………………………………………………………..………53
PHYSIOLOGICALLY BASED PHARMACOKINETIC MODEL FOR SIMULATING BREATH-
BY-BREATH INHALATION……………………………………………………….55
Program…………………………………………………………………………………56
Appendix: Setup File for Performing Monte-Carlo Simulation Using ACSL-TOX
Software……………………………………………………………64
Appendix: Sample M File for conducting Monte-Carlo Simulation for Halon 1301…..66

4
GENERAL INTRODUCTION This section of the final report contains several parts. The first part describes the necessary requirements for enabling one to conduct simulations for assessing safe exposure times. These requirements involve chemical specific data necessary for running the model and biological data collection for validating the model. The second part demonstrates the use of the model in setting acute exposure limits for Halon 1301 and four potential replacement candidates: CF3I, HFC-125, HFC-227ea, and HFC-236fa. This part has been submitted to the journal Inhalation Toxicology and has been accepted for publication. The third part makes use of published data on releases of Halon 1301 and Halon 1211 in aircraft. These data are used to demonstrate whether in the scenarios presented there would be any potential hazard for individuals being exposed under the stated conditions. This part will be submitted to the journal Aviation, Space, and Environmental Medicine. Finally, the fourth part presents a listing of the actual code for the physiologically based pharmacokinetic model used for simulating short–term exposures to halogenated hydrocarbons. This code, as it stands, is written to run with the Advanced Continuous Simulation Language package called ACSL-TOX. The distributor for this software is Pharsight Corporation, Mountain View, CA.

5
Requirements for Conducting Monte Carlo Simulations for Establishing Safe Exposure Times for Potential Halon Replacement Agents
Allen Vinegar and *Gary W. Jepson
AFRL/HEST
ManTech Environmental Technology Inc. P.O. Box 31009
Dayton, OH 45437
*Current address of G.W. Jepson - E. I. Du Pont de Nemours and Company
Haskell Laboratory for Toxicology And Industrial Medicine
1090 Elkton Rd., P.O. Box 50 Newark, DE 19714

6
The procedures for determining safe exposure time involve using a physiologically based pharmacokinetic (PBPK) model to determine the arterial blood concentration associated with a potential human exposure to a chemical agent and comparing it with the arterial blood concentration attained by a dog exposed to that agent after five minutes of exposure at the lowest observable adverse effect level (LOAEL) for cardiac sensitization (Vinegar and Jepson, 1996; Vinegar et al., (in press)). In order to make these determinations for any chemical agent the following chemical specific information is needed: 1 - cardiac sensitization LOAEL determined in beagle dogs, 2 - arterial concentration measured after five minutes of exposure of beagles to the LOAEL concentration, 3 - partition coefficients of the chemical in blood, liver, fat, and muscle from rat, 4 - metabolic constants (determined from gas uptake studies using rats), 5 - partition coefficients of the chemical in human blood (partitions measured using human liver, fat, and muscle would be desirable but not necessary). A validated PBPK model capable of tracking ventilation on a breath-by-breath basis is needed for performing the simulations (Vinegar et al., 1998). The model must be capable of running under a system that allows the performance of Monte Carlo simulations. 1 – Cardiac sensitization LOAEL determined in beagle dogs. The standard for evaluating exposure to agents that might potentially evoke a cardiac sensitization response is the cardiac sensitization test performed in beagle dogs (Dodd and Vinegar, 1998). The results of this test are expressed in terms of the lowest observed adverse effect level (LOAEL) and no observed adverse effect level (NOAEL). The LOAEL value is used as the target value for the PBPK assessment of safe exposure time. One of the problems is how far apart the LOAEL and NOAEL values are from each other. This is a function of the step size in concentration used for the cardiac sensitization test. The expense of the test often prevents a small increment from being used. 2 – Arterial concentration measured after five minutes of exposure of beagles to the LOAEL concentration. The arterial concentration attained by a beagle after five minutes of exposure is taken as the target with which to compare a human exposure simulation. Attaining this information requires that studies be done with beagles that have been cannulated for the sampling of arterial blood. At least six beagles should be exposed, without epinephrine challenge, at three exposure concentrations for 10 minutes at each exposure. The concentrations should be the LOAEL, approximately 25% above the LOAEL, and approximately 25k% below the LOAEL. Blood samples should be taken at least at 1, 2, 5, 7, and 10 minutes. The five minute time point is most critical as it provides the target arterial concentration. Multiple sample points and exposure concentrations are necessary to check the reliability of the data obtained. The volatility and low biological tissue solubility of these chemicals produce challenges for accurate data collection and analysis. Prior to performing the exposures, tests should be done on the material to be used for arterial cannulation. The materials used in the manufacture of cannulas often absorb chemicals. A cannula that is inert with respect to one chemical may not be so for another. Furthermore, even if the solubility is low in the cannula, the tissue solubility may be in the same order of magnitude or lower. Therefore, as blood is drawn it may give up chemical to or take up chemical from the cannula depending on the concentration gradient. Sampling at multiple time points gives

7
information about expected pharmacokinetic behavior. If the data don’t conform to expected behavior, the reliability of the five-minute point is called into question. Performing exposures at three concentrations also allows observation of expected relationships in blood concentration vs. time of sampling vs. exposure concentration. It is important that the laboratory performing these studies be aware of and know how to conduct experiments in light of these problems. 3 - Partition coefficients of the chemical in blood, liver, fat, and muscle from rat. One of the basic chemical specific requirements for the PBPK model is solubility in tissues. Standard techniques have been published for determining solubility or partition coefficients of volatile chemicals (Gargas et al., 1989). However, this method depends upon a difference measurement as part of the methodology. Partition coefficients of chemicals of low solubility, such as many of the halon replacements candidates, can not be accurately measured by this method. Instead, a method using direct measurements such as the direct tonometry method described by Eger (1987) and Lerman et al. (1985 and 1986) must be used instead. A modification of this method is currently being addressed in our laboratory. The published method uses homogenized tissue. We find that non-uniform homogenization and sticking of tissue to glass with resulting loss results in variable data. Our modification uses whole tissue pieces. 4 - Metabolic constants (determined from gas uptake studies using rats). The other chemical specific data needed for running a PBPK model are the metabolic constants. These are obtained using a gas uptake method as described by Gargas et al. (1986). Fortunately, most of the proposed halon replacements are relatively inert and have extremely low to no measurable metabolism. Furthermore, even with moderate metabolism, there is no noticeable effect on the outcome of short-term simulations required for modeling of cardiac sensitization. 5 - Partition coefficients of the chemical in human blood (partitions measured using human liver, fat, and muscle would be desirable but not necessary). The most sensitive parameter for determination of the correct blood concentration is the blood partition coefficient. Therefore since the model is being used to simulate human exposures, human blood partition coefficients must be measured. For short term simulations the model is almost insensitive to differences in the other partitions. Since human blood partitions often differ by as much as two-fold from rat blood partitions it is necessary to make the human blood measurements. Other tissue partitions tend not to differ as much. However, if human tissue is available then the tissue partitions should be determined. Statements concerning methodology under 3 above, apply to this section also. Model validation.

8
After obtaining partition coefficients and determining metabolic constants for a chemical it is necessary to collect data to demonstrate that the model is capable of simulating exposures to the chemical. Since the initial model is constructed using rat partition coefficients and rat metabolic constants, pharmacokinetic data should be collected from at least six rats that have been exposed by inhalation to the chemical. Typically, the exposure should be for an hour with an hour post-exposure for sampling during the off gassing of the chemical. Validation using only blood requires a minimum number of animals since blood can be serially sampled. However, validation for tissue concentrations requires serial sacrificing of animals during and after the exposure. The total number of animals would then be six times the number of time points sampled (minimally five during exposure and five post-exposure). Only seldom are there human data for a direct validation of the human model. For new agents the likelihood of obtaining human data is negligible.

9
Literature Cited Dodd, E.E. and A. Vinegar. 1998. Cardiac sensitization testing of the halon replacement candidates trifluoroiodomethane (CF3I) and 1,1,2,2,3,3,3-heptafluoro-1-iodopropane (C3F7I). Drug Chem. Toxicol. 21:137-149. Eger, E.I. 1987. Partition coefficients of I-653 in human blood, saline, and olive oil. Anesth. Analg. 66:971-973. Gargas, M.L., M.E. Andersen, and H.J. Clewell, III. 1986. A physiologically-based simulation approach for determining metabolic constants from gas uptake data. Toxicol. Appl. Pharmacol. 86:341-352. Gargas, M.L., R.J. Burgess, D.E. Voisard, G.H. Cason, and M.E. Andersen. 1989. Partition coefficients of low-molecular-weight volatile chemicals in various liquids and tissues. Toxicol. Appl. Pharmacol. 98:87-99. Lerman, J., G.A. Gregory, M.M. Willis, B.I. Schmidt, and E.I. Eger. 1985. Age and the solubility of volatile anesthetics in ovine tissues. Anesth. Analg. 64:1097-1100. Lerman, J. G.A. Gregory, M.M. Willis, B.I. Schmidt-Bantel, and E.I. Eger. 1986. Effect of age on the solubility of volatile anesthetics in human tissues. Anesth. Analg. 65:307-311. Vinegar, A. and G.W. Jepson. 1996. Cardiac sensitization thresholds of halon replacement chemicals predicted in humans by physiologically based pharmacokinetic modeling. Risk Anal. 16:571-579. Vinegar, A., G.W. Jepson, M. Cisneros, R. Rubenstein, and W. J. Brock. (in press). Setting safe acute exposure limits for halon replacement chemicals using physiologically-based pharmacokinetic modeling. Inhal. Toxicol. Vinegar, A. G.W. Jepson, and J.H. Overton. 1998. PBPK modeling of short-term (0 to 5 min) human inhalation exposures to halogenated hydrocarbons. Inhal. Toxicol. 10:411-429.

10
SETTING SAFE ACUTE EXPOSURE LIMITS FOR HALON REPLACEMENT CHEMICALS USING PHYSIOLOGICALLY-BASED PHARMACOKINETIC MODELING ALLEN VINEGAR, GARY W. JEPSON1
AFRL/HEST, ManTech Environmental Technology, WPAFB, OH 45433 MARK CISNEROS Great Lakes Chemical Corporation, W. Lafeyette, IN 47905 REVA RUBENSTEIN U.S. Environmental Protection Agency, Washington, DC 20460 WILLIAM J. BROCK2 The DuPont Company, Haskell Laboratory for Toxicology and Industrial Medicine, Newark, DE 19714
Safe Exposure Limits For Halon Replacements Address all Correspondence to: Allen Vinegar ManTech Environmental Technology, Inc. P.O. Box 31009 Dayton, OH 45437
Phone: 937-255-5150 x3145 Fax: 937-258-2197 Email: [email protected]
1 Current Address: The DuPont Company, Haskell Laboratory for Toxicology and Industrial Medicine, Newark, DE 2 Current Address: Unilever Research-U.S., Edgewater, NJ

11
Most proposed replacements for Halon 1301 as a fire suppressant are halogenated hydrocarbons.
The acute toxic endpoint of concern for these agents is cardiac sensitization. An approach is
described which links the cardiac endpoint as assessed in dogs to a target arterial concentration
in humans. Linkage was made using a physiologically based pharmacokinetic (PBPK) model.
Monte Carlo simulations, which account for population variability, were used to establish safe
exposure times at different exposure concentrations for Halon 1301 (bromotrifluoromethane),
CF3I (trifluoroiodomethane), HFC-125 (pentafluoroethane), HFC-227ea (1,1,1,2,3,3,3-
heptafluoropropane), and HFC-236fa (1,1,1,3,3,3-hexafluoropropane). Application of the
modeling technique herein described not only makes use of the conservative cardiac sensitization
endpoint, but also uses an understanding of the pharmacokinetics of the chemical agents to better
establish standards for safe exposure. The combined application of cardiac sensitization data and
physiologically based modeling provides a quantitative approach, which can facilitate the
selection and effective use of halon replacement candidates.
Key Words: Cardiac Sensitization, Halon Replacement Chemicals, Physiologically Based
Pharmacokinetic Modeling, Safe Exposure Limits, Humans, Halon 1301, CF3I, HFC-125, HFC-
227ea, HFC-236fa

12
INTRODUCTION
Many, if not most, of the proposed replacements for Halon 1301 in fire suppression
applications are halogenated hydrocarbons. As a group, acute exposure to the halogenated
hydrocarbons has been associated with the ability to reversibly increase the sensitivity of the
heart to epinephrine (Reinhardt, 1971; Mullin, 1979). Consequently cardiac sensitization has
been of keen interest to regulatory authorities for setting guidelines for human exposure to these
agents because the use of these agents involves potentially acute high concentration exposure.
Vinegar and Jepson (1996) outlined a procedure for setting exposure limits for halon
replacement chemicals using physiologically-based pharmacokinetic (PBPK) modeling to predict
blood levels associated with the potential onset of a cardiac sensitization response. The approach
outlined by Vinegar and Jepson links the laboratory data that are generated from a routine
cardiac sensitization toxicity test in dogs to relevant events occurring for humans exposed to
potential cardiac sensitizers. The LOAEL (lowest observed adverse effect level) for cardiac
sensitization in beagle dogs is determined by inhalation exposure to the chemical of interest and
challenging intravenously with epinephrine levels well above physiological levels. Therefore, the
test is considered conservative and the resulting LOAEL is used without any correction factors.
The epinephrine challenge is given five minutes into the exposure. That the effect is due to the
peak concentration of chemical rather than area under the curve (AUC) has been established
(Reinhardt et al., 1971). Thus, the arterial concentration at five minutes is the target arterial
concentration or dose metric that is associated with the potential for cardiac sensitization.
Different exposure concentration scenarios can then be modeled using the PBPK model. The
time required for an arterial concentration to reach the LOAEL target arterial concentration could
be considered the safe (i.e., protective) exposure duration.

13
Variability in human physiological parameters should be considered in determining safe
exposure times. Others have used Monte Carlo simulations to describe the effect of
interindividual variability on the output of PBPK models (Bois et al., 1991; Bois and Paxman,
1992; Clewell and Jarnot, 1994; Cronin et al., 1995; Farrar et al., 1989, Hetrick et al., 1991;
Portier and Kaplan, 1989; Simon, 1997; Spear et al., 1991; Thomas et al., 1996a&b; Yang et al.,
1995). However, none of these studies involved predicting short-term (0 to 5 min) effects. This
paper describes the methods developed for determining short-term safe exposure times for halon
replacement candidates using Monte Carlo simulations to account for variability and presents the
results for Halon 1301 (bromotrifluoromethane) and four potential replacement chemicals CF3I
(trifluoroiodomethane), HFC-125 (pentafluoroethane), HFC-227ea (1,1,1,2,3,3,3-
heptafluoropropane), and HFC-236fa (1,1,1,3,3,3-hexafluoropropane).
METHODS Target Arterial Concentrations of Chemical in Blood Arterial concentrations measured at five minutes in dogs exposed to the LOAEL
concentration served as the target arterial concentrations for modeling a safe exposure for
humans. Out of a group of dogs exposed to each chemical, the lowest measured five-minute
value was taken as the target arterial concentration for use in modeling human exposure. The
target arterial concentrations used were: Halon 1301, 25.7 mg/L; CF3I, 12.9 mg/L; HFC-125,
47.8 mg/L; HFC-227ea, 26.3 mg/L; and HFC-236fa, 90.3 mg/L (Huntingdon, 1998).
Physiologically Based Pharmacokinetic (PBPK) Model
The human PBPK model used in this work was described by Vinegar et al. (1998) and differs
from the more traditional PBPK model in that it includes a respiratory-tract compartment

14
containing a dead-space region and a pulmonary exchange area. It was used successfully to
simulate the pharmacokinetics of halothane, isoflurane, and desflurane which are structurally
similar to many of the chemicals being considered as halon replacements. The pulmonary
exchange area has its own air space, tissue, and capillary subregions. Respiration is described on
a breath-by-breath basis. This more detailed lung description was necessary to successfully
simulate pharmacokinetic data in the 0 to 1 min range as illustrated for halothane (Vinegar et al.,
1998). Additional physiological compartments described in this model are liver, fat, lung, gut,
slowly perfused and rapidly perfused tissues. All model compartments are perfusion limited and
metabolism, if present, is assumed to occur in the liver. Tissue volumes, blood flows and
ventilation rates for humans are shown in Table I.
Chemical-Specific Model Parameters and Values Blood/air partitions were measured using human blood. In some cases human tissue partition
coefficient data were available and in others only rodent data were available. Rodent metabolic
rate constants were available for these chemicals, but none of them had human metabolism data.
The assumption made for this work was that rat metabolism data can be extrapolated to humans
using allometric scaling ([body weight]0.75). Variance from this assumption does not impact the
work here because: (1) this group of chemicals shows as a general characteristic extremely slow
metabolism (Creech et al., 1995a,b; Vinegar et al., 1995) and (2) metabolism has not
demonstrated an effect on these short term (five minute) simulations even when moderate levels
are incorporated into the model. Metabolism for all chemicals was set to zero except for CF3I
where the maximal velocity constant VMAXC = 0.375 for an allometrically scaled 1.0 kg animal
and the Michaelis-Menten constant KM=0.1. Partition coefficients were determined using a

15
modification of a described tonometry method (Eger, 1987; Lerman et al., 1985; Lerman et al.,
1986) and appear in Table II.
Monte Carlo Simulations
In order to consider the variability in a population Monte Carlo simulations were run with
1000 iterations. Each iteration was sampled randomly from the designated distribution for each
of the model constants (Tables I and II). Upper and lower bounds on normally distributed
parameters were set at the ± 3 standard deviation levels. Monte Carlo simulations were
performed using ACSL TOX simulation software (Pharsight Corp., Mountain View, CA)
operating under Windows95 and WindowsNT (Microsoft Corp., Redmond, WA).
RESULTS Results of the simulations are shown graphically for each chemical (Figure 1-5). Each
simulation line represents the mean arterial concentration plus two standard deviations for a
1000-iteration simulation of human exposure at a given concentration. The horizontal line
represents the target arterial concentration, i.e., the lowest dog arterial concentration measured at
five minutes exposure to the LOAEL. At lower exposure concentrations the target arterial
concentration is not reached in the five-minute period. As exposure concentrations are increased
the arterial concentrations begin to approach the target arterial concentration and do so sooner at
higher exposure concentrations.

16
The same information is presented in tabular form (Table III-VII). Exposure concentration is
presented in increments of 0.5% (0.05% for CF3I) and the time in minutes (up to 5) that a human
can safely be exposed to that concentration is indicated.
DISCUSSION
Currently, requirements for safe exposure design of Halon 1301 and potential replacement
chemicals for use as total flooding agents in a fire-fighting scenario are specified as follows
(U.S. EPA, 1994).
1. Design to NOAEL (cardiac sensitization in dog) where egress from an area cannot be
accomplished within one minute
2. Up to LOAEL if egress can occur in 30 sec to 1 min
3. Above the LOAEL if egress can occur in less than 30 sec and area is normally
unoccupied
These specifications do not take into consideration the pharmacokinetics of the agents and the
relationship between the exposure concentration and the internal concentration actually
associated with a cardiac event. Examination of Tables III-VII reveals interesting relationships
between the cardiac sensitization LOAEL and time for safe human exposure. Exposure to HFC-
125 can occur safely for at least five minutes at an exposure concentration of 11.5%, which is
1.5% above the LOAEL. Similarly, exposure to HFC-227ea can occur safely for at least five
minutes at 10.5%, which actually is the LOAEL. However, the safe five minute exposure for
HFC-236fa occurs at 12.5% which is 2.5% below the LOAEL, for CF3I occurs at 0.3% which is
0.1% below the LOAEL, and for Halon 1301 occurs at 5.5% which is 2.0% below the LOAEL.

17
Ultimately, the duration of safe exposure must be examined in relation to the concentration of
agent needed to extinguish a fire. A comparison can be made between the concentration for safe
five-minute exposure and the recommended design concentration of agent. HFC-125 with an
11.5% safe exposure concentration has a recommended design concentration of 10.0 to 11.0%.
HFC-227ea with a 10.5% safe exposure concentration has a recommended design concentration
of 7.0%. Thus, even though safe exposure to HFC-125 can occur above the LOAEL and to HFC-
227ea only at the LOAEL, the difference between the safe exposure concentration and the
recommended design concentration is only 0.5% for HFC-125 and 3.5% for HFC-227ea.
Interestingly, Halon 1301 with a five-minute safe exposure concentration of 5.5%, 2.0% below
the LOAEL, has a recommended design concentration of 5.0% which is only 0.5% below the
safe exposure concentration. Halon 1301 has a long history of safe use, which points to the
conservative nature of the cardiac sensitization endpoint, which ultimately determines the target
arterial concentration, which in turn is used for determining safe exposure time.
The cardiac sensitization endpoint occurs as a result of the exposure of a chemical sensitizing
the heart to an epinephrine challenge. The challenge is given to the dog after five minutes of
exposure. Therefore, the increased level of sensitivity is due to the concentration of chemical at
the heart at five minutes. It is this level attained after five minutes of exposure that is used as the
target for simulations of human exposure to the chemical. Whenever the simulated human
exposure indicates that the human arterial concentration approaches that of the target level the
assumption is made that there can then be a potential for cardiac sensitization to occur in the
exposed human.
In order to account for individual variability, Monte Carlo simulations were performed. The
mean simulated arterial concentration plus two standard deviations, which is compared with the

18
target arterial concentration, accounts for 97.5% of the simulated population, i.e., in 97.5% of the
population arterial concentration would reach the target arterial concentration at the time (or
later) where the simulation reaches the target.
Furthermore, the target arterial concentration used for this assessment of safe exposure is
determined in a conservative manner. Stressed exercising dogs reached a level of circulating
epinephrine of about 0.4 µg/L (Buhler et al., 1978; Carriere et al., 1983; Keller-Wood et al.,
1982; Young et al., 1985). The level of epinephrine used to challenge the dogs during a cardiac
sensitization test ranges from 1.0 to 12.0 µg/kg body weight (Dodd and Vinegar, 1998). Since
dogs have a total blood volume of about 8.2 percent body weight (Brown et al., 1997) the stated
doses of epinephrine would result in concentrations of about 12 to 146 µg/L or 30 to 365 times
the levels circulating under normal stressed physiological conditions. These are conservative
estimates of the concentration that reaches the heart with an epinephrine challenge since the
above calculation assumes that the epinephrine immediately dilutes throughout the whole blood
volume. The actual dilution, between the site of injection into the cephalic vein and reaching the
heart muscle through the coronary artery, takes place in about one fifth of the blood volume. This
dilution is an estimate of the blood volume in the vasculature between the injection site and the
arterial blood feeding the coronary arteries. It is an approximation using blood flow information
from Leggett and Williams (1995) and Bischoff and Brown (1966). Concentrations reaching the
heart through the coronary arteries would be five times higher than calculations above indicate
(60 to 730 µg/L or 150 to 1825 times the circulating levels). It is recognition of the conservative
nature of the cardiac sensitization test that allows the EPA to apply the LOAEL and NOAEL
determined in the dog directly to humans without application of adjustment for a dog to human
extrapolation.

19
The critical issue in applying any standard for safe exposure is the relationship between the
effective concentration of agent necessary to extinguish a fire and the concentration that poses a
potential threat for cardiac sensitization. Where the extinguishing concentration approaches the
cardiac sensitization concentration the agent may still be approved for use as a fire extinguishant
but only in areas that are normally unoccupied. For candidate agents where the extinguishing
concentration is above the cardiac sensitization concentration there is reluctance by some to risk
using the agent because of perceived potential for accidental exposure. An additional
consideration is that many of these agents release halogen acids upon contact with heat. The
toxicity of these acids is of concern. Levels of release can be reduced if the fire can be put out
quickly, which can be done if higher concentrations of extinguishing agent are used.
Application of the modeling technique herein described not only makes use of the
conservative cardiac sensitization endpoint, but also uses an understanding of the
pharmacokinetics of the chemical agents to better establish standards for safe exposure. The
combined application of cardiac sensitization data and physiologically based modeling provides
a quantitative approach, which can facilitate the selection and effective use of halon replacement
candidates.
ACKNOWLEDGMENTS
The animals used in this study were handled in accordance with the principles stated in the
Guide for the Care and Use of Laboratory Animals, prepared by the Committee on Care and Use
of Laboratory Animals of the Institute of Laboratory Animal Resources, National Research
Council, DHHS, National Institute of Health Publication #86-23, 1985, and the Animal Welfare
Act of 1966, as amended.

20
Support for this work was provided partially by the Department of Defense’s Next Generation
Fire Suppression Technology Program, funded by the DoD Strategic Environmental Research
and Development Program (SERDP) and through Department of the Air Force Contract No.
F41624-96-C-9010. The manuscript has been reviewed by the Office of Public Affairs and
assigned the following technical report number, AFRL-HE-WP-TR-200X-XXXX.
The statements and opinions expressed in this article are those of the authors and do not
necessarily reflect the official policies of the United States Environmental Protection Agency,
unless this is clearly specified.
REFERENCES
Bischoff, K. B. and Brown, R. G. 1966. Drug distribution in mammals. Chemical Engineering
Progress Symposium Series, Vol 62, No. 66, pp33-45.
Bois, F. Y. and Paxman, D. G. 1992. An analysis of exposure rate effects for benzene using a
physiologically based pharmacokinetic model. Regul. Toxicol. Pharmacol. 15:122-136.
Bois, F. Y., Woodruff, T. J., and Spear, R. C. 1991. Comparison of three physiologically based
pharmacokinetic models of benzene disposition. Toxicol. Appl. Pharmacol. 110:79-88.
Brown, R. P., Delp, M. D., Lindstedt, S. L., Rhomberg, L. R., and Beliles, R. P. 1997.
Physiological parameter values for physiologically based pharmacokinetic models. Toxicol.
Industr. Health, 13:407-484.
Buhler, H. U., DaPrada, M., Haefely, W., and Picotti, G. B. 1978. Plasma adrenaline,
noradrenaline and dopamine in man and different animal species. J. Physiol. 276:311-320.

21
Carriere, S., Demassieux, S., Cardinal, J., and LeGrimellec, C. 1983. Release of epinephrine
during carotid artery occlusion following vagotomy in dogs. Can. J. Physiol. Pharmacol.
61:495-501.
Clewell, H. J. and Jarnot, B. M. 1994. Incorporation of pharmacokinetics in noncancer risk
assessment: Example with chloropentafluorobenzene. Risk Anal. 14:265-276.
Creech, J. R., Black, R. K., Garrity, B. L., Abbas, R., Dong, L., Williams, R. J., McDougal, J. N.,
Vinegar, A., and Jepson, G. W. 1995a. Inhalation uptake and metabolism of iodohalogenated
compounds, CF3I, C6F13I, and C3F7I. Technical Report AL/OE-TR-1995-0089, U.S. Air
Force, Armstrong Laboratory, Occupational and Environmental Health Directorate,
Toxicology Division, Wright-Patterson AFB, OH, viii + 14pp.
Creech, J. R., Black, R. K., Neurath, S. K., caracci, M. C., Williams, R. J., Jepson, G. W., and
Vinegar, A. 1995b. Inhalation uptake and metabolism of Halon 1301 replacement candidates,
HFC-227ea, HFC-125, and FC-218. Technical Report AL/OE-TR-1995-0022. U.S. Air
Force, Armstrong Laboratory, Occupational and Environmental Health Directorate,
Toxicology Division, Wright-Patterson AFB, OH, ii + 51pp.
Cronin IV, W. J., Oswald, E. J., Shelley, M. L., Fisher, J. W., and Flemming, C. D. 1995. A
trichloroethylene risk assessment using a Monte Carlo analysis of parameter uncertainty in
conjunction with physiologically-based pharmacokinetic modeling. Risk Anal. 15:555-565.
Davis, N. R. and Mapleson, W. W. 1981. Structure and quantification of a physiological model
of the distribution of injected agents and inhaled anesthetics. Br. J. Anaesth. 53:399-405.
Dodd, D. E. and Vinegar, A. 1998. Cardiac sensitization testing of the halon replacement
candidates trifluoroiodomethane (CF3I) and 1,1,2,2,3,3,3-heptafluoro-1-iodopropane (C3F7I).
Drug Chem. Toxicol. 21:137-149.

22
Eger, E. I. 1987. Partition coefficients of I-653 in human blood, saline, and olive oil. Anesth.
Analg. 66:971-973.
Farrar, D., Allen, B., Crump, K. and Shipp, A. 1989. Evaluation of uncertainty in input
parameters to pharmacokinetic models and the resulting uncertainty in output. Toxicol. Lett.
49:371-385.
Hetrick, D. M., Jarabek, A. M., and Travis, C. C. 1991. Sensitivity analysis for physiologically
based pharmacokinetic models. J. Pharmacokin. Biopharmacol. 19:1-20.
Huntingdon Life Sciences Ltd. 1998. HFC 236fa, HFC 227ea, HFC 125 and CF3I. An
Inhalation Study to Investigate the Blood Levels of Inhaled Halocarbons in the Beagle Dog.
Prepared by Huntingdon Life Sciences Ltd, England. Huntingdon Report Number IFP
001/984370. Submitted under subcontract to ICF Incorporated, Washington DC, under EPA
Contract 68-D5-0147, Work Assignment 2-09.
Keller-Wood, M. E., Wade, C. E., Shinsako, J., Keil, L. C., Van Loon, G. R., and Dallmann, M.
F. 1982. Insulin-induced hypoglycemia in conscious dogs: Effect of maintaining carotid
arterial glucose levels on the adrenocorticotropin, epinephrine and vasopressin responses.
Endocrinology, 112:624-632.
Leggett, R. W. and Williams, L. R. 1995. A proposed blood circulation model for reference man.
Health Phys. 69:187-201.
Lerman, J., Gregory, G. A., Willis, M. M., Schmidt, B. I., and Eger, E. I. 1985. Age and the
solubility of volatile anesthetics in ovine tissues. Anesth. Analg. 64:1097-1100.
Lerman, J., Gregory, G. A., Willis, M. M., Schmidt-Bantel, B. I., and Eger, E. I. 1986. Effect of
age on the solubility of volatile anesthetics in human tissues. Anesth. Analg. 65:307-311.

23
Mullin, L. S., Reinhardt, C. F., and Hemingway, R. E. 1979. Cardiac arrhythmias and blood
levels asociated with inhalation of Halon 1301. Amer. Ind. Hyg. Assoc. J. 40:653-658.
Portier, C. J. and Kaplan, N. L. 1989. Variability of safe dose estimates when using complicated
models of the carcinogenic process. Fundam. Appl. Toxicol. 13:533-544.
Reinhardt, C. F., Azar, A., Maxfield, M. E., Smith, P. E., Jr., and Mullin, L. S. 1971. Cardiac
arrhythmias and aerosol “sniffing”. Arch. Environ. Health, 22:265-279.
Simon, T. W. 1997. Combining physiologically based pharmacokinetic modeling with Monte
Carlo simulation to derive an acute inhalation guidance value for trichloroethylene. Regul.
Toxicol. Pharmacol. 26:257-270.
Spear, R. C., Bois, F. Y., Woodruff, T., Auslander, D., Parker, J., and Selvin, S. 1991. Modeling
benzene pharmacokinetics across three sets of animal data: parametric sensitivity and risk
implications Risk Anal. 11:641-654.
Thomas, R. S., Bigelow, P. L., Keefe, T. J., and Yang, R. S. H. 1996a. Variability in biological
exposure indices using physiologically based pharmacokinetic modeling and Monte Carlo
simulation. Am. Indust. Hyg. Assoc. J. 57:23-32.
Thomas, R. S., Lytle, W. E., Keefe, T. J., Constan, A. A., and Yang, R. S. H. 1996b.
Incorporating Monte Carlo simulation into physiologically based pharmacokinetic models
using advanced continuous simulation language (ACSL): A computational method. Fundam.
Appl. Toxicol. 31:19-28.
U. S. Environmental Protection Agency. 1994. “SNAP Technical Background Document: Risk
Screen on the Use of Substitutes for Class I Ozone-depleting Substances, Fire Suppression
and Explosion Protection (Halon Substitutes),” U. S. Environmental Protection Agency,
Office of Air and Radiation, Stratospheric Protection Division, Washington, DC.

24
Vinegar, A., Buttler, G. W., Caracci, M. C., and McCafferty, J. D. 1995. Gas uptake kinetics of
1,1,1,2,2,2-hexafluoropropane (HFC-236fa) and identification of its potential metabolites.
Technical Report AL/OE-TR-1995-0177, U.S. Air Force, Armstrong Laboratory,
Occupational and Environmental Health Directorate, Toxicology Division, Wright-Patterson
AFB, OH, iv + 42pp.
Vinegar, A. and Jepson, G. W. 1996. Cardiac sensitization thresholds of halon replacement
chemicals predicted in humans by physiologically-based pharmacokinetic modeling Risk
Anal. 16:571-579.
Vinegar, A., Jepson, G. W. and Overton, J. H. 1998. PBPK modeling of short-term (0 to 5 min)
human inhalation exposures to halogenated hydrocarbons Inhal. Toxicol. 10:411-429.
Williams, R. J., Vinegar, A., McDougal, J. N., Jarabek, A. M., and Fisher, J. W. 1996. Rat to
human extrapolation of HCFC-123 kinetics deduced from halothane kinetics: A corollary
approach to physiologically based pharmacokinetic modeling. Fundam. Appl. Toxicol.
30:55-66.
Yang, R. S. H., El-Masri, H. A., Thomas, R. S., and Constan, A. A. 1995. The use of
physiologically-based pharmacokinetic/pharmacodynamic dosimetry models for chemical
mixtures. Toxicol. Lett. 82/83:497-504.
Young, M. A., Hintze, T. H., and Vatner, S. F. 1985. Correlation between cardiac performance
and plasma catecholamine levels in conscious dogs. Am. J. Physiol. 248:H82-H88.

25
Table I - Parameter Distributions for Monte Carlo Analysis
Parameters
Means1
CV2
Upper Bound
Lower Bound
Distribution
Plasma Flows (fraction of cardiac output)
QPC
Alveolar ventilation (L/hr/kg) 17.4
0.8
Lognormal
QCC
Cardiac output (L/hr/kg ) = QPC
QFC
Fat 0.029
0.30
0.042
0.016
Normal
QGC
Gut
0.219
0.33
0.364
0.075
Normal
QLC
Liver
0.089
0.32
0.147
0.030
Normal
QSC
Slowly perfused tissues
0.202
0.30
0.384
0.020
Normal
QRC
Richly perfused tissues = 1.0 – QSC – QLC- QFC- QGC
Tissue Volumes (fraction of body weight)
BW
Body weight (kg)
70
0.26
97.3
42.7
Normal
VFC
Fat
0.215
0.24
0.409
0.022
Normal
VGC
Gut
0.022
0.15
0.035
0.0088
Normal
VLC
Liver
0.027
0.25
0.043
0.011
Normal
VRC
Richly perfused tissues
0.041
0.30
0.066
0.016
Normal
VSC
Slowly perfused tissues = 0.88 – VFC – VGC – VLC – VRC
1Mean values taken from Davis and Mapelson (1981) and Williams et al. (1996) 2Coefficients of variation taken from Thomas et al. (1996a)

26
Table II – Partition Coefficients (Lognormal Distribution) of Halon 1301 and Selected Replacement Agents (Geometric Mean ± Geometric Standard Deviation) Parameters Halon 1301 CF3I HFC-227ea HFC-125 HFC-236fa PB1 0.062H ± 1.057 0.410H ± 1.118 0.033H ± 1.033 0.074H ± 1.081 0.106H ± 1.053 PF2 0.771H ± 1.164 9.014R ± 1.145 0.347R ± 1.541 0.533R ± 1.334 0.678R ± 1.104 PL3 0.145H ± 1.085 0.192R ± 1.380 0.031R ± 1.965 0.062R ± 1.381 0.106R ± 1.075 PR4 0.145H ± 1.085 0.192R ± 1.380 0.031R ± 1.965 0.062R ± 1.381 0.106R ± 1.075 PS5 0.159R ± 1.498 0.239R ± 1.180 0.021R ± 5.889 0.070R ± 1.230 0.091R ± 1.067 1Blood/air 2Fat/air 3Liver/air 4Richly perfused tissues/air 5Slowly perfused tissues/air HHuman RRat

27
Table III. Acceptable Human Exposure Times at Stated Concentrations for Halon 1301.
Halon 1301 Concentration % v/v PPM
Time (Minutes)*
6.0 60,000 5.00 6.5 65,000 1.33 7.0 70,000 0.59 7.5 75,000 0.42 8.0 80,000 0.35
*Based on the 5-minute blood concentration of dogs exposed to Halon 1301 at the LOAEL of 7.5%
Table IV. Acceptable Human Exposure Times at Stated Concentrations for CF3I
CF3I concentration % v/v PPM
Time (Minutes)*
0.30 3000 5.00 0.35 3500 4.30 0.40 4000 0.85 0.45 4500 0.49 0.50 5000 0.35
*Based on the 5-minute blood concentration of dogs exposed to CF3I at the LOAEL of 0.4%
Table V. Acceptable Human Exposure Times at Stated Concentrations for HFC-125.
HFC-125 concentration% v/v PPM
Time (Minutes)*
11.5 115,000 5.00
12.0 120,000 1.13 12.5 125,000 0.73 13.0 130,000 0.59 13.5 135,000 0.50
*Based on the 5-minute blood concentration of dogs exposed to HFC-125 at the LOAEL of 10.0%

28
Table VI. Acceptable Human Exposure Times at Stated Concentrations for HFC-227ea.
HFC-227ea concentration % v/v PPM
Time (Minutes)*
10.5 105,000 5.00
11.0 110,000 1.13 11.5 115,000 0.60 12.0 120,000 0.49
*Based on the 5-minute blood concentration of dogs exposed to HFC-227ea at the LOAEL of 10.5%
Table VII. Acceptable Human Exposure Times at Stated Concentrations for HFC-236fa.
HFC-236fa concentration % v/v PPM
Time (Minutes)*
12.5 125,000 5.00 13.0 130,000 1.93 13.5 135,000 0.99 14.0 140,000 0.73 14.5 145,000 0.55 15.0 150,000 0.49
*Based on the 5-minute blood concentration of dogs exposed to HFC-236fa at the LOAEL of 15.0%

29
Figure Legends
Figure 1 – Monte Carlo simulations of arterial concentration of humans exposed to Halon 1301
for five minutes at concentrations of 5.5, 6.0, 6.5, 7.0, 7.5, and 8.0%. The horizontal line at
25.7 mg/L represents the lowest arterial blood concentration measured at five minutes in a
group of six dogs exposed to Halon 1301 at the cardiac sensitization LOAEL of 7.5%.
Figure 2 – Monte Carlo simulations of arterial concentration of humans exposed to CF3I for five
minutes at concentrations of 0.25, 0.30, 0.35, 0.40, 0.45, and 0.50%. The horizontal line at 12.9
mg/L represents the lowest arterial blood concentration measured at five minutes in a group of
six dogs exposed to CF3I at the cardiac sensitization of LOAEL of 0.4%.
Figure 3 – Monte Carlo simulations of arterial concentration of humans exposed to HFC-125 for
five minutes at concentrations of 11.0, 11.5, 12.0, 12.5, and 13.0%. The horizontal line at 47.8
mg/L represents the lowest arterial blood concentration measured at five minutes in a group of
six dogs exposed to HFC-125 at the cardiac sensitization LOAEL of 10.0%.
Figure 4 – Monte Carlo simulations of arterial concentration of humans exposed to HFC-227ea
for five minutes at concentrations of 10.0, 10.5, 11.0, 11.5, 12.0%. The horizontal line at 26.3
mg/L represents the lowest arterial blood concentration measured at five minutes in a group of
six dogs exposed to HFC-227ea at the cardiac sensitization LOAEL of 10.5%.

30
Figure 5 – Monte Carlo simulations of arterial concentration of humans exposed to HFC-236fa
for five minutes at concentrations of 12.5, 13.0, 13.5, 14.0, 14.5, and 15.0%. The horizontal
line at 90.37 mg/L represents the lowest arterial blood concentration measured at five minutes
in a group of six dogs exposed to HFC-236fa at the cardiac sensitization LOAEL of 15.0%.

31
Halon 1301
0.0 1.0 2.0 3.0 4.0 5.0MINUTES
AR
TE
RIA
L B
LO
OD
CO
NC
EN
TR
AT
ION
(mg/
L)
15.0
20.
0
25.
0
30
.0
35
.0
5.5%
6.0%
6.5%
7.0%
7.5%
8.0%
EXPOSURECONC
0.0 1.0 2.0 3.0 4.0 5.0MINUTES
CF3I5.0
10.
0
15
.0
2
0.0
AR
TE
RIA
L B
LO
OD
CO
NC
EN
TR
AT
ION
(mg/
L)
0.25%
0.30%
0.35%
0.40%
0.45%
0.50%
EXPOSURECONC

32
0.0 1.0 2.0 3.0 4.0 5.0MINUTES
30.0
40.
0
50
.0
6
0.0
AR
TE
RIA
L B
LO
OD
CO
NC
EN
TR
AT
ION
(mg/
L)
HFC-125
11.0%11.5%12.0%
12.5%13.0%13.5%
EXPOSURECONC
0.0 1.0 2.0 3.0 4.0 5.0
MINUTES
HFC-227ea
15.0
20.
0
25.
0
30
.0
3
5.0
AR
TE
RIA
L B
LO
OD
CO
NC
EN
TR
AT
ION
(mg/
L)
10.0%10.5%11.0%11.5%12.0%
EXPOSURECONC

33
0.0 1.0 2.0 3.0 4.0 5.0
70.0
80.0
90.
0
100
.0
110.
0
MINUTES
AR
TE
RIA
L B
LO
OD
CO
NC
EN
TR
AT
ION
(mg/
L)
12.0%
12.5%
13.0%
13.5%14.0%
14.5%15.0%
HFC-236fa
EXPOSURECONC

34
MODELING CARDIAC SENSITIZATION POTENTIAL OF HUMANS EXPOSED TO HALON 1301 OR HALON 1211
ABOARD AIRCRAFT
ALLEN VINEGAR3, M.S., Ph.D.
AFRL/HEST, ManTech Environmental Technology, WPAFB, OH 45433
Short Title: HALON EXPOSURE ABOARD AIRCRAFT Address all correspondence to: Allen Vinegar ManTech Environmental Technology, Inc. P.O. Box 31009 Dayton, OH 45437 Phone: 937-255-5150x3145 Fax: 937-258-2197 Email: [email protected]
3 Author is currently Chief Scientist with ManTech Environmental Technology, Inc. at Wright-Patterson AFB, OH.

35
Abstract
Halon 1301 and Halon 1211 are being replaced because they contribute to the depletion
of ozone. Many of the potential candidate chemicals for replacing them are, like them,
halogenated hydrocarbons. These chemicals have the potential to cause cardiac
sensitization at high enough exposure concentrations. A physiologically based
pharmacokinetic model, which mathematically describes the uptake, distribution,
metabolism, and elimination of chemicals, was used to relate exposure to these chemicals
with arterial blood concentrations resulting from the exposure. This information was then
used to evaluate the potential for the occurrence of a cardiac-sensitizing event. The model
was used to analyze the exposures to Halon 1301 and Halon 1211 in three aircraft. Halon
1301 exposures were shown to be safe but Halon 1211 resulted in arterial concentrations
in exposed individuals that reached levels that could potentially cause cardiac
sensitization. Use of the model for evaluating the risk from exposure to Halon 1301 and
Halon 1211 is a moot point since both chemicals are being replaced. However,
demonstration of the validity of the approach provides a tool for the evaluation of the
health safety of replacement candidates.
Index Terms: cardiac sensitization, halon, physiologically based pharmacokinetic model,
fire extinguishant

36
Introduction
Halons, used as fire extinguishants, have been banned from production because of
international concern for the depletion of stratospheric ozone. Only existing stocks are
available for essential application use in aircraft fire and explosion suppression systems.
Constantly changing political pressure puts these stocks at risk for elimination, increasing
the need to make halon alternatives available for aircraft use. Most chemicals being
considered as replacements for Halon 1301 and 1211 are halogenated hydrocarbons
which, as a class, are regulated by the U.S. Environmental Protection Agency (1).
Cardiac sensitization is the acute toxic endpoint of concern. Dogs are monitored
continually for electrocardiographic changes indicative of the appearance of a burst of
multifocal ventricular ectopic activity or ventricular fibrillation. They are given an
epinephrine challenge after 5 min of exposure to the test chemical. The test is performed
at several chemical concentrations to determine a no observable adverse effect level
(NOAEL) and a lowest observable adverse effect level (LOAEL). The LOAEL and
NOAEL values are used directly for establishing human exposure limits because of the
sensitive nature of the test (1).
Recently, a mathematical tool was developed which allows the quantitative evaluation of
short-term exposure to halogenated hydrocarbons (2). This tool is a physiologically based
pharmacokinetic (PBPK) model, which can relate chemical exposure to concentrations in
the body. It has been proposed that the model be used to relate external exposure of halon
replacement chemicals to arterial blood concentration. Arterial blood concentration can
then be compared with a target arterial blood concentration associated with cardiac

37
sensitization. The methodology for doing this has been proposed (3) and described in
detail (4).
The PBPK model can be used both retrospectively to evaluate previous actual exposure
scenarios and prospectively to evaluate potential exposure scenarios. An example of a
retrospective evaluation was given in Vinegar et al. (2) where they evaluated an
accidental exposure to Halon 1211 that had occurred during an Israeli military exercise
(5). In this instance, model predictions were consistent with the outcome where the
gunner, having only brief exposure, successfully escaped without incident but the driver,
with prolonged exposure, reached levels adequate for cardiac sensitization. The driver, in
fact, was observed to be in ventricular fibrillation, never regained consciousness and died
as a result of the incident. A prospective application of the model was demonstrated by
Vinegar et al. (6). In order to evaluate the potential hazard to ground crews of an
accidental release of CF3I a discharge test was conducted on an F-15 jet to record CF3I
concentration time histories at various locations near the aircraft. These exposure data
were used with the PBPK model to simulate the potential blood levels of workers at
various locations around the aircraft during the release. The blood levels were compared
to the target arterial blood concentration associated with cardiac sensitization. Results
showed that at some locations the target was not reached but at the open nacelle the blood
concentrations could potentially reach double the target. This information was put in
perspective with a further retrospective simulation of individuals who had actually
inhaled CF3I and whose blood concentrations were simulated and estimated to be 100
times the target. These individuals experienced no apparent effect of their exposures.
Further prospective application of the model was demonstrated in Vinegar et al. (4). Here

38
a method was demonstrated for establishing safe duration for exposure to potential halon
replacements at different flooding concentrations.
An issue of health concern is that of the intentional use of fire extinguishers in aircraft
cabins with passengers aboard. No data were available for any of the potential halon
replacements. However, there have been several published reports on measurements
taken in aircraft cabins during the release of Halon 1301 and Halon 1211. These data
were used with the PBPK model to see if any of the described scenarios could put
passengers or crew at potential risk for cardiac sensitization. Results of these simulations
are reported herein.
Materials and Methods
Three publications were found that presented data on releases of Halon 1211 and/or
Halon 1301 in aircraft. The first study (7) used a fleet configured Navy E-2B “Hawkeye”
airplane. Concentrations of Halon 1301 were measured at head level in areas occupied by
flight crewmembers, and in airplane locations where fire hazard potential posed the
greatest threat. Halon 1301 was monitored using a Statham Laboratories Model GA-2A
gas recorder and accessories.
The second study (8) used a Cessna Model C-421B, a small pressurized aircraft. Halon
1211 and Halon 1301 were measured using factory field modified Beckman Model 865
infrared gas analyzers. Measurements were made at three locations:
1. Test area – Actual fire extinguisher discharge location.

39
2. Knee area – 20 inches above the floor at the area of discharge. Discharge area for
pilot’s and copilot’s seat tests was at knee level where the seat cushion meets the seat
back.
3. Nose area – 37 inches above the floor at the area of discharge.
The last study (9) used a Cessna Model 210C, a small non-pressurized aircraft. Halon
1211 and Halon 1301 were measured using modified Beckman Model 865 infrared gas
analyzers. Measurements were made at the point of release and at two other selected sites
during each test.
In all three publications there are diagrams showing the specific locations monitored. The
data were presented in graphic form. Results reaching the highest peak exposure
concentrations were used from each paper. The data were digitized and converted to
ASCII so that they could be used with the PBPK model. Exposure scenarios selected
were used to simulate the arterial concentration using the model described by Vinegar et
al. (2). Arterial concentrations were compared with target arterial concentrations for
cardiac sensitization (4).
Results
Representative results for the Navy E-2B are shown in Figures 1 and 2. A ground test is
illustrated in Figure 1. Concentrations of Halon 1301 measured at four locations are
shown in the left-hand column. Simulated arterial concentrations for each of the four

40
locations are shown in the right hand column. The straight line shown at 25.7 mg/L for
each of the arterial simulations represents the target concentration for cardiac
sensitization. None of the simulated concentrations reached the target. An example of a
flight test is shown in Figure 2. Under these conditions at floor level in the equipment
area the concentrations of Halon 1301 in arterial blood exceeded the target concentration
at about 40 seconds into the exposure and remained above the target for the duration of
the measurements. Arterial concentration simulations remained below target at the other
measured sites.
Results for representative releases aboard the Cessna C-421B are shown in Figures 3 to 6.
Halon 1301 releases at the last vent before the left side door (Figure 3) or at the last vent
on the right side of the cabin (Figure 4) resulted in simulated arterial concentrations well
below the target concentration. Both releases of Halon 1211 resulted in simulated arterial
concentrations that surpassed the target concentration of 21.0 mg/L (Figures 5 and 6).
The target was exceeded at both sites of release. The release at the copilot’s seat (Figure
5) had measurements at nose level, which exceeded the target after about 45 seconds of
exposure. Release at the cabin side of grill under the copilot’s seat resulted in simulated
arterial concentration at the knee area exceeding the target after about 16 seconds and
peaking at more than three times the target at about 26 seconds (Figure 6). However, nose
area concentrations remained below the target.
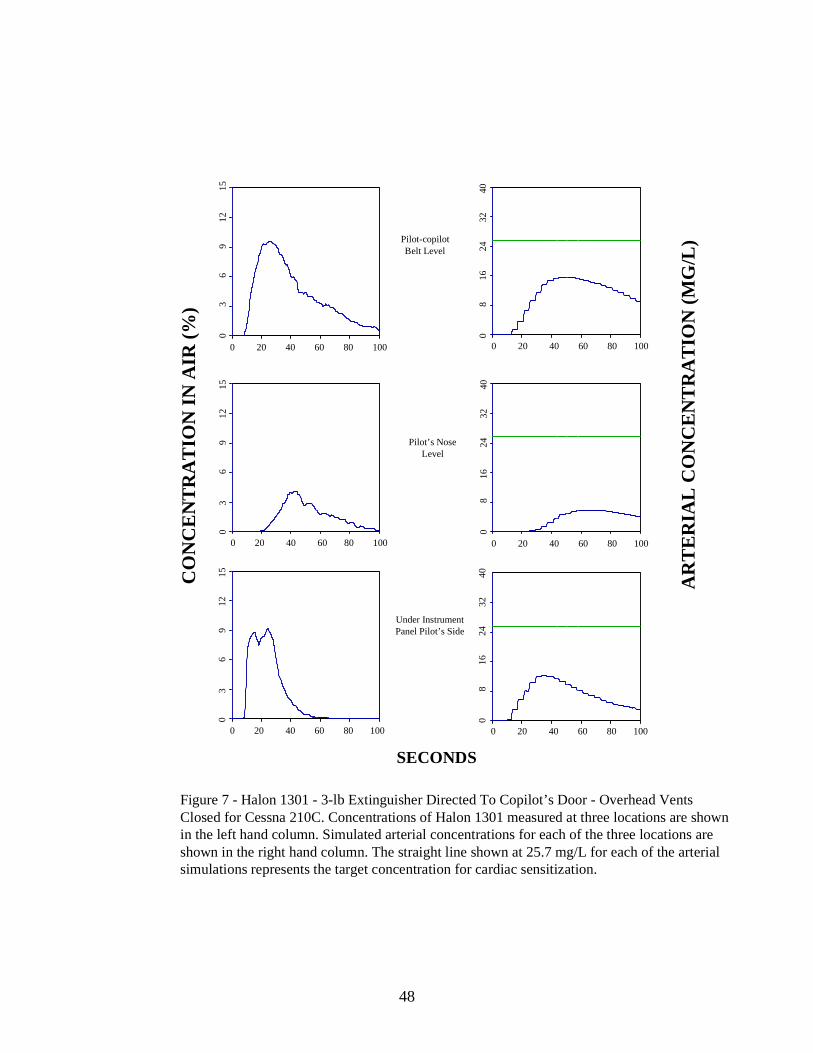
Halon 1301 arterial concentrations remained below the target concentration for releases,
in the Cessna 210C, directed to the copilot’s door with overhead vents closed (Figure 7)
and directed to fuel and hydraulic selector valves with overhead vents open (Figure 8).

41
Halon 1211 arterial concentrations exceeded the target level at all measured locations
when the extinguisher was directed under the instrument panel on the pilot’s side with
overhead vents open (Figure 9) or closed (Figure 10).

42
SECONDSFigure 1 - Halon 1301 - Ground Test (equipment cooling System ON) for Navy E-2b. Concentrations ofHalon 1301 measured at four locations are shown in the left hand column. Simulated arterialconcentrations for each of the four locations are shown in the right hand column. The straight line shownat 25.7 mg/L for each of the arterial simulations represents the target concentration for cardiac sensitization.
0 60 120 180 240 300 0 60 120 180 240 300
CO
NC
EN
TRA
TIO
N IN
AIR
(%)
AR
TE
RIA
L C
ON
CE
NT
RA
TIO
N (M
G/L
)
0
8
16
2
4
3
2
4
0
0
6
12
1
8
2
4
3
0
0 60 120 180 240 300 0 60 120 180 240 300
Personnel Area
0 60 120 180 240 3000 60 120 180 240 300
0
8
16
2
4
3
2
4
0
0
6
12
1
8
2
4
3
0
Head LevelEquipment Area
0 60 120 180 240 300 0 60 120 180 240 300
0
8
16
2
4
3
2
4
0
0
6
12
1
8
2
4
3
0
Floor LevelEquipment Area
0
8
16
2
4
3
2
4
0
0
6
12
1
8
2
4
3
0
Aft EquipmentArea

43
Figure 2 - Halon 1301 - Flight Test (Nozzle Jets Mixing Agent) for Navy E-2B. Concentrations of Halon1301 measured at four locations are shown in the left hand column. Simulated arterial concentrationsfor each of the four locations are shown in the right hand column. The straight line shown at 25.7 mg/Lfor each of the arterial simulations represents the target concentration for cardiac sensitization.
SECONDS
CO
NC
EN
TR
AT
ION
IN A
IR (%
)
AR
TER
IAL
CO
NC
EN
TR
AT
ION
(MG
/L)
0 60 120 180 240 300 0 60 120 180 240 300
0
8
16
2
4
3
2
4
0
0
6
12
1
8
2
4
3
0
Personnel Area
0 60 120 180 240 3000 60 120 180 240 300
0
8
16
2
4
3
2
4
0
0
6
12
1
8
2
4
3
0
Head LevelEquipment Area
0 60 120 180 240 300 0 60 120 180 240 300
0
8
16
2
4
3
2
4
0
0
6
12
1
8
2
4
3
0
Floor LevelEquipment Area
0 60 120 180 240 300 0 60 120 180 240 300
0
8
16
2
4
3
2
4
0
0
6
12
1
8
2
4
3
0
Aft EquipmentArea

44
Figure 3 - Halon 1301 - Concentrations Cabin Area Last Vent Before Door Left Side forCessna C-421B. Concentrations of Halon 1301 measured at three locations are shown in theleft hand column. Simulated arterial concentrations for each of the three locations are shownin the right hand column. The straight line shown at 25.7 mg/L for each of the arterialsimulations represents the target concentration for cardiac sensitization.
0 18 36 54 72 900 18 36 54 72 90
0 18 36 54 72 90 0 18 36 54 72 90
0 18 36 54 72 90 0 18 36 54 72 90
SECONDS
CO
NC
EN
TR
AT
ION
IN A
IR (%
)
AR
TE
RIA
L C
ON
CE
NT
RA
TIO
N (M
G/L
)
0
8
16
2
4
3
2
4
00
8
16
24
32
40
0
8
16
2
4
3
2
4
0
0
3
6
9
12
1
50
3
6
9
12
15
0
3
6
9
12
1
5
Test Area
Knee Area
Nose Area

45
Figure 4 - Halon 1301 - Concentrations Cabin Area Last Vent Right Side for Cessna C-421B.Concentrations of Halon 1301 measured at three locations are shown in the left hand column.Simulated arterial concentrations for each of the three locations are shown in the right handcolumn. The straight line shown at 25.7 mg/L for each of the arterial simulations representsthe target concentration for cardiac sensitization.
0 18 36 54 72 900 18 36 54 72 90
0 18 36 54 72 90 0 18 36 54 72 90
0 18 36 54 72 90 0 18 36 54 72 90
SECONDS
CO
NC
EN
TR
AT
ION
IN A
IR (%
)
AR
TE
RIA
L C
ON
CE
NT
RA
TIO
N (M
G/L
)
0
8
16
2
4
3
2
4
00
8
16
24
32
400
8
16
24
32
40
0
3
6
9
12
1
50
3
6
9
12
15
0
3
6
9
12
15
Test Area
Knee Area
Nose Area

46
Figure 5 - Halon 1211 - Concentrations Copilot’s Seat for Cessna C-421B. Concentrationsof Halon 1211 measured at three locations are shown in the left hand column. Simulatedarterial concentrations for each of the three locations are shown in the right hand column.The straight line shown at 21.0 mg/L for each of the arterial simulations represents the targetconcentration for cardiac sensitization.
0 18 36 54 72 900 18 36 54 72 90
0 18 36 54 72 90 0 18 36 54 72 90
0 18 36 54 72 90 0 18 36 54 72 90
SECONDS
CO
NC
EN
TR
AT
ION
IN A
IR (%
)
AR
TE
RIA
L C
ON
CE
NT
RA
TIO
N (M
G/L
)
0
2
0
4
0
6
0
8
0
10
00
20
40
60
80
100
0
2
0
4
0
6
0
8
0
10
0
0
3
6
9
12
1
50
3
6
9
12
15
0
3
6
9
12
15
Test Area
Knee Area
Nose Area

47
Figure 6 - Halon 1211 - Concentrations Cabin Side Of Grill Under Copilot’s Seat for CessnaC-421B. Concentrations of Halon 1211 measured at three locations are shown in the left handcolumn. Simulated arterial concentrations for each of the three locations are shown inthe right hand column. The straight line shown at 21.0 mg/L for each of the arterial simulationsrepresents the target concentration for cardiac sensitization.
0 18 36 54 72 900 18 36 54 72 90
0 18 36 54 72 90 0 18 36 54 72 90
0 18 36 54 72 90 0 18 36 54 72 90
SECONDS
CO
NC
EN
TR
AT
ION
IN A
IR (%
)
AR
TE
RIA
L C
ON
CE
NT
RA
TIO
N (M
G/L
)
0
2
0
4
0
6
0
8
0
10
00
20
40
60
80
100
0
2
0
4
0
6
0
8
0
10
0
0
3
6
9
12
1
50
3
6
9
12
15
0
3
6
9
12
15
Test Area
Knee Area
Nose Area
48
Figure 7 - Halon 1301 - 3-lb Extinguisher Directed To Copilot’s Door - Overhead VentsClosed for Cessna 210C. Concentrations of Halon 1301 measured at three locations are shownin the left hand column. Simulated arterial concentrations for each of the three locations areshown in the right hand column. The straight line shown at 25.7 mg/L for each of the arterialsimulations represents the target concentration for cardiac sensitization.
0 20 40 60 80 1000 20 40 60 80 100
0 20 40 60 80 100 0 20 40 60 80 100
0 20 40 60 80 100 0 20 40 60 80 100
SECONDS
CO
NC
EN
TR
AT
ION
IN A
IR (%
)
AR
TE
RIA
L C
ON
CE
NT
RA
TIO
N (M
G/L
)
0
8
16
2
4
3
2
4
00
8
16
24
32
40
0
8
1
6
2
4
3
2
4
0
0
3
6
9
12
1
50
3
6
9
12
15
0
3
6
9
12
15
Pilot-copilotBelt Level
Pilot’s NoseLevel
Under InstrumentPanel Pilot’s Side

49
Figure 8 - Halon 1301 - 3-lb Extinguisher Directed To Fuel And Hydraulic SelectorValves - Overhead Vents Open for Cessna 210C. Concentrations of Halon 1301 measured atthree locations are shown in the left hand column. Simulated arterial concentrations for eachof the three locations are shown in the right hand column. The straight line shown at 25.7 mg/Lfor each of the arterial simulations represents the target concentration for cardiac sensitization.
0 20 40 60 80 1000 20 40 60 80 100
0 20 40 60 80 100 0 20 40 60 80 100
0 20 40 60 80 100 0 20 40 60 80 100
SECONDS
CO
NC
EN
TR
AT
ION
IN A
IR (%
)
AR
TE
RIA
L C
ON
CE
NT
RA
TIO
N (M
G/L
)
0
8
16
2
4
3
2
4
00
8
16
24
32
40
0
8
16
2
4
3
2
4
0
0
3
6
9
12
1
50
3
6
9
12
15
0
3
6
9
12
15
Pilot-copilotBelt Level
Pilot’s NoseLevel
Fuel AndHydraulic
Selector Valve

50
Figure 9 - Halon 1211 - 2.5-lb Extinguisher Directed Under Instrument Panel Pilot’s Side -Overhead Vents Open for Cessna 210C. Concentrations of Halon 1211 measured at three locationsare shown in the left hand column. Simulated arterial concentrations for each of the threelocations are shown in the right hand column. The straight line shown at 21.0 mg/L for each ofthe arterial simulations represents the target concentration for cardiac sensitization.
0 20 40 60 80 1000 20 40 60 80 100
0 20 40 60 80 100 0 20 40 60 80 100
0 20 40 60 80 100 0 20 40 60 80 100
SECONDS
CO
NC
EN
TR
AT
ION
IN A
IR (%
)
AR
TE
RIA
L C
ON
CE
NT
RA
TIO
N (M
G/L
)
0
2
0
4
0
6
0
8
0
1
000
20
40
60
80
100
0
2
0
4
0
6
0
8
0
1
00
0
3
6
9
12
1
50
3
6
9
12
15
0
3
6
9
12
15
Pilot-copilotBelt Level
Pilot’s NoseLevel
Under InstrumentPanel Pilot’s Side

51
Figure 10 - Halon 1211 - 2.5-lb Extinguisher Directed Under Instrument Panel Pilot’sSide - Overhead Vents Closed for Cessna 210C. Concentrations of Halon 1211 measured atthree locations are shown in the left hand column. Simulated arterial concentrations for each ofthe three locations are shown in the right hand column. The straight line shown at 21.0 mg/L foreach of the arterial simulations represents the target concentration for cardiac sensitization.
0 20 40 60 80 1000 20 40 60 80 100
0 20 40 60 80 100 0 20 40 60 80 100
0 20 40 60 80 100 0 20 40 60 80 100
SECONDS
CO
NC
EN
TR
AT
ION
IN A
IR (%
)
AR
TE
RIA
L C
ON
CE
NT
RA
TIO
N (M
G/L
)
0
2
0
4
0
6
0
8
0
1
000
20
40
60
80
100
0
2
0
4
0
6
0
8
0
1
00
0
3
6
9
12
1
50
3
6
9
12
15
0
3
6
9
12
15
Pilot-copilotBelt Level
Pilot’s NoseLevel
Under InstrumentPanel Pilot’s Side

52
Discussion
The use of Halon 1301 for several decades has occurred with an excellent safety record.
Retrospective modeling of scenarios such as those illustrated above show that generally
under normal use there has been little to no opportunity for the occurrence of exposure
situations where individuals have been put at potential risk of having blood levels of
Halon 1301 ever reach a target concentration that might predispose for the onset of a
cardiac sensitization response. Halon 1211 when used as a streaming agent under open
conditions likewise has posed little risk. However, when used under more confined
situations the potential for cardiac sensitization exists. Several scenarios illustrated above
showed situations where arterial concentrations of Halon 1211 exceeded the target
associated with a potential for cardiac sensitization. The report of an incident by Lerman
et al. (5) (see introduction) demonstrates that the risk is real if Halon 1211 is used under
confined situations where the exposure concentration can get high enough to result in
highly elevated blood concentrations.
The discussion with reference to Halons 1301 and 1211 is perhaps a moot point with both
of them being replaced with other agents. However, the use of PBPK modeling to
evaluate exposure scenarios with replacement agents should be considered. Prospective
modeling of potential scenarios can forewarn against situations such as that reported by
Lerman et al. (5).
Acknowledgments

53
Support for this work was provided partially by the Department of Defense’s Next
Generation Fire Suppression Technology Program, funded by the DoD Strategic
Environmental Research and Development Program (SERDP); through an Interagency
Agreement between the U.S. EPA and the Department of the Air Force; and through
Department of the Air Force Contract No. F41624-96-C-9010. The manuscript has been
reviewed by the Office of Public Affairs and assigned the following technical report
number, AFRL-HE-WP-TR-200X-XXXX.
Literature Cited
1. “SNAP Technical Background Document: Risk Screen on the Use of Substitutes for
class I Ozone-Depleting substances, Fire Suppression and Explosion Protection (Halon
Substitutes),” Federal Register 59:13044(1994).
2. Vinegar, A., G.W. Jepson, and J.H. Overton. 1998. PBPK modeling of short-term (0 to
5 min) human inhalation exposures to halogenated hydrocarbons. Inhal. Toxicol. 10:411-
429.
3. Vinegar, A. and G.W. Jepson. 1996. Cardiac sensitization thresholds of halon
replacement chemicals predicted in humans by physiologically based pharmacokinetic
modeling. Risk Anal. 16:571-579.

54
4. Vinegar, A., G.W. Jepson, M. Cisneros, R. Rubenstein, and W. J. Brock. 200X. Setting
safe acute exposure limits for halon replacement chemicals using physiologically-based
pharmacokinetic modeling. Inhal. Toxicol. (in press).
5. Lerman, Y., E. Winkler, M.S. Tirosh, Y. Danon, and S. Almog. 1991. Fatal accidental
inhalation of bromochlorodifluoromethane (Halon 1211). Hum. Exp. Toxicol. 10:125-
128.
6. Vinegar, A., G.W. Jepson, S.J. Hammann, G. Harper, D.S. Dierdorf, and J.H. Overton.
1999. Simulated blood levels of CF3I in personnel exposed during its release from an F-
15 jet engine nacelle and during intentional inhalation. Amer. Indust. Hyg. Assoc. J.
60:403-408.
7. Smith, D.G. and D.J. Harris. 1973. Human exposure to Halon 1301 (CBrF3) during
simulated aircraft cabin fires. Aerospace Med. 44:198-201.
8. Abramowitz, A., W. Neese, and G. Slusher. 1990. Smoke and extinguisher agent
dissipation in a small pressurized fuselage. US Dept. of Transportation, Federal Aviation
Administration. DOT/FAA/CT-89/31.
9. Slusher, G.R., J. Wright, and J. Demaree. 1986. Halon extinguisher agent behavior in a
ventilated small aircraft. US Dept. of Transportation, Federal Aviation Administration
DOT/FAA/CT-86/5.
55
Physiologically Based Pharmacokinetic Model for Simulating Breath-By-Breath Inhalation

56
PROGRAM: PHYSIOLOGICAL PHARMACOKINETIC MODEL !Ventilation described on a breath-by-breath basis !---------------------------------------------------------------------- !AS=INTEG(RAS,0.) Amount slowly perfused tissue (mg) !AR=INTEG(RAR,0.) Amount rapidly perfused tissue (mg) !AF=INTEG(RAF,0.) Amount in fat (mg) !AG=INTEG(RAG,0.) Amount in gut (mg) !AM=INTEG(RAM,0.) Amount amount metabolized in liver (mg) !AL=INTEG(RAL,0.) Amount in liver (mg) !CVGDD=INTEG(RCVGDD,0.0) concentration (mg/L) in distal deadspace !CVGDP=INTEG(RCVGDP,0.0) concentration (mg/L) in proximal deadspace !AI=INTEG(RAI,0.) Amount inhaled (mg) !AX=INTEG(RAX,0.) Amount exhaled (mg) !AP=INTEG(RAP,0.0) AMOUNT IN PULMONARY REGION (mg) !---------------------------------------------------------------------- INTEGER CTABLE, VTABLE, ICRP, BREATH, INHALE, VGDCAL,IGEVGD,IHALT $'FLAGS' TABLE VENTT,1,19/0.,.0016667,.0033333,.005,.0066667,.0083333,... .0125,.0166667,.025,.0333333,.05,.0833333,.125,.1666667,... .2083333,.25,.3333333,.4166667,.5,... 5.42,5.42,5.42,5.42,5.42,5.42,5.42,5.42,5.42,5.42,5.42,5.21,... 5.19,5.19,5.33,5.53,5.27,5.58,5.58/ TABLE CONCT,1,19/0.,.0016667,.0033333,.005,.0066667,.0083333,... .0125,.0166667,.025,.0333333,.05,.0833333,.125,.1666667,... .2083333,.25,.3333333,.4166667,.5,... 2025.,2025.,2025.,2025.,2025.,2025.,2025.,2025.,2025.,2025.,2025.,... 1996.,1966.,2000.,2035.,2014.,2051.,2056.,2034./ INITIAL !**Miscellaneous** LOGICAL GENDER, MALE GENDER=.TRUE. $ 'Male=.T., Female=.F.' MALE = GENDER !**Timing commands** CONSTANT TSTOPS =300 !LENGTH OF EXPERIMENT (SECS) TSTOP =TSTOPS/3600 CONSTANT TCHNG =40 !Length of inhalation exposure (hr) !**Physiological Parameters** CONSTANT VGDCAL =1 !>=1: calculate VGD. <1: use input value of VGD CONSTANT CTABLE =-1 !1 !Switch for using the table CONCT CONSTANT VTABLE =-1 !1 !Switch for using the table, VENTT CONSTANT ICRP =0 !SWITCH FOR METHOD OF CALCULATING VT & F CONSTANT KAP =0 !PUL. REGION GAS PHASE RATE CONSTANT CONSTANT KS =10000 !Suppression rate constant (mg/hr) CONSTANT BW =70 !Body weight (kg) {or L where 1 L/kg}

57
CONSTANT H =1.8 !Height (m) CONSTANT A =21 !Age (yr) CONSTANT QPC =17.4 !L/(hr*kg) QP =QPC*BW**0.74 !L/hr QPM =QP/60 !L/min VENTLM =QPM/0.70 !L/min=70% OF QPM CONSTANT QLC =0.0885 !Proportion cardiac output to liver CONSTANT QGC =0.2192 !Proportion cardiac output to gut CONSTANT QFC =0.0288 !Proportion cardiac output to fat CONSTANT QSC =0.2019 !Proportion cardiac output to slow CONSTANT QRC =0.4616 !Proportion card output to rapid QRCC =QRC CONSTANT VLC =0.027 !Liver volume (L/L BW) CONSTANT VGC =0.022 !Gut volume (L/L BW) CONSTANT VFC =0.215 !Body fat volume (L/L BW) CONSTANT VRC =0.041 !Rapid volume (L/L BW) CONSTANT VSC =0.575 !Slow volume (L/L BW) !**Toxicant** CONSTANT CONC =105000 !Inhaled concentration (ppm) CONSTANT MW =168.02 !Molecular weight (g/mol) CONSTANT VMAXC =0.0 !Michaelis-Menten Vmax (mg/hr/kg BW) CONSTANT KM =1 !Michaelis-Menten Km (mg/L) CONSTANT KFC =0. !First order metab. rate constant (1/hr/kg BW) CONSTANT PLA =0.038 !Liver/air partition coefficient CONSTANT PGA =0.056 !Gut/air partition coefficient CONSTANT PFA =0.745 !Fat/air partition coefficient CONSTANT PSA =0.074 !Slowly perfused tissues/air part. coefficient CONSTANT PRA =0.038 !Richly perfused tissues/air part. coefficient CONSTANT PB =0.033 !Blood/air partition coefficient PL =PLA/PB !Liver/blood partition coefficient PG =PGA/PB !Gut/blood partition coefficient PF =PFA/PB !Fat/blood partition coefficient PS =PSA/PB !Slowly perfused tissues/blood part. coefficient PR =PRA/PB !Richly perfused tissues/blood part. coefficient CONSTANT PI =3.1415927 !CONSTANT VT =0.5 !TIDAL VOLUME (L) CONSTANT F =900 !BREATHING FREQUENCY /HR CONSTANT VGP =3. !PULMONARY REGION GAS VOLUME CONSTANT VGD =0.2 !DEAD SPACE GAS VOLUME CONSTANT VPR =1. !VENTILATION PERFUSION RATIO CONSTANT VCAPP =0.169 !VOL OF PUL CAPILLARIES CONSTANT VTP =0.270 !VOL OF PUL TISS (AIR-BLOOD BARRIER) !**Scaled and other derived parameters** FRC =0.65*(2.34*H+.009*A-1.09) !FUNCTIONAL RESIDUAL CAPACITY (L) IF(.NOT. MALE) FRC=.65*(2.24*H+.001*A-1.00) IF(VGDCAL .LE. 0) GOTO 20 VGD =0.002*bw !VGD from Lerou et al.(1991)' 20..CONTINUE VGP =FRC-VGD VL =VLC*BW !Volume liver (L)

58
VG =VGC*BW !Volume gut (L) VF =VFC*BW !Volume fat (L) VR =VRC*BW !Volume rapid (L) VS =VSC*BW !Volume slow (L) VMAX =VMAXC*BW**0.75 !Vmax for toxicant (mg/hr) KF =KFC/BW**0.25 !First-order metabolism of toxicant (1/hr) !**VARIABLE INITILIZATION** !**Inhalation exposure** IF(CTABLE .GT. 0.5) ... CONC=CONCT(T) !INHALED CONC DERIVED FROM TABLE (PPM) CIZONE =RSW((T.LT.TCHNG),1.,0.) !Exposure switch, 0 or 1 !CI =CONC*MW/24450.*CIZONE !Concentration inhaled (mg/L) CI =RSW((T.LT.TCHNG),CONC*MW/24450.,.0000000000000001) !**Activity** IF(VTABLE .GT. 0.5) ... VENTLM=VENTT(T) !VENTILATION DERIVED FROM TABLE (L/MIN) VT =(VENTLM*60.)/F !TIDAL VOLUME DERIVED FROM VDOTE & FREQ IF( ICRP .LT. 0.5) GO TO 100 VT =3.050*(1.0-EXP(-0.023*VENTLM))+0.166 !(L),VT EQ. FOR ADULT FROM HOFMANN ET AL.(89); !BASE ON ICRP # 23(75). F =VENTLM*60/VT !BREATHS/HR 100..CONTINUE VTA =VT-VGD !MAX VOL OF FRESH AIR PENETRATION INTO PUL REGION.' VDOTA =F*VTA !ALVEOLAR VENTILATION (L/HR) VDOTE =VT*F !TOTAL VENTILATION (L/HR) QCI =VDOTA/VPR !CARDIAC OUTPUT=ALVEOLAR VENTILATION/V:P RATIO !IF(VPR .GT. 1E6) QCI =0.0 !SET VPR > 1E6 FOR NO BODY UPTAKE QL =QLC*QCI !Blood flow to liver (L/hr) QG =QGC*QCI !Blood flow to gut (L/hr) QF =QFC*QCI !Blood flow to fat (L/hr) QS =QSC*QCI !Blood flow to slow (L/hr) QR =QRCC*QCI !Blood flow to rapid (L/hr) QC =QL+QG+QF+QS+QR PERIOD =1.0/F !MAXT(4) =PERIOD/(2*NMAXT) HALFP =PERIOD/2 OMEGA =2.*PI*F CINT = PERIOD/(2*NCIPHB) CI =CONC*MW/24450. !CVGDD = 0.0 $ !CVGDP = 0.0 $ !CGP = 0.0 IHALF = 0 $ INHALE = 1 $ UPTAKE = 0 !AG=0 $ !AF=0 $ !AL=0 $ !AS=0 $ !AR=0 $ !AD=0 $ !AP=0 !AM=0 $ !AX=0 $ !AI=0 $ !VOLEX=0 $ !BREATH=0 !AI=0 $ !AX=0 $ !DOSEXL=0.0 $ !DOSEPB=0.0 $ !AMRPB=0.0

59
!IGEVGD=0.0 $ !RATEI=0.0 $ !RATEX=0.0 $ !RATEP=0 $ !CXMIX=0 !AXL=0.0 $ !AXPB=0.0 $ !AMRPH=0 $ !AVGDD=0 $ !AVGDP=0 $ !CX=0 !CXALV=0 $ !CXON2=0 $ !DOSEX=0 massba=0 $ minute=0 $ rmasba=0 $ rmass=0 $ second=0 secxxx=0 $ tbody=0 $ ti=0 $ tmass=0 $ txxx=0 xx=0 $ xxx=0 SCHEDULE IN1 .AT. 0.0 !NEW END !End of initial !---------------------------------------------------------------------------------- DYNAMIC CONSTANT NMAXT =1 !MIN NO OF INTEG STEPS PER PERIOD CONSTANT NCIPHB =1 !# OF COMMUNICATION INTERVALS PER HALF BREATH ALGORITHM IALG =2 NSTEPS NSTP =1000000 MAXTERVAL MAXT =1.0E+33 MINTERVAL MINT =1.0E-33 CINTERVAL CINT =2.22E-5 DISCRETE IN1 !PROCEDURAL PROCEDURAL CALL LOGD(.TRUE.) XX = AI - AX !Total amount retained DOSEPB = XX - DOSEXL !Dose per breatH DOSEXL = XX !Previous amount retained AXPB = AX - AXL !Amount exhaled per breath AXL = AX !Previous amount exhaled !Inhalation exposure**' '********** Activity ********' IF(VTABLE .GT. 0.5) ... VENTLM=VENTT(T) !VENTILATION DERIVED FROM TABLE (L/MIN) VT =(VENTLM*60.)/F !TIDAL VOLUME DERIVED FROM VDOTE & FREQ IF( ICRP .LT. 0.5) GO TO 200 ! 'VT EQ. FOR ADULT FROM HOFMANN ET AL.(89); BASE ON ICRP # 23(75).' VT = 3.050*(1.0 - EXP(-0.023*VENTLM)) + .166 $ '(L)' F =VENTLM*60/VT !BREATHS/HR 200..CONTINUE PERIOD =1.0/F !!MAXT(4) =PERIOD/(2*NMAXT) HALFP =PERIOD/2 OMEGA =2.*PI*F CINT =PERIOD/(2*NCIPHB) VDOTPI =PI*VDOTE !PI*TOTAL VENTILATION (L/HR)

60
VTHALF =VT/2.0 BREATH =BREATH+1 !Counting breaths IHALF =IHALF+1 !Counting half breaths TI =HALFP*IHALF !Time at given half breath SCHEDULE EX1 .AT. TI !Schedule exhale at end of inhale XXX =(1/OMEGA)*ACOS(1.-VGD/VTHALF) !Time within breath that inh vol=ds TXXX =T+XXX !Absol time at which inh vol=dead space SECXXX =TXXX*3600 SCHEDULE GEVGD .AT. TXXX !Schedule integration restart at TXXX IGEVGD =-1 !Flag to change pulmonary rate equation INHALE =1 !Inhale state CVGDP =CI !Proximal deadspace conc=inhaled conc CALL RSTART(DEV1, 1.E-7) !Integration restart CALL LOGD(.TRUE.) END !END PROCEDURAL END !END DISCRETE IN1 DISCRETE GEVGD PROCEDURAL IGEVGD = 1 CALL RSTART(DEV1, 1E-7) CALL LOGD(.TRUE.) END END DISCRETE EX1 $ PROCEDURAL CALL LOGD(.TRUE.) IHALF = IHALF + 1 $'Counting half breaths' TI = HALFP*IHALF $'Time at given half breath' SCHEDULE IN1 .AT. TI $'Schedule inhale at end of exhale' INHALE = -1 $'Exhale state' CVGDD = CGP $'Distal deadspace conc = pulmonary conc' CALL RSTART(DEV1, 1.E-7) $'Integration restart' CALL LOGD(.TRUE.) END $'END PROCEDURAL' END $'END DISCRETE EX1' '*********************************** DERIVATIVE ********************' DERIVATIVE DEV1 $ PROCEDURAL $ '*********************************' IF(CTABLE .GT. 0.5) ... CONC=CONCT(T) $'INHALED CONCENTRATION DERIVED FROM TABLE (PPM)' CIZONE=RSW((T.LT.TCHNG),1.,0.) $ 'Exposure switch, 0 or 1' 'CI=CONC*MW/24450.*CIZONE' $ 'Concentration inhaled (mg/L)' CI=RSW((T.LT.TCHNG),CONC*MW/24450.,.0000000000000001)

61
SINX=SIN(OMEGA*T) SINHX=SIN((OMEGA*T)/2) FLOW=VDOTPI*ABS(SINX) DELVOL=VTHALF*(1.0-COS(OMEGA*T)) VOLP=VGP+DELVOL '**TOXICANT PHARMACOKINETICS**' '**Toxicant in blood**' CA=AP/(VOLP/PB+VTP*PR+VCAPP) $ 'Arterial conc. (mg/L)' ACA=INTEG (CA, 0.0) !AUCCA OF CA CTP=CA*PR CGP=CA/PB '**Toxicant in slowly perfused tissues**' CS=AS/VS $ 'Concentration (mg/L)' CVS=CS/PS $ 'Concentration in venous outflow (mg/L)' RAS=QS*(CA-CVS) $ 'Rate of change (mg/hr)' AS=INTEG(RAS,0.) $ 'Amount (mg)' '**Toxicant in rapidly perfused tissues**' CR=AR/VR $ 'Concentration (mg/L)' CVR=CR/PR $ 'Concentration in venous outflow (mg/L)' RAR=QR*(CA-CVR) $ 'Rate of change (mg/hr)' AR=INTEG(RAR,0.) $ 'Amount (mg)' '**Toxicant in fat**' CF=AF/VF $ 'Concentration (mg/L)' CVF=CF/PF $ 'Concentration in venous outflow (mg/L)' RAF=QF*(CA-CVF) $ 'Rate of change (mg/hr)' AF=INTEG(RAF,0.) $ 'Amount (mg)' '**Toxicant in gut**' CVG=AG/(VG*PG) CG=AG/VG RAG=QG*(CA-CVG) AG=INTEG(RAG,0.) '**Toxicant in liver**' CL=AL/VL $ 'Concentration (mg/L)' CVL=AL/(VL*PL) $ 'Concentration in venous outflow (mg/L)' RAM=(VMAX*CVL)/(KM+CVL*(1+CVL/KS)) $ 'Rate (mg/hr)' $'metabolism' AM=INTEG(RAM,0.) $ 'Amount (mg)' RAL=QL*(CA-CVL)+QG*(CVG-CVL)-RAM $ 'Rate of change (mg/hr)' AL=INTEG(RAL,0.) $ 'Amount (mg)' CV = 0.0 IF(QC .GT. 0.0) CV=(QF*CVF+(QL+QG)*CVL+QS*CVS+QR*CVR)/QC $ ' (mg/L)' VOLEX=VT-DELVOL 'BEGINDS' IF(INHALE .LT. 1) GOTO EXHALE 'INHALE PHASE: SINX >= 0.0 '

62
CMOUTH=CI $ 'Conc at mouth equals inhaled conc' RAI=FLOW*CI $ 'Rate of inhalation (mg/hr)' RAX = 0.0 $ 'RATE OF EXHALATION' 'proximal compartment' VGDP = MIN(DELVOL,VGD) RATEI = FLOW/(VGDP + (1E-4)*VGD) RCVGDP = FLOW*(CI - CVGDP)/(VGDP+(1E-4)*VGD) 'distal compartment' VGDD = VGD - VGDP RCVGDD = 0.0 IF(IGEVGD .LT. 0.0) RATEP = FLOW*CVGDD IF(IGEVGD .GT. 0.0) RATEP = FLOW*CVGDP GOTO ENDDS EXHALE..CONTINUE RATEP=-FLOW*CGP IF(VOLEX .LT. VGD) CMOUTH=CVGDP $'Conc at mouth equals DS conc' IF(VOLEX .GE. VGD) CMOUTH=CVGDD $'Conc at mouth equals PUL conc' RAX=FLOW*CMOUTH $ 'Rate of exhalation (mg/hr)' RAI = 0.0 $ 'RATE OF INHALATION' 'distal compartment' VGDD= MIN(VOLEX, VGD) RATEX = FLOW/(VGDD + (1E-4)*VGD) RCVGDD=FLOW*(CGP-CVGDD)/(VGDD+(1E-4)*VGD) 'proximal compartment' VGDP = VGD - VGDD RCVGDP = 0.0 ENDDS..CONTINUE CVGDD=INTEG(RCVGDD,0.0) $'concentration (mg/L) in distal deadspace' CVGDP=INTEG(RCVGDP,0.0) $'concentration (mg/L) in proximal deadspace' AI=INTEG(RAI,0.) $ 'Amount inhaled (mg)' AX=INTEG(RAX,0.) $ 'Amount exhaled (mg)' RAP=RATEP+QC*(CV-CA) - KAP*CGP $ 'TOTAL RATE OF CHANGE OF AMOUNT IN' 'PULMONARY REGION' AP=INTEG(RAP,0.0) $ 'AMOUNT IN PULMONARY REGION' END $ END $ 'END PROCEDURAL & End of derivative ******************' '**Toxicant mass balance**' AVGDP = CVGDP*VGDP AVGDD = CVGDD*VGDD $ 'NEW !!!!!!!!!!!!!!!!!!!!!' AD=AVGDD+AVGDP $ 'AMOUNT IN DEAD SPACE' TMASS=AG+AF+AL+AS+AR+AD+AP+AM+AX $ 'Total dose (mg)' DOSEX=AI-AX $ 'Net amount absorbed (mg)' TBODY=AG+AF+AL+AS+AR+AD+AP $ 'Total in tissues (mg)' MASSBA=AI-TMASS RMASS=AG+AF+AL+AS+AR+AD+AP+AM $ 'TOTAL RETAINED MASS (MG)' RMASBA=DOSEX-RMASS $ 'MASS BALLANCE' 'AVERAGE MASS RETAINED PER BREATH:'

63
IF(BREATH .GT. 0) AMRPB = DOSEX/BREATH $'AVERAGE MASS RETAINED/BREATH' AMRPH = F*AMRPB $ 'AVERAGE MASS RETAINED/HOUR' IF(AI .GT. 0.0) UPTAKE = DOSEX/AI $ 'AVERAGE FRACTIONAL UPTAKE' '**Toxicant exhaled**' IF(BREATH .GT. 0.0) ... CXMIX = (AXPB/VT)*24450/MW $ 'Mixed exhaled conc. (ppm)' CX=CA/PB $ 'Exhaled alveolar conc. (mg/L)' CXALV=CX*24450./MW $ 'Exhaled alveolar conc. (ppm)' CONSTANT CXEND=5.39106 CXON2=RSW((T.LT.TCHNG),(CX/CI),CX/CXEND) MINUTE=T*60 SECOND = 3600*T '**Condition for termination of run**' TERMT(T.GE.TSTOP) '----------------------------------------------------------------------' END $ 'End of dynamic' '----------------------------------------------------------------------' END $ 'End of program'

64
APPENDIX: Setup File for Performing Monte-Carlo Simulation Using ACSL-Tox Software

65
% FILE: setup.m % Defines functions for implmenting a Monte-Carlo simulation % ---------------------------------------------------------------- % NORMAL - Returns a normally distributed random variable with % mean mu and standard deviation sigma. % ---------------------------------------------------------------- function v=normal(mu, sigma) v = mu + sigma*randn(1,1) ; end % ---------------------------------------------------------------- % NORMBND - Returns a truncated normal distribution with % mean mu, standard deviation sigma, upper and % lower bound % ---------------------------------------------------------------- function v=normbnd(mu, sigma, lower, upper) if(lower >= upper) v = NaN; return; end while ( 1 ) v = normal(mu, sigma) ; if (v >= lower & v <= upper) break; end end end % ---------------------------------------------------------------- % LOGNORMAL - Returns a lognormally distributed random variable % with geometric mean mu and geometric standard deviation % sigma % ---------------------------------------------------------------- function v=lognormal(mu, sigma) r1 = rand(1,1) ; % uniform distributtion r2 = rand(1,1) ; % uniform distributtion v = exp(log(mu) + log(sigma)*sin(pi()*2*r1)*sqrt(-2*log(r2))) ; end % ---------------------------------------------------------------- % PMINMAX - plot mean, min and max of a matrix % ---------------------------------------------------------------- function pminmax(x,y) bar = mean(y')'; maximum = max(y')'; minimum = min(y')'; curve = [minimum bar maximum]; plot(x, curve); end % End of file

66
APPENDIX: Sample M File for Conducting Monte Carlo Simulation for Halon 1301. Must Be Used in Conjunction With The Setup File

67
% File: halon.m % Date: 14 Aug 98 % This will run a Monte Carlo simuation !! prepare minute, ca !! set mw=148.91 !! set wesitg=.f. !! set vmaxc=0, km=10000, kfc=0 sprintf('CINT=%g. Are you sure?', CINT) pause % Empty the bucket into which I will be saving output caBucket=[]; caHist =[]; % Run it one hundred times %figure for run=1:numRun run % Vary the body weight % Fraction of total body volume allocated to various compartments %Means from Dr. Vinegar %Coefficient of Variation from Thomas (Am. Ind. Hyg. Ass. J.) BW =normbnd(70, 9.1, 42.7, 97.3); VFC =normbnd(0.215, 0.0645, 0.0215, 0.4085); %FOR VGC CV IS ASSUMED TO BE =20% VGC =normbnd(0.022, 0.0044, 0.0088, 0.0352); VLC =normbnd(0.027, 0.0054, 0.0108, 0.0432); VRC =normbnd(0.041, 0.0082, 0.0164, 0.0656); VSC =0.88 - VFC - VGC - VLC - VRC; VGP =normal(3.0, 0.60); VGD =normal(0.2, 0.04); VTP =normal(0.270, 0.054); VCAPP =normal(0.169, 0.0338); %F =normal(900, 0.8); % Fraction of total blood volume going to various compartments %Means from Dr. Vinegar %Coefficient of Variation from Thomas (Am. Ind. Hyg. Ass. J.) QPC =lognormal(17.4, 0.8); QSC =normbnd(0.2019, 0.06057, 0.02019, 0.38361); QLC =normbnd(0.0885, 0.01947, 0.03009, 0.14691); QFC =normbnd(0.0288, 0.00432, 0.01584, 0.04176); QGC =normbnd(0.2192, 0.048224, 0.074528, 0.363872);

68
QRC =1.0 - QSC - QLC - QFC - QGC; % Partition coefficients PLA = lognormal(0.144594, 1.085094); PGA = lognormal(0.150, 1.25); PFA = lognormal(0.771412, 1.163943); PSA = lognormal(0.159411, 1.497855); PRA = lognormal(0.144594, 1.085094); PB = lognormal(0.061841, 1.057053); % Run the simulation !! start %plot (_minute, caBucket); % Put the final in the bucket by appending it to the % end. caBucket= [ caBucket ; CA ] ; % Put the history into the final column of this bigger % bucket, caHist. caHist = [ caHist _ca ]; end % Finished %figure % hAxis=axes() % set (hAxis, @xLim=[0 5]) % set (hAxis, @yLim=[0 40]) % xlabel ('MINUTE'), ylabel ('ARTERIAL CONC (MG/L)') ; % title ('HALON1301 7.5% LOAEL') ; %plot(_minute, caHist, 'k') ; % Calculate the mean, standard deviation, max, and min of ca meanHist=mean(caHist')' ; maxHist=max(caHist')' ; minHist=min(caHist')' ; stdHist=std(caHist')' ; ca2sg=[meanHist + 2*stdHist meanHist meanHist - 2*stdHist] % Open a new plot window %figure % hAxis=axes() % set (hAxis, @xLim=[0 5]) % set (hAxis, @yLim=[0 40])

69
% xlabel ('MINUTE'), ylabel ('ARTERIAL CONC (MG/L)') ; % title ('HALON1301 7.5% LOAEL') ; %plot(_minute, meanHist, 'k') ; %h=line(_minute, maxHist) ; %set(h,@color='k') %h=line(_minute, minHist); %set(h,@color='k'); % Open a new plot window figure hAxis=axes() set (hAxis, @xLim=[0 5]) set (hAxis, @yLim=[0 30]) xlabel ('MINUTE'), ylabel ('ARTERIAL CONC (MG/L)') ; title ('HALON1301 7.5% LOAEL') ; plot(_minute, ca2sg, 'k') ; % Save the mean data into a Excel file %mydata=[_minute meanHist ] ; %save mydata @file=mydata.csv @format=ascii @separator=comma % end of file