Physiological Sensing of Emotionpeople.ict.usc.edu/~gratch/CSCI534/Readings/ACII-Handbook...1...
25
1 Physiological Sensing of Emotion Jennifer Healey Abstract Physiological changes have long been associated with emotion. Although the relative role of cognitive versus physiological processes in emotion has been debated, it is acknowledged that in almost all cases, measurable physiological changes co-occur with emotion, for example: changes in heart rate, sweat level, muscle tension, breathing rate, facial expression and electrical activity in the brain. By sensing these changes we can hope to build computer systems that can automatically recognize emotion by recognizing patterns in these sensor signals that capture physiological responses. This chapter will give a detailed introduction to measuring physiological signals that reflect affect (emotion) with a focus on measuring cardiac activity and skin conductance. The discussion will include why these signals are important for measuring emotional activity, how they are most commonly measured, which features are most often extracted for use in recognition algorithms and the trade-offs between signal quality and wearability and convenience for different sensing systems. Keywords/key phrases: physiological, emotion, heart rate variability, galvanic skin response, signals, sensing
Transcript of Physiological Sensing of Emotionpeople.ict.usc.edu/~gratch/CSCI534/Readings/ACII-Handbook...1...
1
Physiological Sensing of Emotion
Jennifer Healey
Abstract
Physiological changes have long been associated with emotion. Although the relative role of
cognitive versus physiological processes in emotion has been debated, it is acknowledged
that in almost all cases, measurable physiological changes co-occur with emotion, for
example: changes in heart rate, sweat level, muscle tension, breathing rate, facial
expression and electrical activity in the brain. By sensing these changes we can hope to
build computer systems that can automatically recognize emotion by recognizing patterns in
these sensor signals that capture physiological responses. This chapter will give a detailed
introduction to measuring physiological signals that reflect affect (emotion) with a focus on
measuring cardiac activity and skin conductance. The discussion will include why these
signals are important for measuring emotional activity, how they are most commonly
measured, which features are most often extracted for use in recognition algorithms and the
trade-offs between signal quality and wearability and convenience for different sensing
systems.
Keywords/key phrases: physiological, emotion, heart rate variability, galvanic skin response,
signals, sensing
2
1 paragraph definition for the glossary:
Physiological: in general, physiology is a branch of biology that deals with the functions of
activities of life. With respect to affective computing, physiological affect in general refers to
responses that come from the body, more especially those associated with the autonomic nervous
systems. Although brain activity is in essence physiological, the field of neurophysiology provides
a more specific view of brain function and the term “physiological” is usually used to refer to other
types of bodily responses.
Emotion: A term used colloquially to reflect a wide range of affective responses (feelings, mood,
disposition, etc.). In emotion theory, emotions are generally perceived as short term affective
responses and are often perceived as both “basic” versus “social/moral/higher-order” emotions,
where the first category is more often tied with primary physiological responses.
Heart Rate Variability: A term used to describe how successive heart beats differ from one another
(e.g. how the lengths of the intervals between successive heart beats vary). The term heart rate
variability is used to describe a number of metrics, some of which are calculated in the time domain
and others of which are calculated in the frequency domain.
Galvanic Skin Response: (also commonly referred to as electrodermal activity (EDR) or Skin
Conductance) is a commonly measured physiological metric that measures a person’s sweat levels
by measuring the conductance of the skin. The skin is normally an insulator, but sweat is ionic and
conducts electricity so that when a person starts sweating their skin conductivity increases. This
phenomena is most often measured by placing two electrodes on two adjacent fingers and
measuring the voltage in response to a small injection current that runs between the two electrodes
across the skin of the palm of the hand where many of the most emotionally reactive sweat glands
are found.
Signals: A signal is a time varying response that communicates information about phenomena. In
the context of physiological affective computing, a signal is usually a two dimensional time-voltage
signal, measured from some part of the body. For example, a skin conductance signal conveys
information about how a person’s sweat level changes over time and a heart rate signal conveys
information about how a person’s heart rate changes over time.

3
Sensing: using a physical instrument to detect a physical stimulus. In affective computing, sensing
is used to capture information that can be used by a computer to incorporate into algorithms, for
example to sense skin conductance, a GSR sensor is used and to sense heart rate a heart rate sensor
(ECG, BVP) is used.

4
1. Emotion and Physiology
Emotion has long been presumed to have a physiological component, although the primacy and
extent of that component is often debated. Research on affective computing has primarily focused
on detecting changes in variables such as heart rate and skin conductance as well as changes in
muscle activity, respiration, skin temperature and other variables. Various methods can be
employed to monitor physiological signals for the purpose of emotion detection. These methods
often vary in the degree of invasiveness required and have associated differences in signal fidelity
and the kinds of features that can be reliably extracted from the signals. Some methods are more
“wearable” and therefore more suited for monitoring “in the wild” whereas other methods are more
awkward or sensitive and should be restricted to use in controlled settings. This chapter presents an
overview of why we might want to measure physiological signals and gives a detailed description
of monitoring heart rate and skin conductance variables.
Since ancient times, it has been speculated that emotion has a physiological component. In ancient
China it was believed that emotions resided in the physical body and that excess emotion could
cause damage to a person’s life energy and affect the function of vital organs. In ancient Greece,
the physician Hippocrates theorized the body was comprised of four “humours” which were
described as: yellow bile, black bile, phlegm and blood. These humors were thought to be essential
to a person’s physiology and responsible for health and that emotion and behaviours were caused by
the action or imbalance of these humours. An excess of one of the fluids would result in a
temperament that was choleric, melancholic, phlegmatic or sanguine, respectively. Aristotle also
had a physiological view of emotions and viewed them as “passions” that could be compared to
physical states like changes in appetite. Many of these ideas still pervade our thinking and directly
influence modern emotion theorists, for example, Hans Eysenck cited the idea of temperament as a
mixture of “humours” as a primary inspiration for defining dimensions of personality such as
Neuroticism and Extraversion in his factor analysis method (Eysenck, 1947)
In modern times, the first theorist to put forth a physiological theory of emotion was William James
(James, 1893). James viewed the physical response as primary to the feeling of an emotion: we feel
happy because we laugh or smile; we feel fear because our hair stands on end and our hands go
cold; and we feel grief when we cry uncontrollably. James believed that a stimulus would first

5
trigger activity in the autonomic nervous system which would then produce an emotional response
in the brain. At about the same time Carl Lange proposed a similar theory, so the view of emotion
as a being primarily a physiological reaction became known as the James-Lange theory of emotion.
William James was also one of the first researchers to list the specific patterns of response that
corresponded to specific emotions, for example, he described anger as ``increased blood flow to
hands, increased heart rate, snarling and increases involuntary nervous system arousal” and fear as
``a high arousal state, in which a person has a decrease in voluntary muscle activity, a greater
number of involuntary muscular contractions and a decrease of circulation in the peripheral blood
vessels.'' Around this same time period, Charles Darwin also began cataloging specific patterns of
observable physiological response in both animals and people. In particular, he studied fear
reactions and used different responses to help classify different species. He also speculated on how
these repeated, identifiable patterns of physical expressions could aid an organism’s survival
(Darwin, 1872).
The description of a set of physiological patterns corresponding to unique emotional states as put
forth by James and Darwin is the theoretical basis for using physiological pattern recognition to
recognize emotion in affective computing. While the descriptions of James and Darwin make sense
to human readers, computer algorithms need more mathematically quantifiable metrics to use as
features. As a result, affective computing researcher use electronic sensors and digital recording
devices to calculate such features as heart rate acceleration and skin conductivity metrics to classify
emotion (Ekman, Levenson, & Friesen, 1983) (Levenson, 1992).
It should also be noted that all of nuances of emotion may not be reflected physiological signals.
One of the greatest critics of the James Lange theory of emotion was the neurologist Walter Cannon
who argued that autonomic patterns were too slow and non-specific to be unique to each emotion
and that emotion therefore had to be primarily a cognitive event (Cannon, 1927). Cannon was
famous for coining the term “fight or flight” reaction, and in his view, the sympathetic nervous
system simply prepared the organism to take some sort of action and which action to take “fight” or
“flight” was determined by cognitive processes. In Cannon’s view an organism always struggled to
maintain physical homeostasis and emotion such as “distress” were experienced when an organism
was thrown off balance and was trying to recover. Cannon thought that the physical reactions of
the organism as it returned to homeostasis were too gross to be the emotion itself and that any sense
of emotional “feeling” associated with these physical changes had to be primarily cognitive,
otherwise “anger”, “fear” and “excitement” should all “feel” the same (Cannon, 1927).
6
The psychologist Stanley Schachter proposed a compromise between the two views saying that
emotion is both cognitive and physiological in his “two-factor” theory of emotion (Schachter,
1964). In his experiments, Schachter attempted to artificially creating the physical “state” of an
emotion in absence of an actual emotional prime by injecting subjects with epinephrine. He then
sought to determine if from purely physical state changes the subject would be able to correctly
identify or “feel” the emotion as he imagined much be the case in James theory where the physical
effect “was” the emotion. He found overall that subjects could not clearly identify an emotion from
the physical state changes he induced. In another experiment, he injected some subjects with
epinephrine and then exposed them to situations that would induce either anger or happiness. He
found that the subjects given epinephrine reported feeling “more” of both types of induced emotion:
the positive and the negative. In conclusion, Schachter determined physiology was part of the
emotional experience, but that emotions were the result of a two factors, physiological changes and
cognitive interpretation of those changes.
While Schachter’s experiments are informative, they do not entirely explain the complex nature of
the interactions between cognitive and physiological responses in emotion. One criticism is that the
injection of epinephrine is too coarse a physiological prime to elicit particular emotional feelings.
In more recent work for example, psychologist Robert Zajonc showed that by putting subjects’
facial muscles in the position of a smile, they reported feeling happy (Zajonc, 1994). In the end, it
may be that Cannon’s intuition about ANS activation alone being too gross to solely distinguish
nuanced emotions might be true and that a wider range of systems such as facial muscles and
neurochemical reactions need to be considered within the scope of physiological responses that
need to be recorded to distinguish between emotions.
Measuring physiological signals is the first step towards creating a system that can automatically
recognize physiological patterns associated with emotion. In the widest view, all bodily changes
could be considered physiological signals including changes in the brain activity, changes in facial
expression, changes in vocal patterns and changes in body chemistry; however the primary focus of
this chapter will be measuring continuous physiological signals that can be sensed from the surface
of the skin and that reflect autonomic nervous system activity. In particular this chapter discusses
various methods for measuring features of cardiac activity (heart rate, heart rate variability, and
blood volume pressure), features of galvanic skin response (specifically skin conductivity), surface
electromyography (EMG) and respiration through chest cavity expansion (as opposed to gas

7
exchange). The methods typically used to detect these signals are introduced and the trade-offs of
different monitoring methods, such as wearability and signal fidelity, are discussed.
2. Measuring Cardiac Activity
Cardiac activity has been studied extensively by the medical community. The heart is a major
muscle and its activity can be easily measured by monitoring either electrical changes on the
surface of the skin or by measuring pulse signals at various locations on the body. In affective
computing, heart rate and heart rate variability have been used a measures of overall physical
activation and effort (Aasman, Mulder, & Mulder, 1987) (Itoh, Takeda, & Nakamura, 1995) and
changes in heart rate have been used to mediate computer human interaction (Kamath & Fallen,
1998) and have been reported as indicators of fear (Levenson, 1992), panic (Hofmann & Barlow,
1996), anger (Levenson, 1992) (Kahneman, 1973) and appreciation (McCraty, Atkinsom, & Tiller,
1995).
2.1 The Effects of a Heart Beat
The beating of the heart is not a subtle event. When the heart pumps blood, major physiological
changes occur. The process of a heart beat begins when the two upper, smaller chambers of the
heart, the atria, depolarize, pumping blood into the larger ventricles; then the ventricles depolarize,
pumping blood into the rest of the body. The heart beat is controlled by the body’s own electrical
signal and the polarizations of heart chambers results in electrical changes that can be detected on
the surface of the skin. The recording of these surface electrical signals is an electrocardiogram, an
example of which can be seen in Figure 1. The beating of the heart also causes blood to be pushed
out into the peripheral blood vessels which causes them to swell. The result of this effect is the
pulse and an example of a pulse trace can be seen in Figure 2.
2.2 Electrocardiogram
An electrocardiogram (ECG) is a trace of electrical activity captured from the surface of the skin.
The inflection points of the time-voltage signal indicate the various polarizations of the heart over
the beat. The first inflection point is the “P” wave, indicating atrial depolarization. The next three
inflection points are labeled “Q,” “R” and “S” and the triangular complex they form is called the
“QRS” complex. This complex represents ventricular depolarization and is dominated by the large
“R” wave. Finally a “T” and potentially in some cases a “U” inflection point indicates ventricular
8
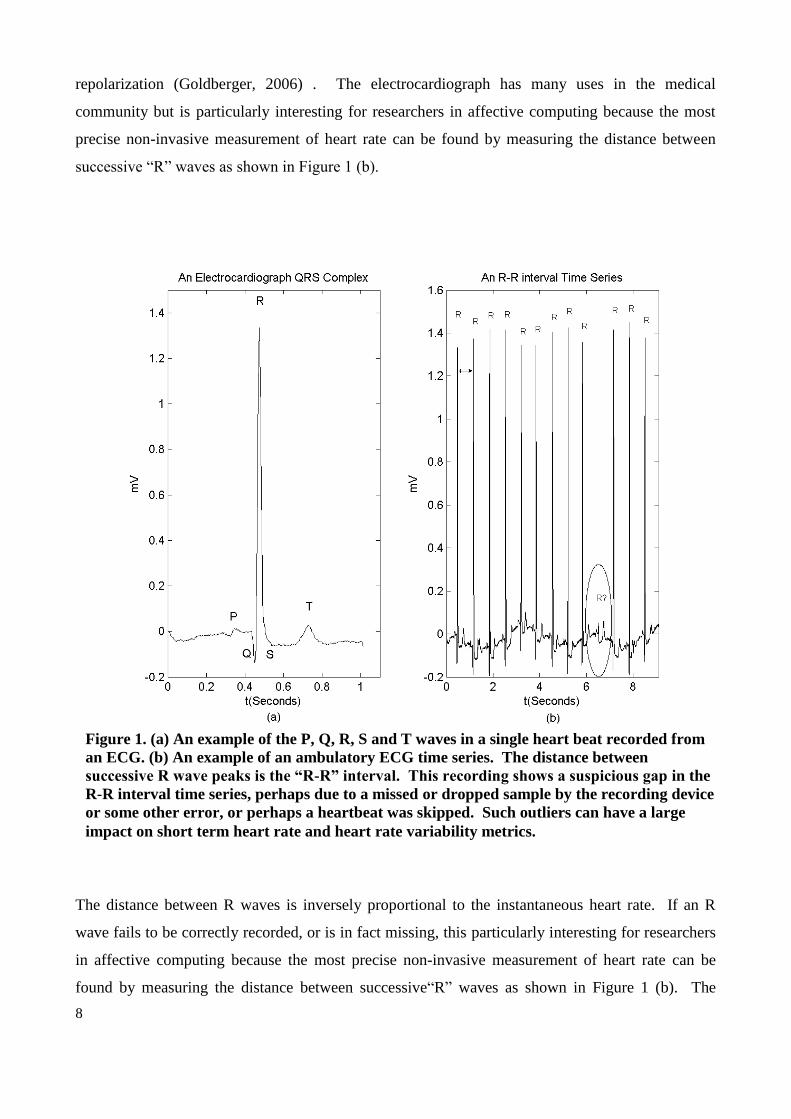
repolarization (Goldberger, 2006) . The electrocardiograph has many uses in the medical
community but is particularly interesting for researchers in affective computing because the most
precise non-invasive measurement of heart rate can be found by measuring the distance between
successive “R” waves as shown in Figure 1 (b).
The distance between R waves is inversely proportional to the instantaneous heart rate. If an R
wave fails to be correctly recorded, or is in fact missing, this particularly interesting for researchers
in affective computing because the most precise non-invasive measurement of heart rate can be
found by measuring the distance between successive“R” waves as shown in Figure 1 (b). The
Figure 1. (a) An example of the P, Q, R, S and T waves in a single heart beat recorded from
an ECG. (b) An example of an ambulatory ECG time series. The distance between
successive R wave peaks is the “R-R” interval. This recording shows a suspicious gap in the
R-R interval time series, perhaps due to a missed or dropped sample by the recording device
or some other error, or perhaps a heartbeat was skipped. Such outliers can have a large
impact on short term heart rate and heart rate variability metrics.

9
distance between R waves is inversely proportional to the instantaneous heart rate. If an R wave
fails to be correctly recorded, or is in fact missing, this causes a large gap in the R-R time series and
a very low instantaneous heart rate. Some signal processing algorithms will ignore such anomalous
beats whereas others will divide the interval in two equal parts to correct for the “missing” beat.
Inserting a “missing” beat will introduce artifacts into metrics of heart rate variability, but may give
a more robust estimate of average heart rate. One drawback to using an ECG to measure heart rate
is that the measurement requires electrode skin contact, which can be uncomfortable. In fact for the
best quality signal, such as is used for medical diagnosis, the person wearing the device must have
excess hair removed from the adhesion sites, have his or her skin cleaned with alcohol and abraded.
In most ECGs, gel is applied to the
electrodes and the electrodes are embedded in an adhesive patch that keeps the electrode-skin
contact secure. These adhesive patches need to be changed daily and are often irritating to the skin.
An alternative to using gel is to rely on the body’s natural sweat to act as a conductive layer
between the skin and the electrode; however, this is less reliable than gel and produces a poorer
quality signal. Pressure can also be used to keep the electrodes in place instead of adhesives, but
this is also less reliable and in some cases even more uncomfortable for the wearer.
2.3 Photoplethysmograph
A photoplethysmograph (PPG) sensor can be used to measure blood volume pulse in peripheral
vessels as an alternative to ECG, for example a pulse oximeter is a PPG sensor that also measure
blood oxygenation. With every heartbeat, blood is pumped through the blood vessels, which
produces an engorgement of the vessels. This change is most pronounced in peripheral vessels
such as those in the fingers and in the earlobe. By placing a device that emits light near one of
these peripheral vessels the amount of blood in the vessel can be monitored by looking at the
amount of light reflected by the vessel over time using a PPG sensor. As blood fills the vessel,
more light is reflected back to the sensor. The more blood that is present in the vessel, the higher
the reflectance reading. A series of heart beats will result in a light reflectance pattern similar to the
one in Figure 2. By detecting the peaks and valleys of this signal, a heart rate time series can be
extracted. In some cases, if the subject is stationary, it is also possible to get a measure of the
vasoconstriction (vessel constriction) of peripheral blood vessels by looking at the envelope of the
signal. Vasoconstriction is a defensive reaction (Kahneman, 1973) in which peripheral blood
vessels constrict. This phenomena increases in response to pain, hunger, fear and rage and
decreases in response to quiet relaxation and may also be a valuable signal indicating affect (Frija,

10
1986). Figure 2 shows an example of a reflectance PPG reading of a blood volume pulse signal
with increasing vasoconstriction.
The PPG sensor can be placed anywhere on the body where the capillaries are close to the surface
of the skin, but peripheral locations such as the fingers are recommended for studying emotional
responses (Thought Technology, 1994). PPG sensors require no gels or adhesives; however the
reading is very sensitive to variations in placement and to motion artifacts. For example, if the light
sensor is moved with respect to the blood vessel, the envelope of the signal will change or the signal
might be lost entirely. This can happen if the sensor slips from an ear clip placement of if the
sensor is bumped during normal daily activities using a finger placement. If a finger placement is
used, it should be noted that the signal will also strongly attenuate if the wearer lifts their hand up,
as blood flow to the extremity will be diminished.
Figure 2. An example of blood volume pulse recorded by a PPG sensor showing
vasoconstriction as can be seen by the narrowing of the envelope of the signal.
11
Recently, new non-contact technologies have been developed to measure the
photoplethysmographic effect using a webcam and visible light sources (red, green and blue color
sensors) in conjunction with blind source separation techniques (Poh, McDuff, & Picard, 2010).
These techniques have been shown to correlate PPG and visible sensor results, particularly from the
green sensor and have been shown to accurately estimate mean heart rate for many users, however
this signal does not exactly replicate the details of standard PPG signals and requires the user to
remain facing the camera.
2.4 Heart Rate and Heart Rate Variability
Two of features most commonly used in affective computing research are heart rate and heart rate
variability. Heart rate gives an excellent view into autonomic nervous system (ANS) activity
because it is controlled by both the sympathetic and parasympathetic nervous systems. The
sympathetic nervous system accelerates heart rate and can be viewed as the part of the ANS that is
related to “stress” or activation. The parasympathetic nervous system is responsible for recovering
heart rate from sympathetic activation (decelerating heart rate) and can be viewed as the system
responsible for “relaxation” or rest and healing. Since the third component of the ANS, the enteric
nervous system that governs the gastro-intestinal tract, is difficult to monitor non-invasively, heart
rate can be viewed as an excellent window into as much of the ANS.
An increase in heart rate indicates an overall increase in sympathetic nervous system activity and a
decrease in heart rate indicates that the parasympathetic nervous system is recovering the person to
a relaxation state. Many different features can be extracted from periods of acceleration and
deceleration, for example, the mean difference over baseline, the amount of time spent in
acceleration vs. deceleration and the magnitude or slope of the acceleration or deceleration.
Heart rate variability (HRV) has also been used as a measure of affect. The term heart rate
variability is used to describe a number of metrics, some of which are calculated in the time domain
and others of which are calculated in the frequency domain. An HRV metric can be as simple as
the measure of the standard deviation of the length of time between successive heart beatswithin a
certain time window (also called “the recording epoch”) (Berntson, et al., 1997). Simple robust
metrics like this one are often best for use with short time windows since the amount of information
available in the window is limited (van Ravenswaaij-Arts, Kollee, Hopman, Stoelinga, & van Geijn,

12
1993). Other metrics of HRV include calculating the difference between the maximum and the
minimum normal R-R interval lengths in the window limited (van Ravenswaaij-Arts, Kollee,
Hopman, Stoelinga, & van Geijn, 1993); the percent differences between successive normal R-R
intervals that exceed 50 msec (pNN50) and the root mean square successive difference (RMSSD)
(Kamath & Fallen, 1998).
As digital recording devices and signal processing algorithms have come into more common usage,
short-term power spectral density analysis of the heart rate has become more popular as a method
for assessing heart rate variability. Since it is known that the parasympathetic nervous system is
able to modulate heart rate effectively at all frequencies between 0.04 and 0.5 Hz, whereas the
sympathetic system modulates heart rate with significant gain only below 0.1Hz (Berntson, et al.,
1997) (Akselrod, Gordon, Ubel, Shannon, & Cohen, 1981) , the relative strengths of the
sympathetic and parasympathetic influence on HRV can be discriminated in the spectral domain.
This ratio is often referred to as the sympathovagal balance. There are many different ways to
calculate this balance, each with various merits. More specific metrics, for example narrower and
lower frequency bands, usually require longer time windows of heart beats to obtain the detailed
information necessary to fill specific bands with enough data points to be meaningful.
One simple sympathovagal ratio calculation is to take the energy in the low frequency band (0.04-
0.1Hz) and divide by the total energy in the (0.04-0.5Hz) band which gives the ratio of sympathetic
to all heart rate activity. Other researchers suggest comparing low frequency energy to different
combinations of low, medium and high frequency energy (Kamath & Fallen, 1998) (van
Ravenswaaij-Arts, Kollee, Hopman, Stoelinga, & van Geijn, 1993) (Akselrod, Gordon, Ubel,
Shannon, & Cohen, 1981) (Aasman, Mulder, & Mulder, 1987) (Itoh, Takeda, & Nakamura, 1995).
Another spectral feature that is of interest to affective computing researchers is the 0.1Hz peak of
the HR spectrum which has been associated with sympathetic tone and mental stress (Nickel,
Nachreiner, & von Ossietzky, 2003) although other researchers have found that an increase in the
0.1Hz spectrum can occur with practiced relaxed breathing (McCraty, Atkinsom, & Tiller, 1995).
Each HRV metric is differently robust to noise, outliers and irregular beats and the precision with
which it can distinguish sympathetic vs. parasympathetic activity. In addition to choosing the
appropriate metric, researchers must also chose the appropriate time window for the heart rate series
over which she or he wishes to calculate the metric. The choice of metric will largely be
determined by which variables are of interest and the quality of the heart rate time series that can be

13
derived from the cardiac signal. In general, a time window of five minutes or more is
recommended; assuming a resting heart rate of 60 bpm, this generates a sample size of 300 beats
from which to estimate variability statistics. As with all statistics, in general, the more samples you
have the better your estimate. In particular with heart rate variability, it should be considered that
heart rate varies naturally over the breath cycle, accelerating following inhalation and decelerating
after exhalation. Taking a longer time window, allows multiple heart rate samples from all parts of
the breath cycle to be incorporated into the estimate.
2.5 Other Factors
Emotion is not the only factor that affects heart rate and heart rate variability and these also need to
be taken into account when interpreting heart rate features. Other factors that affect heart rate
include age, posture, level of physical conditioning, breathing frequency (van Ravenswaaij-Arts,
Kollee, Hopman, Stoelinga, & van Geijn, 1993) and circadian cycle (Berntson, et al., 1997). As age
increases, heart rate variability decreases. For example, infants have a high sympathetic activity but
this decreases quickly between ages 5 and 10 (van Ravenswaaij-Arts, Kollee, Hopman, Stoelinga,
& van Geijn, 1993). In the case of certain diseases such as congestive heart failure, heart rate
variability goes to near zero and the heart beats like a metronome. When pooling data between
subjects, especially subjects of different ages and physical conditions, these differences need to be
considered, in addition to potentially excluding participants who have pacemakers or who are
taking medication to control heart rate. Physical activity, talking, and posture (sitting vs. standing
vs. laying down) also all affect heart rate and HRV (van Ravenswaaij-Arts, Kollee, Hopman,
Stoelinga, & van Geijn, 1993) (Picard & Healey, 1997). This should be considered in monitoring
HRV “in the wild” as it can confound affective signals and in planning experiments that may
involve different activities, postures or posture transitions.
A non-physiological factor that needs to be considered is also the quality of the heart rate signal.
Many factors can affect how well the measured heart rate actually reflects the true heart rate. One
factor is the measurement method. The ECG can give a much more accurate instantaneous heart
rate and is the preferred signal calculating heart rate variability; this is mainly because the sharp R
waves of the ECG give a much clearer picture of when the heart beats than do the more gentle
slopes of the PPG signal. However, no beat detection is perfect and if the underlying signal was not
sampled at the appropriate rate, R waves can be entirely missed by some digital recordings.
Alternatively there can be irregular “ectopic” heart beats that can confound some algorithms. When
14
a beat is perceived to be “missed” some algorithms might divide the long interval in half, which can
introduce artifacts into the heart rate variability metric.
Finally, when estimating the spectral statistics of HRV, the affective computing researcher should
be aware that this method assumes that the statistics of the heart rate time series over which the
power spectrum are stationary (relatively unchanging circumstances). This assumption is more
likely to be true for resting subjects in hospitals than it is for active subjects going about the
activities of daily living. It is generally assumed that longer time windows will give more accurate
HRV estimates because there will be more data points in each spectral bin, however this is only true
if the stationarity assumption is not violated. Windows as short as 30 seconds have been used on
ECGs that are free of missed beats and motion artifacts (Kamath & Fallen, 1998) (van
Ravenswaaij-Arts, Kollee, Hopman, Stoelinga, & van Geijn, 1993).
4. Skin Conductance
Skin conductance, also commonly referred to as Galvanic Skin Response (GSR) or electrodermal
activity (EDR), is another commonly used measure of affect. Skin conductance is used to indirectly
measure the amount of sweat in a person’s sweat glands since the skin is normally an insulator and
its conductivity changes in response to ionic sweat filling the sweat glands. Sweat gland activity is
an indicator of sympathetic activation and GSR is a robust non-invasive way to measure this
activation (Caccioppo, Berntson, Larsen, Poehlmann, & Ito, 2000). GSR was first famously used
by Karl Jung Karl to identify “negative complexes” in word association tests (Jung & Montague,
1969) and is an key component in “lie detector” tests; tests which actually measure the emotional
stress associated with lying rather than untrue facts (Marston, 1938). In laboratory studies to
measure affect (Ekman, Levenson, & Friesen, 1983) (Levenson, 1992) (Winton, Putnam, &
Krauss, 1984), skin conductivity response has been found to vary linearly with the emotional aspect
of arousal (Lang, 1995) and skin conductance measurements have been used to differentiate
between states such as anger and fear (Ax, 1953) and between states of conflict and no conflict
(Kahneman, 1973). Skin conductance has also been used as a measure of stress in studies on
anticipatory anxiety and stress during task performance (Boucsein, 1992).
Skin conductance can be measured anywhere on the body, however, the most emotionally reactive
sweat glands are concentrated on the palms of the hands and on the soles of the feet (Boucsein,

15
1992). In laboratory studies, the most common placement for electrodes is on the lower segment of
the middle and index finger of the dominant hand. A low conductivity gel is usually used between
the skin and the electrodes to ensure good contact and better signal quality. To measure
conductance, a small current is injected into the skin and the resulting change of voltage is
measured (Dawson, Schell, & Fillon, 1990) (Healey J. , 2011). Using the standard placement, the
electrical path of the current passes through the palm as it travels from the base of one finger to the
other. By constantly measuring the change in voltage across the electrodes, the continuously
changing conductance of the skin can be measured.
For ambulatory studies, alternative placements are sometimes used since hand placement is often
found to be inconvenient by participants and signal quality from hand placements can be
compromised by hand motion and activities that deposit or remove residue from the surface of the
palms such as hand washing or eating. Additionally, since hands are frequently in use during daily
life, there is a high chance that electrodes can become dislodged during the day. Therefore many
ambulatory skin conductivity sensors measure conductivity on the wrist, arm or leg (BodyMedia, Q
Sensor, Basis). Some research systems have also included measuring skin conductivity through
clothing or jewelry (Picard & Healey, 1997) (Healey J. , GSR Sock: A New e-Textile Sensor
Prototype, 2011).
An example of the time varying skin conductance response is shown in Figure 3. In this figure an
audio stimulus (a 20 millisecond white noise burst) was played as a prime to elicit “orienting
responses” (also known as startle responses) during the test. We recorded ground truth for the
audio prime using a microphone trace. The microphone trace was overlaid on the figure at the
mean value of “3” as a reference for interpreting the signal. Examples of seven orienting responses
are labeled in the figure. The first major response, 1, occurs at the beginning of the experiment and
was not stimulated by an audio burst. It was likely caused by the computer making a small “click”
at the beginning of the audio-player program, but because this ground truth was not recorded we
would say that this response is “unstimulated” meaning simply that we did not intentionally
stimulate it. The second reaction, 2, is stimulated by the first sound burst, and responses 3, 5, and 7
are stimulated by the successive sound bursts. A second “unstimulated” response occurs between 5
and 7.
An orienting response is usually measured at the upwards inflection point and is assigned an
amplitude that extends to the next local maximum. This amplitude is indicated in Figure 3 by the

16
dotted lines just preceeding (to the left of) each labeled peak. Responses 3,4 and 5 show
successively decreased magnitudes indicating habituation to the stimulus. Response 7 shows
recovery from habituation.
In affective computing, commonly extracted features from skin conductance include: mean
conductivity level; variance; slope; and maximum and minimum levels from this signal as well as
features of the orienting response described in the previous paragraph Commonly used features of
the orienting response include: the amplitude (the distance from the inflection point of the slope at
the beginning of the rise to the point of zero slope at the peak), the latency (the time between the
prime and the inflection point), the rise time (the time between the inflection point and the peak)
and the half-recovery time (the time between the zero slope at peak until the conductivity has
dropped to the value at the inflection point plus half of the amplitude) (Boucsein, 1992) (Damasio,
1994). Figure 3 also shows habituation (Groves & Thompson, 1970), a decrease in response after
repeated stimuli, indicating that the signal is non-time invariant. This and other factors such as long
term changes in baseline due to increased or decreased skin contact introduce confounding factors
to interpreting GSR and pooling features over time.
5. Additional Physiological Signals
Although the majority of this chapter has been focused on a detailed presentation of cardiac activity
and skin conductance response, there many other physiological signals have been considered in
affective computing research including: electroencephalogram (EEG), electromyogram (EMG),
blood pressure and respiration, among others. This section gives a brief overview of these measures
and how they are used by affective computing researchers.
5.1. Electroencephalography
The electroencephalogram (EEG) measures electrical activity of the brain by placing electrodes on
the surface of the head. The study of EEG is a vast topic and has been extensively studied in the
field of neuroscience (see Chapter X by Muhl et al., this volume), however the electrical signals
from the brain that an EEG reads are also physiological signals and should be mentioned here in
Figure 3 An example of a skin conductance signal showing characteristic orienting responses
in response to an audio stimulus. The microphone signal used to record ground truth for the
stimulus is superimposed (at 3mS) to show the relationship between stimulus and response.
17
that context. Recently there has been a widening body of literature (Coan & Allen, 2004)
(Davidson, 2004) asymmetries in the pre-frontal cortex (PFC) seem to represent how different
emotions, such as anger are processed and how PFC may be acting as a moderator or a mediator
between physiological response and cognitive processing. For the first time we may begin to see
and model how the “mind” and the “body” work together in processing emotion and gain greater
insights into the duality that James and Cannon debated.
From the perspective of physiological signal processing of affective signals, most researchers tend
to gravitate towards EEG because it is one of the most non-invasive and accessible tools for getting
some sense of brain activity, even if other metrics such as fMRI are far more accurate. A full
electroencephalogram incorporates over 128 electrodes; however simpler metrics using two or four
channels are used in bio-feedback practice (Thought Technology, 1994). In laboratory experiments,
full EEG has been shown to distinguish between positive and negative emotional valence
(Davidson, 1994) and different arousal levels (Leventhal, 1990). EEG can also be used to detect the
orienting response by detecting ``alpha blocking.'' In this phenomenon, alpha waves (8-13 Hz)
become extinguished and beta waves (14-26Hz) become dominant when the person experiences a
startling event (Leventhal, 1990) . In the past, EEG has been less favored as a measure of emotion
detection because the full EEG was challenging to both apply and interpret and the reduced
electrode sets were considered unreliable. The EEG also reacts to changes in light and sound and it
is sensitive to both motion and muscle activity, so it is sometimes difficult to interpret outside of
controlled laboratory conditions. During normal waking activity, it has been hypothesized that
EEG could only be used as a crude measure of arousal (Leventhal, 1990), but perhaps new
discoveries such as the asymmetry properties may change this view.
5.2. Electromyography
The electromyogram (EMG) measures muscle activity by detecting surface voltages that occur
when a muscle is contracted. In affective computing, the EMG is used to measure muscle
activation, for example EMG has been used on facial muscles to study facial expression (Levenson,
Ekman, & Friesen, 1990), on the body to study affective gestures (Marrin & Picard, 1998), and has
been used as both an indicator of emotional valence (Lang, 1995)and emotional arousal (Caccioppo,
Berntson, Larsen, Poehlmann, & Ito, 2000) (Cacioppo & Tassinary, 1990). EMG can be used as a
wearable substitute for affective changes that are often usually detected by computer vision from a

18
camera that is looking at a subject. The main difficulty is that EMG electrodes need both adhesives
and gels under normal use and when placed on the face they can be seen which may cause
unwanted negative social attention.
Similar to both the ECG and the EEG, the EMG works by detecting electrical signals on the surface
of the skin. In a typical configuration, three electrodes are used for this measurement, two placed
along the axis of the muscle of interest and a third electrode placed off axis to act as a ground. The
EMG signal is actually a very high frequency signal, but in most common usages, the signal is low-
pass filtered to reflect the aggregate muscle activity and is sampled at 10-20Hz.
5.3. Blood Pressure
Blood pressure is used as a metric for overall health and general emotional stress. In affective
computing research, blood pressure has been found to correlate with increases in emotional stress
(Selye, 1956) and with the repression of emotional responses (Innes, Millar, & Valentine, 1959)
(Gross, 2002) (Harris, 2001). The main challenges with blood pressure as a metric for use in
affective computing are that it is difficult to measure continuously, and the measurement itself
requires constricting a blood vessel to measure pressure, which can be noticeable and might cause
the user discomfort. Continuous ambulatory blood pressure monitoring systems have been used in
medical practice (Pickering, Shimbo, & Haas, 2006), but these can be perceived as cumbersome.
Smaller, more portable systems that measure blood pressure from peripheral blood vessels exist,
(Finapres, 2013) but they may cause damage to these smaller vessels with long term use.
5.4 Respiration
Respiration is an interesting physiological signal to consider for affective computing; both as a
signal in its own right and as a signal to consider in conjunction with other measures such as cardiac
activity, due to the strong influence of respiration on heart rate. Respiration is most accurately
recorded by measuring the gas exchange of the lungs; however, this method is excessively
cumbersome and inhibits natural activities. Because of this, an approximate measure of respiratory
activity, such as chest cavity expansion, is often recorded instead. Chest cavity expansion can be

19
measured by a strap sensor that incorporates a strain gauge, a Hall Effect sensor or capacitance
sensor.
Both physical activity and emotional arousal are reported to cause faster and deeper respiration,
while peaceful rest and relaxation are reported to lead to slower and shallower respiration (Frija,
1986). Sudden, intense or startling stimuli can cause a momentary cessation of respiration and
negative emotions have been reported to cause irregularity in respiration patterns (Frija,
1986). The respiration signal can also be used to assess physical activities such as talking,
laughing, sneezing and coughing (Picard & Healey, 1997).
6. Conclusions
Physiological sensing is an important tool for affective computing researchers. While the extent to
which emotion is a cognitive versus physiological processes is still unresolved, there is wide
agreement that physiological responses at least in some way reflect emotional state. Physiological
monitoring offers a continuous, discreet method for computer systems to get information about a
person’s emotional state. Physiological signals have been used successfully to differentiate
between different levels of stress (86-97%), (Healey & Picard, Detecting Stress During Real-World
Driving Tasks Using Physiological Sensors, 2005) (van den Broek, Janssen, Westerink, & Healey,
2009) different categories of emotion in the laboratory (70-91%) (van den Broek, Janssen,
Westerink, & Healey, 2009) and in the wild (Healey, Nachman, Subramanian, Shahabdeen, &
Morris, 2010) (Healey J. , ACII, 2011) (van den Broek, Janssen, Westerink, & Healey, 2009).
There are many challenges to recognizing emotion from physiology. One of the most basic
challenges is one that pervades all of affective computing: the challenge of correctly labelling the
data with an emotion descriptor. In a laboratory, emotions can be acted or primed (e.g. the subject
can be scared, frustrated, rewarded, be made to laugh, etc.) and while acting may not result in a
purely authentic response and primes might not always be successful, at least the start time of the
attempted emotion is known. This greatly facilitates windowing the continuous physiological data
for analysis. In the wild, the onset of an emotion is often unclear, especially because the subject
may be unaware of the natural “prime” occurring because they are caught up in the emotion itself.
And not only does the participant have to notice the onset, they have to record the time precisely.
Often in end of day interviews participants can remember being upset “during a meeting” but the
exact onset is often imprecise which makes the data difficult to window (Healey, Nachman,
Subramanian, Shahabdeen, & Morris, 2010). This causes noise in the windowing of the data.

20
Another challenge is subject self-perception of emotion. Everyone has their own personal
experience of emotion and while emotion theorists have worked hard to try to identify universal
commonalities of emotion, subject often self-describe emotions in colloquial terms that are hard to
classify, for example a participant might say that they felt “happy to be out of that meeting,” and if
given a forced choice of basic emotions (e.g. anger, sadness, fear, joy, surprise or disgust) the
participant might describe this emotion as “joy” when actually their emotion might more accurately
be described as “relief” which in emotion theory is would be considered a negative value for “fear”
but it is not likely that ordinary people would describe it this way. People also tend to report as
emotion feelings such as “boredom, anxiety, fatigue, loneliness and hunger” that fall outside of
what is traditionally studied in emotion research. When dealing with subject self-report, the best
solution is either to educate the participants about the particular emotion types you, as the
researcher, are interested in studying (Healey J. , ACII, 2011) or consider building algorithms for
these non-emotion categories that seem to be of interest for people to record.
A different type of challenge is the many to one mapping between non-emotional and emotional
influences on physiology (Cacioppo & Tassinary, 1990). If a physiological change occurs, there is
no guarantee that an emotion generated the change and conversely non-emotional changes can
occur during emotional episodes and add their effect to the physiological response. For example a
person who is quite calm and relaxed could suddenly sneeze which would cause a dramatic rise in
instantaneous heart rate, blood pressure, and galvanic skin response. Physiologically the person is
startled by the experience, but to what extent is this an affective change? A sneeze does not likely
impact mood as dramatically as it does physiology. Similarly, if a person gets up from their desk
and walks down the hallway, they will have a physiological activation but not necessarily a change
of emotion. An accelerometer can be used to capture the occurrence of motion so that these
episodes can be excluded from affective analysis, but is very difficult to extract affective signals in
the presence of motion. The main reasons for this are that humans are not identical; nor are they
linear, time-invariant systems. Heart rate does not increase linearly with effort or emotion even for
an individual person, and heart rate increases differently in response to both effort and emotion
across individuals. There is currently no method for accurately predicting an individual’s
physiological response due to motion, so it is even more difficult to attempt to “subtract it off” from
the emotional signal. There is also no known method for doing source separation between
emotional and non-emotional responses.
A less fundamental challenge is the challenge of recording sufficient physiological data for
analysis. Currently high quality recording devices are both expensive and inconvenient to wear.
21
This often limits the number of subjects that can be run in a study and the length of time the
subjects are willing to wear the sensors. As a result affective physiological data sets tend to be
small and are often not shared which makes collecting large sample sizes for collective and
individual models difficult (Healey J. , 2012).
This chapter has presented different ways of measuring some of the most commonly used
physiological metrics in affective computing and has presented the advantages of using different
methods to record these signals. The goal of this chapter has been to impart a basic understanding
of physiological mechanisms behind some of the most popular features reported in the literature and
to introduce different sensing methods so that researchers can make informed decisions as to which
method is best for their experiment or application. With the materials presented in this chapter, a
practitioner in affective computing research can be better equipped to incorporate physiological
sensing methods into her or his research methods. As sensing methods improve in popularity and
wearability and our access to context information grows, affective physiological signal processing
may soon start to move into the realm of big data, which could lead to a breakthrough in the field.
If enough participants were able to own and wear sensors at all times and would be willing to allow
context data to be collected from their phones, we might finally be able have a large collection of
physiological signals with high confidence affect labels (Healey J. , 2012). Data could be labeled
with both subject self-report, and context information such as time of day, weather, activity and
who they were with to make an assessment of affective state. Even friends could contribute labels
for each other’s data. With sufficiently large ground truth data sets, we will likely be able to
develop better contextually aware algorithms for individuals and like groups even if the sensor data
is noisier. These algorithms will enable affective computing in a private, personal and continuous
way and allow our devices to both know us better and be able to more effectively communicate on
our behalf with the world around us.
Bibliography Aasman, J., Mulder, G., & Mulder, L. (1987). Operator effort and the measurement of heart rate variability.
Human Factors, 29(2), 161-170.
Akselrod, S., Gordon, D., Ubel, F. A., Shannon, D. C., & Cohen, R. J. (1981). Power spectrum analysis of
heart rate fluctuation: a quantitative probe of beat-to-beat cardiovascular control. Science, 220-2.
Ax, A. F. (1953, September 1). The physiological differentiation between fear and anger in humans.
Psychosomatic Medicine, 15(5), 433-442.

22
Berntson, G. C., Bigger, J. T., Eckberg, D. L., Grossman, P., Kaufmann, P. G., Malik, M., . . . van der
Molen, M. W. (1997). Heart rate variability: origins, methods, and interpretive caveats.
Psychophysiology, 623-48.
Boucsein, W. (1992). Electrodermal Activity. New York, NY: Plenum Press.
Caccioppo, J. T., Berntson, G. G., Larsen, J. T., Poehlmann, K. M., & Ito, T. A. (2000). The
Psychophysiology of Emotion. In M. Lewis, & J. M. Haviland, Handbook of Emotions (pp. 173-
191). New York: The Guilford Press.
Cacioppo, J. T., & Tassinary, L. G. (1990). Principles of psychophysiology: Physical, social, and inferential
elements. New York: Cambridge University Press.
Cannon, W. B. (1927). The James-Lange theory of emotion: A critical examination and an alternative theory.
American Journal of Psychology, 39, 10-124.
Coan, J. A., & Allen, J. B. (2004, October). Frontal EEG as a moderator and mediator of emotion. Biological
psychology, 67(1-2), 7-50.
Damasio, A. R. (1994). Descartes error: emotion, reason and the human brain. New York, NY: Gosset
Putnam Press.
Darwin, C. (1872). The Expression of Emotion in Man and Animals. London, UK: John Murray.
Davidson, R. J. (1994). Asymmetric brain function, affective style and psychopathology: The role of early
experience and plasticity. Development and Psychopathology, 741-758.
Davidson, R. J. (2004). What does the prefrontal cortex “do” in affect: perspectives on frontal EEG
asymmetry research. Biological Psychology, 219–233.
Dawson, M., Schell, A., & Fillon, D. (1990). The electrodermal system. In J. T. Cacioppo, & L. G.
Tassinary, Principles of psychophysiology (pp. 295–324). New York: Cambridge University Press.
Ekman, P., Levenson, R. W., & Friesen, W. V. (1983, September 16). Autonomic Nervous System Activity
Distinguishes among Emotions. Science, 221(4616), 1208-1210.
Eysenck, H. J. (1947). Dimensions of Personality. London, UK: Routledge and Kegan.
Finapres. (2013, August 1). Portapres Product Page. Retrieved from
http://www.finapres.com/site/page/2/9/Portapres/
Frija, N. (1986). The Emotions. Cambridge: Cambridge University Press.

23
Goldberger, A. (2006). Clinical Electrocardiography: A Simplified Approach. Philadelphia, PA USA:
Mosby Elsevier.
Gross, J. J. (2002). Emotion regulation: Affective, cognitive, and social consequences. Psychophysiology,
39, 281–291.
Groves, P. M., & Thompson, R. F. (1970, September). Habituation: A dual process theory. Psychological
Review, 77(5), 419-450.
Harris, C. R. (2001). Cardiovascular responses of embarrassment and effects of emotional suppression in a
social setting. Journal of Personality and Social Psychology, 81, 886–897.
Healey, J. (2011). GSR Sock: A New e-Textile Sensor Prototype. Fifteenth Annual International Symposium
on Wearable Computers (pp. 113-114). San Francisco, CA USA: IEEE.
Healey, J. (2011). Recording Affect in the Field: Towards Methods and Metrics for Improving Ground Truth
Labels. Affective Computing and Intelligent Interaction (pp. 107-116). Memphis, TN, USA:
Springer.
Healey, J. (2012, December 8). Towards Creating a Standardized Data Set for Mobile Emotion Context
Awareness. Retrieved from NIPS 2012 Workshop Machine Learning Approaches to Mobile Context
Awareness: goo.gl/VQl29x
Healey, J., & Picard, R. W. (2005). Detecting Stress During Real-World Driving Tasks Using Physiological
Sensors. Transactions on Intelligent Transportation Systems, 6(2), 156-166.
Healey, J., Nachman, L., Subramanian, S., Shahabdeen, J., & Morris, M. (2010). Out of the Lab and into the
Fray: Towards Modeling Emotion in Everyday Life. Pervasive, (pp. 156-173). Helsinki, Finland.
Hofmann, S. G., & Barlow, D. H. (1996). Ambulatory psychophysiological monitoring: A potentially useful
tool when treating panic relapse. Cognitive and Behavioral Practice, 3, 53-61.
Innes, G., Millar, W. M., & Valentine, M. (1959). Emotion and Blood Pressure. The British Journal of
Psychiatry, 105, 840-851.
Itoh, H., Takeda, K., & Nakamura, K. (1995, August 4). Young borderline hypertensives and hyperreactive
to mental arithmetic stress: spectral analysis of r-r intervals. Journal of the Autonomic Nervous
System, 54(2), 155-162.
James, W. (1893). The Principles of Psychology. Cambridge, MA, USA: Harvard University Press.

24
Jung, C. G., & Montague, D. E. (1969). Studies in Word Association: experiments in the diagnosis of
psychopathological conditions carried out at the Psychiatric Clinic of the University of Zurich under
the direction of C. G. Jung. New York: Routledge and K. Paul.
Kahneman, D. (1973). Arousal and Attention. In D. Kahneman, Attention and Effort (pp. 28-49). Englewood
Cliffs, NJ: Prentice-Hall.
Kamath, M. V., & Fallen, E. L. (1998). Heart Rate Variability: Indicators of user state as an aid to human
computer interaction. SIGCHI Conference on Human Factors in Computing Systems (pp. 480-487).
Los Angeles, CA, USA: ACM.
Lang, P. J. (1995). The emotion probe: studies of motivation and attention. American Psychologist, 50(5),
372-385.
Levenson, R. W. (1992). Autonomic nervous system differences among emotions. Psychological Science,
3(1), 23-27.
Levenson, R. W., Ekman, P., & Friesen, W. V. (1990). Voluntary facial action generates emotion-specific
autonomic nervous system activity. Psychophysiology, 27(4), 363–384.
Leventhal, C. F. (1990). Introduction to physiological psychology. Englewood Cliffs, NJ: Prentice Hall.
Marrin, T., & Picard, R. W. (1998). Analysis of Affective Musical Expression with the Conductor's Jacket.
XII Colloquium for Musical Informatics (pp. 61-64). Gorizia, Italy: Press. Page.
Marston, W. M. (1938). The Lie Detector Test. New York: R. R. Smith.
McCraty, R., Atkinsom, M., & Tiller, W. (1995). The effects of emotions on short term power spectrum
spectrum analysis of heart rate variability. American Journal of Cardiology, 76, 1089-1093.
Nickel, P., Nachreiner, F., & von Ossietzky, C. (2003). Sensitivity and diagnosticity of the 0.1-Hz
component of heart rate variability as an indicator of mental workload. Human Factors, 45(4), 575-
90.
Picard, R. W., & Healey, J. (1997). Affective Wearables. 1st International Symposium on Wearable
Computers. Washington, DC, USA: IEEE.
Pickering, T. G., Shimbo, D., & Haas, D. (2006). Ambulatory Blood-Pressure Monitoring. New England
Journal of Medicine, 354, 2368-2374.

25
Poh, M.-Z., McDuff, D. J., & Picard, R. W. (2010). Noncontact, automated cardiac pulse measurements
using video imaging and blind source separation. Optics Express, 10762-74.
Schachter, S. (1964). The interaction of cognitive and physiological determinants of emotional state. In L.
Berkowitz, Advances in Experimental Social Psychology (pp. 49–79). New York: Academic Press.
Selye, H. (1956). The stress of life. New York: McGraw-Hill.
Thought Technology. (1994). ProComp User’s Manual Software Version 1.41. Quebec, Canada: Thought
Technology Ltd.
van den Broek, E., Janssen, J. H., Westerink, J., & Healey, J. A. (2009). Prerequsites for affective signal
processing (ASP). International Conference on Bio-inspired Systems and Signal Processing (pp.
426-433). Porto, Portugal: Springer.
van Ravenswaaij-Arts, C., Kollee, L. A., Hopman, J. C., Stoelinga, G. B., & van Geijn, H. P. (1993). Heart
Rate Variability. Annals of Internal Medicine, 436-47.
Winton, W. M., Putnam, L. E., & Krauss, R. M. (1984). Facial and autonomic manifestations of the
dimensional structure of emotion. Journal of Experimental Social Psychology, 195-216.
Zajonc, R. B. (1994). Evidence for non-conscious emotions. In P. Ekman, & R. J. Davidson, The nature of
emotion: Fundamental questions (pp. 293-297). New York: Oxford University Press.