Physiological coherence during live music performance
187
Physiological coherence during live music performance - A real-time, exploratory investigation using wireless systems. DISSERTATION Submitted in fulfilment of the requirements for the degree of Magister Scientiae in Human Physiology 2016 by Gehart Kalmeier B. Sc. Hons (Pret.) 28039662 Department of Physiology Faculty of Health Sciences University of Pretoria 0002 South Africa Website: http://www.up.ac.za © University of Pretoria
Transcript of Physiological coherence during live music performance
Physiological coherence during live music
performance -
A real-time, exploratory investigation
using wireless systems.
DISSERTATION
Submitted in fulfilment of the requirements for the degree of
Magister Scientiae in Human Physiology
2016
by
Gehart Kalmeier
B. Sc. Hons (Pret.)
28039662
Department of Physiology
Faculty of Health Sciences
University of Pretoria
0002
South Africa
Website: http://www.up.ac.za
© University of Pretoria

Project submitted in fulfilment of the requirements for the degree:
M.Sc. Human Physiology
through the Department of Physiology, at the Faculty of Health Sciences, University of Pretoria.
Candidate
Name: Gehart Kalmeier Student number: 28039662 Department: Human Physiology
Faculty of Health Sciences University of Pretoria
Email: [email protected]
Contact Number: 0847244320
Supervisor Name: Prof Peet du Toit Department: Human Physiology Position: Associate Professor Faculty of Health Sciences University of Pretoria Head of Department Name: Prof DH van Papendorp Department: Human Physiology Faculty of Health Sciences University of Pretoria
Co-Supervisor Name: Dr Clorinda Panebianco-Warrens Department: Music Position: Lecturer Faculty of Humanities School of Arts University of Pretoria
© University of Pretoria

I
ACKNOWLEDGEMENTS
I wish to thank and acknowledge the roles of the following people
and institutions in the completion of this research:
Prof Peet du Toit who offered to meet with me under no obligation several years back and
has since given me the opportunities to grow and express myself, both as a researcher and as
a professional.
The National Research Foundation (NRF), and the Department of Physiology (UP) for
their financial and continued support.
The volunteers, who not only made this study possible, but gave me the opportunity to be
an observer – both as an academic and as a musician.
Dr Clorinda Panebianco-Warrens for her candour and the infectious optimism that
nurtured this project into being.
To Dr Ariana van Heerden for her help in planting the seeds and sharing her ambitions;
To Michael Kleynhans (UP), Lynton Hazelhurst (TUT), & Prof Peter Bartel (Steve Biko
Academic Hospital) for their help in laying the top soil.
To Leon Brits for not only helping me understand the physics behind signal processing, but
for raising more questions in my head, for being a friend and for sharing a curiosity for things.
To Dr Nicoleen Coetzee for her preparedness to assist me with the statistics for this study
at the 11th hour, but also for her genuine kindness.
To Jessica Farinha for assisting me with testing and for supporting my endeavours.
To Christa van Zyl and Elma Jacobs for their unrelenting faith and support, but also for
giving me a foothold to not only fend for myself, but to teach.
To my body and my own neural substrate for its affinity towards aspirin, caffeine and
nicotine, but moreover, for being a constant reminder of my mortality and the ephemerality
of youth.
© University of Pretoria

II
Dedicated with special thanks
To my mother, for teaching me humility and compassion, and for connecting me to myself
and the Light I wish to harbour.
To my father, for teaching me resourcefulness and autonomy, and for connecting me to
people and a world beyond conventionality.
To my brother, for believing in me always and for teaching me how to grab the bull by its
horns \m/
To Richard Beardsley, Sarah Whigham, Joseph Mulders and Tammy Bean for not only being
in the same boat, but for rocking it more whenever things got tough and for being a living
example that not all who wonder are lost.
To my friends – in particular Anneke, Ashton, Ciska, Deon, Jonathan, Leon, Rikus, Ross,
Sven, Daniel, Wimpie and Drikus – without whom I would have a normal life and no
purpose.
© University of Pretoria
III
© University of Pretoria

IV
TABLE OF CONTENT
ACKNOWLEDGEMENTS ........................................................................................................................ I
ETHICS CLEARNACE CERTIFICATE..................................................................................................III
TABLE OF CONTENT ........................................................................................................................ IVV
LIST OF FIGURES .............................................................................................................................VIIII
LIST OF TABLES ...................................................................................................................................X
LIST OF ABBREVIATIONS..................................................................................................................XII
ABSTRACT..........................................................................................................................................XIII
ABSTRAK ............................................................................................................................................ XV
CHAPTER 1
1.1 INTRODUCTION AND RATIONALE .......................................................................................... 2
1.2 AIM .................................................................................................................................................... 5
1.2.1 OBJECTIVES ................................................................................................................................. 5
1.3 MOTIVATION FOR RESEARCH ...................................................................................................... 5
1.4 OVERVIEW OF CHAPTERS ............................................................................................................ 7
1.5 REFERENCES .................................................................................................................................. 9
CHAPTER 2
2.1 HEART RATE VARIABILITY: FROM ATRIUM TO ANALYSIS ...................................................... 2
2.1.1 DEFINING HEART RATE VARIABILITY ................................................................................................ 2
2.1.2 THE PHYSIOLOGY OF HR MODULATION AND VARIABILITY ................................................................. 2
2.1.2.1 Autonomic control of the heart ............................................................................................ 3
2.1.2.2 Parasympathetic nervous system (PNS) ............................................................................ 4
2.1.2.3 Sympathetic nervous system (SNS) ................................................................................... 5
2.1.2.4 Higher modulation of heart rate .......................................................................................... 5
2.1.3 FACTORS AFFECTING HRV ............................................................................................................ 6
2.1.3.1 Baroreceptor reflex .............................................................................................................. 7
2.1.3.2 Endocrine influences ........................................................................................................... 7
2.1.3.3 Thermoregulation ................................................................................................................ 7
2.1.3.4 Respiratory sinus arrhythmia .............................................................................................. 8
2.1.4 ANALYSIS OF HRV ........................................................................................................................ 9
2.1.4.1 Time domain analyses ...................................................................................................... 10
2.1.4.2 Frequency domain analyses ............................................................................................. 10
2.1.4.3 Filtering of HRV data ......................................................................................................... 13
© University of Pretoria

V
2.2 ELECTROENCEPHALOGRAPHY: FROM CORTEX TO CONDITIONING .................................. 13
2.2.1. DEFINING ELECTROENCEPHALOGRAPHY ...................................................................................... 13
2.2.2 SIGNAL GENERATION AND ELECTROPHYSIOLOGY OF THE BRAIN ..................................................... 14
2.2.2.1 The neuronal makeup and membrane .............................................................................. 14
2.2.2.2 Fast depolarization of neuronal membranes..................................................................... 16
2.2.2.3 Slower membrane potential changes ................................................................................ 18
2.2.3 EEG SIGNAL CAPTURE ................................................................................................................ 20
2.2.3.1 Data montage and recording ............................................................................................ 22
2.2.4 EEG SIGNAL CONDITIONING AND MECHANICS ............................................................................... 25
2.2.4.1 Frequency and amplitude.................................................................................................. 27
2.2.4.2 Morphology ....................................................................................................................... 31
2.2.4.3 Symmetry .......................................................................................................................... 32
2.3 LINKING THE BRAIN AND THE HEART ...................................................................................... 32
2.3.1 PHYSIOLOGICAL COHERENCE ...................................................................................................... 32
2.3.2 ATTENTIONAL CONTROL .............................................................................................................. 35
2.4 CREATIVITY, FLOW AND IMPROVISATION ............................................................................... 36
2.4.1 CONTEXT AND OVERVIEW ............................................................................................................ 36
2.4.1.1 Defining creativity in performance ..................................................................................... 38
2.4.2 THE CREATIVE BRAIN .................................................................................................................. 40
2.4.2.1 Creative versus goal-directed thought .............................................................................. 44
2.4.2.2 Implicit versus explicit information processing .................................................................. 46
2.4.3 FLOW ......................................................................................................................................... 48
2.4.4 IMPROVISATION .......................................................................................................................... 49
2.5 SUMMARY ...................................................................................................................................... 52
2.6 REFERENCES ................................................................................................................................ 54
CHAPTER 3
3.1 RESEARCH APPROACH ................................................................................................................ 2
3.1.1 ETHICAL CONSIDERATIONS ........................................................................................................... 3
3.2 SAMPLE ........................................................................................................................................... 4
3.3 MEASURING HEART RATE VARIABILITY .................................................................................... 5
3.4 MEASURING ELECTROENCEPHALOGRAPHY ............................................................................ 6
3.5 QUESTIONNAIRE ............................................................................................................................ 9
3.6 PERIPHERAL RECORDING AND DATA SYNCHING .................................................................... 9
3.7 OUTLINE OF PROCESS ................................................................................................................ 10
© University of Pretoria

VI
3.7.1 PREPARATION ............................................................................................................................ 10
3.7.2 TESTING PROCEDURE ................................................................................................................. 11
3.7.2.1 E1 (baseline) ..................................................................................................................... 11
3.7.2.2 OF (open frame) ................................................................................................................ 11
3.7.2.3 E2 (comparative baseline) ................................................................................................ 12
3.8 OUTLINE OF DATA ANALYSIS .................................................................................................... 12
3.8.1 A MEANS PERSPECTIVE .............................................................................................................. 14
3.8.2 A DYNAMIC PERSPECTIVE ........................................................................................................... 14
3.8.3 A BIASING PERSPECTIVE............................................................................................................. 14
3.8.4 CORRELATING HEART AND BRAIN ................................................................................................. 15
3.8.5 STATISTICAL IMPLEMENTATION .................................................................................................... 16
3.9 REFERENCES ................................................................................................................................ 17
CHAPTER 4
4.1 INTRODUCTION TO RESULTS ....................................................................................................... 2
4.2 TECHNICAL SPECIFICATIONS ...................................................................................................... 3
4.2.1 EEG SPECIFICATIONS AND OUTLINE ............................................................................................... 3
4.2.2 HRV SPECIFICATIONS AND OUTLINE ............................................................................................... 5
4.2.3 STATISTICAL SPECIFICATIONS AND OUTLINE ................................................................................... 6
4.3 SAMPLE DEMOGRAPHICS AND DESCRIPTORS ........................................................................ 8
4.3.1 DEMOGRAPHIC DESCRIPTORS ....................................................................................................... 8
4.3.2 PERFORMANCE DESCRIPTORS ....................................................................................................... 9
4.4 A MEANS PERSPECTIVE ............................................................................................................... 9
4.4.1 GLOBAL EEG MEANS ................................................................................................................. 10
4.4.2 HEMISPHERIC EEG MEANS ......................................................................................................... 14
4.4.3 REGIONAL EEG MEANS .............................................................................................................. 16
4.5 A DYNAMIC PERSPECTIVE ......................................................................................................... 19
4.5.1 GLOBAL EEG DYNAMICS ............................................................................................................ 19
4.5.2 HEMISPHERIC EEG DYNAMICS .................................................................................................... 22
4.5.3 REGIONAL EEG DYNAMICS ......................................................................................................... 24
4.5.4 HRV DYNAMICS .......................................................................................................................... 27
4.6 A BIASING PERSPECTIVE ........................................................................................................... 30
4.6.1 GLOBAL TRENDS ......................................................................................................................... 35
4.6.1.1 Friedman analysis ............................................................................................................. 41
4.6.2 REGIONAL TRENDS ..................................................................................................................... 43
4.7 OVERALL FINDINGS ..................................................................................................................... 45
© University of Pretoria

VII
4.8 REFERENCES ................................................................................................................................ 47
CHAPTER 5
5.1 RESEARCH CONTEXT AND RELATIVITY ..................................................................................... 2
5.2 INVESTIGATIVE UNDERTAKING ................................................................................................... 4
5.3 PALLIATIVE ASSOCIATIONS AND CONTEXTUAL IMPACT OF THE STUDY ............................ 5
5.3.1 REGARDING SYMMETRY AND LATERALIZATION ................................................................................ 6
5.3.2 REGARDING SPECTRAL DENSITY AND STATE OF MIND ...................................................................... 8
5.3.3 REGARDING ECONOMISATION AND LOBULAR FUNCTIONING ............................................................ 13
5.4 LIMITATIONS AND RECOMMENDATIONS FOR FURTHER RESEARCH ................................. 19
5.5 CONCLUSION ................................................................................................................................ 20
5.6 REFERENCES ................................................................................................................................ 21
APPENDICES
PARTICIPANT INFORMATION LEAFLET AND INFORMED CONSENT ........................................... A
QUESTIONAIRE AND INDEMNITY FORM .......................................................................................... B
FIGURE 32 ............................................................................................................................................. C
© University of Pretoria

VIII
LIST OF FIGURES
CHAPTER 2
FIGURE 1: AUTONOMIC INNERVATIONS TO THE HEART 118 SHOWING SYMPATHETIC AND PARASYMPATHETIC INNERVATIONS TO THE
DIFFERENT NODES (SA AND AV) OF THE HEART. ....................................................................................................... 4
FIGURE 2: VARIATION OF BEAT-TO-BEAT INTERVALS (R-R INTERVALS) IN THE QRS-COMPLEX ..................................................... 9
FIGURE 3: PSD GRAPH SHOWING THE DIFFERENT POWER BANDS AND THEIR RELATIVE POWER.2 ................................................ 11
FIGURE 4: THE STRUCTURE OF A NEURON.32 ................................................................................................................... 15
FIGURE 5: THE STAGES AND ASSOCIATED MEMBRANE POTENTIAL FLUCTUATIONS OF AN ACTION POTENTIAL AS MEASURED IN A GIANT
SQUID NEURON [ADOPTED FROM (34)]. ............................................................................................................... 17
FIGURE 6: THE SYNAPTIC JUNCTION SHOWING NEUROTRANSMITTER RELEASE INTO THE CLEFT IN PROPAGATION OF THE ACTION
POTENTIAL ARRIVING AT THE PRESYNAPTIC TERMINAL TO THE POSTSYNAPTIC NEURON.120 ............................................... 19
FIGURE 7: AN OUTLINE OF A CORTICAL PYRAMIDAL CELL DISPLAYING THE PATTERN OF CURRENT FLOW CAUSED BY EXCITATORY AND
INHIBITORY SYNAPTIC ACTIVATION. ..................................................................................................................... 20
FIGURE 8: APPROXIMATE RESISTIVITY AND THICKNESS OF THE THREE MAIN LAYERS OF THE HEAD (Ω = OHM). 40 ........................... 23
FIGURE 9: THE STANDARDIZED ELECTRODE PLACEMENT ACCORDING TO THE INTERNATIONAL 10-20 SYSTEM (BLACK DOTS) AND THE
MODIFIED COMBINATORIAL 10-10 SYSTEM (BLACK + WHITE DOTS)35.......................................................................... 24
FIGURE 10: PHASE REVERSAL AS DEMONSTRATED IN A BIPOLAR MONTAGE (A); ABSOLUTE VOLTAGE AS DEMONSTRATED IN A
REFERENTIAL MONTAGE (B). .............................................................................................................................. 25
FIGURE 11: THE FOUR MOST DOMINANT, NORMAL BRAIN RHYTHMS IN DESCENDING ORDER OF FREQUENCIES, AND AT THEIR USUAL
AMPLITUDE RANGES. ......................................................................................................................................... 28
FIGURE 12: DYNAMIC INTERACTION BETWEEN NORMALISED DELTA EEG POWER (PANEL B) AND THE HIGH FREQUENCY COMPONENT
OF HRV (PANEL C) ACROSS SLEEP STAGES (PANEL A). 1 ............................................................................................ 34
CHAPTER 3
FIGURE 13: THE ZEPHYR BIOHARNESS 4 ........................................................................................................................... 6
FIGURE 14: THE EMOTIV EPOC EEG HEADSET. 15 ............................................................................................................. 7
FIGURE 15: ELECTRODE PLACEMENT OF THE EMOTIV HEADSET ........................................................................................... 8
FIGURE 16: THE DIFFERENT PHASES OF THE TESTING PROCEDURE. ....................................................................................... 11
CHAPTER 4
FIGURE 17: THE PASS BAND MAGNITUDE OF THE MANUALLY ALTERED FIR OFFSET (A) SET AT 39 HZ, SHOWING A FLAT PASSBAND
FROM 0.5-35 HZ; VERSUS DEFAULT OFFSETS SET AT 0.5-35 HZ (B). ........................................................................... 4
FIGURE 18: (I) ALPHA, (II) THETA AND (III) BETA BAND POWER BASELINE MEANS PER SUBJECT. COMPARISONS BETWEEN EO1 AND
EC2 FORM THE MAIN POINTS OF INTEREST. NORMALISED UNITS (N.U.). ...................................................................... 11
FIGURE 19: (IV) DELTA AND (V) SMR BAND POWER BASELINE MEANS PER SUBJECT. NORMALISED UNITS (N.U). ......................... 12
FIGURE 20: COMPOSITE POWER DISTRIBUTIONS FOR EACH FREQUENCY BAND AND STAGE OF BASELINE MEASUREMENTS. ............... 12
FIGURE 21: (I) ALPHA AND (II) THETA AVERAGED BASELINE POWERS FOR EACH HEMISPHERE ACROSS SUBJECTS. IN NORMALISED
UNITS(N.U). .................................................................................................................................................... 15
© University of Pretoria

IX
FIGURE 22: (III) BETA, (IV) DELTA AND (V) SMR AVERAGED BASELINE POWER FOR EACH HEMISPHERE ACROSS ALL PARTICIPANTS. IN
NORMALISED UNITS (N.U). ................................................................................................................................. 16
FIGURE 23: REGIONAL BASELINE POWER MEANS FOR ALPHA (I) AND THETA (II) POWER BANDS. IN NORMALISED UNITS (N.U). ........ 17
FIGURE 24: REGIONAL BASELINE POWER MEANS FOR THE BETA (III), SMR (IV) AND DELTA (V) POWER BANDS. IN NORMALISED UNITS
(N.U). ............................................................................................................................................................ 18
FIGURE 25: BAND POWER MEANS FOR PERFORMANCES (OF) IN RELATION BASELINE MEASURES FOR SUBJECTS A AND B. ............... 20
FIGURE 26: BAND POWER MEANS FOR PERFORMANCES (OF) IN RELATION TO BASELINE MEASURES FOR SUBJECTS C, D AND E. ....... 21
FIGURE 27: HEMISPHERIC POWER DISTRIBUTION FOR OF PER SUBJECT AND SPECTRAL BAND. (PINK = LEFT; PURPLE = RIGHT) ......... 23
FIGURE 28: A SNAPSHOT TAKEN FROM THE EMOTIV EPOC 3D BRAIN ACTIVITY MAP DURING RECORDING. T TEMPORAL REGIONS. LOW
ACTIVITY IN THE LEFT TEMPORAL, PARIETAL AND OCCIPITAL REGIONS CAN BE SEEN IN THE IMAGE. ..................................... 27
FIGURE 29: HRV DATA FOR SUBJECTS A, B & E (NORMAL). .............................................................................................. 28
FIGURE 30: HRV DATA FOR SUBJECTS C & D (ANXIOUS). HIGH FREQUENCY (HF), LOW FREQUENCY (LF) COMPONENTS AND THE
RATIO OF LF/HF FOR EACH 30 SEC OF EACH PERFORMANCE ARE SHOWN. .................................................................... 29
FIGURE 31: SUMMATION OF CONTEXTUAL, SUBJECTIVE AND DATA-SPECIFIC EVENTS AS NOTED AND REPORTED BY BOTH SUBJECT AND
INVESTIGATOR FOR EACH PERFORMANCE. .............................................................................................................. 33
FIGURE 32: COMPOSITE GRAPHS FOR ALL SUBJECTS SHOWING POWER SPECTRA OVER TIME AND EACH INDIVIDUALS APPROXIMATED
‘FLOW-ZONES’. ................................................................................................................................................ 36
FIGURE 33: A FICTITIOUS, STACKED AREA CHART VISUALLY ILLUSTRATING THE NUMBER OF SIGNIFICANT CORRELATIONS FOUND PER
SPECTRAL BAND AT DIFFERENT TIME INTERVALS (6 MINUTES). ................................................................................... 40
FIGURE 34: FRIEDMAN MEAN RANKS TABLES WITH TEST STATISTICS FOR HF (I) AND THETA (II)................................................ 42
CHAPTER 5
FIGURE 35 - AN EXAMPLE OF THE SYMMETRICAL ACTIVITY EXPRESSED IN A SUBJECT AT DIFFERENT POWER MAGNITUDES THROUGHOUT
THE TESTING PHASE. ........................................................................................................................................... 8
© University of Pretoria

X
LIST OF TABLES
CHAPTER 4
TABLE 1: DEMOGRAPHICS OF THE SAMPLE ........................................................................................................................ 8
TABLE 2: PERFORMANCE TIMES FOR EACH SUBJECT ............................................................................................................ 9
TABLE 4: NOTABLE AND SIGNIFICANT CORRELATIONS AT BASELINE STAGES FOR THE POPULATION MEANS – SPEARMAN’S RHO ........ 13
TABLE 3: HF POWER AND LF/HF RATIO AT BASELINE STAGES ............................................................................................. 14
TABLE 5: A 'HEAT MAP' OF EACH ELECTRODE SITE AND ITS GLOBAL POWER MEAN FOR THE PERFORMANCE STAGE (OF) OF EACH
PARTICIPANT (A-E) AS NORMALISED AGAINST THE BASELINES (EO1).. ........................................................................ 24
TABLE 6: MEAN HF POWER AND STANDARD DEVIATIONS FOR ALL PARTICIPANTS .................................................................... 30
TABLE 7: SIGNIFICANT CORRELATIONS BETWEEN POWER SPECTRAL AT SPECIFIC TIME INTERVALS DURING IMPROVISATION –
SPEARMAN’S RHO. ........................................................................................................................................... 38
© University of Pretoria

XI
LIST OF ABBREVIATIONS
AC - attentional control
ADC - analogue-to-digital converter
ANS - autonomic nervous system
AP - action potential
AR - autoregressive
AV - atrial-ventricle
BCI - brain-computer interfacing
BR - breathing rate
CI - confidence interval
CNS - central nervous system
DLPFC - dorsolateral prefrontal cortex
ECG - electrocardiography
EEG - electroencephalography
EPSP -excitatory post-synaptic
potential
ERP - event related potential
F - Frontal
FIR - finite impulse response
FFT - fast Fourier transformation
fMRI - functional magnetic
resonance imaging
Fp - prefrontal
GHz - gigahertz
HF - high frequency
HFnu - normalised high frequency
HR - heart rate
HRV - heart rate variability
Hz - hertz
ICC - intraclass correlation
IED - interictal epileptiform
discharge
IPSP - inhibitory post-synaptic
potential
LF - low frequency
LFnu - normalised low frequency
LPFC - lateral prefrontal cortex
MF - middle frequency
min - minutes
MPFC - medial prefrontal cortex
ms - milliseconds
NREM - non-rapid eyes movement
O - Occipital
OS - operating system
P - Parietal
PCC - polarity coincidence
correlation
PET - positron emission
tomography
PFC - prefrontal cortex
PNS - parasympathetic nervous
system
© University of Pretoria

XII
PSD - power spectral density
RRI - R-R interval
RSA - respiratory sinus arrhythmia
SA - sino-atrial
SDK - software development kit
sec - seconds
SMR - sensorimotor rhythm
SNS - sympathetic nervous system
SPECT - single photon emission
tomography
SPS - samples per second
T - Temporal
ULF - ultralow frequency
UP - University of Pretoria
uV - microvolts
VLF - very low frequency
α - Alpha
β - Beta
δ - Delta
θ - Theta
© University of Pretoria

XIII
ABSTRACT
Title: Physiological coherence between heart rate variability and
electroencephalography during live music performance – A real-time, exploratory
investigation using wireless systems.
Candidate: Gehart Kalmeier
Supervisor: Prof PJ du Toit
Co-supervisor: Dr C Panebianco-Warrens
Department: Physiology
Degree: MSc Human Physiology
Flow has been described in psychological literature as a state of energized focus
where an individual becomes so engrossed in their doings that they experience an
almost effortless, spontaneous and intuitive, yet highly focused state of optimal and
autotelic experience. However neurophysiological research on flow is severely
underdeveloped, while real-time research on flow within the context of musical
creativity is surprisingly scarce considering how often optimal performance is reported
in this context.
An exploratory investigation was launched in order to assess the physiological
underpinning of such flow experiences in the larger context of musical improvisation
through the study of heart and brain wave activity in five professional jazz musicians.
Using wireless electroencephalographic and electrocardiographic devices, subjects
could improvise unhindered, and did so continuously while various brain and heart
parameters were recorded in real-time.
Through spectral analysis, power values for the different electroencephalographic
frequency bands were quantified for the various stages of performance, and
subsequently the shifts and trends in the data were described. Additionally, heart rate
variability was calculated in order to assess the synergistic actions of the autonomic
nervous system on the heart and the interplay between heart and brain during such
high performance states of musical creativity.
The research revealed the prominence of elevated theta activity persisting through
performance and showed strong associations with subjective experiences of flow.
Such high theta activity has been linked to high performance states in past and further
© University of Pretoria

XIV
evidence suggest the primary involvement of the right frontotemporal regions during
improvisation. Furthermore, heart rate variability data suggested the growing presence
of parasympathetic influence during such flow states, and together with the lower band
dominance suggest trance-like behaviour and activation patterns within the brain. The
study serves as basis for future research and the development of neurofeedback,
music therapy and musical creativity protocols.
Key terms: EEG, HRV, wireless, real-time, improvisation, theta, music, creativity.
© University of Pretoria

XV
ABSTRAK
Titel: Fisiologiese samehang tussen hartklop veranderlikheid en elektroënsefalografie
tydens musiek uitvoering - 'n ware-tyd, verkennende ondersoek met behulp van
koördlose sisteme.
Kandidaat: Gehart Kalmeier
Promotor: Prof PJ du Toit
Mede-promotor: Dr C Panebianco-Warrens
Departement: Fisiologie
Graad: MSc Mens Fisiologie
‘Flow’ is al deeglik beskryf in sielkundige literatuur as 'n toestand van hoë fokus waar
'n individu so verdiep in hulle handelinge dat hulle 'n byna moeiteloos, spontaan en
intuïtief, maar hoogs gefokusde toestand van optimale en ‘autotelic’ ervaring beleef.
Ongelukkig is neurofisiologiese navorsing oor ‘flow’ baie onderontwikkel, terwyl ware-
tyd navorsing oor vloei binne die konteks van musikale kreatiwiteit verbasend skaars
is wanneer in ag geneem word hoe dikwels optimale prestasie gerapporteer word in
hierdie konteks.
'n Verkennende ondersoek is van stapel gestuur om die onderliggende fisiologiese
prosesse van die ‘flow’ ervaring in die groter konteks van musikale improvisasie te
evalueer deur die studie van hart en brein golf aktiwiteit in vyf professionele jazz-
musikante te ondersoek. Deur die gebruik van koördlose elektroënsefalografie en
elektrokardiografiese toestelle, kon deelnemers ongehinderd improviseer en het so
gedoen voortdurend, terwyl verskeie brein en hart parameters in ware-tyd aangeteken
is.
Deur spectraalanalise, was krag waardes vir die verskillende frekwensiebande van die
elektroënsefalografie gekwantifiseer vir die verskillende stadiums van elke opvoering,
en daarna is die verskuiwings en tendense in die data beskryf. Daarbenewens, is
hartklop veranderlikheid bereken ten ondersoek van die sinergistiese optrede van die
outonome senuweestelsel op die hart en die wisselwerking tussen hart en brein tydens
so 'n hoë prestasie toestand van musikale kreatiwiteit.
Die navorsing het aan die lig gebring die prominensie van verhoogde theta aktiwiteit
wat volhard het deur optredes en het sterk assosiasies met subjektiewe ervarings van
‘flow’ gewys. Sulke hoë theta aktiwiteit was voornemend gekoppel aan hoë
© University of Pretoria
XVI
werkverrigting toestande in die verlede en verdere getuienis dui die primêre
betrokkenheid van die regter frontale en temporale streke tydens improvisasie. Verder
het die hartklop veranderlikheid data aan die lig gebring die groeiende
teenwoordigheid van parasimpatiese invloed gedurende sodanige ‘flow’ state wat
saam met die laer krag band oorheersing voorstel dat beswyming-agtige gedrag en
aktivering patrone binne die brein plassvind tydens ‘flow’. Die studie dien as basis vir
toekomstige navorsing en die ontwikkeling van neuro-terugvoering, musiekterapie en
musikale kreatiwiteit protokolle.
Sleutelwoorde: EEG, HRV, koördloos, ware-tyd, improviseering, theta, musiek,
kreatiwiteit.
© University of Pretoria

1 - 1
Chapter 1 Introduction, objectives and motivation of the research undertaking.
...that music is a language which is understood by the immense majority of
mankind, although only a tiny minority of people are capable of expressing
it, and that music is the only language with the contradictory attributes of
being at once intelligible and untranslatable, make the musical creator
comparable to the gods, and music itself the supreme mystery of the
science of man, a mystery that all the various disciplines come up against
and which holds the key to their progress.
Claude Le´vi-Strauss (1969)
© University of Pretoria

1 - 2
1.1 INTRODUCTION AND RATIONALE
As human beings we have an exceptional capacity to create novel ideas and
associates, be it through learning or self-expression, information processing or through
our implicit imaginations and erudite skills such as painting or making music. This
inherent ability to innovate or envision, to be creative, sets us apart from any other
species. It would be true that understanding the underlining neurocognitive
mechanisms and substantiating physiological processes of such creative behaviour
as innovative thinking and improvisation would bring us ever closer to understanding
the elementary nature of our higher cognition and the elusive manner in which our
brains are able to give birth to novel ideas and conceptions. The benefits to our society
that would come in the wake of understanding such basic underpinnings of innovation
and ingenuity would be irrefutable. Alas, to study creative expression, where and how
it arises in the brain and the neural basis for such phenomena is a feat almost more
abstract and capricious in nature than creativity itself.
Considerable progress has been made in certain areas of creativity research through
exploratory investigations and techniques such as surveys, personality inventories
and case studies, but laboratory-based research on creativity have been extremely
limited up to this point. Up until recent times the greatest research contributions
towards the field of creativity have come from psychology-based disciplines and it was
only in recent times that cognitive neuroscience and neuropsychological research
methodologies have been able to employ sophisticated neuroimaging techniques for
creativity research. Indeed, intricate imaging technologies such as functional magnetic
resonance imaging (fMRI), positron emission tomography (PET) and neuroelectric
techniques, e.g. electroencephalography (EEG), have broadened our understanding
of creativity tremendously but have only been accessible in contemporary times.
Perhaps more optimistically, although creativity-focussed experimental research have
maybe lacked testability and acquisition, the large variety of different approaches,
methodologies and interpretations might serve as a quantifiable consolation. However,
real-time testing of art or music creation and findings grounded in or during the actual
live performance of music or creative expression seems almost mythical when
exploring the literature. The more sophisticated technological involvement, as ground-
breaking as it is, have yet to free creativity research from this bondage. Movement of
© University of Pretoria
1 - 3
participants need to be kept to an absolute minimum in order to get good resolution
on imaging, while even just the idea of bringing a musical instrument close to an MRI
machine would be critically abominating. Thus, there is a very clear gap, but also a
strong need for research to move beyond the confines of the laboratory, yet reach still
deeper into the mind of the artist, but in an environment and context where creativity
can be observed not only through visualization or imagination, but through the actual
making, doing and/or performing of art and, in context of this study, music.
Musical improvisation can, in some ways, be compared to the free flowing practises
of e.g. freestyle painting or drawing, in that new and novel conceptions are shaped in
a continuous and concurrent manner. Phenomena such as flow have been described
in psychological literature as a state of consciousness where a person becomes so
emerged in their doings that they experience an almost effortless, spontaneous and
intuitive, yet highly focused state of conduct where their actions flow almost
instinctively and is often associated with peak performance and positive affect. Strong
associations have been established between flow and improvisation, creative intuition,
spontaneous thought, peak performance and altered states of consciousness.
However, neurophysiological research on flow is still only in its first decade of testing
and understanding the physiological and neurocognitive foundations of flow has
generated a great deal of interest in recent years. Dietrich 1 suggests that through the
possible identification of the neurocognitive underpinnings of flow “…it becomes
feasible to delineate it from other manifestations of exceptional human experience, for
instance, creativity.”
From the perspective of an integrative physiological and interdisciplinary approach we
can further recognise that, in order to understand the workings of the brain we need
to also acknowledge the impact of factors outside the central system and their
influence on the CNS. Studying the deeper lying regions of the brain is extremely
difficult, but by combining central and peripheral operatives (brain and body) we can
look at brain functioning holistically as there is continuous communication happening
between the brain and the peripheries. Such dialogues interaction between these
systems can lend valuable insights into the control mechanisms, impact stimuli and
affective relationships underlying complex behaviours such as creativity, insight,
musicality or attentional control.
© University of Pretoria
1 - 4
To serve as an example relevant to this study, meditation studies 2, 3 have yielded
beautiful insights into the self-regulation of attention and emotional systems by
combining the brain and body, showing how e.g. slowing ones breathing can induce
cardiovascular changes and subsequently offer insights into the functioning of the
brain stem and autonomic nervous system (ANS). Research in sleep EEG have also
yielded further insights into the relationship underlying variability of the heart and its
phasic relationship with different brain wave frequencies and associated changes
within the brain.4 It is essentially the amalgamation of these concepts: creative
expression, musical performance, flow, physiological coherence, HRV and EEG that
form the core of the present research undertaking.
HRV has been shown to be a resourceful, none-invasive method of measuring a
multitude of cardiac pathologies, but can also lend insight into the status of autonomic
regulation of the heart by the brain. Through the sympathetic and parasympathetic
innervations to the heart, heart rate and tempo can be modulated and HRV can be
used to assess such neurocardial interactions. Coherence analysis of heart and brain
functioning have revealed dynamic relationships between HRV and EEG power bands
and it is an aim of this investigation to examine the brain and heart functioning during
the live performances of professional musicians.
It was expected that performers would experience such flow-like states during
sessions of improvisation and the study intended to explore and analyse the
physiological activity of the heart and brain and its associative relations with the
subjective experience of flow while improvising on the piano. By utilising wireless
measuring systems musicians could be tested in real-time during live recitals, offering
a privileged insight into an unexplored sphere of creative expression and research.
© University of Pretoria

1 - 5
1.2 AIM
The primary aim of the study was to do an exploratory, multi-modal physiological
investigation of heart and brain activity during live music improvisation. Hemmed into
this leading objective was the ancillary aim of investigating the possible occurrences
of flow during performances and its associated psychophysiological characteristics
and features within the data. In addition, the study attempted to establish rudimentary
correlations and associations between frequency components of the EEG and heart
rate variability data captured during improvisation and such flow-like states.
1.2.1 Objectives
The chief objectives of the study were as follow:
First and foremost, to record EEG and ECG parameters in professional jazz
musicians during real-time, continuous improvisation on the piano;
To isolate and quantify frequency components of the EEG and HRV dynamics;
To establish possible statistical and associative relations between variables
during different stages and events of performances;
To explore the possible occurrence of flow states during improvisation and
potential representations within the data;
To supplement the narrow existing knowledge base pertaining to the real-time
music performance, improvisation and the neurophysiological underpinnings of
flow;
To investigate the utility and appropriateness of a wireless EEG system as
research tool.
1.3 MOTIVATION FOR RESEARCH
Whilst combing the literature on the pertinent topics of this study it became evident
that research pertaining to creativity - especially and more specifically during musical
creativity and improvisation - alongside the application of EEG in this particular arena
was severely limited. As will be discussed in the literature review (Chapter 2), real-
time studies, which is to say the live testing of individuals during actual performance
or improvisation, are very scarce, possibility due to technological constraints and the
inability of existing research methodologies to capture accurate data during
movement. In accordance, the lack of, but also the desperate necessity for research
© University of Pretoria

1 - 6
to be conducted on musicians during real, authentic music performances are stressed
as one of the main motivations for this research. It is proposed that less direct and
more commonly used approaches such as visualization, imagination, pre- and post-
performance testing, and self-report can only marginally be regarded as true
representation or accurate substitutions for neurocognitive activity occurring during
such creative practices as improvising or other high performance states.
The wireless technologies and equipment utilised in this study allows for greater
freedom on behalf of the researcher to investigate phenomena that, until recent times,
might have fallen outside the jurisdiction of currently available research tools. Wireless
EEG systems carry the benefit of being portable, inexpensive and user-friendly
alternatives to its clinical counterpart, allowing much greater mobility and far lesser
restrictions relating to movement, setup, preparation, cleaning and time requirements.
Additionally, the use of such portable systems allow the investigation of such
performances to occur in what could be considered more natural and conducive
environment for creative expression, such as a performance hall or music room as
opposed to the cold, sterile environment of the laboratory. Musicians will be able to
move freely whilst performing, playing their respective instruments in an environment
that better suites their creative demeanour and outlook, with far lesser intervention
from the researcher or research equipment, allowing a greater sense of creative
freedom.
The construct of flow is also addressed in this study and as will be discussed,
neurophysiological research on flow is still only in its first decade of testing and the
current research undertaking attempts to substantiate this incipient field of research.
Linking EEG and HRV has also emerged in recent times as a growing field of interest,
however such research has mainly been conducted during sleep or meditation studies.
Nonetheless, such studies have rendered inspiring insights into the coherence and
synchronization between these two oscillatory systems in human. The study explores
the dynamic interplay of EEG and HRV variables during flow states, and therefore in
more conscious, alert conducted, but which has also been described as trance-like.
To the knowledge of the investigator this approach is novel and has not been
described before.
© University of Pretoria

1 - 7
Therefore the main motivations supporting this study lie in the following:
The lack of research on creativity and/or music during real-time performance,
which, once more, can be mimicked, but not purely substituted by in-direct
measures;
The shortage of EEG and other research within the context of music creativity
and improvisation specifically;
The testing of musicians in a more naturally conducive environment in order to
facilitate greater creative expression (outside the lab);
The supplementation of knowledge to a relatively new field of research
regarding the physiological foundations of the flow experience;
The use and evaluation of novelty EEG technology as a research tool and
alternative for the testing of scenarios that have proven difficult to equate;
A better understanding of the interrelations between brain and heart during
creative and high performance behaviour, and the potential for development
toward neurofeedback, music therapy and music practise protocols.
1.4 OVERVIEW OF CHAPTERS
All introductory and ancillary sections pertaining to the aims, objectives and content of
the document has been put forward in this chapter (Chapter 1 - Introduction,
objectives and motivation of the research undertaking).
Chapter 2 - Introduction to the physiology of the heart and brain within the
context of music, creativity and flow research.
- Discusses the literature background to the study and its themes. Heart rate
variability is defined through its physiological control and regulatory
mechanisms and methods for analysis. Electroencephalography is also
discussed accordingly, with specific focus drawn to the electrophysiology of the
brain and signal generation, recording and conditioning for analysis. The
chapter continues to discuss these themes within the broader literatures of
creativity, improvisation and flow research.
© University of Pretoria

1 - 8
Chapter 3 - Research approach and methodological outline.
- Outlines the approach and methods employed in the study to record, analyse
and quantify heart and brain related variable. The preparation, procedure and
sample population are described, following an outline of the data analysis and
statistical implementations.
Chapter 4 - Research outcomes and results.
- Reports the results and findings of the data analysis. The process of analysis
and statistical methods are discussed in greater detail within the overreaching
and systematized perspectives employed by the study. Technical specifications
are stated, before the outcomes and graphical representations of the analysis
are presented accordingly.
Chapter 5 - Integrated discussion, conclusion and prospective research
directions.
- Presents an integrated discussion of the results within the wider context of
music creativity and other significant research areas. The findings and
outcomes of the study is contextualised and expanded as the chapter
concludes with the study limitations, and recommendations for further research.
© University of Pretoria

1 - 9
1.5 REFERENCES
1. Dietrich A. Neurocognitive mechanisms underlying the experience of flow.
Consciousness and Cognition. 2004; 13: p. 746-761.
2. Kim D, Kang S, Lee K, Kim J, Whang M. Dynamic correlations between heart
and brain rhythm during autogenic meditation. Front. Hum. Neurosci. 2013.
3. Kim D, Rhee J, Kang S. Reorganization of the brain and heart thythm during
autogenic meditation. Frontiers in Integrative Neuroscience. 2014; 7: p. 1-9.
4. Jurysta F, van de Borne P, Migeotte P, M D, Lanquart J, Degaute JP, Linkowski
P. A study of the dynamic interactions between sleep EEG and heart rate
variability in healthy young men. Clinical Neurophysiology. 2003; 114: p. 2146-
2155.
© University of Pretoria
2 - 1
Chapter 2 Introduction to the physiology of the heart and brain within the context of
music, creativity and flow research.
There's a certain groove you pick that makes the music flow, and when you
have it it's in your pocket. It's the feeling behind the rhythm... to me, the
hardest thing to strive for is that feeling, behind the groove.
Max Weinberg
© University of Pretoria

2 - 2
A literature and background review on the existing knowledge base pertaining to heart
rate variability, electroencephalography and the interaction of these two oscillatory
systems within the body are presented in this chapter. The relativity and contextual
overview of these parameters are discussed within the broader field of creativity
research and more specifically within the context of flow and its physiological
underpinnings.
2.1 HEART RATE VARIABILITY: FROM ATRIUM TO ANALYSIS
2.1.1 Defining heart rate variability
The cyclic activity of the heart is responsible for the phasic and periodic nature of blood
circulation within the body. The length of a heart cycle is often referred to as the heart
period and is inversely proportional to the heart rate (HR). HR demonstrates small
fluctuations between cycles and is not a consistent measure, instead showing slight
variations between beats due to the interactive nature of interaction between the heart
and brain. Heart rate variability (HRV) is this beat-to-beat alteration in the heart’s sinus
rhythm, i.e. the time variation between consecutive heartbeats (R-R intervals), that
describe the oscillations of consecutive heartbeats.
HRV has been shown to be an important indicator of physiological resilience and
behavioural flexibility according to systems-oriented models and reflects the capacity
of the heart to adapt to stressful and environmental demands. It is highly important for
biological systems to maintain a high degree of variability as it is thought that many
phase transitions often occur at certain ‘critical values when variability is high’1.
Analysis of HRV has shown to be an effective, significant and non-invasive measure
to quantify and assess cardiovascular health and autonomic regulation2 with
numerous papers having been published on HRV-related cardiological health
assessment methods.3
2.1.2 The physiology of HR modulation and variability
Initiation of the heart beat originates from the sinoatrial node (SA node) at the posterior
wall of the right atrium of the heart. Unstable membrane potentials of the adapted
myocytes within the heart tissue give rise to spontaneous action potentials that
propagate through the heart and cause systematic contraction of its muscle fibres
resulting in a heartbeat.
© University of Pretoria

2 - 3
Physiological regulation of heart rate is complex, involving many overlapping control
mechanisms that directly or indirectly influence the autorhythmicity of the SA node with
the principal aim of maintaining homeostasis. This is because many factors, intrinsic
and extrinsic in nature, act on the heart and blood circulation, requiring the heart rate
to adapt in an effort to preserve and achieve stability. The concept of allostasis refers
to this ability to maintain stability through change.4
Although the automaticity of the heart is intrinsic to a variety of pacemaker tissues,
chief control of heart rate and rhythm resides with the autonomic nervous system
(ANS). The balancing actions of the sympathetic and parasympathetic innervations to
the heart, monitor and adjust the HR according to a supply and demand rapport (Figure
1).
2.1.2.1 Autonomic control of the heart
The variability and fluctuations of HR can largely be attributed to changes of the
autonomic input to the SA node.5 The ANS, as the name suggests, controls the
automated functioning of e.g. blood and lymphatic vessels, smooth muscles and
visceral organs. Under control of the central nervous system (CNS) it also interacts
with the somatic nervous system6 and consists of two divisions namely the
parasympathetic nervous system (PNS) and the sympathetic nervous system (SNS).
By altering the activity of cyclic AMP second-messenger systems within the cardiac
cells7, heart rate is modified through these innervations and the antagonistic
interactions occurring between the PNS and SNS.
These two divisions of the ANS are anatomically distinct, functionally different and
release different neuromediators from their respective postganglionic nervous
terminals. It has been suggested that differentiation of the characteristics of
parasympathetic and sympathetic mediated HR fluctuations can be attributed to the
difference in response to their respective neurotransmitters by the nodal tissues in the
heart.8 The degree of variability in HR lends insights into the net effect of the PNS and
SNS on the heart and also the heart’s ability to adapt and respond to unpredictable
stimuli.
© University of Pretoria

2 - 4
2.1.2.2 Parasympathetic nervous
system (PNS)
Parasympathetic influence on HR is
facilitated through the vagus nerve
(cranial nerve X). The PNS
postganglionic fibres insert into the
atrioventricular node (AV node), SA
node, atrial and ventricular
musculature and coronary vessels,
however there is only a sparse amount
of parasympathetic innervation of the
ventricles.7 Parasympathetic influence
on heart rate is mediated through the
neurotransmitter acetylcholine which,
upon release from the vagus nerve,
slows the rate of depolarization of the
SA node by binding to the muscarinic
receptors and reducing activity of the
cyclic AMP pathway through inhibitory
G proteins. Through this mechanism
weaker atrial contractions and
decreased conductivity of cardiac cells results in cardio-deceleration3 and a reduction
in heart rate.2, 6
Vagal stimulation of the heart is followed by a rapid response, drawing its maximum
effect at approximately 0.5 seconds. Return to baseline takes less than one second
and is subsequently followed by a slower rebound along the direction of decreasing
R-R intervals.9 Studies have shown that sympathetic influences on cardiac regulation
are much slower than vagal influences10 and that a decrease in fast vagal modulation
leads to a worsening of the heart’s ability to respond appropriately to environmental
demands.
Figure 1: Autonomic innervations to the heart 118 showing sympathetic and
parasympathetic innervations to the different nodes (SA and AV) of the heart.
© University of Pretoria

2 - 5
2.1.2.3 Sympathetic nervous system (SNS)
The SA node, atria, ventricles, conduction system and coronary vessels are just some
of the structures of the heart that are innervated by the efferent nerve fibres of the
SNS. The heart’s response to sympathetic stimulation is slightly slower than
parasympathetic stimulations, and is typified by a time delay of roughly one second,
with a maximum decrease in RRI occurring within four seconds and a return to
baseline taking up to 20 seconds.9
Mediation of sympathetic influence on HR occurs through the release of adrenalin and
noradrenaline which increases the speed of the sinoatrial rhythm through a beta1-
receptor-mediated second messenger system.9 Such beta-adrenergic receptor
acceleration increases the rate of slow diastolic depolarization which accelerates the
heart rate.2
Through the process of syntaxis sympathetic intensity can be redoubled through
positive chronotropic and inotropic effects, i.e. increased force of contraction and
increased impulses to the heart.11 In addition, impulses from the sympathetic nerves
also secrete a co-transmitter from their terminals in the form of neuropeptide Y which
serves to inhibit the parasympathetic nervous activity.6
2.1.2.4 Higher modulation of heart rate
Due to the fact that control of HR resides mainly with the autonomic input to the heart,
HRV analysis offers valuable insight into not only autonomic functioning of the SNS
and PNS but also assessment of the ‘autonomic balance’ of the ANS.4 At any given
moment, HR is determined by this balance between the stimulating effect of the SNS
and inhibitory effects of the PNS. Under resting conditions vagal tone dominates, with
variations of the heart period mainly dependant on vagal modulation despite the high
concentration of acetylcholinesterase within the sinus node and the consequential
rapid hydrolysation of acetylcholine.12
Coordination of the activity of these two branches of the ANS occurs within the
cardiovascular control centre in the brainstem,7 however control of these two outlets
are not always reciprocal and variations of their functioning can be independent and
might also demonstrate co-activation or co-inhibition.13 HR modulation, heart rhythm
and contractibility involves several higher control centres inside the medulla oblongata,
© University of Pretoria
2 - 6
cortical and diencephalic centres (inner-brain), cerebral cortex, thalamus and
hypothalamus.6 The vasomotor centre, located in the medulla oblongata,
compromises of both vasoconstrictor and vasodilator areas that exert their effect on
HR through the vagal and sympathetic innervations of the heart. By reducing muscle
contractibility and peripheral resistance, the depressor area of the vasodilation centre
decreases the HR through vagal stimulation.12 The pressor area within the
vasoconstrictor area produces a reciprocal influence on the depressor area through
increased sympathetic neuronal activity to the heart, accompanied by decreased tonic
activity of the vagal fibres.6
The autonomic centres in the brain stem are also associated with the cerebral cortex
through involvement of the hypothalamus. Communal connections from the
hypothalamus to the vasomotor centres can increase blood pressure in response to
emotions like anger 6 while structures such as the diencephalic and cortical centres
can also initiate cardiac reactions in response to emotional states such as anxiety and
excitement.6 The hypothalamus however controls many vitally important conditional
and unconditional reflexes associated with functioning such as breathing, metabolism
and circulation. The paraventricular nucleus located in the hypothalamus is also likely
to play a central role in facilitating circadian rhythms of the ANS.7 Therefore it is
expected that hypothalamic stimulations would result in variation of the HR.
Other centres such as those in the thalamus will result in tachycardia (increased HR)
upon stimulation, while those areas of the cerebral cortex that can effect cardiac
functioning include the anterior temporal lobe, frontal lobe, insula, orbital cortex,
cingulate gyrus, pre-motor and motor cortex.14
2.1.3 Factors affecting HRV
Intrinsically, cardiac contractions are modulated by a variety of pacemaker tissues
which is then further regulated by other extrinsic factors. Intrinsic factors that can
impact HRV include thermoregulation, circadian rhythm, neuroendocrine secretion,
baroreceptor reflex activity and respiratory sinus arrhythmia 15 while extrinsic factors
like changes in posture, activity, arousal and stress can also affect HR. Such intrinsic
and extrinsic influences are reflected through the autonomic neural regulation of the
heart by the synergistic action of the sympathetic and parasympathetic axis, as
discussed.
© University of Pretoria

2 - 7
2.1.3.1 Baroreceptor reflex
The baroreceptors (stretch receptors) in the walls of the blood vessels and heart react
to distension and their afferent nerve fibres travel to the medulla via the aortic and
carotid sinus nerves. There is a direct proportional relationship between the frequency
of action potential generation in the baroreceptors and the changing pressure within
the structure which they are located in.16 Increased discharge of the baroreceptors
results in bradycardia due to its stimulation of the vagal heart innervations and
reduction of the tonic discharge of the vasoconstrictor nerves.6 When analysing the
power spectrum of HRV within the frequency domain, the lower frequency bands are
associated with baroreceptor activity.17
2.1.3.2 Endocrine influences
It has been shown that several hormones and endocrine factors can affect HRV
including reproductive hormones, thyroxine, steroids and the renin-angiotensin
system.4, 16 Quantitative data on HR responses within the time and frequency domain
pertaining to hormonal modulation is limited, but evidence of non-autonomic control of
HR has been gathered mostly from HRV recordings of heart transplant patients prior
to sympathetic reinnervation.9 Results from these patients suggest that HR hormonal
control is only active at frequencies lower than 0.03 Hz. HRV analysis in this regard
will therefore not be biased by hormonal influences and should not be of concern.
2.1.3.3 Thermoregulation
Temperature fluctuations is a significant source for HR changes.4 Fever increases HR
and with every 1°C increase in body temperature HR increases with roughly 18 beats
per minute.11 Conversely, a decrease in body temperature results in a decrease of HR
such as in methods used during heart surgery where the heart is cooled. With
decreased temperatures, HR keeps slowing until body temperature reaches 15.5 –
21.2 °C where death as a result of hypothermia becomes a serious risk.6 Temperature
effects on HRV is not only mediated through the ANS but can directly impact the
pacemaker activity of the SA node 4 and thermal regulation of HRV should therefore
always be considered when HRV experiments are conducted.
© University of Pretoria

2 - 8
2.1.3.4 Respiratory sinus arrhythmia
During inspiration HR typically accelerates and conversely slows down during
expiration. Respiratory sinus arrhythmia (RSA) reflects this coupling between
autonomic neural outflow and breathing. RSA is primarily mediated by respiration-
driven gating of parasympathetic influence on the heart and the exact phase
relationship between HR and respiratory oscillations is dependent on the respiration
rate (BR).18 RSA therefore reflects the rhythmic ‘waxing and waning of cardiac vagal
efferent effects’ on HR and upon the SA node 19 and vagal efferent outflow to the sinus
node fluctuates in phase with expiration.
A linear relationship exists between parasympathetic cardiac control and the degree
of RSA 20 and RSA is thus a vagally-mediated modulation of HR that is related to
respiration. Such HR variations trail the respiratory rate across a range of frequencies
and its upturn reflects an increase in PNS activity. Because RSA is facilitated by vagal
activity fluctuations, indexing of the respiratory frequency band (ranging from 0.15 Hz
to 0.4 Hz) can be used to measure vagal activity.
Here within we see the dynamic relationship that exists between the cardiovascular
and respiratory systems. Both parasympathetic and sympathetic nerve trafficking
fluctuates with respiration, but the time constant for fluctuations of the sympathetic
tone to affect HR is too long to affect HR at normal breathing frequencies. However,
corresponding changes of increased restorative parasympathetic influence on the
cardiovascular system have been shown to occur during slower breathing rates.21, 22,
23 In conjunction, slowed breathing patterns also correlate with increased
synchronisation, i.e. RSA 24, 25 and the ratio of MF/(LF + HF)a can be used to
approximate heart coherence and may further predict high quality, stable meditative
states.23 Such heart coherence states, as described through RSA can therefore be
achieved easily through slow diaphragmatic breathing, as in the case of e.g. meditative
practises.
a LF= lower frequency; MF= medium frequency; HF= higher frequency ranges of HRV analysis.
© University of Pretoria

2 - 9
2.1.4 Analysis of HRV
Long before modern constructs such as HRV was developed physicians already
recognized the importance of cardiac sounds, rhythms and beat-to-beat rhythm shifts
related to illness, ageing and psychological states. 11 Although initial methods for heart
rate pattern analysis was limited to auscultation, the technology for analysing and
quantifying the electrical activity of the heart has progressed tremendously. Starting
with the galvanometer, the kymograph and polygraph followed, where after the
electrocardiogram was developed and now digital signal processing systems are
playing a very prominent role in analysis of the heart and its rhythms and electrical
activity.9
Acting upon a growing suspicion amongst clinicians that a significant relationship
existed between ANS activity and cardiovascular mortality, experimental evidence for
this observation came into being through the analysis of HRV which showed to be the
most promising quantitative marker for autonomic activity.2
In electrocardiography (ECG) the R-wave of the central waveform (QRS-complex) is
easiest to identify and is used to derive the HRV data.
The original method of assessment of HRV was through manually calculation the
mean R-R intervals and its standard deviations over five minute electrocardiograms
(short-term).9 Smaller standard deviations in R-R intervals therefore equates to a lower
HRV. Presently, detection and evaluation of RRIs can be done digitally.
A report published in 1996 by the Task Force of the European Society of Cardiology
and the North American Society of Pacing and Electrophysiology2 presented important
guidelines towards the standardization of HRV analysis. These guidelines were
followed in the technique evaluation and HRV analysis in this study.
Figure 2: Variation of beat-to-beat intervals (R-R intervals) in the QRS-complex
© University of Pretoria

2 - 10
2.1.4.1 Time domain analyses
(No time-domain parameters were incorporated in this study and are therefore only
briefly explained for informative resolve.)
Time-domain measures are calculated from the raw beat-to-beat interval time series
and is the simplest of the HRV factors to compute and can be done through statistical
or geometric methods. In such calculations the interval length between successive R-
R intervals are determined but can also be used to determine HR at a certain point in
time. In essence the time-domain parameters measure the amount of variability and
by the year 2002 more than 26 different methods of arithmetic manipulations of R-R
intervals had been reported.26
Many time-domain measures are closely correlated with each other. The following
time-domain measures were some that were recommended by the Task Force of the
European Society of Cardiology: 2
SDNN (standard deviation of all normal R-R intervals) and HRV triangular index
- For estimation of overall HRV;
SDANN (standard deviation of the average normal R-R intervals)
- For estimation of long-term components of HRV;
RMSSD (square root of the mean differences between successive R-R
intervals)
- For estimation of the short-term components of HRV.
2.1.4.2 Frequency domain analyses
The total variance in HR can be partitioned into underlying rhythms that typically occur
at different frequency ranges. These different frequencies are associated with different
underlying intrinsic rhythms and physiological factors that are involved in HR
regulation 9 and these oscillations and their power outputs can be determined through
frequency domain analyses.2 Spectral analysis of such HR fluctuations can provide
valuable information regarding autonomic functioning and are identified as following:
© University of Pretoria

2 - 11
ULF (ultra-low frequency) band – can occur under 5 minutes to once in 24
hours. (0.0001-0.003 Hz);
VLF (very-low frequency) band – cycles approximately every 20 sec - 5 min.
(0.003-0.04 Hz);
LF (low frequency) band – cycles approximately every 8 – 10 seconds (0.04 –
0.15 Hz)
HF (high frequency) band – at respiratory frequencies, 9 - 24 cycles/min (0.15
– 0.40 Hz).
Power spectral density (PSD) can be derived through mathematical transformation of
HRV data [Fast Fourier Transformation (FFT) as non-parametric, or autoregressive
(AR) time series modelling as parametric method]. This can be used to differentiate
sympathetic and parasympathetic influence on the heart through quantification of the
relative power of these constituent frequency components of the HRV signal. The SNS
and PNS operate upon the heart at distinct frequencies and their separate rhythmic
contributions modulate the R-R intervals of the QRS complex.3
PSD provides information about power distribution (variance) as a function of
frequency.2 In a PSD graph the area (ms2) under the frequency curve represents the
respective power of the spectral components (Figure 3).
Figure 3: PSD graph showing the different power bands and their relative power.2
© University of Pretoria

2 - 12
Ultra-low frequency (ULF) band activity
The ULF band oscillations are significantly influenced by the ANS, typically reflecting
circadian rhythms 27 and a down-turn in ULF has been shown to be a strong predictor
of mortality in e.g. fibromyalgia.9 The ULF and VLF rhythms of HR may have
psychophysiological correlates and clinical application; however the literature is
ambiguous.28
Very-low frequency (VLF) band activity
VLF band oscillations have been linked to thermogenesis, periodic breathing and
changing vasomotor tone in response to metabolic and thermoregulatory needs, but
can also be affected by hormonal systems e.g. renin-angiotensin systems (dampens
VLF power).4 Additionally, VLF fades when parasympathetic activity is blocked and
can therefore be used as indicator for parasympathetic abnormalities.16
Low frequency (LF) band activity
According to the standardisation criteria put forth by the Task Force of the European
Society of Cardiology 2 the LF component directly reflects sympathetic activity upon
the heart, however evidence have been brought forth that LF is also under notable
influence from the PNS, baroreceptor feedback and other centrally generated rhythms
from the brainstem.3, 4, 29 LF is therefore not an unalloyed reflection of sympathetic
activity but rather reflects a blend of both para- and sympathetic influence, though
skewed towards sympathetic dominance.
In order to acquire a more reliable index for sympathetic activity, some researchers
have proposed it necessary to normalize the LF component (discussed later) where
after the normalized HF component can be subtracted to exclude parasympathetic
influence.30 A medium frequency range (MF = 0.08 – 0.15) has been put forth in other
studies 23 with LF and HF ranges shifting to 0.01 – 0.08 Hz and 0.15 – 0.5 Hz
respectively, allowing deeper interpretations into the baroreflective feedback arising
from the MF expanses (0.1 Hz). In addition, MF power relative to that of LF and HF
ranges are said to be highly reactive to changes in emotional states.31
High frequency (HF) band activity
Unlike the SNS which only truly operates at frequencies lower than 0.1 Hz, the PNS
operates at a wider range of frequencies (0.15 – 0.4Hz), implying that the total power
© University of Pretoria

2 - 13
of high frequency oscillations, i.e. faster alterations in heart rhythm, is a solitary
reflection of vagal activity and operates in phase with the respiratory frequency
(RSA).4, 19, 30 The fact that HF is affected by BR means the spectral power of HF is
also affected, however the mean R-R intervals remain nearly constant across all
different respiratory frequencies and this consistency can therefore be taken as
evidence for the steadiness of vagal-cardiac traffic.32 Given the fact that HRV is
derived from ECG, it is not possible to distinguish between reduced vagal activity
arising in the vagal centres of the brain or a reduction in peripheral activity as
contributed by the sinus node or afferent/efferent conduction pathways to/from the
brain.32
2.1.4.3 Filtering of HRV data
It is critically important to the integrity of any data set that adequate artifact removal is
performed for unbiased analyses. The most common artifacts that arise in HRV
analysis is that of missed beats. Fortunately, by restoring the original R-R series the
removal of missed beats results not in any loss of information. However, the removal
of any abnormal or ectopic sinus beats does involve loss of information and this is
evidently more problematic. By using RR statistics or an autonomic filter the problem
can be rectified by inserting upper and lower bounds so that any R-R interval may not
differ by more than 20% from its previous intervals. Such methods make it possible to
identify and replace or exclude outliers from the data analysis based on estimations of
the R-R probability distributions.5, 30 Detrending methods (e.g. Niskanen et al.33) and
artifact correction methods make it possible to smooth out erroneous or distorted data
end points.
2.2 ELECTROENCEPHALOGRAPHY: FROM CORTEX TO
CONDITIONING
2.2.1. Defining electroencephalography
The electroencephalogram (EEG) is a valuable and uniquely developed measuring
system of the electrical activity of the brain, first reported in humans by Hans Berger
(1873 – 1941) in 1929. The EEG allows one to observe the oscillatory rhythms of
electrical activity of the brain often referred to as brainwaves.34 The brain does not
have inherent brainwaves, instead the EEG picks up the stream of electrical activity of
© University of Pretoria

2 - 14
neuronal activation on the brain’s surface through electrodes (leads) and can be
described as a simple method to measure the underlying summed postsynaptic
electrical activity of the cortex on the surface of the scalp. It provides a graphic display
of brain function by plotting the potential difference between positive, negative and
proximal electrode sites (depending on the montage utilised), recorded over time.
Electroencephalography (EEG) is therefore the study of recording such electrical
oscillations generated within the brain and can be done either extra- or intracranially.
Extracranial EEG produces an across-the-board survey of electrocerebral activity in
both hemispheres of the brain by strategically placing electrodes on the scalp (its
conductivity enhanced by an electrode paste or other form of conductive medium).
Alternatively, intracranial EEG, performed by surgical implantation of electrodes,
provides focused recordings from targeted sites directly from the brain.
From the scalp to the electrodes (positive leads), the signal further propagates through
the connected wires to an electrode board where it is amplified and routed to a
computer or feedback device. In addition, one electrode (negative lead) is placed on
either side of the head on an electrically inactive site (customarily the mastoid bone
behind the ear or on the earlobes) to serve as reference against which the activity at
each of the positive leads can be reflected. The raw waveforms observed through EEG
show the wave’s morphology (shape), amplitude (height from peak to trough) and
frequency (waves per second, measured in Hertz).35
It is the clinical application of EEG and its findings that impart its greatest utility, but
the EEG is also a practically valuable and inexpensive research tool. Added that it can
be set up in a non-medical environment it remains a very useful tool in research and
clinical settings to date.
2.2.2 Signal generation and electrophysiology of the brain
2.2.2.1 The neuronal makeup and membrane
At birth approximately 10e11 neurons exist in the human brain when the central
nervous system (CNS) becomes fully functional, 36 averaging at 10e4 neurons per
cubic mm. In the average adult there would exist approximately 5 x 10e14 synapses
which interconnect neurons with each other to form neural nets.36 The number of
© University of Pretoria

2 - 15
neurons in the brain decreases with age, but the number of synaptic junctions per
neuron increases as a person gets older.
Looking at the brain from an anatomical point of view it consists of three main parts:
the brainstem, cerebellum and cerebrum. The highly convoluted surface layers of the
cerebrum is what is referred to as the cerebral cortex. The cerebrum contains regions
related to higher functions such as conscious awareness of sensory input, complex
analysis, emotions, behaviour and movement initiation, whereas the brainstem is
concerned more with involuntary functions such as heart regulation, respiration
biorhythms and hormone secretion. The cerebellum is almost exclusively involved with
coordinated voluntary movements of skeletal muscles and balance.
The CNS in general consists of nerve cells (neurons) and glial cells (supporting cells
located between neurons) and activities in the CNS relate mainly to currents
transferred between the junctions (synapses) of axons and dendrites of these neurons
(Figure 4). Each nerve cell consists of a cell body (soma), dendrites (branching
processes) and an axon (main process). The cell body of the nerve has a single large
nucleus and houses most of the metabolic activity occurring within the cell, especially
related to protein synthesis. These proteins (e.g. neurotransmitters) are transported to
other parts of the nerve cell by means of tubulin rails which also maintain the shape of
the soma.
The axon is cylindrically shaped and carries the purpose of transmitting nerve
impulses from the soma to other cells. In humans, the axon can be anything from a
percentage of a millimetre to more than a metre in length. The dendrites connect to
the axons or dendrites from other cells in order to relay or receive signals. In the human
Figure 4: The structure of a neuron.32
© University of Pretoria

2 - 16
brain a single nerve cell can be connected to upwards of 10,000 other neurons, mostly
through such dendritic connections. The large surface area provided by these dendritic
connections facilitate the reception and propagation of multiple signals from attached
neurons.
Recorded EEGs from the scalp’s surface represent pooled electrical activity that is
generated from a large number of neurons with modest contribution from the glial cells.
The nervous system’s intrinsic electrophysiological properties and the time-varying
ionic currents generated in the neurons form the origin of cerebral potentials in the
brain and can be recorded using electrodes at short distances (local field potentials,
LFPs) or longer distances (from the scalp, i.e. the EEG) from the source. These ionic
currents are produced at cellular membrane level (transmembrane currents) and it is
possible to distinguish between two main forms of neuronal activation 37 namely:
Fast depolarization of the neuronal membrane – mediated through sodium and
potassium voltage-dependent ionic conductance. (Action potentials)
Slower membrane potentials changes - mediated through synaptic activation
by neurotransmitter systems. (Synaptic activation)
2.2.2.2 Fast depolarization of neuronal membranes
Through the efflux of positively charged potassium ions (K+) the neuronal membrane
is able to maintain an electrochemical equilibrium and thus a resting membrane
potential at -75 mV. The axon membrane is covered with integral ion channels that
allow the passage of ions across its surface. When depolarization occurs, voltage-
gated channels within the lipid bilayer of the membrane openb and an influx of sodium
ions (Na+) occurs due to the intra- and extracellular ionic gradient, exceeding the
normal electrochemical resting state.
If this applied voltage, or stimulus, is high enough to breach threshold the result is a
transient reversal of the membrane polarity as the intercellular potential suddenly shifts
from negative to positive (depolarization) and rapidly returns to resting potential (1 to
2 ms) allowing the generation of what is called an action potential (Figure 5). The
action potential (AP) has the remarkable ability to propagate across dendrites and
axons without any loss of amplitude. Furthermore, the shape of this AP and its rate of
b Closure of these channels is time dependant
© University of Pretoria

2 - 17
travel along the axon occur at a rate independent of the initially applied voltage as AP
generation is an all-or-nothing event occurring at a distinct threshold. In humans, the
amplitude of the AP can lie somewhere in the range of approximately -60 mV to 10
mV.
In summary the process of AP generation is as follows: 38
I. Upon receiving the stimulus Na+ channels in the dendrites open, driving the
internal potentials higher. If this opening is enough to raise the membrane
potential from -70 mV to -55 mV, the process will continue (threshold).
II. The moment the action threshold is breached, more Na+ channels open,
causing an influx of Na+ and raising the interior membrane potential up to 30
mV (depolarization).
III. The subsequent closing of Na+ channels and opening of K+ channels (slower
to open) allows completion of the depolarization, while the opening of K+
channels now allows the membrane to repolarize in the direction of its resting
potential (repolarization).
Figure 5: The stages and associated membrane potential fluctuations of an action potential as measured in a giant squid neuron [adopted from (34)].
© University of Pretoria

2 - 18
IV. During repolarization, these ionic fluxes typically overshoot the resting potential
to approximately -90 mV, called hyperpolarization. Hyperpolarization therefore
raises the threshold for any immediately following stimuli, preventing the neuron
from receiving another stimulus and subsequently generating a new AP. This
also prevents any impulse already travelling across an axon from eliciting
another AP in the opposite direction.
V. Following hyperpolarization the membrane potential returns to -70 mV by
means of Na+/K+ pumps re-establishing the ionic gradients collaterally along
the membrane.
2.2.2.3 Slower membrane potential changes
Communication between neurons occur by means of synaptic transmission which can
be either electrical or chemical. The term synapse refers to the junction between two
excitable cells where communication occurs. The greatest percentage of neuronal
synapses in the CNS are chemical synapses, which are specialized structures
enabling the chemical transfer of information between cells. Typically at these
chemical synapses, the terminal of the presynaptic axon swells to form what is called
a bouton. A synaptic cleft (gap) exists between termini as the bouton does not
physically touch the postsynaptic terminal, but is in extremely close proximity (20nm).
This fluid-filled gap prohibits the direct transmission of the electrical impulse from one
cell to the other. Instead, rapid diffusion of neurotransmitters across the synaptic cleft
(released into the gap when an action potential travelling across the axon reaches the
synapse) is how the nerve impulse is transferred to the postsynaptic cell. This may
generate either an excitatory post-synaptic potential (EPSPs) if it ends in an excitatory
synapse or inhibitory post-synaptic potentials (IPSPs) if the action potential reaches
an inhibitory synapse. If subsequent action potentials, separated by only a short
distance, travel along the same fibre a summation of EPSPs occurs.
© University of Pretoria

2 - 19
EPSPs flow inwardly (sinks) to other parts of the cell by means of calcium and sodium
ions (extracellular to intracellular), whereas IPSPs flow outwardly (source) involving
potassium and chloride ions. It is these summed potentials that form the greatest
source of extracellular current flow; longer in duration (slower) than action potentials
they are responsible for the majority of EEG waveforms of which the major contributor
of such synaptic potentials are the pyramidal cells layered in the cortex.
Areas >6cm2 are required for measurements at the scalp’s surface, however due to
the attenuating properties of the skull, an area >10cm2 is required for the scalp EEG
to show most IEDs (interictal epileptiform discharges). The thalamus and brainstem
act as “subcortical generators to synchronize populations of neocortical neurons in
both normal (i.e., sleep elements) and in abnormal situations (i.e., generalized spike-
and-wave complexes”.39 The term ‘volume conduction’ hereby describes the process
of current flow from the generators in the brain and the recording electrodes and
Figure 6: The synaptic junction showing neurotransmitter release into the cleft in propagation of the action potential arriving at the presynaptic terminal to the
postsynaptic neuron.120
© University of Pretoria

2 - 20
therefore the EEG displays the continuously changing voltage fields across different
locations on the scalp.
As described in the previous sections, an EEG signal is therefore a measurement of
the current flow occurring during synaptic excitations of neurons, and more specifically
their dendrites, in the cerebral cortex. These currents generate electrical fields over
the scalp, created by the dipoles between the soma and apical dendrites of the
neurons that are caused by such summed postsynaptic graded potentials and are
measurable by scalp electrodes.
2.2.3 EEG signal capture
The first electrical neural activity recordings were made using simple galvanometers,
which later evolved the string galvanometer and capillary electrometer in the early
1900’s,40 using mirrors and coils to register current variations. Modern EEG systems
Figure 7: An outline of a cortical pyramidal cell displaying the pattern of current flow caused by excitatory and inhibitory synaptic activation. The apical
dendrites of these cells are typically oriented towards the surface of the cortex. Current flow arising from an activation of an excitatory synapse (EPSP) creates a
‘current sink’ in the extracellular medium surrounding the synapses, showing a negative polarity at the site of the synapse. At the level of the soma however a
distributed passive current ‘source’ generates a positive polarity in the extracellular medium. In the event of an IPSP, current flow causes an extracellular ’source’ at the
soma and a passive ‘sink’ at the apical/basal dendrites. Note that a source-sink configuration features in both cases.37
© University of Pretoria

2 - 21
comprise of a number of sensitive electrodes, differential amplifiers and filters, having
evolved from pen-type systems (that plotted activity on paper and are still in use today)
to more sophisticated computerized systems that can digitize and store signals.
From an empirical standpoint, other perhaps more sophisticated, non-invasive
neuroimaging and neuroelectrical technologies exist in addition to EEG, such as
functional magnetic resonance imaging (fMRI), positron emission tomography (PET)
and single photon emission tomography (SPECT). In a creative task-related study,
perhaps more appropriate to the current research context, Bekhtereva et al. 41
compared EEG with PET, finding both systems generally satisfactory. However, the
authors disclosed that EEG’s spatial resolution and sensitivity for deep brain
processes was not adequate. Other authors have also critically expressed that EEG
can only be considered a gross correlate of brain activity.42
However Fink et al. 43 explain that the primary advantage that EEG has over the high
spatial accuracy and neuroanatomical insights of e.g. fMRI resides in the EEG’s high
temporal resolution which is typically in the range of milliseconds, as well as the
availability of many diverse parameters for further analysis. Additional limitations in the
application of fMRI when compared to the EEG include: 43
Many types of brain disorders, malfunction and typical mental activities of the
brain cannot be recorded with fMRI due to the limited effect they have on the
level of oxygenated blood;
Accessibility to fMRI systems are costly and limited, especially in developing
countries;
Temporal (time) resolution of the fMRI is very low, i.e. the image sequences is
slow, approximately two frames/s.
© University of Pretoria

2 - 22
Concerning more specifically the current research undertaking:
Movement on behalf of the individual is a great limitation when using fMRI.c As
subjects were required to perform using the piano, such movement is not
tolerable during fMRI scanning to acquire clear imagery.
A multitude of cognitive tasks can be conducted during an fMRI scan such as
imagination, visualisation or memorising. However, critically such data cannot
be accepted as substitute or as accurate representation of real-time brain
activity during acts of e.g. art making, music performance or tactile behaviour.
A strong motivation for this study.
2.2.3.1 Data montage and recording
The human head comprises of several different layers including the brain, skull and
scalp with several other layers of differing tissues existing between them. Signals
generated within the brain are attenuated approximately one hundred times more by
the skull as compared to the soft tissues, however most of the noise regarding signal
processing are produced over the scalp (external noise) or within the brain itself
(internal noise). This implies that only large populations of active neurons would be
able to generate a large enough potential field to be recordable from the scalp.
Scalp EEG recordings therefore reflect the difference in electrical potentials between
two sites overlying the cerebral cortex, representing a two-dimensional projection of
the pooled synchronous activity of a large population of neurons at an electrode site.
Proper functioning of the EEG electrodes are crucial for the acquisition of high quality
data. There are different types of electrodes that can be used for EEG recordings e.g.
disposable electrodes (pre-gelled types or gel-less types), reusable disc electrodes
(silver, gold, tin or stainless steel), saline-based electrodes, electrode caps and
headbands.
A high level of impedance exists between the cortex and the electrode due to
attenuation from the skull and it’s lining tissues and might cause distortions or masking
of the true EEG signals. Fortunately, most modern commercial EEG systems come
c When head movement of an individual under fMRI testing exceeds two millimetres, no usable data
can be collected.102 Thus, although these technologies are more powerful than EEG, they are also more
sensitive to movement artifacts.
© University of Pretoria

2 - 23
with built-in impedance monitors. An effective electrode impedance level lower than
5kΩ, balanced within 1kΩ of each other, is required for satisfactory recording quality.
Once picked up by the electrodes, brain generated electrical signals are amplified for
the purpose of display by the EEG, along with
the incorporation of waveform analyses of
voltage, frequency, morphology and
topography. However, due to the two-
dimensional nature of these recordings, the
layered and spiral structure of the brain, the
potential distribution over the cortex is not
uniform, 44 posing a problem when trying to
localize the signal generator, and/or interictal or
ictal sources.
From the original one-channel analogue EEG
recordings performed in the late 1920s, the
EEG has evolved to sophisticated
computerized and digital-based recording devices, offering a wide variety of data
presentation for processing and interpretation. Electrode placement has since been
standardized to an international 10-20 system that designates the sites where
electrodes should be placed based on 10% and 20% interval subdivisions centred on
certain anatomical landmarks.
Electrode designations utilized in both the 10-20 and 10-10d systems reflect for each
electrode the:
region of the cerebrum – Fp (frontopolar); F (frontal); C (central), P (parietal);
T (temporal); and O (occipital);
side of the head – right (even numbers) or left (odd numbers);
proximity from the midline – lower numbers indicate a closer proximity to the
midline; the midline is indicated by ‘z’ e.g., Cz = central midline).
d The 10-10 system is a newer combinatorial electrode placement system where the intervals between electrodes are much smaller, allowing the use of additional electrodes.
Figure 8: Approximate resistivity and thickness of the three main layers of the head (Ω = ohm). 40
© University of Pretoria

2 - 24
From the spatial array of recording electrodes, an electrical “map” can be attained
known as the montage. Two basic EEG montage types are typically used, monopolar
(more often referred to as referential) and the bipolar type. The referential montage
depicts absolute voltage through amplitude at different loci by using an active
electrode site as initial input and reflecting this measure against one or more ‘neutral’
electrode/s (placed on an electrically inactive site e.g. the mastoid bone behind the
ear, or the earlobes). The greatest advantage of the referential montage is that a
common reference allows valid comparisons of activity between many electrode
pairings, however there lies a major disadvantage in that no reference site is ideal.45
Earlobe electrodes might pick up EEG activity from the temporal cortex, whereas other
noncephalic reference sites, such as the tip of the nose, angle of the jaw or neck might
be subject to EMG artifacts due to activity of the muscles.
Bipolar montage arrangement can take on many different spatial layouts such as
circumferential, transverse or longitudinal (“double banana”) patterns and compare
EEG activity between two active electrode sites. A bipolar montage therefore reflects
activity at adjacent active electrode sites with each other, signifying absolute
Figure 9: The standardized electrode placement according to the international 10-20 system (black dots) and the modified combinatorial
10-10 system (black + white dots)35
© University of Pretoria

2 - 25
electrographic activity by phase reversals, i.e. activity that both sites have in common
are subtracted, rendering only the activity difference. A typical array consists of a chain
of electrode placements from anterior to posterior, central and temporal, arranged on
both sides of the head.
The major advantage of bipolar montages are that the localization of
electrophysiological events are easier. Spikes, or notable EEG patterns or events can
be identified by examining sequences of bipolar derivations for phase reversals of
electrical signals as one moves spatially (anterior to posterior) or laterally (left to right).
However, due to the differential nature of these montages, some information is lost,
being the major disadvantage of the bipolar montage.
2.2.4 EEG signal conditioning and mechanics
Analysis of EEG require the sampling of signals, its digital or visual representation and
encoding, allowing the signal data to be processed and analysed further. Detecting
and understanding brain oscillations from scalp EEGs can prove difficult alongside the
definition of back- and foreground EEG, but through the application of advanced signal
processing tools it is possible to separate, quantify and analyse waveforms
manifestations and abnormalities. Computerized systems typically come equip with
simple or advanced signal processing tools, allowing for variable settings, stimulations
and sampling frequencies. Conversion from analogues to digital EEG is achieved
through multichannel analogue-to-digital converters (ADCs). With a limited effective
Figure 10: Phase reversal as demonstrated in a bipolar montage (A); absolute voltage as demonstrated in a referential montage (B). By convention, an upwards deflection in the waveform reflects a more negative voltage difference at electrode 1.
compared to electrode 2.39
© University of Pretoria

2 - 26
bandwidth of 100 Hz (although many application may be considered at almost half of
this), EEG sampling at 200 samples/s is enough to satisfying the Nyquist’s criterione.
The raw EEG input comprises of frequency components of up to 300 Hz and
amplitudes of the order of μVolts (μV). However, to preserve the operative information
the raw signals need to be amplified and filtered in order to reduce noise and make
the signal more eligible for processing and visualization. High-pass filters, usually set
at a cut-off frequency of <0.5 Hz, are used to remove very low frequency components,
such as those associated with breathing, that might cause disturbances in the data.
Low-pass filters are also applied in order to mitigate high-frequency noise and are
normally set somewhere between 50 – 70 Hz. An additional notch filter is sometimes
necessary to ensure the definitive rejection of strong frequencies associated with the
power supply, normally set at a null frequency of 50 Hz, although in some countries
this might be at 60 Hz.
Filtering as part of the pre-processing stage carries the purpose of removal and
mitigation of common occurring artifacts to ensure restoration of informative data.
Artifacts can be described as any distortions of the data that might be caused by, but
not limited to, e.g. movement. The foremost artifacts can be subdivided into system
artifacts and physiological (patient-related) artifacts. System artifacts include 50/60 Hz
power supply interference, impedances of the electrodes, cable defects and electrical
noise from the electronic components. The physiological (internal) artifacts are mainly
related to body or eye movements, ECG and pulsation, ballistocardiogram, and
sweating.
A number of factors play a role in the computerized analysis of EEG signals. These
factors involve the frequency distribution, amplitude of the signal (voltage), form/shape
morphology of the wave, characteristics of the waveform’s occurrence (continuous,
serial or random), interhemispheric symmetries (voltage frequency, shape and site),
reactivity and voltage/frequency regulation.
e “The statement that when a continuous-time band-limited channel is to be sampled, the sampling process may or may not cause information to be lost according to whether the sampling rate...is less than, greater than, or equal to twice the bandwidth....” 119
© University of Pretoria

2 - 27
2.2.4.1 Frequency and amplitude
The term frequency refers to the rate at which a waveform repeats within 1 sec, i.e.
the number of cycles per second (hertz or Hz). Analysis of the EEG signal in terms of
different frequency ranges is known as frequency or spectral analysis and traditionally
encompasses two basic approaches: spectral analysis by narrowband filters (typically
partitioning the signal into 1 Hz segments or bins) or wideband electronic filtering.45
Exploring the cyclic or oscillatory patterns or rhythms within the data is the chief
concern of spectral analysis, enabling the decomposition of compound and complex
time series into a few principal sinusoidal functions of particular wavelengths.
The amplitude of an EEG signal can be defined as the voltage difference (in microvolts,
μV) measured from the peak to the trough of the wave and typically falls within the
range of 20-50 μV. There is however a great degree of variability, with amplitudes
varying from more than 100μV to less than 10μV. The amplitude of an EEG signal is
often tempered in response to certain stimulation. An example can be observed when
comparing fast activity during an eyes-closed state and how the amplitude of such
activity is attenuated when the eyes are opened. The most common method of
analysing the frequency distribution within the EEG spectrum is through the use of
Fast Fourier Transformation (FFT),46 resulting in measures of the amount of energy,
or power, distributed between different frequency bands of the waveform.
Five major frequency bands or brain rhythms are distinguishable:
alpha (α; 8 – 13 Hz) and beta (β; 14 – 26 Hz) – originally introduced by Berger
in 1929;
delta (δ; 0.5 – 4 Hz) – initially introduced by Walter in 1936 to designate all
frequencies below the range of the alpha rhythms (subsequently changed after
the introduction of the theta wave);
gamma (γ; 30 – 45 Hz) – introduced by Jasper and Andrews in 1938 to
described frequencies above 30 Hz;
theta (ϴ; 4 – 7.5 Hz) – a notion introduced in 1944 by Wolter and Dovey after
the earlier introduction of the delta frequency range as a sort of sub-division of
its own.
© University of Pretoria

2 - 28
Activity falling within the delta and theta ranges are often referred to as slow-wave
activity, whereas fast-wave activity refers to the higher frequency band activity in the
alpha and beta ranges.
Delta waves (0.5 – 4 Hz)
Delta frequencies (δ) are high amplitude rhythms primarily associated with deep sleep
(Stage 3 and 4 of NREM), typically arising from the thalamus (coordinating with
reticular formation) 47 or cortex (regulated through suprachiasmatic nuclei).48 Showing
right hemispheric lateralization during sleep, it delta rhythms are mediated in part by
T-type calcium channels 49 and also stimulates the release of a number of hormones
including prolactin and growth hormone releasing hormone (GHRH).
The large muscles in the neck and jaw can sometimes cause artifact signals in the
data that might resemble that of delta waves. This is due to these muscles lying close
to the skin’s surface, causing large signals upon contraction, whereas the genuine
delta response, which originate from deeper lying regions in the brain, is severely
attenuated as it passes through the skull. Through application of signal analysis
Figure 11: The four most dominant, normal brain rhythms in descending order of frequencies, and at their usual amplitude ranges. Delta and theta waves are observed in infants and during sleep in adults; alpha waves appear in the occipital
regions of the brain during low attention states; beta waves appear at low amplitudes in the frontal and parietal regions.40
© University of Pretoria
2 - 29
methods it is possible to see when these signals are caused by excessive movements
to resolve this dilemma.
Theta waves (4 – 7.5 Hz)
It has been put forth that the term theta might have been chosen to refer to its
presumed thalamic origin.40 The theta frequencies (ϴ) show strong association with
deep meditation, creative inspiration and access to unconscious material. It is allied
with a person’s level of arousal and is often accompanied by other frequencies. Theta
oscillations have also been demonstrated in a variety of voluntary and alert behaviours
in rats 50 and research suggest that theta might reflect sensorimotor integration.51
Strong associations have been established between theta rhythms and the
hippocampal formations in rats, 52 suggesting its involvement in memory and learning,
however hippocampal associations in humans are much harder due to the deeper
positioning of the hippocampus in the brain. Cantero et al. 53 did however record theta
activity arising from the hippocampus and neocortex in epileptic patients by means of
intracranial electrodes and found associations with REM sleep, transition from sleep
to waking, and quite wakefulness.
It has been shown that changes in theta occur during meditative exercises [e.g. (54)],
alpha/theta neurofeedback enhancement of creative performance, improvisation and
anxiety, 55 importance in childhood and infancy, 56 maturation, emotion and various
pathological complications in waking adults (e.g. Parkinson’s disease 57 and
schizophrenia58).
Alpha waves (8 – 13 Hz)
Alpha rhythms (α) are most commonly found in the occipital and posterior regions of
the brain. These waves often appear as sinusoidal shaped (rounded) signals, but may
also appear as sharp waves, although rare. Alpha oscillations are the most prominent
rhythms in the brain, thought to reflect a relaxed awareness without overt
concentration or attention and may possibly cover a larger range than has been
formerly accepted.40 This is due to regular peaks appearing in the beta wave range
that seem to resemble alpha wave morphology more than that of the beta wave.
Alpha waves show greater amplitudes over the occipital regions, normally less than
50 μV. Most subjects show an intensification of alpha activity when their eyes are shut,
© University of Pretoria

2 - 30
leading to the supposition that alpha waves are merely a scanning or idling pattern
produced by the visual areas in the brain. Opening of the eyes result in a suppression
of alpha activity. Therefore, the physiological origin of alpha waves are thought to be
in the occipital areas, however speculation of thalamic origination have been
suggesed.59
Beta waves (14 – 26 Hz)
Beta rhythms (β) represent the usual waking rhythms of the adult brain and shows
association with active attention and thinking, problem solving, and focus on the
outside world. The normal amplitude of the beta rhythm is usually under 30 μV and
are mainly encountered in the central and frontal regions. Beta rhythms may be
inhibited by tactile stimulation or motor activity, but may also be enhanced by bone
defects, 60 during panic states or around tumour sites.40
Gamma waves (30 – 45 Hz)
The gamma range (γ) are also sometimes referred to as fast beta waves, normally
arising at much lower amplitude and of very seldom occurrence. However, detection
of gamma activity can be used for confirmation of certain brain pathologies.
Additionally, the gamma band is also a good indicator of event-related synchronization
(ERS) in the brain, having been used to designate the locus for both left and right index
finger movement, toes on the dextral side of the body, as well as an expansive and
bilateral area associated with tongue movement.61
SMR waves (13 – 15 Hz)
The sensorimotor rhythm (SMR) is an idling rhythm observed in sensorimotor areas
of the brain during states of immobility. There is typically a decrease in SMR rhythms
when a person becomes active, 62 however SMR activation in general is rather poorly
understood. Deliberate modification of SMR activity has proven useful in the field of
Brain-Computer Interfacing (BCI) 63 in order to control external applications, and have
shown utility in the realms of neurofeedback training, learning disabilities and autism.
[e.g. (64)].
© University of Pretoria

2 - 31
Other waves of interest
Additional brain oscillatory patterns and rhythms have also been put forth by many
researchers including: 40
a) The Phi rhythm (φ; <4 Hz), found to be a possible neuromarker for social
engagements and coordination between individuals. 65
b) The Tau rhythm (τ), representing alpha activity in the temporal regions.
c) The sleep spindle, occurring during sleep at 11-15 Hz. Often referred to as
sigma activity (σ).
d) The Kappa rhythm (κ) – alpha-like activity occurring in the anterior temporal
regions. Discrete lateral oscillations caused by the eyeballs and considered as
an artifact signal.
e) The Chi wave (χ) is believed to be a mu-like, rolandic pattern occurring at 11-
17 Hz; observed during Hatha Yoga practise.
f) The Lambda rhythm (λ) – a rare pattern observed in waking adults; sharp
transient signals occurring in the occipital regions during visual exploration of
walking subjects. These patterns show varied amplitudes (generally below 90
μV), positive in polarity and time-locked to saccadic eye movement.66
g) Frontal artifacts (alpha range) caused by eyelid flutter when the eyes are
closed.
2.2.4.2 Morphology
Frequency and amplitude components of a signal combine to affect the “shape” or
morphology of a waveform. Continuous fluctuations occur within the signal as
response to stimuli and towards the subject’s state of consciousness (sleep, awake,
drowsy etc.) and certain features of the waveform permit its detection by the recording
apparatus. A transient form stands out from the background EEG activity and is thus
an isolated feature or form like a spike (peak duration less than 70 ms) or sharp wave
(peak duration between 70 – 200 ms). When waves occur together or repeat at
periodic intervals they are referred to as complex features or forms. A monomorphic
complex can be described as such waves where subsequent waveforms are similar,
whereas polymorphic complex waves are dissimilar. Waveforms may also
accommodate numerous positive and negative voltage swings and can therefore be
© University of Pretoria

2 - 32
of differing phases e.g. nonphasic (either positive or negative), diphasic (positive and
negative), triphasic or polyphasic. 40, 62
2.2.4.3 Symmetry
Waveform amplitude (bilateral) symmetry between homologous electrode sites are
often regarded as sensitive to certain neuropathologies and an important
consideration within the EEG.45 Research conducted in the 1970s by Matousek and
Petersen 67 revealed that for each of the different frequency bands the symmetry
amplitude values were comparable, as well as corresponding to the symmetry of the
overall EEG activity. John’s 68 neurometric analytic approach published a few years
later defined a ratio for amplitude asymmetry of transformed measures at certain
electrode sites. EEG symmetry also include the phasic relationship of two waveforms
within a certain frequency band, with one of the earliest methods for measuring phasic
symmetry applying polarity coincidence correlation (PCC) to calculate phase from a
large number of polarity comparisons of two simultaneous signals.68
Measures of the phasic relations between signals provide estimates of the lag or lead
times between connected systems or generators that are spatially separated. When
the sampling of EEG signals is at a high rate (e.g. 10 kHz) the frequency resolution of
the correlation exceeds the EEG signal bandwidth, however digital delay circuits allow
for the delay of one signal with regards to the other. By quantifying the phase shifts
between interhemispheric pairings or from within lateralized hemispheres, it becomes
possible to gain information regarding the propagation of neural pathways.69
Symmetry analysis can furthermore be divided into ‘amplitude symmetry within a
frequency band’ or ‘phase and coherence functions within respective frequency
bands’.45
2.3 LINKING THE BRAIN AND THE HEART
2.3.1 Physiological coherence
In the preceding section it was explained that spectral analysis is a means of
examining the oscillatory patterns of the data within respective frequency domains.
Cross-spectral analysis is used to compare patterns from two inputs, representing the
correlation between two time series at different frequencies. The term coherence
delineates the symmetry between frequency patterns of two time series, is analogous
© University of Pretoria

2 - 33
to cross correlation within the frequency domain and mirrors the strength of connection
between spatially distant signal generators. Put differently, coherence can be
understood as “the quality of being logically integrated, consistent and intelligible”, as
in a coherent argument.70 When we refer to a person’s speech as coherent, the parts
fit together well, whereas if their speech was incoherent, it would not make sense or
might be meaningless. For a system of parts, or a sentence of words, the meaning
conveyed by the arrangement of these words are greater than each word’s individual
meaning, and therefore coherence in this context refers to wholeness and global order.
In signal processing mechanics, the concept of coherence describes the level of
coupling or interaction between oscillatory systems. Coherence infers
synchronization, which describes the degree to which two oscillatory patterns are
frequency or phase locked. Applying this concept to the realm of physiology,
coherence analysis can be used similarly to describe the degree of harmonious
interaction or coupling between two or more oscillatory systems within the body (cross-
coherence), e.g. the heart and brain, or within a single system (auto-coherence), e.g.
between regions or electrode sites of the brain. In the case of cross-coherence
between two separate systems that may operate at different frequencies, it may be
possible that they may become entrained to oscillate at the same frequency or might
become phase-locked.
In a beautifully constructed sleep EEG study, Jurysta et al. 71 assessed the phasic
relationship and dynamic interactions between the power bands of
electroencephalography (EEG) and the high frequency (HF) of the R-R interval
variability (RRI; referring to HRV). Using a coherency analysis approach the authors
aimed to determine whether specific EEG frequency bands varied greatly in
association with HRV. It was found that all EEG bands showed high levels of
coherence with high frequency (HF) fluctuations and shifts and changes in cardiac
autonomic control showed dynamic relations to all EEG power bands. By determining
the gain between changes the authors were able to extrapolate that the delta
frequencies of the EEG showed the greatest gain, and hence forth the greatest
associated changes with regard to the autonomic regulation of the heart during sleep.
Put differently, the ‘modifications in cardiac autonomic regulation are mostly
associated with changes in the delta EEG band’ (Figure 12).
© University of Pretoria
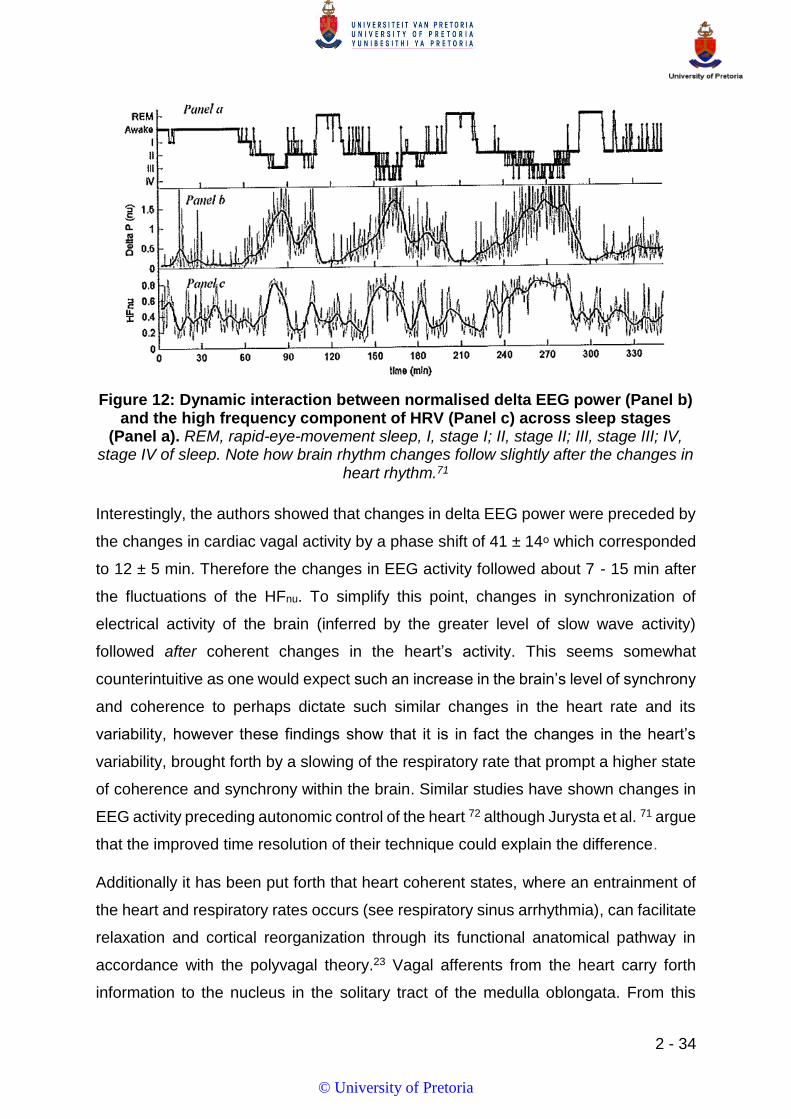
2 - 34
Interestingly, the authors showed that changes in delta EEG power were preceded by
the changes in cardiac vagal activity by a phase shift of 41 ± 14ᵒ which corresponded
to 12 ± 5 min. Therefore the changes in EEG activity followed about 7 - 15 min after
the fluctuations of the HFnu. To simplify this point, changes in synchronization of
electrical activity of the brain (inferred by the greater level of slow wave activity)
followed after coherent changes in the heart’s activity. This seems somewhat
counterintuitive as one would expect such an increase in the brain’s level of synchrony
and coherence to perhaps dictate such similar changes in the heart rate and its
variability, however these findings show that it is in fact the changes in the heart’s
variability, brought forth by a slowing of the respiratory rate that prompt a higher state
of coherence and synchrony within the brain. Similar studies have shown changes in
EEG activity preceding autonomic control of the heart 72 although Jurysta et al. 71 argue
that the improved time resolution of their technique could explain the difference.
Additionally it has been put forth that heart coherent states, where an entrainment of
the heart and respiratory rates occurs (see respiratory sinus arrhythmia), can facilitate
relaxation and cortical reorganization through its functional anatomical pathway in
accordance with the polyvagal theory.23 Vagal afferents from the heart carry forth
information to the nucleus in the solitary tract of the medulla oblongata. From this
Figure 12: Dynamic interaction between normalised delta EEG power (Panel b) and the high frequency component of HRV (Panel c) across sleep stages
(Panel a). REM, rapid-eye-movement sleep, I, stage I; II, stage II; III, stage III; IV, stage IV of sleep. Note how brain rhythm changes follow slightly after the changes in
heart rhythm.71
© University of Pretoria
2 - 35
region it projects onto the parabranchial nucleus and the locus coeruleus before
branching out to the forebrain, linking with the hypothalamus and amygdala. Thalamic
connections to the insula, prefrontal and orbitofrontal areas are also involved, which
in turn gives feedback to the anterior cingulate.73 Although some of these areas lie
very deep in the brain and are therefore difficult to probe and quantify, the facilitation
of attentional control, meditative states, cortical reorganization through heart
coherence and the involvement of the pre/frontal region in the brain are important
themes for the current research initiative. An additional dimension to this focus area
can be sculpted when looking at more conscious, cognitive functioning such as that of
attentional control as opposed to unconscious, sleeping behaviours.
2.3.2 Attentional control
Attentional control (AC) refers to the cognitive ability to regulate attentional distribution
and allocation to task-related stimuli or demands.1 Balle et al. 1 argue that given the
evidence that AC could be a trait-like disposition that can not only influence emotional
regulatory processes but also influence performance of non-emotional attentional
tasks, it would make reasonable sense that self-reported attentional control between
individuals could be reflected in specific patterns of cardiac and EEG patterns. As
example, an inadequate orienting response and reduced ability to endear attention to
task-related stimuli has been reflected in reduced HRV.1 Therefore, high resting HRV
facilitates and maintains sustained attention to discrete impetuses and reduced
attentional control has also been positively associated with low resting HRV.74
The neurovisceral integration model (alongside other related models) consider
vagally-mediated HRV as informative on how the heart-brain bidirectional system
works.
‘In brief, these models consider that a poor tonic inhibition of the amygdala
mainly by the medial pre-frontal cortex, and in conjunction with other cortical
regions, is associated with… …a disinhibition of sympathoexcitatory
circuits… This dysregulated central–peripheral integration results in
reduced levels of complex neurogenic rhythms and lower HRV.’ 1
A meta-analytical review done by Thayer et al. 75 shows that the above statement is
supported by neuroimaging studies and a growing body of research according to Balle
et al. 1 has identified the amygdala-prefrontal circuit to underlie attentional biases.
© University of Pretoria

2 - 36
Furthermore, poor prefrontal functioning has been associated with worsening
attentional control when faced with non-emotionally-laden tasks.76 The involvement of
the frontal regions of the brain during attention related functioning alongside its
standing relationship with HRV is relevant to the conduct of this investigation,
especially within the context of flow (as discussed later).
From the perspective of an integrative physiological and interdisciplinary approach we
can recognise that, in order to understand the workings of the brain we need to also
acknowledge the impact of factors outside the central system and their influence on
the CNS. Studying the deeper lying regions of the brain is extremely difficult, but by
combining central and peripheral operatives (brain and body) we can look at brain
functioning holistically as there are continuous communication happening between the
brain and the peripheries. Such dialogues interaction can lend valuable insights into
the control mechanisms, impact stimuli and affective relationships underlying complex
behaviours such as creativity, insight, musicality or attentional control.
To serve as an example relevant to this study, meditation studies 22 have yielded
valuable insights into the self-regulation of attention and emotional systems by
combining the brain and body, showing how e.g. slowing ones breathing can induce
cardiovascular changes and subsequently offer insights into the functioning of the
brain stem and ANS.
2.4 CREATIVITY, FLOW AND IMPROVISATION
2.4.1 Context and overview
To serve as a contextual overview, creativity research is discussed in the sections
following with specific regard to the expression of creative thought, research pertaining
to real-time music performance, improvisation and the concept of flow, as well as the
intrinsic and implicit nature of musical practise and creative expression. The present
research undertaking lies rooted in the musical performance of experienced
individuals with the aim of extrapolating EEG and HRV information related to their
performance and the implicit and intuitive nature of such conduct. Studying the
underlining neurocognitive mechanisms and substantiating physiological processes of
creativity, innovative thinking and improvisation would bring us ever closer to
understanding the elementary nature of our higher cognition and the elusive manner
in which our brains are able to give birth to novel ideas and conceptions. The societal
© University of Pretoria

2 - 37
benefits that would arise in the wake of understanding such basic underpinnings of
innovation and ingenuity would be irrefutable. Alas, to study creative expression,
where and how it arises in the brain and the neural basis for such phenomena is a feat
almost more abstract and capricious in nature than creativity itself.
Considerable progress has been made in certain areas of creativity research through
exploratory investigations and techniques such as surveys, personality inventories
and case studies (e.g. Simonton77), but laboratory-based research focussed on
creativity have been extremely limited up to this point. Up until recent times the
greatest research contributions towards the study of creativity have come from
psychology-based disciplines and it is only up until very contemporary times that the
cognitive sciences (e.g. Ward78), neuro- and social psychology (e.g. Hennessey et
al.79), pedagogy related domains (e.g. Sawyer80) and the neurosciences 43, 81, 82, 83
have been able to employ sophisticated neuroimaging techniques for creativity
research. Indeed, it is worth noting that the growing interest and attractiveness of
creativity across a broad range of scientific disciplines is a field of research still very
young in its pursuit of finding underlying cognitive, physiological and neural substrates
compared to other mental ability constructs such as intelligence. In 2014, Fink and
Benedek 84 found a mere 550 scientific publications relating to creativity and its brain
inferences compared to the 19000+ publications on the brain and intelligence.
Perhaps more optimistically, although creativity-focussed experimental research have
lacked testability and accession in past, the growing presence of creativity-related
research in the neurosciences have yielded a considerable diversity of methodologies,
findings and approaches which might serve as a quantifiable consolation.
Dissappointingly however, reviews of a large number of these studies have yielded
very little clear evidence with Dietrich and Kanso 82 concluding that “…creative thinking
does not appear to critically depend on any single mental process or brain region, and
it is not especially associated with the right brains, defocused attention, low arousal,
or alpha synchronization, as sometimes hypothesized…”.
In addition, real-time testing of art or music creation alongside findings grounded in
and during the actual performance of music or creative expression seems critically
assumptive at best when exploring the literature. The more sophisticated technological
involvement in modern times have been ground-breaking but have failed to free
© University of Pretoria

2 - 38
creativity research from this bondage. Movement of participants need to be kept to an
absolute minimum in order to get good resolution on imaging. Together with the low
temporal resolution that such imaging technologies such as fMRI harbour, related
methodologies become uncompromisable and equally inadequate to capture the true
nature of creative conduct. Thus, there is a very clear gap, but also a strong need for
research to move beyond the confines of the laboratory, yet reach still deeper into the
mind of the artist, but in an environment and context where creativity can be observed
not through visualization or imagination, but through the actual making and
performance of art and, in context of this study, music.
It should be noted that creativity is rarely considered as a homogeneous constructs,
often being defined in very different paradigms as being a cognitive event or state, as
personality disposition, by expertise or achievement, or as cognitive potential. The
broad diversity of parameters and neurophysiological measures that have been
employed in creativity research may also be partly responsible for no conclusive
agreement on potential neural mechanisms underpinning the phenomenon of
creativity as of yet.84 Moreover, considering the multi-facetted nature of creativity and
the overlapping findings and interpretations of its inquiry, it becomes pivitol to delineate
a clear conceptual definition of which aspects and domains are focussed on when
searching for consistent brain mechanisms involved in creativity.82
2.4.1.1 Defining creativity in performance
“The term creativity, however, seems in constant danger of collapsing under
the weight of its own plurality. It is common in everyday parlance, of course,
and arts discourse in particular is filled with talk about its importance. To be
a great artist, it is said, one must have unusual capacity for creativity, and
so create products (in the broadest sense; e.g., compositions,
performances, paintings, poems) of the highest quality and utmost
originality. The same features of this anecdote that make it so widely
appealing – its apparent generality and fervent idealism towards identifying
excellence – also suggest why research into creativity is so complex” 85
When attempting to define creativity scholars have had great difficulty with almost no
success in offering a broadly-agreed upon and unambiguous definition for creativity,
partly due to the extreme difficulty of isolating creativity empirically, and partly due to
© University of Pretoria

2 - 39
the “deeply entrenched mythology” surrounding creativity within the arts as some
mysterious and unknown process.85 Williamon et al. 85 argue that such perspectives
inhibit the progress of creativity research as often researchers might opt to rather focus
on more directly traceable issues; a “disappointing state of affairs” given the central
importance of creativity in everyday human life. They argue further that it would be a
mistake to view creativity in such a light as even the most mundane everyday tasks
often require some degree of creativity, alluding to an example of “needing to find the
most efficient arrangement for packing shopping bags into the boot of a car”. They
explain that there are also different degrees of creativity or creative processing
requirements and that when we describe a person’s idea or action as being ‘creative’
it might not automatically imply originality or value but rather that is might have been
“sufficiently creative as to be relatively unlikely given the experience and knowledge
of the person”.
Gardner 86 describes a similar distinction between “big C” creativity (e.g. some kind of
breakthrough which is rare or only occasionally occurring) and “little c” creativity (e.g.
the type of creativity we all demonstrate in our every-day lives). In addition, Gardner’s
point of view does not only describe the degree of creativity but also the frequency of
its occurrence, implying a correlation between the extent of a person’s creative ability
and the frequency with which they express such creative levels. However, Williamon
et al. 85 argue that there might very well be no correlation at all on this front and that
the components of ‘originality’ and ‘value’ form additional dimensions to creativity that
need to be taken into consideration. They go on to explain that the uniqueness of
creativity lies not just in a person’s ability to think outside the population’s norms, but
that it is an amalgamation of the manner in which they bring their novel ideas into
‘fruition’, together with how those ideas and products are appreciated and valued
within their society, at the time of production and against the scrutiny of time that
follows. This brings together the cultural and societal facet to any creative conduct,
with perhaps greater regard to the arts than every day behaviour, and also the
ingenuity or creative ideation and, more centrally, the actualisation of those ideas.
From the earlier aesthetics literatures, Götz 87 proposed that creativity shares a direct
link with making, explicating that “creativity is the process or activity of deliberately
concretising insight”. He hereby stresses that although the creative process consists
of several steps, it is only the one stage – that which occurs between the idea genesis
© University of Pretoria

2 - 40
and its actualisation or realisation into a final product or action – that can be regarded
as “creative”. Most psychological research of creativity, when viewed in light of this
perspective are therefore actually the study of the antecedent stages of creativity and
not its central phenomenon.85 However it is important that such an outlook does not
define away the need to disentangle the relationship between originality, value and
creativity.85 Drawn from this point of view, the current research undertaking lies seeded
within the promise of gaining much needed insights into authentic experience of
creative conduct given the scarcity of literature and research grounded in the
actualisation of creative behaviours.
2.4.2 The creative brain
In 2010 an extensive review of neuroelectrical and neuroimaging studies aimed at
testing creativity and insight was conducted by Dietrich and Kanso.82 The authors
reviewed 63 articles and 72 experiments published up until Febuary 2010. Seven of
these articles were reports on experimental procedures pertaining to visualization or
imagination but none were constructed for the testing of creative expression in real-
time such as painting or musical improvisation. Seven studies revolved around art of
which five involved art making but, once more, none involved the real-time testing of
art making. Seven of the studies reviewed involved EEG measurements.
In summary, the findings of this review revealed the following (points have been
supplemented):
1) Creativity is not an exclusive function of the right hemisphere, but instead
involves interhemispheric communication and interactions between multiple
regions from both hemispheres.
Hemispheric specialization has been described as early as the 1940’s by authors
such as Alajouanine who recognized the hemispheric specialization for music, art
and linguistics.88 Neither hemisphere is ‘dominant’ or ‘recessive’ over the other per
se, but the different hemispheres are functionally specialized to handle different
tasks or information. Therefore, the workload is subdivided between the
hemispheres and each hemisphere is functionally dedicated to certain processes.
This distribution of functions between hemispheres in the brain is refered to as
cerebral lateralization. It is often falsely assumed that creativity and musical ability
stem from the right hemisphere (functions related to artistic or musical ability are
© University of Pretoria

2 - 41
most often associated with the right hemisphere). It is of general consensus
amongst researchers that creativity is a global process, resulting from an
intergration between hemispheres 81 and is not limited to a specific hemisphere.
Such rigid allocation of functions to one hemisphere or the other is an unfounded
and grossly exaggerated misperception.81
A multimodal rCBF (regional cerebral blood flow) investigation into the relationship
between creativity and hemispheric assymetry conducted by Carlsson et al. 89
revealed that hemispheric differences were very prominent in ‘low’ creative
participantsf. Higher creative individuals showed a greater bi-lateral response
leading the authors to conclude that creativity is a functional system consisting of
the cognitive interaction of hemispheres, as well as the interactions of instructional
and executive functioning of the frontal lobes. It has further been supported by
other studies 90 that creative individuals are inclined to have abler access to bi-
lateral involvement and interaction between hemispheres and have therefore a
greater degree of inter-hemispheric communication. Thus, with respect to creativity
and music, such activities are of a global nature in the brain, with the cerebral
hemispheres complimenting one another to accommodate for such elaborate
processing.91
2) Activation of multiple areas of the prefrontal cortex was reported in several
studies. This included the dorsolateral prefrontal cortex [DLPFC (BA 46)];
frontal gyrus (BA 8 & 9); frontal operculum (BA 44 & 45); and premotor and
supplemenatry motor regions (BA 6).
Damasio 92 provides a definition of consciousness as a state of “awareness of self
and surroundings” where awareness is designated to ‘core consciousness’ and
thereby words such as ‘alert’, ‘awake’, ‘attentive’ and ‘responsive’ are often
associated with consciousness. In a later paper by the same author, 93
consciousness is described as being hierarchally ordered where higher cognitive
and executive functions such as perception, reasoning, (working) memory and
language are fundamental instruments of cognition and consciousness. It has been
put forth hereafter that the cerberal cortex, and more specifically the prefrontal
f Rated on the Smith and Carlsson’s Creative Function Test (CFT), designed to measure visual perception.
© University of Pretoria

2 - 42
cortex form the pinnacle of this hierarchy and therefore forms the underlying neural
basis for higher cognitive functioning.94 This is not to say that the cerebral cortex
forms the root or foundation of consciousness but instead that the prefrontal cortex
contributes the higher-order functions of cognition to the conscious experience,
thereby enabling the top-layers of consciousness.94
Dietrich explains the development of two neural systems that are anatomically
distinct, process information differently and extract different types of information
from the environment.95 One of these systems constructs representations
necessary for cognitive processing, whereas the other lies rooted in emotional
information extractions (involvement of the limbic system, amygdala and
ventromedial prefrontal cortex) and evaluates the ‘biological significance’ of an
event. Cognitive processing of such emotional information require additional input
from the hippocampus and temporal cortex. In addition, both systems keep record
of their activity: for the emotional system, emotional memory, and for the more
cognitive system, conceptual memory, are stored in their respective circuitries.95
To bring the above mentioned information into context, both information-
processing systems (emotional and cognitive) have overlapping structural circuitry
but they are only fully integrated once they converge back on the dorsolateral
prefrontal cortex (DLPFC), resulting only then in their conscious perception.95
Therefore, the prefrontal cortex (PFC) is neither directly involved in emotional
processing nor long-term memory storage, nor does it receive any direct sensory
information but instead it plays a central integrative role and functions as a
facilitator of consciousness.
Given the broader functioning of the frontal areas and the disproportionately
evolved size and complexity of these frontal regions in humans, it has been
suggested that this may explain why humans create art or music, but no other
species do.96 A basic assumption of neuroscience is that the brain is plastic,
henceforth learning a skill (such as playing an instrument) and its subsequent
practice or repitition - leading eventually to proficiency - will cause the brain to
undergo anatomical, physiological and structural changes.88 Given then the more
developed frontal regions in combination with the involvement of these regions with
higher cognitive functioning one might be tempted to conclude that perhaps
© University of Pretoria

2 - 43
creativity or musical ability as such might therefore reside in these frontal regions.
However Dietrich95 cautions that, once more, the prefrontal cortex contributes
higher cognitive integrations to the experience of consciousness. It permits novel
combinations and constructs of information, be it science or music, rather than
being the ‘seat of creativity’.
3) Activation was also shown outside the frontal regions: several areas of the
visual cortex, thalamus, hippocampus, basal ganglia, cerebellum, pons and
temporoparietal regions.
4) Wide-spread deactivation of limbic and paralimbic areas (e.g amygdala,
hippocampus, entorhinal cortex); parietal and occipital lobes were also
observed.
When measuring the manifestation, i.e. creation, and expression of creative
thinking one must also recognise that the domain (e.g fine arts or music) as well
as the subcomponents of those domains (e.g abilities, training) will be deterministic
in what activity occurs in the brain.97 Many different components can play a part
such as the person’s level of education and creative background; the motor areas
and activities involved; as well as the type of task at hand. Ward 78 explains how
the complex and multidimensional nature of creativity requires a diversified
approach of varying metods and perspective to establish its underlying
neurocognitive origin. He further suggests that seeing as creative activities rely
heavily on accessing stored knowledge, certain ways of accessing this knowledge,
when developing original ideas, might be more conducive than others.
Creativity is an integrative process between different locations and functions.98 Its
localisation will never realise, but instead individual results and findings will be
dependent upon the methodologies used; the population that are investigated (e.g
students, proffessionals), as well as the task that is used as “proxy” (e.g convergent
thinking, visualization, piano playing, painting).83
5) Significant evidence indicated a strong linkage between creativity and
deactivation of the frontal areas (hypofrontality) which suggests the
downregulation of supervisory processes and metacognition, leading to more
intuitive, spontaneous and free flowing actions.
© University of Pretoria

2 - 44
Dietrich 95 postulates that creativity is facilitated by the executive functions and
capabilities of the DLPFC which enables still higher cognitive functions such as
abstract thinking, planning and self-reflection by integrating information that is
already highly processed. An EEG study conducted by Bekhtereva et al. 41 showed
both an increase and decrease in frontal cortex activity where this decrease in
frontal lobe activity, or hypofrontality, during creative exercise is characteristic of
flow. Therefore, with regards to creative performance such as music creation or
improvisation we see a central integrative contribution from the pre-frontal regions,
allowing the generation of new ideas and novel association; while simultaneous
down-regulation of the cognitive control also vested in the frontal regions allows
more spontaneous and intuitive creative expression. This decrease in cognitive
control links flow to a form of spontaneous or creative thought as described by
Christoff et al. 99
2.4.2.1 Creative versus goal-directed thought
Christoff et al. 99 postulate three types of thought namely ‘goal-directed’, ‘spontaneous’
and a sort of hybrid, ‘creative thought’. Cognitive control is chiefly associated with goal-
directed thought which can be described as “…representing current and desired
states, and linking these representations through a series of actions that attempt to
transform the current to the desired state.” 99 This cognitive control is typically localised
to the prefrontal cortex, involving the dorso- as well as the rostolateral PFC – which is
loosely defined as the lateral portion of that Brodman’s area.100 Christoff et al. 99
explain that cognitive control refers to the ability of the PFC to override and influence
other cortical regions. Research done on creativity and open-ended problem solving
have also shown the involvement and activation of the prefrontal cortex during effortful
problem-solving tasks.101
Spontaneous thought increases when cognitive demands are reduced and is often
refered to as ‘mind wandering.’99 This implies lesser recruitment of prefrontal
involvement, i.e hypofrontality (typical of flow) and is explained to transpire along the
midline of the brain in areas such as the medial PFC, cingulate cortex (anterior and
posterior), posterior parietal lobe and precuneus.99 Mind wandering have been linked
with regions in the temporal lobes (memory processing) as well as a set of areas
known as the ‘default network’. The default network is inactive during attention-
© University of Pretoria

2 - 45
demanding or novel tasks but becomes active when attention levels are low, in the
absence of a task, or during one of high familiarity.99 It could therefore be said that the
capacity for spontaneous thought increases during tasks that have been practised, are
familiar to an individual or are done utilising a highly developed skill. Once more a
characteristic of flow. Reference is made in the above cited article to neuroimaging
studies that have found spontaneous thoughts to carry the same advantages as rest
with regard to the consolidation of memories that normally occur while sleeping. Thus,
spontaneous thought play an active and important role in human cognition.
Christoff et al. 99 explain that creative thought lies somewhere between the two types
of thought mentioned above. They explain that the processes of creative thought are
similar to spontaneous thought in that it also involves lower cognitive control but during
a state of broader attention distribution.
“Thus, lowering cognitive control and arousal, as well as shifting attention
from a focused state to a wider, defocused attentional state, enables a
transition from a relatively goal-directed thinking mode to a more
associative, creative mode. This state of defocused attention may be one
of the key factors facilitating creative thought…” 99
The authors explain how creative thought requires an initial ‘generative’ phase where
novel ideas or concepts are engendered, requiring access to ‘remote semantic
associations’ which seems to share connections with the ‘default’ and memory
networks. In addition, a second phase or aspect to creative thought is one of evaluation
strongly associated with lateral prefrontal involvement. The experience of flow is here
within described to be a form of creative thought, demanding lesser cognitive control
and once more, resulting in hypofrontality.99
This state of transitory hypofrontality is a prerequisite to the experience of flow
according to Dietrich’s primary hypothesis.95 This allows for temporary suppression of
the cognitive control exerted by the prefrontal areas and therefore describes a state of
lesser analytic or meta-cognition. In the 1970’s Martindale121 conducted EEG studies
on the neurophysiology of creativity, indicating that a reduction in activity of the frontal
lobes was associated with creative processes. At the time the concept of flow had not
yet been described or identified and this finding might have pointed more towards flow
than to creativity per se.41
© University of Pretoria

2 - 46
Taken together thus far it seems that creativity and improvisation revolve around a
rudimentary integrative process involving the frontal, temporal and parietal lobes
(creative axis), the interactive communication between both hemispheres and regional
activity is dependant on the task at hand. It seems most likely that the integrations of
these creative processes occur in the frontal areas of the brain where sometime a
down-regulation in this area occurs which seems to suggest more intuitive
performance. A phenomenon related to the concept of ‘flow’. This hypofrontality
suggests lesser cognitive control and micromanagement of the actions being
perfomed so that it becomes more implicitly driven and intuitive such as occuring
during musical improvisation.
Dietrich 95 explains that, as expected, complex behaviours such as art making or
musical improvisation involve the prefrontal cortex which is considered the epitomic
structure of higher-functioning in the brain. However the involvement of these
structures are context-dependant and the manner in which information is being
processed in the brain; its acquisition, memorization and representation are attributed
to two divergent information-processing systems. These two classifications can be
distinguised from one another based on function and anatomy and are refered to as
the explicit and implicit systems.102
2.4.2.2 Implicit versus explicit information processing
The explicit system requires conscious awareness and handles information that is
transmitted and processed globally in the brain. This explicit information can be
verbalized, and the recollection of explicit memory is a reconstructive process,
consequently being suseptable to misrepresentation.102 It is also available to other
more specialized structures of the brain to utilize accordingly. With regards to the
structures and regions involved in the brain, the explicit system is mostly dependant
on the prefrontal regions, in particular the PFC. Dietrich 95 hypothesizes that the
explicit system can be considered a more recent evolutionary development and better
established in animals with higher developed prefrontal cortices; a viewpoint that is
consistent with the hierarchical view of higher-cognition and consciousness discussed
earlier. This would subsequently localise higher mental actions such as explicit
knowledge representation to the the prefrontal cortex.95
© University of Pretoria
2 - 47
The implicit system, by contrast, is based on skill and experience and is isolated from
conscious intervention. Implicit information cannot be verbalized, but is instead
communicated through actions, behaviour and/or task performance. It is more
primitive in nature and cannot be made available for exemplification in working
memory, consciousness or through the explicit system, i.e the explicit system has no
understanding of the implicit knowledge base.102 The specifics of the neural
underpinning of the implicit system still remains unclear.95
“For implicit knowledge to reach consciousness it must first be explicated,
which cannot proceed, due to its concrete-operational organization, through
a bottom-up process. We must perform or execute implicit knowledge,
which allows the explicit system to observe it and extract its essential
components. Because the implicit system refrains from abstractions, it is
not burdened by the computational complexity that comes with higher-order
thought, and a single brain structure, such as the basal ganglia or
cerebellum, can handle all information processing steps. This makes
knowledge in the system highly efficient, albeit only to its specific
application. Smooth sensory-motor integration leading to purposeful motion
must occur in real time and this is the domain of the implicit system,
responding to environmental stimuli in a fast and accurate manner.” 102
Therefore, the main differences lie in that implicit knowledge needs to be performed
or expressed through behaviour and cannot be verbalised, where as explicit
knowledge requires conscious awareness and can be expressed intellectually and
cognitively. Implicit knowledge would represent e.g. practised skillsets or embedded
behaviours that can only be expressed through its enactment or actualisation. Tasks
typically based in movement such as playing a musical instrument or art making such
as drawing, painting or sculpting are taken up much easier by the implicit system.103
To draw relations between these two systems of information-processing and the flow
experience, Van Heerden103 explains a kind of trade-off relationship between the
explicit and implicit systems during flow. Phenomena such as flow have been
described many decades ago and occurs where e.g. artists or musicians become so
engrossed in their conduct that creative expression such as improvisation or freestyle
painting or drawing becomes effortless, spontaneous and almost completely intuitive,
© University of Pretoria

2 - 48
often resulting in peak performance. The intuitive and spontaneous actions associated
with flow are therefore the result of implicit representations that are retrieved and
translated through actual behaviour such as motor skills and actions. Through the
application of such behaviour the explicit system is circumvented to prevent it from
micromanaging the skill, which would affect the quality of its execution. This is the
hyporfrontality we see during the flow experience.
Dietrich and Audiffren 104 therefore disagree with conceptions that high performance
requires equally high concentration or conscious effort directed at that task. In
accordance, neural signalling is metabolically very demanding and due to its high
energy requirements the cortex employs energy-efficient routes and circuits to
compensate for such exhausting metabolic processes.105 Therefore, it would make
sense from an objective point of view, that during enactment of a sufficiently developed
skill or highly proficient behaviour the brain would not unneccassarily allocate
conscious effort or attention to an already fluent practise. Subjectively, the experience
of the individual during the state of flow is exactly that: mental exertion is perceived as
almost effortless while performance improves and might even peak.
2.4.3 Flow
The construct of flow is one born from the field of positive psychology during the 1980s.
First proposed by Mihaly Csikszentmihalyi 106 as “an almost automatic, effortless, yet
highly focused state of consciousness” 107 which often ensues when one becomes so
deeply engrossed in a task that it not only feels effortless but is often associated with
peak performance. In more colloquial terms flow can be described as a feeling of being
‘in the zone’ or ‘in the moment’. Csikszentmihalyi noticed in painters that, when the
painting was going well, the artist tended to persist ‘single-mindedly’ with the task at
hand regardless of fatigue, hunger or discomfort, and it was in an attempt to
understand such intrinsically motivated states that flow research began.
Understanding such autotelic behaviour which is satisfactorily rewarding in itself apart
from any extrinsic rewards or the end-product revealed a picture of flow as an
absorbed state of effortless attention and ‘optimal experience’.
Some conditions to the experience of flow have been put forward and can be
summarised as consisting of:109 (I) a balance of skill vs challenge – too easy or too
difficult could result in feelings of anxiety or boredom; (II) merging of action and
© University of Pretoria

2 - 49
awareness where the action feels automatic, with little or no attentional resources are
demanded; (III) high concentration; (IV) clear goals; (V) sense of control; (VI)
unambiguous feedback; (VII) loss of self-reflective or self-conscious thought such as
fear of social evaluation; (VII) distortion in time as being faster/slower than usual; (IX)
autotelic experience paired with positive emotions. From these conditions, and the
strong correlations found between flow and objective measures of quality of
performance in various different domains, 108 flow is therefore a state of energized
focus where cognition is driven by implicit processes and free-association rather than
self-referential thoughts or explicit rational reasoning.109
Flow as a construct often runs parallel with creativity, yet defining creative brain
function such as flow remains largely contextual. Despite the rich psychological
background to flow research, physiological research on the underlying brain
mechanisms involved during flow has only been put forth in recent years. 110, 111, 112
Neurophysiological research on flow is still only in its first decade of testing and have
been rather confined to laboratory protocols; however seminal works investigating the
neurocognitive processes underlying flow 81, 82, 94, 95 have established strong
associations with improvisation, peak performance, creative intuition, spontaneous
thought and altered states of consciousness. Dietrich 95 suggests that through the
possible identification of the neurocognitive underpinnings of flow “…it becomes
feasible to delineate it from other manifestations of exceptional human experience, for
instance, creativity.”
It is important to clarify at this point that the central focus of this study does not revolve
around flow specifically, but that the mental states, attentional distribution and
neurophysiological processes associated with its experience shapes a contextual
platform to investigate the associated heart and brain functioning of musical
performance. As such the current research undertaking does not aim to exemplify flow
or its conceptual understanding, but instead ‘borrows’ from its associated topographies
and features to create a focal point for investigation.
2.4.4 Improvisation
De Manzano 109 explains that all creative behaviours have two common features in
that they involve the generation of novel ideas that are at the same time both original
and meaningful. In this regard, musical improvisation can be seen to involve the
© University of Pretoria

2 - 50
continuous and spontanteous extemporization of new and contextually appropriate
musical content, while De Manzano 109 also remarks that at the time (2010) only four
studies on the musical improvisation and in the neuroscience literature could be found.
He does stress however the importance of the DLPFC in three of the four studies.
One of these studies, an fMRI study conducted by Limb and Braun, 113 identified a
unique pattern of changes inside the prefrontal cortex that were paired with music
improvisation or spontaneous composition. The pattern reflected a wide-spread
deactivation of the lateral flanks of the PFC and the convergent activation of the medial
PFC.
“This unique pattern may offer insights into cognitive dissociations that may
be intrinsic to the creative process: the innovative, internally motivated
production of novel material (at once rule based and highly structured) that
can apparently occur outside of conscious awareness and beyond volitional
control.” 113
By implication this tells us that improvisation, be it through art or music, can only occur
when the fundamental rules for that discipline have been embedded. The process of
art making involves continuous improvisation and can be compared to some extent
with the improvisation required to play jazz music for example, which lies central to the
performance of this art form. This improvisation can truly be considered to be a very
subjective interpretation by the artist and is a uniquely individualistic expression. Limb
and Braun 113 explain how the construction of ‘autobiographical narrative’ and its
association with the medial PFC is apropos to the concept of improvisation. Therefore
improvisation is a deeply idiosyncratic expression which, together with its associated
activity in the medial PFC, concurs with “…an emerging view that the region plays a
role in the neural instantiation of self, organizing internally motivated, self-generated,
and stimulus-independent behaviors…” 113 The same authors further explain that the
frontal polar cortex (BA 10), which are the regions of the MPFC that are activated
during improvisation, are still poorly understood but that it seems to play an integrative
role in coalescing cognitive modules aimed at higher behavioural objectives. In
particular, utilising sets of rules that chaperon ongoing behaviour, executing
behavioural subroutines while still maintaining the governing intentions.
© University of Pretoria

2 - 51
Improvisation (which can also be likened to the spontanteous art making process) is
described as involving the deactivation of the DLPFC and lateral orbitofrontal cortex
(LOFC) 113 which is consistent with other suppositions on flow discussed thus far. The
DLPFC is believed to be accountable for the planning, implimentation and real-time
adjustment to behaviour related to problem-solving or goal-directed, self-monitoring,
focussed and conscious attention. Subfunctions of the DLPFC include attention (to
current engagements) and response selection; judgement of allowing or suppressing
stereotypical responses and the tracking of preceding actions or steps in working
memory.113
In a study requiring musicians to improvise and subsequently reproduced that
improvised piece from short-term memory, Bengtsson et al. 114 utilised fMRI to identify
regions in the brain involved in music creation. What the authors discovered was the
involvement of the DLPFC in the creative facet of improvisation and as such, in
complex behaviour through its ability to select appropriate responses in tandem with
a global objective. Phrased differently, the DLPFC is able to freely select behavioural
responses based on a overall goal, which in this case would be the generation of
musical constructs or ideas with the aim of producing a musical piece that is
aesthetically pleasing or satisfactory.
Limb and Braun 113 postulate that, by implication, if this activity in the MPFC along with
the co-occuring decrease of activity in the DLPFC and LOFC is indicative of internally
driven behaviour, than such self-engendered behaviour are occuring void of context
which is typically provided by the lateral prefrontal capacities. Where activation of the
lateral prefrontal regions usually supports focused or self-monitoring attention,
herewithin we see that its deactivation, which usually results in de-focussed, non-
specific awareness allows for spontaneous and unintentional free association, insight
and realizations.
© University of Pretoria

2 - 52
“…[C]reative intuition may operate when an attenuated DLPFC no longer
regulates the contents of consciousness, allowing unfiltered, unconscious,
or random thoughts and sensations to emerge. …[R]ather than operating
in accordance with conscious strategies and expectations, musical [or
artistic] improvisation may be associated with behaviors that conform to
rules implemented by the MPFC outside of conscious awareness...” 113
Based on this discussion we can therefore say musical improvisation or other forms
of artistic composition or creation is implicitly driven and involves a certain measure of
intuition. The above mentioned authors refer to studies in other disciplines that have
also shown conscious self-monitoring and dedicated attention to be counterproductive
with regards to spontaneity and performance.
With more specific regards to flow and improvisation, Sinnamon et al. 115 report only
finding one peer-reviewed article on flow states in adult musicians, while only five
article were found pertaining to self-reported flow in any musical domain. Therefore,
as stressed before, there is a severe scarcity of research on flow within the context of
musical improvisation, which is quite surprising given that music and improvisation are
activties that frequently elicit peak performance.116
2.5 SUMMARY
In summary therefore, “…musical creativity vis-à-vis improvisation may be a result of
the combination of intentional, internally generated self expression (MPFC-mediated)
with the suspension of self-monitoring and related processes (LOFC and DLPFC-
mediated) that typically regulate conscious control of goal-directed, predictable, or
planned actions.” 113 The intuitive and spontaneous side to such creative expression
is an implicitly driven experience grounded in behaviours and skill sets that have been
practised and embedded, thereby circumventing the need for intently focussed
attention or micromanagement. Instead such actions can occur ‘naturally’ and
spontaneously, as a result of a decrease in cognitive control and frontal activity
associated with flow-like states where performance feels effortless and might even
peak. During such a flow state, attention allocation becomes broadly distributed.
Subsequently performers can become so engrossed in their actions that they become
unaware of things happening around them or might lose track of time. These states
could be likened to altered states of consciousness or trance-like states and it was
© University of Pretoria

2 - 53
expected that electrophysiological activity in the brain would reflect this. Increased
lower band activity has been associated with continuous-attention tasks.117 During
such free flowing performance it is also expected that associated physiological
changes would be noticeable in e.g. heart and breathing rate, as well as heart rate
variability which has been shown to reflect not only the autonomic regulation of the
heart by the brain but a strong association with changes in the brains oscillatory
behaviour.
© University of Pretoria

2 - 54
2.6 REFERENCES
1. Balle M, Bornas X, Tortella-Feliu M, Llabres J, Morillas-Romero A, Aguayo-
Siquier B, Gelabert JM. Resting parietal EEG assymetry and cardiac vagal tone
predict attentional control. Biol Psychol. 2013; 93: p. 257-261.
2. Task Force of the European Society of Cardiology and the North American
Society of Pacing and Electrophysiology. Heart rate variability: standards of
measurement, physiological interpretation and clinical use. Circulation. 1996;
93: p. 1043-1065.
3. Acharya U, Joseph K, Kannathal N, Lim C, Suri JS. Heart rate variability a
review. Med Bio Eng Comput. 2006; 44: p. 1031-1051.
4. Strauss H. Heart rate variability. American journal of physiology - Regulatory,
integrative and comparative physiology. 2003; 285: p. R927-R931.
5. Winchell R. Analysis of heart-rate variability: a noninvasive predictor of death
and poor outcome in patients with severe head injury. J Trauma. 1997; 43: p.
927-933.
6. Ganong F. Review of medical physiology. 20th ed. New York: McGraw-Hill
Companies; 2001.
7. Sherwood L. Human physiology - from cells to systems. 5th ed. USA: Thomson
Brooks/Cole; 2004.
8. Berger R, Saul J, Cohen R. Transfer function analysis of autonomic regulation:
I. The canine atrial rate response. Am J Physiol. 1989; 256: p. H142-H152.
9. Berntson G, Bigger J, Eckberg D, Grossman P, Kaufmann P, Malik M, Nagaraja
HN, Porges SW, Sauk JP, Stone PH, Van der Molen MW. Heart rate variability:
origins, methods, and interpretive caveats. Psychophysiol. 1997; 34: p. 623-
648.
10. Thayer J, Lane R. A model of neurovisceral integration in emotional regulation
and dysregulation. J Affect Disorders. 2000; 61: p. 201-216.
11. Graig J. The psychoneurological profile of Fibromyalgia Pretoria: University of
Pretoria; 2005.
© University of Pretoria
2 - 55
12. Akselrod S, Gordon D, Madwed J, Snidman N, Shannen D, Cohen R.
Hemodynamic regulation: investigation by spectral analysis. Am J Physiol.
1985; 249: p. H867-H875.
13. Valkonen-Korhonen M, Tarvainen M, Ranta-aho P, Karjalainen P, Partanen JJ,
Lehtonen J. Heart rate variability in acute psychosis. Psychophysiol. 2003; 40:
p. 716-726.
14. Anderson M, Keith J, Novak P. Dorland's illustrated medical dictionary. 29th ed.
Philadelphia: W.B. Saunders Company; 2000.
15. Ori Z, Monir G, Weiss J, Sayhouni X, D S. Heart rate variability frequency
domain analysis. Cardiology Clinics. 1992; 10: p. 499-533.
16. Akselrod S, Gordon D, Ubel F, Shannon D, Barger A, Cohen R. Power spectral
analysis of heart rate fluctuation: a quantative probe of beat-to-beat
cardiovascular control. Science. 1981; 213: p. 220-222.
17. Cohen H, Neumann L, Kotler M, Buskila D. Autonomic nervous system
derangement in fibromyalgia syndrome and related disorders. Israel Med Assoc
J. 2001; 3: p. 755-760.
18. Eckberg D. Human sinus arrhythmia as an index of vagal cardiac outflow. J
Appl Physiol. 1983; 54(4): p. 961-966.
19. Grossman P, Taylor E. Towards understanding respiratory sinus arrhythmia:
Relations to cardiac vagal tone, evolution and biobehavioural functions. Biol
Psychol. 2007; 74: p. 263-285.
20. Malliani A, Pagani M, Lombardi F, Cerutti S. Cardiovascular neural regulation
explored in the frequency domain. Circulation. 1991; 84: p. 482-492.
21. Libby D, Worhunsky P, Pilver C, Brewer J. Mediatation-induced changes in
high-frequency heart rate variability predict smoking outcomes. Front. Hum.
Neurosci. 2012; 6: p. 54.
22. Kim D, Kang S, Lee K, Kim J, Whang M. Dynamic correlations between heart
and brain rhythm during autogenic meditation. Front. Hum. Neurosci. 2013.
© University of Pretoria
2 - 56
23. Kim D, Rhee J, Kang S. Reorganization of the brain and heart thythm during
autogenic meditation. Front. Integr Neurosci. 2014; 7: p. 1-9.
24. Wu S, Lo P. Cardiorespiratory phase synchronization during normal rest and
inward-attention meditation. Int. J. Cardiolo. 2010; 141: p. 325-328.
25. Cysarz D, Bussing A. Cardiorespiratory synchronization during Zen meditation.
Eur. J. Appl. Physiol. 2005; 95: p. 88-95.
26. Niskanen J, Tarvainen M, Ranta-aho P, Karjalainen PA. Software for advance
HRV analysis. Kuopio:; 2002.
27. Petzke F, Clauw D. Sympathetic nervous system function in fibromyalgia.
Current Rheumatology Reports. 2000; 2: p. 116-123.
28. Mulder L. Measurement and analysis methods of heart rate and respiration for
use in applied environments. Biol Psychol. 1992; 34: p. 205-236.
29. Sayers. Analysis of heart rate variability. Ergonomics. 1973; 16(1): p. 17-32.
30. Cohen H. Association of autonomic dysfunction and clozapine: heart rate
variability and risk for sudden death in patients with schizophrenia on long-term
psychotropic medication. Brit J Psychiat. 2001; 179: p. 167-171.
31. McCraty R, Atkinson M, Tiller W, Rein G, Watkins A. The effects of emotions
on short-term power spectrum analysis of heart rate variability. Am. J. Cardiol.
1995; 76: p. 1089-1093.
32. Parker P, Cellar B, Potter E, McCloskey D. Vagal stimulation and cardiac
slowing. Journal of Autonomic Nervous System. 1984; 11: p. 226-231.
33. Niskanen J, Tarvainen M, Ranta-aho P, Karjalainen P. Software for advanced
HRV analysis. Comput Methods Programs Biomed. 2004 Oct; 76(1): p. 73-81.
34. Herrmann C, Demiralp T. Human EEG gamma oscillations in neuropsychiatric
disorders. Clin Neurophysiol. 2005; 116(12): p. 2719-2733.
35. Thompson L, Thompson M. Neurofeedback treatment for autistic pectrum
disorders: Review of 60 cases-primciples and outcome. In 34th Annual Meeting
of the Association for Applied Psychophysiology and Biofeedback; 2003;
Jacksonville.
© University of Pretoria

2 - 57
36. Nunez P. Neocortical Dynamics and Human EEG Rhythms New York: Oxford
University Press; 1995.
37. Lopes da Silva F, van Rottendam A. Biophysical aspects of EEG and
magnetoecephalographic generation. In Niedermeyer E, Lopes da Silva F,
editors. Electroencephalography: basic principles, clinical applications and
related fields. 5th ed. New York: Lippincott, Williams & Wilkins; 2005.
38. Charand K. Action Potentials. [Online]. [cited 2015 April 9. Available from:
http://hyperphysics.phy-astr.gsu.edu/hbase/biology/actpot.html.
39. Tatum W, Husain A, Benbadis S, Kaplan P. Handbook of EEG interpretation:
Demos Medical Publishing; 2008.
40. Sanei S, Chambers J. EEG signal processing Chichester, West Sussex,
England: John Wiley & Sons Ltd; 2007.
41. Bekhtereva N, Dan'ko S, Starchenko M, Pakhomov S, Medvedev S. Study of
the brain organization of creativity: III Brain activation assessed by the local
cerebral blood flow and EEG. Human Physiology. 2001; 27(4): p. 390-397.
42. Teixeira J, Vinhas V, Oliveira E, Reis L. A new approach to emotion
assessment based on biometric data. In Proceedings of the 2008
IEEE/WIC/ACM International Conference on Web Intelligence and Intelligent
Agent Technology; 2008: IEEE Computer Society. p. 505-511.
43. Fink A, Benedek M, Grabner R, Staudt B, Neubauer A. Creativity meets
neuroscience: Experimental tasks for the neuroscientific study of creative
thinking. Methods. 2007; 42(1): p. 68-76.
44. Gotman J, Ives J, Gloor R. Autonomic recognition of interictal epiletic activity in
prolonged EEG recordings. Electroencephalogr. Clin. Neurophysiol. 1979; 46:
p. 510-520.
45. Evans J, Abarbanel A. Introduction to quantitative EEG and neurofeedback
California: Academic Press; 1999.
46. Walter W. Specific and non-specific responses and autonomic mechanisms in
human subjects during conditioning. Prog. Brain Res.. 1963; 1: p. 395-401.
© University of Pretoria

2 - 58
47. Maquet P, Degueldre C, Delfiore G, Aerts J, Peters J, Luxen A. Functional
neuroanatomy of human slow wave sleep. J Neurosci. 1997; 17(8): p. 2807-
2812.
48. Mistlberger R, Bergmann B, Rechtshaffen A. Relationships among wake
episode lengths, contiguous sleep episode lenghts and
electroencephalographic delta waves in rats with suprachiasmatic nuclei
lesions. Sleep. 1987; 10(1): p. 12-24.
49. Lee J, Kim D, Shin H. Lack of delta waves and sleep disturbances during non-
rapid eye movement sleep in mice lacking a1g-subunit of T-type calcium
channels. PNAS. ; 10(52): p. 18195-18199.
50. Vanderwolf C. Hippocampal electrical activity and voluntary movement in the
rat. EEG Clin Neurophysiol. 1969; 26(4): p. 407-418.
51. Bland B, Oddie S. Theta band and synchrony in the hippocampal formation and
associated structures: the case for its role in sensorimotor integration. Behav
Brain Res. 2001; 127(1-2): p. 119-136.
52. Vertes P. Hippocampal theta rhythm: a tag for short-term memory. Hippocapus.
2005; 15(7): p. 923-935.
53. Cantero J, Atienza M, Stickgold R, Kahana M, Madsen J, Kocsis B. Sleep-
dependent theta oscillations in the human hippocampus and neocortex. J
Neurosci. 2003; 23(34): p. 10897-10903.
54. Xue S, Tang Y, Tang R, Posner M. Short-term meditation induces changes in
brain resting EEG theta networks. Brain Cognition. 2014; 87: p. 1-6.
55. Gruzelier J, Holmes P, Hirst L, Bulpin K, Rahman S, van Run C, et al.
Replication of elite music performance enhancement following alpha/theta
neurofeedback and application to novice performance and imporivsation with
SMR benefits. Biol Psychol. 2014; 95: p. 96-107.
56. Ashwal S, Rust R. Child neurology in the 20th century. Pedia. Res. 2003; 53:
p. 345-361.
© University of Pretoria

2 - 59
57. Bologna M, Di Biasio F, Conte A, Iezzi E, Modugno N, Berardelli A. Effects of
cerebellar continuous theta burst stimulation on resting tremor in Parkinson's
disease. Parkinsonism & related Disorders. 2015; 21(9): p. 1061-1066.
58. Hasan A, Brinkmann C, Strube W, Palm U, Malchow B, Rothwell JC, Falkai P,
Wobrock T. Investigations of motor-cortex cortical plasticity following facilitatory
and inhibitory transcranial theta-burst stimulation in schizophrenia: A proof-of-
concept study. J Psychiat Res. 2015; 61(February): p. 196-204.
59. Domino E, Ni L, Thompson M, Zhang H, Shikata H, Fukai H, et al. Tabacco
smoking produces widespread dominant brainwave alpha frequency increases.
Int J Psychophysiol. 2009; 74(3): p. 192-198.
60. Sternman M, MacDonald L, Stone R. Biofeedback training of sensorimotor EEG
in man and its effect on epilepsy. Epilepsia. 1974; 15: p. 395-416.
61. Pfurtscheller G, Flotzinger D, Neuper C. Differentiation between finger, toe and
tongue movements in man based on 40 Hz EEG. Electroencephalogr. Clin.
Neurophysiol.. 1994; 90: p. 456-460.
62. Niedermeyer E, da Silva F. Electroencephalograpy. Basic principles, clinical
applications and related fields. 3rd ed. Baltimore: Williams & Wilkins; 1993.
63. Kubler A, Muller K. An introduction to brain computer interfacing. In Dornhege
G, Millan J, Hinterberger T, McFarland D, Muller K. Toward Brain-Computer
Interfacing. Cambridge, MA: MIT Press; 2007. p. 1-25.
64. Pineda J, Brang D, Hecht E, Edwards L, Carey S, Bacon M, Futagaki C, Suk,
D, Tom J, Birnbaum C, Rork A. Positive behavioural and electrophysiological
changes following neurofeedback training in children with autism. Res Autism
Spect Dis. 2008; 2(3): p. 557-581.
65. Tognoli E, Lagarde J, DeGuzman G, Scott Kelso J. The phi cmoplex as a
neuromarker of human social coordination. Proceedings of the National
Academy of Sciences. 2007 May 8; 104(19): p. 8190-8195.
66. Brigo F. Lambda waves. Am J Electroneurodiagnostic Technol. 2011 Jun;
51(2): p. 105-113.
© University of Pretoria

2 - 60
67. Matousek M, Petersen I. Frequency analysis of the EEG in normal children and
adolescents. In Kellaway P, Petersen I, editors. Automation of Clinical
Electroencephalography. New York: Raven Press; 1973. p. 75-102.
68. John E. Functional Neuroscience. In Neurometrics: Clinical Applications of
Quantitative Electrophysiology. New Jersey: Lawrence Erlbaum Associates;
1977.
69. Thatcher R, Krause P, Hrybyk M. Cortico-cortical associations and EEG
coherence: A two-compartmental model. EEG Clin. Neurophysiol. 1986; 64: p.
123-143.
70. Ho M. The rainbow and the worm: The physics of organisms London: World
Scientific Publishing; 1998.
71. Jurysta F, van de Borne P, Migeotte P, M D, Lanquart J, Degaute JP, Linkowski
P. A study of the dynamic interactions between sleep EEG and heart rate
variability in healthy young men. Clin Neurophysiol. 2003; 114: p. 2146-2155.
72. Brandenberger G, Ehrhart J, Piquard F, Simon C. Inverse coupling between
ultradian oscillations in delta wave activity and heart rate variability during
sleep. Clin Neurophysiol. 2001; 112(6): p. 992-996.
73. Porges S. The polyvagal perspective. Biol. Psychol. 2007; 74(28).
74. Appelhans B, Luecken L. Heart rate variability as an index of regulated
emotional responding. Review of general Psychology. 2006; 10(3): p. 229-240.
75. Thayer J, Ahs F, Fredrikson M, Sollers III J, Wager T. A meta-analysis of heart
rate variability and neuroimaging studies: implications for heart rate variability
as a marker of stress and health. Neurosci Behav Rev. 2012; 36(2): p. 747-756.
76. Bishop J. Trait anxiety and impoverished prefrontal control of attention. Nature
Neuroscience. 2009; 12: p. 92-98.
77. Simonton D. Scientific creativity as constrained stochastic behavior: The
integration of process and person perspectives. Psychological Bulletin. 2003;
129: p. 475-494.
© University of Pretoria

2 - 61
78. Ward T. Creative cognition as a window on creativity. Methods. 2007; 42: p. 28-
37.
79. Hennessey B, Amabile T. Creativity. An rev psychol. 2010; 61: p. 569-598.
80. Sawyer R. Educating for innovation. Think Skills Creative. 2006; 1: p. 41-48.
81. Dietrich A. Who's afraid of a cognitive neuroscience of creativity? Methods.
2007; 42: p. 22-27.
82. Dietrich A, Kanso R. A Review of EEG, ERP, and Neuroimaging Studies of
Creativity and Insight. Psychol Bull. 2010; 136(5): p. 822-848.
83. Jung R, Segall J, Bockholt H, Flores R, Smith S, Chavez RS, Haier RJ.
Neuroanatomy of Creativity. Hum Brain Mapp. 2010; 31(3): p. 398-409.
84. Fink A, Benedek M. EEG alpha power and creative ideation. Neuroscience and
biobehavioral reviews. 2014; 44: p. 111-123.
85. Williamon A, Thompson S, Lisboa T, Wiffen C. Creativity, originality, and value
in music performance. In Deliege I, Wiggins G, editors. Musical creativity. Hove:
Psychology Press; 2006. p. 159-219.
86. Gardner H. Seven creators of the modern era. In Brockman J, editor. Creativity.
New York: Simon & Schuster; 1993. p. 28-47.
87. Götz I. On defining creativity. J aesthet art critic. 1981; 39: p. 297-301.
88. Muller-Dahlhaus J, Orekhov Y, Liu Y, Ziemann U. Interindividual variability and
age-dependancy of motor cortical plasticity induced by paired associative
stimulation. Exp Brain Res. 2008; 187(3): p. 467-475.
89. Carlson I, Wendt P, Risberg J. On the neurobiology of creativity. Differences in
frontal activity between highly and low creative subjects. Neuropsychologia.
2000;: p. 1-31.
90. Hoppe K, Neville L. Dual brain, creativity, and health. Creativity Research
Journal. 1990; 3(2): p. 150-157.
91. Doron K, Gazzaniga M. Neuroimaging techniques offer new perspectives on
callosal transfer and interhemispheric communication. Cortex. 2008; 44: p.
1023-1029.
© University of Pretoria
2 - 62
92. Damasio A. Investigating the biology of consciousness. Transactions of the
Royal Society. 1998; 353: p. 1879–1882.
93. Damasio A. The Feeling of What Happens: Body and Emotion in the Making of
Consciousness New York: Harcourt Brace; 1999.
94. Dietrich A. Functional neuroanatomy of altered states of consciousness: The
transient hypofrontality hypothesis. Consciousness and Cognition. 2003; 12: p.
231-256.
95. Dietrich A. Neurocognitive mechanisms underlying the experience of flow.
Consciousness and Cognition. 2004; 13: p. 746-761.
96. Ramachandran V, Hubbard E. The Phenomenology of Synaesthesia. Journal
of Consciousness Studies. 2003; 10(8): p. 49-57.
97. Sawyer R. Group Creativity: musical performance and collaboration.
Psychology of Music. 2006; 34(2): p. 148-165.
98. Ramachandran V, Blakeslee S. Phantoms in the brain New York: William
Morrow; 1998.
99. Christoff K, Gordon A, Smith R. The role of spontaneous thought in human
cognition. In Vartanian O, Mandel D. Neuroscience of Decision Making. New
York: Psychology Press; 2011. p. 259-284.
100. Smith R, Keramatian K, Christoff K. Localizing the rostrolateral prefrontal cortex
at the individual level. NeuroImage. 2007; 36: p. 1387-1396.
101. Srinivasan N. Cognitive neuroscience of creativity: EEG based approaches.
Methods. 2007; 42: p. 109-116.
102. Dietrich A. Imaging the imagination: The trouble with motor imagery. Methods.
2008; 45: p. 319-324.
103. Van Heerden A. Creativity, the Flow state and brain function. SAJAH. 2010;
25(3): p. 141-151.
104. Dietrich A, Audiffren M. The reticular-activating hypofrontality (RAH) model of
acute exercise. Neurosci & Biobehav Rev. 2011; 35: p. 1305-1325.
© University of Pretoria

2 - 63
105. Laughlin S. the implications of metabolic energy requirements for the
representation of information in neurons. In Gazzaniga M. The cognitive
neurosciences.: MIT Press; 2004. p. 187-196.
106. Csikszentmihalyi M. Beyond boredom and anxiety: Jossey-Bass Publishers;
1975.
107. Csikszentmihalyi M. Creativity New York: Harper Perennial; 1996.
108. Csikszentmihalyi M, Csikszentmihalyi I. optimal experience. Psychological
studies of flow in consciousness Cambridge: Cambridge University Press;
1992.
109. De Manzano O. Biological mechanisms of creativity and flow. 2010. Thesis.
110. Kivikangas J. Psychophysiology of flow experience: An explorative study. 2006.
Faculty of Behavioural Sciences. Department of Psychology.
111. De Manzano O, Theorell T, Harmat , L , Ullen F. The psychophysiology of flow
during paino playing. Emotion. 2010; 10(3): p. 301-311.
112. Keller J, Bless H, Blomann F, Kleinbohl D. Physiological aspects of flow
experiences: Skills-demands-compatibility effects on heart rate variability and
salivary cortisol. Journal of Experimental Social Psychology. 2011; 47(4): p.
849-852.
113. Limb C, Braun A. Neural substrates of spontaneous musical performance: An
fMRI study of jazz improvisation. PLoS ONE. 2008;: p. e1679.
114. Bengtsson S, Csikszentmihalyi M, Ullen F. Cortical regions involved inthe
generation of musical structures during improvisation in pianist. Cogn Neurosci.
2007; 19: p. 830-842.
115. Sinnamon S, Moran A, O'Connell M. Flow amongst musicians: measuring peak
experiences of student performers. J Res Mus Edu. 2012 June; 60(1): p. 6-25.
116. Lowis M. Music as a trigger for peak experiences among a college staff
population. Creat Res J. 2002; 14: p. 351-359.
117. Kirmizi-Alsan E, Bayraktaroglu Z, Gurvit H, Keskin Y, Emre M, Demiralp T.
Comparative analysis of event-related potentials during Go/NoGo and CPT:
© University of Pretoria

2 - 64
Decomposition of electrophysiological markers of response inhibition and
sustained attention. Br Res. 2006; 1104(1): p. 114-128.
118. Midlands Technical College. The Cardiovascular System: The Heart.; 2016
[cited 2016 March 12 [Course content (BIO 211)]. Available from:
"http://classes.midlandstech.edu/carterp/Courses/bio211/chap18/chap18.html
119. Daintith J. Nyquists criterion.; 2004 [cited 2016 March 13. Available from:
"http://www.encyclopedia.com/doc/1O11-Nyquistscriterion.html"
120. Keesew GS. Synaptic knob. i3D learning collaboration space. [cited 2016
March 12. Available from: “http://i3dlearning.pbworks.com/w/page/27666060
/Synaptic%20Knob
121. Martindale C, Hasenfus N. EEG differences as a function of creativity, stage of
the creative process, and effort to be original. Biol Psychol. 1978; 6: p. 157-167.
© University of Pretoria

3 - 1
Chapter 3 Research approach and methodological outline.
It is the tension between creativity and scepticism that has produced the
stunning and unexpected findings of science.
Carl Sagan
© University of Pretoria

3 - 2
The primary aim of the study was to do an exploratory, multi-modal physiological
investigation of heart and brain operatives during live music improvisation. Hemmed
into this leading objective were the ancillary aim of investigating the possible
occurrences of flow during performances and its associated psychophysiological
characteristics and features within the data. In addition, the study attempted to
establish rudimentary correlations and associations between frequency components
of the EEG and heart rate variability data captured during improvisation and such flow-
like states.
An exploratory investigation of electrophysiological rhythms of the brain and the
variability in heart rate was instigated during live sessions of musical improvisation.
Wireless EEG measurements were taken from the scalps of professional jazz
musicians during performances, while a heart monitoring device measured amount
and time variability in heart beats. The aim was to explore potential relationships
between variables in order to better understand the physiological processes in
operation during a high performance state and the experience of optimal performance
associated with flow. The following chapter describes the methodological approach
taken in this investigative study. Recruitment of participants are discussed, alongside
the testing process and equipment used. The process of data analysis is outlined
together with the accompanying analytical perspectives and data pre-processing
requirements.
3.1 RESEARCH APPROACH
A combination of quantitative and qualitative methods were used in this observational,
exploratory, basic research study. Basic research can be described and contrasted
with applied research in that its objective can be considered as “…the primary goal of
advancing knowledge and theoretical understanding rather than solving practical
problems” as opposed to “…the intention of applying the results to some specific
problem” vis-à-vis to applied research.1 Therefore the study aims to advance the
knowledge on the subject matter by determining possible statistically significant
relationships between variables, while simultaneously taking a chiefly exploratory and
descriptive (observational) approach.
The first phase of the study involved the quantitative testing of heart rate variability
and electroencephalographic parameters in professional musicians during a session
© University of Pretoria

3 - 3
of continuous improvisation (piano) and was followed by a qualitative phase of semi-
structured interviews and informal feedback. This was done in order to gain insight
into the artists’ subjective experiences, in particular, relating to the experience of flow.
This personal feedback was used in combination with video/audio recordings,
investigative notes and perceived ease-of-play, and the clarity of data to generate a
qualitative perspective on each performance to aid the identification of possible states
of flow during each routine.
The quantitative phase involved the preparation of subjects with the recording
instruments (EMOTIVE EEG headset; Zephyr BioHarness 3 heart monitor) and the
subsequent recording of physiological activity within the heart and brain before, during
and after a session of continuous improvisation.
The main limiting factors pertaining to the research were the time lost during
replacement of damaged equipment and the subsequent (international) importation of
new testing equipment and software, resulting in an unforeseen truncation of time
available for testing. In addition, a calculated decision was taken during the testing
phase of this study to switch to a more powerful software platform for data analysis,
but came at the expense of the data that had been accumulated up to that point. Due
to the nature of the study and the sole recruitment of professional musicians, the
number and availability of suitable candidates played a restrictive role, while
nationwide protests on university campuses caused delays at critical points during the
conduction of this study. Further limitations are discussed in Chapter 5.
3.1.1 Ethical Considerations
The research proposal and its outlined protocol was tendered to the Ethics Committee
and MSc Committees of the Faculty of Health Sciences (UP), and was approved
(S15/2015) by both. In light of the objectives of research ethics as stated by Walton, 2
particular emphasis was given to the health or safety of the subject and no risk existed
on the subject’s behalf. There was no discomforts associated with the equipment. In
order to serve the best interest of the individuals involved, all audio and video
recordings of performances were made available to the participants for their own
personal use and distribution (e.g. for auditions). Results and findings from this study
and individual’s performances were reported back to each subject.
© University of Pretoria

3 - 4
Pertaining to the ethical soundness of the testing protocol, informed consent was
obtained from all participants, as mentioned, and all persons were briefed on the
project endeavours, confidentiality, objectives, benefits and their role and rights in the
study. The aim, purpose, procedures and duration of the study was discussed with
each participant. All persons and personal information associated with the study was
handled with the greatest confidentiality and professionalism. Participants were
assigned a subject code and all data, results and biographical information were stored
securely and password protected. No personal information of any participant has been
made available to any third party or, in the case of currently enrolled postgraduate
students, could affect any facet of their academic performance or results.
This study was conducted in compliance with GCP (Good Clinical Practice) which is
to say that the scientific goals of the study are secondary to the wellbeing of the
research participant. The results of this study was recorded and reported in an
objective manner and the limitations, restrictions, shortcomings and constraints have
been pertinently noted.
3.2 SAMPLE
All subjects were personally invited to participate and were recruited through their own
volition. Senior authorities within the Department of Physiology (UP) and the
Department of Music (UP) were consulted regarding the identification, invitation and
potential recruitment of musicians that fitted the criteria and level of experience
required for the study. Testing was conducted at the Musaion Concert Hall (UP) on
different days but all in the morning hours, utilizing the same piano, venue and testing
equipment.
The testing population consisted of healthy adults of both sexes, above 21 years of
age, right-handed, and were all professional jazz-trained pianists of a performance
licentiate standard. This is to say that all tested musicians had advanced levels of
performance experience coupled with a pronounced amount of performing hours to
ensure that those involved were highly skilled practitioners. With a high level of
performance expertise, i.e. advanced skill set paired with experience, engagement
with flow and peak performance becomes easier and faster.3 Additionally, in order to
get sufficient volume, good resolution and a greater insight into such volatile and
complicated conduct as improvisation it was important that participants would be able
© University of Pretoria

3 - 5
to improvise continuously without stopping for at least twenty minutes, while
performing unrehearsed and unpractised pieces of music. In light of the demanding
nature of the testing procedure it was crucial to recruit individuals with the expertise
and the experience to meet the challenge.
Prior to arrival, participants were only informed that they were required to improvise
but no further information was shared in order to ensure no premeditation on their part,
as the intention was to test improvisation exclusively, making it crucial that they had
not practiced or recited parts prior to the testing. Upon arrival, all participants were
presented with and required to read and sign an Informed Consent document and
Information Leaflet and were subsequently briefed on the testing procedure. Time for
warm-up was granted prior to testing, however none of the subjects felt it necessary.
Inclusion Criteria Exclusion Criteria
Aged 21+
Professional status or advanced
level of performance experience
Right hand dominant
Wind Instruments
Left hand dominant
Physical disabilities
Use of chronic medication
Prevalence of epilepsy
3.3 MEASURING HEART RATE VARIABILITY
Heart rate variability (HRV) was measured using the Zephyr BioHarness 3™. The
BioHarness is a compact electrocardiography (ECG) monitoring unit attached to a
Smart Fabric strap for the monitoring of several heart and breathing modules. It is a
wireless, light-weight bio-monitoring apparatus that is worn around the torso and can
record and transmit physiological information (in real-time or for future reviewing and
analysis) to a PC or laptop.
© University of Pretoria

3 - 6
BioHarness™ 3 modules include: 4
Heart rate - 0-240 bpm;
±1bpm;
Breathing rate – 0-120 bpm
±1bpm;
Heart rate variability (HRV);
Posture and positioning
(±180˚);
Estimated core temperature
(˚C);
Movement detection (VMU);
3-axis acceleration (up to
16g);
USB connectivity (for data
download and charging);
Bluetooth and/or 802.15.4
(ECHO) connectivity;
Galvanic skin response (GSR)
500+ hours of data storage.
Validity assessments for the BioHarness™ 3 are well in place. Using a bias and
Standard Error (SE) of less than 3 beats, the performance of the BioHarness™ 3
against a 3-lead ECG has been validated [high degree of correlation (>0.98)], showing
the device to be an effective practical measure for ECG data reading and collection
under common exercise conditions 4 and was therefore more than adequate for the
study. In addition, the BioHarness™ 3 has been proven an effective tool in the
prediction of high, medium and low mental workload 5 and mental fatigue 6 based on
HR features.
3.4 MEASURING ELECTROENCEPHALOGRAPHY
For the measurement of brainwaves and electrophysiological activity within the brain,
the Emotiv ® EPOC EEG headset was employed. The EMOTIV EPOC headset is an
innovative personal brain-computer interface (BCI) device. It is a wireless, high
Figure 13: The Zephyr BioHarness 4
© University of Pretoria

3 - 7
resolution, 14-channel EEG headset, born from the commercial computer gaming
industry and was originally developed to bring the mind into the gaming realm.
Allowing users to control the movement of characters and objects in a virtual
environment using only their thoughts and expressions, development of such
rudimentary, commercially available EEG devices have become a growing trend. The
system uses dry electrodes (small cotton pads soaked in saline solution) that are
clipped to sockets on a headset frame.
The headset frame allows for simple alignment and setup (in accordance with the
international 10/20 system), and has a built-in gyroscope for the tracking of head
movements. Complimented by a built-in proprietary wireless transmitter (2.4 GHz),
real-time EEG data is transmitted over a wireless signal with a bandwidth of 0.2 – 45
Hz (digital notch filters at 50Hz and 60Hz) at a sampling rate of 128 SPS (2048 Hz
internal) to a USB receiver.g Additionally a USB-rechargeable battery in the headset
allows for up to 12 hours of continuous and wireless usage. The 14 EEG channels
(excluding 2 reference leads) are positioned as follows: AF3, F7, F3, FC5, T7, P7, O1,
O2, P8, T8, FC6, F4, F8, AF4 (Figure 15).
The EMOTIV EEG software package includes three detection suites:
1. Expressiv™ suite – Interpretation of the user’s facial expressions such as
smiling, blinking, winking or frowning.
g A data packet counter in the Testbench™ software interface verifies data transmission integrity and any missing data packets.
Figure 14: The Emotiv EPOC EEG headset. 15
© University of Pretoria
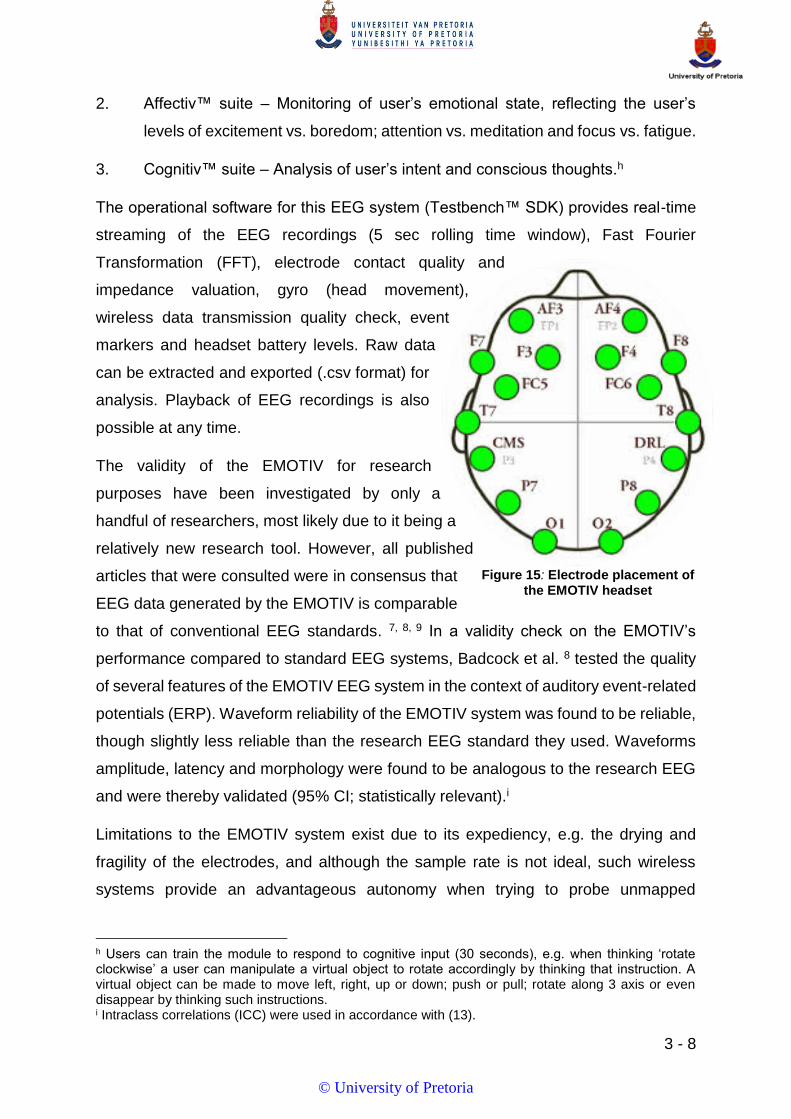
3 - 8
2. Affectiv™ suite – Monitoring of user’s emotional state, reflecting the user’s
levels of excitement vs. boredom; attention vs. meditation and focus vs. fatigue.
3. Cognitiv™ suite – Analysis of user’s intent and conscious thoughts.h
The operational software for this EEG system (Testbench™ SDK) provides real-time
streaming of the EEG recordings (5 sec rolling time window), Fast Fourier
Transformation (FFT), electrode contact quality and
impedance valuation, gyro (head movement),
wireless data transmission quality check, event
markers and headset battery levels. Raw data
can be extracted and exported (.csv format) for
analysis. Playback of EEG recordings is also
possible at any time.
The validity of the EMOTIV for research
purposes have been investigated by only a
handful of researchers, most likely due to it being a
relatively new research tool. However, all published
articles that were consulted were in consensus that
EEG data generated by the EMOTIV is comparable
to that of conventional EEG standards. 7, 8, 9 In a validity check on the EMOTIV’s
performance compared to standard EEG systems, Badcock et al. 8 tested the quality
of several features of the EMOTIV EEG system in the context of auditory event-related
potentials (ERP). Waveform reliability of the EMOTIV system was found to be reliable,
though slightly less reliable than the research EEG standard they used. Waveforms
amplitude, latency and morphology were found to be analogous to the research EEG
and were thereby validated (95% CI; statistically relevant).i
Limitations to the EMOTIV system exist due to its expediency, e.g. the drying and
fragility of the electrodes, and although the sample rate is not ideal, such wireless
systems provide an advantageous autonomy when trying to probe unmapped
h Users can train the module to respond to cognitive input (30 seconds), e.g. when thinking ‘rotate clockwise’ a user can manipulate a virtual object to rotate accordingly by thinking that instruction. A virtual object can be made to move left, right, up or down; push or pull; rotate along 3 axis or even disappear by thinking such instructions. i Intraclass correlations (ICC) were used in accordance with (13).
Figure 15: Electrode placement of the EMOTIV headset
© University of Pretoria

3 - 9
scenarios such as real-time creative expression, that have proved difficult in past.
Although no published validity checks have been made publicly available by the
developers, and access to whitepapers are at this stage limited, non-contextual
shortcomings concerning the quality of data, access to raw data and/or its analysis
could not be found.
This system does however carry several practical advantages, being a vastly
inexpensive alternative to the clinical or laboratory equivalents. Its portability, ease of
use, cleaning, wireless capabilities and size/weight proved greatly accommodating
given the context of the current study. The system permitted the testing of performers
during actual playing while moreover allowing musicians to perform in a natural
manner, unrestricted and in a more suitable and conducive environment for such
creative expression.
3.5 QUESTIONNAIRE
All subjects were required to complete a short biographical data sheet with the twofold
objective of indexing each individuals performance background and expertise, and
their basic biographic information. The latter survey centred around physiological and
lifestyle factors that might influence HRV such as age, gender, and body mass on one
side, while alcohol consumption, smoking habits or sleep abnormalities were also
considered. This was a non-standardized questionnaire with the simple aim of
eliminating potential perversions and bias within HRV data. The elected questions
were grounded in the validation of factors that have been recognised to affect HRV. 10
3.6 PERIPHERAL RECORDING AND DATA SYNCHING
There was a strong need for the data capturing in this study to be synchronised not
only between the different testing modules and equipment, but in a manner that would
allow for retrospective analysis. When trying to investigate a phenomenon as volatile
as creativity, improvisation or flow it is imperative that high-quality, meaningful
peripheral recording methods are set in place during testing, so that performances
may be revisited during analysis. Visual recordings of each performance was captured
using a GoPro Hero3 camera, mounted peripherally so as to capture each musicians’
display. Due to the inimitable fashion and distinctiveness of each performance,
playback of visual recordings proved to be a valuable asset during the review process.
© University of Pretoria

3 - 10
Performances were recorded in an acoustically pristine environment and all recordings
were made available to participants for their own personal use or distribution.
On the second front, time stamping of events that might negatively or positively
influence the subject’s performance were logged during each session. Relevant or
potentially relevant events that might cause artifacts within the data (e.g. disruptive
movements), impede the occurrence of flow (e.g. distractions or mistakes), or suggest
the occurrence of flow (e.g. perceived effortlessness, positive affect) were logged and
reflected against the data during the analysis phase.
Time stamping of events and stages of the performances also served an additional
purpose in ensuring the synchronicity between the different testing modules. Due to
the use of separate systems and software platforms, the synchronicity of the data was
of the highest priority and all recording starting/change-over times were logged, and
paired relative to a centralized chronograph.
3.7 OUTLINE OF PROCESS
After completion of the biographical questionnaire (Appendix B) and informed consent
(Appendix A) participants were briefed and prepared for testing.
3.7.1 Preparation
Preparation consisted of impedance and connectivity checks, together with the
physical setup of the testing equipment and took about 10 - 15 minutes. The sponge
electrodes of the EEG headset were moistened with common saline solution in
advance, while the heart band also needed moistening prior to attachment. Subjects
were asked to fit the Zephyr heart band in private following instruction, due to the need
for the strap to make contact with the skin around the torso. Subsequently, the
EMOTIV EEG headset was placed onto the head of the subject. Alignment and
impedance checks were conducted at this point to ensure 100% connectivity, data
transfer and absolute signal generation from all electrodes. Both devices were
wirelessly connected to the recording laptop (Windows 7 OS) through their respective
receivers and once all devices were operational, central and peripheral recordings
were initiated and the testing procedure commenced.
© University of Pretoria

3 - 11
3.7.2 Testing procedure
The first stage of testing consisted of a six minute baseline measurement (E1) after
which participants were asked to improvise continuously (no stopping) for an
undetermined period of time (open frame; OF), followed directly with an inverse
replication of the baseline measurement (E2) upon completion.
3.7.2.1 E1 (baseline)
The six minute baseline prior to improvisation required subjects to sit quiet and
motionless for 3 minutes with their eyes closed (EC1), followed sequentially by a 3
minute ‘eyes open’ period (EO1). EC1 was conducted as a stabilisation phase to allow
participants to become calm, relaxed and alleviate tension from the preparations or
prior engagement. EO1 in that regard reflects the true baseline and was used for
normalisation and relation during the analysis of each performance.
Phase time: 6 minutes
3.7.2.2 OF (open frame)
Following successful completion of E1, subjects commenced immediately with their
performance and continued in a non-stop fashion until completion. Subject were
allowed to improvise for any amount of time that they were comfortable with and were
EC1 EO1 EO2 EC2
E1 E2 OF
PRE
P
STORAGE
time
Figure 16: The different phases of the testing procedure. An initial baseline (E1) is done after preparation (PREP) has been completed, followed by the
improvisation performance (OF). Directly after conclusion of the performance, a comparative baseline measurement was performed (E2).EC and EO refer to the
eyes-closed and eyes-open divisions of the baseline measurements.
© University of Pretoria
3 - 12
not interrupted or distracted.j The participant was now allowed to move accordingly,
but were reminded to refrain from making noises or overly expressive head
movements.
Phase time: 20 – 50 minutes.
3.7.2.3 E2 (comparative baseline)
Directly following the conclusion of performance (OF) an inverse replication of the
baseline measurement was conducted. Subjects were required to take their hands off
the piano, and sit comfortably with their eyes open for 3 minutes first (EO2) followed
by a 3 minute ‘eyes closed’ period (EC2). As in E1 subjects were required to remain
quiet and motionless. Here EO2 would represent the stabilisation measure, allowing
participants to equalise after their performance, and EC2 could be used to compare
before and after baseline values.
Phase time: 6 minutes
Total testing estimate: 35 – 65 minutes
This concludes the testing procedure (quantitative phase). Testing equipment was
removed, cleaned and stored. All data was stored and backed up and the informal
interview and feedback commenced (qualitative phase). Participants were asked
about their performances and how they felt they played, with special focus on flow and
its occurrence in order to assist in identifying stages of each performance where
subjects felt they reached flow, peak performance, in-the-moment sensations, or any
possible distractions or atypical disengagements.
3.8 OUTLINE OF DATA ANALYSIS
For data analysis purposes two supplementary software platforms were employed.
HRV data was captured using the complimentary OmniSense software of the Zephyr
BioHarness as mentioned above, and raw data was subsequently exported to Kubios
j The investigation centred on the freedom on the subject’s behalf to play for an undetermined period of time. The rationale here is to allow the subject to perform for as long as they felt comfortable with and remained engaged and focussed on their performance. Having the creative freedom to perform to their own ability and motivation not only generated a greater deal of data, but allowed the free expression of each subject to find their groove, and so reach flow on their own terms. When subjects started disengaging due to fatigue or boredom they could then stop at their own volition. Hereby, the recordings were grounded in the individuals own engagements with the music and their performance, uninterrupted and free of predetermination from the external environment or researcher.
© University of Pretoria

3 - 13
HRV (version 2.2) for analyses. Kubios HRV is an advance heart rate variability
analysis tool that provides a wide variety of different analysis options, suitable for both
research and clinical purposes. Data was screened for ectopic and missed beats and
was rectified using a built-in artifact correction implement. Successive windowing of
the data was done so as to generate frequency components and their respective
power values for every 30 seconds of data and is outlined in Chapter 4.
EEG data was directly recorded into the BioExplorer 1.6 software platform developed
by CyberEvolution 11 and is used for real-time biophysical data processing and display.
The software has a comprehensive range of tools, features and investigative outfits
for filtering, analyses and graphic representation of the electrophysiological data.
Although the platform shows greater utility for the graphical illustration of data
captured, tables were generated for the respective spectral analysis and its
complimentary power and amplitude outputs for every 30 seconds of data. This too is
described further in Chapter 4. Transmitted data from all electrode sites were verified
and confirmed to be below the recommended impedances levels (0.5 Ω). Due to the
movement involved with playing an instrument it is to be expected that naturally
occurring artifacts would be present in the data. During testing data was visually
inspected for abnormalities and the greatest of these were noted and time stamped
for later consideration.
Pre-processing of the EEG data involved separating the signals from the Emotiv into
its respective electrode constituents (sites), and each channel (source) was directed
through a filtering component in order to remove unwarranted frequencies and signals
falling outside the desired frequency range. A band-pass filter (0.5 – 35Hz) was
therefore imposed on the signals from each electrode, allowing only those frequencies
to pass through and henceforth eliminating those frequencies that fall outside this
range. Amplitude values were calculated, enabling the calculation of spectral power
components.
Due to the exorbitant amount of data generated for each subject, the analytical
approach was compartmentalised into three diverging perspectives so as to
systematically investigate (and explore) the data. These perspectives have the shared
aim of describing the shifts and generalisations that were observed within different
stages of each individuals’ performance but carry dedicated focal areas of
© University of Pretoria

3 - 14
investigation. These three perspectives concern primarily the EEG data and can be
described as follows:
3.8.1 A Means Perspective
This basic (mean) perspective revolves around the mean values of the different
stages, and by calculating such means, this perspective allows for a basic resolution
and comparison of the mean spectral values for each stage and subject. The main
focus in this perspective revolves around the comparison of baseline stages and
whether noteworthy differences are found before and after improvisation.
Research questions that are asked from this perspective involve: How does the overall
baseline power means compare to that of the performance? Are there notable
differences in the means of the two baselines? Are there noticeable or lingering effects
within certain spectral bands following improvisation? Are there consistent changes
between individuals?
3.8.2 A Dynamic Perspective
This perspective attempts to give greater insight and focus to the performance stage
itself, taking a simpler approach to the means perspective, but instead looking at the
global, hemispheric and regional power contributions during the act of improvisation.
The approach follows mainly a descriptive valuation of the data and its graphical
representations, with the intention of defining trends and shifts in the data rather than
robust statistical analysis.
Research questions that are posed from this perspective involve: Are there noteworthy
amplitude/power shifts occurring during the performance? Are there important shifts
in regional and hemispheric dominance? What are the overall trends in each of the
power bands and are is this consistent across subjects?
3.8.3 A Biasing Perspective
This perspective revolves around the subdivision of the testing stages into differing
epochs (time intervals) in order to advance a greater resolution on the shifting trends
that are taking place during performance. Due to the subjective experience of flow and
the idiosyncratic nature of the improving performances of every subject, it was thought
valuable to include a biasing or subjective perspective with the objective of describing
trends and activity in the data as occurring in and around moments of flow. The ‘bias’
© University of Pretoria

3 - 15
therefore lies simply in the fact that feedback received from subjects in conjunction
with subjective investigative measures are combined to pinpoint the incidences of flow.
As there are no objective measures for flow, the reliance on subjects to report such
occurrences in retrospect constitute this perspective and its partiality. Subject
feedback, video review, independent investigator notes, clarity of data, and perceived
ease-of-play was all taken into consideration and combined to identify the most likely
time periods of each performance where individuals experienced flow. Through adding
this bias it was possible to focus the explorative investigation of shifts and trends in
the data in and around certain approximated ‘flow zones’.
Research questions asked from this perspective involved: How long into the
performance did flow first occur? Are there any noteworthy shifts in overall, regional
or hemispheric power during, prior or after windowed flow zones? What are the
dominant frequencies, and spectral expression around these times? Is there
consistency between individuals concerning the landscape of the data during these
times?
3.8.4 Correlating heart and brain
HRV data is described and presented throughout several of the aforementioned
perspectives. Through power spectral density (PSD) analysis of HRV data, the high
(HF) and low frequency (LF) components could be extracted, allowing the investigation
of the autonomic influence from the brain on the heart. Through this frequency-domain
analysis, the power and balancing actions of the sympathetic and parasympathetic
branches of the ANS could be quantified and described. Frequency components of
the HRV data was analysed over a 3minute window and shifted by 30 seconds in order
to generate band power values for each half minute of testing. This approach is an
altered rendition of an analysis strategy employed by Jurysta et al. 12
Normalized power values for both HRV and EEG data was employed during all
analytical perspectives so as to reflect band power values as ratios of their respective
baseline means. Through normalisation of the data it becomes feasible to bridge the
gap between such relative power values as calculated for each subject, spectral band
and oscillatory system. EEG data, already in the frequency domain, can be processed
through Fast Fourier Transformation (FFT) to generate its respective spectral
components (i.e. frequency bands namely Alpha, Theta, Delta etc.) in much the same
© University of Pretoria

3 - 16
way that HRV is divorced into its high and low frequency components . By normalizing
both HRV and EEG data against their respective baseline mean, such separate
datasets that operate at different, distinct frequencies and are relative to each subject
can be compared or plotted on the same graph for comparison and correlative
associations [see (12)].
3.8.5 Statistical implementation
Descriptive statistics surrounding the test population is presented. In combination,
bivariate and non-parametric statistical methods were employed in examination of the
data, however the small sample size did not lend itself out to further statistical analysis.
Amongst other, it is mainly for these reasons that an exploratory study was conducted
with a greater descriptive outlook. Statistical approaches as described further in the
following chapter.
© University of Pretoria

3 - 17
3.9 REFERENCES
1. Vogt W. Dictionary of statistics and methodology. 3rd ed. Thousand Oaks: SAGE
Publications; 2005.
2. Walton N. What is research ethics? 2012. [cited 2012 March 20. Available from:
http://www.researchethics.ca/what-is-research-ethics.htm]
3. Travis F, Harung H, Lagrosen Y. Moral development, executive functioning, peak
experiences and brain patterns in professional and amateur classical musicians:
Interpreted in light of a Unified Theory of Performance. Consciousness and Cognition.
2011.
4. Zephyr Technology Corporation. Validity of BioHarness Heart rate vs 3-lead ECG;
2008.
5. Cinaz B, La Marca R, Arnrich B, Troster G. Monitoring of mental workload levels.
[Cited 2014 April 1. Available from: http://www.zephyranywhere.com/zephyr-
labs/white-papers].
6. Myers L, Hunter Downs J. Parsimonious identification of physiological indices for
monitoring cognitive fatigue. [Cited 2014 April 1. Available from:
http://www.zephyranywhere.com/zephyr-labs/white-papers]
7. Thie J, Kilstorner A, Graham S. Biomedical signal acquisition with streaming
wireless. Documenta Ophthalmologica. Advances in Ophthalmology. 2012; 125: p.
149-159.
8. Badcock N, Mousikou P, Mahajan Y, de Lissa P, Thie J, McArthur G. Validation of
the Emotiv EPOC gaming system for measuring research quality auditory ERPs.
PeerJ. 2013; 1(e38).
9. Stytsenko K, JE&PC. Evaluation of consumer EEG device Emotiv EPOC. 2011.
10. Acharya U, Joseph K, Kannathal N, Lim C, Suri J. Heart rate variability: a review.
Med Bio Eng Comput. 2006; 44: p. 1031-1051.
11. CyberEvolution. BioExplorer; 2014 [cited 2014 October 20. Available from:
"http://www.cyberevolution.com/index.html]
© University of Pretoria

3 - 18
12. Jurysta, F; van de Borne, P; Migeotte, PF; M, Dumont; Lanquart, JP; Degaute, JP;
Linkowski, P. A study of the dynamic interactions between sleep EEG and heart rate
variability in healthy young men. Clinical neurophysiology. 2003; 114: p. 2146-2155.
13. Bishop D,HM,UR&vSW. Maturation of the long latency auditory ERP: step function
changes at start and end of adolescence. Developmental Science. 2007; 10: p. 565-
575.
14. Taking space; 2013 [cited 2014 April 23. Available from:
http://www.takingspace.org/page/2]
15. BH Digital Media Production. First trial with EPOC headset device; 2012 [cited
2016 March 18. Available from: https://mynameiskavi.wordpress.com/page/2/]
© University of Pretoria

4 - 1
Chapter 4 Research outcomes and results.
Creativity itself doesn't care at all about results - the only thing it craves is
the process. Learn to love the process and let whatever happens next
happen, without fussing too much about it. Work like a monk, or a mule, or
some other representative metaphor for diligence. Love the work. Destiny
will do what it wants with you, regardless.
Elizabeth Gilbert
© University of Pretoria

4 - 2
4.1 INTRODUCTION TO RESULTS
This chapter presents the results for the current investigation. An exploratory, multi-
modal investigation was conducted into the nature of improvisation and flow and its
underlying physiological expressions within the heart and brain. Recorded autonomic
functioning and electrophysiological activity are presented in this chapter and
prominent trends and shifts within the data are described. The occurrence of flow
during performances and its associated psychophysiological characteristics and
features within the data are explored. Despite being an exploratory investigation, the
overall enquiry of this study carries a definitive determination of whether flow induced
noticeable physiological events such as a harmonisation of activity between and within
oscillatory systems or significant correlates within the data.
By coalescing differing perspectives with specific focal areas, findings and outcomes
are compartmentalised through diverging points of view (perspectives) to
systematically disentangle the wealth of data generated during the testing phases.
These three perspectives are referred to as the (I) Means perspective, (II) Dynamic
perspective and (III) Biasing perspective and are put forth in the sections to follow. A
general top-down approach was followed in assessing the power spectra associated
with each dataset and within each of the aforementioned perspectives, typically
starting with the global (overall) impressions. Subsequently, hemispheric (left/right),
regional (frontal and temporal expanses specifically) and individual electrode
contributions are investigated.
Summarising points after each section alongside a brief concluding discussion of the
results at the end of the chapter are provided. An integrated and comprehensive
discussion can be found in Chapter 5.
Typically, derivation of spectral power values are reported in Volts-squared per Hz
(V2/Hz) or ms squared (ms2) as its units, however due to the number of
transformations and rescaling that the data undergoes from the initial voltage
measurements (amplitude), values might no longer have a basic linear correlation to
Volt units. Instead, none conventional units are ascribed and it should henceforth be
clarified that power spectra values have been normalised against each persons’ and
each bands respective baseline mean (EO1) or total power. Put differently, all power
measures have been reflected against their particular baselines for each subject,
© University of Pretoria

4 - 3
thereby reflecting a ratio of the dynamic outputs against the baseline average power.
This allows for a better comparison between spectra that naturally carry different
amplitudes, but also a more rational comparison between subjects as such normalised
units (n.u) therefore convey relative changes of each individual.
As mentioned EO1 serves as the baseline stage in each performance, as EC1 served
more stabilising purpose from preceding tensions and exertions leading up to testing.
In addition, EO1 is also the eyes open, resting state immediately prior to performance,
making it a more appropriate control compared to the eyes-closed state where the
person might become somnolent. By normalising the values it becomes possible to
compare the magnitude of relative changes within and between separate datasets,
and in relation therefore a value of 1n.u would therefore be of equal power magnitude
to that of the baseline mean. A power value of 2 n.u for instance would thus be double
that of the baseline, and 0.5 n.u would be half.
4.2 TECHNICAL SPECIFICATIONS
In view of the forthcoming exposition, further elucidation is offered on certain technical
stipulations and particulars of the study.
4.2.1 EEG specifications and outline
Pertaining to the tech riders and preliminary analysis of the EEG, all electrode signals
were visually inspected throughout testing for overt artifacts. Pre-processing involved
the mitigation of all electrode signals using low- and high-pass FIR (finite impulse
response) filters.k This was done to attenuate the data of artifactual signals falling
outside the desired range of frequencies caused by e.g. environmental or high-
frequency noise. The desired range was from 0.5 – 35 Hz, including therefore the
delta, theta, alpha, SMR and beta bands, with the omission of the gamma band (above
35 Hz).
FIR filters carry the advantages of giving stable output signals, due to it being non-
recursive, while having a constant delay for all frequency bands implying that the
signal shape will not be influenced through phase shifts.1 A manual adjustment of the
default FIR filter offsets were made in order to ensure a flat passband over the sought
k An order of 60 was selected (software maximum). Increased order of FIR filters result in a sharper cut-offs at the boundaries of the specified frequency range.1
© University of Pretoria

4 - 4
frequency range as illustrated in Figure 17 and was intentionally made to sharpen the
fall-off at the set boundaries without loss of power at the end of the passband (0.5 - 35
Hz). Therefore the high-end offset was extended past 35 Hz to 39 Hz which also
altered the pass band to not drop off higher than 0.5 Hz but remain level up to this
frequency. Spectral, and thus power analysis of EEG signals are the main analytical
approach of the study and a steep roll-off at this passband boundaries are essential.
Any premature drop-offs at the passband boundaries would drastically reduce power
outputs of any frequencies that fall within these end segments. Therefore, a flat pass
band would infer absolute power magnitudes within the desired range with no loss of
power towards the offsets.
For each subject, the EMOTIV signal was separated out so that each electrode signal
was isolated as an independent source. All channels were sampled at 128 Hz. The
described filters were applied to all sources, after which spectral components were
sequestered and quantified using the BioExplorer software. This is to say that spectral
band amplitudes were extracted for the calculation of the relative power of each
frequency band at different electrode, regional and hemispheric sites. A quality check
was done in comparison with the raw signal to ensure no overlap between filtered
bands due to the extension of the upper boundary offset. No additional artifact
removal/correction was applied in preservation of the totality of the data, and thus it
remains possible for the data to be marginally contaminated by artifacts that fall within
the band-pass range.
Figure 17: The pass band magnitude of the manually altered FIR offset (A) set at 39 Hz, showing a flat passband from 0.5-35 Hz; versus default offsets set at 0.5-35 Hz (B). In (B), setting the offsets to the exact values results in an attenuation
of the frequencies at the edges of the filters, inferring a increasingly steep loss of power of the frequencies at the edges of the specified range.
© University of Pretoria
4 - 5
Conventional frequency bands were stipulated as falling within the specific ranges of
0.5 - 4 Hz (Delta), 4 - 8 Hz (Theta), 8 - 12 Hz (Alpha), 12 - 15 Hz (SMR) and 15 - 25
Hz (Beta), as apportioned by the software platform. Signal amplitudes were quantified
and power spectra were estimated for each frequency band through application of
Fast Fourier transformation (FFT), and was applied using a rectangular window and
averaged for every 30 sec of data. The spectrum power was scaled so that the power
of a 50 μV sine-wave was 1250 (μV)2. EEG spectral power was normalised against
the baseline means for each power band and subject and are consequently expressed
in normalised units (n.u).
Concerning the regional demarcations, it should be clarified that due to the particular
electrode configuration and montage of the EMOTIV EEG headset, regional
investigations orbited around specific combinations of electrode sites. Regional
electrode allocations were defined as involving the following electrode sites:
• AF3, F3, F7 (Frontal Left region);
• AF4, F4, F8 (Frontal Right region);
• F7, FC5, T7 (Temporal Left region);
• F8, FC6, T8 (Temporal Right region).
Parietal and occipital regions were disqualified due to the shortage of electrode sites
in these regions (one parietal site; one occipital site) and preliminary acumens from
the data preparation.
4.2.2 HRV specifications and outline
The ECG was recorded at a sensor sampling rate of 1000 Hz and reporting frequency
of 250 Hz. A built-in automated algorithm was used to detect the QRS complexes, so
that RRI time intervals and series could be calculated. Ectopic beats, artifacts and
premature ventricular contractions were detected using the criteria RRI < 350 ms and
RRI > 1500 ms. A quality check was imposed to assess the percentage of
contaminated data and revealed less than 0.97% (mean) of the data to contain ectopic
or artifactual beats (min= 0.54%; max= 1.24%). Due to the low percentage of
‘abnormal’ values, a low artifact correction method was imposed on the data, set at a
threshold of 0.35s from the local mean RR interval. The RR series was interpolated
© University of Pretoria

4 - 6
using a cubic-spline interpolation method (2), sampled at 4 Hz and the power spectrum
values were calculated for each 30 sec in a 180 sec window.l
Each analysed window contained 180 sec of RRI data over which HRV frequency
components were calculated, and the window was shifted by 30 sec interludes,
resulting in the obtainment of data values for each 30 sec of data.m Spectral
components for the HRV were computed: LF (0.04 Hz < f < 0.45 Hz); HF (0.15 < f <
0.4 Hz), alongside the LF to HF ratio (LF/HF). Power values were normalised against
the total power, thus LFnu = LF/(LF + HF), and HFnu = HF/(LF + HF). Consequently,
power spectral density (PSD) was used with a spectrogram algorithm using FFT on
180 sec of data (sampled at 4 Hz) to generate a 256 points PSD with 50 % window
overlap. LF and HF power and normalised power values could be obtained for each
30 sec of the data set.n
4.2.3 Statistical specifications and outline
As is evident from the research approach, an exploratory investigation was piloted
here due to the complexity of not only the task at hand, but by the same token that of
the data generated from this enterprise too. Testing of individuals during real-time
creative expression, let alone improvisation on such a specialized level presents with
many difficulties and limitation. An exorbitant amount of multifaceted data was
recorded for each individual performance which comprised of a large number of
variables, each pertaining to various different localities, exacting modifications and
implications, and on a large scale of processing and consolidation. In addition, given
the duration of each performance, i.e. the size of each data set, the number of
processing steps and the subdivisions of analytical perspectives and testing phases,
robust statistical analysis is challenging.
It is for these same reasons and, in addition and perhaps more significantly, the small
sample size that an exploratory statistical approach was implemented as such
multivariate data paired with a small testing population restricts the use of vigorous
statistical strategies. Instead a more descriptive line of attack was taken, graphically
l All power spectra analysis of the RRI time series was performed in accordance with the recommendations of the Task Force of the European Society of Cardiology. 14
m This is a modified approach similar to that used by Jurysta, et al. 12 n 30 sec intervals allow for the same number of power estimates for both ECG and EEG.
© University of Pretoria

4 - 7
illustrating prominent trends and features in the data, and supplemented with a basic
correlative, non-parametric statistical approach.
Correlation matrices were constructed for intersubjective, inter-spectral and time
based comparisons in the form of Spearman’s Rank Order Correlations analysis in
order to investigate any significant (P<0.05) relationships within the data. Any such
findings were then reflected back against the graphical depictions so as to get a
rounded interpretation of the presented findings and stated where applicable.
In supplementation of these statistics and given the small sample size, bootstrapping
techniques was incorporated to support and verify findings of significance.
Bootstrapping is a resampling technique used to generate random “copies” of a
sample statistic in order to assign measures of accuracy to sample estimates (e.g.
bias, confidence intervals, variance or error prediction). By random resampling (1000
samples) the sample size is therefore exaggerated and lends additional support to the
correlative tests performed by establishing whether such correlations fall within a
confidence interval (95%). In this regards significant correlations and differences were
only reported if both Spearman and Bootstrapped correlation matrices showed
corresponding significance.
In addition, a Friedman test was performed as a non-parametric alternative used to
test the same sample of cases at different conditions or times. Here it was used to
assess the differences of power spectra at designated time intervals in order to
compare the mean ranks of spectral power during continued performances. The
findings from this analysis are presented and explained further in a separate section
below (section 4.6.1.1).
Ideally, cross correlative measures were sought after in order to assess the level of
coherence between HRV and EEG power spectra within a concluding perspective.
Comparing the level of coherence between the normalised values of these two time
series would have proved ideal but statistical resources for such advanced
methodologies proved problematic. One method suggesting the comparison of the
slopes of each series within designated windows was rejected due to the lack of
objective measures of flow and its duration, as the intention behind such cross
coherence analysis lied with establishing whether a level of synchronicity between
brain and heart activity arose during flow.
© University of Pretoria

4 - 8
None the less, exploratory statistical support and correlations are presented where
found within the confines of such a descriptive and exploratory approach, and
appropriate findings are expressed where applicable. All statistical analysis were
performed using SPSS (version 23).
4.3 SAMPLE DEMOGRAPHICS AND DESCRIPTORS
4.3.1 Demographic descriptors
Upon invitation, eleven individuals responded and nine subjects volunteered for the
study. Due to the replacement of the preliminary analytical software (Chapter 2), two
datasets were consequently excluded due to compatibility issues between the
captured data and the altered software platform. In addition, two more subjects had to
be disregarded due to data quality inadequacies. The sample therefore consisted of
three males and two females (N=5), with the mean age = 25.8 years (SD = 1.6; range
= 24 – 27 years). Some demographic characteristics of the sample are summarized in
Table 4.1.
Table 1: Demographics of the sample
Variable Mean SD Minimum Maximum
Age (years) 25.8 1.6 24 27
Height (cm) 172.4 11.9 155 182
Mass (kg) 68.6 13.3 54 90
Hours of sleep (night before) 6.4 1.14 5 8
The sample comprised of three African and two Caucasian individuals. Two individuals
admitted to being smokers, however both participants reported smoking on average
no more than 5-7 cigarettes per day. No alcohol consumption was reported for the
evening prior to testing. Likewise, no chronic illnesses or medication needs were
reported, however one subject did report experiencing slight insomnia in the days
preceding testing. No other sleep abnormalities were reported.
Individual testing was conducted on separate occasions over two weeks, but all
between 9.30 – 11.30 am. The sample population boasted three Master’s degrees
(MMus), with all participants having finished at least their Bachelor’s degree in Music
(BMus). Two subjects were piano teachers at tertiary level and all participants
© University of Pretoria

4 - 9
performed frequently, both recreationally and professionally, and were therefore of a
very high performance licentiate standard.
4.3.2 Performance descriptors
As described earlier each performance consisted of an initial baseline measurement
(E1) that consisted of a 3 minute eyes-closed (EC1) and subsequent 3 minute eyes-
open (EO1) inactive period. Following the baseline measurement, subjects
commenced their performance (OF) and improvised continuously for a self-
determined period, followed by an inverse repetition of the baseline measurement
(E2).
The comparative baseline (E2) involved a 3 minute eyes-open (EO2) phase followed
immediately with a 3 minute eyes-closed period (EC2). Both baselines were conducted
in motionless silence with the individual looking at a blank wall in front of them with no
visual or auditory stimulations or distractions present.
Between subjects the mean performance phase (OF) length was 28.8 minutes (mean)
with the total testing times (E1+OF+E2) rendered at a mean of 40.8 minutes (SD =
8.89; Range = 30 – 51 minutes). Participants were allocated a code-letter as alias and
are henceforth referred to as Subject A – E from this point onwards.
Table 2: Performance times for each subject
E1 (min) OF (min) E2 (min)
Subject A 3 + 3 33 3 + 3
Subject B 3 + 3 51 3 + 3
Subject C 3 + 3 30 3 + 3
Subject D 3 + 3 45 3 + 3
Subject E 3 + 3 45 3 + 3
4.4 A MEANS PERSPECTIVE
This preliminary perspective can be considered one of basic resolution with the
rudimentary objective of assessing whether there were substantial differences and/or
prominent shifts occurring between the two baseline measurements – i.e. before and
after improvisation. The assessment involved comparison of band power means
© University of Pretoria
4 - 10
between the two baseline measurements. Global and hemispheric means are
reported, alongside a more progressive surveying of the particular outputs from
regional and electrode sites across the baseline phases. Both the original (E1) and
comparative (E2) baselines consist of an eyes-closed (ECx) and eyes-open (EOx)
component. As described EO1 acts as normalising reference, while EO2 serves also
to stabilise the subject immediately after performance. Hereby the comparison of EO1
and EC2 are of greater importance and represent a truer comparison of the baselines.
4.4.1 Global EEG Means
Figures 18 and 19 represent the different frequency bands and their relative,
normalised power for the baseline stages of each performance. Note that EO1 is
always 1 n.u, while the other stages reflect the ratios of their means against that of
EO1. In general summation of the global mean power differences, a comparison
between subjects showed greater variation within the Alpha and Theta bands (I & II,
Figure 18). Beta and SMR bands (III, Figure 18; V, Figure 19) showed greater
consistency between subjects, while individualistic outliers are most prevalent within
the Delta (A & E) band and therefore shows the lesser consistency. Such inconsistent
variations (Alpha and Theta) could imply greater recruitment of those frequencies
during improvisation as there are greater differences before and after its execution,
versus the steady out puts of SMR and Beta compared to the original baseline.
However, it is well known that Alpha power increases when the eyes are closed, and
the Alpha band power shows such typical increases when looking at the EC stages.
There is thus a general trend for Alpha power to increase once the eyes close and
therefore needs deeper enquiry, also given that EC2 generally shows greater strength
compared to EC1.
Focussing on the Theta spectral band, subjects show very dissimilar responses. As
stated, such inordinate variation could infer greater involvement and utility of theta
activity during performance, as one might expect perhaps that were improvisation not
engaging the brain within this frequency range, that subjects would show uniform
© University of Pretoria
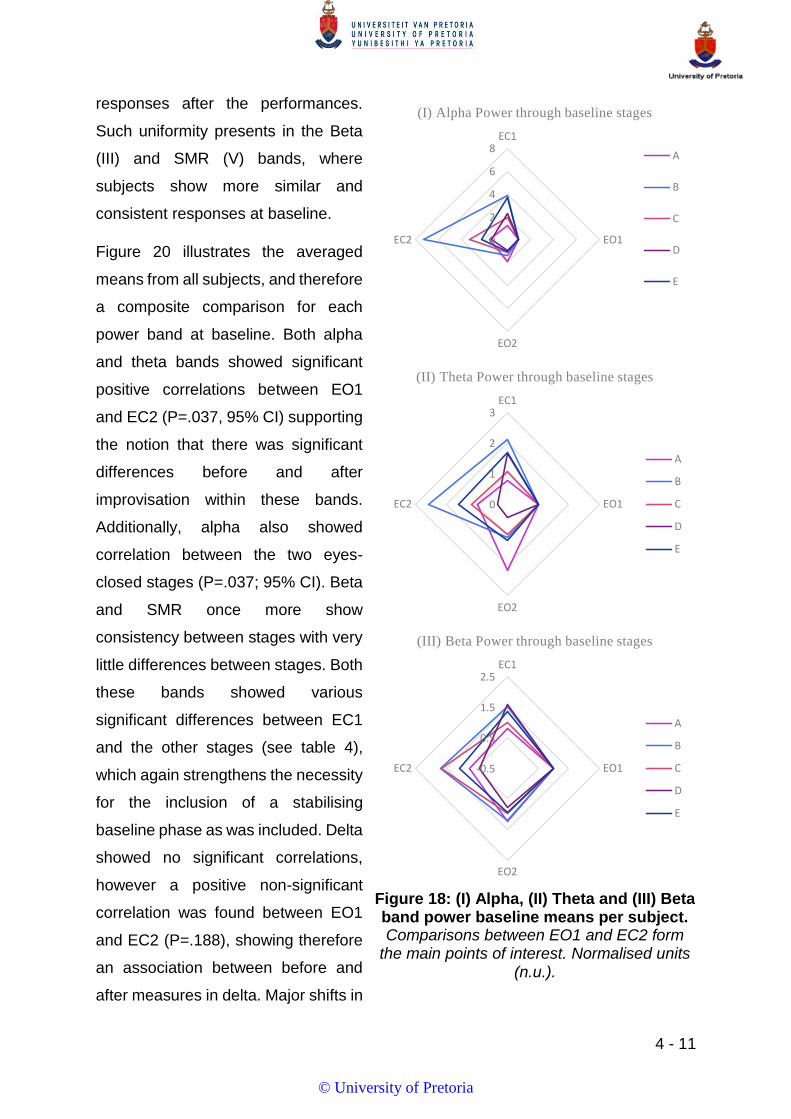
4 - 11
responses after the performances.
Such uniformity presents in the Beta
(III) and SMR (V) bands, where
subjects show more similar and
consistent responses at baseline.
Figure 20 illustrates the averaged
means from all subjects, and therefore
a composite comparison for each
power band at baseline. Both alpha
and theta bands showed significant
positive correlations between EO1
and EC2 (P=.037, 95% CI) supporting
the notion that there was significant
differences before and after
improvisation within these bands.
Additionally, alpha also showed
correlation between the two eyes-
closed stages (P=.037; 95% CI). Beta
and SMR once more show
consistency between stages with very
little differences between stages. Both
these bands showed various
significant differences between EC1
and the other stages (see table 4),
which again strengthens the necessity
for the inclusion of a stabilising
baseline phase as was included. Delta
showed no significant correlations,
however a positive non-significant
correlation was found between EO1
and EC2 (P=.188), showing therefore
an association between before and
after measures in delta. Major shifts in
0
2
4
6
8EC1
EO1
EO2
EC2
(I) Alpha Power through baseline stages
A
B
C
D
E
0
1
2
3EC1
EO1
EO2
EC2
(II) Theta Power through baseline stages
A
B
C
D
E
-0.5
0.5
1.5
2.5EC1
EO1
EO2
EC2
(III) Beta Power through baseline stages
A
B
C
D
E
Figure 18: (I) Alpha, (II) Theta and (III) Beta band power baseline means per subject. Comparisons between EO1 and EC2 form
the main points of interest. Normalised units (n.u.).
© University of Pretoria

4 - 12
Delta in Figure 20 may therefore likely be misleading due to the massive differences
by two particular subjects, as shown in Figure 19.
-1
1
3
5
7EC1
EO1
EO2
EC2
(IV) Delta Power through baseline
stages
A
B
C
D
E
-0.5
0.5
1.5
2.5EC1
EO1
EO2
EC2
(V) SMR Power through baseline
stages
A
B
C
D
E
Figure 19: (IV) Delta and (V) SMR band power baseline means per subject. Normalised units (n.u).
Figure 20: Composite power distributions for each frequency band and stage of baseline measurements.
© University of Pretoria

4 - 13
Table 3: Notable and significant correlations at baseline stages for the population means – Spearman’s Rho
DELTA THETA ALPHA SMR BETA
EC1 EO1 EO2 EC2 EC1 EO1 EO2 EC2 EC1 EO1 EO2 EC2 EC1 EO1 EO2 EC2 EC1 EO1 EO2 EC2
EC1 CC - - - - - .900* - - .700 .900* - - - .900* - .900* .900* .900*
Sig. - - - - - .037 - - - - .188 .037 - - - .037 - .037 .037 .037
N - - - - - 5 - - 5 5 - - - 5 - 5 5 5
Bias - - - - - -.055 - - -.036 -.036 - - - -.066 - -.037 -.037 -.047
Std.Err - - - - - .303 - - .434 .434 - - - .313 - .24 .24 .295
EO1 CC - - - - .900* .700 .900* .700 .900* - - - .900* .900* - - .800
Sig. - - - - .037 - .188 .037 - - .188 .037 - - - .037 .037 - - .104
N - - - - 5 5 5 5 5 - - - 5 5 - - 5
Bias - - - - -.055 -.035 -.055 -.054 -.054 - - - -.066 -.037 - - -.084
Std.Err - - - - .303 .442 .303 .297 .297 - - - .313 .24 - - .332
EO2 CC - - - - - .700 - - .700 .700 - - - - - .900* .900* - - .800
Sig. - - - - - .188 - - .188 .188 - - - - - .037 .037 - - .104
N - - - - - 5 - - 5 5 - - - - - 5 5 - - 5
Bias - - - - - -.035 - - -.036 -.054 - - - - - -.066 -.037 - - -.084
Std.Err - - - - - .442 - - .434 .297 - - - - - .313 .24 - - .332
EC2 CC - - - - - .900* - - .900* .900* - - .900* .900* .900* - .900* .800 .800 -
Sig. - - - - - .037 - - .037 .037 - - .037 .037 .037 - .037 .104 .104 -
N - - - - - 5 - - 5 5 - - 5 5 5 - 5 5 5 -
Bias - - - - - -.055 - - -.036 -.054 - - -.066 -.066 -.066 - -.047 -.084 -.084 -
Std.Err - - - - - .303 - - .434 .297 - - .313 .313 .313 - .295 .332 .332 -
*. Correlation is significant at the 0.05 level (2-tailed).
© University of Pretoria

4 - 14
For HRV analysis for each of the baseline stages:
Table 4: HF power and LF/HF ratio at baseline stages
Mean HF power (ms2) Range Mean HF power (n.u) Mean LF/HF
EC1 929.6 250-1170 41.04 ± 20.4 2.64
EO1 840.6 110 – 1925 42.48 ± 20.5 2.12
EO2 750.1 106 – 2690 28.98 ± 16.1 3.82
EC2 1244.3 146 – 4260 41.49 ± 18.6 3.00
No significant correlations between stages were found, however the table above can
be interpreted to mirror that HF power is typically higher in the comparative baseline.
Through the increased LF/HF ratio and declining HF normalised power however we
can see that this is misleading as LF is also higher at this stage (LF/HF) and therefore
reflects a higher level of sympathetic dominance after performances despite higher
HF power.
Summarising point: The overall impression is that globally Alpha and Theta bands
show greater variation between individuals, as well as respective significant
differences before and after improvisation. This might infer a greater recruitment of
these frequency bands during creative expression and more so than that of Beta and
SMR bands which show equal power outputs at both baseline measures. The Delta
response proves ambiguous and non-conclusive while no significant differences or
correlations were found between the original and comparative baselines.
4.4.2 Hemispheric EEG Means
Hemispheric band power means were calculated for laterally designated electrode
sites with the aim of examining the contributions from each hemisphere towards the
global power laid out in the previous section. Within the same perspective, baseline
values are compared, described and correlated for each power band respectively.
© University of Pretoria

4 - 15
A more generalizable trend is noticeable when examining the hemispheric power
contributions. Interestingly, all frequency bands show the right hemisphere to have
greater power (if any differences are apparent) during all stages of both baseline
measures. Therefore, even prior to improvisation all individuals showed a greater
power output arising from the right hemisphere across all spectra. It would be
interesting to investigate whether such lateralized activity is perhaps a consistent
feature for higher creative individuals or musicians specifically, compared to persons
of averaged creative inclination or non-musicians. In conjunction with this all power
bands show very little if any hemispheric dissimilarities in power once the eyes are
opened prior to performance (baseline). However, upon completion hemispheric
divergences are much greater and persists through both eyes-open and eyes-closed
stages. Thus, there is a consistent and obstinate difference in power output between
hemispheres immediately after improvisation, with only the Delta power seemingly
stabilising during EC2, despite showing elevated power levels in EO2.
Figure 21: (I) Alpha and (II) Theta averaged baseline powers for each hemisphere across subjects.
In normalised units(n.u).
© University of Pretoria
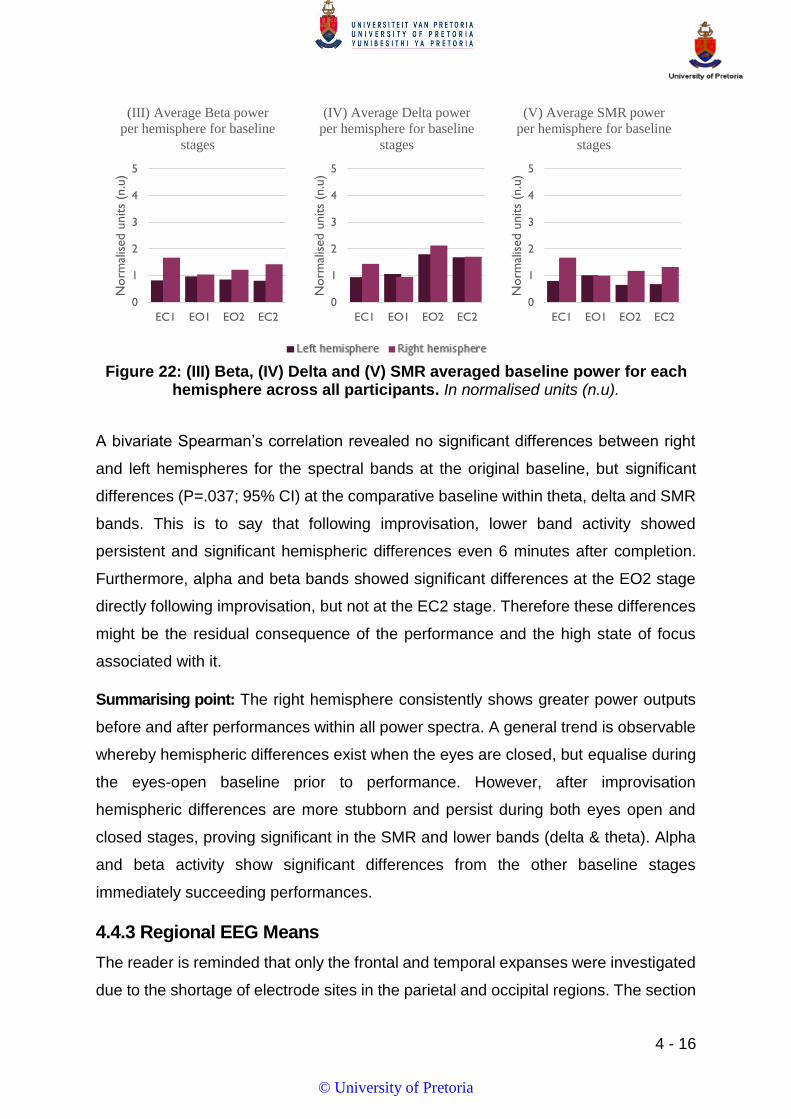
4 - 16
A bivariate Spearman’s correlation revealed no significant differences between right
and left hemispheres for the spectral bands at the original baseline, but significant
differences (P=.037; 95% CI) at the comparative baseline within theta, delta and SMR
bands. This is to say that following improvisation, lower band activity showed
persistent and significant hemispheric differences even 6 minutes after completion.
Furthermore, alpha and beta bands showed significant differences at the EO2 stage
directly following improvisation, but not at the EC2 stage. Therefore these differences
might be the residual consequence of the performance and the high state of focus
associated with it.
Summarising point: The right hemisphere consistently shows greater power outputs
before and after performances within all power spectra. A general trend is observable
whereby hemispheric differences exist when the eyes are closed, but equalise during
the eyes-open baseline prior to performance. However, after improvisation
hemispheric differences are more stubborn and persist during both eyes open and
closed stages, proving significant in the SMR and lower bands (delta & theta). Alpha
and beta activity show significant differences from the other baseline stages
immediately succeeding performances.
4.4.3 Regional EEG Means
The reader is reminded that only the frontal and temporal expanses were investigated
due to the shortage of electrode sites in the parietal and occipital regions. The section
0
1
2
3
4
5
EC1 EO1 EO2 EC2
Norm
alis
ed u
nits
(n.u
)(III) Average Beta power
per hemisphere for baseline
stages
0
1
2
3
4
5
EC1 EO1 EO2 EC2N
orm
alis
ed u
nits
(n.u
)
(IV) Average Delta power
per hemisphere for baseline
stages
0
1
2
3
4
5
EC1 EO1 EO2 EC2
Norm
alis
ed u
nits
(n.u
)
(V) Average SMR power
per hemisphere for baseline
stages
Figure 22: (III) Beta, (IV) Delta and (V) SMR averaged baseline power for each hemisphere across all participants. In normalised units (n.u).
© University of Pretoria

4 - 17
following assesses the specific contributions of these two regions specifically and can
be broken up into four hemispheric variants namely the left frontal (FL), right frontal
(FR), left temporal (TL), and right temporal (TR) regions.
Figure 23 and 24 depicts the subject power means at each baseline stage within all
five frequency spectra. At first noticeable is the seemingly strong association between
FR and TR present in all of the power bands. In fact, taking the averages of all four
baseline stages from all subjects, a bootstrapped correlation matrix comparing the
right frontal and right temporal power bands, reveal extremely significant correlations.
TR and FR baselines values showed remarkable correlations, all significant at the 0.01
level (2-tailed). Although this statistics need to be considered with caution
corresponding TR and FR baseline means for each of the frequency bands showed
significant correlation (P<.01). This high level of correlation exists during all every
stage of the baseline and power band. While it is certain that TR and FR show
continuous association, TL shows constantly lower power outputs compared to the
other regions in all power spectra, while the FL response in all the graphs show
unpredictability and inconsistency between stages.
0
1
2
3
4
5
EC1 EO1 EO2 EC2
NO
RM
ALIS
ED
UN
ITS
(N.U
)
(I) Averaged regional baseline Alpha
power
0
1
2
3
EC1 EO1 EO2 EC2
NO
RM
ALIS
ED
UN
ITS
(N.U
)
(II) Averaged regional baseline Theta
power
Figure 23: Regional baseline power means for Alpha (I) and Theta (II) power bands. In normalised units (n.u).
© University of Pretoria

4 - 18
What is clear however is that there is a very clear and prominent divorce of power
between the regions on a hemispheric level, and is evident when in all the graphs.
Right brain regions (FR and TR) show sustained higher power in following
improvisation compared to the regions on the left (FL and TL). During the comparative
baseline it is clear that there is a distinct difference in hemispheric power output across
all power bands, with those areas on the left showing greater association after
performance but all lower power.
In addition, a general pattern is observable whereby the areas located in the right
hemisphere typically show elevated power in all bands in the comparative baseline
compared to the original baseline, with the power of those areas on the left generally
about the same or lower than initial baseline means following performance.
Furthermore, significant correlations between baselines (EO1/EC2) were found for the
TR region within Alpha and Theta bands (P=.037; 95% CI), FR region within the SMR
band (P=.037; 95% CI), and the TL region in the Theta band (P=.037; 95% CI).
Summarising point: There exists an exceedingly strong relationship between FR and
TR across all spectra and stages (P<.01; 95% CI). The right hemisphere again shows
consistently greater power outputs, especially after improvisation, at which point there
is typically also a better association between left-brain regions but at distinctly lower
power outputs. Therefore, after improvisation frontal and temporal regions show strong
lateral associations but at markedly different power. The temporal region on the left
0
1
2
3
EC1 EO1 EO2 EC2
NO
RM
ALIS
ED
UN
ITS
(N.U
)(III) Averaged regional
baseline Beta power
0
1
2
3
4
EC1 EO1 EO2 EC2
NO
RM
ALIS
ED
UN
ITS
(N.U
)
(V) Averaged regional
baseline Delta power
0
1
2
3
EC1 EO1 EO2 EC2
NO
RM
ALIS
ED
UN
ITS
(N.U
)
(IV) Averaged regional
baseline SMR power
Figure 24: Regional baseline power means for the Beta (III), SMR (IV) and Delta (V) power bands. In normalised units (n.u).
© University of Pretoria

4 - 19
shows a rise in slow-wave power following improvisation and shows correlation within
the Theta band when baselines are compared.
4.5 A DYNAMIC PERSPECTIVE
The Dynamic perspective carries the particular objective of examining the related
shifts and trends of the set out parameters during the actual performance stage
(improvisation). Unlike the Means perspective results are much less generalizable, as
each performance is very subjective and personally expressive, effected possibly by
subjects’ playing style, level of engagement, expertise and the duration of
performance. To draw consistency between the baseline measures and that of the
performance (OF), datasets were spliced into 30 sec epochs, and power estimates
were averaged over a 180 sec windows. This 3 minute window corresponds with the
length of each baseline stage, thereby maintaining consistent intervals throughout
each dataset. A similar top-down modus operandi is employed to the outcomes of this
perspective, starting with the global epoch power normalisations, and refined to
assess both hemispheric and regional power shifts and contributions.
Therefore, the focus within this point of view lies in assessing the performance phase
means with that of the baselines. An investigation of the diverse nature of outcomes
yielded by individually-driven performances that carry little more commonality than the
instrument and genre of music, proved difficult. Data arrays show large differences
and the idiosyncratic core to such doings therefore forces a measure of subtly when
probing the data for cohesive similarities.
4.5.1 Global EEG Dynamics
In order to assess the global undercurrents of performance, each frequency band’s
overall (mean) power was calculated for the improvising performance (OF) and is
reflected in Figures 25 - 26 next to the inactive baselines before and after the session
(EO1 and EO2). Frequency bands have been chronologically ordered from 0 – 35 Hz
and each graph therefore demonstrates the global power distribution (n.u) of each
subject and power band.
© University of Pretoria

4 - 20
Alpha, theta and SMR bands showed significant correlations (P<.04; 95% CI) between
the EO1 and EC2 baselines, while delta and beta bands showed notable positive but
not significant correlations too (P=.104).
There are no immediately obvious similarities between individuals, but there are
however major increases in power across all frequency bands in all subjects (with the
exception of Subject D) compared to baseline. It can therefore be said that a definite
increase in global power is evident during the creative endeavour of improvisation.
These increases vary greatly, with some subjects showing power increase of a 5x
magnitude, whilst others show in excess of 40x greater power fluxes. Most noticeable
are the extremely high increases in the Delta and Theta bands. Taking into account
that EEG signals are generated by the underlying electrical activity of firing neurons,
amplitude, and therefore power, is directly proportionate to the number of firing
neurons. More neurons firing at the same time results in a greater energy output,
resulting in greater amplitude and power. Henceforth, as we see in sleep and
meditative states, low frequency waves with their correspondingly higher amplitudes
become predominant, inferring also a greater synchronicity between firing neurons
that leads to higher energy outputs.
Sleep and deeper levels of meditation and awareness are associated strongly with
delta activity, 3 while theta activity has been shown to be protuberant in daydreaming,
creativity, spontaneity;4 visualization, association and peak performance.5 Both show
great power increases here, which might be in part due to their naturally higher
amplitudes, but the degree to which these lower frequency increase in magnitude,
Figure 25: Band power means for performances (OF) in relation baseline measures for subjects A and B.
0
1
2
3
4
5
6
7
DELTA THETA ALPHA SMR BETA
No
rmal
ised
un
its
(n.u
)Subject A
0
5
10
15
20
25
30
35
40
DELTA THETA ALPHA SMR BETA
No
rmal
ised
un
its
(n.u
)
Subject B
© University of Pretoria

4 - 21
suggests a greater prominence of slow-
wave activity during the improvisation
stages, and therefore a greater level of
synchronicity between active neurons
in the brain.
Increased Alpha power has widely
been reported as being an important
marker for creativity and creative
conducts. Wise 6 describes a state of
strong simultaneous presence of all
power bands during creative inspiration
and peak mental awareness. After
testing a great number of artists,
athletes, high-performing businessmen
and spiritual teachers, Wise found a
distinctive wave pattern that she refers
to as the “awakened mind”, showing
strong expression in all bands from
delta to beta. This ‘state’ is described
as having both intellectual processing
(as governed by beta frequencies), and
deeper meditative and unconscious
connections to memory resources (as
overseen by the theta and delta
waves). High alpha acts as a bridge
connecting the conscious and
unconscious, and may explain the
relationship between creativity and
flow. 3
In light of such findings, Alpha power
shows a definite increase from baseline during these all presented creative sessions
and in all subjects show a definite increase in the comparative baseline (EC2)
compared to pre-performance (EO1). The significance of higher alpha activity resides
0
2
4
6
8
10
12
14
DELTA THETA ALPHA SMR BETA
No
rmal
ised
un
its
(n.u
)
Subject C
0
0.2
0.4
0.6
0.8
1
1.2
1.4
1.6
DELTA THETA ALPHA SMR BETA
No
rmal
ised
un
its
(n.u
)
Subject D
0
5
10
15
20
25
30
35
40
DELTA THETA ALPHA SMR BETA
No
rmal
ised
un
its
(n.u
)
Subject E
EO1 OF EO2
EC2 Poly. (OF)
Figure 26: Band power means for performances (OF) in relation to baseline
measures for subjects C, D and E.
© University of Pretoria

4 - 22
with the strong relationships that have been established between higher alpha activity
and relaxed awareness (viewed as ‘cortical idling’), shifts in consciousness, deeper
creativity, prevention of external disturbance of internal processing states,
visualization and lack of cognitive processing. 3, 4, 5, 7, 8 The fact that heightened alpha
activity endures into the inactive measurements directly after performance could have
significant therapeutic consequences and are explored later.
Summarising point: Global power increases are observable across all power spectra,
showing large power increases in all but one individual during the performance phase.
The lower spectral bands (Delta and Theta) show the greatest power increases during
performance which is typically associated with accessing unconscious information
processing systems in the brain and might play an important factor in the flow
experience. Although not as high as the lower bands, Alpha power also shows
definitive increases across subjects during improvisation and remained still elevated
even 6 minutes after completion, at increased levels compared to pre-performance.
Elevated levels in the comparative baseline might be due to the closing of eyes and
its paired rise in alpha activity.
The dramatically elevated lower bands activity, in conjunction with the elevated alpha
activity during improvisation are the leading findings from this section.
4.5.2 Hemispheric EEG Dynamics
Divorcing the data representation into its synergic hemispheric interaction reveals a
strong slant towards the right hemisphere once again. According to Figure 27 all power
bands show stronger power contributions arising from the right hemisphere, except
peculiarly again for one subject. Creative conduct such as music and art have been
misleadingly ascribed as an exclusive right-brain phenomenon, and it is much better
understood today that creativity is a global phenomenon. However, hemispheric
specialization does describe the designation different functions to each hemisphere.
© University of Pretoria

4 - 23
These graphs represent the power
contributions from each hemisphere
during improvisation and therefore not
where hemispheric activity is symmetrical
or not which is often important for creative
conduct. The proclivity of the right
hemisphere to show greater power
outputs might be explained by the trade-
off between the hemispheres during flow
states, but is not an uncommon theme in
creative research. The left brain has often
been linked to more cognitive activities like
sequential thinking, logic, sense of time,
detail orientation and analytical thinking, 3,
9 all of which are doings that become
diminished during flow. The right brain
however shows attributes of associations,
symbolism, holistic inclinations, aesthetic
senses and intuition. Concurrently, these
are all trade mark of flow states and
creative ideation. Therefore, the strong
power arising in the right hemisphere may
stem from the moderation of left brain
tendencies to process information in a
more cognitive manner, leading to a
greater freedom of the right brain to
express these skills in a non-verbal and
more spontaneous and intuitive manner.
0
1
2
3
4
5
6
7
8
DELTA THETA ALPHA SMR BETA
No
rmal
ised
un
its
(n.u
) Subject A
0
10
20
30
40
50
DELTA THETA ALPHA SMR BETAN
orm
alis
ed u
nit
s (n
.u) Subject B
0
5
10
15
20
DELTA THETA ALPHA SMR BETA
No
rmal
ised
un
its
(n.u
) Subject C
0
0.2
0.4
0.6
0.8
1
DELTA THETA ALPHA SMR BETA
No
rmal
iose
d u
nit
s (n
.u) Subject D
0
10
20
30
40
50
DELTA THETA ALPHA SMR BETA
No
rmal
ised
un
its
(n.u
) Subject E
Figure 27: Hemispheric power distribution for OF per subject and
spectral band. (Pink = left; Purple = right)
© University of Pretoria

4 - 24
Summarising point: The right hemisphere consistently shows greater power yields
across spectra during improvisation in all but one subject. This partiality of the right
brain to express greater power and energy might be due to the information processing
inclinations of this hemisphere. Such preferential tendencies might be a product of
flow or the nature of improvisation itself.
4.5.3 Regional EEG Dynamics
As we move systematically closer to the consideration of flow within the data, the
reader is reminded of the brain architecture and recruitment pertaining to flow and
more generally creative expression, as described in Chapter 2. Regions in the
prefrontal cortex are “involved in making novelty fully conscious, evaluating its
appropriateness, and ultimately implementing its creative expression,” 10 with the
dorsolateral prefrontal regions providing the cognitive input for novelty generation. The
medial prefrontal areas also play a role in spontaneous thought which is more related
to creative thought and increases when cognitive demands decrease. However, even
though the prefrontal region are crucial in processing such already highly-processed
information, flow recruits different brain circuitries that result in a transient
hypofrontality which empowers implicitly driven skills like improvisation to occur at
maximum efficiency without ‘micro-management’ from these frontal regions.
The temporal regions in the brain are strongly associated with auditory functioning and
processing, and it is common knowledge that musicality requires auditory feedback
for effective execution. Additionally, temporal regions border association with the
Broca’s and Wernicke’s areas involved in language, speech, singing and other areas
of communication which are often used to research creative drive and ideations (e.g.
Flatherty11).
At first glance Table 5 (below) might be perplexing. In order to investigate the regional
contributions throughout each performance, it was thought valuable to investigate
each electrode site individually to establish underlying dominance between lead
positions. Scaling the individual electrode power outputs yielded insight into which
sites were expressing higher and lower power returns during improvisation. Power
bands have been grouped (right of table) and cross divided into electrode site (header
row) and subject (first column). For each subject within each band, electrode site mean
power values have been highlighted in a grading colour scale from highest (red) to
© University of Pretoria
4 - 25
lowest (blue). Middle values have no colour (white). Through this assemblage of all
fourteen electrode positions, for each of the five subjects, into the five allocated power
spectra, power distributions from all sites can be visualised as a ‘heat map’ to identify
which regions were most active during the improvising performance (OF) in general.
Furthermore, the table has been schematized so that all electrode sites associated
with the left hemisphere are situated in the left half of the table, and the right
hemispheric sites in the right half. Sequentially all sites in the left brain have been
arranged from rostral to caudal position, starting with the prefrontal site (AF3) and
ending with the occipital site (O1). From here the reverse is true for the right brain sites
which continues from the neighbouring occipital (O2) site and continues to the
prefrontal (AF4) position. Power bands have also been organized from lowest
frequency (delta) to highest frequency (beta).
Immediately visible from the table is again greater power (red) flaring in more cells on
the right half of the table compared to the left, signifying the higher power output from
the right hemisphere as described earlier. Electrode sites F7, F8 and T8 can easily be
identified as showing a uniformly stronger power output across subjects and bands.
Equally, T7, P7 and O1 can be recognised as those sites expressing the lowest power
(blue). This pattern of activation is illustrated in Figure 28, which is a live screenshot
taken from the Emotiv 3D brain activity map during recording. Although this is a
stationary imaging it serves to illustrate the heightened activity (red) at the electrode
sites just mentioned. Equally at the same time, turning the 3D model around shows
lower activity (yellow) in the left temporal, parietal and occipital regions, as identified
from the electrode heat map below. This pattern of activation was discernible for all
subjects deep into their respective performances. From the image, low (green) level
of activity are also observable in the prefrontal areas, consistent with flow conditions.
© University of Pretoria

Table 5: A 'heat map' of each electrode site and its global power mean for the performance stage (OF) of each participant (A-E) as normalised against the baselines (EO1).
4 - 26
AF3 F7 F3 FC5 T7 P7 O1 O2 P8 T8 FC6 F4 F8 AF4
DE
LT
A
A 3760 23638 1825 3309 2153 943 1241 2005 4278 17407 7447 2201 22279 6078
B 9602 78720 8658 12502 13095 13219 10638 23540 22660 32578 17805 21903 67917 26106
C 39636 74492 7266 18817 84113 14173 3925 6574 25117 151542 55157 6705 131581 62660
D 4935 19086 803 2693 1428 1465 2045 937 1209 15114 5938 1629 52982 4103
E 30830 22870 18100 30087 10071 11721 5688 18530 1304 6054 2142 10799 26034 40610
AF3 F7 F3 FC5 T7 P7 O1 O2 P8 T8 FC6 F4 F8 AF4
TH
ET
A
A 344 887 206 206 89 56 131 202 253 478 433 206 1029 464
B 403 3290 362 506 695 277 359 488 629 1128 1004 694 1971 552
C 949 1712 1253 341 976 228 118 342 681 3121 607 333 2211 511
D 538 625 155 202 140 109 112 245 273 490 521 311 3568 583
E 15079 10092 9156 10682 225 216 557 1824 78 224 443 2355 904 23569
AF3 F7 F3 FC5 T7 P7 O1 O2 P8 T8 FC6 F4 F8 AF4
AL
PH
A
A 122 201 89 73 59 37 80 127 149 233 159 94 256 139
B 282 731 226 253 396 163 313 402 432 478 391 322 691 391
C 282 398 595 176 327 161 149 381 516 1166 380 222 630 270
D 687 410 298 261 137 121 143 459 442 578 578 558 1769 737
E 7961 5302 3797 5610 76 97 334 849 71 124 231 1287 353 12425
AF3 F7 F3 FC5 T7 P7 O1 O2 P8 T8 FC6 F4 F8 AF4
SM
R
A 56 75 43 38 41 25 44 73 88 102 70 46 93 60
B 144 265 114 119 316 115 235 250 297 278 209 169 303 206
C 133 195 311 141 239 105 75 191 324 661 237 130 282 149
D 102 86 33 46 86 34 34 96 84 130 83 60 466 83
E 4451 2920 1804 3110 36 42 154 459 39 65 113 677 127 6685
AF3 F7 F3 FC5 T7 P7 O1 O2 P8 T8 FC6 F4 F8 AF4
BE
TA
A 112 123 79 82 123 55 68 116 182 189 124 84 145 103
B 270 302 180 237 801 239 449 445 548 488 345 254 428 323
C 304 493 617 462 634 311 208 458 800 1146 645 369 640 401
D 191 171 58 93 277 72 66 178 178 272 156 100 605 146
E 4645 2961 1627 3183 59 63 188 470 60 102 134 689 146 6754
© University of Pretoria

4 - 27
Summarising point: Electrode sites F7, F8 and T8 show greatest power outputs across
participants, especially in the lower range frequencies. These sites stand in strong
contrast with that of the T7, P7 and O1 which show the lowest power yields. This hints
towards the lateral frontal and right temporal regions playing a much more significant
role during improvisation. Likewise, left temporal, parietal and occipital regions show
lower power yields and might therefore be recruited less or are not so much involved
within this domain of creative expression. Medial frontal (F3 & F4), together with
prefrontal (AF3 & AF4) show moderate to moderately low power outputs which is
consistent with the conception of a hypofrontality occurring during creative peak
performance.
4.5.4 HRV dynamics
Figure 29 & 30 shows the HF and LF values for each subject over the duration of each
performance, including baseline values (first and last 6 min). Normalised HF and LF
(primary vertical axis) and LF/HF (secondary vertical axis) have been plotted over time
(horizontal axis). Trend lines were ascribed to each dataset and were based on a
polynomial trend of order = 6.
HF represents an almost pure indicator of parasympathetic influence from the ANS on
the heart, which typically slows the heart response and rate. LF is not a pure indicator
of sympathetic activity however, but rather a mix of both para- and sympathetic effects,
though slanted towards sympathetic influence. LF/HF is therefore a simple ratio of the
interactive relationship between these synergistic branches of the ANS.
Figure 28: A snapshot taken from the Emotiv EPOC 3D brain activity map during recording.
High activity in the frontal and right temporal regions. Low activity in the left temporal, parietal and occipital regions can be seen in the image.
© University of Pretoria

4 - 28
Similar trends were observe in
most participant and were not
atypical to what would be
expected from the testing
situation. Two subjects (Subject
C & D) did however reported
feelings of anxiety and have
been grouped together in Figure
30 as we therefore see two
groups of very different HRV
responses.
During baseline stages, where
the subject would be sitting in a
passive and resting state, the
normal grouping showed
expectantly higher levels of HF
power. HF power showed
higher or equal measures
(mean= 1305.3 ms2) to that of
LF where the mean LF/HF ratio
was 0.93 (SD=0.39). In the
anxious subjects however the
ratio of LF/HF averaged around
4.5 (SD= 1.7) for baseline
stages (mean HF power= 254.7
ms2). Therefore, even prior to
performance the anxious
subjects were already in a highly
sympathetic state, and from
Figure 30 we can see that this
hardly changed during
performance with these
subjects showing continuously
0
2
4
6
8
10
12
14
0
20
40
60
80
100
00
:00
02
:30
05
:00
07
:30
10
:00
12
:30
15
:00
17
:30
20
:00
22
:30
25
:00
27
:30
30
:00
32
:30
LF/H
F ra
tio
HF
and
LF
po
wer
(n
.u)
Time
Subject A HRV
0
2
4
6
8
10
12
14
0
20
40
60
80
1000
0:0
0
03
:30
07
:00
10
:30
14
:00
17
:30
21
:00
24
:30
28
:00
31
:30
35
:00
38
:30
42
:00
45
:30
49
:00
LF/H
F ra
tio
HF
and
LF
po
we
r (n
.u)
Time
Subject B HRV
0
2
4
6
8
10
12
14
0102030405060708090
100
00
:00
03
:00
06
:00
09
:00
12
:00
15
:00
18
:00
21
:00
24
:00
27
:00
30
:00
33
:00
36
:00
39
:00
42
:00
45
:00
LF/H
F ra
tio
HF
and
LF
po
we
r (n
.u)
Time
Subject E HRV
HF Power n.u LF Power n.u LF/HF
Figure 29: HRV data for Subjects A, B & E (normal). High frequency (HF), low frequency (LF) components & the ratio of LF/HF for each 30 sec of
each performance are shown. All values are normalised
© University of Pretoria

4 - 29
low HF power throughout. Low parasympathetic influence in these individuals might
impact on their performances as feelings of nervousness, and therefore elevated
sympathetic influence could affect focus, breathing rates, emotions and flow.
In the normal subjects, slight
shifts occur during
performances compared to prior
and following baseline
measurements. Typically, as
mentioned, a LF/HF ratio lower
or equal to 1 is measure prior to
performance, with a rapid
declined in HF power occurring
when improvisation is
commenced, followed by a
steady increase in HF power
towards the latter half of
performance and the
subsequent measures at rest
following its conclusion. The
LF/HF trend line demonstrates
such changes quite clearly.
Upon initiation of performance,
the LF/HF ratio shifts quite
sternly in favour of LF power
(sympathetic activation) as
would be expected from a
person moving and actively engaging the task at hand, typically peaks around 15 – 25
minutes into all performances. However, after peaking there is a gradual decline in LF
power, showing a growing influence in parasympathetic stimuli the heart. The growing
presence of the parasympathetic system as the performances continues on might
carry significance and is readdressed later.
0
2
4
6
8
10
12
14
0
20
40
60
80
100
00
:00
02
:00
04
:00
06
:00
08
:00
10
:00
12
:00
14
:00
16
:00
18
:00
20
:00
22
:00
24
:00
26
:00
28
:00
LF/H
F ra
tio
HF
and
LF
po
we
r (n
.u)
Time
Subject C HRV
02468101214
0
20
40
60
80
100
00
:00
03
:00
06
:00
09
:00
12
:00
15
:00
18
:00
21
:00
24
:00
27
:00
30
:00
33
:00
36
:00
39
:00
42
:00
LF/H
F ra
tio
HF
and
LF
po
we
r (n
.u)
Time
Subject D HRV
HF Power n.u LF Power n.u LF/HF
Figure 30: HRV data for Subjects C & D (anxious). High frequency (HF), low frequency
(LF) components and the ratio of LF/HF for each 30 sec of each performance are shown.
© University of Pretoria

4 - 30
Table 6: Mean HF power and standard deviations for all participants
4.6 A BIASING PERSPECTIVE
Flow is a very subjective experience of strongly positive emotions paired with
heightened creativity, peak performance and sharp focus. Its meditative and trancelike
properties allow the individual to become so engrossed in their conduct that their
behaviour becomes almost automated and intuitive. An implicitly driven state that
allows for the maximal expression of embedded and highly practised skills without the
need for higher executive cognition.
It is for these highly idiosyncratic qualities of flow that a biasing perspective was built
into this investigation. The ‘bias’, however, lies only in approximating where in each
performance the subject experienced flow, i.e. the locus for investigation, and was
never biased in its interpretation. Subjects were asked after each performance about
their feelings toward their performances and whether and when they had experienced
flow or flow-like states while playing. Their feedback was combined with notes taken
by the investigator regarding the perceived ease-of-play, sense of enjoyment,
noticeable positive affect in facial and body language, and predicted flow occurrence
scores. Collectively the subject feedback, and subjective investigator assessment
notes were combined with data clarity and audio/video reviews to isolate segments of
each performance that carried the strongest possibility of flow. The objective in this
regard was to evaluate these windowed or designated ‘flow-zones’ for trends and
comparable differences in interpretation of whether flow might present with
quantifiable or discernible fluxes in spectral power. The areas were marked for each
Table key E1 OF E2
LF/HF HFpower
(ms2) LF/HF
HFpower
(ms2) LF/HF
HFpower
(ms2)
Mean SD Mean SD Mean SD Mean SD Mean SD Mean SD
0.93 0.4 1305 602 4.56 1.7 255 104 2.38 2.2 885 746
3.24 0.3 264 113 9.30 2.6 48.2 .03 5.66 3.6 177 142
1.63 1.0 1571 1588 6.09 0.8 137 33 3.41 2.5 997 1407
Normal subjects Anxious subjects All subjects
© University of Pretoria

4 - 31
performance, and developments in the data in, and around the windowed flow-zones
were described.
It should be stressed once more that the bias here lied only with designating at what
points in time assessment should be conducted based on subjective and qualitative
information sources. Identifying these moments in time was done prior to any
examination or preparation of the data. If no significant or discernible changes or
difference were observable, the selection stood and findings were reported as is. No
alterations or tempering of these designated areas were done to better suite the data,
salient events in it or any preconceived notions of what the data was supposed to
reflect. In essence therefore, a few markers in the data were demarcated based on
individual feedback and qualitative investigator notes during/after improvisation and
subsequently investigated and described. These areas were surveyed for potential
events or fluctuations in brain activity that could have been caused by the flow
experience. This perspective carries the aim of bridging the subjective experience on
behalf of both the subject and researcher, with the empirical and objectively
presentable data and never to highlight the data that best suited the conditions,
prerequisites and ideologies of flow. Such a bias would be intolerable and critically
damaging to the integrity of both this study and flow research in general.
A dynamic and progressive trending of the real-time data is presented here that
accurately reflects the moving averages of brain waves and HRV powers at 30 second
and 180 second frames. The need for such a dynamic representation of the data is
motivated from a critical viewpoint. Due to the high temporal resolution of the EEG it
is deceivingly easy to be misled into trusting a snapshot or freeze-frame image
(moment in time of a given dataset) as an accurate representation of the totality of a
dataset. Therefore, the biasing outlook presented here aims to capture the full
performance with all the changes happening across spectra, over time, and in turn to
focus on the identified flow-zones to assess whether there are noteworthy changes
surrounding these moments in time.
During each performance, events that could be important or of value in assessing the
data were marked and time stamped. These events included contextual events, such
as possible distractions, excessive movements or vocal noises; subjective events like
perceived ease-of-play or noticeable positive affect and body language that might
© University of Pretoria

4 - 32
portray positive emotions (like smiles, or enjoyment); and data specific events like
visible amplitude shifts in the real-time windowing, spindle-like waveforms or noise.
Spindle-like waveforms that are typically present during sleep was noticed by the
investigator in more than one subjects during performances, and could be investigated
in future.
In Figure 31 (below) events and markers indicative of the potential occurrence of flow
were plotted for each minute, as noted, marked and reported through individual
feedback during/after each performance. A summation of these events were used to
identify moments during each performance that subjects might have been in flow.
Along these lines, determination of flow zones were not purely advocated by feedback
received from participants. The main reason for this is that it is difficult to quantify with
accuracy, the duration that a participant is in a flow state. One of the traits of flow is
the perceptive loss of time on behalf of the individual and therefore participants were
often able to approximate when they were in flow but not for how long. In consideration
of this, subjective feedback was amended with supporting evidence from notes made
by the investigator, events in the data (e.g. spindle-like waveforms) and contextual
markers (e.g. possible distractions; noticeable positive affect), as already mentioned.
No objective measurement of flow exists at present and a combination therefore of
subjective and investigative comments were used to define flow-zones.
Peaks portrayed in Figure 31 were again weighed against subjective feedback and
visual/audio recordings, and were concurrently highlighted and windowed in Figure
32. To particularised this matter, Figure 31 set out a mixed criteria whereby flow-like
characteristics and experiences were identified during performances and thereby
constituting the biasing focal point for investigation. These windows were then
highlighted in the graphs of Figure 32 that represent a dynamic outlook of each power
band over time within each participant. Values were averaged for every 180 seconds
as recorded during each subjects’ improvising performance. Values have been
normalised against the baseline values for each band and hypothetical flow zones
shaded in purple.
© University of Pretoria

4 - 33
0123456
01
:00
03
:00
05
:00
07
:00
09
:00
11
:00
13
:00
15
:00
17
:00
19
:00
21
:00
23
:00
25
:00
27
:00
29
:00
31
:00
33
:00
Subject A
0123456
01
:00
03
:00
05
:00
07
:00
09
:00
11
:00
13
:00
15
:00
17
:00
19
:00
21
:00
23
:00
25
:00
27
:00
29
:00
31
:00
33
:00
35
:00
37
:00
39
:00
41
:00
43
:00
45
:00
47
:00
49
:00
51
:00
Subject B
0123456
01
:00
03
:00
05
:00
07
:00
09
:00
11
:00
13
:00
15
:00
17
:00
19
:00
21
:00
23
:00
25
:00
27
:00
29
:00
Subject C
0123456
01
:00
03
:00
05
:00
07
:00
09
:00
11
:00
13
:00
15
:00
17
:00
19
:00
21
:00
23
:00
25
:00
27
:00
29
:00
31
:00
33
:00
35
:00
37
:00
39
:00
41
:00
43
:00
45
:00
Subject D
0123456
01
:00
03
:00
05
:00
07
:00
09
:00
11
:00
13
:00
15
:00
17
:00
19
:00
21
:00
23
:00
25
:00
27
:00
29
:00
31
:00
33
:00
35
:00
37
:00
39
:00
41
:00
43
:00
45
:00
Subject E
Perceived-ease-of-play Positive affect/gestures
Predicted flow Reported flow
Spindle-like waveforms Noticeable amplitude shifts (live)
Figure 31: Summation of contextual, subjective and data-specific events as noted and reported by both subject and investigator for each performance.
© University of Pretoria

4 - 34
Based on the narrative thus far, the windowed zones highlighted in Figure 32 thereby
serve as indicators of when flow was encountered, but the width of each window is
thus not directly proportionate to its duration. These windowed flow zones might have
been longer/shorter, overlap with neighbouring zones or be part of the same
continuous flow experience were they pure indicators of the complete experience. As
already motivated, a statistical analyses approach of correlating the slopes of each
power band with each other and that of HRV within these flow windows was
considered and rejected for the above mentioned reason. In this regard, it makes more
sense to objectively look at the overall trends that are happening within the data at
these moments in time, rather than describing the data that fall only within the bounds
of each window.
Composite graphs are presented with both EEG and HRV data depicted on them. The
statistical method incorporated here are based on correlative matrices again along the
Spearman Rank Order correlations. Two sets of matrices had specifically been
constructed for this section based on time and within-subject data sets. The
corresponding graphs presented in this section are plotted on 3 minute intervals
however in order to make the statistical data more functionally valid only the first 30
minutes of each dataset, excluding baseline, was used.o In addition, constructing
matrices based on each 30 second intervals proved to be too great and a condensation
around every 6 minutes of data was prepared instead. Therefore, the data was
averaged at five intervals (at 6, 12, 18, 24 and 30 min) and the spectral elements for
each subject were correlated against each other at these interludes.
In much the same manner, subjective matrices involved the cross correlation of
spectral bands for the total duration of each performance within each subject’s dataset.
Given how many variables were at play, variables were reduced to the five different
spectral elements of the EEG (delta, theta, alpha, SMR, and beta power) and only the
high frequency (HF) component of HRV. HF was targeted as the primary locus for
investigation of HRV due to the facts that HF is a pure indicator of parasympathetic
influence on the heart,p its previous correlation with EEG power bands in other
o Some performances continued for longer, but later times would therefore not reflect all datasets, reducing the N score and therefore its reliability as being representative of the total population. p LF was excluded due to it not being a pure indicator but rather under mixed influence from bot parasympathetic and sympathetic outflow.
© University of Pretoria

4 - 35
research, 12 and the hypothesised notion that its intensification demonstrate the
occurrence of flow.
4.6.1 Global trends
As clarified above, each subject’s full performance (including EO1) have been
graphically illustrated in Figure 32. Windowed ‘flow-zones’ have been shaded in purple
and all spectral bands including HF (HRV) data are plotted. These graphs illustrate the
variables at 6 minute intervals as was used in the statistical analysis, with the
exception of the baseline (EO1) which is labelled at 3min. Due to the fact that some
performances were longer than others, only the first 30 minutes of each were used for
statistical purposes, however the full duration from each subject has been graphically
illustrate d. As all graphs are represented in normalised values, EO1 is a 1 n.u values
for all parameters including HF (secondary axis).
Figures 32 can clearly be seen to demonstrate a high level of variance between
individuals with very little commonality or similarity. Essentially however, all graphs
show substantial peaks across spectra, especially within the delta and theta bands.
These peaks attest to major power increases that arise from equally great amplitudes
upsurges within these frequency bands. In some cases these increases are of
magnitude greater than 100 fold and in the case of one subject (D), power values
across performance are lower than the baseline means (as was apparent in section
4.5.1). Therefore it is clear, at least off the bat, that improvisation resulted, on some
level, in an upsurge in cross spectral power especially within the lower power bands.
Focussing then on the highlighted flow zones, general trends of overall increases can
be observed across all bands, however delta and theta show greatest intensifications
through these windows. When observing Subject A, B and C, these intensifications
are most evident. The indicated flow-zones show great concomitance with these chief
peaks and the most major amplitude shifts throughout each of the five performances.
On this front, one could be led to believe that perhaps the flow-states experienced at
those moments in time evoked such major increases, which in some cases correspond
to more than an 80 fold increase in power (Subject B & E in particular).
© University of Pretoria
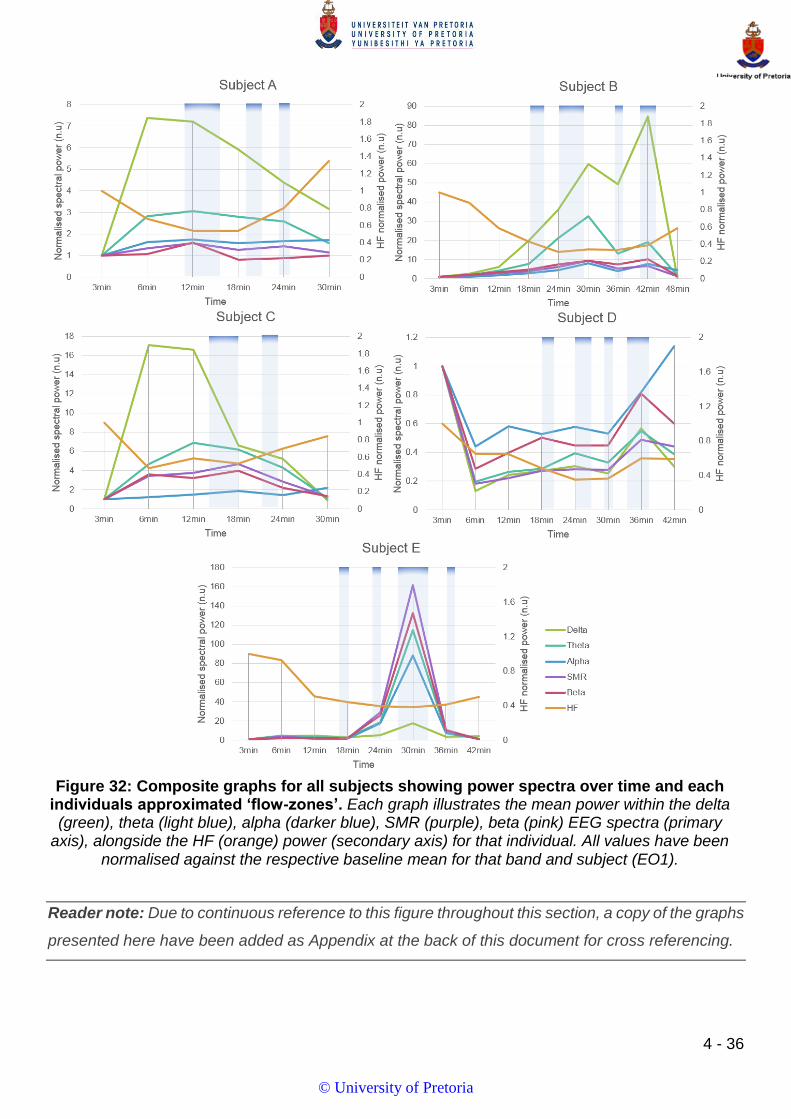
4 - 36
Reader note: Due to continuous reference to this figure throughout this section, a copy of the graphs
presented here have been added as Appendix at the back of this document for cross referencing.
Figure 32: Composite graphs for all subjects showing power spectra over time and each individuals approximated ‘flow-zones’. Each graph illustrates the mean power within the delta (green), theta (light blue), alpha (darker blue), SMR (purple), beta (pink) EEG spectra (primary
axis), alongside the HF (orange) power (secondary axis) for that individual. All values have been normalised against the respective baseline mean for that band and subject (EO1).
© University of Pretoria

4 - 37
Were it the case that flow was responsible for major increases in amplitude across
spectra, such findings could prove to be of great significance. The reader is reminded
that there is an expected difference in amplitude across the differing frequency ranges,
with lower frequencies typically showing higher amplitudes by default. However in the
resulting graphs posed here, values have been normalised against the respective
baseline mean, which in basic terms implies that the values on display are ratios of
that baseline, qualifying bands with naturally different amplitudes to be comparable.
Additional, a 1 n.u increase translates to a 1-fold increase. Therefore, the fact that
individuals are producing power shifts of such magnitude, which is directly comparable
to the inactive baseline, must carry meaning.
As mentioned also, slower wave activity is chiefly generated during more unconscious
states of awareness like sleeping (delta) and deeper meditative states (theta). Activity
manifested in the delta and theta ranges infer greater synchronicity amongst active
neuronal responses as would be the case where an individual was sleeping, as
opposed to the erratic higher frequency signals generated by more active, conscious
states of awareness. Therefore, these principal increases in the low frequency bands
during identified flow zones could be interpreted as greater global synchronicity of
brain activity occurring at these moments. In and around most of the highlighted flow
windows there are either already elevated power or an escalating gradients noticeable
in most bands, with the lower frequency bands generally showing the greatest upturns.
It can further be remarked that the tendencies of cross spectral power increases during
these chief peaks in each graph reflects an upturn in frequency power associated with
both conscious and unconscious processing. Such collective augmentation across
spectra and its association with peak mental performance and creative inspiration has
been put forth by Wise, 6 during a state which the author refers to as the “awakened
mind”. Such a state is described as having a distinct configuration of joint increases
across all bands and was shown to over hundreds of EEG recording of individuals
during high performance states. Such a specific configuration was hard to isolate in
our findings but global increase across all bands are positively discernible in most
cases reported here.
© University of Pretoria

4 - 38
A bootstrapped correlation matrix was constructed based on the power within each
band across participants at a given time. This was done in order to assess whether
there were significant relationships across the population at each time interval. Table
7 puts forth all significant correlations found for the sampling population.
Corroborating these correlations with the graphs in Figure 32 reveals a few apparent
underlying patterns. The first 12 minutes of data shows the same correlations, namely
the significant associations between delta and theta, theta and SMR, and SMR and
beta (p=.037; 95% CI). Reflecting this finding against Figure 32, it is easy to see this
relationship. During the initial 12 minutes delta and theta show similar trending
increases, while SMR and beta show similar responses. Here within we see a
correlative relationship between the lower and higher spectral ends.
Interestingly, over the next 12 minutes (i.e. 12 – 24) there are significant correlations
between beta and all the other EEG band at the 18 minute mark, which is mirrored
again at 24 minutes, except here SMR shows correlation with all other bands too (beta
excluded). Towards the half hour mark, theta shows correlation with all other power
bands. No significant relationships were found to pair with the HF components.
In order to better understand these seemingly arbitrary relationship, a hypothetical,
simple stacked area chart was conceived graphically illustrate these findings. Although
the chart has no meaning per say, it helps to visualise these findings in a manner that
help describe the underlying shifts. By ascribing an imaginary value of 1 unit to each
of the bands for every significant relationship found, the chart (Figure 33) brings forth
interesting possibilities.
© University of Pretoria

Table 7: Significant correlations between power spectral at specific time intervals during improvisation – Spearman’s Rho
4 - 39
6 minutes 12 minutes 18 minutes 24 minutes 30 minutes
δ θ α S β δ θ α S β δ θ α S β δ θ α S β δ θ α S β
δ CC .900 - - - .900* - - - - - - .900* - - .900* .900* .900* - - -
Sig. .037 - - - .037 - - - - - - .037 - - .037 .037 .037 - - -
N 5 - - - 5 - - - - - - 5 - - 5 5 5 - - -
Std.Err .297 - - - .273d - - - - - - .268d - - .313d .313d .320d - - -
θ CC .900 - .900 - .900* - .900* - - - - .900* - - .900* .900* .900* .900* .900* .900*
Sig. .037 - .037 - .037 - .037 - - - - .037 - - .037 .037 .037 .037 .037 .037
N 5 - 5 - 5 - 5 - - - - 5 - - 5 5 5 5 5 5
Std.Err .297 - .306 - .273d - .284d - - - - .268d - - .313d .313d .320d .301d .301d .301d
α CC - - - - - - .900* - .900* - .900* - -
Sig. - - - - - - .037 - .037 - .037 - -
N - - - - - - 5 - 5 - 5 - -
Std.Err - - - - - - .268d - .276d - .301d - -
S CC - - - .900 - .900* - .900* .900* .900* .900* .900* - - .900* - -
Sig. - - - .037 - .037 - .037 .037 .037 .037 .037 - - .037 - -
N - - - 5 - 5 - 5 5 5 5 5 - - 5 - -
Std.Err - - - .269 - .284d - .295d .306d .313d .313d .276d - - .301d - -
β CC - - - .900 - - - .900* .900* .900* .900* .900* .900* .900* .900* - - .900* - -
Sig. - - - .037 - - - .037 .037 .037 .037 .037 .037 .037 .037 - - .037 - -
N - - - 5 - - - 5 5 5 5 5 5 5 5 - - 5 - -
Std.Er - - - .269 - - - .295d .268d .268d .268d .306d .313d .313d .276d - - .301d - -
*. Correlation is significant at the 0.05 level (2-tailed).
© University of Pretoria

4 - 40
In the fabricated chart above an imaginary value of 1 unit was allocated to each power
band for every significant correlation that was found linked to it. What the chart
illustrates is firstly, the increased number of correlative relationships over time,
implying that the longer improvisation went on, the more cross band activity started
showing significant relationships. Secondly, following the timeline we can see that
between 12 -24 minutes beta activity showed more correlations than any other band
(correlation found with all other bands). In light of this, it does not make sense to think
of it as one entity (beta) correlating with several completely different arrays of data,
but instead that the reverse was true and that the other bands’ activities were in fact
correlating with beta between these times. Therefore, beta activity might the governing
frequency during this time. Along the same lines, we see the growing presence of
alpha within this midterm period, however towards the half hour mark theta band
activity starts showing much greater prominence, exemplified by the amount of
correlations involving theta. Therefore, perhaps the chart suggests that during the first
10 - 15 minutes of performance we have a predominance arising from the higher
frequencies (beta and SMR), associated with high focus, cognitive processing,
creative ideation and sensorimotor integration. Succeeding this is the growing
presence of alpha, often described as a bridge between high and low end activity and
0
2
4
6
8
10
12
6 12 18 24 30
Imag
inar
y u
nit
s (u
nit
s)
Time
Correlation chart
Delta Theta Alpha SMR Beta
Figure 33: A fictitious, stacked area chart visually illustrating the number of significant correlations found per spectral band at different time intervals
(6 minutes).
© University of Pretoria

4 - 41
diversely pronounced in the creativity research literatures, around 15 - 20 minutes.
Building on this then, the dominance continues to shift lower towards the theta
frequency range as lower band activity starts showing greater significant influence on
the other bands, hinting towards a more unconscious, trance-like perspective
experience that we might describe as flow. Such a relationship between the different
spectral bands are most likely not of a linear nature, however in all except one subject
theta does show a strong presence progressively build in power as the performance
continues. Alas, the correlations above are based on the population’s means and are
less pragmatic when applied directly to any individual dataset.
There is however perhaps some support to be found from the individual graphs put
forth in Figure 32, in that subjects typically show the first occurrences of flow arising
around the 18 minute mark and manifesting sporadically thereafter over the 24 – 30
minutes intervals. Furthermore, in section 4.5.4 it was put forth that LF/HF ratios
peaked for all subjects between 15 -25 minutes before declining for an unknown
reason. Therefore, at the same time that theta band shows greater correlative
significance, subjective flow was reported while simultaneously a decline in LF/HF (i.e.
rising HF, declining LF) was observed. The matter is particularised in the integrated
discussion of Chapter 5.
4.6.1.1 Friedman analysis
When considering the high amount of processing and processing steps incorporated
in the study, especially given the small sample size and the need to average out large
quantities of data points in order to detrend and break the data down into more
manageable chunks, any statistical interpretation needs to be considered with caution.
Simple correlation methods have been employed to substantiate the descriptive
exploratory approach taken by this study, and for this reason a Friedman test was also
included as a non-parametric alternative to assess the level of variance between time
intervals given the small sample size.
From the Friedman Mean Rank only two bands showed meaningful or notable
significance between their respective periods. The HF component for HRV showed
asymmetrical significance at P=.015, while the Theta bands showed notable
mathematical differences just above the significance cut-off (P=.065).
© University of Pretoria

4 - 42
In order to assess where the significance lied within the ranks, i.e. which intervals
contributed the most variance, a post hoc analysis in the form of a Wilcoxon Signed
rank was calculated. However, the post hoc analysis was unable to reveal where, due
to high number of variables. This is to say that due to the high amount of time intervals
considered, the Bonferroni adjustment resulted in a very small P-value (0.005/7 =
.0007) and consequently could not reveal between which ranks the significance lied.
Although not significant and inconclusive, the Wilcoxon Signed Rank seemed to
suggest (based on the lowest significance scores) that the greatest variations lied
between 6 and 18 minutes, 12 and 18 minutes, and 24 and 30 minutes for HF (P=.188);
and between 18 -24 minutes, and 18 – 30 minutes for the theta band (P=.188).
Were this the case, and more specifically towards that of the theta band, if it were true
that the greatest variation, and therefore most significant variation for theta occurred
between 18 and 24 minutes, this would coincide not only with most subjects’
approximated flow-zones but also concur with most of the findings put forwards up to
this point. This could lend valuable insight into theta band activity playing a prominent
Figure 34: Friedman Mean Ranks tables with test statistics for HF (I) and Theta (II).
(I) (II)
© University of Pretoria
4 - 43
role in the conduction and manifestation of flow during improvisation and higher
creative behaviour.
Summarising point: The dynamic power graphs above revealed salient power shifts
within each separate dataset. These major power peaks directly translated to massive
amplitude upsurges over those periods in time and such increases were typically found
across all power bands, though more so in the lower frequency ranges (delta and
theta). Approximated flow-zones show high concomitance with the biggest observable
peaks in all subjects, leading to the consideration that these chief amplitude shifts
might be a product of the flow and its trance-like properties. In addition, an exploration
of the correlative relationships between the power bands values across the population
at different time intervals revealed the possibility of flow being induced by the high
numbers of correlational and perhaps coherent engagement with the theta band.
Unfortunately no correlations were found between the EEG and HRV spectra, however
significant correlations were found between theta and HF in two individuals (P=.037).
Moreover, a Friedman test revealed significant variations within the HF band (P=.015)
with the differences between 6 and 18 minutes, 12 and 18 minutes, and 24 and 30
minutes seemingly showing the greatest variations. In much the same manner,
although not significant, a high degree of variance within the Theta band (P=.065) was
also detected, and seemed to lie chiefly around the 18 – 24 minute interval, hinting
once more at the Theta band playing an important role in the transmission of the flow
state. Furthermore, the aforementioned findings coincide with a decline in LF/HF as
reported in section 4.5.4.
4.6.2 Regional trends
Ensuing examination of the frontal and temporal regional power contributions in and
around the designated flow-zones revealed some interesting trends. In light of the
limited number of electrode sites in other areas on the headset configuration, the
frontal and temporal regions continue to be the main focal areas, and therefore
remains a gross correlate to these specified regions. From the earlier deliberations in
section 4.5.3 it was evident that the F7, F8 and T8 sites contributed the largest
amounts to the major power shifts and themes in the data. In context of the biasing
inquisition of this perspective, these findings prompted the examination of these
regions and whether their prominence could be associated with the drifts in these flow-
related time frames.
© University of Pretoria

4 - 44
Examining the regional contributions in all power bands and individuals during the
designated flow-zones revealed, foremost, the predominance of the right temporal
region in all bands and also across all participants. In this regards, the dextral temporal
region generated higher power outputs compared to any of the frontal or other regions
in almost all power bands and was consistent across all participants except Subject E.
This individual also showed an elevated power output in this region but it was not the
higher and other regions showed superior power.
Examination of the individual regions for all spectral arrays in each participants yielded
a generous amount of graphs, all of which did not carry noteworthy revelations and
the most relevant findings are therefore presented in bullet point form below instead.
The main finding are as follow:
• In all individuals, the right temporal (TR) region shows higher power outputs in
almost all bands compared to the other regions.
• TR shows peak power outputs in concomitance with the highlighted flow zones.
Thus, there is an association between flow-zones and major amplitude shifts in
the TR region across subjects.
• All individuals show raised theta levels in all frontal and temporal regions,
showing hemispheric convergences during flow-zones, especially in the left
hemisphere. Such convergence infers that activity shows strongly similar
patterns in its peaks and valleys.
• Alpha band shows consistent peaks with approximated flow zones across the
frontal and temporal regions in all subjects.
• SMR and beta bands show very similar activity patterns.
• Delta band power is strongest again in TR and shows mixed responses in
subjects.
• Subject C typically shows looser associations between hemispheric regions
compared to the other subjects. Higher frequency bands in this subject show
greater cohesiveness than lower bands. Objectively Subject C was also the
lesser experienced performer in the sample group. This might point to some
aspects of expertise.
© University of Pretoria
4 - 45
Summarising point: In all individuals, the right temporal (TR) region shows higher
power outputs compared to the other regions. The greatest of these amplitude shifts
within the TR region tend to occur around close to the approximated flow-zones within
each respective subject subset. Alpha activity also shows trending elevations during
flow-zones in the frontotemporal regions, while elevated theta levels are also observed
in these regions. Differences between the temporal and laterofrontal regions seem to
equalise on both sides of the brain during flow-zones. This is to say that the possibility
exists that there is an entrainment of activity in these regions during flow, especially in
the left hemisphere, but such a notion would be assumptive. In addition, there seems
to be a level of entrainment occurring between regions in the delta band in and around
the windowed flow-zones. Findings suggest expertise and experience might play a
role in the strength of associations between frontotemporal regions.
4.7 OVERALL FINDINGS
The analytical approach taken in this exploratory, investigative study was one that
embodied just that. In a top-down manner the global, hemispheric and regional
contributions to the spectral power generated during improvisation and the baseline
measures made before and after, were assessed. This hierarchical approach was
maintain through three divergent perspectives that helped to compartmentalise and
systematised the complex and generous amount of data generated during testing. The
complexity of the data captured, processed and presented, together with the small
sample size constituted a more descriptive outlook, and statistically found correlations
were presented where found. In this chapter many findings have been reported, some
statistical and some purely of descriptive nature, but taken together the main
observations and overall findings of the study can be made as follow:
The right hemisphere was found to elicit consistently and significantly higher
power during the original baseline, improvisation phase and during the
comparative baseline following performance. This elevated power was unfailing
in all power spectra of the EEG and was found in all but one of our subjects.
Therefore, the sustained prominence and stable presence of the right
hemisphere during creative behaviours such as musical creativity and
improvisation is once more found and supported.
© University of Pretoria
4 - 46
The theta band did not just show elevated power across all participants during
improvisation but was found to show significant differences between several
parameters before and after performances. These included significance
correlations and associations found between theta power levels (a) in the right
hemisphere before and after performances; (b) in the frontal and temporal
regions on both sides of the brain following performance; and (c) in the most
active electrode sites identified (F7, F8, T8). Moreover, theta power showed
continuously elevated levels in and around the approximated flow-zones, and
showed increased correlations with other band activity around the 18 – 24
minute intervals. During this time period, a Friedman analysis of the variability
within theta band, and an unsuccessful post hoc analysis showed possibly
significant variations around this same point in time. HRV data also reflected
an increase in parasympathetic influence on the heart during this interval.
Therefore, findings suggest the greater importance of theta band activity during
improvisation, and perhaps more specifically the flow experience and its trance-
like experiential, and unconscious processing characteristics.
Frontal and temporal regions on the right of the brain showed exceedingly
strong associations and there was a convergence of the activity within these
regions following improvisation, especially in the lower bands. The right
temporal electrode site (T8) showed the greatest power contributions of all
electrode sites, while the lateral frontal sites (F7 and F8) showed highest power
next to that of T8. During low-zones there was also typically good associations
found between the right temporal and right frontal regions, especially in the
theta band. Therefore, the convergence of activity in the right frontotemporal
region stands out as the most active areas during improvisation.
© University of Pretoria
4 - 47
4.8 REFERENCES
1. Brainquiry B.V. Real-time filtering in BioExplorer: Brainclinics products [cited
2016 March 19. Available from:
"http://www.brainclinics.com/dynamic/media/1/documents/Onderzoeksinstituut
/Filtering%20in%20BioExplorer.pdf"
2. Tarvainen M. Kubios HRV version 2.2 User's Guide. 2014.
3. Van Heerden A, Munro M. When five artists' identities seem as one. South
African Journal of Art History: Identity. 2014; 29(3): p. 138-155.
4. Demos J. Getting started with Neurofeedback New York: W. W. Norton &
Company; 2005.
5. Thompson M, Thompson L. The Neurofeedback Book Wheat Ridge, Colorado:
Association of Applied Psychophysiology and Biofeedback; 2003.
6. Wise A. Awakening the Mind. A guide to Mastering the Power of Your Brain
Waves New York: Tarcher/Putnam; 2002.
7. Fink A, Benedek M, Grabner R, Staudt B, Neubauer A. Creativity meets
neuroscience: Experimental tasks for the neuroscientific study of creative
thinking. Methods. 2007; 42: p. 68-76.
8. Stinson B, Arthur D. A novel EEG for alpha brain state training, neurofeedback
and behaviour change. Complement Ther Clin Pract. 2013; 19(3): p. 114-118.
9. Crews D. On the neurophysiology of flow. 2004 July 5-8.
10. Dietrich A. Neurocognitive mechanisms underlying the experience of flow.
Conscious cogn. 2004 Dec; 13(4): p. 746-761.
11. Flatherty A. Frontotemporal and dopaminergic control of idea generation and
creative drive. Journal of Comparative Neurology. 2005; 493(1): p. 147-153.
12. Jurysta F, van de Borne P, Migeotte P, M D, Lanquart J, Degaute JP, Linkowski
P. A study of the dynamic interactions between sleep EEG and heart rate
variability in healthy young men. Clinical Neurophysiology. 2003; 114: p. 2146-
2155.
13. Sawyer R. Educating for innovation. Think Skills Creative. 2006; 1: p. 41-48.
© University of Pretoria

4 - 48
14. Task Force of the European Society of Cardiology and the North American
Society of Pacing and Electrophysiology. Heart rate variability: standards of
measurement, physiological interpretation and clinical use. Circulation. 1996;
93: p. 1043-1065.
© University of Pretoria

5 - 1
Chapter 5 Integrated discussion, conclusion and prospective research directions
The greatest athletes are the ones who 'make it look easy'...The athletes
and others in peak performance states are not 'wanting' to perform well but
are engaged in the flow of doing.
Michael Hutchison
Flow can only truly be achieved when we are willing to let go of the outcome
and just play.
Sandra Taylor Hedges
© University of Pretoria
5 - 2
5.1 RESEARCH CONTEXT AND RELATIVITY
The study of flow and its underlying physiological mechanisms is a modern day
quandary. For half a century psychology and its related disciplines have attempted to
contextualise this state of peak performance that carries an almost uncanny mystic
whilst at the same time being an every-day human feat. A state of implicitly driven
behaviour that needs no superior directive, often occurring void of context and freeing
the individual from internal incitements so that action becomes the ordinance. Yet, our
comprehension of the underpinning neurological functions that governs such
behaviour is not well-founded, with only a handful of researchers making reforming
advances in the field. However, despite being an enormously challenging field of
research, neurophysiological research on the topic of flow is still only in its embryonic
phase, dating back merely a decade. There exists a large body of qualitative research
on flow and creativity, from many different standpoints and in many research fields,
however quantitative perspectives are scarce. In the initial chapters it was discussed
that numerous publications and sources on the topic of flow revolve around
retrospective analysis or self-report surveys, with practically no studies found that
conducted active, real-time investigations of creative conduct during its actualisation
and transference. This renders the current research undertaking novel.
The study was designed in a bold attempt to grab the bull by the horns, investigating
the higher states of creativity and peak performance in the context of jazz
improvisation. Highly experienced professionals were tested during a live session of
continuous improvisation by using wireless systems as a new-fangled approach to get
to the heart of the matter, as opposed to more classic methods. The difficulties face
here however boil down to a few key issues. The first issue is one of quality control
and is perhaps the greatest restriction to the progress of flow and creativity research
within a live, real-time setting. An ideal could be conceptualised whereby the
researcher would be able to test, with great accuracy, whichever parameters are of
interest, in an actively engaging individual whilst performing their respective art.
Therefore the two cornerstones holding up such an ideal would be the accuracy of
measurement on the one side and the actual, real-time engagement of the subject on
the other. Meeting the latter ideal is in essence the core to the current investigation as
most research strategies in the literature involve retrospective feedback, self-report,
or intervention during the creative endeavour, as was contested in Chapter 2.
© University of Pretoria

5 - 3
This is an important point in motivation of this study as it is the opinion of the
investigator that retrospectively captured data can only be deemed marginally
correlative of the actual act. In addition strategies involving intervention, or prompting
of the performer at time interval during their performances in order to report on their
current experience of flow-related parameters, can also be misrepresentative. The
problem resides with the intervention from the researcher or research equipment. In a
state of conduct such as improvisation or free-styling in whichever art form, interrupting
the process for feedback or measurements draws in the consequence of interrupting
the persons focus and thus rendering the flow state terminated. It is for these reasons
that a protocol design was attempted that would not rely on borderline or interceptive
data acquisition, but would instead take continuous real-time measurements
throughout the act of improvisation and any occurrences of flow during that process.
The idealist theory on the creative process maintains that the process is complete
once the creative idea has been generated, whilst action theory pinpoints the
execution of such ideas as indispensable to the creative process.1 Action theory has
proven to be the preferred viewpoint amongst researchers in the field of creative
research 2 and the deportment of this study stands in agreement. As an original
approach, the study would yield insight into the ongoing conduct and physiological
responses of the individual, generating novel data directly linked and translatable from
the creative endeavour. Individuals could perform unimpeded, in an environment that
suited the art form with far less intervention from the researcher or research
equipment. And, as described before, lending us a privileged insight into the mind of
the artist submerged in their creative on-goings and during an ever elusive state of
optimal performance that we call flow.
However, as fate would have, with resolution comes compensation, and data quality
remains a concern. Some of the reasons why real-time investigations are so difficult
(and often abandoned) is due to accuracy of data. Until recently EEG monitoring
involve a large amount of parts, connectors and wiring that was designed for the
laboratory or hospital environments, restricting movement of the individual and
proximity of the research equipment. Artifactual complications is the main concern,
arising as a consequence of e.g. head or other sudden movements, while the use of
sophisticated technologies such as fMRI and PET scans could not tolerate even the
© University of Pretoria
5 - 4
smallest amount of movement, let alone the costs involved with conducting such
testing.
However, in recent times more affordable, practical and portable alternatives have
been developed, giving rise a multitude of new commercially available EEG devices
that are easy to set up, expedient and programmable. It has become increasingly
conceivable to do research in scenarios that might previously not have been up for
consideration. The growing trend within the industries of wireless EEG and brain-
computer interfacing (BCI) means that technologies are being developed and
improved at a more than respectable rate, and developing protocols such as this one
will carry much greater accuracy within the immediate future. As things stand at
present, such technologies as used in this study (EMOTIV) are still novelty research
tools and is thus a modest alternative to its clinical counterparts, but offers the added
advantages that is needed to pursue the objectives of this investigation. In this regard,
the balancing of priorities in the study design prompted as original line of attack in
addressing the issue of real-time research on creative behaviour. Granting the
reduced sampling quality an exploratory investigation was thus piloted.
5.2 INVESTIGATIVE UNDERTAKING
To date, no complete definition of creativity exists that can be fully applied to any and
all disciplines of creative conduct including the arts (e.g. painting, dancing), music,
architecture, science, medicine, film and literature. Empirically difficult to test in human
subjects, creativity research is also not easily translatable in animal models, and
hinges on a strong “cultural relativity” in many frameworks.3 Distinguishing the truly
creative from the simply eccentric; the correlating relationships between creativity and
features of psychopathy, and the imperative differentiation between insight, originality
and novelty aspects to creativity is perplexing. From an integrated physiological
standpoint, research on creativity is equally confounding and sometimes even
contradictory, while the physiological study of flow, a non-exclusive manifestation of
highly creative behaviour has already been highlighted as still only in an incubation
phase. The study aimed to shed light on such phenomena as flow and its physiological
underpinnings while contributing valuable research to the narrow existing body of
knowledge pertaining to EEG and HRV evidence within the sphere of music and
neuroscience.
© University of Pretoria

5 - 5
The study began with the investigation of heart rate variability and
electroencephalography parameters in a volunteer-based sample of 5 professional
jazz musicians. All volunteers filled in a short biographical questionnaire, signed an
informed consent leaflet and were fitted with the Zephyr BioHarness heart monitor and
EMOTIV EEG headset. A baseline recording was conducted at a state of relaxed
inactivity with the eyes closed where after the eyes were opened and another
continuous measurement (true baseline) was done. Each subject then improvised
continuously without stopping for an unanticipated period of time after which a
stabilising (eyes-open) and comparative (eyes-closed) inactive baseline repetition was
measured. During improvisation there was no interaction or intervention with the
subject and participants were allowed to perform for a self-determined period, only
instructed to remain quiet and motionless upon completion.
Analysis of the data captured during improvisation was approached from three
divergent perspectives that carried distinct objectives in order to firstly
compartmentalise the exorbitant amount of data generated from each performance,
but also to systematise the analysis. Normalisation of the spectral analysis of both
EEG and HRV data was done in order to relatively standardise the magnitude
differentials between the two systems, but also between individuals.
5.3 PALLIATIVE ASSOCIATIONS AND CONTEXTUAL IMPACT
OF THE STUDY
According to Arden et al. 4 the neuroscientific theories of creativity, at present at least,
can be broadly categorized into four groups that are based on the hypothetical
associations of creativity with: (a) right brain activity dominance, (b) higher levels of
neural connectivity, (c) low cortex arousal, and (d) functioning of the prefrontal and
frontal brain regions. Given the scope of this study, and the associative importance of
the frontal brain regions in both novelty generation and flow, findings are discussed
within the greater context of creativity and flow research. In an effort to liaise these two
entities within the current framework, Burzik 5 is cited, summarising flow as
compromising of:
© University of Pretoria

5 - 6
1. Largely symmetrical brain activity;
2. The presence of strong delta, theta and alpha waves which might be the
bridge between creativity, flow and its spiritual constituents, as well as
explaining the trance-like properties of flow;
3. An economisation of brain activity in the form of “cerebral microsleep” which
might explain the ease and efficiency of the flow experience;
4. The paradoxical activation patterns of a partially passive mind and active
body.
These arguments will serve as guiding principles for the ensuing discussion.
5.3.1 Regarding symmetry and lateralization
During the 1970’s, early neuroscientific conceptions of creativity lay rooted in the idea
of “hemispheric specialisation”. Transection surgery for intractable epilepsy led
scientist to believe that the right hemisphere (non-dominant) was specialised for
creativity and holistic pattern recognition. 6, 7 However, the model of lateralization
applies poorly to creative language and other creative activities, and later evidence
pointed to the greater importance of bilateral recruitment for maximizing creativity. 8
A meta-analysis by Mihov et al. 9 on hemispheric specialization and creativity affirms
the lack of evidence to suggest a partiality of right brain activation during creative
thinking. However, early EEG studies have added greater dimension to the issue of
lateralisation and the ubiquitous presence of the right brain, showing that highly
creative individuals differ from lesser creative persons in that they show:
1. Greater activity in the parieto-temporal areas in the right hemisphere;
2. Heightened alpha activity during spells of inspiration, and
3. Tendencies of greater physiological over-responses. 10, 11
Later EEG studies illustrated a significant correlation between EEG coherence levels
in the right brain with higher creative scores during “rest.” 12 In addition, one study
showed greater interconnectivity in the right hemisphere of higher creative male
subjects, 13 along with associations found between right temporal epilepsy and de
novo artistic expression.14
© University of Pretoria

5 - 7
In light of such associations, our findings proved consistent. Prior to improvisation all
subjects showed fairly equal power output arising from the both hemispheres during
the true baseline. Upon initiation of the performance there was continually greater
strength in power arising from the right hemisphere in all but one subject. This elevated
right brain power persisted throughout each performance and showed consistently
higher activity in all spectral bands. Moreover, we also found exceedingly strong
associations between the activity of the frontal and temporal areas in the right
hemisphere. Following completion of the performance phase, the comparative
baseline revealed continued supremacy of the right hemisphere, typically showing
even greater differences between left and right brain activity. Put differently, all
frequency bands of the EEG showed greater power (thus amplitudes) in the right
hemisphere during and after improvisation in all but one of our five pianists.
It could be possible that a greater power expression in the right brain can be a product
of the information processing tendencies of the right hemisphere within the creative
context. To grossly simplify, the processing inclinations of the left hemisphere involves
more sequential, logical thinking and is more detail orientated, whereas the right brain
involves more holistic, symbolic (associative) thinking and is more intuitive.15 The flow
state and its associative propensities as a subjective experience, encompasses a lot
of these ‘right brain tendencies’. It could therefore perhaps be said that such
lateralization of processing predispositions could, at least in part, explain the
prominence of the right hemisphere, however other research has also found greater
right brain activity in higher creative subjects during creative tasks.16
A study by Crews 17 involving golfers putting under stressful conditions revealed that
those who were successful exhibited the same levels of anxiety as those who ‘choked’
under the pressure, but that a determining factor existed in the EEG activity measured
from these subjects. Failed golfers showed much greater activation of the left
hemisphere, associated with higher cognitive and self-conscious behaviour; mentally
trying to control their actions by analysing or intellectualising the action. On the
contrary, the successful golfers showed greater activation in the right brain which
would involve greater measures of visualisation or focussing on the smoothness of the
action and senses rather than sequentially deconstructing the action. These golfers
displayed greater co-lateral symmetry in activation too, which once more lends credit
to the notion of equal activation of both hemispheres during high-performance states.
© University of Pretoria

5 - 8
In our study, all participants consistently showed greater activity arising from the right
hemisphere during improvisation, however the activity from both hemispheres showed
symmetry. What we observed was consistently symmetrical responses from both
hemispheres within all of the power bands, but more often than not the right
hemisphere would exhibit greater power magnitudes compared to the left. In other
words, there is symmetry between the activities of both hemispheres, whereby
amplitudes showed closely similar fluctuations in both hemispheres, except fluxes in
the right hemisphere would occur at greater magnitude. PET studies performed by
Chávez-Eakle 18 support these findings, stating that the creative performance involves
“a bilaterally distributed brain system” but that most elevated activity arises from the
right hemisphere.
Therefore, our findings show accuracy and agreement with Burzik 5 and Arden et al. 4
more specifically showing significant differences (P=.037) between the right and left
brain activity in the delta, theta and SMR bands following improvisation.
5.3.2 Regarding spectral density and state of mind
One of the most apparent and rousing observations of this study was the pre-
eminence of theta band relations throughout the findings. Looking at theta activity in
isolation our findings revealed globally significant differences (P=.037) between the
true and comparative baseline measures (EO1/EC2) for theta. Together with this, the
0
0.5
1
1.5
2
2.5
3
00:00 07:12 14:24 21:36 28:48 36:00
Po
wer
(n
.u)
Time
Alpha activity of both hemisphere in Subject A
Figure 35 - An example of the symmetrical activity expressed in a subject at different power magnitudes throughout the
testing phase.
© University of Pretoria
5 - 9
means perspective revealed that there existed a significant difference (P=.037)
between the hemispheres when comparing the baseline theta power measures.
Regional means contributed to these initial findings by showing that there were
significant differences (P=.037) in baseline theta power within temporal regions on
both sides of the brain. Significantly therefore, global theta activity was different before
and after improvisation and was also different between the hemispheres, with the right
brain consistently showing higher power. Theta activity in both temporal regions (left
and right) were also difference before and after improvisation too.
During improvisation, dramatic increases in theta and delta power constituted the
greatest recorded amplitude shifts in all but one participant. Theta power magnitudes
showed increases varying from 3 – 100 times that measured at baseline and was also
found to be highly expressive in the F7, F8 and T8 sites which were isolated as the
most active electrode positions during improvisation. Therefore, the fact that theta
activity shows prevalence in the most active sites during improvisation, paired with the
considerably higher mean power outputs of the lower bands (theta and delta) during
improvisation hints at a state of lower band dominance during the performance phase.
This slower wave activity predominance can be said to reflect a state of greater
unconscious processing associated with accessing memories and other unconscious
material, transition between sleep and waking, and integration of sensorimotor
information. It should also be taken into consideration that heightened slow-wave
activity does not infer slow or less activity, but on the contrary a greater level of
synchronicity between firing neurons operating at these frequencies. When more
neurons are firing in syncopation (together) the pooled energy is greater, which is
reflected in the amplitude of that frequency range and therefore directly related to its
power output. Thus higher power translates to higher amplitudes which translates to
higher energy output which translates to neurons firing in a harmonised and
coordinated manner (rhythmic pulsations versus erratic arbitrary firing of neurons).
Such activity is typically seen while sleeping or meditating, however here we see
elevated slow-wave activity occurring in alert, highly focussed individuals actively
engaged in very complex, highly skilled creative behaviour. The Royal College of
Music, London, demonstrated enhanced musical understanding, quality of
performance, stylistic accuracy and interpretative imagination through improved theta
activity in students using neurofeedback protocols.19 The authors explain that
© University of Pretoria

5 - 10
alpha/theta feedback is used so that the subject can enter a “theta cross-over”
whereby theta activity surmounts that of alpha activity. Entering such a mental state
implicates “a transient entering and re-entering of dreamlike states while staying
awake, enabling a fluent retrieval of memories into conscious awareness and working
memory.” 5
Even more, trance EEG studies have shown elevated theta activity during states of
intense physical and mental engagement.20 EEG recordings conducted on fakirs in
deep trance states - during which these individuals would stick swords through their
tongues and other areas on their body – revealed, once more, the presence of high
theta activity.20 Larbig 20 explains that such elevated theta activity during intense
physical, and thus wakeful engagement could be interpreted as an “economisation of
the brain by temporary synchronisation of those parts of the brain which are not
included in the processing of the task at hand.” What this means is that it is possible
for the brain to switch areas that are not actively engaged in an activity into a
“microsleep” 20 which would therefore give rise to such elevated theta presence.
Described as a paradoxical state of mind-body activation referred to as “passive mind
– active body”, the author did not specifically refer to flow, most likely because the idea
of flow was only introduced around the same time (late 1970’s) it is evident that such
trance states and its accompanying brain activity resembles that of flow to a great
extent. Flow has in fact been described as a trance state before (“meditation in
action”)5 and our study provides further evidence for such views.
From the biasing perspective it was shown that theta band activity showed an
increased number of correlations with other bands as improvisation continued.
Significant positive correlations (CC=0.9; P=.037) were found between theta and all
other spectral bands, arising from about 18 minutes into performances. In addition,
consistently elevated or rising theta power was observed in close proximity to
approximated flow-zones in all subjects. Flow-zones were probability estimates based
on subjective feedback and investigative notes taken from each performance and not
only showed great concomitance with raised or rising theta power, but all subjects also
showed flow encounters starting in or around the 18 minute mark. Moreover, a
Friedman test showed almost significant (P=.065) variation within the theta band over
time and despite being inconclusive, the post hoc analysis seemed to suggest that the
greater contribution to this variation centred around the 18 – 24, and 18 – 30 minutes
© University of Pretoria

5 - 11
interval. Therefore, given the already elevated theta levels during flow-zones, paired
with the occurrences of flow overlapping within the time frame that all spectral bands
show improving correlation with the theta band; and the Friedman analysis which,
though not significant suggests the greatest intraspectrum variation in theta seems to
occur around the same time, the notion of flow as a high theta state seems plausible.
In even further support of this idea, HRV data showed LF/HF peaking at 15 – 25
minutes, followed by a steady decline in this ratio. What this signifies is the gradual
decline of LF strength and the consequent rise in HF power. This suggests the decay
of a sympathetic dominated state into one that is by no means parasympathetic
dominant but where parasympathetic influence is rising, slowing the heart and
breathing rates. During sleep or meditation parasympathetic, or vagal tone dominates
due to the lowered breathing rates, coupled with the heart rhythms (respiratory sinus
arrhythmia) and therefore reflects high HF power. EEG studies have also already been
put forth showing the coherent relationship between HF and the lower spectral bands
of the EEG as occurring during sleep, 21 and two subjects were found to express
correlating relationships between theta and HF power over 30 minutes (Subject A &
B; P=.037). Thus, given the theta related results discussed up to this point, the
overlapping statistical findings of elevated theta during and after improvisation, its
correlations with other band activity and intraspectrum variance concentrating around
the same time when parasympathetic influence starts to show intensification and self-
report indicated the occurrences of flow, proves an exciting prospect and strong
evidence of the likelihood of flow as trance state contributing to the interplay between
heart and brain during a state of high theta activity and high creative performance.
The reader is reminded that the creative proxy plays a significant role whenever any
creative research is conducted and that very few conclusive perspectives can be
generalised to all facets and manners of creative conduct. In this regards, these
findings might be contextually exclusive to music performance, piano playing, genre,
style or improvisation, as creativity research in general often emphasise and maintain
the opinion of the importance of alpha activity in the creative process [e.g. (22) (23)
(24) (25) (26) (27) (10)]. However, due to the fact that so little research has been
conducted on individuals during the actualisation of their creativity, most creativity
research found revolved around problem solving, insight, alternate uses, idea
generation, creative drive, inspiration, and visualisation based tasks. The fact of the
© University of Pretoria

5 - 12
matter is that the largest body of creativity research therefore revolve around tasks
and methodologies grounded in either divergent or convergent types of creative
thinking and the importance of the alpha band may therefore also be contextualised
and particular to such conceptualisations of idea generation and creative ideation.
In the same manner we can paint a different picture. In Chapter 2 it was explained that
many studies show the particular involvement of the frontal cortex in the evaluation of
novelty and originality, which are deemed subcomponents of creativity, and therefore
the active role of the frontal areas in the creative process. However, almost contrarily,
it is also well reported that flow encompasses a state of hypofrontality, resulting in the
down regulation of the frontal areas, allowing the implicit arrangements to execute
tasks at optimal efficiency. It seems therefore that the idealist viewpoint of the idea
generation or conceptualisation as the core to creativity is expressed more commonly
in the literature through creativity tasks such as problem solving or visualisation and
its strong associations with the alpha band and the frontal areas of the brain.
Could it therefore be possible, from an action theory perspective, complimented by the
literature consulted in this study regarding flow, trance states and implicit functioning
in the brain; and the presented findings, that the flow experience sculpts an alternative
view of creativity as an expression of skill-based, implicit knowledge and processing
in the brain? Can it be said therefore that flow could be governed largely by theta band
activity and predominance and that high alpha in the creative process acts as the
‘bridge’ between the explicit and implicit systems (conscious to unconscious
processing)? 2, 5 If such separate creative states or conditions could exist, sustained
through either high theta or high alpha eminence, this could differentiate the
associations of e.g. novelty generation or ideation with high alpha as an archetype of
creative thought, versus the fluent, implicitly-driven transference of creative skills such
as e.g. improvisation with lower spectral manifestations. Such an impression
necessitates further investigation and could shed light on the difference between
creative ideation (generation of idea) and creative conduct (expression of idea).
In light of such a distinction it should be mentioned that our study, despite propagating
the idea of flow being a theta dominant state of conduct, does not stand in opposition
of existing views that stress the importance of higher alpha activity during creative
endeavours. In fact our findings showed significant differences (P=.037) in alpha
© University of Pretoria

5 - 13
power between the true and comparative baselines, and also significance (P=.037)
between both eyes-closed baseline. In pertaining to the latter point, it was mentioned
that closing of the eyes naturally causes a sharp increase in alpha power, but our
findings showed consistently greater differences in alpha power in the comparative
baseline compared to the initial measure. We also observed elevated alpha power
throughout improvisation in all but one subject, showing great concomitance with the
approximated flow-zones, especially in the right frontal and right temporal areas.
Therefore, higher asymmetrical alpha activity was also observed, but at lower power
outputs compared to the theta band, with a much more stable expression of elevated
alpha occurring throughout the act of improvisation, rather than expressing major
peaks like we observed in the theta band. Thus, our findings prove consistent with that
found in the literature with specific reference to alpha band activity, however, the
superior expression of theta and its offshoots seem the better fit given the current
domain and proxy.
5.3.3 Regarding economisation and lobular functioning
Long since the original ideas of hemispheric specialisation, contemporary theories of
creative neurobiology focus more on lobar function and connectivity, implicating the
frontal lobes and areas of the temporal and parietal lobes as being key to the creative
process. 6, 28, 29, 30 The literature often shows opposing findings regarding cortical
activation, showcasing a decrease in cortical activation in highly creative individuals
whilst performing creative tasks in recent studies, 31 yet earlier findings support notions
of increased activation. 8
Despite the general consensus that the prefrontal areas play a pivotal role in creative
thinking, such theories of prefrontal dominance 32, 33 stand inharmoniously to other
studies that point to the explicitly necessary role of the temporal-parietal-occipital
collective (TPO area). 34, 35 The incongruity between laboratory testing and observable
behaviour as displayed in real world creative behaviour adds to such heterogeneity in
brain research on creativity. Moreover, extremely little has been published within the
particularly focus of improvisation and musical creativity, 36 let alone flow states
associated with such practices. No more than five years ago, it was still reported that
positive psychological states such as flow “has remained almost entirely unexamined
in live music performance.” 37 Nonetheless, some neurophysiological correlates have
been put forth for musical creativity and improvisation.36
© University of Pretoria

5 - 14
Focussing on the lobular and regional activity as measured in our study, particular
attention was directed at the frontal and temporal areas. As was protuberant from the
superior right hemispheric power, right temporal (TR) and right frontal (FR) areas also
showed greatest power outputs compared to other areas, while the left frontal region
(FL) also showed above average power yields. We observed an exceedingly strong
relationships between FR and TR (P<.01) with the two areas also showing consistently
higher power in the comparative baseline. The right frontal region showed significant
(P=.037) correlations with the SMR band when baselines were compared, while the
right temporal region showed correlations (P=.037) within the alpha and theta bands
before and after performance. The TR region also showed the highest power output
in all subjects and across all bands, both at baselines but also during improvisation.
Throughput performances the TR region showed elevated power and showed
consistent peaking in and around the designated flow areas. The higher power in the
right hemisphere as reported earlier is therefore largely due to temporal electrode
sites, but more specifically that of T8 and F8 on the right. However we also found
greater ipsilateral associations between frontal and temporal areas in both
hemispheres immediately following improvisation, however left brain associations
were typically at lower amplitudes and showed marked increases in slow-wave power
(P=.037). The trending of activity measured between regions also seemed to suggest
a convergence of the regional activity in the left brain around the flow-zones, however
the T7 site, together with P7 and O1 (all on the left) showed the lowest power outputs
of all sites. Prefrontal and medial frontal sites showed moderate or slightly below
average power and could be assumed to lean towards a hypofrontality situation. Lower
spectral bands (delta through alpha) were very prevalent in all frontal and temporal
areas.
Taken together, we see co-lateral frontal regions (F7, F8, AF3, AF4), together with the
right temporal region (T8), to be most active during improvisation, especially between
the delta to alpha power bands. This is to say that the left frontal and right fronto-
temporal areas of the brain was most active, whilst expression greater power within
low frequency bands, whereas the left temporal, parietal and occipital areas showed
the lowest activity during performances.
Similar findings of increased power within the frontal cortex, alongside the increased
desynchronization of the posterior cortex during performance of verbal insight and
© University of Pretoria

5 - 15
creativity tasks are cited 38 in support of our findings. In addition, Martindale and
Hasenfus 10 have reported increased activity in the right temporal regions in highly
creative individuals with a tendency of physiological hyperresponses, while bi-lateral
frontal activation was also detected in highly creative individuals during divergent
thinking tasks. 39 Furthermore, SPECT scans on figural creativity showed positive
relationships between high creative scores and temporal and frontal associated areas
on the right (right postcentral and parahippocampal gyri; right inferior parietal lobule),
40 while lesions studies tend to point to the frontal and temporal poles when attempting
to localize creativity. 11
We therefore see various research within different creative facets pointing toward the
same activation patterns, however, as mentioned, “neuroscience inquiries of creativity
show a muddled picture likely related to subject, modality, and metric issues” and
contextually we need greater deliberation on musical improvisation specifically.
Dikaya and Skirtach 36 calculated statistical correlates between music improvisation,
professionalism and musical mode, typically finding improvisation related tasks to
have greatest effect on left temporal (delta), right prefrontal (beta1) and left occipital
(beta1) brain regions. Musical mode, pertaining to differences in major or minor scale
improvisation (greater emotional element) showed greatest effect in the theta band
across the frontal leads. Furthermore, the authors found significantly higher delta
power in the left frontal and posterior temporal regions particular to improvisation in
comparison with other musical activities (p<.05). Such temporal regions form part of
the acoustical associative areas, also connected to rhythm perception and processing
of complex musical characteristics. Moreover musical improvisation was further
characterized by augmented short coherence between right prefrontal, central and left
parietal regions within the delta and theta bands, while right prefrontal, frontal and left
occipital regions showed elevated beta power (p<.05). This led the authors to claim
that this “short-distance low-frequency coherence connections and the high-frequency
creative axis are most relevant for the creative process in music."
In light of such correlations, our study showed general agreement, but in some regards
we had mixed or inconclusive results. For instance, superior delta power was indeed
found in the left frontal regions, but we had mixed results regarding delta activity in the
left temporal region, with some individuals showing much lower or around average
© University of Pretoria
5 - 16
values. Likewise, we saw raised levels in power within the delta, theta and beta bands
in the right frontal area, but prefrontal areas, and occipital areas on the left typically
showed lower levels in power across all power bands. Such differences can be
imparted to several differences in methodologies between the two studies. In the study
mentioned above, EEG measures were conducted on mentally improvised pieces that
involved only the perceptual and internal composition of an improvised piece of music.
Therefore no instruments were played and EEG measure were done before musicians
were allowed to perform there pieces on actual instruments. No measurements were
taken while performing, and improvisation was done within specified modes and
frameworks. Along such lines, the differences in activity measured might be the
product of motor and sensory activity representations within the brains of our actively
participating subjects, or perhaps the relative freedom for subjects to progress
musically in a direction of their choosing as opposed to conforming to a mode or
specific key, could play a role. In fact, premotor and primary motor cortices are indeed
allocated within the temporal areas and might be the difference, however paradoxically
we typically found decreased levels in power in the left temporal areas which point
away from the influence of motor activity.
Alternatively, Flatherty 28 cites from numerous lesion, mania and surgical studies the
importance of the temporal and frontal regions in the non-domain specific areas of
creative idea generation and creative drive. The author highlights that most temporal
lobe conditions that trigger greater creative drive arise through disruption of temporal
lobe function. Frontotemporal dementia is a very well-known example where a subset
of about 10% of such individuals (selected neurodegeneration in the temporal lobes)
develop compulsive musical and artistic interests even if no artistic tendencies existed
beforehand. Such notions fit better within the framework of our study where the down
regulation of the temporal areas in the left brain might reflect such increased creativity
as would be mediated through musical improvisation. The author (Flatherty) goes
further to explain that the temporal regions can thus, more accurately be considered
as a “region of creative suppression,” clarifying that large temporal lobe efferent fibres
inhibit the frontal lobes, 41 and that connections between frontal and temporal regions
might play a greater role in creativity than the interconnections shared between right
and left hemispheres. 28
© University of Pretoria

5 - 17
This relates to the chief contributions of frontal lobes to the creative process, most
markedly regarding executive functioning, 42 goal-directed behaviour, evaluation of
appropriateness and originality, and the integration of already highly processed
information.q Creative block (as with e.g. writer’s block) has been linked to frontal lobe
dysfunction with supporting evidence typically found in anxiety and depression studies.
28, 43 However, the involvement of the frontal and prefrontal areas within the context of
improvisation is almost enigmatic, often showing a down regulation in activity levels
and might further explain some of the differences in our results.
In a critical review, Sawyer 44 explain that “improvisation involves brain regions that
are involved in the generation and comprehension of sequences, making decisions
among competing alternatives, and the creation of a plan for the motor execution of
that sequence. These are domain-general brain regions, suggesting a role for domain-
general mental processes in creativity.”
The outlook stated here is important to keep in mind as improvisation often provides
controverting correlates in brain activity. One aspect that might play a substantial role
here, would be the experience of flow and the hypofrontality often described as
occurring during such states. fMRI studies on jazz improvisation 45 showed decreased
activity in almost all of the lateral prefrontal cortices, in particular that of the dorsolateral
(DLPFC) and lateral orbital prefrontal cortex (LOFC). The decrease in activity in the
lateral prefrontal regions suggests the inhibition of regions involved in the conscious
monitoring and correction of goal-directed behaviours, while changes in activity within
the medial prefrontal regions (MPFC) previously associated with autobiographical
narrative was also observed. 44 Our findings showed consistency.
The prefrontal sites (AF3 & AF4) and more medial frontal sites (F3 & F4) showed
typical means of average or below average power across subjects, compared to other
regions, pointing towards a lower level of activity in these regions. On deeper
inspection, we found the right temporal (T8) and the more lateral frontal regions (F7 &
F8) to exhibit the highest power outputs. We also traced the largest shifts in amplitude
within the right temporal region to occur in strong association with the highlighted flow
zones in all of the subjects.
q For greater resolution on the involvement of the frontal areas in the creative process, refer to Chapter 2.
© University of Pretoria

5 - 18
From the dynamic power graphs put forth in Chapter 4, it was evident that there were
quite prominent shifts in amplitude within each dataset, and that these major amplitude
shifts can be attributed to massive power upsurges at those moments in time. These
peaks more often than not occurred in close proximity with the predesignated flow-
zones, implying the possibility of a causal relationship between the flow experience
and rising amplitude levels and higher energy output. Peaks were most profound in
the lower frequency bands, but were typically present across spectra. During these
flow-zones, alpha activity showed trending elevations, while elevated theta levels were
more saliently observed in the frontal and temporal regions in all subjects. Differences
in power between the temporal and laterofrontal regions seem to converge on both
sides of the brain in and around the apportioned flow-zones, which is to say that the
possibility exists of an ‘entrainment’ of activity in these regions during flow, especially
within the left hemisphere. Such ‘entrainment’ could be in the form of coherent
associations between these regions. In summary therefore, our findings point to the
inclination of the lateral frontal and temporal regions towards a lower band presence,
together with a down regulation of the prefrontal and medial frontal areas. Additionally,
our findings of lower power outputs in the left parietal and occipital areas necessitates
greater resolution if it were to prove true.
Our findings and the relative activation patterns can also be likened to the studies on
mania. SPECT imaging studies in manic patients have shown increased activity in the
right anterior temporal area, while EEG studies show decreases in lower left temporal
activity, 28 a very similar pattern that we found. In this regards, likeness can be drawn
to the occurrences of hypergraphia (a compulsive drive to write) in manic patients,
reflecting decreases in temporal lobe activity, as well as temporal lobe lesions on the
right being one of the most prevalent causes of mania. 28 Flatherty 28 explains that
hypergraphia in manic patients provides a platform to investigate creative drive,
elucidating on the role of the dopaminergic system in the brain and its effects on
motivation, idea generation, goal-directedness and reward-seeking activity. Mania can
be described as a state of mental illness marked by episodes of great excitement,
excessive enthusiasm, euphoria, over-activity and obsession, and it is in this regard
that mania and hypergraphia, and its activation patterns in the brain can likely be
mirrored in the positive emotions and motivated behaviour experienced during flow. In
this regard, it would not be too difficult to imagine that the limbic involvement and
© University of Pretoria

5 - 19
positive affect, together with such goal-directed behaviour associated with flow and
peak performance might echo the same activity in the brain, which might explain why
we observed similar activity in our musicians.
5.4 LIMITATIONS AND RECOMMENDATIONS FOR FURTHER
RESEARCH
Due largely in part to the small sample size, statistical power of the study was
limited. The greatest restrictions to obtaining a larger populations was related
to time and viability of candidates.
o Time constraints were largely due to the replacement of damaged
equipment, with major delays during importation resulting in a truncation
of time available for testing. In addition, national protests resulted in the
sporadic closing down of campuses in and around critical phases of this
project.
o The restrictions related to candidate viability revolved mainly around the
recruitment of professional individuals only which dramatically shrunk
the amount of internally available candidates at the university.
Additionally, a calculated decision was made to replace the software
used for data analysis, resulting in the loss of data recorded up to that
point due to compatibility issues.
o Basic statistical approaches were followed due to the small sample size,
however cross-correlation and coherence specific statistical methods
paired with a larger sample would add great value to the existing
research protocol.
From the data, exportation restrictions of the software platforms utilized, meant
the manual distribution and processing of data which was not ideal. Therefore,
an upgrade to more powerful software packages would contribute to lesser time
needed for processing and analysis, greater accuracy and a greater number of
available analytical tools. Along the same lines, the Emotiv EEG headset,
although useful, remains a largely tyro tool for research. However, the
enormous proliferation of such technologies and the extreme rate of improved
temporal and signal resolutions mean that such technologies are continuously
© University of Pretoria

5 - 20
improving at a rapid rate and provide very promising alternatives for future
research.
Future research should build from this study, employing more powerful methods
of assessing the interplay between heart and brain measures, as mentioned.
Additionally, building on the more salient findings in this study, concentrating
on isolating, inducing and observing high alpha and high theta states might
shed light on different facets or types of creative behaviour, such as creative
thinking versus creative doing. Therefore, the study carries value in that it can
serve as basis for refinement of such protocols that could contribute to the
areas of bio- and neurofeedback and music therapy. More sophisticated
statistical methods would help to understand the interrelatedness of the heart-
brain collective and the potential for breathing, biofeedback and trance-inducing
procedures to facilitate creativity and flow experiences.
5.5 CONCLUSION
The research suggests that flow, as an experience of optimal performance and higher
creative conduct, is related to an intensification of theta oscillations in the brain. In light
of this, it was shown that elevated lower band activity show prevalence during
improvisation in professional musicians, and that flow may be responsible for hyper-
responses in the amplitude of these frequency ranges. Furthermore, a decrease in
LF/HF, inferring a rise in parasympathetic influence on the heart showed strong
overlap with the first occurrences of flow, and the apparent entrainment of brain activity
with the strong theta presence. In addition, the research suggests the convergence of
activity within the right frontotemporal regions, which was also the most active regions
during improvisation, while there was a lower energy transfer in the temporal, parietal
and occipital areas on the left. Sustained right hemispheric dominance was found
across all subjects, and the possibility of differences in high alpha versus high theta
states of creative behaviour are advocated.
© University of Pretoria
5 - 21
5.6 REFERENCES
1. Sawyer R. Explaining creativity New York: Oxford University Press; 2006.
2. Van Heerden A. Creativity, the flow state and brain function. SAJAH. 2010;
25(3): p. 140-141.
3. Newton H. The neurology of creativity: Focus on music. In Charyton C, editor.
Creativity and innovation among science and art. London: Springer-Verlag;
2015. p. 3-52.
4. Arden R, Chavez R, Grazioplene R, Jung R. Neuroimaging creativity: A
psychometric view. Behavioural brain research. 2010; 214(2): p. 143-156.
5. Burzik A. On the neurophysiology of flow. In 2nd European conference on
positive psychology; 2004; Verbania Pallanza, Italy.
6. Hennessey B, Amabile T. Creativity. Annual Review of Psychology. 2010; 61:
p. 569-598.
7. Hoppe K. Hemispheric specialization and creativity. Psychiatric Clinics of North
America. 1988; 11: p. 3-315.
8. Martindale C. Biological bases of creativity. In Sternberg R, editor. Handbook
of creativity. New York: Cambridge University Press; 1999. p. 137-152.
9. Mihov K, Denzler M, Forster J. Hemispheric specialization and creative
thinking: A meta-analytic review of lateralization of creativity. Brain and
cognition. 2010; 72(3): p. 442-448.
10. Martindale C, Hasenfus N. EEG differences as a function of creativity, stage of
the creative process, and effort to be original. Biol Psychol. 1978; 6: p. 157-167.
11. Jung R, Segall J, Bockholt H, Flores R, Smith S, Chavez R, et al. Neuroanatomy
of creativity. Human Brain Mapping. 2010; 31: p. 398-409.
12. Jausovec N, Jausovec K. Differences in resting EEG related to ability. Brain
Topogr. 2000; 12: p. 229-240.
13. Razumnikova O. Functional organization of different brain areas during
convergent and divergent thinking: An EEG investigation. Cogn Brain Res.
2000; 10: p. 11-18.
© University of Pretoria

5 - 22
14. Mendez M. Hypergraphia for poetry in an epileptic patient. J Neuropsychiatry
Clin Neurosci. 2005; 17: p. 560-561.
15. Springer S, Deutsch G. Left brain, right brain New York: W.H Freeman and
Company; 1989.
16. Martindale C, Hines D, Mitchell L, Covello E. EEG alpha asymmetry and
creativity. Personality and individual differences. 1984; 5(1): p. 77-86.
17. Crews D. Putting under stress. Golf Magazine. 2001: p. 94-96.
18. Chávez-Eakle. Creativity, DNA, and cerebral blood flow. In Martindale C,
Locher P, Petrov V, editors. Evolutionary and neurocognitive approaches to
aesthetics, creativity, and the arts. Amityville, NJ: Baywood; 2007. p. 209-224.
19. Gruzelier J, Egner T. Physiological self-regulation: Biofeedback and
neurofeedback. In Williamon A, editor. Musical Excellence. Strategies and
techniques to enhance performance. Oxford; 2004.
20. Larbig W. Schmerz: Grundlagen - Forschung - Therapie Stuttgart:
Kohlhammer; 1982.
21. Jurysta F, van de Borne P, Migeotte P, M D, Lanquart J, Degaute JP, Linkowski
P. A study of the dynamic interactions between sleep EEG and heart rate
variability in healthy young men. Clinical Neurophysiology. 2003; 114: p. 2146-
2155.
22. Fink A, Neubauer A. EEG alpha oscillations during the performance of verbal
creativity tasks: differential effects of sex and verbal intelligence. Int J
Psychophysiol. 2006; 62: p. 46-53.
23. Grabner R, Fink A, Neurbauer A. Brain correlates of self-rated originality of
ideas: evidence from even-related power and phase-locking changes in the
EEG. Behav Neurosci. 2007; 121: p. 444-454.
24. Fink A, Grabner R, Benedek M, Reishofer G, Hauswirth V, Fally M, Neuper C,
Ebner F, Neubauer AC. The creative brain: investigation of brain activity during
creative problem solving by means of EEG and fMRI. Hum Brain Mapp. 2009;
30: p. 734-748.
© University of Pretoria

5 - 23
25. Jausovec N, Jausovec K. EEG activity during the performance of complex
mental problems. Int J Psychophysiol. 2000; 27: p. 73-88.
26. Jausovec N. Differences in cognitive processes between gifted, intelligent,
creative, and average individuals while solving complex problems: an EEG
study. Intelligence. 2000; 28: p. 213-237.
27. Martindale C, Hines D. Creativity and cortical activation during creative,
intellectual, and EEG feedback tasks. Biol Psychol. 1975; 3: p. 71-80.
28. Flatherty A. Frontotemporal and dopaminergic control of idea generation and
creative drive. Journal of Comparative Neurology. 2005; 493(1): p. 147-153.
29. Shamay-Tsoory S, Adler N, Aharon- Peretz J, Perry D, Mayseless N. The
origins of originality: The neural bases of creative thinking and originality.
Neuropsychologia. 2011; 49(2): p. 178-185.
30. Abraham A, Pieritz K, Thybusch K, Rutter B, Kroger S, Schweckendiek J.
Creativity and the brain: Uncovering the neural signature of conceptual
expansion. Neuropsychologia. 2012; 50(8): p. 1906-1917.
31. Starchenko M, Kireev M, Medvedev S. Brain organization in creative thinking.
International journal of psychophysiology. 2014; 94(2): p. 160.
32. Fink A, Benedek M. EEG alpha power and creative ideation. Neuroscience &
Biobehavioral reviews. 2014; 44: p. 111-123.
33. Lustenberger C, Boyle M, Foulser A, Mellin J, Frohlich F. Functional role of
frontal alpha oscillations in creativity. Cortex. 2015; 67: p. 74-82.
34. Jung R, Mead B, Carrasco JFR. The structure of creative cognition in the
human brain. Frontiers in human neuroscience. 2013; 7: p. 330.
35. Kounios J, Beeman M. The cognitive neuroscience of insight. Annual review of
psychology. 2014; 65(1): p. 71-93.
36. Dikaya L, Skirtach I. Neurophysiological correlates of musical creativity: The
example of improvisation. Psychology in Russia: State of the art. 2015; 8(3): p.
84-97.
© University of Pretoria

5 - 24
37. Wrigley W, Emmerson S. The experience of the flow state in live music
performance. Psychology of Music. 2011; 41(3): p. 292-305.
38. Razumnikova O. Creativity related cortex activity in the remote associates task.
Brain Res Bull. 2007; 73((1-3)): p. 96-102.
39. Carlsson I, Wendt P, Risberg J. On the neurobiology of creativity. Differences
in frontal activity between high and low creative subjects. Neuropsychologia.
2000; 38: p. 873-885.
40. Chavez R, Graff-Guerrero A, Garcia-Reyna J, Vaugier V, Cruz-Fuentes C.
Neurobiology of creativity. Salud Ment. 2004; 27: p. 38-46.
41. Menzel C, Grunwald F, Klemm E, Ruhlmann J, Elger C, Biersack H. Inhibitory
effects of mesial temporal partial seizures onto frontal neocortical structures.
Acta Neurol Belg. 1998; 98: p. 327-331.
42. Dietrich A. Neurocognitive mechanisms underlying the experience of flow.
Conscious cogn. 2004 Dec; 13(4): p. 746-761.
43. Cannistraro P, Rauch S. Neural circuitry of anxiety: evidence from structural
and functional neuroimaging studies. Psychpharmacol Bull. 2003; 37: p. 8-25.
44. Sawyer K. The cognitive neuroscience of creativity: A critical review. Creativity
Research Journal. 2011; 23(2): p. 137-145.
45. Limb C, Braun A. Neural substrates of spontaneous musical performance: An
fMRI study of jazz improvisation. PLos One. 2008; 3(2): p. e1679.
© University of Pretoria

Appendix A INFORMED CONSENT
A
PARTICIPANT INFORMATION LEAFLET AND INFORMED
CONSENT
Research study title: Physiological coherence between heart rate variability and electroencephalography during live music performance - A real-time, exploratory investigation using wireless systems.
Introduction: You are invited to take part in a research study on brain and heart coherence during musical performance. This information leaflet has been created to aid you in deciding whether you would like to participate in our study and to inform you of the purpose, aim and procedures of this study. Before you agree to take part in this study you should fully understand what the study entails and your role in it. If you have any questions that are not explained in this leaflet, please do not hesitate to ask the investigator (Gehart Kalmeier – see contact information below).
What is the purpose of this study? This study is an exploratory investigation into the physiological aspects and activities of the heart and the brain during musical performance. The study aims to explore the brain waves, heart functioning and mental involvement associated with creative performance and more specifically the performance of music in a live setting.
Explanation of procedures to be followed: You will be asked firstly to complete a brief questionnaire regarding your personal details and information. The questionnaire should take no more than 10 minutes to complete. This information will be kept safe and private and will only be accessible to the main investigator (Gehart Kalmeier). You’re personal information will be protected under all circumstances and will not be shared with anyone. Following completion of this form, we will prepare you for testing. You will be asked and instructed on how to put on a heart monitoring strap around your chest, which will take measurements of your heart rate, breathing rate and other related heart functions. There is no discomfort involved, but the strap does have to make contact with your skin in order to make accurate readings. Therefore you will be asked to put the strap on in private after receiving instructions on how it should be positioned. Once you have put on the heart monitor, a brain-wave measuring device called an electroencephalograph (EEG) will be positioned on your head. This device uses electrodes to measure the electric activity of your brain and in order to facilitate this measurement the electrodes needs to make contact with your scalp and is moistened with salt-water to increase conductivity. You will experience no discomfort whilst wearing the device. When the equipment has been set up correctly the testing procedure will commence.
© University of Pretoria

Appendix A INFORMED CONSENT
A
Prior to your performance, you will be required to sit still, in a comfortable position for 3 minutes with your ‘eyes open’, followed immediately by 3 minutes period with your ‘eyes closed’. When the 3 minutes ‘eyes closed’ period has passed you will start with your performance. Please remain quite throughout all these steps. Talking will cause inaccuracies in the measurement and you are asked kindly to refrain from talking or making any sudden movements. When you have completed your performance, you will be asked to sit again for 3 minutes with your ‘eyes open’ followed by another 3 minute period with your ‘eyes closed’. This completes the testing session.
It is important that you understand the sequence of events required and you are encouraged to ask at any point in time if you are unsure about the procedure. Please remember that throughout this procedure you are requested to refrain from speaking. That being said, please feel free to bring any concern under the attention of the investigator at any point in time. When you are finished with all the steps we want to ask you a few questions about your experience and performance. This will conclude the testing procedures. Please note that pictures, video and audio recordings are done during testing in order to reflect the data captured against your performance for later analysis. These recordings might be used in academic presentations and future research under your written permission. All such pictures, video and audio recordings, will be used strictly for the reasons specified above and no other. All recordings, video and audio, will be made available to you for your own personal use and distribution.
What is the duration of the study? As described above, the testing session will be approximately 45-60 minutes in total, depending on how long your performance is. The questionnaire will take about 10 minutes to complete.
Has the research study received ethical approval? This research study protocol was submitted to the Faculty of Health Sciences Research Ethics Committee, University of Pretoria and written approval has been granted by that committee (S15/2015). The study has been structured in accordance with the Declaration of Helsinki (last update: 2004), which deals with the recommendations guiding studies in biomedical research involving human participants. A copy of the Declaration may be obtained from the investigator should you wish to review it.
What are your rights as participant in this research study?
3 min
EYES
CLOSED
3 min
EYES
OPEN
PERFORM 3 min
EYES
OPEN
3 min
EYES
CLOSED
© University of Pretoria

Appendix A INFORMED CONSENT
A
Your participation in this study is entirely voluntary and you have the right to withdraw or stop at any time without stating a reason. You have the right to information relating to the purpose, procedures and any other ethical considerations of the study. The investigator retains the right to withdraw you from the study if it is considered to be in your best interest or if the information supplied by you is inaccurate or false; or in the case where you did not follow the guidelines and regulations of the study.
What are the risks involved in this research study? There are no risks involved concerning your health, safety, comfort or interests in this study. If you have any concerns or feel fatigued you are asked to please bring this under the attention of the investigator at any point in time.
What are the benefits to you for participating in this research? In a broader sense, by participating in this research you are contributing to an area of creativity research that has not yet received much attention. Not much experimental research has been done on musicians (such as yourself) during live performing. Hereby, your involvement will help us gain more insight into the brain function and underlying physiological processes happening in the brain during creative performance. On a more personal level, we will give you all the video and audio recordings of your performance which you can use for your own personal causes, such as future auditions etc.
Confidentiality:
All information obtained during the course of this study are strictly confidential. Data that may be reported in scientific journals will not include any information which identifies you as a participant in this research study.
Any information uncovered regarding your test results or state of health as a result of your participation in this study will be held in strict confidence. You will be informed of any finding of importance to your health or continued participation in this study but this information will not be disclosed to any third party without your written permission.
Contact Details of Investigator
Mr Gehart Kalmeier
Department of Physiology, University of Pretoria
Cell: 0847244320
Email: [email protected]
© University of Pretoria

Appendix B INDEMNITY FORM AND QUESTIONNAIRE
B
QUESTIONAIRE AND INDEMNITY FORM
Subject Number: Number Date: DD MM YEAR
INDEMNITY
I hereby declare that I have read and understand the content of this document and my role and rights
in this study. I had the opportunity to discuss any relevant matters with the investigator and
participate in this research at my own risk. I will not hold the University of Pretoria responsible in the
unlikely event of an injury or any other negative impact that my participation in this study could confer
upon myself. I hereby give consent for my participation in the aforementioned study and give
permission that video/audio recordings of my performance may be used for academic presentations
and future research.
__________________________________ ________________________________________ Signed Date
I hereby give consent to the terms and conditions of the study, as discussed above.
Participant’s name (please print):
Date: DD MM YEAR Participant Signature:
Witness’s name (please print):
Date: DD MM YEAR Witness Signature:
Department of Physiology, Faculty of Health Sciences PO Box 2034, Pretoria, 0001 - Republic of South Africa Tel: (012) 420 4482 Fax: (012) 420 4483
© University of Pretoria
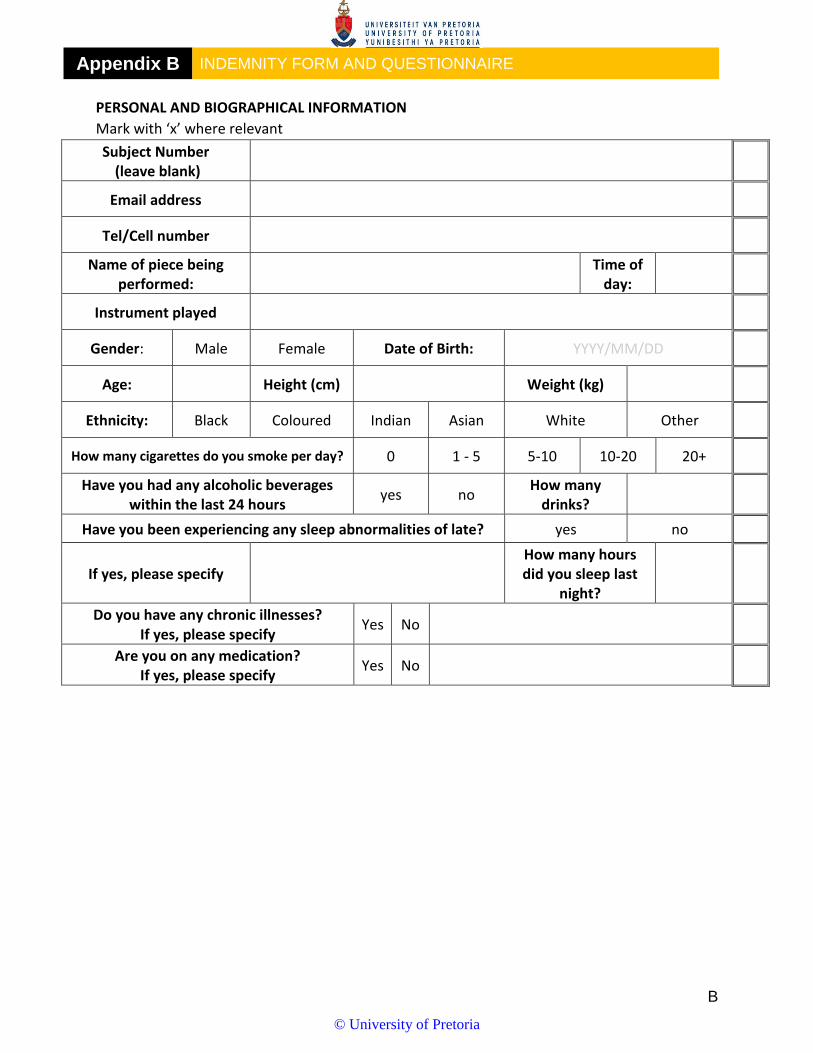
Appendix B INDEMNITY FORM AND QUESTIONNAIRE
B
PERSONAL AND BIOGRAPHICAL INFORMATION
Mark with ‘x’ where relevant
Subject Number (leave blank)
Email address
Tel/Cell number
Name of piece being performed:
Time of
day:
Instrument played
Gender: Male Female Date of Birth: YYYY/MM/DD
Age: Height (cm) Weight (kg)
Ethnicity: Black Coloured Indian Asian White Other
How many cigarettes do you smoke per day? 0 1 - 5 5-10 10-20 20+
Have you had any alcoholic beverages within the last 24 hours
yes no How many
drinks?
Have you been experiencing any sleep abnormalities of late? yes no
If yes, please specify How many hours did you sleep last
night?
Do you have any chronic illnesses? If yes, please specify
Yes No
Are you on any medication? If yes, please specify
Yes No
© University of Pretoria

Appendix C REFERENCE TO FIGURE 32
C
FIGURE 32
Composite graphs for all subjects showing power spectra over time and each individuals approximated ‘flow-zones’.
© University of Pretoria


![deis oracle cloud 2010 [Read-Only]...•Consolidate to WebLogic Server (or Tuxedo for C/C++/COBOL) •Use scripting to automate scaling Coherence Coherence Coherence Coherence JRockit](https://static.fdocuments.in/doc/165x107/60424d9ef7a72d35481332d7/deis-oracle-cloud-2010-read-only-aconsolidate-to-weblogic-server-or-tuxedo.jpg)