Physiologic Concepts of Hemodynamic Monitoring -...
114
Physiologic Concepts of Hemodynamic Monitoring Edward Hamaty D.O. FACCP, FACOI
Transcript of Physiologic Concepts of Hemodynamic Monitoring -...

Physiologic Concepts of Hemodynamic Monitoring
Edward Hamaty D.O. FACCP, FACOI
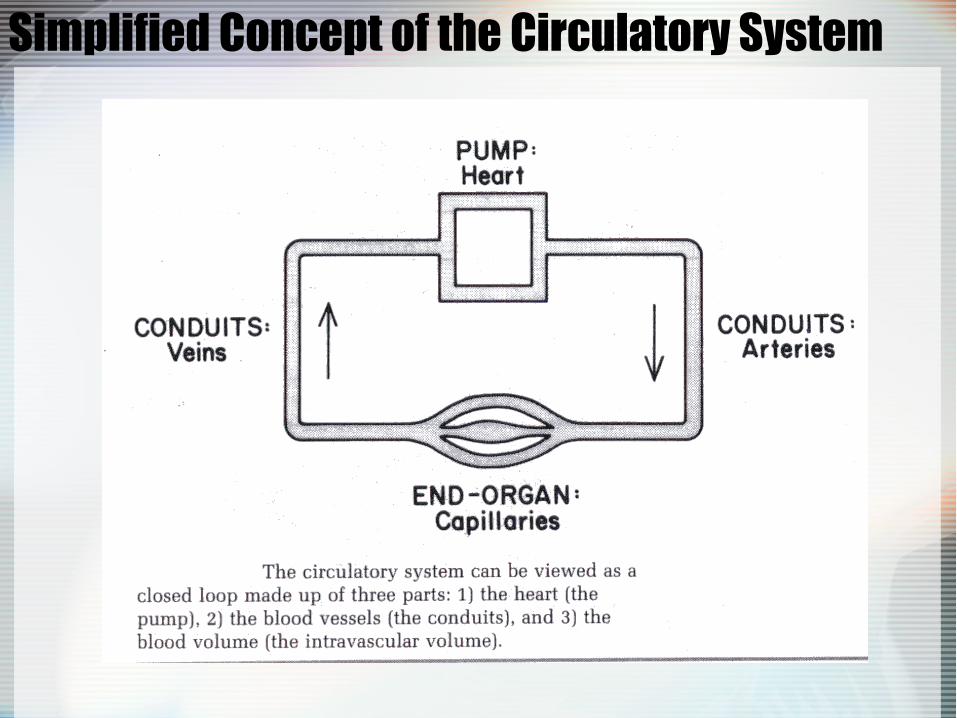
Simplified Concept of the Circulatory System

Blood Volume
• Normal Blood Volume– Female: 4.0 – 4.5 liters or 67 ml/kg– Male: 5.0 – 5.5 liters or 75 ml/kg
• Normal control of blood volume– Plasma refill– ADH– Aldosterone– Erythropoietin

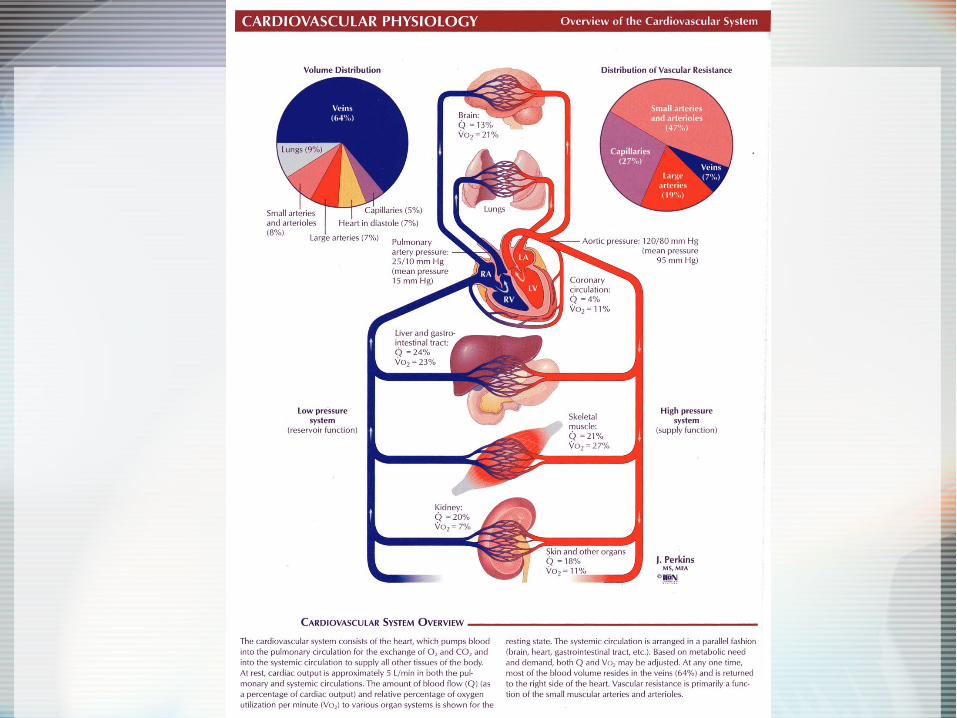
Distribution of Blood Volume

Blood Volume and Pressure-Systemic

Flow Resistance Map

Functional Correlates of PV Structure

Structural Characteristics of PV System

Blood Vessel Types

Vascular Resistance Control Points

Distribution of Cardiac Output

Poiseuille’s Law (pwä-zwēēz]


Vascular Resistance in Series/Parallel

Components of Vascular Resistance
• R = nL/r4.• It is seen that n, the viscosity, is the
fluid resistance factor.• L/r4 the blood vessel resistance factor.• The radius is the most important factor
in determining vascular resistance.• The viscosity is the second most
important.• The fourth power effect on flow is
profound.
Effect of Radius on Flow
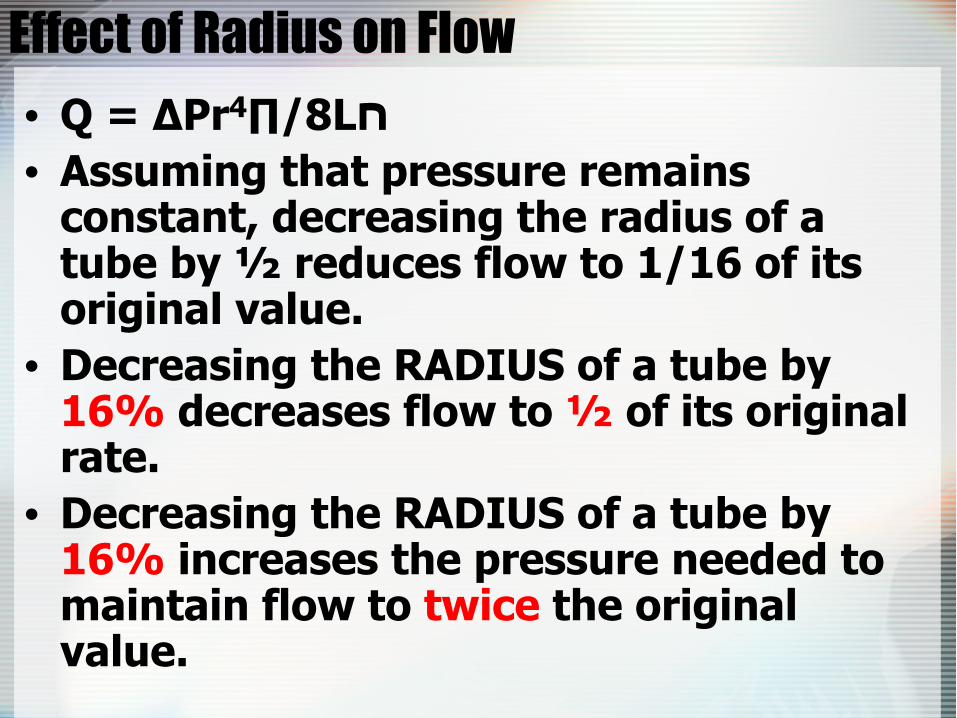
• Q = ∆Pr4∏/8Lח• Assuming that pressure remains
constant, decreasing the radius of a tube by ½ reduces flow to 1/16 of its original value.
• Decreasing the RADIUS of a tube by 16% decreases flow to ½ of its original rate.
• Decreasing the RADIUS of a tube by 16% increases the pressure needed to maintain flow to twice the original value.

Effect of Radius on Flow
• Rewritten as simple proportionalities:• Q = Pr4
• P = Q/r4
• Based on the proportionality for flow, it can be stated that because flow varies directly with r4, if pressure remains constant as radius decreases, flow decreases.
• Stated another way, if the radius decreases, pressure must increase to maintain flow.

Viscosity
• In a homogeneous liquid such as water, in an artificial system, viscosity is a constant.
• In the case of a two-phase medium such as blood flowing in an in vivo circulatory system, viscosity is NOT constant, but depends on several factors-– The concentration of the suspended
medium (the cells)– The velocity of flow– The radius of the vessel

Viscosity
• The relative viscosity of PLASMA is about 1.3 x water.
• The relative viscosity of whole blood depends mainly on the cell concentration or hematocrit.
• At a normal Hct of 42 to 45, the relative viscosity of blood is about 3.6 x water.
• However, because the relationship is exponential, an increase in 10 in the Hct from the level of 40 will increase the viscosity about 25% and an increase of 20 to the level of 60 will increase viscosity about 60%.

Viscosity
• Viscosity is related to:– Hematocrit– Blood Flow– Vessel Diameter
• The hematocrit is the most important factor governing blood viscosity.
• Viscosity of whole blood is about 3.5 times that of water.
• A decrease in hematocrit to half normal causes the viscosity of blood to decrease to 2 times that of water.

Viscosity
•Anemia, therefore, improves the rheologic properties of blood.•Polycythemic states have an adverse effect on blood flow. When the Hct is raised to 70% above normal, the viscosity of blood increases to 20 times normal.

Viscosity

Viscosity
• In low Hct states, such as anemia, viscosity and therefore vascular resistance both fall, resulting in increased cardiac output.
• In high Hct states, such as polycythemia and leukemia, with Hct of 60-70%, a profound increase in systemic and pulmonary vascular resistance occurs with a resultant elevation of BP.

Viscosity
• Vessel bore and flow rate are two additional factors affecting blood flow in a two-phase medium.
• In tubes less than 200 micrometers in diameter-which would include arterioles, capillaries, and venules- the relative viscosity of the blood decreases and offers less resistance to flow.
• This phenomenon, for which there is no satisfactory explanation, is sometimes called the Fahraeus-Lindqvist effect.

Viscosity• At low flow rates the apparent viscosity
increases (anomalous viscosity).
• This phenomenon has been attributed to the disposition of red cells in the flowing stream.– At higher velocities the cells accumulate in the
axial part of the stream.– At low velocities that have a more even distribution
and hence offer greater flow resistance.– At low velocities rouleaux formation may occur.– This effect is exaggerated in low flow states such
as burns or shock, causing pronounced cell clumping or sludge in the microcirculation with severe hindrance to flow and resultant tissue ischemia.

Viscosity
• Therefore, in different parts of the circulation there will be significant variations in blood vessel diameter, flow velocity, and Hct and that the net effect on viscosity is not always predictable.
• Present evidence suggests that the Hct effect is the most important and predominate one.
• Under special circumstances temperature may affect viscosity.– 2% rise in viscosity/1oC fall in temp.
Viscosity
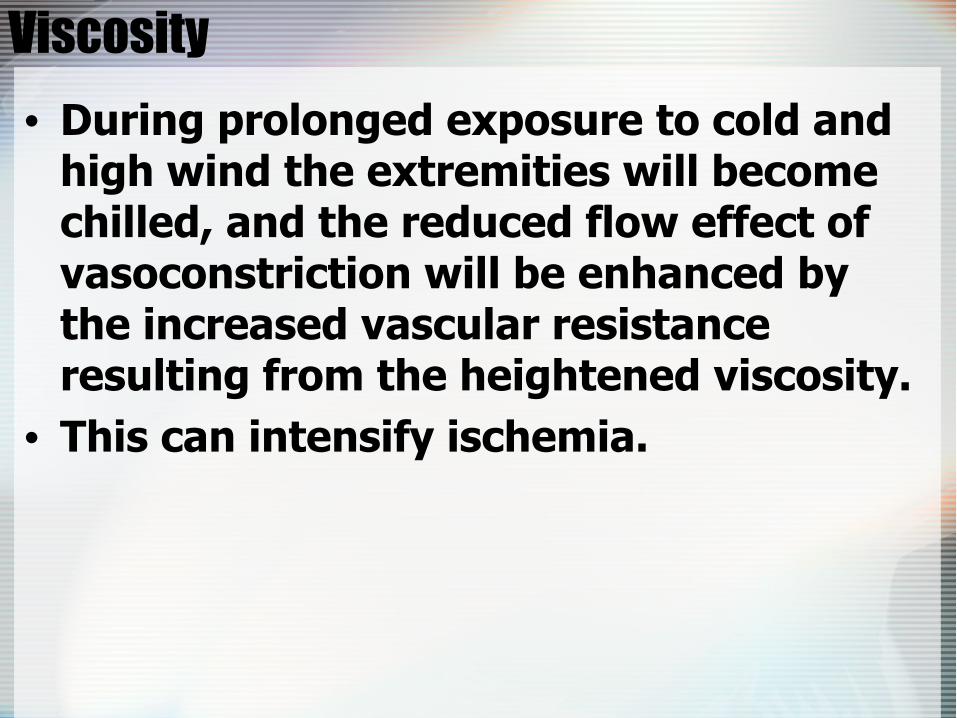
• During prolonged exposure to cold and high wind the extremities will become chilled, and the reduced flow effect of vasoconstriction will be enhanced by the increased vascular resistance resulting from the heightened viscosity.
• This can intensify ischemia.

Viscosity and O2 Delivery

Viscosity and Cardiac Output
Flow Velocity and Turbulence
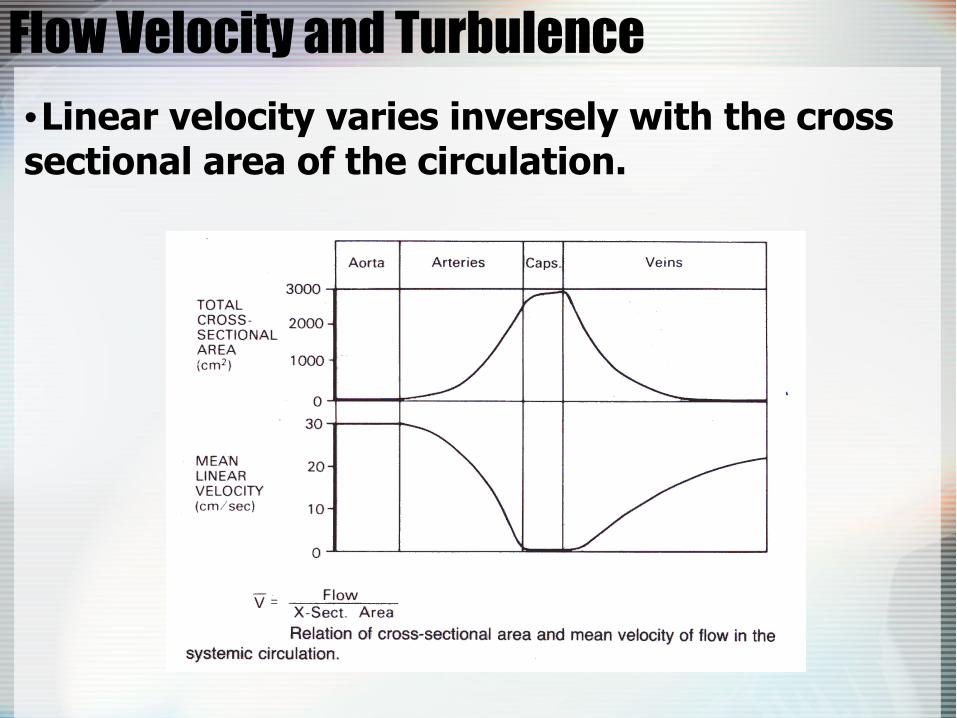
•Linear velocity varies inversely with the cross sectional area of the circulation.
Flow Velocity and Turbulence
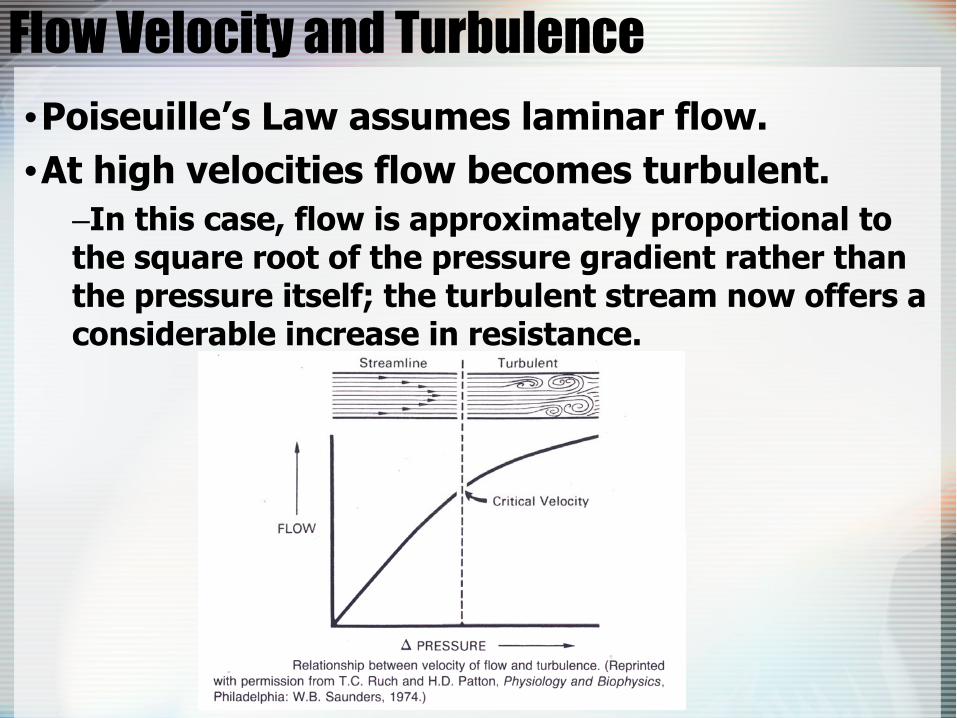
•Poiseuille’s Law assumes laminar flow.•At high velocities flow becomes turbulent.
–In this case, flow is approximately proportional to the square root of the pressure gradient rather than the pressure itself; the turbulent stream now offers a considerable increase in resistance.

Reynolds Number
•Reynolds has defined the factors affecting this phenomenon and stated that turbulence is likely to occur in a moving stream when the Reynolds ratio (Re) exceeds a value of about 1000 for blood or 2000 for homogeneous fluids.

Cell Function and Ion Concentrations
• In general, cell function is stimulated or depressed by ionic concentrations.
• This ionic influence may be described qualitatively in terms of the capacity to increase or depress irritability of nerve and striated muscle cells.
• A coefficient of irritability, K, has been related to EFC or plasma cationic concentrations by the following formula:

Cell Function and Ion Concentrations
• K = [Na+][K+][OH-] [Ca++][Mg++][H+]
The ions in the numerator are “irritability ions”, because increases in their concentrations heighten cell irritability and decreased concentrations depress it.
In contrast, the “paralysis ions” of the denominator depress cell irritability with increasing concentrations and intensify it with decreased concentrations.

Cell Function and Ion Concentrations
• Cardiac muscle is an exception to this general rule. For this tissue:
• K = [Na+][Ca++][OH-][K+][Mg++][H+]
Increased Ca++ causes vasoconstriction, increased K+ causes vasodilatation, increases in Mg++ cause powerful vasodilatation. Increased H+ also causes vasodilatation.
The only anions with significant effects include acetate and citrate, both of which cause mild vasodilatation.

Total Peripheral Resistance

Pulmonary Vascular Resistance/Pcap

Pulmonary Vascular Resistance/Pcap

Coronary Circulation

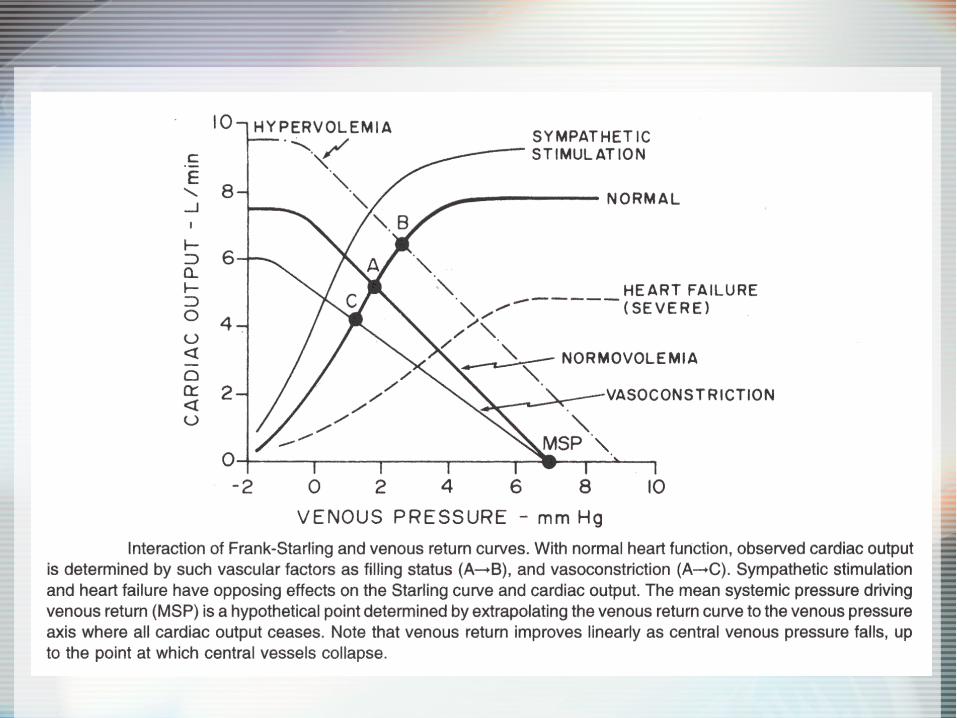
Venous Return Curves
• The main changes in cardiac output are determined by the metabolic requirements of the body, it is evident that the body sets the pace, not the pump!
• The heart, from a flow standpoint, plays a “permissive” role and does not regulate its own output.
• In human circulation, the heart functions as a “demand” pump and will eject only the minimum volume demanded of it.
Venous Return Curves
• The output of the heart, therefore, represents a balance between the VENOUS RETURN-the demand-and the ability of the heart to meet that demand.
• For these reasons, it is necessary to consider the regulation of cardiac output from two different standpoints:– The role of systemic factors in determining cardiac
output (i.e. what influences the return flow of blood to the heart)
– The role of cardiac factors in determining cardiac output (i.e. what influences the ability of the heart to pump out the blood returned to it.)

Venous Return Curves• “Mean circulatory filling pressure” is the
average of the pressures in all segments of the vascular system when each one is weighted in proportion to the compliance of its respective segment.
• This average pressure would be a single, integrated, hydrostatic measurement of the degree of filling of the circulation and would represent the force tending to propel blood toward the right atrium
• The mean circulatory pressure for the systemic system (PSF) is about 7 mm Hg.
• The mean circulatory pressure for the pulmonary circulation (PPF) is about 5 mm Hg.

Venous Return Curve

Venous Return Curve

Venous Return Curve

Venous Return Curve

Venous Return Curve
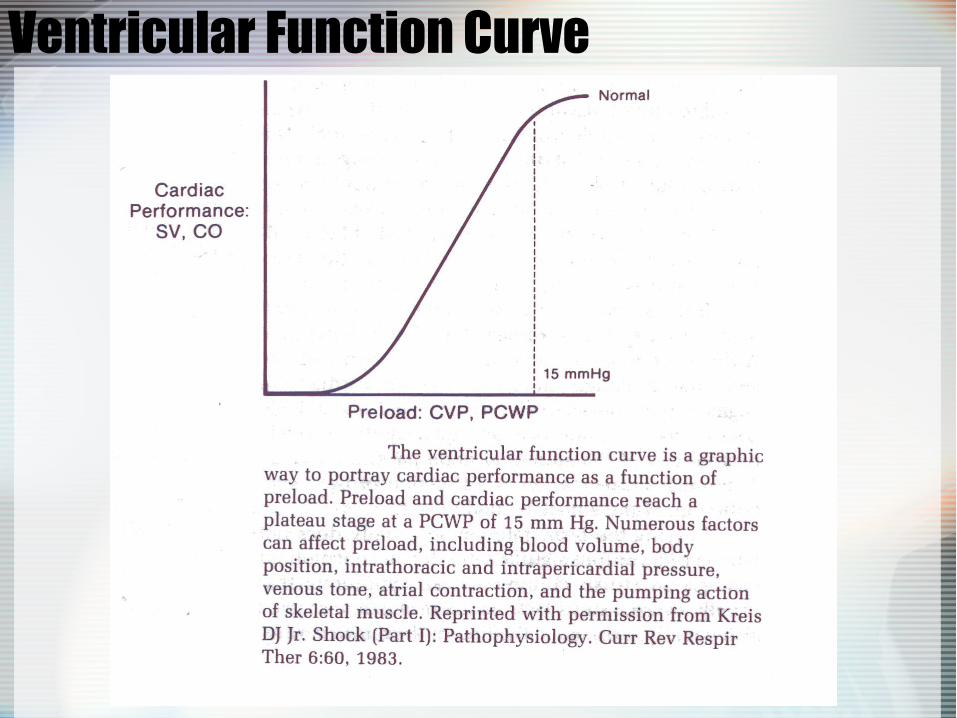
Ventricular Function Curve

Ventricular Function Curve

Ventricular Function Curve• Hypereffective Heart—normally only 2 factors:
– Nervous stimulation• Sympathetic stimulation• Parasympathetic inhibition
– Hypertrophy of the cardiac muscle• Hypoeffective Heart
– Inhibition of nervous excitation of the heart– Pathologic factors that cause abnormal heart
rhythm or rate of heartbeat– Valvular heart disease– Increased arterial pressure– Congenital Heart Disease– Myocarditis– Cardiac anoxia– Myocardial damage/toxicity


Cardiac Output

Cardiac Output

Cardiac Output

Cardiac Output

Pressure Volume Curves

Summary Slide

Determinants of Cardiac Output

Transmural Pressure

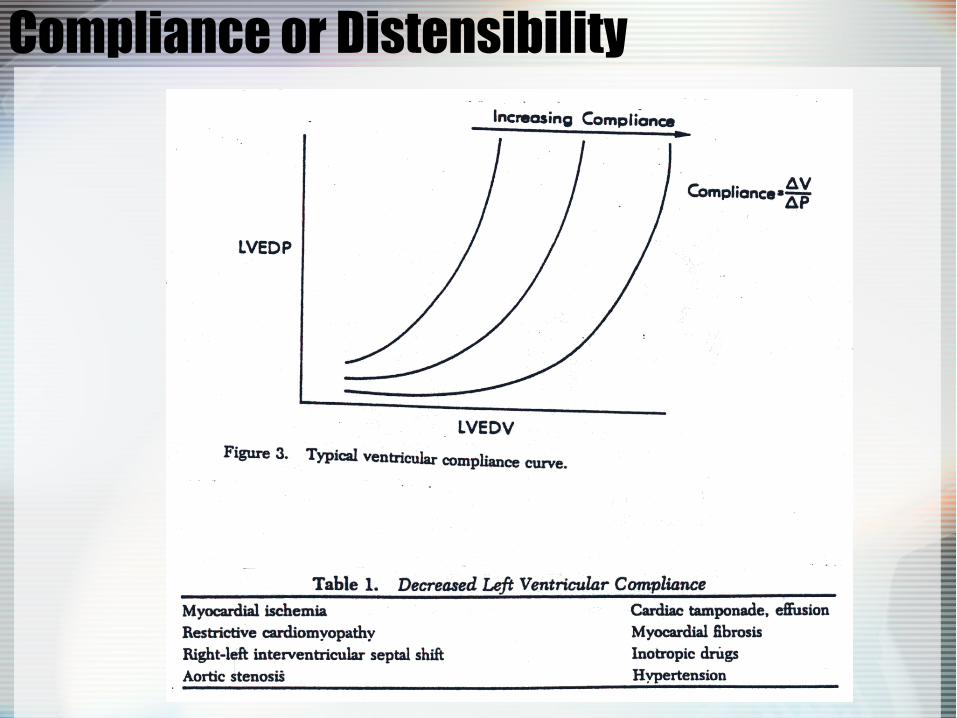
Compliance or Distensibility
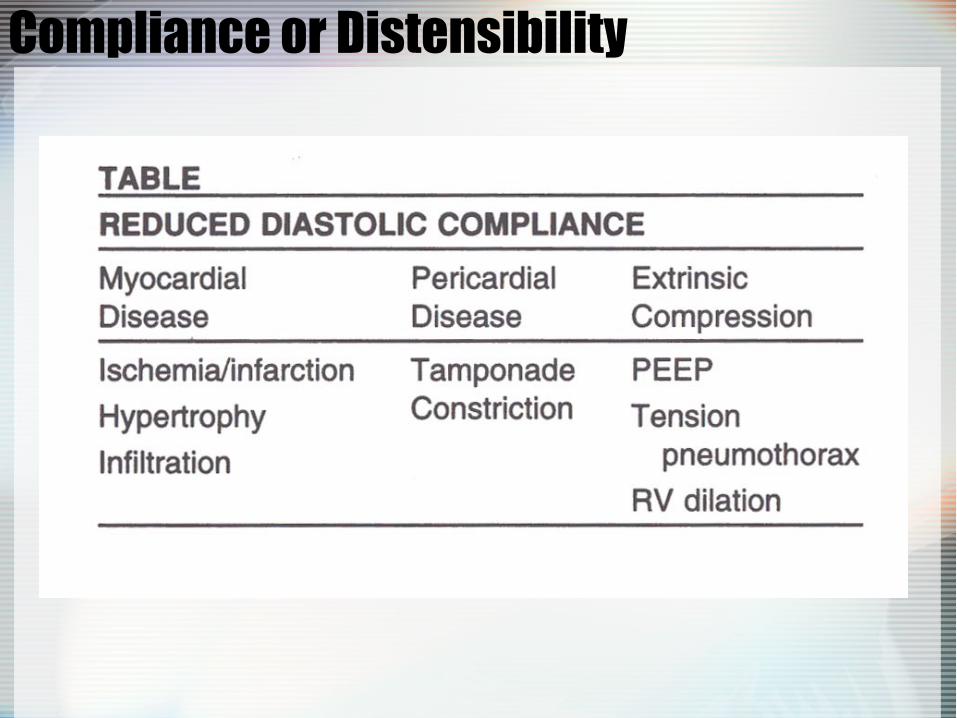
Compliance or Distensibility

Compliance or Distensibility
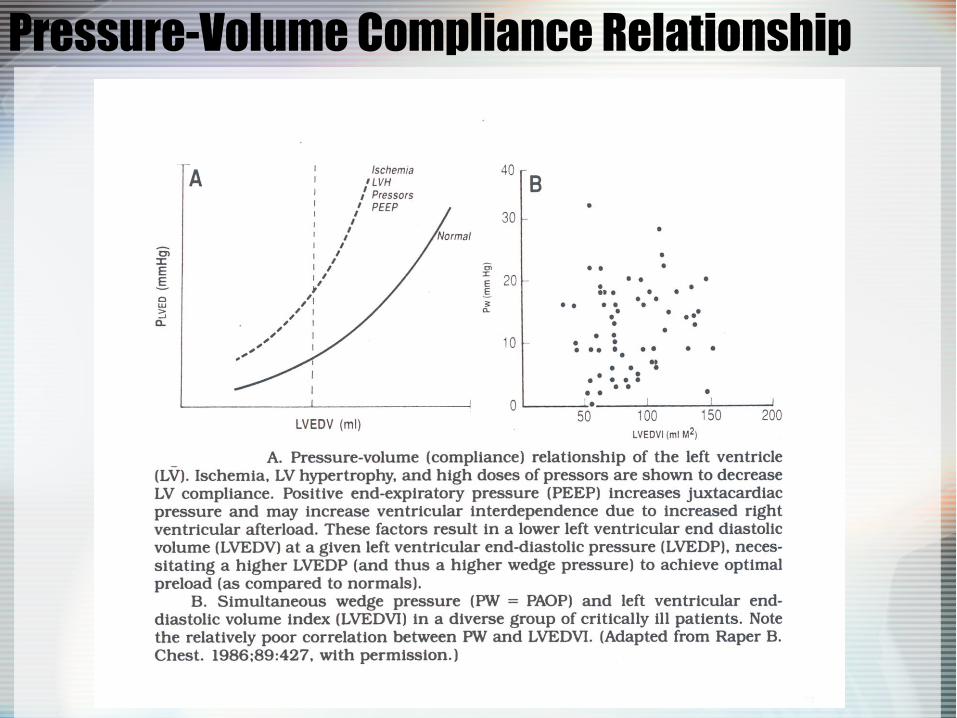
Pressure-Volume Compliance Relationship

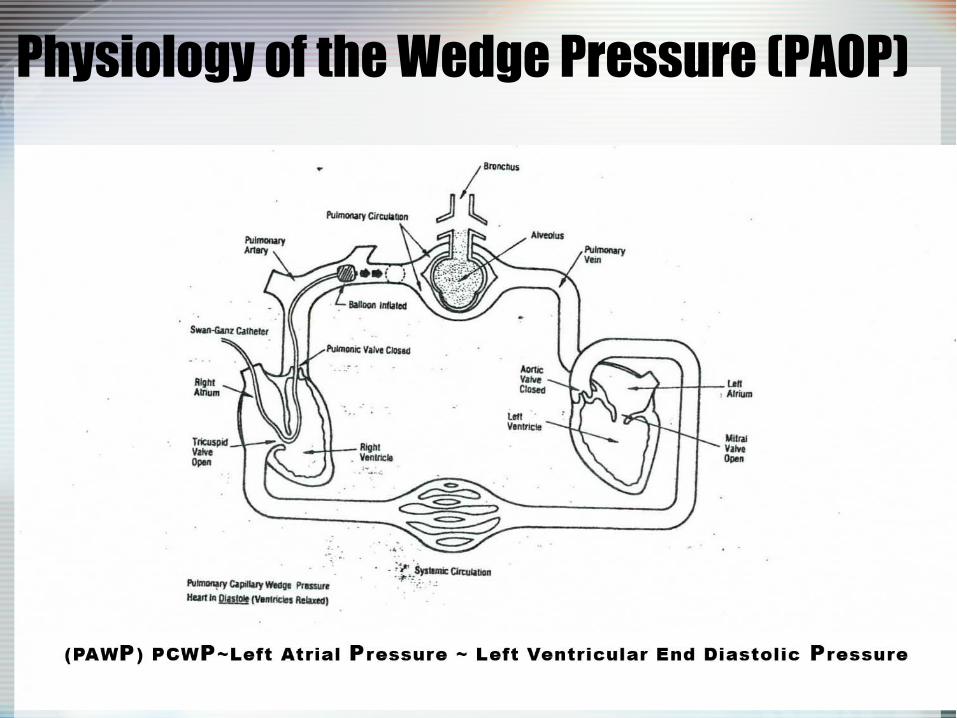
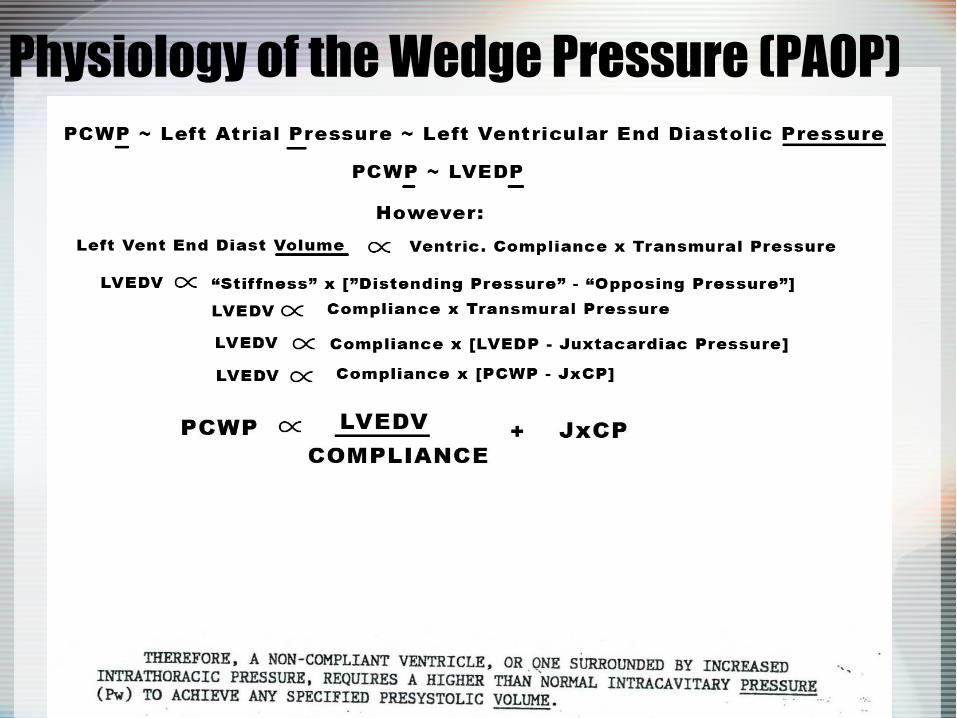
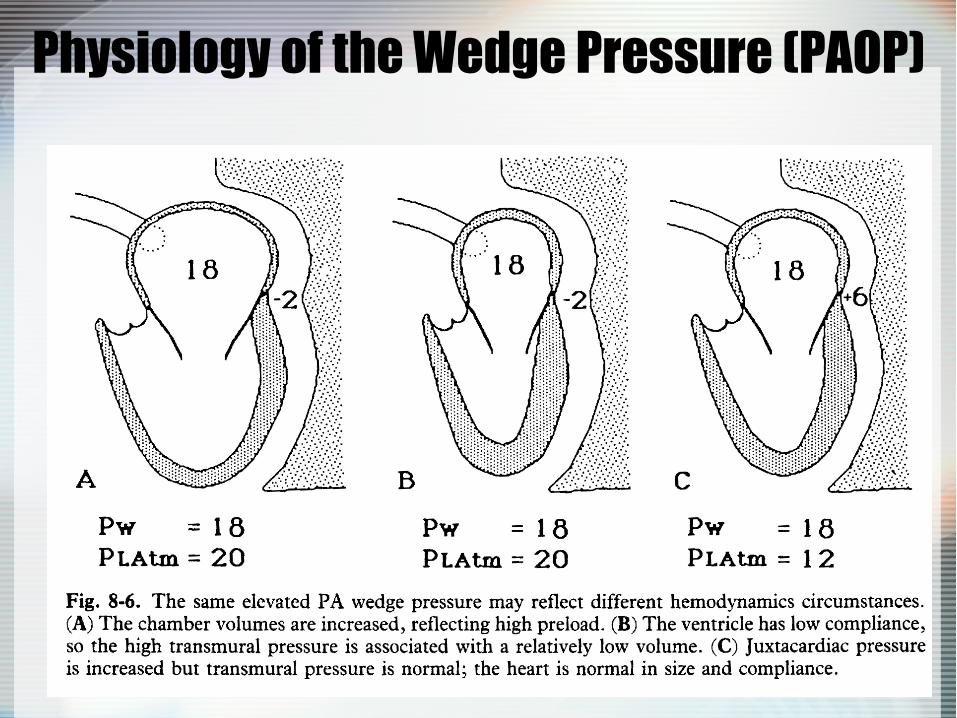
Physiology of the Wedge Pressure (PAOP)
Physiology of the Wedge Pressure (PAOP)
Physiology of the Wedge Pressure (PAOP)

Physiology of the Wedge Pressure (PAOP)
Juxtacardiac Pressure
Ventricular Compliance
LV Volume
Intravascular Pressure PAOP/Wedge Pressure

Physiology of the Wedge Pressure (PAOP)

Physiology of the Wedge Pressure (PAOP)
Physiology of the Wedge Pressure (PAOP)

Physiology of the Wedge Pressure (PAOP)Therefore, ONCE AND FOR ALL, THE
WEDGE PRESSURE IS NOT directly equal to PRELOAD (LEFT VENTRICULAR END DIASTOLIC VOLUME)!
It IS and always WAS the intravascular pressure resulting from the interplay of:
PCWP = LVEDVolume + JCPCompliance

Pressure-Volume Compliance Relationship

Pressure-Volume Compliance Relationship

Right vs Left Heart Properties
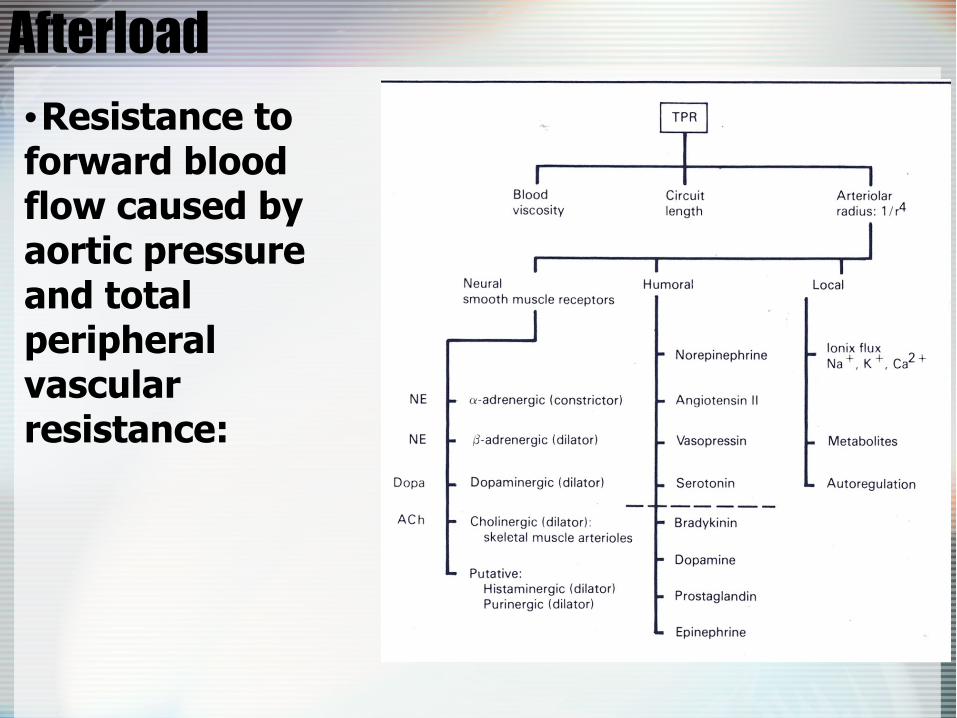
Afterload
•Resistance to forward blood flow caused by aortic pressure and total peripheral vascular resistance:
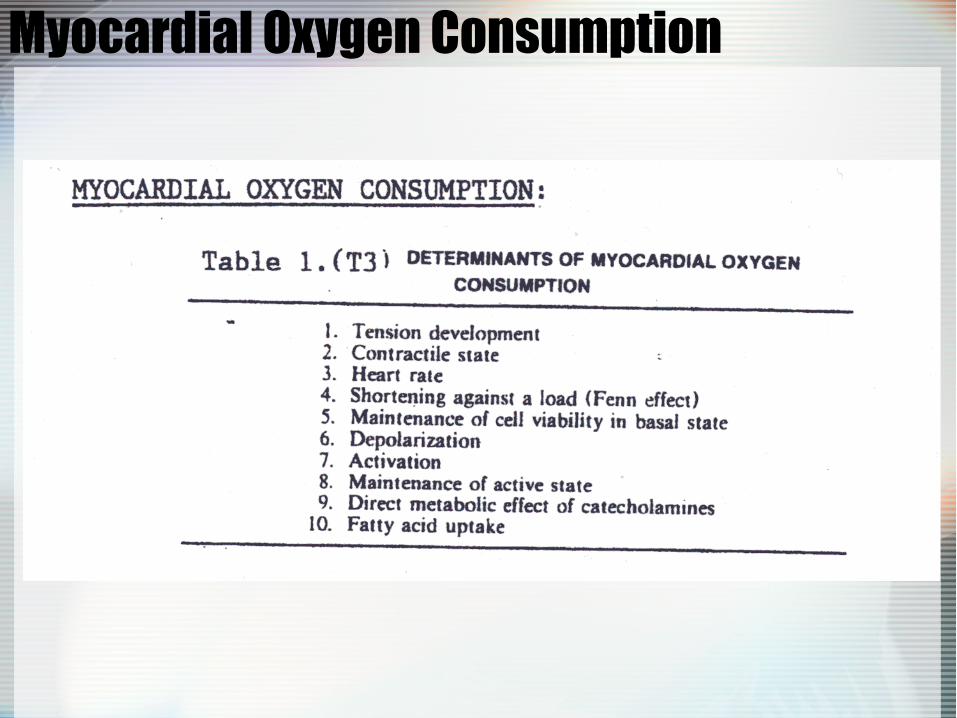
Myocardial Oxygen Consumption

Laplace and Wall Tension

CO and Oxygen Delivery

Oxygen Content

Oxygen Consumption

Oxygen Consumption

Normal Oxygen Values

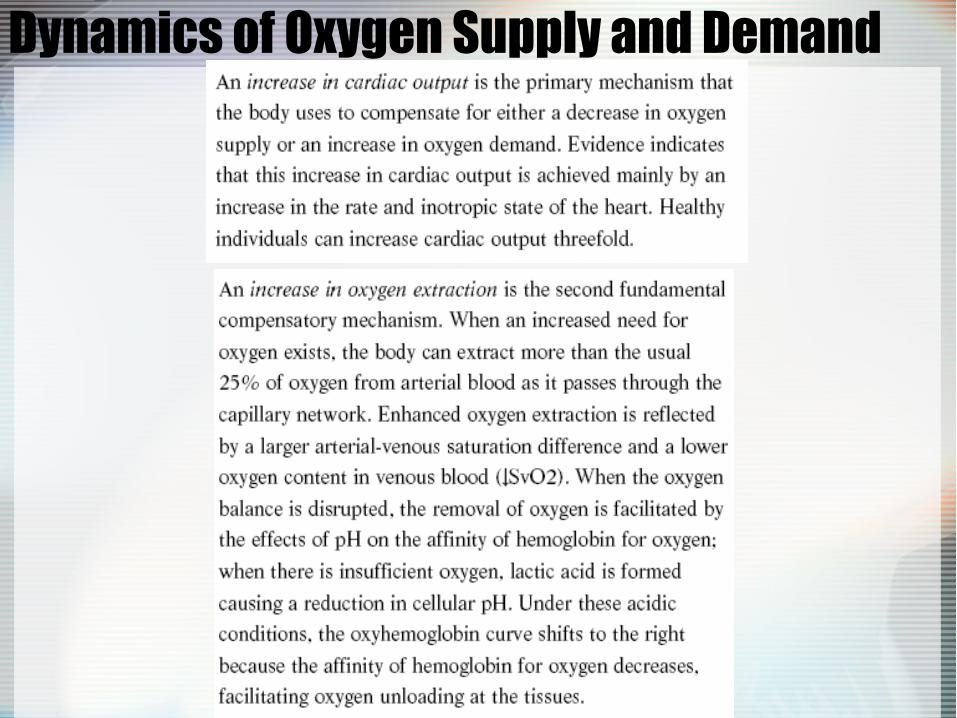
Dynamics of Oxygen Supply and Demand
• Compensatory Mechanisms– When the balance between oxygen supply
and demand is threatened, the body mobilizes its compensatory mechanisms to ensure adequate oxygen delivery.
– The two most important ones are an increase in cardiac output and an increase in oxygen extraction.
Dynamics of Oxygen Supply and Demand
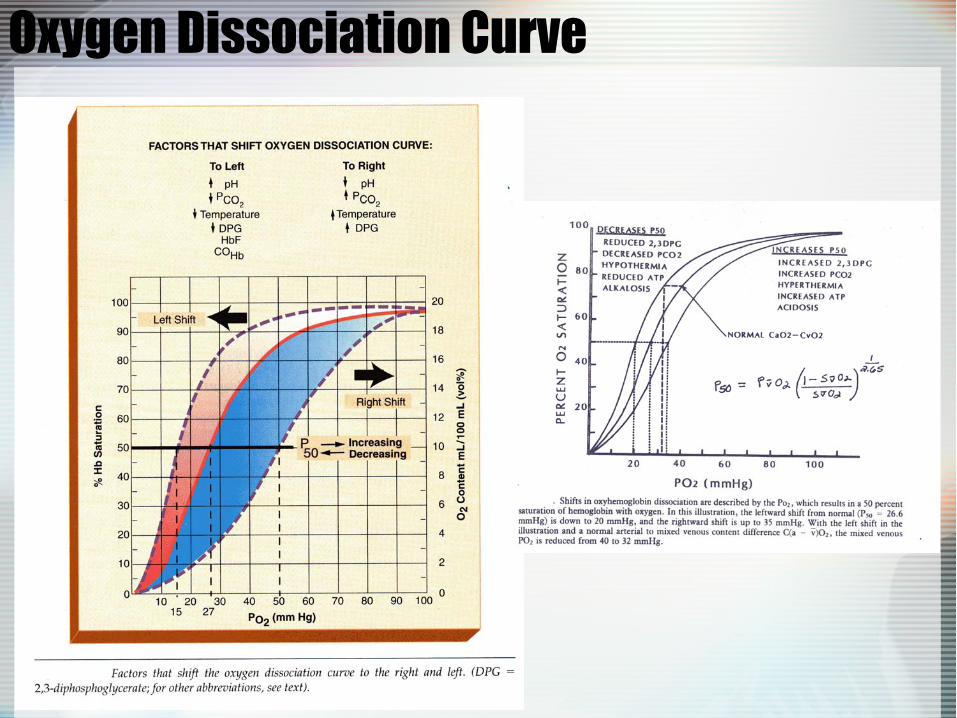
Oxygen Dissociation Curve

Oxygen Extraction

Oxygen Extraction

Specific Threats to Oxygen Balance

Specific Threats to Oxygen Balance

Specific Threats to Oxygen Balance

Specific Threats to Oxygen Balance
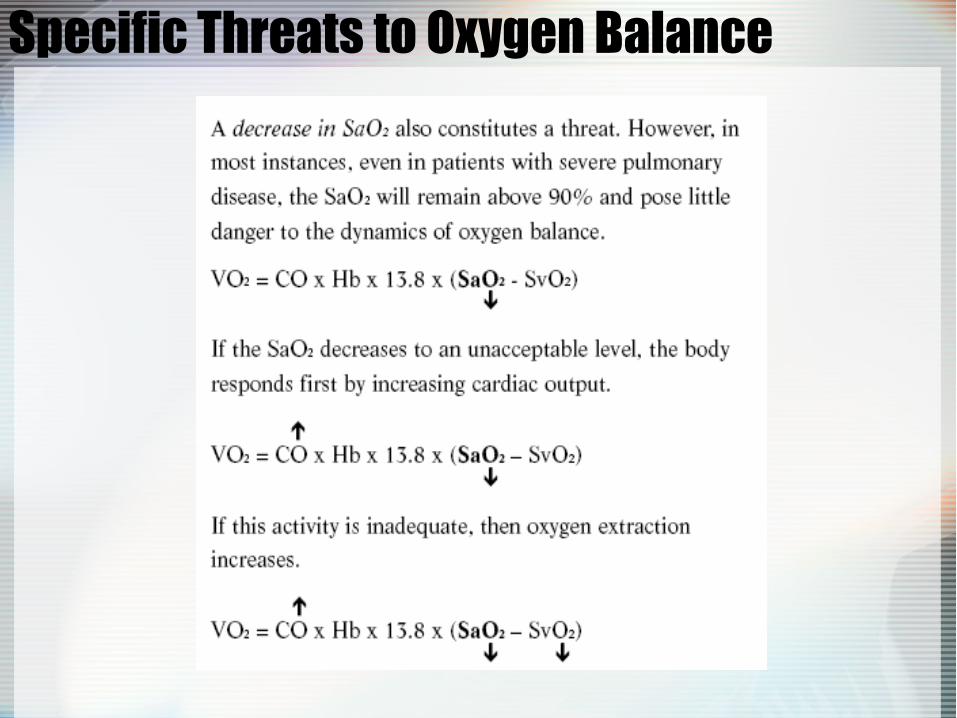
Specific Threats to Oxygen Balance
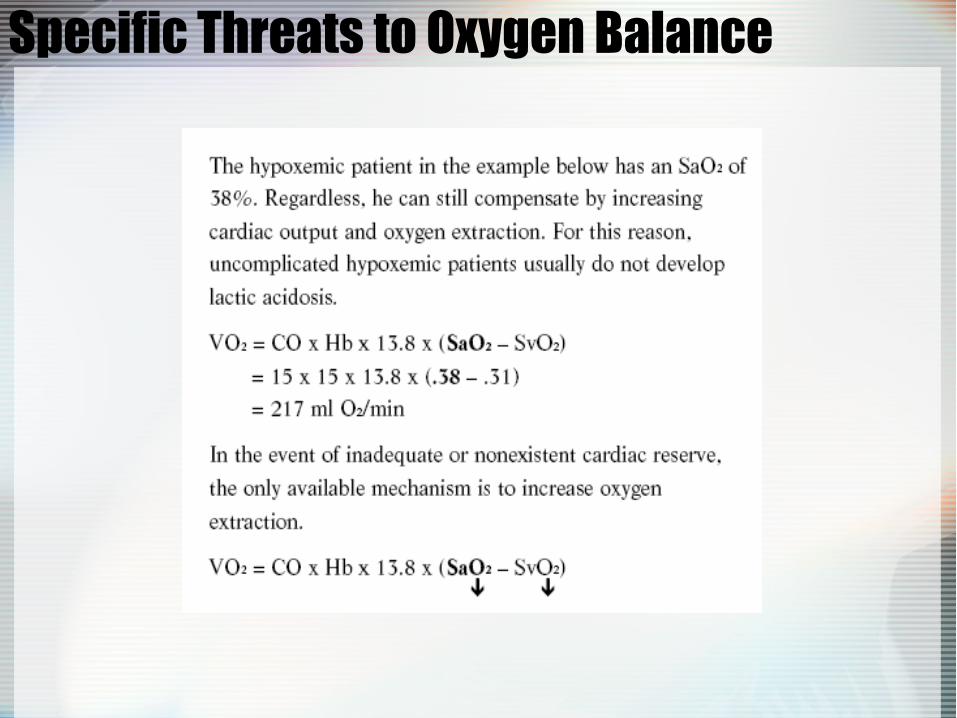
Specific Threats to Oxygen Balance

Specific Threats to Oxygen Balance

Specific Threats to Oxygen Balance
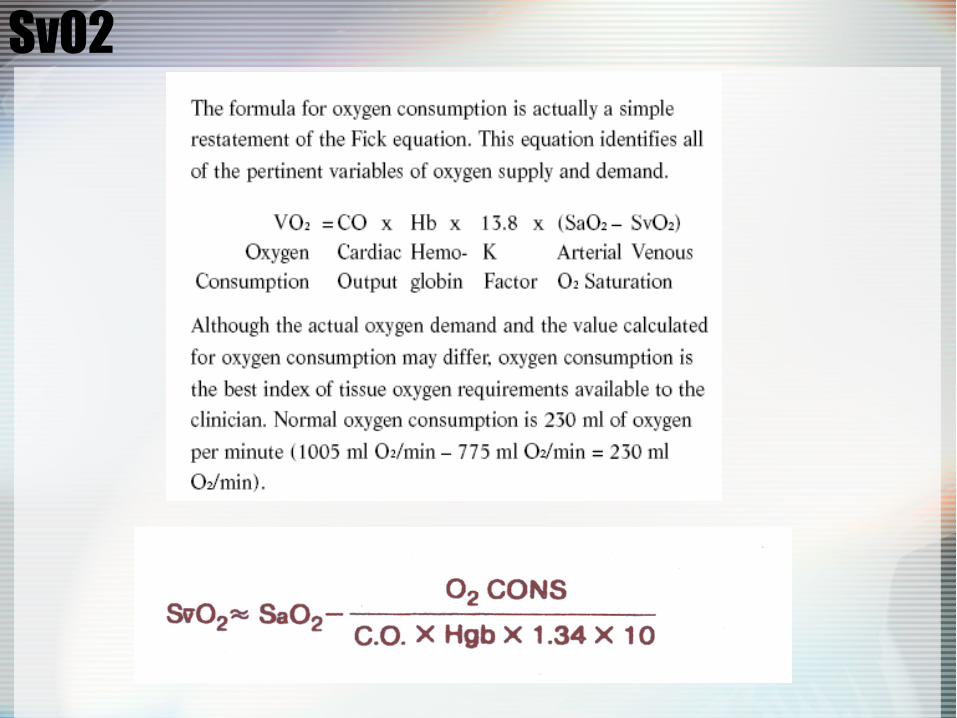
SvO2
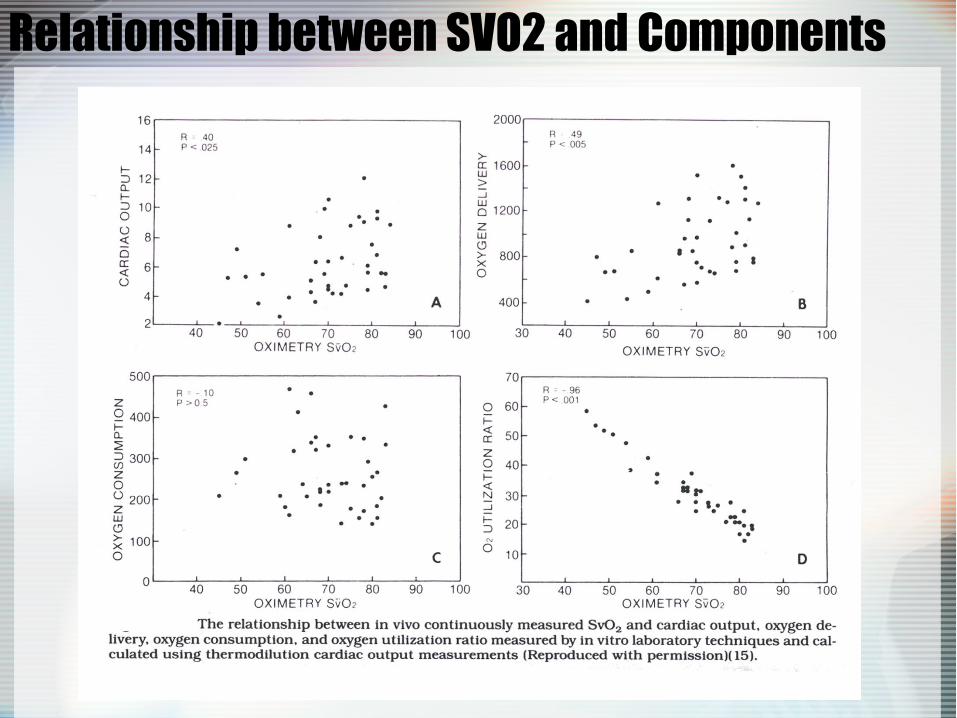
Relationship between SVO2 and Components

Oxygen Flow-Consumption Diagram
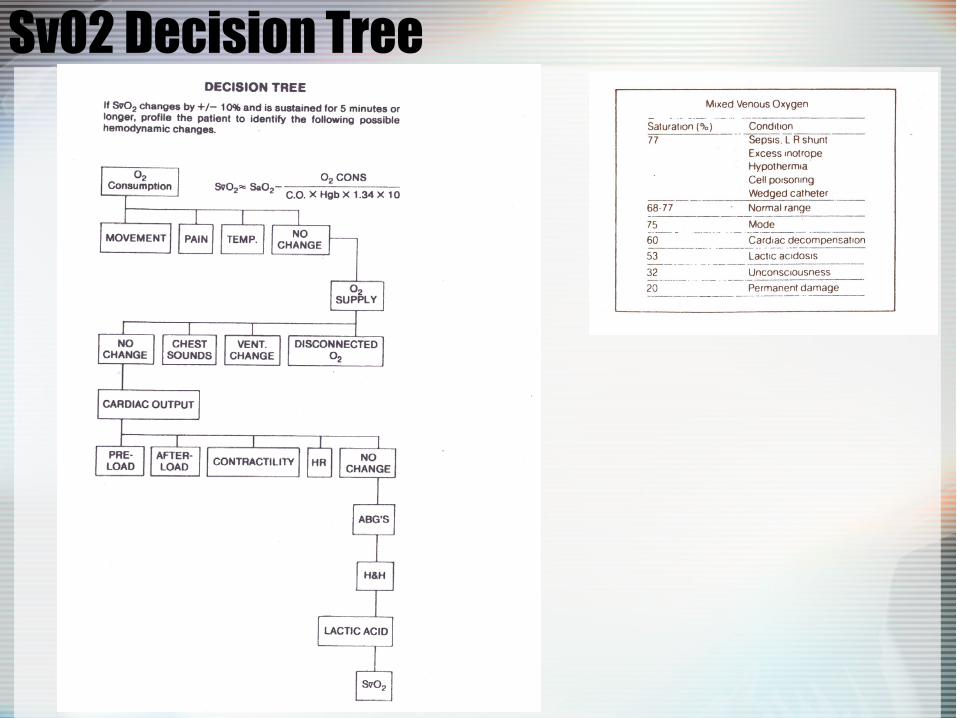
SvO2 Decision Tree

SvO2 and CvO2

SvO2 and CvO2
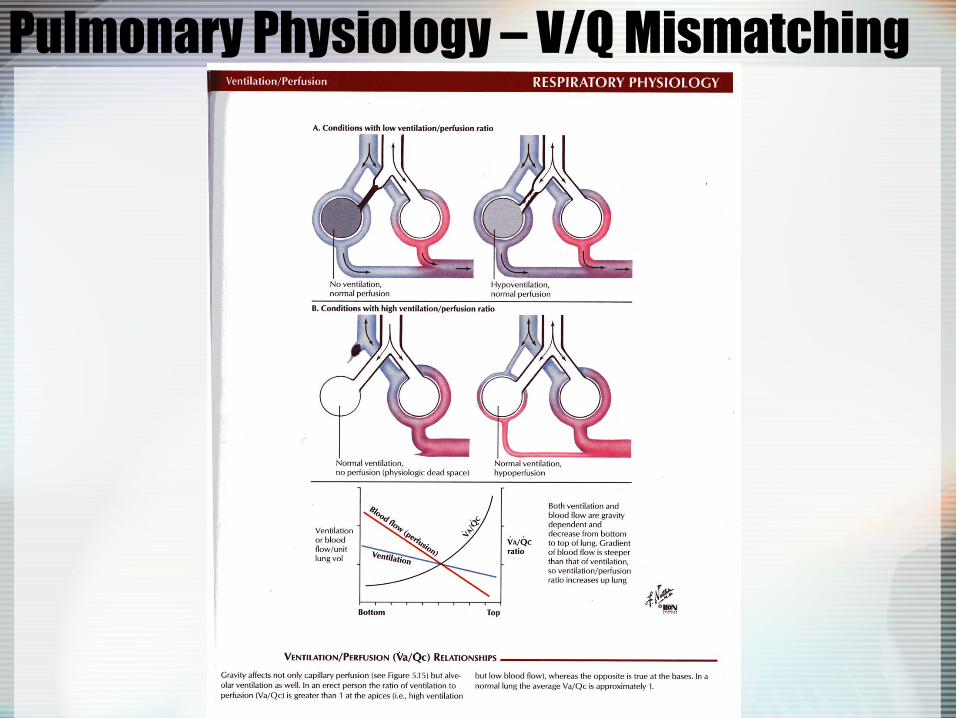
Pulmonary Physiology – V/Q Mismatching
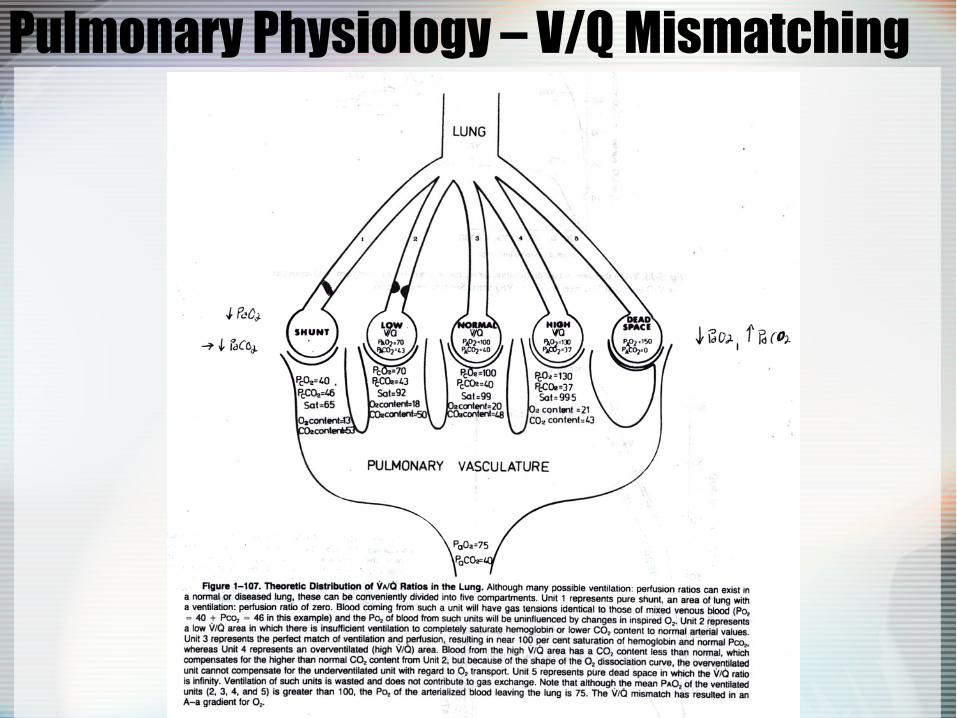
Pulmonary Physiology – V/Q Mismatching

Pulmonary Physiology – V/Q Mismatching

Pulmonary Physiology – Transit Time

Biphasic VO2-DO2 Model

Biphasic VO2-DO2 in Health and Disease

Slope of the Extraction-SvO2 Curve

Slope of the Extraction-SvO2 Curve
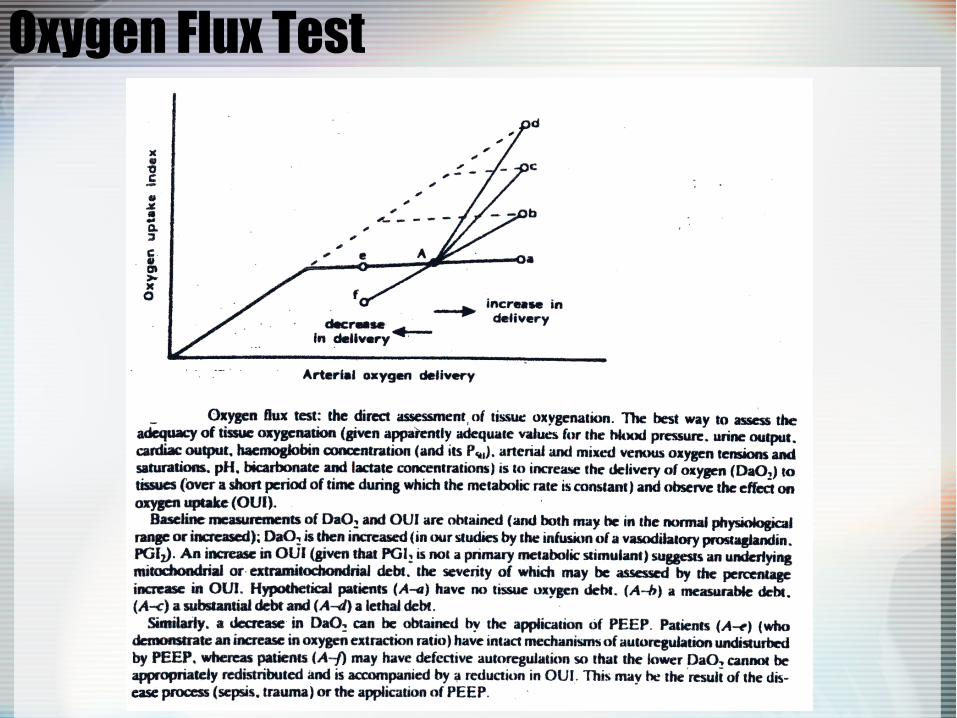
Oxygen Flux Test

Tissue Oxygenation Process