Physiochemical and Microbial Analysis of Soil and...
43
Physiochemical and Microbial Analysis of Soil and Water of Dhobiajharan Village (Proposed Coal Mine Site - Tubed) A Project Thesis Submitted in Partial Fulfillment of The Requirements For The Degree in Bachelor of Technology in Biotechnology Submitted by: SIBARAM BEHERA (109BT0020) Under Guidance of Prof. Mukesh Kumar Gupta Department of Biotechnology and Medical Engineering National Institute of Technology Rourkela-769008 2012-2013
Transcript of Physiochemical and Microbial Analysis of Soil and...

Physiochemical and Microbial Analysis of Soil and Water of Dhobiajharan
Village (Proposed Coal Mine Site - Tubed)
A Project Thesis Submitted in Partial Fulfillment of The
Requirements
For The Degree in
Bachelor of Technology in Biotechnology
Submitted by:
SIBARAM BEHERA
(109BT0020)
Under Guidance of
Prof. Mukesh Kumar Gupta
Department of Biotechnology and Medical Engineering
National Institute of Technology
Rourkela-769008
2012-2013
CERTIFICATE
This is to certify that, the thesis entitled “Physiochemical and Microbial analysis of Soil and
Water of Dhobiajharan Village (Proposed Coal Mine Site - Tubed)” submitted by Sibaram
Behera, in partial fulfillment of the requirement for the award of Bachelor of Technology degree
in Biotechnology at National Institute of Technology Rourkela, is an authentic work carried out
by him under my supervision. To the best of my knowledge, the matter embodied in the thesis
has not been submitted to any other University/Institute for award of any Degree/Diploma.
Date: Prof. /Dr. Mukesh Kumar Gupta
Place: Rourkela Dept. of Biotechnology & Medical Engineering
NIT Rourkela

iii
Contents
Sl. No. Title Page no.
1. Chapter I
Introduction 1
1.1 Site Location 3
1.2 Objectives 4
2 Chapter II
2.1 Soil 6
2.2 Soil color 6
2.3 Soil types 7
2.4 Physiochemical parameters of soil 8
2.5 Soil bacteria 8
2.6 Identification of bacteria 9
2.7 Bergey‟s manual 10
2.8 Water 10
3 Chapter 3
3.1 Sample Collection 12
3.2
3.2.1
3.2.2
3.2.3
3.2.4
Physiochemical analysis
pH
Organic matter
Calcium carbonate
Water content
12
12
13
13

iv
3.2.5 Dissolved oxygen 13
3.3
3.3.1
3.3.2
3.3.3
3.3.4
3.3.5
3.3.6
3.3.7
3.3.8
Microbial analysis
Isolation and Total bacterial count
Gram staining
Catalase test
Oxidase test
Indole test
Citrate test
Methyl Red test
Urease test
14
14
15
15
16
16
17
18
4 Chapter 4
4.1 Soil Characteristics 20
4.2 Total bacterial count 20
4.3
4.3.1
4.3.2
4.3.3
4.3.4
4.3.5
4.3.6
4.3.7
Biochemical test results
Gram stain
Catalase test
Oxidase test
Indole test
Citrate test
Methyl red
Urease
22
23
24
24
25
25
26
4.4
4.5
Water parameter
Discussion
27
27

v
5 Chapter 5
Conclusion and future work 32
6 References 33

vi
List of Figures
Figure No. Description Page No.
Figure 1 Map showing site location 3
Figure 2 Isolated bacterial colonies 21
Figure 3 Pure culture isolated by streak plate
method
22
Figure 4 Gram staining result 23
Figure 5 Catalase test result 23
Figure 6 Indole test result 24
Figure 7 Citrate test result 25
Figure 8
Figure 9
Methyl Red test result
Urease test result
26
27
List of Tables
Table No Description Page No.
Table-1 Different physiochemical parameters
of soil
8
Table-2 List of common soil bacteria 9
Table-3 Steps of Gram staining 15
Table-4 Composition of kovacs reagent 16
Table-5 Simon‟s citrate medium composition 17
Table-6 Composition of MR-VP broth 18
Table-7 Composition of urease broth medium 18
Table-8 Physiochemical parameter of soil 20
Table-9
Table-10
Table-11
Table-12
Table-13
Table-14
Table-15
Table-16
CFU values
Gram stain result
Catalase test results
Oxidase test results
Indole test results
Citrate test results
MR test results
Urease test results
20
22
23
24
24
25
26
26
Table-17 Water parameter result 27
Table-18 Soil classification according to pH 29
Table-19 Comparison of Enterobacter and
unknown D2
30
Table:20 Comparison of Streptococcus and
unknown D1
30
vii
Abbreviations
EIA: Environmental Impact Assessment
IAIA: International Association for Impact Assessment
EC: Electrical Conductivity
TDS: Total Dissolved Solids
DNA: Deoxyribonucleic acid
rRNA: Ribosomal ribonucleic acid
HCl: Hydrochloric acid
CFU: Colony Forming Unit
DMAB: p-dimethylaminobenzaldehyde
MR-VP: Methyl Red -Voges-Proskauer
viii
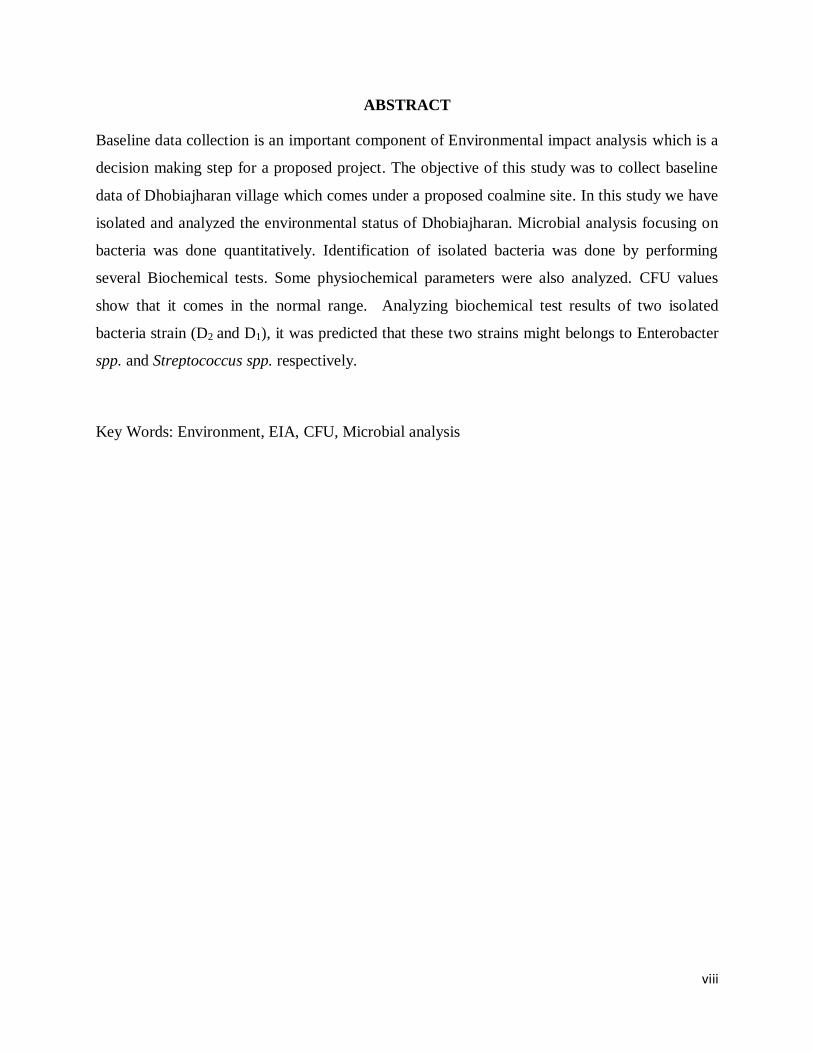
ABSTRACT
Baseline data collection is an important component of Environmental impact analysis which is a
decision making step for a proposed project. The objective of this study was to collect baseline
data of Dhobiajharan village which comes under a proposed coalmine site. In this study we have
isolated and analyzed the environmental status of Dhobiajharan. Microbial analysis focusing on
bacteria was done quantitatively. Identification of isolated bacteria was done by performing
several Biochemical tests. Some physiochemical parameters were also analyzed. CFU values
show that it comes in the normal range. Analyzing biochemical test results of two isolated
bacteria strain (D2 and D1), it was predicted that these two strains might belongs to Enterobacter
spp. and Streptococcus spp. respectively.
Key Words: Environment, EIA, CFU, Microbial analysis
1| P a g e
Chapter-1
INTRODUCTION

1 | P a g e
Environment and humans are are highly dependent on each other. The term natural environment,
commonly referred as „environment‟, is used to denote everything that surrounds us. It therefore,
includes the living things like all types of animals (including humans) and plants, as well as the
non-living things (i.e. everything other than the living organisms) including the three basic
elements of nature, i.e. land, water and air. The living world is usually called the „biotic world‟;
while the non-living things are referred as the „abiotic world‟. As a matter of fact, every entity in
an environment interacts with its environment, causing its influence on the environment;
accordingly gets influenced by its environment. Humans being a part of the biotic component of
the environment eventually get affected by their natural environment and accordingly cause an
impact on the environment [1].
In the natural environment in the biosphere, there exists a perfect balance or equilibrium between
the various organisms and this is known as the ecological balance. In this equilibrium state, the
relative numbers of different organisms in a particular environment remain constant. However,
this ecological balance may get disturbed when the changes take place in the natural
environment. When the balance get disturbed, all the components of environment get affected by
this. The disturbance in the balance may be due to various reasons (e.g. species variation,
population variation, natural hazards or man-made causes etc.). Now-a-days Man made cause is
prominent over the other cause for the disturbance in ecological balance disturbance and
biodiversity loss.
Earth‟s most unique feature is the existence of life, and the most extraordinary feature is
diversity in life. Approximately 9 million types of animals, plants, protists and fungi inhabit the
Earth. At the first Earth Summit, it was declared by majority of the world‟s nations that human
actions were dismantling the Earth‟s ecosystems, eliminating species, genes and biological traits
at an alarming rate [2]. The impact of human activity on environment is also known as
anthropogenic impact on environment. The human activities such as industrialization,
urbanization, mining activity etc. affect the environment most. For example the ecological
effects of roads which is reviewed by Seiler Andreas [3]. The number of reservoir construction is
increasing as the demand of water rising worldwide. Constructions of large freshwater reservoirs
are associated with serious impacts upon natural environment. Morley Neil J [4] reviewed the
anthropogenic effects of a reservoir construction particularly focusing on parasite fauna of
aquatic wildlife.

2 | P a g e
An environmental impact assessment (EIA) is an approach of assessment of the possible positive
or negative impact that a proposed project may have on the environment, together considering
the environmental, economic and social aspects. The purpose of the assessment is to ensure that
decision makers consider the ensuing environmental impacts when deciding whether to proceed
with a project. In simple word this is a decision making step. The International Association for
Impact Assessment (IAIA) defines an environmental impact assessment as “the process of
identifying, predicting, evaluating and mitigating the biophysical, social, and other relevant
effects of development proposals prior to major decisions being taken and commitments made”
[5]. This decision making process was introduced with the purpose of identifying or evaluating
the potential beneficial and adverse impacts of the proposed projects on the environment, taking
into account environmental, socioeconomic, cultural and aesthetic considerations. These aspects
are critical for determination of the viability of a project and to decide if a project should be
granted environmental clearance.
An EIA concentrate on conflicts natural resource constraints and problems which might affect
the future of a project. It also involves the prediction of how the project could harm to people,
their livelihoods, and the other nearby developmental activities. After potential impact
prediction, the EIA identifies mitigation approaches to minimize the impacts and to improve the
project viability. An EIA aims to identify the impacts at an early stage of the project planning
and design. So that the project can be modified accordingly in order to reduce the adverse effects
of the project.
Baseline data collection is an important segment of environmental impact assessment (EIA).It
describes the existing environmental status of the identified study area. There are various areas
(e.g.-water, air, land, noise, biological etc.) which are primarily concerned for EIA.
The population and kinds of microorganisms present in soil depend on many environmental
factors; nutrients availability, available moisture, degree of aeration, pH, temperature etc. Soil
bacteria and fungi play pivotal roles in various biochemical cycles and are responsible for the
recycling of organic compounds [6]. Therefore result obtained from microbial analysis give
information about soil health. Bacteria make up the most abundant group of microorganisms in
the soil (3.0 x 10⁶ – 5.0 x 10
8) per gram of soil, followed by the actinomycetes (1.0 x 10
6 – 2.0
x107), fungi (5.0 x 10
3 – 9.0 x 10
6), yeast (1.0 x 10
3 – 1.0 x10
6), algae and protozoa (1.0 x 10
3-

3 | P a g e
5.0 x 10⁵) and nematodes (50 – 200) counts per gram of soil [6]. Therefore microbial analysis of
soil is essential to know about soil health.
Physicochemical analysis of soil and water provides information about the current environmental
status, for example pH of water.
1.1 Site Location
The village (Dhobiajharan) comes under the proposed coalmine site-tubed, Jharkhand. The tubed
coal block is located at Latehar district of the state of Jharkhand.The full village comes in the
proposed coal mine area. A map showing Dhobiajharan is presented below.
Figure-1: Map showing site location
4 | P a g e
1.2 Objectives
The present work focused on baseline data collection for EIA of Dhobiajharan village. The
detailed objectives were:
Quantitative analysis of soil living Bacteria.
Identification of isolated bacteria.
Physiochemical analysis of soil
Physiochemical analysis of water

5 | P a g e
Chapter-2
LITERATURE REVIEW
6 | P a g e
2.1 Soil
Soils are particulate materials of the outer crust of the earth surface formed from the continuous
weathering of the underlying parental rocks. Therefore, the type of soil is a function of the nature
of the underlying rocks. Soil formation has been reported to be combination of various
interrelated factors of parental materials, climate, organisms, topography and time [7]. Soil is
important to everyone directly or indirectly.
Soil is a complex ecosystem where living organisms play a key role in the maintenance of its
properties. Soil is a highly complex medium influence by environmental and physicochemical
parameters, creating a varied habitat for a diverse range of soil microorganisms. Soil quality can
be assessed by analyzing different physiochemical parameters with the analysis of microbial
diversity .These are the various indicators which provide the actual condition, nature and quality
of the soil.
2.2 Soil Color
Soil color does not affect the behavior and use of soil; however it can indicate the composition of
the soil and give clues to the conditions that the soil is subjected to. Soil can exhibit a wide range
of color; gray, black, white, reds, browns, yellows and under the right conditions green [8].Color
and distribution pattern of soil results from both chemical and biological processes, especially
redox reactions. As the soil contains various minerals, organic compounds so the combination
lead into new and colorful compounds. Reducing environment produce disrupted color pattern
but aerobic environment result in uniform pattern of color change. Yellow or red soil indicates
the presence of iron oxides. Dark brown or black color in soil indicates that the soil has high
organic matter content. Due to presence of water wet soil appears darker than dry soil. Soil color
is get affected by oxidation rate which is dependent upon water content. High water content
means less air in the soil, specifically less oxygen. In well drained (oxygen rich soils) red and
brown colors caused by oxidation are more common, as opposed to in wet (low oxygen) soils
where the soil usually appears grey. The presence of specific minerals can also affect soil color.
Manganese oxide causes a black color, glauconite makes the soil green and calcite can make soil
appearance white [8].
7 | P a g e
2.3 Soil types
Soil is basically of 5 types [9], these are:-
Sandy Soil:
This is light and dry in nature. Approximately no moisture content and absorb heat
quickly. This is good for the production of early crops. It is fit for cultivation any time of
the year but it need to be watered frequently.
Clay Soil:
Clay soil is also called „late‟ soil. The soil serves as an excellent retort for the dry season,
as it has a high water retention quality. For improving texture, it is necessary to drain clay
soil frequently. The soil becomes unmanageable during rainy season, as it becomes
„sticky‟. On the other hand, during draught, it becomes „rock solid‟.
Loam Soil:
Loamy soil is a combination of all the three - sandy soil, clay soil and silt soil, in the ratio
of 40:40:20. It is suitable for any and every kind of crops. loam soil has best of the
characteristic of all. It has high nutrients content, warms up quickly in summers and
rarely dries out in the dry weather. It has become the ideal soil for cultivation.
Peaty Soil:
Peaty soils are acidic in content, which makes them sour. This is the most exceptional
feature of Peaty soils. Usually found in low-lying areas, these soils require proper
drainage, as the place is accustomed to a lot of water clogging. Though peaty soils have
less nutrient content, they warm up quickly in the spring, making them excellent if right
amount of fertilizers are added.
Chalky Soil:
Chalky soil is alkaline in nature and usually poor in nutrients. It requires nourishment, in
the form of additional nutrients and soil improvers, for better quality. The soil becomes
dry in summers, making it very hard, and would require too much of watering for the
plants to grow. The only advantage which such a soil has is its lime content. When deep-
rooted, Chalky soil becomes excellent for plant growth and favors good growing
conditions as well.

8 | P a g e
2.4 Physicochemical parameters of Soil
These parameters provide the physical and chemical status of the soil. Rabah et al. (2010)
assessed different physicochemical parameters of the soil contaminated with abattoir effluents.
Zaiad Galal M (2010) analyzed different physicochemical parameters Al-Khums city, Libya. The
parameters which were studied by different groups are summarized and represented in a table.
(Table-1)
Table 1. Different physiochemical parameters of soil
Sl.No Physicochemical parameters Reference
1 pH, Temperature, Nitrogen, Magnesium,
Phosphorus, Potassium, Calcium, Sulphide, Organic
matter, Cation exchange capacity
Rabah et al. (2010) [10]
2 moisture contents, conductivity, TDS, pH, and
chloride contents
Zaiad Galal M (2010) [11]
3 pH, Conductivity, Total alkalinity, Total chloride,
Sulphate, Bulk density, Moisture content, Organic
matter, Na, K
Narkhede et al.(2011) [12]
4 pH, Bulk density, Specific gravity, N,P,K, Carbon
Nitrogen ratio
Pal and Lalwani (2011) [13]
5 pH, EC ,N, P, K, Cu, Fe, Mn ,Zn Ni, Cd Pujar et al.(2012) [14]
2.5 Soil Bacteria
Different reports show the presence of various kinds of bacteria playing various roles (e.g.
Decomposers, Nitrogen fixers etc.) in soil ecological system. Diverse kinds of bacteria belonging
to different genus and species are found in soil commonly. Summarizing findings of different
studies a list of genus of common soil living bacteria was prepared which is presented below in
tabular format.
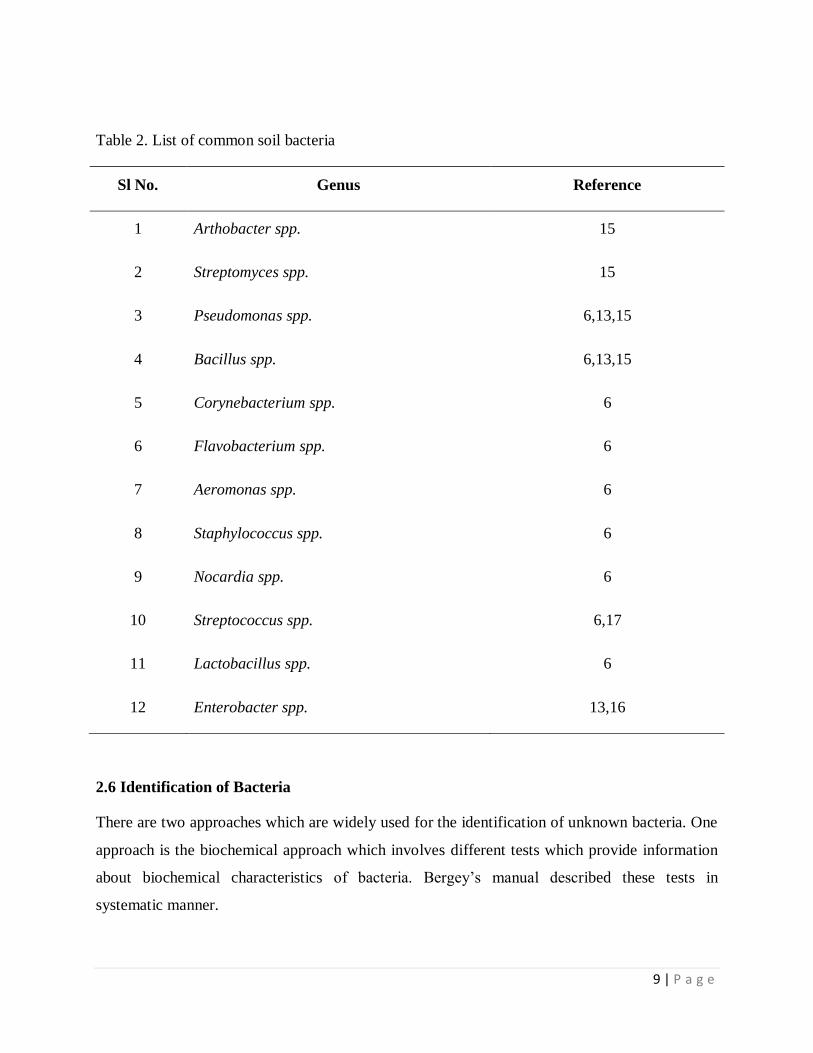
9 | P a g e
Table 2. List of common soil bacteria
Sl No. Genus Reference
1 Arthobacter spp. 15
2 Streptomyces spp. 15
3 Pseudomonas spp. 6,13,15
4 Bacillus spp. 6,13,15
5 Corynebacterium spp. 6
6 Flavobacterium spp. 6
7 Aeromonas spp. 6
8 Staphylococcus spp. 6
9 Nocardia spp. 6
10 Streptococcus spp. 6,17
11 Lactobacillus spp. 6
12 Enterobacter spp. 13,16
2.6 Identification of Bacteria
There are two approaches which are widely used for the identification of unknown bacteria. One
approach is the biochemical approach which involves different tests which provide information
about biochemical characteristics of bacteria. Bergey‟s manual described these tests in
systematic manner.
10 | P a g e
The other approach is the molecular approach in which bacteria identification was done
according to the information of 16SrRNA sequence. Delmont et al. (2011) [18], Rachid et al.
(2012) [19] and Maciel et al. (2009) [20] used this approach for the identification of bacteria. In
this approach DNA from the soil sample is extracted by direct or indirect methods. Then
16SrRNA segment of isolated DNA is amplified and sequenced. Fatima et al. (2011) [21]
reported a comparative study of different DNA extraction methods from soil.
2.7 Bergey’s Manual
In 1923, David Bergey, professor of bacteriology at the University of Pennysylvania, and four
colleagues published a classification of bacteria that could be used for identification of bacterial
species, the Bergey‟s Manual of Determinative Bacteriology. This manual is now in its ninth
edition [22]. In 1984, the first edition of Bergey‟s Manual of Systematic Bacteriology was
published. It contained descriptions of all prokaryotic species then identified. There has been
enormous progress in prokaryotic taxonomy since the first volume was published. In particular,
the sequencing of rRNA, DNA and proteins has made phylogenetic analysis of prokaryotes
feasible.
2.8 Water
Water is a chemical compound having two hydrogen and one oxygen atom linked by covalent
bond. Its molecular formula is H2O.Water is a liquid at standard ambient temperature and
pressure. It is also found in solid (ice) and gaseous (vapour) state. 71% of the total Earth surface
is covered by water. On Earth water is found as ocean, river, lake, groundwater and glacier etc.
Water is a vital element of all the biological systems. Water is needed for day to day activity. For
various production processes at industries water is also essential. Water plays a pivot role in the
field of agriculture. Water is also a huge ecological system which houses various kinds of
organisms. Safe drinking water is essential to humans and other life forms even though it
provides no calories or organic nutrients. Water is highly essential for day to day activities of
human. The physical and chemical parameters of water (e.g. pH, Dissolved Oxygen, TDS,
alkalinity etc.) provide the quality of water and for which purpose it can be used.

11 | P a g e
Chapter- 3
MATERIALS AND METHODS

12 | P a g e
3.1 Sample Collection
Samples were obtained from random plots at the depth of 15cm in sterilized zip lock as described
by Arotupin et.al (2008) [7]. A soil auger was used to obtain volume samples with a minimum of
0.5 kg of soil per sampling area. GPS coordinates of the sampling plots were noted. Soil samples
were collected in tightly sealed plastic bags and kept at 4°C to keep them field moist and to
preserve biological properties. Water sample was collected from the tube well and pond/open
well for ground water and surface water respectively.
GPS coordinates of soil sample collection: 840
35‟ 12” E and 230 49‟ 56” N
3.2 Physiochemical analysis
Physiochemical parameters of soil and water are analyzed by following the methods described in
the respective Indian Standards. The soil specimen obtained from field was prepared in
accordance with IS: 2720 (part 1) – 1983 before performing test for physiochemical parameters.
3.2.1 pH
The pH value which is a measure of the hydrogen or hydroxyl ion activity of the soil water
system indicates whether the soil is acidic, neutral or alkaline in reaction. Crop growth suffers
much both under very low as well as high pH. The instrument for pH measurement commonly
used is a digital pH meters have single electrode assembly. The instrument being a
potentiometer, the pH scale has to be calibrated before use with buffer solutions of known pH
values. 30g of soil is taken in a 100ml beaker to which 75 ml of distilled water is added .The
suspension is stirred at regular intervals for 30 minutes and the pH is recorded. The suspension is
stirred well just before the electrode are immersed and readings are taken.
pH of water sample was taken by using pH meter. Three readings were observed and then mean
of it was calculated.
3.2.2 Organic matter
The soil is grounded and completely passed through 0.2 mm sieve (80mesh) and 1gm is placed at
the bottom of a dry 500 ml conical flask. Add 10 ml of potassium dichromate (1N) in the 500 ml
conical flask, swirled and conical flask gently to disperse the soil in the dichromate solution.
Then 20 ml of sulphuric acid is run in run in and swirled again two or three times. The flask is
allowed to stand for 30 minutes and there after 200 ml of distilled water along with 10 ml of
13 | P a g e
ortho-phosphoric acid is added and 1ml of diphenylamine indicator. The whole contents are
titrated with ferrous ammonium sulphate solution till the color flashes from blue – violet to
green. For a final calculation, a blank is run without soil.
3.2.3 Calcium Carbonate
Five gram of soil was weighed accurately and transferred into a 150 ml beaker.100 ml of HCl
was added to it. It was kept at Room Temperature for 1 hour with vigorous stirring. After
settling, 20 ml of supernatant liquid was taken and 6 to 8 drops of bromothymol blue indicator
was added to it. Titration was performed with sodium hydroxide solution.
3.2.4 Water content
The container with lid was weighed for this study petridishes were used. Required quantity of
soil specimen was taken and the weight was noted down. The specimen is dried in oven at 1100C
for 24 hours without the lid of petridish. Every time the container is taken out for weighing .The
lid of petridish was replaced and the final constant reading was obtained.
The percent of water content (w) was calculated using the following formula,
Where w = water content percent
w1= mass of container with lid with wet soil
w2= mass of container with lid with dry soil
w3 = mass of container with lid
3.2.5 Dissolved Oxygen
This was performed by Wrinkler method.2 ml of manganous sulfate solution and 2ml of alkaline
potassium iodide was added to the water. The solutions were mixed thoroughly.2 ml of conc.
Sulfuric acid was added to it. From the above solution 200 ml was transferred into a conical
flask. Few drops of starch indicator were added. Then it was titrated against sodium thiosulfate
till blue color turns violet. The amount of titrants used gives DO value. Three readings were
taken and mean of it was calculated.
w= (w2-w3)/ (w3-w1)

14 | P a g e
3.3 Microbial analysis
These are the tests or steps which were followed for analysis and identification of bacteria.
3.3.1 Isolation and Total Bacterial Count
This was achieved by serial dilution or log dilution method. Five test tubes containing 9ml of
sterile distilled water were taken. One test tube containing 10 ml of sterile distilled water was
taken.1 g of soil was added to the test tube with 10 ml of sterile distilled water. Mixing was done
properly. Then 1 ml of microbial suspension was added to another test tube containing 9 ml of
sterile distilled water. Again mixing was performed properly.1ml of microbial suspension was
added to another test tube containing 9ml sterile distilled water. This step was repeated serially
for other test tubes. In this way the microbial suspension get 10 fold serially diluted.100 µl of
diluted suspension was poured into the surface of Nutrient agar plate .and spread by „L‟ shaped
spreader. The bacteria can thus be isolated and counted by C.F.U i.e. Colony Forming Unit.
C.F.U=No. of colonies/inoculum size (g) X Dilution Factor
Pure culture was isolated from this plate by streak plate method using inoculation loop.
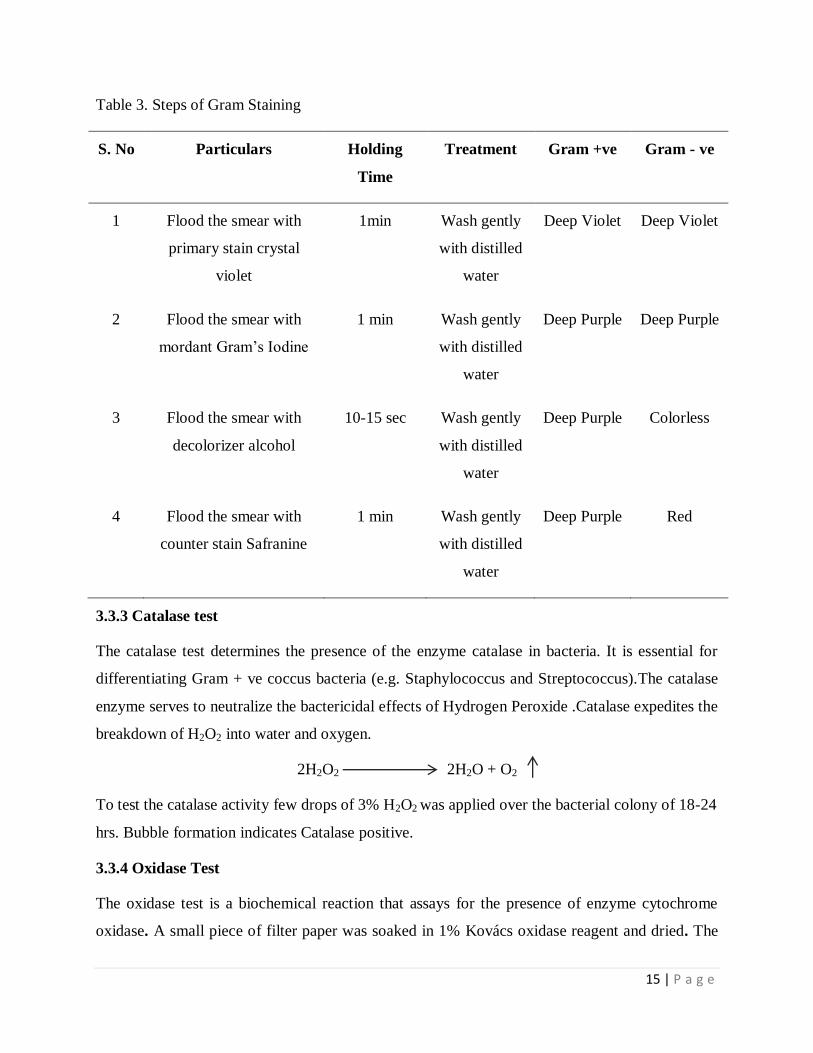
3.3.2 Gram Staining
The Gram stain is a differential stain that allows classifying bacteria. Gram +ve as well as Gram
–ve cells take up the deep violet color of the primary stain crystal violet. When treated with a
mordant (Iodine) a crystal violet-Iodine (CVI) complex is formed resulting deep purple color in
all cells. When alcohol is applied, it quickly removes the crystal violet-Iodine complex of Gram
–ve cells with ease. This is attributed to the dissolving of excess lipids present in the outer
membrane of Gram –ve bacteria. The complex takes a longer time to be removed in Gram +ve
cells due to thick and impermeable peptidoglycan layer in their walls. Thus controlled treatment
of alcohol only decolorizes the entire Gram –ve cells while the Gram positive retains purple
color. A counter stain such as safranine is then used to stain the colorless Gram negative cells.
15 | P a g e
Table 3. Steps of Gram Staining
S. No Particulars Holding
Time
Treatment Gram +ve Gram - ve
1 Flood the smear with
primary stain crystal
violet
1min Wash gently
with distilled
water
Deep Violet Deep Violet
2 Flood the smear with
mordant Gram‟s Iodine
1 min Wash gently
with distilled
water
Deep Purple Deep Purple
3 Flood the smear with
decolorizer alcohol
10-15 sec Wash gently
with distilled
water
Deep Purple Colorless
4 Flood the smear with
counter stain Safranine
1 min Wash gently
with distilled
water
Deep Purple Red
3.3.3 Catalase test
The catalase test determines the presence of the enzyme catalase in bacteria. It is essential for
differentiating Gram + ve coccus bacteria (e.g. Staphylococcus and Streptococcus).The catalase
enzyme serves to neutralize the bactericidal effects of Hydrogen Peroxide .Catalase expedites the
breakdown of H2O2 into water and oxygen.
2H2O2 2H2O + O2
To test the catalase activity few drops of 3% H2O2 was applied over the bacterial colony of 18-24
hrs. Bubble formation indicates Catalase positive.
3.3.4 Oxidase Test
The oxidase test is a biochemical reaction that assays for the presence of enzyme cytochrome
oxidase. A small piece of filter paper was soaked in 1% Kovács oxidase reagent and dried. The

16 | P a g e
composition of Kovács oxidase reagent is 1% tetra-methyl-p-phenylenediamine dihydrochloride
in distilled water. A well isolated colony was picked from a fresh bacterial plate (18 to 24 hours)
and rubbed into the filter paper soaked with Kovács oxidase reagent. Color change indicates the
result of this test. Microorganisms are oxidase positive when the color changes to dark purple
within 5 to 10 seconds. Microorganisms are delayed oxidase positive when the color changes to
purple within 60 to 90 seconds. Microorganisms are oxidase negative if the color does not
change or it takes longer than 2 minutes.
3.3.5 Indole Test
The indole test screens for the ability of an organism to degrade the amino acid tryptophan and
produce indole by the activity of tryptophanase enzyme.
Tryptophan + water = indole + pyruvic acid + ammonia
Indole test was performed as described by Abdulkadir and Waliyu (2012) [16]. One percent
tryptophan broth was taken in a test tube and inoculated with bacteria colony. After 48 hours of
incubation period at 37°C, one militre (1ml) of chloroform was added to the broth. The test tube
was shaken gently. 5 drops of Kovács reagent was added directly to the tube. This was also
shaken gently and allowed to stand twenty (20) minutes. The formation of red coloration at the
top layer indicated positive and yellow coloration indicates negative. Composition of Kovacs
reagent:
Table 4. Composition of Kovacs reagent
Ingredient Amount
Amyl or isoamyl alcohol 150.0 ml
p-dimethylaminobenzaldehyde (DMAB) 10.0 g
HCl (concentrated) 50 ml
3.3.6 Citrate Test
The citrate test screens a bacterial isolate for the ability of utilization citrate as its carbon and
energy source. Citrate utilization test was performed as described by Abdulkadir and Waliyu
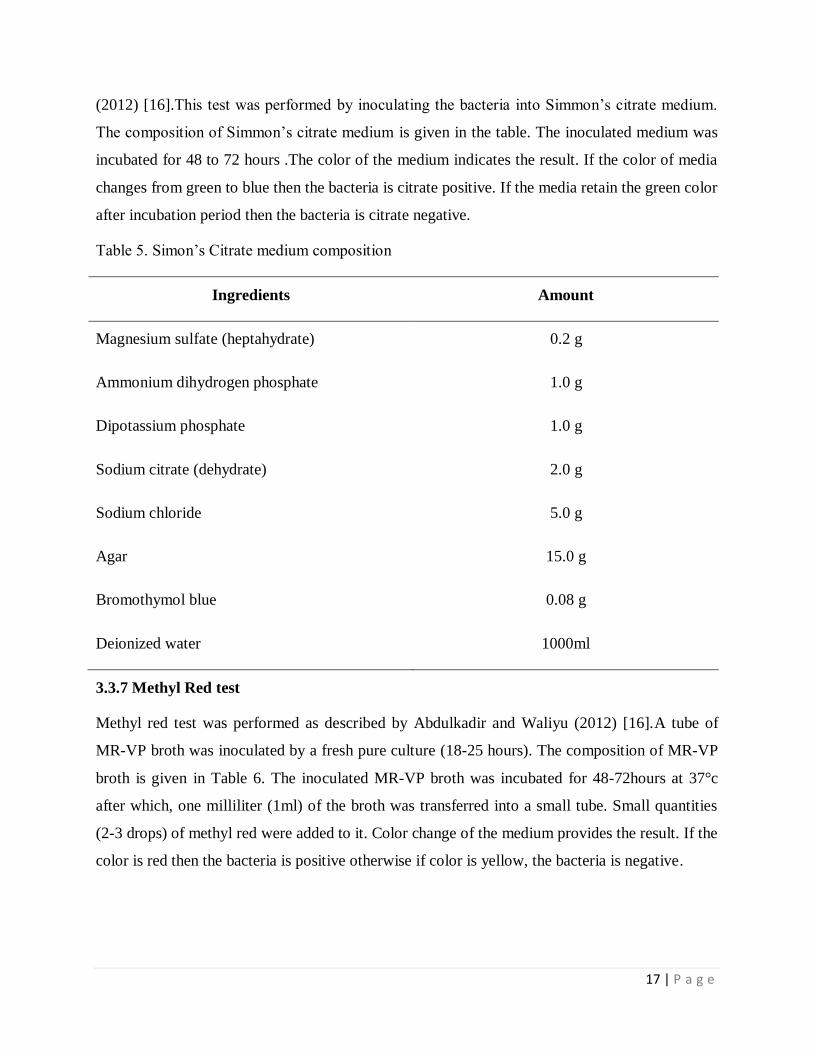
17 | P a g e
(2012) [16].This test was performed by inoculating the bacteria into Simmon‟s citrate medium.
The composition of Simmon‟s citrate medium is given in the table. The inoculated medium was
incubated for 48 to 72 hours .The color of the medium indicates the result. If the color of media
changes from green to blue then the bacteria is citrate positive. If the media retain the green color
after incubation period then the bacteria is citrate negative.
Table 5. Simon‟s Citrate medium composition
Ingredients Amount
Magnesium sulfate (heptahydrate) 0.2 g
Ammonium dihydrogen phosphate 1.0 g
Dipotassium phosphate 1.0 g
Sodium citrate (dehydrate) 2.0 g
Sodium chloride 5.0 g
Agar 15.0 g
Bromothymol blue 0.08 g
Deionized water 1000ml
3.3.7 Methyl Red test
Methyl red test was performed as described by Abdulkadir and Waliyu (2012) [16].A tube of
MR-VP broth was inoculated by a fresh pure culture (18-25 hours). The composition of MR-VP
broth is given in Table 6. The inoculated MR-VP broth was incubated for 48-72hours at 37°c
after which, one milliliter (1ml) of the broth was transferred into a small tube. Small quantities
(2-3 drops) of methyl red were added to it. Color change of the medium provides the result. If the
color is red then the bacteria is positive otherwise if color is yellow, the bacteria is negative.
18 | P a g e
Table 6. Composition of MR-VP broth
Ingredients Amount
Buffered peptone 7.0 g
Dipotassium phosphate 5.0 g
Dextrose 5.0 g
Deionized water 1000ml
3.3.8 Urease test
Presence of enzyme urease which splits urea into ammonia CO2 was detected by inoculating
bacterial cultures into tubes containing urease broth Incubated at 30 + 0.10C for 72 hours.
Purplish pink coloration of the medium indicated positive reaction. Composition of the urease
broth medium:
Table 7. Composition of urease broth medium
Ingredients Grams/Litre
Peptone 1
NaCl 5
K2HPO4 2
Glucose(Sterilized Separately) 1
Urea(Filter sterile) 20
pH 6.8
Phenol red(Filter Sterilized) 6 ml

19 | P a g e
Chapter-4
RESULTS AND DISCUSSION

20 | P a g e
4.1 Soil Characteristics
The color of the soil collected from Dhobiajharan is yellowish. The obtained values of different
physiochemical parameters of soil are represented in tabular format which is given below.
Table 8. Physicochemical parameters of Soil
S.No Parameter Name Obtained Value
1 pH 6.51
2 Organic Matter 1.17%
3 CaCO3 Content 16.1%
4 Moisture Content 8.68%
4.2 Total Bacterial Count
The isolated bacteria was quantified by calculating Colony Forming Unit (C.F.U) i.e. Colony
Forming Unit. The obtained C.F.U values are represented in the following table.
Table 9. CFU values
Dilution No.of Colonies Dilution factor CFU(per g)
10-4
67 104 67x10
4
10-5
32 105 32x10
5
10-6
26 106 26x10
6
Two types of bacterial colonies were found in the plates. By streak plate method pure bacteria
culture is isolated. The two types of bacteria were named as D1 and D2, Which will be used for
the identification tests.
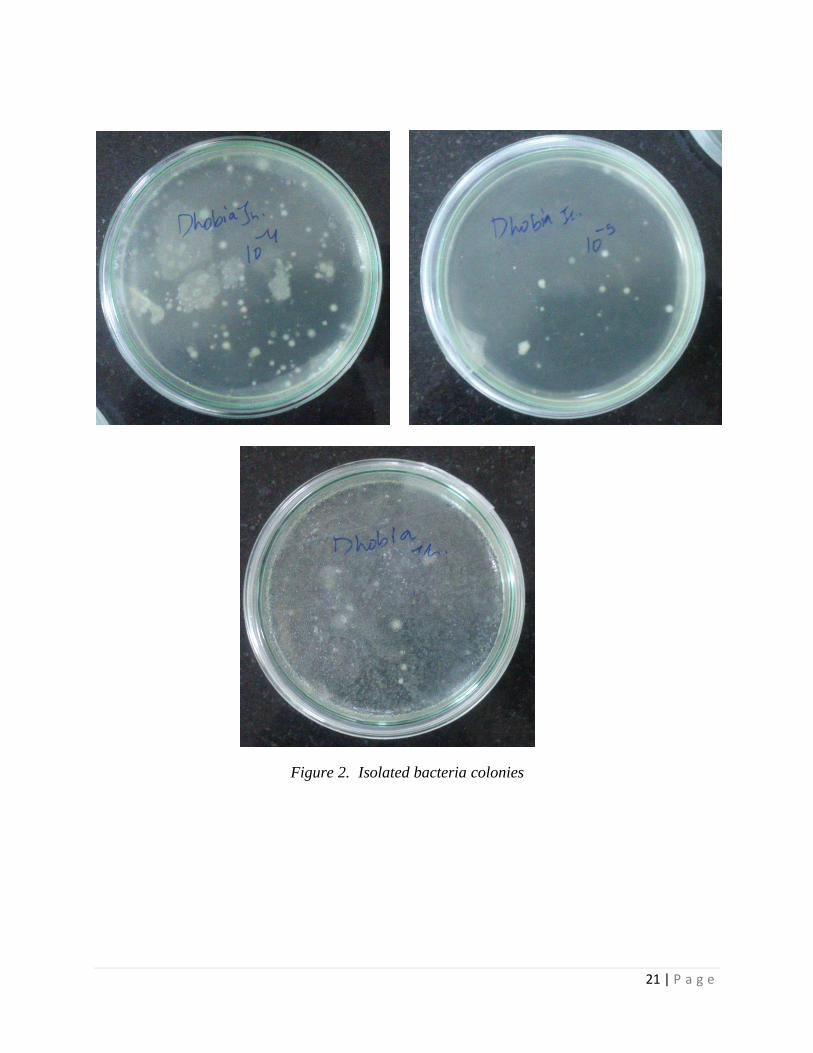
21 | P a g e
Figure 2. Isolated bacteria colonies

22 | P a g e
Figure 3. Pure culture isolation by streak plate method
4.3 Biochemical Test result
The obtained results of biochemical tests are given below. These are required for identification
of bacteria genus.
4.3.1 Gram Staining
D1 gives purple color and D2 gives Red color when observed under microscope. Microscopic
observation of D1 shows that shape is coccus and found in chains. The shape of D2 is bacilli in
nature.
Table 10.Gram stain results
D1 Gram +ve Coccus
D2 Gram -ve Bacilli

23 | P a g e
D1 D2
Figure-4: Gram staining result
4.3.2 Catalase Test
D1 does not form bubbles when H2O2 is applied.D2 forms bubble when H2O2 is applied.
Table 11.Catalase test results
D1 No bubble Catalase - ve
D2 bubbles Catalase +ve
Figure-5.Catalase test result
24 | P a g e
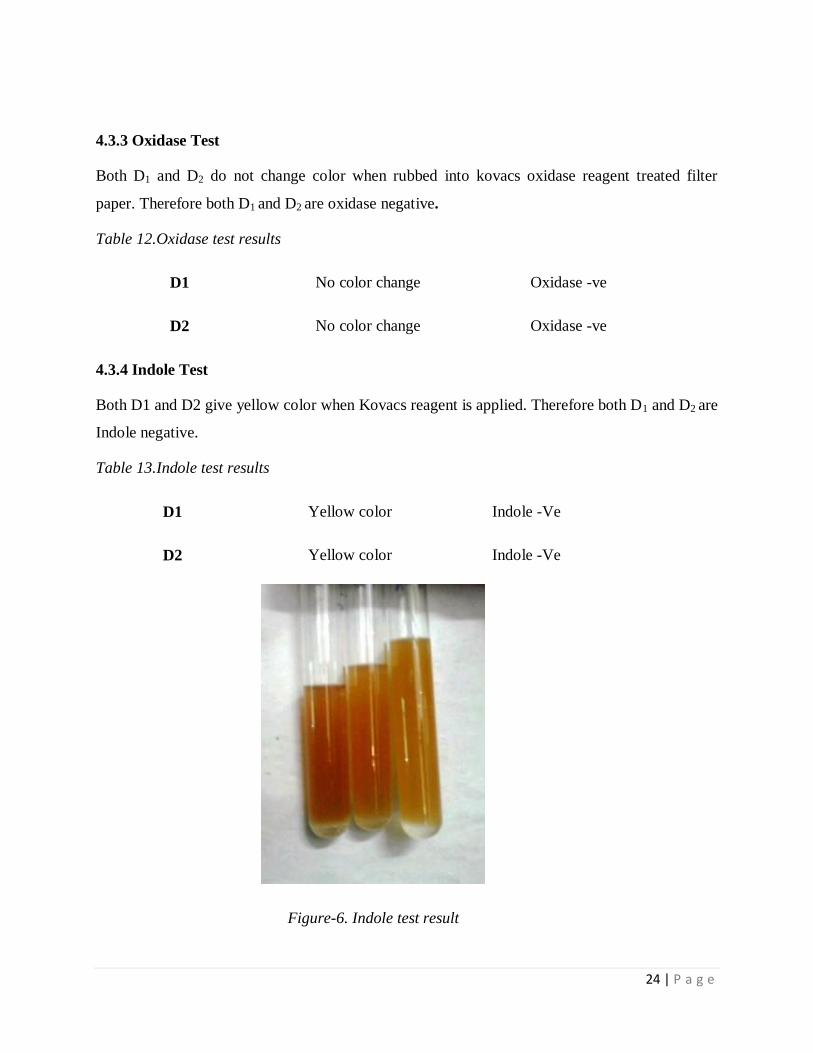
4.3.3 Oxidase Test
Both D1 and D2 do not change color when rubbed into kovacs oxidase reagent treated filter
paper. Therefore both D1 and D2 are oxidase negative.
Table 12.Oxidase test results
D1 No color change Oxidase -ve
D2 No color change Oxidase -ve
4.3.4 Indole Test
Both D1 and D2 give yellow color when Kovacs reagent is applied. Therefore both D1 and D2 are
Indole negative.
Table 13.Indole test results
D1 Yellow color Indole -Ve
D2 Yellow color Indole -Ve
Figure-6. Indole test result

25 | P a g e
4.3.5 Citrate utilization test
Both for D1 and D2 the media color changes from green to blue. Therefore both D1 and D2 are
citrate positive.
Table 14.Citrate test results
D1 Blue color media Citrate +ve
D2 Blue color media Citrate +ve
Figure-7. Citrate utilization test result
4.3.6 Methyl Red test
Both for D1 and D2 the color is yellow. Therefore D1 and D2 are methyl red negative.

26 | P a g e
Table 15. MR test results
D1 Yellow color MR –ve
D2 Yellow color MR -ve
Figure-8. Methyl Red test result
4.3.7 Urease Test
The color of D1 changed therefore it is D1 is urease positive while the color
of D2 does not change so Urease negative.
Table 16.Urease test results
D1 Urease + ve
D2 Urease - ve

27 | P a g e
Figure-9: Urease test result
4.4 Water parameter
Dissolved oxygen and pH of water was calculated and represented in tabular format.
Table-17.water parameter result
S. No. Parameter Obtained value
1 pH 6.4
2 Dissolved Oxygen(DO) 7.45 mg/ml
4.4 Discussion
The soil color of Dhobiajharan was yellowish. According to Brady and Weil (2006) [8], yellow
color of a soil indicates the iron oxide content may be high. The soil is clayey in nature so the
water content is high. From the analysis of moisture content it was obtained that moisture content
of the soil is around 8.7% which is quite high. Water affects soil formation, structure, stability
and erosion but is of primary concern with respect to plant growth. Water is essential to plants
for four reasons:
It constitutes 85%-95% of the plant's protoplasm.
It is essential for photosynthesis.
It is the solvent in which nutrients are carried to, into and throughout the plant.
28 | P a g e
It provides the turgidity by which the plant keeps itself in proper position.
The pH of the soil of Dhobiajharan was found to be 6.51.According to the United States
Department of Agriculture [23] soil pH range classification is represented in tabular format.
From the table, it was obtained that the nature of the soil is slightly acidic. Organic matter
content of the soil was found to be 1.17%.Calciumcarbonate content of the soil was found to be
above 16% which is quite high.
By analyzing the CFUs it was observed that the no. of bacteria comes in the normal range.
Ogunmwony et.al. (2008) reported that Bacteria are most abundant group of soil. One gram of
normal soil contains approximately 3.0 x 10⁶-5.0 x 10
8 of bacteria. Bacteria play various roles in
soil for examples it act as decomposers, Nitrogen fixers etc. Therefore Bacteria no. shows the
status of soil health. From this study it was observed that soil of Dhobiajaharan is healthy and
supports the growth of bacteria.
Comparing the results of the biochemical test results with the Bergey‟s manual it is predicted
that the D1 strain may belongs to Streptococcus genus and D2 strain may belongs to
Enterobacter genus. Biochemical test profile of Enterobacter which was reported by Pal and
Lalwani et al. (2011) and Abdulkadir and Waliyu (2012) was compared with the obtained result
of D2.From the comparison it was observed that there are high similarity between D2 strain and
Enterobacter. Therefore D2 might be a species of genus Enterobacter.

29 | P a g e
Table -18. Soil classification according to pH
Denomination pH range
Ultra acid < 3.5
Extreme acid 3.5–4.4
Very strong acid 4.5–5.0
Strong acid 5.1–5.5
Moderate acid 5.6–6.0
Slight acid 6.1–6.5
Neutral 6.6–7.3
Slightly alkaline 7.4–7.8
Moderately alkaline 7.9–8.4
Strongly alkaline 8.5–9.0
Very strongly alkaline > 9.0

30 | P a g e
Table 19: Comparison of Enterobacter and unknown D2
Biochemical Test Enterobacter D2
Gram staining Negative Negative
Shape Bacilli Bacilli
Catalase + +
Oxidase - -
Indole - -
Citrate + +
Methyl Red +/- -
Urease - -
Similarly By analyzing the result for D1 it was found that the shape, Gram staining result,
Catalase and oxidase test result it was predicted that the D1 strain might be a species of the genus
Streptococcus.
Table-20: Comparison of Streptococcus and unknown D1
Biochemical Test Streptococcus D1
Gram Stain + +
Shape coccus coccus
Catalase - -
Oxidase - -
31 | P a g e
Chapter 5
CONCLUSION AND FUTURE WORK

32 | P a g e
By this study microbial analysis focusing on bacteria of the soil collected from Dhobiajharan was
performed. Analyzing various biochemical test results the genus of isolated strains were
predicted as Enterobacter and Streptococus corresponding to D2 and D1.Quantitavie analysis of
bacteria show the soil health status. Physiochemical parameters also provide the soil health
status. This study is mainly aimed on the baseline data collection aspect of Environmental
Impact Assessment (EIA).By this studies some aspects of baseline data collection for the EIA of
proposed coal mine site was obtained.
In order to get information about environmental status, more number of physicochemical
parameter needs to be studied. Microbial analysis of water need to be performed to study the
kinds of microbes grow.

33 | P a g e
REFERENCES
1. Garg et al., Environmental Science and Ecological Studies, New Delhi: Khanna
Publishers, 2007
2. Cardinale et al., Biodiversity loss and its impact on humanity, Nature, Vol 486, (2012),
pg-59.
3. Seiler Andreas, Ecological effects of roads a review, Introductory Research Essay No
9,(2001), Department of Conservation Biology, SLU, Uppsala
4. Morley Neil J., Anthropogenic Effects of Reservoir Construction on the Parasite Fauna of
Aquatic Wildlife, Eco Health,4,( 2007), 374-383
5. "Principle of Environmental Impact Assessment Best Practice." International Association
for Impact Assessment. 1999.
6. Ogunmwony et.al., Microbial analysis of different top soil samples of selected site in
Obafemi Awolowo University,Nigeria,Scientific Research and
Essay.vol3(3),(2008),pp.120-124
7. Arotupin and Akinyosoye, Micobiological and physicochemical charecterstics of
Cassava cultivated soils, Research Journal of Microbiology,3(1),(2008);pp-41-46
8. Brady Nyle C. & Weil Ray R., Elements of the Nature and Properties of Soils, New
Jersey : Prentice Hall (2006), page 95.
9. Burh Priya Monalisha, Microbial Analysis of Soil and Water Samples from Koel River in
Rourkela, Odisha (2011)
10. Rabah et al., microbiological and physico-chemicalassessment of soil contaminated with
abattoir effluents in sokoto metropolis, Nigeria., Science World Journal, Vol 5 (No 3)
,(2010)
11. Zaiad Galal M, Physico-Chemical Analysis of Soils in Al-Khums city, Libya, Journal of
Applied Sciences Research, Vol 6(8),(2010),Pg:1040-1044
12. Narkhede et al. , Physico-Chemical Analysis Of Soil Collected From Chorwad, Tehsil –
Bhusawal, Dist. Jalgaon (M.S.), Int. J. Chem. Sci.: 9(4), (2011),Pg:1973-1978

34 | P a g e
13. Pal and Lalwani, A brief comparative study of bacterial population of different soils of
Bhopal, Bioscience Biotechnology Research Communication, Vo l 4,No 2,(2011)
,Pg:,211-215
14. Pujar et al., Analysis Of Physico-Chemical And Heavy Metal Concentration In Soil Of
Bijapur Taluka, Karnataka, Science. Revs. Chem. Commun.: 2(1), (2012),Pg: 76-79
15. Mohapatra Pradipta K,Textbook of Environmental Microbiology, New Delhi: I K
International Publishing House,2008
16. Abdulkadir and Waliyu, Screening and Isolation of the Soil Bacteria for Ability to
Produce Antibiotics, European Journal of Applied Sciences 4 (5),(2012),Pg.: 211-215
17. Gledhill and Casida, Predominant Catalase-negative Soil Bacteria, Applied
Microbiology, Vol. 17, No.2,( 1969), p. 208-213
18. Delmont et al., Accessing the soil metagenome for studies of Microbial diversity,
Applied and Environmental Microbiology, Vol 77,No-4,(2011),p.1315-1324
19. Rachid et al. ,Physical-chemical and microbial changes in Cerrado soil under differing
sugarcane harvest management system, BMC Microbiology,12,(2012),2012
20. Maciel et al., Simple DNA extraction protocol for a 16SrDNA study of bacterial
diversity in tropical landform soil used for bioremediation of oil waste ,Genetics and
Molecular research8(1),(2009),Pg:375-388
21. Fatima et al., Microbial DNA extraction from soil by different methods and its PCR
amplification, Biochem. cell arch., Vol 11,No 1(2011)
22. Willey et al. , Prescott, Harley and Klein‟s Microbiology, New York: The McGraw-Hill
publications,2008
23. Soil Conservation Service, U.S. Department of Agriculture Handbook 18