Physics Working Group Report to the LBNE Recon guration ...
36
Physics Working Group Report to the LBNE Reconfiguration Steering Committee J. Appel 1 , M. Bass 2 , M. Bishai 3 , S. Brice 1 , E. Blucher 4 , D. Cherdack 2 , M. Diwan 3 , B. Fleming 5 , G. Gilchriese 6 , Z. Isvan 3 , B. Lundberg 1 , W. Marciano 3 , M. Messier 7 , S. Parke 1 , J. Reichanadter 8 , G. Rameika 1 , K. Scholberg 9 , M. Shochet 4 , J. Thomas 10 , R. Wilson 2 , E. Worcester 3 , C. Young 8 , G. Zeller 1 , 1 Fermi National Accelerator Laboratory, Batavia, IL 60510, USA 2 Department of Physics, Colorado State University, Fort Collins, CO 80523, USA 3 Physics Department, Brookhaven National Laboratory, Upton, NY 11973, USA 4 Department of Physics, University of Chicago, Chicago, IL 60637, USA 5 Department of Physics, Yale University, New Haven, CT 06511, USA 6 Physics Division, Lawrence Berkeley National Laboratory, Berkeley, CA 94720 7 Department of Physics, Indiana University, Bloomington, IN 47405, USA 8 Stanford Linear Accelerator Laboratory, Menlo Park, CA, USA 9 Department of Physics, Duke University, Durham, NC 22708, USA 10 Department of Physics and Astronomy, University College London, London, WC1E 6BT, UK (Dated: August 6, 2012) This document summarizes the physics capabilities of a long-baseline neutrino experiment em- ploying a liquid argon detector and fed by an intense neutrino beam from Fermilab. The locations considered for the detector are at the Homestake mine in South Dakota, the Soudan mine in Min- nesota, and the Ash River, Minnesota site of the NOvA detector. The experimental reach as a function of detector mass is given for the neutrino mass hierarchy and CP violation phase as well as for proton decay, atmospheric neutrino studies, and neutrinos from supernova explosions.
Transcript of Physics Working Group Report to the LBNE Recon guration ...

Physics Working Group Report to the LBNE Reconfiguration Steering Committee
J. Appel1, M. Bass2, M. Bishai3, S. Brice1, E. Blucher4, D. Cherdack2, M. Diwan3, B. Fleming5,
G. Gilchriese6, Z. Isvan3, B. Lundberg1, W. Marciano3, M. Messier7, S. Parke1, J. Reichanadter8,
G. Rameika1, K. Scholberg9, M. Shochet4, J. Thomas10, R. Wilson2, E. Worcester3, C. Young8, G. Zeller1,1 Fermi National Accelerator Laboratory, Batavia, IL 60510, USA
2 Department of Physics, Colorado State University,Fort Collins, CO 80523, USA
3 Physics Department, Brookhaven National Laboratory, Upton, NY 11973, USA4 Department of Physics, University of Chicago, Chicago, IL 60637, USA
5 Department of Physics, Yale University,New Haven, CT 06511, USA
6 Physics Division, Lawrence Berkeley National Laboratory, Berkeley, CA 947207 Department of Physics, Indiana University,
Bloomington, IN 47405, USA8 Stanford Linear Accelerator Laboratory, Menlo Park, CA, USA
9 Department of Physics, Duke University, Durham, NC 22708, USA10 Department of Physics and Astronomy,
University College London, London, WC1E 6BT, UK
(Dated: August 6, 2012)
This document summarizes the physics capabilities of a long-baseline neutrino experiment em-ploying a liquid argon detector and fed by an intense neutrino beam from Fermilab. The locationsconsidered for the detector are at the Homestake mine in South Dakota, the Soudan mine in Min-nesota, and the Ash River, Minnesota site of the NOvA detector. The experimental reach as afunction of detector mass is given for the neutrino mass hierarchy and CP violation phase as wellas for proton decay, atmospheric neutrino studies, and neutrinos from supernova explosions.

ii
CONTENTS
I. Introduction 1
II. Configurations 1
III. Long-baseline Physics 2A. The Neutrino Beams 5B. The LAr-TPC Neutrino Detector 5C. Mass Hierarchy and CP Violation Sensitivity 11D. Precision Measurement of Neutrino Mixing Parameters 12E. Searches for New Physics 17
1. Non-standard Interactions 172. Long-range Interactions 173. Search for Active-Sterile Neutrino Mixing 17
F. Summary 18G. What is the Optimal Baseline for LBNE? 24
IV. Non-Accelerator Physics Reach 28A. Searches for baryon number non-conservation 28B. Atmospheric Neutrinos 29C. Core Collapse Supernova Neutrinos 31D. Summary 31
V. Summary 33
References 34

1
I. INTRODUCTION
Four years ago, HEPAP’s P5 subpanel laid out a plan to maintain the United States as a world leader in highenergy physics. Central to that plan was a world-class neutrino program utilizing a large underground detector inSouth Dakota fed by an intense neutrino source at Fermilab. Such an experiment would answer a number of importantscientific questions. (1) Is there CP violation in the neutrino sector? The existence of matter this late in the universe’sdevelopment requires CP violation, but the effect seen in the quark sector is much too small. The answer may beneutrino CP violation, and the proposed project would be the first to have the sensitivity needed to observe it. (2)Is the ordering of the neutrino mass states the same as that of the quarks, or is the order inverted? In addition tobeing an important question on its own, it has a major impact on our ability to determine whether the neutrino isits own antiparticle, which if true could reflect physics at energy scales much greater than those probed at the LHC.(3) Is the proton stable? The answer will provide clues to the unification of the forces of nature. (4) What physicsand astrophysics can we learn from the neutrinos emitted in supernova explosions?
The proposed experiment would have addressed all of these questions, but its cost was found to be too large. Wewere asked to propose options for staging the program in a way that is both affordable and effective in doing thescience. Here we provide the data needed to assess the reach of each option for the above scientific questions.
II. CONFIGURATIONS
During the committee’s deliberations, the following detector configurations were considered.
Config. Number Beam Baseline Off-axis angle Location Depth Detector
1 NuMI LE 735km 0 Soudan 0 LAr 5, 10, 15, 34 kt2 NuMI LE 735km 0 Soudan 2300ft LAr 5, 10, 15, 34 kt3 NuMI ME 810km 14mrad Ash River 0 LAr 5, 10, 15, 34 kt4 NuMI LE 810km 14mrad Ash River 0 LAr 5, 10, 15, 34 kt5 NuMI ME 810km 14mrad Ash River 0 TASD 14 (NOνA), 40kt7 LBNE LE 1300km 0 Homestake 0 LAr 5, 10, 15, 34 kt8 LBNE LE 1300km 0 Homestake 4850ft LAr 5, 10, 15, 34 kt
TABLE I. Configurations considered by the LBNE Reconfiguration Physics Working Group. NuMI LE (ME) refers to thelow-energy (medium-energy) tunes of the existing NuMI beamline. LBNE LE is the low-energy tune of a new proposed beam-line from Fermilab aimed at the Homestake Mine in South Dakota. LAr refers to a Liquid Argon Time-Projection Chamber,and TASD refers to a Totally Active Scintillator Detector.
2
III. LONG-BASELINE PHYSICS
Although the Standard Model of particle physics presents a remarkably accurate description of the elementaryparticles and their interactions, it is known that the current model is incomplete and that a more fundamentalunderlying theory must exist. Results from the last decade, that the three known types of neutrinos have nonzeromass, mix with one another and oscillate between generations, implies physics beyond the Standard Model [1].
The three-flavor-mixing scenario for neutrinos can be described by three mixing angles (θ12, θ23 and θ13) and oneCP-violating phase (δCP ). The probability for neutrino oscillation also depends on the difference in the squares ofthe neutrino masses, ∆m2
ij = m2i −m2
j ; three neutrinos implies two independent mass-squared differences (∆m221 and
∆m232).
The entire complement of neutrino experiments to date has measured five of the mixing parameters: three angles,θ12, θ23, and recently θ13, and two mass differences, ∆m2
21 and ∆m232. The sign of ∆m2
21 is known, but not that of∆m2
32. The value of θ13 has been determined to be much smaller than the other two mixing angles which are bothlarge [2] [3], implying that mixing is qualitatively different in the neutrino and quark sectors. Table II summarizesthe current values of the neutrino oscillation parameters obtained from a global fit to experimental data [4] and themeasurement of θ13 from the Daya Bay reactor experiment [2]. A comparison to the equivalent mixing parametervalues in the quark CKM matrix is also shown [5].
TABLE II. Best fit values of the neutrino mixing parameters in the PMNS matrix and comparison to the equivalent values inthe CKM matrix
Parameter Value (neutrino PMNS matrix) Value (quark CKM matrix)θ12 34± 1◦ 13.04± 0.05◦
θ23 43± 4◦ 2.38± 0.06◦
θ13 9± 1◦ 0.201± 0.011◦
∆m221 +(7.58± 0.22)× 10−5 eV2
|∆m232| (2.35± 0.12)× 10−3 eV2 m3 >> m2
δCP no measurement 67± 5◦
Assuming a constant matter density, the oscillation of νµ → νe in the Earth for 3-generation mixing is describedapproximately by the following equation [6]
P (νµ → νe) ≈ sin2 θ23sin2 2θ13
(A− 1)2sin2((A− 1)∆)
+αsin δCP cos θ13 sin 2θ12 sin 2θ13 sin 2θ23
A(1− A)sin(∆) sin(A∆) sin((1− A)∆)
+αcos δCP cos θ13 sin 2θ12 sin 2θ13 sin 2θ23
A(1− A)cos(∆) sin(A∆) sin((1− A)∆)
+α2 cos2 θ23 sin2 2θ12
A2sin2(A∆)
(1)
where α = ∆m221/∆m
231, ∆ = ∆m2
31L/4E, A = 2V E/∆m231, V =
√2GFne, ne is the density of electrons in the
Earth, L is the distance between the neutrino source and the detector in km, and E is the neutrino energy in GeV.Recall that ∆m2
31 = ∆m232 + ∆m2
21. For antineutrinos, the second term in Equation 1 has the opposite sign, and thematter potential also has the opposite sign. The second term is proportional to the following CP violating quantity:
JCP ≡ sin θ12 sin θ23 sin θ13 cos θ12 cos θ23 cos2 θ13 sin δCP (2)
Equation 1 is an expansion in powers of α. The νµ/νµ → νe/νe oscillation probabilities from the approximateformula given in Equation 1 as a function of neutrino energy and baseline are shown in Figure 1 for both the normalmass hierarchy (m1 < m2 < m3) and inverted mass hierarchy (m3 < m1 < m2) . There are two very differentoscillation scales driven by the two independent mass-squared differences (∆m2
21 and ∆m232). The maximal oscillation

3
FNAL−Soudan
FNAL−Soudan
FNAL−Soudan
FNAL−Hmstk
FNAL−Soudan
FNAL−Hmstk
FNAL−Hmstk
FNAL−Hmstk
FIG. 1. The νµ/νµ → νe/νe oscillation probability vs neutrino energy and baseline with sin2 2θ13 = 0.1, δcp = 0 for normalhierarchy (top) and inverted hierarchy (bottom). The solid blue lines correspond to the locations of the 1st and 2nd oscillationmaxima in vacuum.
probabilities occur at:
L/Eνn (km/GeV) = (2n− 1)π
2
1
(1.267×∆m2 (eV2))
≈ (2n− 1)× 500 km/GeV for ∆m232 (atmospheric)
≈ (2n− 1)× 15, 000 km/GeV for ∆m221 (solar)
(3)
where Eνn is the neutrino energy at the maximum of oscillation node n. The oscillations of νµ → νe in long-baselineaccelerator neutrino experiments are driven primarily by the atmospheric mass scale. The 1st and 2nd nodes areindicated as solid blue lines in Figure 1. The approximate formula given in Equation 1 is useful for understandingimportant features of the appearance probability shown in Figure 1:
1. The first three terms in the equation control the matter induced enhancement for normal mass ordering (m1 <m2 < m3) or suppression for the inverted mass ordering (m3 < m1 < m2) which dominates in the region of the

4
first oscillation node (largest Eν).
2. The second and third terms control the sensitivity to CP and the value of δcp at the second oscillation node.
3. The last term controls the sensitivity to ∆m221 and the solar oscillation parameters at the higher order oscillation
nodes (largest L/E).
4. The first term (last term) is also proportional to sin2 θ23 (cos2 θ23), and therefore is sensitive to whether θ23 isabove or below 45◦.
The large non-zero value of θ13 indicates that measurement of the spectrum of oscillated νµ → νe events over a largerange of L/E in a single experiment will allow us access to all of the parameters in Equation 1 with good systematicscontrol. Figure 1 demonstrates that the longer the experimental baseline the more oscillation nodes and the largerthe range of L/E values are accessible.
The signature of CP violation is a difference in the probabilities for νµ → νe and νµ → νe transitions. The CPasymmetry Acp is defined as
Acp(Eν) =
[P(νµ → νe)− P(νµ → νe)
P(νµ → νe) + P(νµ → νe)
](4)
The observed asymmetry A is a combination of both the CP asymmetry and the asymmetry due to the matter effect.Figure 2 shows the maximal possible CP asymmetry in vacuum (δcp = −π/2) and the asymmetry from the mattereffect alone as a function of energy and baseline. The CP asymmetry arising from non-zero/π values of δcp is dominantin the L/E regions of the secondary oscillation nodes and is constant as a function of baseline, whereas the asymmetrydue to the matter effect dominates the L/E region of the first oscillation node and increases with longer baselines.
FIG. 2. The asymmetry, Acp, for maximal CP violation in vacuum (left) and arising from the matter effect only (right) as afunction of energy and baseline. An average earth density of ρ = 2.8 g/cm3 is assumed for the matter effect.
Observations of νµ → νe oscillations of a beam (composed initially of muon neutrinos, νµ) over a long baselineand a wide range of neutrino energies are thus the key to unambiguously determining the mass hierarchy (the sign of∆m2
32), and the unknown CP-violating phase δcp. The study of νµ → νe oscillations can also help determine the θ23quadrant since the first and fourth terms in Equation 1 are proportional to sin2 θ23 and cos2 θ23 respectively.
The study of the disappearance of νµ probes sin2 2θ23 and |∆m232|. Non-standard physics can manifest itself in
differences observed in higher precision measurements of νµ and νµ disappearance over long baselines and in observingdeviations from the 3-flavor model in νµ → νe oscillations. The precision with which we know the current set ofneutrino oscillation parameters ensures that the compelling physics program outlined is feasible with the combinationof a long-baseline, very large detector mass, and a wide-band beam with beam energies matched to the baseline assummarized in Equation 3.
5
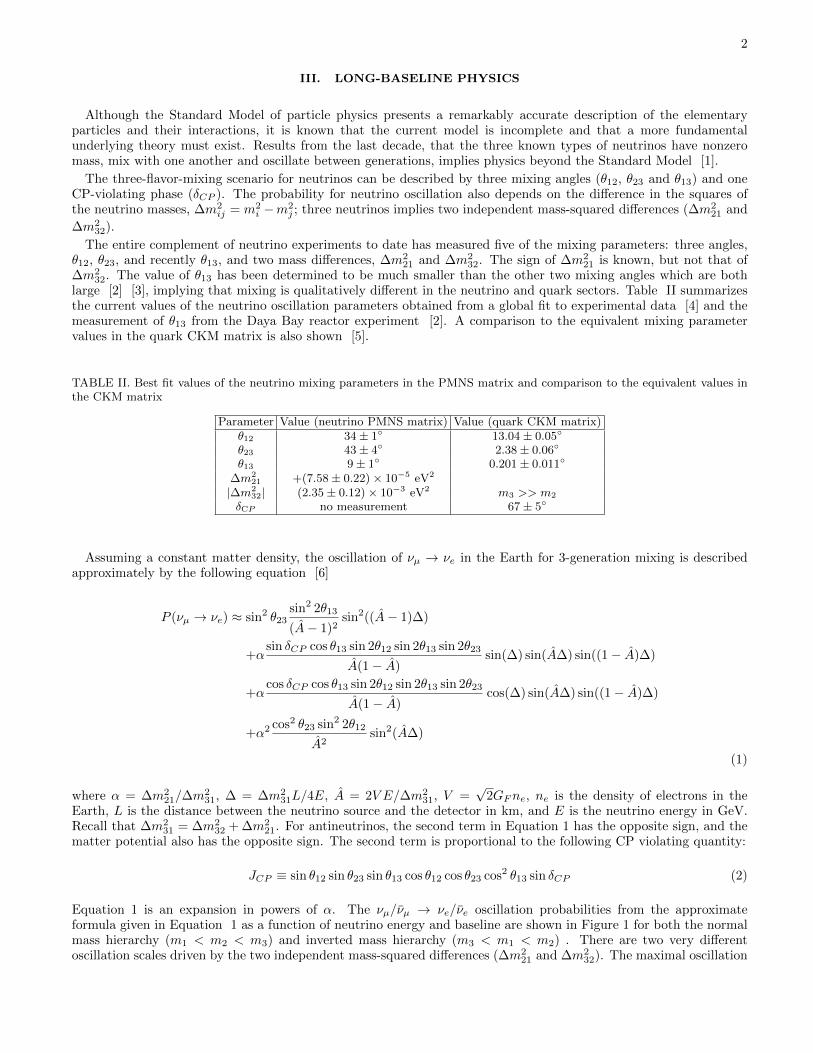
The primary scientific goals of the next generation of long-baseline neutrino experiments is to carry out the mostprecise measurements of the three-flavor neutrino-oscillation parameters over a very long baseline and a wide range ofneutrino energies, in particular, the CP-violating phase in the three-flavor framework. Precision measurements of the3-flavor neutrino oscillation parameters will also enable the search for new physics that manifests itself as deviationsfrom the expected three-flavor neutrino-oscillation model.
A. The Neutrino Beams
The three beam configurations under consideration are the 1) LBNE beamline in the low energy configurationon-axis with a detector at Homestake Mine (1300km), 2) the NuMI beamline in the low energy configuration witha detector on-axis at Soudan Mine (735km), and 3) the NuMI beamline in the medium energy configuration with adetector 14mrad off-axis at Ash River (810km). The neutrino beamline parameters used in the GEANT3 simulationfor each of these options are summarized in Table III.
TABLE III. The NuMI and LBNE neutrino beam configurations used in this study
LBNE LE a NuMI LE NuMI MEPrimary beam 120 GeV p+ 120 GeV p+ 120 GeV p+
Beam power 708 kW 708 kW 708 kWPOT/yr 6.0× 10²⁰ 6.0× 10²⁰ 6.0× 10²⁰
Target material graphite graphite graphiteTarget cross-section circular d=1.2cm rectangular w=0.64cm h=2cm rectangular w=0.64cm h=2cmTarget length 2 interaction lengths 2 interaction lengths 2 interaction lengthsFocusing horns (1/2) NuMI, 250kA NuMI, 185 kA NuMI, 200 kAHorn separation 6m 10m 23mTarget-Horn 1 distance 30cm 45cm 135 cmDecay pipe 4m diameter, 280m long 2m diameter, 677m long 2m diameter, 677m long
Evacuated/He filled He filled He filleda The LBNE decay pipe in the conceptual design has a length between 200 and 250m and is filled with air.
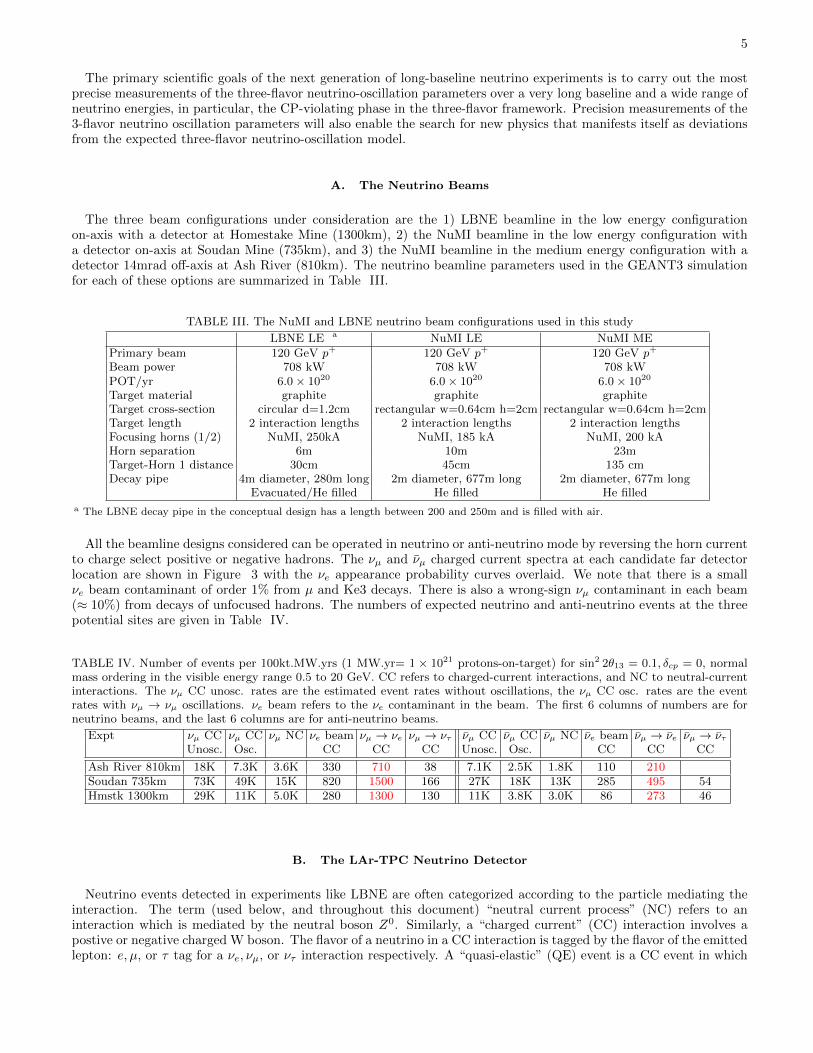
All the beamline designs considered can be operated in neutrino or anti-neutrino mode by reversing the horn currentto charge select positive or negative hadrons. The νµ and νµ charged current spectra at each candidate far detectorlocation are shown in Figure 3 with the νe appearance probability curves overlaid. We note that there is a smallνe beam contaminant of order 1% from µ and Ke3 decays. There is also a wrong-sign νµ contaminant in each beam(≈ 10%) from decays of unfocused hadrons. The numbers of expected neutrino and anti-neutrino events at the threepotential sites are given in Table IV.
TABLE IV. Number of events per 100kt.MW.yrs (1 MW.yr= 1 × 10²¹ protons-on-target) for sin2 2θ13 = 0.1, δcp = 0, normalmass ordering in the visible energy range 0.5 to 20 GeV. CC refers to charged-current interactions, and NC to neutral-currentinteractions. The νµ CC unosc. rates are the estimated event rates without oscillations, the νµ CC osc. rates are the eventrates with νµ → νµ oscillations. νe beam refers to the νe contaminant in the beam. The first 6 columns of numbers are forneutrino beams, and the last 6 columns are for anti-neutrino beams.
Expt νµ CC νµ CC νµ NC νe beam νµ → νe νµ → ντ νµ CC νµ CC νµ NC νe beam νµ → νe νµ → ντUnosc. Osc. CC CC CC Unosc. Osc. CC CC CC
Ash River 810km 18K 7.3K 3.6K 330 710 38 7.1K 2.5K 1.8K 110 210Soudan 735km 73K 49K 15K 820 1500 166 27K 18K 13K 285 495 54Hmstk 1300km 29K 11K 5.0K 280 1300 130 11K 3.8K 3.0K 86 273 46
B. The LAr-TPC Neutrino Detector
Neutrino events detected in experiments like LBNE are often categorized according to the particle mediating theinteraction. The term (used below, and throughout this document) “neutral current process” (NC) refers to aninteraction which is mediated by the neutral boson Z0. Similarly, a “charged current” (CC) interaction involves apostive or negative charged W boson. The flavor of a neutrino in a CC interaction is tagged by the flavor of the emittedlepton: e, µ, or τ tag for a νe, νµ, or ντ interaction respectively. A “quasi-elastic” (QE) event is a CC event in which

6
FIG. 3. The un-oscillated νµ CC spectra at the 3 candidate locations (black histograms) with the νe appearance probabilitycurves for sin2 2θ13 = 0.1, δcp = 0 (red) π/2 (blue) − π/2 (green) with normal mass ordering. The curve in cyan shows thecontribution from the fourth term of Equation 1 which is driven by the solar oscillation and is independent of sin2 2θ13 and δcp.The figures are from top to bottom: NuMI ME at Ash River, NuMI LE at Ash River, NuMI LE at Soudan, and the LBNEbeam at Homestake. The left set of figures is for neutrino running and the right set of figures is for anti-neutrino running.

7
the scattering of the neutrino is almost elastic with only a charged lepton and a nucleon or nucleons emerging fromthe target nucleus. The charged lepton in QE events carries most of the energy of the neutrino, and as a result, QEinteractions have the best neutrino-energy resolution. Final State Interactions (FSI) inside the nucleus will alter theexpected nucleon types and spectrum, and a measurement of this effect is an important goal of the Near Detector. CCand NC interactions of neutrinos with energies > 1 GeV are inelastic and the target nucleus disintegrates producingmultiple hadrons.
The cross-section of ν/ν CC and NC interactions [7] for different event categories is shown in Figure 4.
(GeV)νE
-110 1 10 210
/ G
eV)
2 c
m-3
8 (
10ν
cro
ss s
ecti
on
/ E
ν 0
0.2
0.4
0.6
0.8
1
1.2
1.4
(GeV)νE
-110 1 10 210
/ G
eV)
2 c
m-3
8 (
10ν
cro
ss s
ecti
on
/ E
ν 0
0.2
0.4
0.6
0.8
1
1.2
1.4
G. Zeller
TOTAL
QE
DIS
RES
(GeV)νE
-110 1 10 210 /
GeV
)2
cm
-38
(10
ν c
ross
sec
tio
n /
Eν 0
0.05
0.1
0.15
0.2
0.25
0.3
0.35
0.4
(GeV)νE
-110 1 10 210 /
GeV
)2
cm
-38
(10
ν c
ross
sec
tio
n /
Eν 0
0.05
0.1
0.15
0.2
0.25
0.3
0.35
0.4G. Zeller
TOTAL
QEDIS
RES
FIG. 4. Neutrino charged-current interaction cross-sections divided by neutrino energy for neutrinos (top-left), and anti-neutrinos (top-right) for an isoscalar target plotted as a function of neutrino energy. Also shown are the contributions tothe total cross section from quasi-elastic scattering (red), resonance production (blue), and deep inelastic scattering (green)processes. Example predictions for each are provided by the NUANCE generator [8]. Note that the quasi-elastic scatteringdata and predictions have been averaged over neutron and proton targets and hence have been divided by a factor of 2 for thepurposes of this plot. On the bottom are existing measurements of the cross section for the NC process, νµ p → νµ p π
0, as afunction of neutrino energy. The Gargamelle measurement comes from a more recent re-analysis of this data [9]. Also shownis the prediction from [8]. All three Plots are from [7].
A substantial component of the background for νe CC interactions comes from NC interactions where a π0 isproduced. The π0 decays to two γs which shower electromagnetically and fake electrons. NC interactions where acharged pion is produced are also the predominant background for νµ CC interactions where the pion fakes a muon.Therefore to study neutrino flavor oscillations with high precision, the LBNE Far Detector has to have high efficiencyand high purity e/µ/γ and π/K/p separation.
A massive liquid argon TPC (LArTPC) has been chosen as the Far Detector technology for the LBNE project [10].TPCs are the detectors of choice for low-rate, large-volume, high-precision particle physics experiments due to theirexcellent 3D position resolutions and particle identification in large volumes. In addition to detailed event topologiesand measurements of particle kinematics, dE/dx measurements allow TPCs to unambiguously distinguish electrons,muons, photons, kaons, pions and protons over a wide range of energies. Examples of how event topologies can be

8
used to identify νe/νµ CC and ν NC events in a LAr-TPC are shown in Figure 5. The expected signal efficiencies and
FIG. 5. Examples of neutrino beam interactions in an LArTPC obtained from a GEANT4 simulation [11]. A CC νµ interactionwith a stopped µ followed by a decay Michel electron (top), a QE νe interaction with a single electron and a proton (middle),an NC interaction which produced a π0 that then decayed into two γ’s with separate conversion vertices (bottom).
background mis-identification rates as well as the energy resolution for different event types are summarized in TableV. The performance parameters were derived from several visual scan studies carried out using GEANT4 simulationof LAr-TPC as shown in Figure 5, from studies of the ICARUS detector performance [12–14] and from automatedreconstruction used in the LAr detector proposal for a detector at a 2km baseline in the T2K experiment [16].
The performance parameters summarized in Table V were implemented into the GLoBES software package [17].The expected spectrum of νe or νe oscillation events from a parameterized implementation of a 34-kton LArTPCrunning with 5 years of neutrino and 5 years of anti-neutrino 700kW beam assuming sin2(2θ13) = 0.1 and normalmass ordering is shown in Figure 6. The expected spectrum of νµ or νµ oscillation events is shown in Figure 7.
The GLoBES experimental assumptions for the NOνA and T2K experiments used in this study were obtained fromreferences [18, 19] and [20–22] respectively. The assumptions for the NOνA experiment are summarized in Table VI.
Operating a large liquid argon detector on the Earth’s surface is currently under study by the LBNE collaboration.

9
Neutrino Energy (GeV)1 2 3 4 5 6 7 8
Eve
nts
/ 250
MeV
0
20
40
60
80
100
120
140
160
180
200 Spectrumeν
° = 0CPδSignal + Bg,
° = 90CPδSignal + Bg,
° = -90CPδSignal + Bg,
CC Bgµν
NC Bgµν
BgeνBeam
A Beam, Baseline = 810 kmνNO
Normal Hierarchy
runningν5 years of
) = 0.113θ(22sin
Spectrumeν
Neutrino Energy (GeV)1 2 3 4 5 6 7 8
Eve
nts
/ 250
MeV
0
10
20
30
40
50
60
70
80 Spectrumeν
° = 0CPδSignal + Bg,
° = 90CPδSignal + Bg,
° = -90CPδSignal + Bg,
CC Bgµν + µν
NC Bgµν + µν
Bgeν + eνBeam
A Beam, Baseline = 810 kmνNO
Normal Hierarchy
runningν5 years of
) = 0.113θ(22sin
Spectrumeν
Neutrino Energy (GeV)1 2 3 4 5 6 7 8
Eve
nts
/ 250
MeV
20
40
60
80
100
120
140
160
180
200
220
240 Spectrumeν
° = 0CPδSignal + Bg,
° = 90CPδSignal + Bg,
° = -90CPδSignal + Bg,
CC Bgµν
NC Bgµν
BgeνBeam
NuMI Beam, Baseline = 735 km
Normal Hierarchy
runningν5 years of
) = 0.113θ(22sin
Spectrumeν
Neutrino Energy (GeV)1 2 3 4 5 6 7 8
Eve
nts
/ 250
MeV
20
40
60
80
100
Spectrumeν° = 0CPδSignal + Bg,
° = 90CPδSignal + Bg,
° = -90CPδSignal + Bg,
CC Bgµν + µν
NC Bgµν + µν
Bgeν + eνBeam
NuMI Beam, Baseline = 735 km
Normal Hierarchy
runningν5 years of
) = 0.113θ(22sin
Spectrumeν
Neutrino Energy (GeV)1 2 3 4 5 6 7 8
Eve
nts
/ 250
MeV
0
20
40
60
80
100
120
140
160
180 Spectrumeν
° = 0CPδSignal + Bg,
° = 90CPδSignal + Bg,
° = -90CPδSignal + Bg,
CC Bgµν
NC Bgµν
BgeνBeam
Normal HierarchyBeam: 120 GeV, 700kW
runningν5 years of ) = 0.113θ(22sin
Spectrumeν
Neutrino Energy (GeV)1 2 3 4 5 6 7 8
Eve
nts
/ 250
MeV
0
10
20
30
40
50
60
70
80 Spectrumeν
° = 0CPδSignal + Bg,
° = 90CPδSignal + Bg,
° = -90CPδSignal + Bg,
CC Bgµν + µν
NC Bgµν + µν
Bgeν + eνBeam
Normal HierarchyBeam: 120 GeV, 700kW
runningν5 years of ) = 0.113θ(22sin
Spectrumeν
FIG. 6. The expected spectrum of νe or νe oscillation events in a 34-kton LArTPC for 5 years of neutrino (left) and anti-neutrino (right) running with a 700 kW beam assuming sin2(2θ13) = 0.1 and normal mass ordering. Backgrounds from intrinsicbeam νe (cyan), νµ NC (yellow), and νµ CC (green) are displayed as stacked histograms. The points with error bars are theexpected total event rate for δcp = 0; the red (blue) histogram is the total expected event rate with δcp = −π/2(+π/2). Thefigures are from top to bottom: NuMI ME at Ash River, NuMI LE at Soudan and the LBNE beam at Homestake.

10
Neutrino Energy (GeV)0 1 2 3 4 5 6 7 8
Eve
nts
/ 250
MeV
0
100
200
300
400
500
600
700
800
900
1000
Signal+Bg, N=5041
NC Bg, N=44µν
DisappearanceµνBeam: 120 GeV, 700kW
-modeν5 years NuMI 810km Ash River
Neutrino Energy (GeV)0 1 2 3 4 5 6 7 8
Eve
nts
/ 250
MeV
0
100
200
300
400
500
600
700
800
900
1000
Signal+Bg, N=2722
NC Bg, N=16µν
CC Bg, N=912µν
DisappearanceµνBeam: 120 GeV, 700kW
-modeν5 years NuMI 810km Ash River
Neutrino Energy (GeV)0 1 2 3 4 5 6 7 8
Eve
nts
/ 250
MeV
0
500
1000
1500
2000
2500
3000
3500
4000
Signal+Bg, N=40255
NC Bg, N=683µν
DisappearanceµνBeam: 120 GeV, 700kW
-modeν5 years NuMI 735km Soudan
Neutrino Energy (GeV)0 1 2 3 4 5 6 7 8
Eve
nts
/ 250
MeV
0
500
1000
1500
2000
2500
3000
3500
4000
Signal+Bg, N=21281
NC Bg, N=83µν
CC Bg, N=6335µν
DisappearanceµνBeam: 120 GeV, 700kW
-modeν5 years NuMI 735km Ash River
Neutrino Energy (GeV)0 1 2 3 4 5 6 7 8
Eve
nts
/ 250
MeV
0
100
200
300
400
500
600
700
800
900
1000
Signal+Bg, N=9101
NC Bg, N=80µν
DisappearanceµνBeam: 120 GeV, 700kW
-modeν5 years LBNE 1300km
Neutrino Energy (GeV)0 1 2 3 4 5 6 7 8
Eve
nts
/ 250
MeV
0
100
200
300
400
500
600
700
800
900
1000
Signal+Bg, N=5028
NC Bg, N=33µν
CC Bg, N=1646µν
DisappearanceµνBeam: 120 GeV, 700kW
-modeν5 years LBNE 1300km
FIG. 7. The expected spectrum of νµ or νµ oscillation events in a 34-kton LArTPC for 5 years of neutrino (left) and anti-neutrino (right) running with a 700 kW beam. The points with error bars are the expected total event rate for ∆2m32 = 2.35and sin2 2θ23 = 0.1. Backgrounds from NC and the wrong sign ν are displayed. The figures are from top to bottom: NuMIME at Ash River, NuMI LE at Soudan and the LBNE beam at Homestake.

11
TABLE V. Estimated range of the LAr-TPC detector performance parameters for the primary oscillation physics. The expectedrange of signal efficiencies, background levels, and resolutions from various studies (middle column) and the value chosen forthe baseline LBNE neutrino-oscillation sensitivity calculations (right column) are shown. ∗ For atmospheric neutrinos this isthe mis-identification rate for < 2 GeV events, the mis-identification rate is taken to be 0 for > 2 GeV.
Parameter Range of Values Value Used for LBNE Sensitivities
Identification of νe CC events
νe CC efficiency 70-95% 80%νµ NC mis-identification rate 0.4-2.0% 1%νµ CC mis-identification rate 0.5-2.0% 1%Other background 0% 0%Signal normalization error 1-5% 1%Background normalization error 2-10% 5%
Identification of νµ CC events
νµ CC efficiency 80-95% 85%νµ NC mis-identification rate 0.5-10% 0.5%Other background 0% 0%Signal normalization error 1-5% 5%Background normalization error 2-10% 10%
Identification of ν NC events
ν NC efficiency 70-95% 90%νµ CC mis-identification rate 2-10% 10% ∗
νe CC mis-identification rate 1-10% 10% ∗
Other background 0% 0%Signal normalization error 1-5%Background normalization error 2-10%
Neutrino energy resolutions
νe CC energy resolution 15%/√E(GeV ) 15%/
√E(GeV )
νµ CC energy resolution 20%/√E(GeV ) 20%/
√E(GeV )
Eνe scale uncertaintyEνµ scale uncertainty 1-5% 2%
Initial results on muon-induced background are presented in a supporting document on the LBNE Reconfigurationwebsite [23]. GEANT simulation indicates that there are cuts which reduce the background to a few events per yearwhile retaining high signal efficiency. A system of photon detectors, which would improve the time resolution of theexperiment, would further reduce the background to less than 1 event per year.
The need for a near detector is analyzed in a supporting document [24]. A full near detector, with a design similarto that of the far detector, will be needed for later phases of LBNE when high statistics allow a variety of searchesfor physics beyond the 3× 3 ν-matrix model. However for phase-1 and its primary goals of determining the neutrinomass hierarchy and measuring the CP phase, a simpler and less costly near detector should suffice. This could includea magnetized detector to measure the muon neutrino and anti-neutrino spectra and an existing liquid argon TPC onthe surface to detect off-axis neutrinos and measure the π0 production rate.
C. Mass Hierarchy and CP Violation Sensitivity
The long-baseline physics capabilities of a LAr-TPC far detector in the proposed LBNE project is described indetail in [25]. In these sections we will focus on the comparison of physics capabilities of a LAr-TPC at Homestakewith a LAr-TPC detector placed in the NuMI beam at the Soudan and Ash River locations.
We use the GLoBES software package to estimate the significance, σ, with which we can 1) exclude the oppositemass hierarchy, and 2) exclude δcp = 0 or π (CP violation). A True appearance event spectrum is generated for agiven value of δcp, sign(∆m2
31) as shown in Figure 6. A minimum χ2 fit is performed to the given hypothesis. Theminimization accounts for the correlations between the different mixing parameters which are included with Gaussianconstraints based on the best fit uncertainties as summarized in Table II. The disappearance experiment as shownin Figure 7 is included in the minimization and helps to constrain the atmospheric parameters. The normalizationuncertainties on the signal and background listed in Table V are included as nuisance parameters. θ13 is constrained

12
TABLE VI. Detector efficiencies and background rejection assumptions for NOνA used in sensitivity calculations.
Parameter Value Used (NOνA)
Identification of νe CC events
νe CC efficiency 26% (ν) 41% (ν)νµ NC mis-identification rate 0.28% (ν) 0.88% (ν)νµ CC mis-identification rate 0.13%Other background 0%Signal normalization error 5%Background normalization error 10%
Identification of νµ CC events
νµ CC efficiency 100% (QE only)νµ NC mis-identification rate 0.1%Other background 0%Signal normalization error 2%Background normalization error 10%
using the projected accuracy expected from the final run of the current reactor experiments (3%). When estimatingthe sensitivity to the mass hierarchy, the χ2 minimization is performed over all values of δcp. The opposite masshierarchy is included in the minimization when estimating the χ2 to determine whether CP is violated (δcp 6= 0 orπ). The significance with which we can exclude the opposite mass hierarchy and determine whether δcp 6= 0 or π is
defined as σ =√χ2. The significance as a function of δcp is shown in Figure 8 for three different LAr-TPC masses,
10, 15, and 34 kt placed at Soudan, Ash River, and Homstake. No constraints from other experiments are included.The relatively poor performance for δcp > 0 for the Minnesota sites is due to the inability to determine the mass
hierarchy with those experiments alone. Sensitivity to the hierarchy depends strongly on the baseline and the energyspread of the beam. The very long-baseline to Homestake makes the problem easier. For the shorter baseline to theMinnesota sites, it is more difficult, especially for δcp > 0 where the CP and matter effects are of opposite sign.The situation is significantly improved if results from the T2K experiment in Japan are included in a global analysis.T2K’s short baseline greatly reduces the matter effect. This allows the two effects to be separated in the globalanalysis. However it must be remembered that success depends on understanding in detail the systematics of severalexperiments and their correlations. The significance of the hierarchy measurement when results from a 15 kt LAr-TPCare combined with the NOνA, and T2K experiments is shown in Figure 9. For the combinations with a LAr-TPC atthe Minnesota site the NOνA experiment is assumed to run concurrently for a total of 16 yrs. We use a 6 year runwhen combining NOνA results with the experiment at Homestake. A total of 5 × 10²¹ integrated protons on targetis assumed for the T2K experiment. The significance with which CP violation is resolved with a LAr-TPC at AshRiver Soudan, and Homestake when combined with NOνA and T2K running is also shown in Figure 9. The oppositemass hierarchy is considered when estimating the CP violation significance with different experimental combinations.
In Figure 10, the significance with which CP violation is resolved for 50% of δcp values as a function of exposurein kt.yrs with a LAr-TPC at Homestake , Ash River, and Soudan is shown. The sensitivity of the NOνA experiment(estimated using the GLoBES package) with increasing exposure is also displayed for reference.
D. Precision Measurement of Neutrino Mixing Parameters
One of the primary scientific goals of the LBNE experiment is to carry out the most precise measurements ofthe three-flavor neutrino-oscillation parameters. The precision with which the values of δcp and sin2 2θ13 can bedetermined in the νµ → νe appearance mode as a function of exposure in yrs and mass is shown in Figures 11, and12 respectively. It is to be noted that for measurements of δcp, the resolution is limited by the degeneracy betweenδcp and other mixing parameters such as θ13, θ23 and the mass ordering. External constraints on θ13 from the reactorexperiments improves the δcp resolution from the NuMI options for values of δcp in the vicinity of |π/2| (maximalCP violation). LBNE-Homestake provides enough internal constraints on the other mixing parameters and the massordering that the impact of degeneracies is much less pronounced. Its to be noted that Figures 11 and 12 assumethe mass ordering is resolved for all values of δcp.
The precision with which the values of sin2 2θ23 and |∆m231| can be determined from a joint fit to the νµ → νµ
disappearance mode and νµ → νe appearance mode as a function of exposure in years and mass is shown in Figures

13
0
2
4
6
8
10
12
14
16
-1 -0.8 -0.6 -0.4 -0.2 0 0.2 0.4 0.6 0.8 1
Es
tim
ate
d M
H S
ign
ific
an
ce
(σ)
δCP/π
Mass Hierarchy Significance vs δCP 10kt, NH, θ13=0.154(4)
3σ
Homestake 10kt, 10yrsAsh River 10kt, 10 yrs
Soudan 10kt, 10 yrsNOvA 14kt, 6 yrs
0
1
2
3
4
5
6
7
-1 -0.8 -0.6 -0.4 -0.2 0 0.2 0.4 0.6 0.8 1
Sig
nif
ica
nc
e (
σ)
δCP/π
CPV Significance vs δCP 10kt, NH(IH considered), θ13=0.154(4)
3σ
Homestake 10kt, 10yrsAsh River 10kt, 10 yrs
Soudan 10kt, 10 yrsNOvA 14kt, 6 yrs
0
2
4
6
8
10
12
14
16
-1 -0.8 -0.6 -0.4 -0.2 0 0.2 0.4 0.6 0.8 1
Es
tim
ate
d M
H S
ign
ific
an
ce
(σ)
δCP/π
Mass Hierarchy Significance vs δCP 15kt, NH, θ13=0.154(4)
3σ
Homestake 15kt, 10yrsAsh River 15kt, 10 yrs
Soudan 15kt, 10 yrs
0
1
2
3
4
5
6
7
-1 -0.8 -0.6 -0.4 -0.2 0 0.2 0.4 0.6 0.8 1
Sig
nif
ica
nc
e (
σ)
δCP/π
CPV Significance vs δCP 15kt, NH(IH considered), θ13=0.154(4)
3σ
Homestake 15kt, 10yrsAsh River 15kt, 10 yrs
Soudan 15kt, 10 yrs
0
2
4
6
8
10
12
14
16
-1 -0.8 -0.6 -0.4 -0.2 0 0.2 0.4 0.6 0.8 1
Es
tim
ate
d M
H S
ign
ific
an
ce
(σ)
δCP/π
Mass Hierarchy Significance vs δCP 34kt, NH, θ13=0.154(4)
3σ
Homestake 34kt, 10yrsAsh River 34kt, 10 yrs
Soudan 34kt, 10 yrs
0
1
2
3
4
5
6
7
-1 -0.8 -0.6 -0.4 -0.2 0 0.2 0.4 0.6 0.8 1
Sig
nif
ica
nc
e (
σ)
δCP/π
CPV Significance vs δCP 34kt, NH(IH considered), θ13=0.154(4)
3σ
Homestake 34kt, 10yrsAsh River 34kt, 10 yrs
Soudan 34kt, 10 yrs
FIG. 8. The significance with which the mass ordering (left) and CP violation (δcp 6= 0, π) is resolved (right) with a LAr-TPCat Homestake (red), Ash River (blue-dashed), Soudan (black-dashed) as a function of the unknown CP violating phase δcp. Thesensitivity of the NOνA experiment with 14 kt of a totally active liquid scintillator detector (TASD) at Ash River is shown ingray. The plots are from top to bottom: 10kt, 15kt and 34kt. The significance is calculated using the current constraints on themixing parameters from the global fit as shown in Table II. θ13 is constrained using the projected accuracy expected from thecurrent reactor experiments (3%). The opposite mass hierarchy is considered when calculating the CP violation significance.There is no T2K constraint on the mass hierarchy. An exposure of 5 yrs neutrino running combined with 5 yrs of anti-neutrinorunning in a 700kW beam is assumed. The NuMI LE beam is used at Soudan and at Ash River.

14
0
2
4
6
8
10
12
14
16
-1 -0.8 -0.6 -0.4 -0.2 0 0.2 0.4 0.6 0.8 1
Esti
mate
d M
H S
ign
ific
an
ce (
σ)
δCP/π
Mass Hierarchy Significance vs δCP 15kt, NH, θ13=0.154(4)
Homestake + NOvA(6) + T2KAsh River + NOvA(16) + T2K
Soudan + NOvA(16) + T2KNOvA(16) + T2K
3σ
0
1
2
3
4
5
6
7
-1 -0.8 -0.6 -0.4 -0.2 0 0.2 0.4 0.6 0.8 1
Sig
nif
ican
ce (
σ)
δCP/π
CPV Significance vs δCP 15kt, NH(IH considered)
sin2(2θ13)=0.092(5)
3σ
Homestake + NOvA(6) + T2KAsh River + NOvA(16) + T2K
Soudan + NOvA(16) + T2KNOvA(16) + T2K
FIG. 9. The significance with which the mass ordering (left) and CP violation (right) is resolved when a 15 kt LAr-TPC atHomestake (red), Ash River (blue-dashed), Soudan (black-dashed) is combined with NOνA running with the ME beam for 3+3years (I), the LE beam for 5+5 yrs (II) and T2K (5× 10²¹ protons-on-target). The significance just from NoVA I+II combinedwith T2K is shown as gray-dashed line.
13, and 14 respectively. The measurements from neutrino and anti-neutrino running in the ratio 1:1 are combined.The current best measurements of |∆m2
32| for neutrinos and anti-neutrinos measured separately are from the MINOSexperiment [26] utilizing only the signal in the disappearance mode.

15
0
1
2
3
4
5
6
0 50 100 150 200 250 300
Sig
nif
ica
nc
e (
σ)
Exposure (kt*years)
CP violation sensitivity: Significance vs. exposure
50% δCP Coverage, NH(IH considered)
3σ
HomestakeAsh River
SoudanNOvA
0
1
2
3
4
5
6
0 50 100 150 200 250 300
Sig
nif
ica
nc
e (
σ)Exposure (kt*years)
CP violation sensitivity: Significance vs. exposure
50% δCP Coverage, NH(IH considered)
3σ
Homestake + NOvA(6) + T2KAsh River + NOvA(16) + T2K
Soudan + NOvA(16) + T2K
FIG. 10. The significance with which CP violation is resolved for 50% of δcp values as a function of exposure in kt.yrs with aLAr-TPC at Homestake (red), Ash River (blue-dashed), Soudan (black-dashed). The sensitivity of the NOνA experiment witha totally active liquid scintillator detector (TASD) at Ash River is shown in gray. The results are for neutrino and anti-neutrinorunning in the ratio 1:1 with a 700kW beam assuming 6.0 × 10²⁰ protons-on-target per year. The NuMI LE beam is used atSoudan and Ash River. The measurements include a constraint on θ13 = 0.154 ± 0.005 and take into account all correlationswith the other mixing parameters which are constrained using the current best estimate of the uncertainties as summarizedin [4]. Both mass hierarchies are considered when estimating the sensitivities to CP violation. The figure on the left is thesensitivity achieved by each individual experiment. The figure on the right shows the sensitivities achieved combining theLAr-TPC with NOνA and T2K (5 × 10²¹ integrated protons-on-target). For the Homestake option, it is assumed NOνA willrun for 6 yrs at 700kW; for the Minnesota sites it is assumed NOνA will run for 16 yrs.
Exposure (kT-years)50 100 150 200 250 300
)° r
esol
utio
n (
CP
δ
0
20
40
60
80
100
120
140
160 NuMI ME BeamAsh River: 810 km
° = 0CPδ
° = 90CPδ
° = -90CPδ
constraint 13θNo
Exposure (kT-years)50 100 150 200 250 300
)° r
esol
utio
n (
CP
δ
0
20
40
60
80
100
120
140
160 NuMI LE BeamSoudan: 735 km
° = 0CPδ
° = 90CPδ
° = -90CPδ
constraint 13θNo
Exposure (kT-years)50 100 150 200 250 300
)° r
esol
utio
n (
CP
δ
0
20
40
60
80
100
120
140
160 LBNE LE Beam
Homestake: 1300 km
° = 0CPδ
° = 90CPδ
° = -90CPδ
constraint 13θNo
FIG. 11. The 1σ resolution on the measurement of δcp as a function of exposure in kt.yrs for δcp = 0 (red), π/2 (blue), −π/2 (green). The exposure in yrs is assumed to be 1/2 ν and 1/2 ν running at 700kW. The solid lines include the tight externalconstraint on θ13 = 0.154 ± 0.005. The dashed lines are without any external constraints on θ13. The plots from left to rightare for Ash River, Soudan, and Homestake. The measurements assume sin2 2θ13 = 0.092 and normal hierarchy. The masshierarchy is assumed to be known.

16
Exposure (kT-years)50 100 150 200 250 300
) re
solu
tion
13θ(22
sin
0
0.005
0.01
0.015
0.02
0.025
0.03
NuMI ME BeamAsh River: 810 km
° = 0CPδ° = 90CPδ° = -90CPδ
Exposure (kT-years)50 100 150 200 250 300
) re
solu
tion
13θ(22
sin
0
0.005
0.01
0.015
0.02
0.025
0.03
NuMI LE BeamSoudan: 735 km
° = 0CPδ° = 90CPδ° = -90CPδ
Exposure (kT-years)50 100 150 200 250 300
) re
solu
tion
13θ(22
sin
0
0.005
0.01
0.015
0.02
0.025
0.03LBNE LE Beam
Homestake: 1300 km° = 0CPδ° = 90CPδ° = -90CPδ
FIG. 12. The 1σ resolution on the measurement of sin2 2θ13 = 0.092 as a function of exposure in kt.yrs for δcp =0 (red), π/2 (blue), − π/2 (green). The plots from left to right are for Ash River, Soudan, and Homestake. The masshierarchy is assumed to be known.
Exposure (kT-years)50 100 150 200 250 300
res
olut
ion
(rad
ians
)23θ
0
0.005
0.01
0.015
0.02
0.025
0.03
0.035
0.04
0.045
0.05
NuMI ME BeamAsh River: 810 km
= 0.70523θ = 0.62223θ = 0.92723θ
Exposure (kT-years)50 100 150 200 250 300
res
olut
ion
(rad
ians
)23θ
0
0.005
0.01
0.015
0.02
0.025
0.03
0.035
0.04
0.045
0.05
NuMI LE BeamSoudan: 735 km
= 0.70523θ = 0.62223θ = 0.92723θ
Exposure (kT-years)50 100 150 200 250 300
res
olut
ion
(rad
ians
)23θ
0
0.005
0.01
0.015
0.02
0.025
0.03
0.035
0.04
0.045
0.05LBNE LE Beam
Homestake: 1300 km
= 0.70523θ = 0.62223θ = 0.92723θ
FIG. 13. The 1σ resolution on the measurement of sin2 2θ23 from νµ → νµ and νµ → νe oscillations as a function of exposurein kt.yrs for different values of sin2 2θ23. Neutrino and anti-neutrino running are combined in the ratio of 1:1. The plots fromleft to right are for Ash River, Soudan, and Homestake. The mass hierarchy is assumed to be known.
Exposure (kT-years)50 100 150 200 250 300
)2 r
esol
utio
n (e
V312
m∆
0
0.01
0.02
0.03
0.04
0.05
0.06
0.07
0.08
0.09
0.1-310×
NuMI ME BeamAsh River: 810 km
= 0.70523θ = 0.62223θ = 0.92723θ
Exposure (kT-years)50 100 150 200 250 300
)2 r
esol
utio
n (e
V312
m∆
0
0.01
0.02
0.03
0.04
0.05
0.06
0.07
0.08
0.09
0.1-310×
NuMI LE BeamSoudan: 735 km
= 0.70523θ = 0.62223θ = 0.92723θ
Exposure (kT-years)50 100 150 200 250 300
)2 r
esol
utio
n (e
V312
m∆
0
0.01
0.02
0.03
0.04
0.05
0.06
0.07
0.08
0.09
0.1-310×
LBNE LE Beam
Homestake: 1300 km
= 0.70523θ = 0.62223θ = 0.92723θ
FIG. 14. The 1σ resolution on the measurement of |∆m231| = 2.35 × 10⁻³ eV2 from νµ → νµ and νµ → νe oscillations as a
function of exposure in kt.yrs for different values of sin2 2θ23. Neutrino and anti-neutrino running are combined in the ratio 1:1.The plots from left to right are for Ash River, Soudan, and Homestake. The mass hierarchy is assumed to be known.

17
E. Searches for New Physics
In addition to precision measurements of the standard three-flavor neutrino oscillation parameters, LBNE is alsowell-suited for new physics searches in the neutrino sector. For example, the experiment is sensitive to non-standardneutrino interactions and active-sterile neutrino mixing, provided that these effects are not too weak.
1. Non-standard Interactions
NC non-standard interactions (NSI) can be understood as non-standard matter effects that are visible only in a fardetector at a sufficiently long-baseline. This is where LBNE has a unique advantage compared to other long-baselineexperiments (except atmospheric neutrino experiments, which are, however, limited by systematic effects). NC NSIcan be parameterized as new contributions to the MSW matrix in the neutrino-propagation Hamiltonian:
H = U
0∆m2
21/2E∆m2
31/2E
U† + VMSW , (5)
with
VMSW =√
2GFNe
1 + εmee εmeµ εmeτεm∗eµ εmµµ εmµτεm∗eτ εm∗µτ εmττ
(6)
Here, U is the leptonic mixing matrix, and the ε-parameters give the magnitude of the NSI relative to standard weakinteractions. For new physics scales of few × 100 GeV, we expect |ε| . 0.01.
To assess the sensitivity of LBNE to NC NSI, the NSI discovery reach is defined in the following way: Aftersimulating the expected event spectra, assuming given “true” values for the NSI parameters, one attempts a fitassuming no NSI. If the fit is incompatible with the simulated data at a given confidence level, one would say thatthe chosen “true” values of the NSI parameters are within the experimental discovery reach. As an example of thereach for new physics, figure 15 shows the NSI discovery reach of a Phase-2 LBNE at Homestake for the case whereonly one of the εmαβ parameters is non-negligible at a time [27]. It can be concluded from the figure that such anexperiment would be able to improve model-independent bounds on NSI in the e–µ sector by a factor of two, and inthe e–τ sectors by an order of magnitude.
2. Long-range Interactions
The small scale of neutrino-mass differences implies that minute differences in the interactions of neutrinos andantineutrinos with background sources can be detected through perturbations to the time evolution of the flavoreigenstates. The longer the experimental baseline, the higher the sensitivity to a new long-distance potential actingon neutrinos. For example, some of the models for such long-range interactions (LRI) as described in [31] could containdiscrete symmetries that stabilize the proton and a dark matter particle and thus provide new connections betweenneutrino, proton decay and dark matter experiments. The longer baseline of LBNE coupled with the expected precisionof better than 1% on the νµ and νµ oscillation parameters improves the sensitivity to LRI beyond that possible bythe current generation of long-baseline neutrino experiments.
3. Search for Active-Sterile Neutrino Mixing
Searches for evidence of active sterile neutrino mixing at LBNE can be conducted by examining the NC eventrate at the Far Detector and comparing it to a precision measurement of the expected rate from the near detector.Observed deficits in the NC rate could be evidence for active sterile neutrino mixing. The latest such search in along baseline experiment was conducted by the MINOS experiment [32]. The expected rate of NC interactions withvisible energy > 0.5 GeV in LBNE is approximately 5K events over five years (see Table IV). The NC identificationefficiency is high with a low rate of νµ CC background misidentification as shown in Table V. LBNE will provide aunique opportunity to revisit this search with higher precision over a large range of neutrino energies.

18
10-3 10-2 10-1 100
Εeem
ΕeΜm
ΕeΤm
ΕΜΜm
ΕΜΤm
ΕΤΤm
True ÈΕÈ
NC NSI discovery reach H3Σ C.L.L
sin22Θ13true = 0
only one Ε ¹ 0 at a timeLeft�right edges: Best�worst argHΕL
GLoBES 2010
LAr 33.4 kt � 1300 km120 GeV, 5 + 5 yrs
2nd max. only
1st max. only
both maxima
Excl. by current bounds
FIG. 15. Non-standard interaction discovery reach in a 34kt LAr-TPC at Homestake. The left and right edges of the errorbars correspond to the most favorable and the most unfavorable values for the complex phase of the respective NSI parameters.The gray shaded regions indicate the current model-independent limits on the different parameters at 3 σ [28–30].
F. Summary
The fraction of the possible CP-violating phase angles for which the mass hierarchy can be resolved at 2 or 3 σis shown in Figure 16 as a function of detector mass. Results are plotted for each detector alone and for a globalanalysis using the LAr, NOvA, and T2K results. For the Minnesota sites, it is assumed that NOvA would continueto run concurrently with the LAr detector for a total NOvA run of 16 years (NOvA(16)). For the South Dakotasite, NOvA would stop data taking when the new beamline turned on, for a total NOvA run of 6 years (NOvA(6)).The fraction of the possible CP-violating phase angles for which CP violation can be resolved at 3 or 5 σ is shownin Figure 17 as a function of detector mass. The opposite mass hierarchy hypothesis is included in the estimationof the significance with which CP violation can be measured. Here again, results are provided for the LAr detectoralone and for a LAr-NOvA-T2K global analysis. Figure 18 shows the δcp resolution achievable at each location withthe mass hierarchy assumed to be known.
Table VII summarizes the oscillation measurements achievable with different configurations.The LBNE Reconfiguration Steering Group has identified three experimental choices for Phase I of the next gener-
ation long-baseline neutrino experiment: 1) 10kt LAr detector on the surface at Homestake, 2) a 15kt LAr detectorunderground at Soudan, and 3) a 30 kt LAr detector on the surface at Ash River. Figure 19 summarizes the physicsreach for determining the mass hierarchy and CP violation for the three choices alone and in combination with NOvAand T2K neutrino running for 5× 10²¹ protons-on-target. The effect of a change in sin2 2θ13 by up to ±2σ from thecurrent value is shown as colored bands. Figure 20 shows the effect of variations in sin2 2θ23. Note that for the masshierarchy and CP violation measurements, it is just as important to know θ23 as it is θ13. Figure 21 shows similarplots but for variations in ∆m2
31.

19
0
0.2
0.4
0.6
0.8
1
0 5 10 15 20 25 30
δ CP F
racti
on
Ash River Detector Mass (kton)
Mass hierarchy sensitivity: δCP fraction vs. detector mass
Normal Hierarchy
Ash RiverAsh River + NOvA(16) + T2K
2σ3σ
0
0.2
0.4
0.6
0.8
1
0 5 10 15 20 25 30
δ CP F
racti
on
Soudan Detector Mass (kton)
Mass hierarchy sensitivity: δCP fraction vs. detector mass
Normal Hierarchy
SoudanSoudan + NOvA(16) + T2K
2σ3σ
0
0.2
0.4
0.6
0.8
1
0 5 10 15 20 25 30
δ CP F
racti
on
Homestake Detector Mass (kton)
Mass hierarchy sensitivity: δCP fraction vs. detector mass
Normal Hierarchy
HomestakeHomestake + NOvA(6) + T2K
2σ3σ
FIG. 16. The fraction of δcp values for which the mass hierarchy can be resolved at 2/3 σ (solid/open points) as a function ofLAr-TPC detector mass. The dashed black line indicates the sensitivty from the experiment alone. The solid red line is theresolution obtained from the combination with T2K (neutrinos only) and NOνA. The plots from left to right are for Ash River,Soudan, and Homestake. The measurements assume sin2 2θ13 = 0.092, normal hierarchy and a combination of 5yrs of runningin neutrino mode with 5 yrs of running in anti-neutrino mode with 700kW. The NuMI LE beam is used with the LAr-TPC atboth Soudan and Ash River.
0
0.2
0.4
0.6
0.8
1
0 5 10 15 20 25 30
δ CP F
racti
on
Ash River Detector Mass (kton)
CP violation sensitivity: δCP fraction vs. detector mass
NH(IH considered)
Ash RiverAsh River + NOvA(16) + T2K
3σ5σ
0
0.2
0.4
0.6
0.8
1
0 5 10 15 20 25 30
δ CP F
racti
on
Soudan Detector Mass (kton)
CP violation sensitivity: δCP fraction vs. detector mass
NH(IH considered)
SoudanSoudan + NOvA(16) + T2K
3σ5σ
0
0.2
0.4
0.6
0.8
1
0 5 10 15 20 25 30
δ CP F
racti
on
Homestake Detector Mass (kton)
CP violation sensitivity: δCP fraction vs. detector mass
NH(IH considered)
HomestakeHomestake + NOvA(6) + T2K
3σ5σ
FIG. 17. The fraction of δcp values for which CP violation can be resolved at 3/5 σ (solid/open points) as a function ofLAr-TPC detector mass. The dashed black line indicates the sensitivity from the experiment alone. The solid red line is theresolution obtained from the combination with T2K (neutrinos only) and NOνA. The plots from left to right are for Ash River,Soudan, and Homestake. The measurements assume sin2 2θ13 = 0.092, normal hierarchy and a combination of 5yrs of runningin neutrino mode and 5 yrs of running in anti-neutrino mode with 700kW. The NuMI LE beam is used with the LAr-TPC atboth Soudan and Ash River.

20
Ash River Detector Mass (kton)0 5 10 15 20 25 30
)° r
eso
luti
on
(C
Pδ
0
20
40
60
80
100
NuMI LE BeamAsh River: 810 km*Combined with: 3+3 years of NOvA (ME), 5+5 years of NOvA (LE), and 5 years of T2K
° = 0CPδ ° = 90CPδ
AloneCombined*No LAr detector*
Soudan Detector Mass (kton)0 5 10 15 20 25 30
)° r
eso
luti
on
(C
Pδ
0
20
40
60
80
100
NuMI LE BeamSoudan: 735 km*Combined with: 3+3 years of NOvA (ME), 5+5 years of NOvA (LE), and 5 years of T2K
° = 0CPδ ° = 90CPδ
AloneCombined*No LAr detector*
Homestake Detector Mass (kton)0 5 10 15 20 25 30
)° r
eso
luti
on
(C
Pδ
0
20
40
60
80
100
LBNE LE BeamHomestake: 1300 km*Combined with: 3+3 years of NOvA (ME) and 5 years of T2K
° = 0CPδ ° = 90CPδ
AloneCombined*No LAr detector*
FIG. 18. The 1σ resolution on the measurement of δcp as a function of LAr-TPC detector mass for δcp = 0 (red), π/2 (blue). Atight external constraint on θ13 = 0.154± 0.005 is included. The dashed lines are the resolution obtained from each experimentalone. The solid lines include the combination with T2K (neutrino only) and NOνA. The plots from left to right are forAsh River, Soudan, and Homestake. The measurements assume sin2 2θ13 = 0.092, normal hierarchy and a combination of5yrs of running in neutrino mode and 5 yrs of running in anti-neutrino mode with 700kW. The NuMI LE beam is used withthe LAr-TPC at both Soudan and Ash River. The mass hierarchy is assumed to be known. The stars represent theresolutions obtained from the NOνA+T2K combination alone.
TABLE VII. Summary of the oscillation measurements with different configurations given θ13 = 8.8◦, θ23 = 40◦,∆m231 =
+2.27 × 10⁻³eV2. The fraction of δcp values for which the mass hierarchy (MH) or CP violation (CPV) are determinedwith 3σ sensitivity are given in the first 2 columns. For the first 2 columns, all correlations and uncertainties on the knownmixing parameters, as well as consideration of the opposite mass hierarchy hypothesis, are included. For the estimates of theresolutions on the different oscillation parameters, the mass hierarchy is assumed to be known. The measurements assume 5years of neutrino running and 5 years of anti-neutrino running at a beam power of 708kW with 6 × 10²⁰ protons-on-targetaccumulated per year with a LAr-TPC. We assume NOνA will run for a minimum of 3+3 years with the NuMI ME energybeam (NOνA I). An additional 5+5 years of running with NOνA in the NuMI LE beam (NOνA II) is assumed when combiningwith Soudan and Ash River options. We assume 5 × 10²¹ protons-on-target total accumulated by T2K (∼ 6 yrs) in neutrinoonly mode. ∗ These measurements are for the combination of neutrino and anti-neutrino running.
Configuration MH∗ CPV∗ σ(δcp)∗ σ(θ13)∗ σ(θ23) σ(θ23) σ(∆m2
31) σ(∆m231)
fraction of δ fraction of δ 0, 90◦ δ = 90◦ ν ν ν ν(3σ) (3σ) (10−3 eV2) (10−3 eV2)
Soudan 10kt 0.00 0.00 27,36◦ 0.70◦ 1.3◦ 1.6◦ 0.045 0.065Soudan 15kt 0.17 0.05 23,30◦ 0.60◦ 1.1◦ 1.3◦ 0.036 0.055Soudan 30kt 0.34 0.18 16,24◦ 0.45◦ 0.80◦ 0.97◦ 0.028 0.040Ash River 10kt 0.28 0.00 23,48◦ 0.60◦ 1.3◦ 1.8◦ 0.058 0.080Ash River 15kt 0.37 0.10 19,40◦ 0.50◦ 1.0◦ 1.5◦ 0.048 0.069Ash River 30kt 0.47 0.27 18,29◦ 0.40◦ 0.74◦ 1.1◦ 0.035 0.050Homestake 5kt 0.66 0.00 25,41◦ 0.60◦ 0.92◦ 1.4◦ 0.035 0.055Homestake 10kt 0.81 0.27 17,30◦ 0.40◦ 0.69◦ 0.97◦ 0.025 0.040Homestake 15kt 0.95 0.43 15,25◦ 0.30◦ 0.52◦ 0.80◦ 0.020 0.030Homestake 20kt 1.0 0.50 13,21◦ 0.25◦ 0.46◦ 0.63◦ 0.018 0.026NOνA I (6yrs) +T2K (6yrs) 0.0 0.0 22,65◦ 0.62◦
NOνA I+II (16yrs)+T2K (6yrs) 0.25 0.11 18,47◦ 0.53◦
Soudan 10kt +NOνA (I+II)+T2K 0.38 0.21 16,30◦
Soudan 15kt +NOνA (I+II)+T2K 0.38 0.23 14,26◦
Soudan 30kt +NOνA (I+II)+T2K 0.45 0.29 12,21◦
Ash River 10kt +NOνA (I+II)+T2K 0.40 0.23 14,34◦
Ash River 15kt +NOνA (I+II)+T2K 0.45 0.25 13,30◦
Ash River 30kt +NOνA (I+II)+T2K 0.50 0.55 13,25◦
Homestake 5kt +NOνA I+T2K 1.00 0.33 15,31◦
Homestake 10kt +NOνA I+T2K 1.00 0.45 12,25◦
Homestake 15kt +NOνA I+T2K 1.00 0.53 12,24◦

21
Sig
nif
ica
nc
e (
σ)
δCP/π
Mass Hierarchy Significance vs δCPNormal Hierarchy, sin
2(2θ13)=0.07 to 0.12
Matt Bass (CSU)
Ash River 30ktHomestake 10kt
Soudan 15kt
0
2
4
6
8
10
12
14
16
-1 -0.8-0.6-0.4-0.2 0 0.2 0.4 0.6 0.8 1
Sig
nif
ica
nc
e (
σ)δCP/π
CPV Significance vs δCPNH(IH considered), sin
2(2θ13)=0.07 to 0.12
Matt Bass (CSU)
Ash River 30ktHomestake 10kt
Soudan 15kt
0
1
2
3
4
5
6
7
-1 -0.8-0.6-0.4-0.2 0 0.2 0.4 0.6 0.8 1
Sig
nif
ica
nc
e (
σ)
δCP/π
Mass Hierarchy Significance vs δCPNormal Hierarchy, sin
2(2θ13)=0.07 to 0.12
Ash River 30kt + NOvA(16) + T2KHomestake 10kt + NOvA(6) + T2K
Soudan 15kt + NOvA(16) + T2K
0
2
4
6
8
10
12
14
16
-1 -0.8-0.6-0.4-0.2 0 0.2 0.4 0.6 0.8 1
Sig
nif
ica
nc
e (
σ)
δCP/π
CPV Significance vs δCPNH(IH considered), sin
2(2θ13)=0.07 to 0.12
Ash River 30kt + NOvA(16) + T2KHomestake 10kt + NOvA(6) + T2K
Soudan 15kt + NOvA(16) + T2K
0
1
2
3
4
5
6
7
-1 -0.8-0.6-0.4-0.2 0 0.2 0.4 0.6 0.8 1
FIG. 19. Comparison between the 3 selected configurations. Significance with which the mass hierarchy is resolved is on theleft. The significance with which δcp is determined to be 6= 0, π is on the right. The top set of plots is for the 3 choices alone :10kt at Homestake, 15kt at Soudan and 30kt at Ash River. The bottom set of plots is for the 3 choices combined with NOνAand T2K running. NOνA is assumed to run for 6 years in combination with LBNE-Homestake and for 16 years in combinationwith the Minnesota sites. T2K is assumed to run for an integrated 5× 10²¹ protons-on-target. The colored bands indicate thechange in significance when the central value of sin22θ13 assumed is changed from 0.07 to 0.12.

22
Sig
nif
ica
nc
e (
σ)
δCP/π
Mass Hierarchy Significance vs δCPNormal Hierarchy, sin
2(2θ23)=0.9 to 1.0
Matt Bass (CSU)
Ash River 30ktHomestake 10kt
Soudan 15kt
0
2
4
6
8
10
12
14
16
-1 -0.8-0.6-0.4-0.2 0 0.2 0.4 0.6 0.8 1
Sig
nif
ica
nc
e (
σ)δCP/π
CPV Significance vs δCPNH(IH considered), sin
2(2θ23)=0.9 to 1.0
Matt Bass (CSU)
Ash River 30ktHomestake 10kt
Soudan 15kt
0
1
2
3
4
5
6
7
-1 -0.8-0.6-0.4-0.2 0 0.2 0.4 0.6 0.8 1
Sig
nif
ica
nc
e (
σ)
δCP/π
Mass Hierarchy Significance vs δCPNormal Hierarchy, sin
2(2θ23)=0.9 to 1.0
Matt Bass (CSU)
Ash River 30kt + NOvA(16) + T2KHomestake 10kt + NOvA(6) + T2K
Soudan 15kt + NOvA(16) + T2K
0
2
4
6
8
10
12
14
16
-1 -0.8-0.6-0.4-0.2 0 0.2 0.4 0.6 0.8 1
Sig
nif
ica
nc
e (
σ)
δCP/π
CPV Significance vs δCPNH(IH considered), sin
2(2θ23)=0.9 to 1.0
Matt Bass (CSU)
Ash River 30kt + NOvA(16) + T2KHomestake 10kt + NOvA(6) + T2K
Soudan 15kt + NOvA(16) + T2K
0
1
2
3
4
5
6
7
-1 -0.8-0.6-0.4-0.2 0 0.2 0.4 0.6 0.8 1
FIG. 20. Same as Figure 19 except showing the effect of varying sin2 2θ23 from 0.9 to 1.0.

23
Sig
nif
ica
nc
e (
σ)
δCP/π
Mass Hierarchy Significance vs δCPNormal Hierarchy, ∆m
231=2.30e-3 to 2.62e-3
Matt Bass (CSU)
Ash River 30ktHomestake 10kt
Soudan 15kt
0
2
4
6
8
10
12
14
16
-1 -0.8-0.6-0.4-0.2 0 0.2 0.4 0.6 0.8 1
Sig
nif
ica
nc
e (
σ)δCP/π
CPV Significance vs δCPNH(IH considered), ∆m
231=2.30e-3 to 2.62e-3
Matt Bass (CSU)
Ash River 30ktHomestake 10kt
Soudan 15kt
0
1
2
3
4
5
6
7
-1 -0.8-0.6-0.4-0.2 0 0.2 0.4 0.6 0.8 1
FIG. 21. Same as Figure 19 except showing the effect of varying ∆m231 by ±7%.

24
G. What is the Optimal Baseline for LBNE?
A number of studies have been done to determine the optimal baseline for a next-generation long-baseline neutrinoexperiment aiming to determine the mass hierarchy and CP violation [33] – most were performed before the valueof θ13 was known. One might now ask whether or not the distance from Fermilab to Homestake remains an optimalchoice for LBNE given the now known value of θ13. To determine the optimal baseline for LBNE with a new neutrinobeamline, the LBNE LE beam design described in Table III was modified to produce a beam flux that covered theentire region of the 1st oscillation node at each baseline. The double-parabolic NuMI focusing system was used, sinceit is highly tunable. The target to horn 1 distance, decay pipe length and off-axis angle were varied to match thebaseline. Table VIII summarizes the beam parameters used for each baseline and the estimated signal and backgroundevent rates obtained at a 35kt LAr-TPC far detector.
TABLE VIII. The modified LBNE beam configuration used at each baseline to determine the optimal baseline for the nextgeneration long-baseline experiment. The beam parameters were chosen to cover the entirety of the 1st oscillation node at eachbaseline. The signal and background event rates are for a 35kt LAr-TPC 5+5 years at 700kW (6×10²⁰ protons-on-target/year)for sin2(2θ13) = 0.09, δcp = 0, normal hierarchy.
Baseline (km) Target-Horn 1 distance Decay pipe length Off-axis angle νe+νe appearance signal background300 30cm 280m 2◦ 480+170 740+450500 30cm 280m 1.5◦ 450+150 425+240750 30cm 280m 1.0◦ 520+170 350+2001000 0cm 280m 0◦ 820+290 434+2701300 30cm 280m 0◦ 770+230 310+1801700 30cm 280m 0◦ 550+130 170+1002000 70cm 580m 0◦ 780+160 321+1222500 70cm 580m 0◦ 610+100 140+753000 100cm 580m 0◦ 560+72 100+50
The event spectra expected from in a 35kt LAr-TPC running for 5 years in a 700kW beam at each baseline usingthe beam configurations described in Table III are shown in Figures 22 (neutrinos) and 23 (anti-neutrinos).
Figure 24 shows the mass hierarchy and CP violation reach for a 35 kton LAr-TPC detector in 10 years of runningfor various baseline considerations when a different flux was chosen to more appropriately match the baseline. Figure25 shows the fraction of δcp values for which CP violation and the mass hierarchy can be determined at the 3σ levelor greater as a function of baseline. For determining the CP violation uncertainty, the mass hierarchy is assumed tobe unknown and is allowed to change. The optimal baseline for the CP violation measurement is found to be in therange 1000-1500km. A 1300 km distance achieves a > 5σ determination of the mass hierarchy for all values of δCPwith a 35 kt detector and simultaneously maintains the highest sensitivity for CP violation. Hence, the distance fromFermilab to Homestake remains an optimal baseline given what is now known about the value of θ13.

25
FIG. 22. Neutrino event spectra in a 35 kt LAr-TPC at different baselines with optimized LBNE beam tunes. Projectionsassume sin2 2θ13 = 0.09 and a running time of 5 years with a 700kW beam.

26
FIG. 23. Anti-neutrino event spectra in a 35 kt LAr-TPC at different baselines with optimized LBNE beam tunes. Projectionsassume sin2 2θ13 = 0.09 and a running time of 5 years with a 700kW beam.

27
0
10
20
30
40
50
-1 -0.8 -0.6 -0.4 -0.2 0 0.2 0.4 0.6 0.8 1
Sig
nif
ica
nc
e (
σ)
δCP/π
Mass Hierarchy Significance vs δCP Normal Hierarchy35 kt, 5+5, 700 kW
300 km750 km
1000 km1300 km2000 km3000 km
0
2
4
6
8
10
-1 -0.8 -0.6 -0.4 -0.2 0 0.2 0.4 0.6 0.8 1
Sig
nif
ica
nc
e (
σ)
δCP/π
CPV Significance vs δCP NH(IH considered)35 kt, 5+5, 700 kW
300 km750 km
1000 km1300 km2000 km3000 km
FIG. 24. Significance with which the mass hierarchy (left) and CP violation (right) can be determined as a function of δCPfor a 35 kt LAr detector in 5+5 years of neutrino + anti-neutrino running for various baselines ranging from 300 km up to3000 km. In each case, the beam was adjusted to more appropriately match the baseline. Projections assume sin2 2θ13 = 0.09.
0
0.2
0.4
0.6
0.8
1.0
0 500 1000 1500 2000 2500 3000
δ CP F
rac
tio
n
Baseline (km)
3σ δCP Fraction vs Baseline 35kt LAr
CPV NH(IH considered)MH Normal Hierarchy
FIG. 25. The fraction of δcp values for which CP violation and the mass hierarchy can be determined at the 3σ level or greateras a function of baseline. The LBNE beam design was optimized for each base-line. Projections assume sin2 2θ13 = 0.09.

28
IV. NON-ACCELERATOR PHYSICS REACH
A large liquid argon TPC, when sited underground, has significant capabilities for addressing diverse physics top-ics, including proton decay, and atmospheric and supernova neutrinos. These capabilities are described in detail inreference [25]. For non-beam physics, no external trigger will be available, and therefore the key issue is selection ofsignal from background, assuming suitable triggering can be implemented. Photon collection will likely be required.Since backgrounds are dominated by cosmic rays, physics reach for a given detector size depends primarily on depth.Table IX summarizes expected signal rates. Proton decay and atmospheric neutrino events are, like beam events,∼GeV scale, and should in principle be quite cleanly identifiable in a LArTPC: see Figs. 26 and 27. Proton decayevents, although distinctive, would be extremely rare, and hence highly intolerant of background; in contrast, atmo-spheric neutrinos (which are background for proton decay) have a higher rate and could tolerate some background.The signatures of individual supernova burst neutrino interaction events are much less clean. With only a few tens ofMeV of energy, these neutrinos will create small tracks involving only a few adjacent wires: see Fig. 28. For diffuse“relic” supernova events which arrive singly, the very low expected signal rate makes their selection overwhelminglydifficult, and we will not consider them further here. A nearby core collapse is more promising: it will provide a pulseof low energy events all arriving within ∼30 seconds, so that we can hope to make a meaningful measurement of signalover a (well-known) background.
TABLE IX.
Physics Energy range Expected signal rate(events kton−1s−1)
Proton decay ∼ GeV < 2× 10⁻⁹
Atmospheric neutrinos 0.1− 10 GeV ∼ 10−5
Supernova burst neutrinos few-50 MeV ∼ 3 in 30 s at 10 kpcDiffuse supernova neutrinos 20-50 MeV < 2× 10⁻⁹
FIG. 26. Example νe and νµ CC atmospheric neutrino events in liquid argon from reference [35].
We will consider the physics reach as a function of detector mass and depth for proton decay, supernova bursts andatmospheric neutrinos. (Solar neutrinos will not be considered; with mostly <10 MeV energies, they require stringentcontrol of background. Other than providing a νe calibration in argon for supernova neutrinos, they are not likely totell us anything not already known in the detectors under consideration.)
A. Searches for baryon number non-conservation
Searches for baryon-number-violating processes are highly motivated by grand unified theories. Even a single eventcould be evidence of physics beyond the Standard Model. Current limits are dominated by Super-K [34]; however for

29
FIG. 27. LArSoft simulation of p → K+ν decay with K+ → µ+ → e+ in the MicroBooNE geometry. The drift time is alongthe vertical axis. The wire number is along the horizontal axis (3-mm wire spacing).
FIG. 28. LArSoft simulation of a 10 MeV electron (which would resemble a supernova neutrino event) in the MicroBooNEgeometry (3-mm wire spacing). There are four reconstructed hits (black bands) on five adjacent wires. This event would createsignals on about four wires with 5-mm spacing. The drift time is on the vertical axis, and the wire number is on the horizontalaxis.
some predicted modes, most prominently p → K+ν, efficiency for water Cherenkov detectors is low, and detectorswhich can cleanly reconstruct kaon decay products have a substantial efficiency advantage. Other modes for whichLArTPCs have an edge include n → e−K+ and p → e+γ. Figure 29 shows the expected limit as a function of timefor p → K+ν. According to this plot, approximately 10 kton of LAr is required to improve the limits significantlybeyond continued Super-K running.
In LAr, the most pernicious background for proton decay with kaon final states comes from cosmic rays thatproduce entering kaons in photonuclear interactions in the rock near the detector. Backgrounds as a function of depthhave been studied for LAr in references [35, 36]. These studies show that proton decay searches can be successfulat moderate depth via reduction of fiducial mass or in conjunction with a high-quality veto, but cannot be done atthe surface. Among the sites under consideration, Homestake would be excellent. Soudan would likely be acceptable,although it would require some reduction in fiducial mass. Proton decay searches are not feasible for any of the surfaceoptions.
B. Atmospheric Neutrinos
Atmospheric neutrinos are unique among sources used to study oscillations: the oscillated flux contains neutrinosand antineutrinos of all flavors, and matter effects play a significant role. The expected interaction rate is about 285events per kton-year. The excellent CC/NC separation and the ability to fully reconstruct the hadronic final statein CC interactions in an LArTPC would enable the atmospheric neutrino 4-momentum to be fully reconstructed.This would enable a higher-resolution measurement of L/E to be extracted from atmospheric-neutrino events in anLArTPC compared to the measurements obtained from Super-K, and would provide good sensitivity to mass hierarchyand to the octant of θ23. Since the oscillation phenomenology plays out over several decades in energy and path length,

30
FIG. 29. Proton decay lifetime limit for p → K+ν as a function of time for Super-Kamiokande compared to different LArmasses at the 4850 level starting in 2020. The dashed lines show the effect of a 30% reduction of fiducial mass, conservativelyassumed for a Soudan-depth detector. The limits are at 90% C.L., calculated for a Poisson process including backgroundassuming that the detected events equal the expected background. (Figure from J. Raaf.)
atmospheric neutrinos are very sensitive to alternative explanations or subdominant new physics effects that predictsomething other than the characteristic L/E dependence predicted by oscillations in the presence of matter.
Because atmospheric neutrinos are somewhat more tolerant of background than proton decay, a depth which issufficient for a proton decay search should also be suitable for atmospheric neutrinos. For 4850 ft depth, a veto shouldnot be necessary, and one can assume full fiducial mass; at Soudan depth, a 1 meter fiducial cut should be adequate.Figure 30 shows expected sensitivity to mass hierarchy: for ten years of running, a Soudan-depth 20 kton detectorcould rival beam sensitivity, and even a 10 kton detector would add to world knowledge.
FIG. 30. Sensitivity to mass hierarchy using atmospheric neutrinos as a function of fiducial exposure in a LAr detector. (Figurefrom H. Gallagher, J. Coelho, A. Blake.)

31
C. Core Collapse Supernova Neutrinos
A nearby core-collapse supernova will provide a wealth of information via its neutrino signal (see [37, 38] for reviews).The neutrinos are emitted in a burst of a few tens of seconds duration. Energies are in the few tens of MeV range, andluminosity is divided roughly equally between flavors. Ability to measure and tag the different flavor components ofthe spectrum is essential for extraction of physics and astrophysics from the signal. Currently, world-wide sensitivityis primarily to electron anti-neutrinos, via inverse beta decay on free protons, which dominates the interaction rate inwater and liquid scintillator detectors. Liquid argon has a unique sensitivity to the electron neutrino component ofthe flux, via the absorption interaction on 40Ar, νe + 40Ar→ e− + 40K∗. In principle, this interaction can be taggedvia the de-excitation gamma cascade. About 3000 events would be expected in 34 kton of liquid argon for a supernovaat 10 kpc; the number of signal events scales with mass and the inverse square of distance as shown in Fig. 31. For acollapse in the Andromeda galaxy, a 34-kton detector would expect about one event. This sensitivity would be lostfor a smaller detector. However even a 5 kton detector would gather a unique νe signal from within the Milky Way.
Distance to supernova (kpc)1 10 210 310
Nu
mb
er o
f in
tera
ctio
ns
-210
-110
1
10
210
310
410
510
AndromedaGalaxy Edge LMC
34 kton20 kton15 kton10 kton5 kton
FIG. 31. Number of supernova neutrino interactions in a LAr detector as a function of distance to the supernova, for differentdetector masses. Core collapses are expected to occur a few times per century, at a most-likely distance of about 10-15 kpc.
As noted above, due to their low energy, supernova events are subject to background, although the short-timescaleburst nature of the signal means that the background can be well known and subtracted. Muons and their associatedMichel electrons can in principle be removed. Radioactive decays, including cosmogenic spallation products, tend tomake <10 MeV signals. They lie below the main supernova signal range, but inhabit a potential region of interest forphysics signatures. Preliminary studies from reference [39], extended for cosmic ray rates on the surface, suggest thatwhile Soudan depth is likely acceptable, the surface cosmic-ray associated signal rates are daunting. It will require atleast a few orders of magnitude of background rejection to pull the signal from background. While more work needsto be done to determine the extent to which the background can be mitigated, a surface option is highly unfavorablefor supernova neutrino physics.
D. Summary
Although more work needs to be done to understand backgrounds at shallow depth, the following findings are fairlyrobust:
• Proton decay capabilities as a function of depth are the best documented, and a search at the surface seemsimpossible. A modest fiducial mass reduction would be required at Soudan. A detector mass of at least 10 ktonwould be needed for competitiveness.
• For atmospheric neutrinos, less is known about signal selection on the surface; however it is probably extremelydifficult. Soudan depth is acceptable. Underground, a 20 kton detector would be needed for competitiveness,although a smaller detector could still provide useful information.

32
• For supernova burst neutrinos, selection of signal events over background at the surface will be a daunting task,and information will be highly degraded even in the best case. Soudan depth would be acceptable. More massis better, but even a 5-kton detector would provide a unique νe-flavor supernova signal.
The overall conclusions are: a reasonably-sized detector sited at 4850 ft depth would provide excellent opportunitiesfor a diverse range of physics topics. Soudan depth requires only modest compromise in physics reach. At the surface,capabilities for non-beam physics are extremely poor.

33
V. SUMMARY
The results presented here show that the CP-violating phase δ and the neutrino hierarchy can be determined with anumber of the options being considered. The accessible range of δ and the confidence in the hierarchy determinationincreases with detector mass. For shorter baselines, results from the T2K experiment in Japan are required to establishthe hierarchy.
The options with a longer baseline and wide-band beam can observe multiple oscillation peaks and the valleysbetween them. This provides broader sensitivity to neutrino oscillation physics beyond that described by the 3 × 3PMNS matrix.
The search for proton decay and the study of atmospheric neutrinos and neutrinos from nearby supernova explosionscan be successfully carried out by a liquid argon detector underground, but not one on the surface.

34
[1] R.N. Mohapatra et. al. “‘The Theory of Neutrinos: A White Paper”.Rept.Prog.Phys. 70 (2007) 1757. arXiv:hep-ph/0510213v2.
[2] F.P. An et. al. [Daya Bay Collaboration] “Observation of electron-antineutrino disappearance at Daya Bay”. Phys.Rev.Lett.108 (2012) 171803. arXiv:hep-ex/1203.1669.
[3] J.K. Ahn et. al. [RENO Collaboration] “Observation of Reactor Electron Antineutrino Disappearance in the RENOExperiment.” arXiv:1204.0626 [hep-ex], 2012.
[4] G.L. Fogli et. al. “Evidence of θ13 > 0 from global neutrino data analysis”. Phys.Rev. D84 (2011) 053007. arXiv:1106.6028[hep-ph]
[5] K. Nakamura et al. (Particle Data Group), “The Review of Particle Physics”. J. Phys. G 37, 075021 (2010).[6] M. Freund, M. Lindner, S.T. Petcov and A. Romanino, “Testing matter effects in very long baseline neutrino oscillation
experiments”.Nucl. Phys. B 578 (2000) 27.[7] J.A. Formaggio and G.P. Zeller, “From eV to EeV: Neutrino Cross Sections Across Energy Scales”, to be published in
Rev. Mod. Phys. (2012)[8] D. Casper, Nucl. Phys. Proc. Suppl. 112, 161 (2002), hep-ph/0208030.[9] E. Hawker, proceedings of the 2nd International Workshop on Neutrino-Nucleus Interactions in the Few-GeV Region,
Irvine, CA, 2002, unpublished, http://www.ps.uci.edu/ nuint/proceedings/hawker.pdf
[10] ”LBNE Liquid Argon TPC Detector Case Study” LBNE-doc-3600[11] The LArSoft Collaboration, https://plone4.fnal.gov:4430/P1/Main/wiki/LArSoft/LArSoft[12] A. Ankowski et al. [ICARUS Collaboration], Acta Physica Polonica B 41, 103 (2010).[13] S. Amoruso et al. [ICARUS Collaboration], Eur. Phys. J. C33, 233 (2004).[14] A. Ankowski et al. [ICARUS Collaboration], Eur. Phys. J. C48, 667 (2006).[15] ”A Large Liquid Argon Time Projection Chamber for Long-baseline Off-Axis Neutrino Oscillation Physics with the NuMI
Beam”, Submitted to the NuSAG committee, 2006, FERMILAB-FN-0776-E.[16] ”A Proposal for a Detector 2 km Away from the T2K Neutrino Source”, http://www.phy.duke.edu/~cwalter/
nusag-members/.[17] P. Huber, M. Lindner, W. Winter, “Simulation of long-baseline neutrino oscillation experiments with GLoBES”. Comput.
Phys. Commun. 167 (2005) 195. arXiv:hep-ph/0407333v1.[18] P. Huber, M. Lindner, T. Schwetz, and W. Winter, ”First hint for CP violation in neutrino oscillations from upcoming
superbeam and reactor experiments”, arXiv:0907.1896.[19] I. Ambats et. al., NOvA Collaboration, ”NOvA proposal to build a 30-kiloton off-axis detector to study neutrino oscillations
in the Fermilab NuMI beamline”,hep-ex/0503053.[20] M. Fechner, “Determination des performances attendues sur la recherche de l’oscillation νµ → νe dans l’experience T2K
depuis l’etude des donnees recueilles dans l’experience K2K”, Ph.D thesis, Universite Paris VI, 2006.[21] Kato, Proceedings of Neutrino 2008, 2008.[22] J. E. Campagne, M. Maltoni, M. Mezzetto, M. and T. Schwetz, ”Physics potential of the CERN-MEMPHYS neutrino
oscillation project”, JHEP 04 003 (2007), hep-ph/0603172.[23] V.A. Kudryatsev et. al., “Muon-induced background for beam neutrinos at the surface”. Available at http://www.fnal.
gov/directorate/lbne_reconfiguration/index.shtml.[24] M. Bishai et. al., “The Science and Strategy for a Long-Baseline Neutrino Experiment Near Detector”. Available at
http://www.fnal.gov/directorate/lbne_reconfiguration/index.shtml.[25] T. Akiri et al. [LBNE Collaboration] “The 2010 Interim Report of the Long-Baseline Neutrino Experiment Collaboration
Physics Working Groups” arXiv:1110.6249[26] P. Adamson et al. [MINOS Collaboration] “Search for the disappearance of muon antineutrinos in the NuMI neutrino
beam.” FERMILAB-PUB-11-357-PPD, BNL-96122-2011-JA, Phys.Rev.D84:071103,2011. arXiv:1108.1509[27] arXiv:1010.3706 and private communication with Joachim Kopp.[28] S. Davidson, C. Pena-Garay, N. Rius, and A. Santamaria, hep-ph/0302093.[29] M.C. Gonzalez-Garcia, and M. Maltoni, Phys. Rept. 460, 1 (2008), arXiv:0704.1800 [hep-ph].[30][31] H. Davoudiasl, H.S. Lee and W. J. Marciano, Phys. Rev. D 84 031009 (2011) arXiv:1102.5352[hep.ph][32] P. Adamson et al. [MINOS Collaboration] Phys.Rev.D81:052004,2010[33] V. Barger, P. Huber, D. Marfatia, W. Winter, Phys. Rev. D76 053005 (2007)[34] H. Nishino et al. [Super-Kamiokande Collaboration], Phys. Rev. Lett. 102, 141801 (2009) [arXiv:0903.0676 [hep-ex]].[35] A. Bueno et al., JHEP 0704, 041 (2007) [arXiv:hep-ph/0701101].[36] A. Bernstein, M. Bishai, E. Blucher, D. B. Cline, M. V. Diwan, B. Fleming, M. Goodman and Z. J. Hladysz et al.,
arXiv:0907.4183 [hep-ex].[37] K. Scholberg, arXiv:astro-ph/0701081.[38] A. Dighe, arXiv:0809.2977 [hep-ph].[39] D. Barker, D. M. Mei and C. Zhang, arXiv:1202.5000 [physics.ins-det].