PHYSICS INVESTIGATIONS - Shoppe Pro Web Hostingultimate2.shoppepro.com/~ibidcoma/samples/Physics...
17
sample copy only PHYSICS INVESTIGATIONS (for use with the IB Diploma programme) (THIRD EDITION) Volume 2 (relevant to the HL topics) TEACHING NOTES TEACHING NOTES Author: Gregg Kerr Series Editor: David Greig © S.T.A.R. 2008 This page may only be legally copied under the conditions of sale to the purchasing school. Physics HL Investigations – TEACHING NOTES 53 I B P h y s i c s I n v e s t i g a t i o n s – V o l u m e 2 – H L
Transcript of PHYSICS INVESTIGATIONS - Shoppe Pro Web Hostingultimate2.shoppepro.com/~ibidcoma/samples/Physics...

sample
copy
only
PHYSICS INVESTIGATIONS(for use with the IB Diploma programme)
(THIrd EdITION)
Volume 2 (relevant to the HL topics)
TEACHING NOTES
TEACHING NOTES
Author: Gregg KerrSeries Editor: David Greig
© S.T.A.R. 2008 This page may only be legally copied under the conditions of sale to the purchasing school.
Physics HL Investigations – TEACHING NOTES 53I
B
Ph
ys
ic
s
In
ve
st
ig
at
io
ns
–
V
ol
um
e
2
–
HL

sample
copy
only
© S.T.A.R. 2008 This page may only be legally copied under the conditions of sale to the purchasing school.
Physics HL Investigations – TEACHING NOTES 54I
B
Ph
ys
ic
s
In
ve
st
ig
at
io
ns
–
V
ol
um
e
2
–
HL
INTrOduCTION
These 25 investigations cover syllabus topics in the Additional Higher level material in the following topics:
• Motion in fields
• Thermal Physics
• Wave phenomena
• Electromagnetic induction
• Oscillations and waves
• Quantum Physics and Nuclear Physics
• Digital technology
They reflect the modern trend of replacing continual formal reports with a balance between data-based investigations, planning exercises, and formal reporting. The investigations are in a format to try and ensure that students do not feel the need to provide full write-ups for every investigation, and thus cut down on student work overload. They form part of the candidate’s portfolio of investigations.
A number of alternatives are offered for many of the Investigations. The aim of this manual is to put together a series of Investigations that could be carried out in laboratories that are well-equipped, and those possessing a lack of equipment. However, the use of computer simulations and multiprocessor software is encouraged.
The following page is provided to assist with your planning and assessment. Teachers should refer to current IBO Internal Assessment documents for details of requirements and procedures.
It is hoped that some of the investigations will be considered innovative. They are ideas that have been generated by many Physics colleagues throughout the world to be shared with everyone.
There is no assumption that these investigations are superior to the investigations that teachers have been using in there own classrooms successfully for years. Teachers are encouraged to supplement this manual with their own ideas, and these components will make up an excellent portfolio.
Most importantly, it is hoped that the investigations are ‘student-friendly’.
Gregg Kerr Shanghai American School, China 2008
dISClAImEr
Please note that although every care has been taken in preparing and trialling these activities, absolutely no responsibility whatsoever can be accepted for any damage or accident which may occur for whatever reason during the conduct of any of these Investigations. Editor

sample
copy
only
© S.T.A.R. 2008 This page may only be legally copied under the conditions of sale to the purchasing school.
Physics HL Investigations – TEACHING NOTES 55I
B
Ph
ys
ic
s
In
ve
st
ig
at
io
ns
–
V
ol
um
e
2
–
HL
Physics HL Investigations - Outline PlanNo. Investigations Rele vant
TopicHours D DCP CE
1. Range of a projectile 9.1 1
2. Investigation circus 9.1 1.5
3. Determination of the Universal Gravitation constant 6.1 1.5
4. Speed distribution of gases 3.2 0.5
5. Boyle’s Law investigation (data-based) 10.2 1
6. Charles’ Law and the Pressure Law (data-based) 10.1 1.5
7. Universal Gas constant R determination 10.1 1 • •
8. Pressure and properties of a fluid Various 2
9. Speed of sound using resonance 11.1, A.2 1
10. Standing waves on a string 11.1, A.4 1
11. White light diffraction and interference 11.3, A.4 1
12. Behaviour of microwaves 11.1, A.2 2
13. Polarisation of light 11.5, A.6 1
14. Electric field patterns 9.3 1
15. Electrons on sticky tape 9.3
16. Lenz’s Law 12.1 2 •
17. Charging and discharging a capacitor 14.2 1.5 • •
18 Efficiency of a DC motor Various 2 • • •
19 The photo-electric effect 13.1 1
20 Thomson’s experiment 6.3 1
21 Analysis of emission spectrum 13.1, B1 1
22 Millikan analog investigation 7.7 1
23 Half-life, range and energy of alpha particles 13.2, B2 1 •
24 Statistical nature of radioactive decay 7.2 1
25 Design based investigations Various • • •

sample
copy
only
© S.T.A.R. 2008 This page may only be legally copied under the conditions of sale to the purchasing school.
Physics HL Investigations – TEACHING NOTES 56I
B
Ph
ys
ic
s
In
ve
st
ig
at
io
ns
–
V
ol
um
e
2
–
HL
INvESTIGATION 1 – rANGE Of A PrOjECTIlE
By measuring the height of the bench, the time for the sphere to fall from the bottom of the incline to the floor can be determined from:
v2y = u2
y +2gs and vy = uy + gt
Realising that uy = 0 m.s-1, and that it takes the same time whether the sphere is projected off the incline, or simply dropped vertically downwards.
Another alternative is to use the conservation of energy. The Ep of the sphere at the top of the incline is converted to Ek at the bottom of the incline. The velocity of the launch can be determined. By measuring the range of the projectile, and knowing that the horizontal velocity is constant, t = range / vx
INvESTIGATION 2 – INvESTIGATION CIrCuS
Problem 1 is best done outdoors as squirting water in the laboratory has many potential problems. A garden hose is a good constant water source.
Assuming the water pressure and the rate of flow of such is constant, students can test the validity of:
Range = v2 sin2θ / g
The range is maximum when 2θ = 90°. Therefore maximum range occurs when the water is projected at 45°.
Problem 2 has some potential safety considerations. Safety goggles should be worn at all times.
The problem can be solved by assuming that the work done in moving the clay ball and the clay block through a distance as measured by the straw is equal to the initial velocity of the clay ball projected from the sling shot.
INvESTIGATION 3 – dETErmINATION Of ‘G’
This data based question provides a set of data for determination of the Universal gravitational constant.
Firstly, the period of oscillation of the torsion balance is determined. The graph obtained is a sinusoidal wave of several complete periods (a rough shaped one). From the obtained period of oscillation, the torsion constant of the wire µ can be calculated.
Secondly, when the M / d2 versus ∆ graph for the three large masses is drawn, the points should lie on a straight line with a slope of 2π2b / DT2G. Thus, G can be determined.

sample
copy
only
© S.T.A.R. 2008 This page may only be legally copied under the conditions of sale to the purchasing school.
Physics HL Investigations – TEACHING NOTES 57I
B
Ph
ys
ic
s
In
ve
st
ig
at
io
ns
–
V
ol
um
e
2
–
HL
INvESTIGATION 4 – ArTmANN INvESTIGATION – ArTmANN INvESTIGATIONArTmANN INvESTIGATION
I first saw this investigation on a video put out by ILPAC (available from John Murray publishers in the UK). This simulation has been adapted from this video. In a true sense, there are some oversimplifications of the true Zartmann experiment, and it is hoped that students might identify these in their conclusion. For example, bismuth density on the glass plate may not be related to the dots here because the sample of bismuth dots is very small. Furthermore, the width of each segment is very large.
Students should have little difficulty in analysing their data. The first graph is the lower temperature case. Zartmann concluded that the bismuth particles had a range of speeds with most concentrated around the average value with some much slower and some much faster than this average. He confirmed that the range of speeds was due to continual collisions between particles as assumed in the kinetic theory of gases.
INvESTIGATION 5 – OlE’S lA INvESTIGATION – OlE’S lA INvESTIGATIONOlE’S lA INvESTIGATION
There are three experimental set-ups given for this investigation depending on the equipment available. If using the mercury method, students should be made aware of the poisonous nature of mercury. Sulphur or a mercury clean-up kit should be at hand. If using the modern Boyle’s law apparatus, the glass capillary tube should not be given too much pressure.
INvESTIGATION 6 – CHArlES’ lA ANd THE PrESSurE lA – CHArlES’ lA ANd THE PrESSurE lACHArlES’ lA ANd THE PrESSurE lA
One apparatus is shown for Charles’ Law and two are shown for the Pressure Law. Again, if mercury is going to be used then students must be made aware of the poisonous nature of the substance.
INvESTIGATION 7 – uNIvErSAl GAS CONSTANT dETErmINATION
The correct equation for determining R is:
1/V (nRT) = m (g / A) + Po
If a graph of 1/V is plotted against m, the gradient is equal to g / RAnT.
Therefore, R = g /(gradient) AnT
The number of moles of air in the syringe can be found under the laboratory conditions can be determined by using the combined gas Law, and the fact that one mole occupies 22.4 dm3 at STP.

sample
copy
only
© S.T.A.R. 2008 This page may only be legally copied under the conditions of sale to the purchasing school.
Physics HL Investigations – TEACHING NOTES 58I
B
Ph
ys
ic
s
In
ve
st
ig
at
io
ns
–
V
ol
um
e
2
–
HL
INvESTIGATION 8 – PrESSurE ANd THE PrOPErTIES Of A lIQuId
In part 1, students should observe that pressure increases with depth and that pressure is transmitted throughout the liquid. Some may explain using P = ρgh. Water can be siphoned from a higher to a lower point. Students should realise that pressure diff erence between the hose end that is in the water and the end that is sucked.
In part 2, a 2m length of U-tube will help with the connections. No water should squirt out the end of the manometer if the students use a small volume of water to support the gas. Th e gas pressure will equal the atmospheric pressure on the day minus ρgh.
In part 3, the planning component is important. Use large graduated measuring cylinders. Two good liquids are water and glycerol (glycerine). It is unlikely that the students will observe laminar fl ow but it would be a good extended essay. However, some design to observe terminal speed of a ball bearing dropped in the liquids would be expected.
For the last section, a design that allows for the steady fl ow of water (a constant head device) would be a must. Don’t expect good results for the coeffi cient of viscosity as the radius measurement of the capillary tube is diffi cult. Th e radius has a power of four (r4) in the equation.
Th e apparatus could look like
INvESTIGATION 9 – SPEEd Of SOuNd uSING rESONANCE
Th ree diff erent methods for undertaking this investigation are given. Th e students determine the speed of sound by plotting a graph of the length of the air column L against f-1. Th e relationship is explained in the background section of this investigation. Th e speed of sound at a particular temperature is given by
v = fλ
∴ L + e = v / 4f or L = v / 4f – e
If the fundamental frequency, f, is determined using diff erent tuning forks or signals from the signal generator for diff erent lengths of the air column, a graph of L against f produces a linear graph with a slope of v/4 and a y-intercept of –e.
water in
constant head device Capillary tubehwater
water out

sample
copy
only
© S.T.A.R. 2008 This page may only be legally copied under the conditions of sale to the purchasing school.
Physics HL Investigations – TEACHING NOTES 59I
B
Ph
ys
ic
s
In
ve
st
ig
at
io
ns
–
V
ol
um
e
2
–
HL
If using the procedure using the tuning fork, a long PVC tube should be inserted into the large measuring cylinder, and the resonance of the air in the tube should be obtained by moving the tube up and down in the water. The signal generator works best on a low frequency between 50 –100 Hz.
Students should be warned of the potential hazards of using water near an electrical power supply.
INvESTIGATION 10 – STANdING AvES ON A STrING
The equation v = μT is no longer a syllabus requirement.
However, the students can still carry out an investigation to determine how the frequency of the standing wave in a string depends on the tension of the string. Since the wavelength of the standing wave is kept fixed this is the same as determining the dependence of speed on tension.
Students are provided with a diagram of the appropriate apparatus and are asked to find the relationship between the speed of the wave in the string and the tension of the string.
They are not told to plot a graph of T against v2, and the slope of the straight line obtained is the mass per unit length of the string.
Once they have obtained the mass per unit length graphically, they compare this value to the value obtained by weighing a known length of string.
INvESTIGATION 11 – HITE lIGHT INTErfErENCE ANd dIffrACTION
This is a qualitative investigation where the eye is used as a screen to view white light through slits and diffraction gratings.
The equipment list is given here for fast recognition of the method being used:
Glass slides, black art paint, razor blades, cardboard, rubber bands, needle, glue, thin gauge copper wire, single-slit slide, double-slit slide, diffraction gratings up to approx. 106 lines per metre, ray box producing a single beam of light, green filter, metre rule, transparent ruler, magnifying glass or binocular microscope, power supply and connecting wires, glue.
The students firstly make their own single and double slits by the method given. The prepared slits are then put aside for the moment. If this is felt to be too time-consuming, then prepared single and doubles slits should be issued instead. They then observe the patterns of the light intensity for different diffraction gratings. Some explanation of what is meant by light intensity diagrams may be necessary. For a diffraction grating:
nλ = d sinθ = d x / L
x = nλ L / d

sample
copy
only
© S.T.A.R. 2008 This page may only be legally copied under the conditions of sale to the purchasing school.
Physics HL Investigations – TEACHING NOTES 60I
B
Ph
ys
ic
s
In
ve
st
ig
at
io
ns
–
V
ol
um
e
2
–
HL
As the distance to the screen increases the value of x increases. As d becomes bigger x becomes smaller, and the resolution becomes poorer. Different light intensity does not affect the value of x but it does affect resolution. Light intensity is proportional to L-2. Using a green filter in place of a red filter should decrease x.
The students repeat the procedure using a double-slit in place of the diffraction grating, and record their observations. It may be difficult to observe all the properties with a single slit, but students should notice a definite shift in constructive and destructive interference.
INvESTIGATION 12 – THE EHAvIOur Of mICrOAvES – THE EHAvIOur Of mICrOAvESTHE EHAvIOur Of mICrOAvES
General
A microwave kit with all the appropriate accessories can be obtained from most major educational suppliers.
Since it is likely that schools will have only one kit then clearly this series of experiments cannot be set as a class experiment. It would be better done as part of a circus of experiments involving waves.
Experiment A – reflection
The fact that the apparatus (apart from a ruler and protractor) will have been given to the student means essentially that the Planning (b) aspects will apply to designing a suitable method for measuring a range of incident and reflected angles. The aluminum plate that acts as the reflector should be mounted vertically on a plain sheet of paper. A plan view is shown below.
The normal to the reflector can be found by making sure that the transmitter and receiver are on the same line and then by locating the mid-point between them.
Students should comment on the fact that the transmitter and receiver are not flush with the paper and suggest whether or not this needs to be taken into account.
Students should construct their own data table and to gain the maximum marks for the data collection criterion they should make sure that they include the uncertainty (ies) in their data.
Their data analysis should show that the angle of reflection is equal to the angle of incidence within the limits of their suggested experimental error (or not, as the case may be). This should be mentioned in their evaluation report.
Reector
ReceiverTransmitter
sample
copy
only
© S.T.A.R. 2008 This page may only be legally copied under the conditions of sale to the purchasing school.
Physics HL Investigations – TEACHING NOTES 61I
B
Ph
ys
ic
s
In
ve
st
ig
at
io
ns
–
V
ol
um
e
2
–
HL
Experiment B – refraction
The experiment is carried out in very much the same way that an experiment using a glass block and light would be. The main problem is in locating the point on the block at which the microwaves are incident and the point at which they leave the block. To achieve this, the students should recognise that this can be done by using the diode receiver as a “pin” as one would with light from a raybox.
Another approach to this experiment would be to ask them to devise a method for measuring the refractive index of paraffin wax using microwaves. This is quite nice since it underlines the fact that refractive index depends on wavelength.
Students should construct their own data table with appropriate uncertainties.
Their data analysis should show that constantri=
sinsin within the limits of their suggested experimental error
(or not, as the case may be).
This should be mentioned in their evaluation report.
Experiment C – Interference
In their evaluation students should recognise that one way to improve the experiment would be to find another set of values of d and D for a different value of s. They could also keep D constant and vary s.
Experiment d – Standing waves
In the planning, students should recognise that they should make use of the standing wave formula λ = nL2
. The experiment that they devise should be a variation of the experiment in which standing waves of different wavelengths are set up in a stretched string. In the microwave case, λ is constant. The standing wave is set up by reflection. The students should position the diode midway between the reflector and the transmitter. They should then move the reflector either away or towards the transmitter until no current is recorded by the micro-ammeter. The separation between the diode and transmitter is now such that an integral number of half-wavelengths are “fitted in”. They should then move the diode until the next nodal point is located. The wavelength can then be determined. The experiment can be repeated with different separations that produce a standing wave patterns and the result can be checked by finding other positions of zero current or positions of maximum current.
NB. In all these experiment with microwaves none of the readings are particularly accurate so it is very important that the students check all readings. If they have not been checked, then this should be discussed in the evaluation as an improvement that can be made to the procedure.

sample
copy
only
© S.T.A.R. 2008 This page may only be legally copied under the conditions of sale to the purchasing school.
Physics HL Investigations – TEACHING NOTES 62I
B
Ph
ys
ic
s
In
ve
st
ig
at
io
ns
–
V
ol
um
e
2
–
HL
INvESTIGATION 13 – POlArISATION Of lIGHT – POlArISATION Of lIGHTPOlArISATION Of lIGHT
In this investigation, students will observe and record some of the properties of polarised light. They use 2 sheets of polaroid, the polariser and the analyser. The intensity of light incident on an ideal polariser is halved after preferential absorption. The analyser can then be rotated from 00 to 900 to reduce the emerging light intensity to zero. When the electric field for light incident on a polaroid is at an angle θ to the plane of vibration, then the electric field vector of the light is E0cosθ, and the light intensity emerging from the polaroid is given by the Malus equation:
I = I0cos2θ
where I is the emerging light intensity and I0 is the half intensity after polarisation.
The equipment must be prepared in advance and is included for your information:
3 squares of polaroid 5 cm in diameter, 5 microscope slides, glass box, ray box to give a single beam of light, polarimeter if available, protractor, perspex ruler, liquid crystal display (calculator or digital watch), masses, string, colour filter for the ray bos, sucrose solution.
In part A, the students produce and detect polarised light, and comment on the intensity of light. In part B, they examine the reflection of polarised light. In part C, they examine a liquid crystal display, a sucrose solution, and stress and strain in plastics.
INvESTIGATION 14 – ElECTrIC fIEld PATTErNS – ElECTrIC fIEld PATTErNSElECTrIC fIEld PATTErNS
To make the electric field apparatus you will need a flat piece of wood measuring about 20 cm x 10 cm x 0.5 cm. On this, two terminal pins are mounted as shown in the diagram in the experiment.
The dish is a typical flat-bottomed glass dish found in all chemistry laboratories. If possible it should not be more that 1 cm in height
The bare copper wire used in the experiment is about 2 mm in diameter.
The parallel conductors are made by soldering two pieces of copper wire together.
The EHT should give a range of 0 –5000 V
If the students wish to observe the field pattern of two like point charges then two supplies will be needed.
INvESTIGATION 15 – ElECTrONS ON STICk TAPE
Find the mass of the tape. The component of the coulombic force of repulsion will be mg sinθ as measured from the centre of mass of the tape. So mg sinθ = kq2 / r2. The charge is shared by each piece of tape. So the charge on each piece of tape can be calculated.

sample
copy
only
© S.T.A.R. 2008 This page may only be legally copied under the conditions of sale to the purchasing school.
Physics HL Investigations – TEACHING NOTES 63I
B
Ph
ys
ic
s
In
ve
st
ig
at
io
ns
–
V
ol
um
e
2
–
HL
INvESTIGATION 16 – lEN’S lA – lEN’S lAlEN’S lAThe difficulty for the students in this planning exercise is choosing the appropriate apparatus. If they get this right then perforce, they have designed a method for the control of variables and for collecting raw data.
The coil X should be a square solenoid and coil Y should consist of a several copper turns wrapped around the solenoid. A 6 V battery will suffice as the power supply. They will need a rheostat and switch. Since the induced current is small, they will also need an “edspot” to detect the current in coil Y. If they do not mention an edspot in their design then they should at least mention that a sensitive ammeter with a centre zero scale is required.
The control and collection of data involves the switching the current on in X, switching the current off in X, increasing and decreasing the current in X. For each of these procedures the direction of the current in Y must be recorded.
INvESTIGATION 17 – CHArGING ANd dISCHArGING A CAPACITOr – CHArGING ANd dISCHArGING A CAPACITOrCHArGING ANd dISCHArGING A CAPACITOr
IEC have a very good electronics and photonics kit (catalogue #1765-011) that can be purchased from www.haines.com.au. A complete set of experiments comes with the kit. When the voltage across the capacitor is equal to the smooth 9 volt power supply, the capacitor will stop charging. The graph obtained from the discharging process will show exponential decay. It can be shown by finding the gradients at 50%, 25% and 12.5% for the fall in voltage per second, the values obtained are constant.
INvESTIGATION 18 – ElECTrIC mOTOr – ElECTrIC mOTOrElECTrIC mOTOr
This construction task does not lend itself to assessment. It is essentially an interesting and entertaining task for the students.
Simple DC electric motor kits are available from most educational suppliers.
Essentially the student should realise that the input power can be determined by measuring the input current and the input voltage. The output power can be determined by the steady rate at which the motor raises a load. (Two spring balances could be used to measure the breaking torque but this is more appropriate for larger motors. Also the method precludes SL students who have not studied Option A).
The students should design their own data table and include appropriate errors.
The data analysis will depend on their stated research problem (see below). The efficiency is given by mghVIt
and students should comment on the value of g that they use. A graph of efficiency against input power would be a good way of presenting the results.
The efficiency is very small and there are many sources of error in the experiment which the students should mention in their evaluation.

sample
copy
only
© S.T.A.R. 2008 This page may only be legally copied under the conditions of sale to the purchasing school.
Physics HL Investigations – TEACHING NOTES 64I
B
Ph
ys
ic
s
In
ve
st
ig
at
io
ns
–
V
ol
um
e
2
–
HL
Below is a guide as to how a student might address the aspects of the Planning criteria in order to gain full credit.
design
• An appropriate research problem would be something along the lines “ to investigate how the efficiency is affected by the input power to the motor”, or, “the load” or “the speed of the motor”. The latter is tricky and should be discouraged.
• The prediction can be simple – e.g. “ A motor is more efficient when the input power is a maximum”.
• The relevant variables are the input current, the output current, the output load and the rate at which the load is raised.
• The motor circuit is shown in the adjacent diagram.
The motor should be clamped in a retort stand such that it protrudes over the bench.
• The rheostat is used to control the input power and slotted weights are used for the load. A metre ruler which is marked clearly at two appropriate points is used to control the measured height over which the time of the motion of the slotted weights is measured. The set up is shown below.
• The input voltage is set such that the motor starts to rotate. The power is then switched off and slotted weights are added to the bottom of the thread. The power is switched on. The procedure is repeated until the added weights appear to be moving upwards at a constant speed. The time it takes the weights to travel between the marks is measured.
The procedure is repeated for different values of input power.
6 V
motor
A
V
motor
Bench top
Metre rulerSlotted weights
Cotton thread

sample
copy
only
© S.T.A.R. 2008 This page may only be legally copied under the conditions of sale to the purchasing school.
Physics HL Investigations – TEACHING NOTES 65I
B
Ph
ys
ic
s
In
ve
st
ig
at
io
ns
–
V
ol
um
e
2
–
HL
INvESTIGATION 19 – THE PHOTOElECTrIC EffECT – THE PHOTOElECTrIC EffECTTHE PHOTOElECTrIC EffECT
A red, green and yellow LED that emit when the voltage across them is about 1.5 V are suitable for this experiment. However, the “strike” potential is not critical. If the light frequency is not given by the manufacturer then you can “cheat” by working out the frequency by doing the experiment and using a value for Planck’s constant bearing in mind that the experiment gives a value of h that is about ±20% of the accepted value!
To make an appropriate shield, mount the LED on a cylindrical cork and then wrap matt black paper around the cork, overlapping the end of the cork on which the LED is mounted.
INvESTIGATION 20 – THE THOmSON CHArGE TO mASS rATIO Of ElECTrONS
To purchase a deflection tube and the corresponding Helmholtz coils can be quite expensive for an experiment that is only undertaken once a year.
The ammeter should be in the 0-1 A range. T he rheostat is usually of the 15Ω, 5A type.
There are a number of software packages available that allow for collecting data on the charge to mass ratio of the electron.
May I recommend the software produced by a company in Australia.
Their details are given below:
The Logical Interface, 96 Fowler Road, Illawong. 2234, Australia
Tel: +61 2 95410367
Fax: +61 2 95410535
E-mail: [email protected]
Web: www.logint.com.au
The site licence for the use of Thomson’s experiment is presently AUD $ 99.
sample
copy
only
© S.T.A.R. 2008 This page may only be legally copied under the conditions of sale to the purchasing school.
Physics HL Investigations – TEACHING NOTES 66I
B
Ph
ys
ic
s
In
ve
st
ig
at
io
ns
–
V
ol
um
e
2
–
HL
INvESTIGATION 21 – EmISSION SPECTrA – EmISSION SPECTrAEmISSION SPECTrA
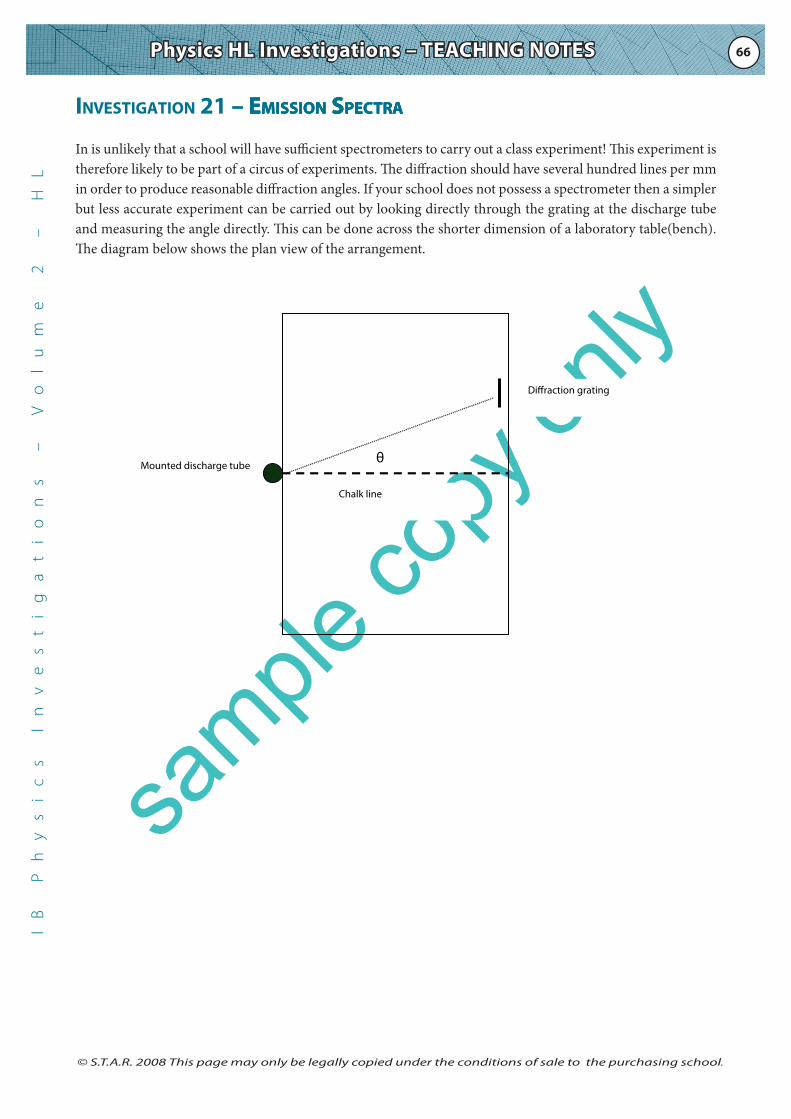
In is unlikely that a school will have sufficient spectrometers to carry out a class experiment! This experiment is therefore likely to be part of a circus of experiments. The diffraction should have several hundred lines per mm in order to produce reasonable diffraction angles. If your school does not possess a spectrometer then a simpler but less accurate experiment can be carried out by looking directly through the grating at the discharge tube and measuring the angle directly. This can be done across the shorter dimension of a laboratory table(bench). The diagram below shows the plan view of the arrangement.
Mounted discharge tube
Diraction grating
Chalk line
θ

sample
copy
only
© S.T.A.R. 2008 This page may only be legally copied under the conditions of sale to the purchasing school.
Physics HL Investigations – TEACHING NOTES 67I
B
Ph
ys
ic
s
In
ve
st
ig
at
io
ns
–
V
ol
um
e
2
–
HL
INvESTIGATION 22 – mIllIkAN ANAlOG INvESTIGATION
There are many software packages available to show the quantisation of charge. However, if you do not have access to such, here is a simple idea.
It is important to prepare the envelopes in advance. Here is a possible selection of masses that give a good range of intervals.
EnvelopeNumber
Mass (g)
EnvelopeNumber
Mass (g)
EnvelopeNumber
Mass (g)
EnvelopeNumber
Mass (g)
1 8.49 31 9.86 61 11.18 91 12.412 8.50 32 9.86 62 11.18 92 12.413 8.51 33 9.87 63 11.18 93 12.434 8.53 34 9.87 64 11.19 94 12.435 8.53 35 9.87 65 11.20 95 12.446 8.55 36 9.87 66 11.20 96 12.447 8.55 37 9.88 67 11.22 97 12.468 8.56 38 9.88 68 11.22 98 12.469 8.56 39 9.88 69 11.22 99 12.47
10 8.57 40 9.88 70 11.23 100 12.4811 8.57 41 9.89 71 11.23 101 12.4912 8.58 42 9.90 72 11.23 102 12.4913 8.58 43 9.91 73 11.23 103 12.4914 8.59 44 9.92 74 11.24 104 12.5015 8.59 45 9.92 75 11.25 105 12.5016 8.60 46 9.92 76 11.26 106 12.5217 8.60 47 9.93 77 12.39 107 12.5218 8.60 48 9.94 78 12.40 108 12.5219 8.61 49 9.94 79 12.40 109 12.5320 8.61 50 9.98 80 12.40 110 12.5721 8.63 51 11.09 81 12.40 111 13.7622 8.63 52 11.10 82 12.40 112 13.8223 8.64 53 11.10 83 12.40 113 13.8224 9.80 54 11.11 84 12.40 114 13.8225 9.80 55 11.11 85 12.40 115 15.0426 9.83 56 11.12 86 12.40 116 15.0927 9.84 57 11.14 87 12.41 117 15.0928 9.85 58 11.16 88 12.41 118 16.3029 9.85 59 11.16 89 12.41 119 16.3730 9.86 60 11.17 90 12.41 120 16.39
Students should approach this task in a cooperative manner. They can help each other to weigh the envelopes. I find it good to have a computer and printer in the classroom. One student can enter the masses into a spreadsheet. The data can then be sorted, and then a histogram can be created. The students then get a printout of the results, and from these they can give an analysis of their findings.

sample
copy
only
© S.T.A.R. 2008 This page may only be legally copied under the conditions of sale to the purchasing school.
Physics HL Investigations – TEACHING NOTES 68I
B
Ph
ys
ic
s
In
ve
st
ig
at
io
ns
–
V
ol
um
e
2
–
HL
INvESTIGATION 23 – HAlf-lIfE, ENErG ANd rANGE Of AN AlPHA PArTIClE
Students can obtain can obtain log T and log R values, and plot a graph to find m and c. They can then find E3/2 values to plot R against E 3/2 in order to find ω.
INvESTIGATION 24 – STATISTICAl NATurE Of rAdIOACTIvE dECA – STATISTICAl NATurE Of rAdIOACTIvE dECASTATISTICAl NATurE Of rAdIOACTIvE dECA
This activity is self-explanatory and no notes are necessary.
INvESTIGATION 25 – dESIGN ASEd INvESTIGATIONS
This is a good investigation by which to assess all the criteria. The investigations listed include:
1. A property of a bouncing ball
2. A property of a cantilever
3. A property of a spring
4. A property of a pendulum
5. A factor that affects the operation of an NTC thermistor
6. The domino effect
7. A beverage made of water and milk
8. The propulsion of a container along the ground.
9. A property of a fluid
10. A factor that affects resistance in a conductor.
11. A property of plasticine
12. Investigate the formation of a crater
13. Investigate a physical aspect of a falling parachute.
14. A factor affecting the voltage of a citrus fruit cell
15. Investigate affecting the strength of an electromagnet
sample
copy
only
© S.T.A.R. 2008 This page may only be legally copied under the conditions of sale to the purchasing school.
Physics HL Investigations – TEACHING NOTES 69I
B
Ph
ys
ic
s
In
ve
st
ig
at
io
ns
–
V
ol
um
e
2
–
HL
The property of a bouncing ball, the property of a fluid and a factor that affects resistance in a conductor have already been mentioned in this and the core manual. Cantilevers, springs and the pendulum are classic investigations. The domino effect and the coffee-milk investigations have been mentioned in the OCC support material of the 2003 syllabus.
The plasticine investigation could be done with different types of plasticine as some conducts electricity, some float and other types bounce.
12, 13 14 and 15 are given as design examples on the Physics Teacher support material on the OCC.
For the propulsion of a container, students should recognise that the following factors affect the distance travelled.
• Mass of the container
• Distance that the elastic is stretched
• Nature of the surface on which the container is propelled.
Essentially students have to devise a method for:
• propagating the container along a surface
• measuring the distance that the elastic is stretched when the container is pulled back (This is not as easy as it sounds since when it is pulled back it will look something like the diagram in the Investigation.)
Students will have to decide which “stretched” distance they are going to measure
• measuring the distance travelled along a surface
• securing slotted masses to the bottom of the container.
In investigating the effect of increasing the distance that the elastic is stretched, students should appreciate that they now need to keep the mass constant. A graph of distance stretched against distance travelled should show a quadratic relation. (½ kx2 = Kd) – but watch out for the measurement and description of x!)