Physics Grade 12
222
FHSST Authors The Free High School Science Texts: Textbooks for High School Students Studying the Sciences Physics Grades 10 - 12 Version 0 November 9, 2008
-
Upload
aruna-kiran -
Category
Documents
-
view
99 -
download
3
description
An excellent physics book for grade 12. Covers all fundamental concepts and questions are exciting and interesting.
Transcript of Physics Grade 12

FHSST Authors
The Free High School Science Texts:Textbooks for High School StudentsStudying the SciencesPhysicsGrades 10 - 12
Version 0November 9, 2008

ii
Copyright 2007 “Free High School Science Texts”Permission is granted to copy, distribute and/or modify this document under theterms of the GNU Free Documentation License, Version 1.2 or any later versionpublished by the Free Software Foundation; with no Invariant Sections, no Front-Cover Texts, and no Back-Cover Texts. A copy of the license is included in thesection entitled “GNU Free Documentation License”.
STOP!!!!
Did you notice the FREEDOMS we’ve granted you?
Our copyright license is different! It grants freedoms
rather than just imposing restrictions like all those other
textbooks you probably own or use.
• We know people copy textbooks illegally but we would LOVE it if you copied
our’s - go ahead copy to your hearts content, legally!
• Publishers’ revenue is generated by controlling the market, we don’t want any
money, go ahead, distribute our books far and wide - we DARE you!
• Ever wanted to change your textbook? Of course you have! Go ahead, change
ours, make your own version, get your friends together, rip it apart and put
it back together the way you like it. That’s what we really want!
• Copy, modify, adapt, enhance, share, critique, adore, and contextualise. Do
it all, do it with your colleagues, your friends, or alone but get involved!
Together we can overcome the challenges our complex and diverse country
presents.
• So what is the catch? The only thing you can’t do is take this book, make
a few changes and then tell others that they can’t do the same with your
changes. It’s share and share-alike and we know you’ll agree that is only fair.
• These books were written by volunteers who want to help support education,
who want the facts to be freely available for teachers to copy, adapt and
re-use. Thousands of hours went into making them and they are a gift to
everyone in the education community.

FHSST Core Team
Mark Horner ; Samuel Halliday ; Sarah Blyth ; Rory Adams ; Spencer Wheaton
FHSST Editors
Jaynie Padayachee ; Joanne Boulle ; Diana Mulcahy ; Annette Nell ; Rene Toerien ; Donovan
Whitfield
FHSST Contributors
Rory Adams ; Prashant Arora ; Richard Baxter ; Dr. Sarah Blyth ; Sebastian Bodenstein ;
Graeme Broster ; Richard Case ; Brett Cocks ; Tim Crombie ; Dr. Anne Dabrowski ; Laura
Daniels ; Sean Dobbs ; Fernando Durrell ; Dr. Dan Dwyer ; Frans van Eeden ; Giovanni
Franzoni ; Ingrid von Glehn ; Tamara von Glehn ; Lindsay Glesener ; Dr. Vanessa Godfrey ; Dr.
Johan Gonzalez ; Hemant Gopal ; Umeshree Govender ; Heather Gray ; Lynn Greeff ; Dr. Tom
Gutierrez ; Brooke Haag ; Kate Hadley ; Dr. Sam Halliday ; Asheena Hanuman ; Neil Hart ;
Nicholas Hatcher ; Dr. Mark Horner ; Robert Hovden ; Mfandaidza Hove ; Jennifer Hsieh ;
Clare Johnson ; Luke Jordan ; Tana Joseph ; Dr. Jennifer Klay ; Lara Kruger ; Sihle Kubheka ;
Andrew Kubik ; Dr. Marco van Leeuwen ; Dr. Anton Machacek ; Dr. Komal Maheshwari ;
Kosma von Maltitz ; Nicole Masureik ; John Mathew ; JoEllen McBride ; Nikolai Meures ;
Riana Meyer ; Jenny Miller ; Abdul Mirza ; Asogan Moodaly ; Jothi Moodley ; Nolene Naidu ;
Tyrone Negus ; Thomas O’Donnell ; Dr. Markus Oldenburg ; Dr. Jaynie Padayachee ;
Nicolette Pekeur ; Sirika Pillay ; Jacques Plaut ; Andrea Prinsloo ; Joseph Raimondo ; Sanya
Rajani ; Prof. Sergey Rakityansky ; Alastair Ramlakan ; Razvan Remsing ; Max Richter ; Sean
Riddle ; Evan Robinson ; Dr. Andrew Rose ; Bianca Ruddy ; Katie Russell ; Duncan Scott ;
Helen Seals ; Ian Sherratt ; Roger Sieloff ; Bradley Smith ; Greg Solomon ; Mike Stringer ;
Shen Tian ; Robert Torregrosa ; Jimmy Tseng ; Helen Waugh ; Dr. Dawn Webber ; Michelle
Wen ; Dr. Alexander Wetzler ; Dr. Spencer Wheaton ; Vivian White ; Dr. Gerald Wigger ;
Harry Wiggins ; Wendy Williams ; Julie Wilson ; Andrew Wood ; Emma Wormauld ; Sahal
Yacoob ; Jean Youssef
Contributors and editors have made a sincere effort to produce an accurate and useful resource.Should you have suggestions, find mistakes or be prepared to donate material for inclusion,please don’t hesitate to contact us. We intend to work with all who are willing to help make
this a continuously evolving resource!
www.fhsst.org
iii

iv
Contents
I Introduction 1
1 What is Physics? 3
II Grade 10 - Physics 5
2 Units 9
2.1 Introduction . . . . . . . . . . . . . . . . . . . . . . . . . . . . . . . . . . . . . 9
2.2 Unit Systems . . . . . . . . . . . . . . . . . . . . . . . . . . . . . . . . . . . . . 9
2.2.1 SI Units . . . . . . . . . . . . . . . . . . . . . . . . . . . . . . . . . . . 9
2.2.2 The Other Systems of Units . . . . . . . . . . . . . . . . . . . . . . . . 10
2.3 Writing Units as Words or Symbols . . . . . . . . . . . . . . . . . . . . . . . . . 10
2.4 Combinations of SI Base Units . . . . . . . . . . . . . . . . . . . . . . . . . . . 12
2.5 Rounding, Scientific Notation and Significant Figures . . . . . . . . . . . . . . . 12
2.5.1 Rounding Off . . . . . . . . . . . . . . . . . . . . . . . . . . . . . . . . 12
2.5.2 Error Margins . . . . . . . . . . . . . . . . . . . . . . . . . . . . . . . . 13
2.5.3 Scientific Notation . . . . . . . . . . . . . . . . . . . . . . . . . . . . . 13
2.5.4 Significant Figures . . . . . . . . . . . . . . . . . . . . . . . . . . . . . . 15
2.6 Prefixes of Base Units . . . . . . . . . . . . . . . . . . . . . . . . . . . . . . . . 15
2.7 The Importance of Units . . . . . . . . . . . . . . . . . . . . . . . . . . . . . . 17
2.8 How to Change Units . . . . . . . . . . . . . . . . . . . . . . . . . . . . . . . . 17
2.8.1 Two other useful conversions . . . . . . . . . . . . . . . . . . . . . . . . 19
2.9 A sanity test . . . . . . . . . . . . . . . . . . . . . . . . . . . . . . . . . . . . . 19
2.10 Summary . . . . . . . . . . . . . . . . . . . . . . . . . . . . . . . . . . . . . . . 19
2.11 End of Chapter Exercises . . . . . . . . . . . . . . . . . . . . . . . . . . . . . . 21
3 Motion in One Dimension - Grade 10 23
3.1 Introduction . . . . . . . . . . . . . . . . . . . . . . . . . . . . . . . . . . . . . 23
3.2 Reference Point, Frame of Reference and Position . . . . . . . . . . . . . . . . . 23
3.2.1 Frames of Reference . . . . . . . . . . . . . . . . . . . . . . . . . . . . . 23
3.2.2 Position . . . . . . . . . . . . . . . . . . . . . . . . . . . . . . . . . . . 25
3.3 Displacement and Distance . . . . . . . . . . . . . . . . . . . . . . . . . . . . . 28
3.3.1 Interpreting Direction . . . . . . . . . . . . . . . . . . . . . . . . . . . . 29
3.3.2 Differences between Distance and Displacement . . . . . . . . . . . . . . 29
3.4 Speed, Average Velocity and Instantaneous Velocity . . . . . . . . . . . . . . . . 31
v
CONTENTS CONTENTS
3.4.1 Differences between Speed and Velocity . . . . . . . . . . . . . . . . . . 35
3.5 Acceleration . . . . . . . . . . . . . . . . . . . . . . . . . . . . . . . . . . . . . 38
3.6 Description of Motion . . . . . . . . . . . . . . . . . . . . . . . . . . . . . . . . 39
3.6.1 Stationary Object . . . . . . . . . . . . . . . . . . . . . . . . . . . . . . 40
3.6.2 Motion at Constant Velocity . . . . . . . . . . . . . . . . . . . . . . . . 41
3.6.3 Motion at Constant Acceleration . . . . . . . . . . . . . . . . . . . . . . 46
3.7 Summary of Graphs . . . . . . . . . . . . . . . . . . . . . . . . . . . . . . . . . 48
3.8 Worked Examples . . . . . . . . . . . . . . . . . . . . . . . . . . . . . . . . . . 49
3.9 Equations of Motion . . . . . . . . . . . . . . . . . . . . . . . . . . . . . . . . . 54
3.9.1 Finding the Equations of Motion . . . . . . . . . . . . . . . . . . . . . . 54
3.10 Applications in the Real-World . . . . . . . . . . . . . . . . . . . . . . . . . . . 59
3.11 Summary . . . . . . . . . . . . . . . . . . . . . . . . . . . . . . . . . . . . . . . 61
3.12 End of Chapter Exercises: Motion in One Dimension . . . . . . . . . . . . . . . 62
4 Gravity and Mechanical Energy - Grade 10 67
4.1 Weight . . . . . . . . . . . . . . . . . . . . . . . . . . . . . . . . . . . . . . . . 67
4.1.1 Differences between Mass and Weight . . . . . . . . . . . . . . . . . . . 68
4.2 Acceleration due to Gravity . . . . . . . . . . . . . . . . . . . . . . . . . . . . . 69
4.2.1 Gravitational Fields . . . . . . . . . . . . . . . . . . . . . . . . . . . . . 69
4.2.2 Free fall . . . . . . . . . . . . . . . . . . . . . . . . . . . . . . . . . . . 69
4.3 Potential Energy . . . . . . . . . . . . . . . . . . . . . . . . . . . . . . . . . . . 73
4.4 Kinetic Energy . . . . . . . . . . . . . . . . . . . . . . . . . . . . . . . . . . . . 75
4.4.1 Checking units . . . . . . . . . . . . . . . . . . . . . . . . . . . . . . . . 77
4.5 Mechanical Energy . . . . . . . . . . . . . . . . . . . . . . . . . . . . . . . . . 78
4.5.1 Conservation of Mechanical Energy . . . . . . . . . . . . . . . . . . . . . 78
4.5.2 Using the Law of Conservation of Energy . . . . . . . . . . . . . . . . . 79
4.6 Energy graphs . . . . . . . . . . . . . . . . . . . . . . . . . . . . . . . . . . . . 82
4.7 Summary . . . . . . . . . . . . . . . . . . . . . . . . . . . . . . . . . . . . . . . 83
4.8 End of Chapter Exercises: Gravity and Mechanical Energy . . . . . . . . . . . . 84
5 Transverse Pulses - Grade 10 87
5.1 Introduction . . . . . . . . . . . . . . . . . . . . . . . . . . . . . . . . . . . . . 87
5.2 What is a medium? . . . . . . . . . . . . . . . . . . . . . . . . . . . . . . . . . 87
5.3 What is a pulse? . . . . . . . . . . . . . . . . . . . . . . . . . . . . . . . . . . . 87
5.3.1 Pulse Length and Amplitude . . . . . . . . . . . . . . . . . . . . . . . . 88
5.3.2 Pulse Speed . . . . . . . . . . . . . . . . . . . . . . . . . . . . . . . . . 89
5.4 Graphs of Position and Velocity . . . . . . . . . . . . . . . . . . . . . . . . . . . 90
5.4.1 Motion of a Particle of the Medium . . . . . . . . . . . . . . . . . . . . 90
5.4.2 Motion of the Pulse . . . . . . . . . . . . . . . . . . . . . . . . . . . . . 92
5.5 Transmission and Reflection of a Pulse at a Boundary . . . . . . . . . . . . . . . 96
5.6 Reflection of a Pulse from Fixed and Free Ends . . . . . . . . . . . . . . . . . . 97
5.6.1 Reflection of a Pulse from a Fixed End . . . . . . . . . . . . . . . . . . . 97
vi

CONTENTS CONTENTS
5.6.2 Reflection of a Pulse from a Free End . . . . . . . . . . . . . . . . . . . 98
5.7 Superposition of Pulses . . . . . . . . . . . . . . . . . . . . . . . . . . . . . . . 99
5.8 Exercises - Transverse Pulses . . . . . . . . . . . . . . . . . . . . . . . . . . . . 102
6 Transverse Waves - Grade 10 105
6.1 Introduction . . . . . . . . . . . . . . . . . . . . . . . . . . . . . . . . . . . . . 105
6.2 What is a transverse wave? . . . . . . . . . . . . . . . . . . . . . . . . . . . . . 105
6.2.1 Peaks and Troughs . . . . . . . . . . . . . . . . . . . . . . . . . . . . . 106
6.2.2 Amplitude and Wavelength . . . . . . . . . . . . . . . . . . . . . . . . . 107
6.2.3 Points in Phase . . . . . . . . . . . . . . . . . . . . . . . . . . . . . . . 109
6.2.4 Period and Frequency . . . . . . . . . . . . . . . . . . . . . . . . . . . . 110
6.2.5 Speed of a Transverse Wave . . . . . . . . . . . . . . . . . . . . . . . . 111
6.3 Graphs of Particle Motion . . . . . . . . . . . . . . . . . . . . . . . . . . . . . . 115
6.4 Standing Waves and Boundary Conditions . . . . . . . . . . . . . . . . . . . . . 118
6.4.1 Reflection of a Transverse Wave from a Fixed End . . . . . . . . . . . . 118
6.4.2 Reflection of a Transverse Wave from a Free End . . . . . . . . . . . . . 118
6.4.3 Standing Waves . . . . . . . . . . . . . . . . . . . . . . . . . . . . . . . 118
6.4.4 Nodes and anti-nodes . . . . . . . . . . . . . . . . . . . . . . . . . . . . 122
6.4.5 Wavelengths of Standing Waves with Fixed and Free Ends . . . . . . . . 122
6.4.6 Superposition and Interference . . . . . . . . . . . . . . . . . . . . . . . 125
6.5 Summary . . . . . . . . . . . . . . . . . . . . . . . . . . . . . . . . . . . . . . . 127
6.6 Exercises . . . . . . . . . . . . . . . . . . . . . . . . . . . . . . . . . . . . . . . 127
7 Geometrical Optics - Grade 10 129
7.1 Introduction . . . . . . . . . . . . . . . . . . . . . . . . . . . . . . . . . . . . . 129
7.2 Light Rays . . . . . . . . . . . . . . . . . . . . . . . . . . . . . . . . . . . . . . 129
7.2.1 Shadows . . . . . . . . . . . . . . . . . . . . . . . . . . . . . . . . . . . 132
7.2.2 Ray Diagrams . . . . . . . . . . . . . . . . . . . . . . . . . . . . . . . . 132
7.3 Reflection . . . . . . . . . . . . . . . . . . . . . . . . . . . . . . . . . . . . . . 132
7.3.1 Terminology . . . . . . . . . . . . . . . . . . . . . . . . . . . . . . . . . 133
7.3.2 Law of Reflection . . . . . . . . . . . . . . . . . . . . . . . . . . . . . . 133
7.3.3 Types of Reflection . . . . . . . . . . . . . . . . . . . . . . . . . . . . . 135
7.4 Refraction . . . . . . . . . . . . . . . . . . . . . . . . . . . . . . . . . . . . . . 137
7.4.1 Refractive Index . . . . . . . . . . . . . . . . . . . . . . . . . . . . . . . 139
7.4.2 Snell’s Law . . . . . . . . . . . . . . . . . . . . . . . . . . . . . . . . . 139
7.4.3 Apparent Depth . . . . . . . . . . . . . . . . . . . . . . . . . . . . . . . 143
7.5 Mirrors . . . . . . . . . . . . . . . . . . . . . . . . . . . . . . . . . . . . . . . . 146
7.5.1 Image Formation . . . . . . . . . . . . . . . . . . . . . . . . . . . . . . 146
7.5.2 Plane Mirrors . . . . . . . . . . . . . . . . . . . . . . . . . . . . . . . . 147
7.5.3 Ray Diagrams . . . . . . . . . . . . . . . . . . . . . . . . . . . . . . . . 148
7.5.4 Spherical Mirrors . . . . . . . . . . . . . . . . . . . . . . . . . . . . . . 150
7.5.5 Concave Mirrors . . . . . . . . . . . . . . . . . . . . . . . . . . . . . . . 150
vii
CONTENTS CONTENTS
7.5.6 Convex Mirrors . . . . . . . . . . . . . . . . . . . . . . . . . . . . . . . 153
7.5.7 Summary of Properties of Mirrors . . . . . . . . . . . . . . . . . . . . . 154
7.5.8 Magnification . . . . . . . . . . . . . . . . . . . . . . . . . . . . . . . . 154
7.6 Total Internal Reflection and Fibre Optics . . . . . . . . . . . . . . . . . . . . . 156
7.6.1 Total Internal Reflection . . . . . . . . . . . . . . . . . . . . . . . . . . 156
7.6.2 Fibre Optics . . . . . . . . . . . . . . . . . . . . . . . . . . . . . . . . . 161
7.7 Summary . . . . . . . . . . . . . . . . . . . . . . . . . . . . . . . . . . . . . . . 163
7.8 Exercises . . . . . . . . . . . . . . . . . . . . . . . . . . . . . . . . . . . . . . . 164
8 Magnetism - Grade 10 167
8.1 Introduction . . . . . . . . . . . . . . . . . . . . . . . . . . . . . . . . . . . . . 167
8.2 Magnetic fields . . . . . . . . . . . . . . . . . . . . . . . . . . . . . . . . . . . 167
8.3 Permanent magnets . . . . . . . . . . . . . . . . . . . . . . . . . . . . . . . . . 169
8.3.1 The poles of permanent magnets . . . . . . . . . . . . . . . . . . . . . . 169
8.3.2 Magnetic attraction and repulsion . . . . . . . . . . . . . . . . . . . . . 169
8.3.3 Representing magnetic fields . . . . . . . . . . . . . . . . . . . . . . . . 170
8.4 The compass and the earth’s magnetic field . . . . . . . . . . . . . . . . . . . . 173
8.4.1 The earth’s magnetic field . . . . . . . . . . . . . . . . . . . . . . . . . 175
8.5 Summary . . . . . . . . . . . . . . . . . . . . . . . . . . . . . . . . . . . . . . . 175
8.6 End of chapter exercises . . . . . . . . . . . . . . . . . . . . . . . . . . . . . . . 176
9 Electrostatics - Grade 10 177
9.1 Introduction . . . . . . . . . . . . . . . . . . . . . . . . . . . . . . . . . . . . . 177
9.2 Two kinds of charge . . . . . . . . . . . . . . . . . . . . . . . . . . . . . . . . . 177
9.3 Unit of charge . . . . . . . . . . . . . . . . . . . . . . . . . . . . . . . . . . . . 177
9.4 Conservation of charge . . . . . . . . . . . . . . . . . . . . . . . . . . . . . . . 177
9.5 Force between Charges . . . . . . . . . . . . . . . . . . . . . . . . . . . . . . . 178
9.6 Conductors and insulators . . . . . . . . . . . . . . . . . . . . . . . . . . . . . . 181
9.6.1 The electroscope . . . . . . . . . . . . . . . . . . . . . . . . . . . . . . 182
9.7 Attraction between charged and uncharged objects . . . . . . . . . . . . . . . . 183
9.7.1 Polarisation of Insulators . . . . . . . . . . . . . . . . . . . . . . . . . . 183
9.8 Summary . . . . . . . . . . . . . . . . . . . . . . . . . . . . . . . . . . . . . . . 184
9.9 End of chapter exercise . . . . . . . . . . . . . . . . . . . . . . . . . . . . . . . 184
10 Electric Circuits - Grade 10 187
10.1 Electric Circuits . . . . . . . . . . . . . . . . . . . . . . . . . . . . . . . . . . . 187
10.1.1 Closed circuits . . . . . . . . . . . . . . . . . . . . . . . . . . . . . . . . 187
10.1.2 Representing electric circuits . . . . . . . . . . . . . . . . . . . . . . . . 188
10.2 Potential Difference . . . . . . . . . . . . . . . . . . . . . . . . . . . . . . . . . 192
10.2.1 Potential Difference . . . . . . . . . . . . . . . . . . . . . . . . . . . . . 192
10.2.2 Potential Difference and Parallel Resistors . . . . . . . . . . . . . . . . . 193
10.2.3 Potential Difference and Series Resistors . . . . . . . . . . . . . . . . . . 194
10.2.4 Ohm’s Law . . . . . . . . . . . . . . . . . . . . . . . . . . . . . . . . . 194
viii
CONTENTS CONTENTS
10.2.5 EMF . . . . . . . . . . . . . . . . . . . . . . . . . . . . . . . . . . . . . 195
10.3 Current . . . . . . . . . . . . . . . . . . . . . . . . . . . . . . . . . . . . . . . . 198
10.3.1 Flow of Charge . . . . . . . . . . . . . . . . . . . . . . . . . . . . . . . 198
10.3.2 Current . . . . . . . . . . . . . . . . . . . . . . . . . . . . . . . . . . . 198
10.3.3 Series Circuits . . . . . . . . . . . . . . . . . . . . . . . . . . . . . . . . 199
10.3.4 Parallel Circuits . . . . . . . . . . . . . . . . . . . . . . . . . . . . . . . 200
10.4 Resistance . . . . . . . . . . . . . . . . . . . . . . . . . . . . . . . . . . . . . . 202
10.4.1 What causes resistance? . . . . . . . . . . . . . . . . . . . . . . . . . . 202
10.4.2 Resistors in electric circuits . . . . . . . . . . . . . . . . . . . . . . . . . 202
10.5 Instruments to Measure voltage, current and resistance . . . . . . . . . . . . . . 204
10.5.1 Voltmeter . . . . . . . . . . . . . . . . . . . . . . . . . . . . . . . . . . 204
10.5.2 Ammeter . . . . . . . . . . . . . . . . . . . . . . . . . . . . . . . . . . . 204
10.5.3 Ohmmeter . . . . . . . . . . . . . . . . . . . . . . . . . . . . . . . . . . 204
10.5.4 Meters Impact on Circuit . . . . . . . . . . . . . . . . . . . . . . . . . . 205
10.6 Exercises - Electric circuits . . . . . . . . . . . . . . . . . . . . . . . . . . . . . 205
III Grade 11 - Physics 209
11 Vectors 211
11.1 Introduction . . . . . . . . . . . . . . . . . . . . . . . . . . . . . . . . . . . . . 211
11.2 Scalars and Vectors . . . . . . . . . . . . . . . . . . . . . . . . . . . . . . . . . 211
11.3 Notation . . . . . . . . . . . . . . . . . . . . . . . . . . . . . . . . . . . . . . . 211
11.3.1 Mathematical Representation . . . . . . . . . . . . . . . . . . . . . . . . 212
11.3.2 Graphical Representation . . . . . . . . . . . . . . . . . . . . . . . . . . 212
11.4 Directions . . . . . . . . . . . . . . . . . . . . . . . . . . . . . . . . . . . . . . 212
11.4.1 Relative Directions . . . . . . . . . . . . . . . . . . . . . . . . . . . . . 212
11.4.2 Compass Directions . . . . . . . . . . . . . . . . . . . . . . . . . . . . . 213
11.4.3 Bearing . . . . . . . . . . . . . . . . . . . . . . . . . . . . . . . . . . . 213
11.5 Drawing Vectors . . . . . . . . . . . . . . . . . . . . . . . . . . . . . . . . . . . 214
11.6 Mathematical Properties of Vectors . . . . . . . . . . . . . . . . . . . . . . . . . 215
11.6.1 Adding Vectors . . . . . . . . . . . . . . . . . . . . . . . . . . . . . . . 215
11.6.2 Subtracting Vectors . . . . . . . . . . . . . . . . . . . . . . . . . . . . . 217
11.6.3 Scalar Multiplication . . . . . . . . . . . . . . . . . . . . . . . . . . . . 218
11.7 Techniques of Vector Addition . . . . . . . . . . . . . . . . . . . . . . . . . . . 218
11.7.1 Graphical Techniques . . . . . . . . . . . . . . . . . . . . . . . . . . . . 218
11.7.2 Algebraic Addition and Subtraction of Vectors . . . . . . . . . . . . . . . 223
11.8 Components of Vectors . . . . . . . . . . . . . . . . . . . . . . . . . . . . . . . 228
11.8.1 Vector addition using components . . . . . . . . . . . . . . . . . . . . . 231
11.8.2 Summary . . . . . . . . . . . . . . . . . . . . . . . . . . . . . . . . . . 235
11.8.3 End of chapter exercises: Vectors . . . . . . . . . . . . . . . . . . . . . . 236
11.8.4 End of chapter exercises: Vectors - Long questions . . . . . . . . . . . . 237
ix
CONTENTS CONTENTS
12 Force, Momentum and Impulse - Grade 11 239
12.1 Introduction . . . . . . . . . . . . . . . . . . . . . . . . . . . . . . . . . . . . . 239
12.2 Force . . . . . . . . . . . . . . . . . . . . . . . . . . . . . . . . . . . . . . . . . 239
12.2.1 What is a force? . . . . . . . . . . . . . . . . . . . . . . . . . . . . . . . 239
12.2.2 Examples of Forces in Physics . . . . . . . . . . . . . . . . . . . . . . . 240
12.2.3 Systems and External Forces . . . . . . . . . . . . . . . . . . . . . . . . 241
12.2.4 Force Diagrams . . . . . . . . . . . . . . . . . . . . . . . . . . . . . . . 242
12.2.5 Free Body Diagrams . . . . . . . . . . . . . . . . . . . . . . . . . . . . . 243
12.2.6 Finding the Resultant Force . . . . . . . . . . . . . . . . . . . . . . . . . 244
12.2.7 Exercise . . . . . . . . . . . . . . . . . . . . . . . . . . . . . . . . . . . 246
12.3 Newton’s Laws . . . . . . . . . . . . . . . . . . . . . . . . . . . . . . . . . . . . 246
12.3.1 Newton’s First Law . . . . . . . . . . . . . . . . . . . . . . . . . . . . . 247
12.3.2 Newton’s Second Law of Motion . . . . . . . . . . . . . . . . . . . . . . 249
12.3.3 Exercise . . . . . . . . . . . . . . . . . . . . . . . . . . . . . . . . . . . 261
12.3.4 Newton’s Third Law of Motion . . . . . . . . . . . . . . . . . . . . . . . 263
12.3.5 Exercise . . . . . . . . . . . . . . . . . . . . . . . . . . . . . . . . . . . 267
12.3.6 Different types of forces . . . . . . . . . . . . . . . . . . . . . . . . . . . 268
12.3.7 Exercise . . . . . . . . . . . . . . . . . . . . . . . . . . . . . . . . . . . 275
12.3.8 Forces in equilibrium . . . . . . . . . . . . . . . . . . . . . . . . . . . . 276
12.3.9 Exercise . . . . . . . . . . . . . . . . . . . . . . . . . . . . . . . . . . . 279
12.4 Forces between Masses . . . . . . . . . . . . . . . . . . . . . . . . . . . . . . . 282
12.4.1 Newton’s Law of Universal Gravitation . . . . . . . . . . . . . . . . . . . 282
12.4.2 Comparative Problems . . . . . . . . . . . . . . . . . . . . . . . . . . . 284
12.4.3 Exercise . . . . . . . . . . . . . . . . . . . . . . . . . . . . . . . . . . . 286
12.5 Momentum and Impulse . . . . . . . . . . . . . . . . . . . . . . . . . . . . . . . 287
12.5.1 Vector Nature of Momentum . . . . . . . . . . . . . . . . . . . . . . . . 290
12.5.2 Exercise . . . . . . . . . . . . . . . . . . . . . . . . . . . . . . . . . . . 291
12.5.3 Change in Momentum . . . . . . . . . . . . . . . . . . . . . . . . . . . . 291
12.5.4 Exercise . . . . . . . . . . . . . . . . . . . . . . . . . . . . . . . . . . . 293
12.5.5 Newton’s Second Law revisited . . . . . . . . . . . . . . . . . . . . . . . 293
12.5.6 Impulse . . . . . . . . . . . . . . . . . . . . . . . . . . . . . . . . . . . 294
12.5.7 Exercise . . . . . . . . . . . . . . . . . . . . . . . . . . . . . . . . . . . 296
12.5.8 Conservation of Momentum . . . . . . . . . . . . . . . . . . . . . . . . . 297
12.5.9 Physics in Action: Impulse . . . . . . . . . . . . . . . . . . . . . . . . . 300
12.5.10Exercise . . . . . . . . . . . . . . . . . . . . . . . . . . . . . . . . . . . 301
12.6 Torque and Levers . . . . . . . . . . . . . . . . . . . . . . . . . . . . . . . . . . 302
12.6.1 Torque . . . . . . . . . . . . . . . . . . . . . . . . . . . . . . . . . . . . 302
12.6.2 Mechanical Advantage and Levers . . . . . . . . . . . . . . . . . . . . . 305
12.6.3 Classes of levers . . . . . . . . . . . . . . . . . . . . . . . . . . . . . . . 307
12.6.4 Exercise . . . . . . . . . . . . . . . . . . . . . . . . . . . . . . . . . . . 308
12.7 Summary . . . . . . . . . . . . . . . . . . . . . . . . . . . . . . . . . . . . . . . 309
12.8 End of Chapter exercises . . . . . . . . . . . . . . . . . . . . . . . . . . . . . . 310
x

CONTENTS CONTENTS
13 Geometrical Optics - Grade 11 327
13.1 Introduction . . . . . . . . . . . . . . . . . . . . . . . . . . . . . . . . . . . . . 327
13.2 Lenses . . . . . . . . . . . . . . . . . . . . . . . . . . . . . . . . . . . . . . . . 327
13.2.1 Converging Lenses . . . . . . . . . . . . . . . . . . . . . . . . . . . . . . 329
13.2.2 Diverging Lenses . . . . . . . . . . . . . . . . . . . . . . . . . . . . . . 340
13.2.3 Summary of Image Properties . . . . . . . . . . . . . . . . . . . . . . . 343
13.3 The Human Eye . . . . . . . . . . . . . . . . . . . . . . . . . . . . . . . . . . . 344
13.3.1 Structure of the Eye . . . . . . . . . . . . . . . . . . . . . . . . . . . . . 345
13.3.2 Defects of Vision . . . . . . . . . . . . . . . . . . . . . . . . . . . . . . 346
13.4 Gravitational Lenses . . . . . . . . . . . . . . . . . . . . . . . . . . . . . . . . . 347
13.5 Telescopes . . . . . . . . . . . . . . . . . . . . . . . . . . . . . . . . . . . . . . 347
13.5.1 Refracting Telescopes . . . . . . . . . . . . . . . . . . . . . . . . . . . . 347
13.5.2 Reflecting Telescopes . . . . . . . . . . . . . . . . . . . . . . . . . . . . 348
13.5.3 Southern African Large Telescope . . . . . . . . . . . . . . . . . . . . . 348
13.6 Microscopes . . . . . . . . . . . . . . . . . . . . . . . . . . . . . . . . . . . . . 349
13.7 Summary . . . . . . . . . . . . . . . . . . . . . . . . . . . . . . . . . . . . . . . 351
13.8 Exercises . . . . . . . . . . . . . . . . . . . . . . . . . . . . . . . . . . . . . . . 352
14 Longitudinal Waves - Grade 11 355
14.1 Introduction . . . . . . . . . . . . . . . . . . . . . . . . . . . . . . . . . . . . . 355
14.2 What is a longitudinal wave? . . . . . . . . . . . . . . . . . . . . . . . . . . . . 355
14.3 Characteristics of Longitudinal Waves . . . . . . . . . . . . . . . . . . . . . . . 356
14.3.1 Compression and Rarefaction . . . . . . . . . . . . . . . . . . . . . . . . 356
14.3.2 Wavelength and Amplitude . . . . . . . . . . . . . . . . . . . . . . . . . 357
14.3.3 Period and Frequency . . . . . . . . . . . . . . . . . . . . . . . . . . . . 357
14.3.4 Speed of a Longitudinal Wave . . . . . . . . . . . . . . . . . . . . . . . 358
14.4 Graphs of Particle Position, Displacement, Velocity and Acceleration . . . . . . . 359
14.5 Sound Waves . . . . . . . . . . . . . . . . . . . . . . . . . . . . . . . . . . . . 360
14.6 Seismic Waves . . . . . . . . . . . . . . . . . . . . . . . . . . . . . . . . . . . . 361
14.7 Summary - Longitudinal Waves . . . . . . . . . . . . . . . . . . . . . . . . . . . 361
14.8 Exercises - Longitudinal Waves . . . . . . . . . . . . . . . . . . . . . . . . . . . 362
15 Sound - Grade 11 363
15.1 Introduction . . . . . . . . . . . . . . . . . . . . . . . . . . . . . . . . . . . . . 363
15.2 Characteristics of a Sound Wave . . . . . . . . . . . . . . . . . . . . . . . . . . 363
15.2.1 Pitch . . . . . . . . . . . . . . . . . . . . . . . . . . . . . . . . . . . . . 364
15.2.2 Loudness . . . . . . . . . . . . . . . . . . . . . . . . . . . . . . . . . . . 364
15.2.3 Tone . . . . . . . . . . . . . . . . . . . . . . . . . . . . . . . . . . . . . 364
15.3 Speed of Sound . . . . . . . . . . . . . . . . . . . . . . . . . . . . . . . . . . . 365
15.4 Physics of the Ear and Hearing . . . . . . . . . . . . . . . . . . . . . . . . . . . 365
15.4.1 Intensity of Sound . . . . . . . . . . . . . . . . . . . . . . . . . . . . . . 366
15.5 Ultrasound . . . . . . . . . . . . . . . . . . . . . . . . . . . . . . . . . . . . . . 367
xi

CONTENTS CONTENTS
15.6 SONAR . . . . . . . . . . . . . . . . . . . . . . . . . . . . . . . . . . . . . . . 368
15.6.1 Echolocation . . . . . . . . . . . . . . . . . . . . . . . . . . . . . . . . . 368
15.7 Summary . . . . . . . . . . . . . . . . . . . . . . . . . . . . . . . . . . . . . . . 369
15.8 Exercises . . . . . . . . . . . . . . . . . . . . . . . . . . . . . . . . . . . . . . . 369
16 The Physics of Music - Grade 11 373
16.1 Introduction . . . . . . . . . . . . . . . . . . . . . . . . . . . . . . . . . . . . . 373
16.2 Standing Waves in String Instruments . . . . . . . . . . . . . . . . . . . . . . . 373
16.3 Standing Waves in Wind Instruments . . . . . . . . . . . . . . . . . . . . . . . . 377
16.4 Resonance . . . . . . . . . . . . . . . . . . . . . . . . . . . . . . . . . . . . . . 382
16.5 Music and Sound Quality . . . . . . . . . . . . . . . . . . . . . . . . . . . . . . 384
16.6 Summary - The Physics of Music . . . . . . . . . . . . . . . . . . . . . . . . . . 385
16.7 End of Chapter Exercises . . . . . . . . . . . . . . . . . . . . . . . . . . . . . . 386
17 Electrostatics - Grade 11 387
17.1 Introduction . . . . . . . . . . . . . . . . . . . . . . . . . . . . . . . . . . . . . 387
17.2 Forces between charges - Coulomb’s Law . . . . . . . . . . . . . . . . . . . . . . 387
17.3 Electric field around charges . . . . . . . . . . . . . . . . . . . . . . . . . . . . 392
17.3.1 Electric field lines . . . . . . . . . . . . . . . . . . . . . . . . . . . . . . 393
17.3.2 Positive charge acting on a test charge . . . . . . . . . . . . . . . . . . . 393
17.3.3 Combined charge distributions . . . . . . . . . . . . . . . . . . . . . . . 394
17.3.4 Parallel plates . . . . . . . . . . . . . . . . . . . . . . . . . . . . . . . . 397
17.4 Electrical potential energy and potential . . . . . . . . . . . . . . . . . . . . . . 400
17.4.1 Electrical potential . . . . . . . . . . . . . . . . . . . . . . . . . . . . . 400
17.4.2 Real-world application: lightning . . . . . . . . . . . . . . . . . . . . . . 402
17.5 Capacitance and the parallel plate capacitor . . . . . . . . . . . . . . . . . . . . 403
17.5.1 Capacitors and capacitance . . . . . . . . . . . . . . . . . . . . . . . . . 403
17.5.2 Dielectrics . . . . . . . . . . . . . . . . . . . . . . . . . . . . . . . . . . 404
17.5.3 Physical properties of the capacitor and capacitance . . . . . . . . . . . . 404
17.5.4 Electric field in a capacitor . . . . . . . . . . . . . . . . . . . . . . . . . 405
17.6 Capacitor as a circuit device . . . . . . . . . . . . . . . . . . . . . . . . . . . . 406
17.6.1 A capacitor in a circuit . . . . . . . . . . . . . . . . . . . . . . . . . . . 406
17.6.2 Real-world applications: capacitors . . . . . . . . . . . . . . . . . . . . . 407
17.7 Summary . . . . . . . . . . . . . . . . . . . . . . . . . . . . . . . . . . . . . . . 407
17.8 Exercises - Electrostatics . . . . . . . . . . . . . . . . . . . . . . . . . . . . . . 407
18 Electromagnetism - Grade 11 413
18.1 Introduction . . . . . . . . . . . . . . . . . . . . . . . . . . . . . . . . . . . . . 413
18.2 Magnetic field associated with a current . . . . . . . . . . . . . . . . . . . . . . 413
18.2.1 Real-world applications . . . . . . . . . . . . . . . . . . . . . . . . . . . 418
18.3 Current induced by a changing magnetic field . . . . . . . . . . . . . . . . . . . 420
18.3.1 Real-life applications . . . . . . . . . . . . . . . . . . . . . . . . . . . . 422
18.4 Transformers . . . . . . . . . . . . . . . . . . . . . . . . . . . . . . . . . . . . . 423
xii
CONTENTS CONTENTS
18.4.1 Real-world applications . . . . . . . . . . . . . . . . . . . . . . . . . . . 425
18.5 Motion of a charged particle in a magnetic field . . . . . . . . . . . . . . . . . . 425
18.5.1 Real-world applications . . . . . . . . . . . . . . . . . . . . . . . . . . . 426
18.6 Summary . . . . . . . . . . . . . . . . . . . . . . . . . . . . . . . . . . . . . . . 427
18.7 End of chapter exercises . . . . . . . . . . . . . . . . . . . . . . . . . . . . . . . 427
19 Electric Circuits - Grade 11 429
19.1 Introduction . . . . . . . . . . . . . . . . . . . . . . . . . . . . . . . . . . . . . 429
19.2 Ohm’s Law . . . . . . . . . . . . . . . . . . . . . . . . . . . . . . . . . . . . . . 429
19.2.1 Definition of Ohm’s Law . . . . . . . . . . . . . . . . . . . . . . . . . . 429
19.2.2 Ohmic and non-ohmic conductors . . . . . . . . . . . . . . . . . . . . . 431
19.2.3 Using Ohm’s Law . . . . . . . . . . . . . . . . . . . . . . . . . . . . . . 432
19.3 Resistance . . . . . . . . . . . . . . . . . . . . . . . . . . . . . . . . . . . . . . 433
19.3.1 Equivalent resistance . . . . . . . . . . . . . . . . . . . . . . . . . . . . 433
19.3.2 Use of Ohm’s Law in series and parallel Circuits . . . . . . . . . . . . . . 438
19.3.3 Batteries and internal resistance . . . . . . . . . . . . . . . . . . . . . . 440
19.4 Series and parallel networks of resistors . . . . . . . . . . . . . . . . . . . . . . . 442
19.5 Wheatstone bridge . . . . . . . . . . . . . . . . . . . . . . . . . . . . . . . . . . 445
19.6 Summary . . . . . . . . . . . . . . . . . . . . . . . . . . . . . . . . . . . . . . . 447
19.7 End of chapter exercise . . . . . . . . . . . . . . . . . . . . . . . . . . . . . . . 447
20 Electronic Properties of Matter - Grade 11 451
20.1 Introduction . . . . . . . . . . . . . . . . . . . . . . . . . . . . . . . . . . . . . 451
20.2 Conduction . . . . . . . . . . . . . . . . . . . . . . . . . . . . . . . . . . . . . . 451
20.2.1 Metals . . . . . . . . . . . . . . . . . . . . . . . . . . . . . . . . . . . . 453
20.2.2 Insulator . . . . . . . . . . . . . . . . . . . . . . . . . . . . . . . . . . . 453
20.2.3 Semi-conductors . . . . . . . . . . . . . . . . . . . . . . . . . . . . . . . 454
20.3 Intrinsic Properties and Doping . . . . . . . . . . . . . . . . . . . . . . . . . . . 454
20.3.1 Surplus . . . . . . . . . . . . . . . . . . . . . . . . . . . . . . . . . . . . 455
20.3.2 Deficiency . . . . . . . . . . . . . . . . . . . . . . . . . . . . . . . . . . 455
20.4 The p-n junction . . . . . . . . . . . . . . . . . . . . . . . . . . . . . . . . . . . 457
20.4.1 Differences between p- and n-type semi-conductors . . . . . . . . . . . . 457
20.4.2 The p-n Junction . . . . . . . . . . . . . . . . . . . . . . . . . . . . . . 457
20.4.3 Unbiased . . . . . . . . . . . . . . . . . . . . . . . . . . . . . . . . . . . 457
20.4.4 Forward biased . . . . . . . . . . . . . . . . . . . . . . . . . . . . . . . 457
20.4.5 Reverse biased . . . . . . . . . . . . . . . . . . . . . . . . . . . . . . . . 458
20.4.6 Real-World Applications of Semiconductors . . . . . . . . . . . . . . . . 458
20.5 End of Chapter Exercises . . . . . . . . . . . . . . . . . . . . . . . . . . . . . . 459
IV Grade 12 - Physics 461
21 Motion in Two Dimensions - Grade 12 463
21.1 Introduction . . . . . . . . . . . . . . . . . . . . . . . . . . . . . . . . . . . . . 463
xiii
CONTENTS CONTENTS
21.2 Vertical Projectile Motion . . . . . . . . . . . . . . . . . . . . . . . . . . . . . . 463
21.2.1 Motion in a Gravitational Field . . . . . . . . . . . . . . . . . . . . . . . 463
21.2.2 Equations of Motion . . . . . . . . . . . . . . . . . . . . . . . . . . . . 464
21.2.3 Graphs of Vertical Projectile Motion . . . . . . . . . . . . . . . . . . . . 467
21.3 Conservation of Momentum in Two Dimensions . . . . . . . . . . . . . . . . . . 475
21.4 Types of Collisions . . . . . . . . . . . . . . . . . . . . . . . . . . . . . . . . . . 480
21.4.1 Elastic Collisions . . . . . . . . . . . . . . . . . . . . . . . . . . . . . . . 480
21.4.2 Inelastic Collisions . . . . . . . . . . . . . . . . . . . . . . . . . . . . . . 485
21.5 Frames of Reference . . . . . . . . . . . . . . . . . . . . . . . . . . . . . . . . . 490
21.5.1 Introduction . . . . . . . . . . . . . . . . . . . . . . . . . . . . . . . . . 490
21.5.2 What is a frame of reference? . . . . . . . . . . . . . . . . . . . . . . . 491
21.5.3 Why are frames of reference important? . . . . . . . . . . . . . . . . . . 491
21.5.4 Relative Velocity . . . . . . . . . . . . . . . . . . . . . . . . . . . . . . . 491
21.6 Summary . . . . . . . . . . . . . . . . . . . . . . . . . . . . . . . . . . . . . . . 494
21.7 End of chapter exercises . . . . . . . . . . . . . . . . . . . . . . . . . . . . . . . 495
22 Mechanical Properties of Matter - Grade 12 503
22.1 Introduction . . . . . . . . . . . . . . . . . . . . . . . . . . . . . . . . . . . . . 503
22.2 Deformation of materials . . . . . . . . . . . . . . . . . . . . . . . . . . . . . . 503
22.2.1 Hooke’s Law . . . . . . . . . . . . . . . . . . . . . . . . . . . . . . . . . 503
22.2.2 Deviation from Hooke’s Law . . . . . . . . . . . . . . . . . . . . . . . . 506
22.3 Elasticity, plasticity, fracture, creep . . . . . . . . . . . . . . . . . . . . . . . . . 508
22.3.1 Elasticity and plasticity . . . . . . . . . . . . . . . . . . . . . . . . . . . 508
22.3.2 Fracture, creep and fatigue . . . . . . . . . . . . . . . . . . . . . . . . . 508
22.4 Failure and strength of materials . . . . . . . . . . . . . . . . . . . . . . . . . . 509
22.4.1 The properties of matter . . . . . . . . . . . . . . . . . . . . . . . . . . 509
22.4.2 Structure and failure of materials . . . . . . . . . . . . . . . . . . . . . . 509
22.4.3 Controlling the properties of materials . . . . . . . . . . . . . . . . . . . 509
22.4.4 Steps of Roman Swordsmithing . . . . . . . . . . . . . . . . . . . . . . . 510
22.5 Summary . . . . . . . . . . . . . . . . . . . . . . . . . . . . . . . . . . . . . . . 511
22.6 End of chapter exercise . . . . . . . . . . . . . . . . . . . . . . . . . . . . . . . 511
23 Work, Energy and Power - Grade 12 513
23.1 Introduction . . . . . . . . . . . . . . . . . . . . . . . . . . . . . . . . . . . . . 513
23.2 Work . . . . . . . . . . . . . . . . . . . . . . . . . . . . . . . . . . . . . . . . . 513
23.3 Energy . . . . . . . . . . . . . . . . . . . . . . . . . . . . . . . . . . . . . . . . 519
23.3.1 External and Internal Forces . . . . . . . . . . . . . . . . . . . . . . . . 519
23.3.2 Capacity to do Work . . . . . . . . . . . . . . . . . . . . . . . . . . . . 520
23.4 Power . . . . . . . . . . . . . . . . . . . . . . . . . . . . . . . . . . . . . . . . 525
23.5 Important Equations and Quantities . . . . . . . . . . . . . . . . . . . . . . . . 529
23.6 End of Chapter Exercises . . . . . . . . . . . . . . . . . . . . . . . . . . . . . . 529
xiv

CONTENTS CONTENTS
24 Doppler Effect - Grade 12 533
24.1 Introduction . . . . . . . . . . . . . . . . . . . . . . . . . . . . . . . . . . . . . 533
24.2 The Doppler Effect with Sound and Ultrasound . . . . . . . . . . . . . . . . . . 533
24.2.1 Ultrasound and the Doppler Effect . . . . . . . . . . . . . . . . . . . . . 537
24.3 The Doppler Effect with Light . . . . . . . . . . . . . . . . . . . . . . . . . . . 537
24.3.1 The Expanding Universe . . . . . . . . . . . . . . . . . . . . . . . . . . 538
24.4 Summary . . . . . . . . . . . . . . . . . . . . . . . . . . . . . . . . . . . . . . . 539
24.5 End of Chapter Exercises . . . . . . . . . . . . . . . . . . . . . . . . . . . . . . 539
25 Colour - Grade 12 541
25.1 Introduction . . . . . . . . . . . . . . . . . . . . . . . . . . . . . . . . . . . . . 541
25.2 Colour and Light . . . . . . . . . . . . . . . . . . . . . . . . . . . . . . . . . . . 541
25.2.1 Dispersion of white light . . . . . . . . . . . . . . . . . . . . . . . . . . 544
25.3 Addition and Subtraction of Light . . . . . . . . . . . . . . . . . . . . . . . . . 544
25.3.1 Additive Primary Colours . . . . . . . . . . . . . . . . . . . . . . . . . . 544
25.3.2 Subtractive Primary Colours . . . . . . . . . . . . . . . . . . . . . . . . 545
25.3.3 Complementary Colours . . . . . . . . . . . . . . . . . . . . . . . . . . . 546
25.3.4 Perception of Colour . . . . . . . . . . . . . . . . . . . . . . . . . . . . 546
25.3.5 Colours on a Television Screen . . . . . . . . . . . . . . . . . . . . . . . 547
25.4 Pigments and Paints . . . . . . . . . . . . . . . . . . . . . . . . . . . . . . . . 548
25.4.1 Colour of opaque objects . . . . . . . . . . . . . . . . . . . . . . . . . . 548
25.4.2 Colour of transparent objects . . . . . . . . . . . . . . . . . . . . . . . . 548
25.4.3 Pigment primary colours . . . . . . . . . . . . . . . . . . . . . . . . . . 549
25.5 End of Chapter Exercises . . . . . . . . . . . . . . . . . . . . . . . . . . . . . . 550
26 2D and 3D Wavefronts - Grade 12 553
26.1 Introduction . . . . . . . . . . . . . . . . . . . . . . . . . . . . . . . . . . . . . 553
26.2 Wavefronts . . . . . . . . . . . . . . . . . . . . . . . . . . . . . . . . . . . . . . 553
26.3 The Huygens Principle . . . . . . . . . . . . . . . . . . . . . . . . . . . . . . . 554
26.4 Interference . . . . . . . . . . . . . . . . . . . . . . . . . . . . . . . . . . . . . 556
26.5 Diffraction . . . . . . . . . . . . . . . . . . . . . . . . . . . . . . . . . . . . . . 557
26.5.1 Diffraction through a Slit . . . . . . . . . . . . . . . . . . . . . . . . . . 558
26.6 Shock Waves and Sonic Booms . . . . . . . . . . . . . . . . . . . . . . . . . . . 562
26.6.1 Subsonic Flight . . . . . . . . . . . . . . . . . . . . . . . . . . . . . . . 563
26.6.2 Supersonic Flight . . . . . . . . . . . . . . . . . . . . . . . . . . . . . . 563
26.6.3 Mach Cone . . . . . . . . . . . . . . . . . . . . . . . . . . . . . . . . . 566
26.7 End of Chapter Exercises . . . . . . . . . . . . . . . . . . . . . . . . . . . . . . 568
27 Wave Nature of Matter - Grade 12 571
27.1 Introduction . . . . . . . . . . . . . . . . . . . . . . . . . . . . . . . . . . . . . 571
27.2 de Broglie Wavelength . . . . . . . . . . . . . . . . . . . . . . . . . . . . . . . 571
27.3 The Electron Microscope . . . . . . . . . . . . . . . . . . . . . . . . . . . . . . 574
27.3.1 Disadvantages of an Electron Microscope . . . . . . . . . . . . . . . . . 577
xv

CONTENTS CONTENTS
27.3.2 Uses of Electron Microscopes . . . . . . . . . . . . . . . . . . . . . . . . 577
27.4 End of Chapter Exercises . . . . . . . . . . . . . . . . . . . . . . . . . . . . . . 578
28 Electrodynamics - Grade 12 579
28.1 Introduction . . . . . . . . . . . . . . . . . . . . . . . . . . . . . . . . . . . . . 579
28.2 Electrical machines - generators and motors . . . . . . . . . . . . . . . . . . . . 579
28.2.1 Electrical generators . . . . . . . . . . . . . . . . . . . . . . . . . . . . . 580
28.2.2 Electric motors . . . . . . . . . . . . . . . . . . . . . . . . . . . . . . . 582
28.2.3 Real-life applications . . . . . . . . . . . . . . . . . . . . . . . . . . . . 582
28.2.4 Exercise - generators and motors . . . . . . . . . . . . . . . . . . . . . . 584
28.3 Alternating Current . . . . . . . . . . . . . . . . . . . . . . . . . . . . . . . . . 585
28.3.1 Exercise - alternating current . . . . . . . . . . . . . . . . . . . . . . . . 586
28.4 Capacitance and inductance . . . . . . . . . . . . . . . . . . . . . . . . . . . . . 586
28.4.1 Capacitance . . . . . . . . . . . . . . . . . . . . . . . . . . . . . . . . . 586
28.4.2 Inductance . . . . . . . . . . . . . . . . . . . . . . . . . . . . . . . . . . 586
28.4.3 Exercise - capacitance and inductance . . . . . . . . . . . . . . . . . . . 588
28.5 Summary . . . . . . . . . . . . . . . . . . . . . . . . . . . . . . . . . . . . . . . 588
28.6 End of chapter exercise . . . . . . . . . . . . . . . . . . . . . . . . . . . . . . . 589
29 Electronics - Grade 12 591
29.1 Introduction . . . . . . . . . . . . . . . . . . . . . . . . . . . . . . . . . . . . . 591
29.2 Capacitive and Inductive Circuits . . . . . . . . . . . . . . . . . . . . . . . . . . 591
29.3 Filters and Signal Tuning . . . . . . . . . . . . . . . . . . . . . . . . . . . . . . 596
29.3.1 Capacitors and Inductors as Filters . . . . . . . . . . . . . . . . . . . . . 596
29.3.2 LRC Circuits, Resonance and Signal Tuning . . . . . . . . . . . . . . . . 596
29.4 Active Circuit Elements . . . . . . . . . . . . . . . . . . . . . . . . . . . . . . . 599
29.4.1 The Diode . . . . . . . . . . . . . . . . . . . . . . . . . . . . . . . . . . 599
29.4.2 The Light Emitting Diode (LED) . . . . . . . . . . . . . . . . . . . . . . 601
29.4.3 Transistor . . . . . . . . . . . . . . . . . . . . . . . . . . . . . . . . . . 603
29.4.4 The Operational Amplifier . . . . . . . . . . . . . . . . . . . . . . . . . 607
29.5 The Principles of Digital Electronics . . . . . . . . . . . . . . . . . . . . . . . . 609
29.5.1 Logic Gates . . . . . . . . . . . . . . . . . . . . . . . . . . . . . . . . . 610
29.6 Using and Storing Binary Numbers . . . . . . . . . . . . . . . . . . . . . . . . . 616
29.6.1 Binary numbers . . . . . . . . . . . . . . . . . . . . . . . . . . . . . . . 616
29.6.2 Counting circuits . . . . . . . . . . . . . . . . . . . . . . . . . . . . . . 617
29.6.3 Storing binary numbers . . . . . . . . . . . . . . . . . . . . . . . . . . . 619
30 EM Radiation 625
30.1 Introduction . . . . . . . . . . . . . . . . . . . . . . . . . . . . . . . . . . . . . 625
30.2 Particle/wave nature of electromagnetic radiation . . . . . . . . . . . . . . . . . 625
30.3 The wave nature of electromagnetic radiation . . . . . . . . . . . . . . . . . . . 626
30.4 Electromagnetic spectrum . . . . . . . . . . . . . . . . . . . . . . . . . . . . . . 626
30.5 The particle nature of electromagnetic radiation . . . . . . . . . . . . . . . . . . 629
xvi
CONTENTS CONTENTS
30.5.1 Exercise - particle nature of EM waves . . . . . . . . . . . . . . . . . . . 630
30.6 Penetrating ability of electromagnetic radiation . . . . . . . . . . . . . . . . . . 631
30.6.1 Ultraviolet(UV) radiation and the skin . . . . . . . . . . . . . . . . . . . 631
30.6.2 Ultraviolet radiation and the eyes . . . . . . . . . . . . . . . . . . . . . . 632
30.6.3 X-rays . . . . . . . . . . . . . . . . . . . . . . . . . . . . . . . . . . . . 632
30.6.4 Gamma-rays . . . . . . . . . . . . . . . . . . . . . . . . . . . . . . . . . 632
30.6.5 Exercise - Penetrating ability of EM radiation . . . . . . . . . . . . . . . 633
30.7 Summary . . . . . . . . . . . . . . . . . . . . . . . . . . . . . . . . . . . . . . . 633
30.8 End of chapter exercise . . . . . . . . . . . . . . . . . . . . . . . . . . . . . . . 633
31 Optical Phenomena and Properties of Matter - Grade 12 635
31.1 Introduction . . . . . . . . . . . . . . . . . . . . . . . . . . . . . . . . . . . . . 635
31.2 The transmission and scattering of light . . . . . . . . . . . . . . . . . . . . . . 635
31.2.1 Energy levels of an electron . . . . . . . . . . . . . . . . . . . . . . . . . 635
31.2.2 Interaction of light with metals . . . . . . . . . . . . . . . . . . . . . . . 636
31.2.3 Why is the sky blue? . . . . . . . . . . . . . . . . . . . . . . . . . . . . 637
31.3 The photoelectric effect . . . . . . . . . . . . . . . . . . . . . . . . . . . . . . . 638
31.3.1 Applications of the photoelectric effect . . . . . . . . . . . . . . . . . . . 640
31.3.2 Real-life applications . . . . . . . . . . . . . . . . . . . . . . . . . . . . 642
31.4 Emission and absorption spectra . . . . . . . . . . . . . . . . . . . . . . . . . . 643
31.4.1 Emission Spectra . . . . . . . . . . . . . . . . . . . . . . . . . . . . . . 643
31.4.2 Absorption spectra . . . . . . . . . . . . . . . . . . . . . . . . . . . . . 644
31.4.3 Colours and energies of electromagnetic radiation . . . . . . . . . . . . . 646
31.4.4 Applications of emission and absorption spectra . . . . . . . . . . . . . . 648
31.5 Lasers . . . . . . . . . . . . . . . . . . . . . . . . . . . . . . . . . . . . . . . . 650
31.5.1 How a laser works . . . . . . . . . . . . . . . . . . . . . . . . . . . . . . 652
31.5.2 A simple laser . . . . . . . . . . . . . . . . . . . . . . . . . . . . . . . . 654
31.5.3 Laser applications and safety . . . . . . . . . . . . . . . . . . . . . . . . 655
31.6 Summary . . . . . . . . . . . . . . . . . . . . . . . . . . . . . . . . . . . . . . . 656
31.7 End of chapter exercise . . . . . . . . . . . . . . . . . . . . . . . . . . . . . . . 657
V Exercises 659
32 Exercises 661
VI Essays 663
Essay 1: Energy and electricity. Why the fuss? 665
33 Essay: How a cell phone works 671
34 Essay: How a Physiotherapist uses the Concept of Levers 673
35 Essay: How a Pilot Uses Vectors 675
xvii

CONTENTS CONTENTS
A GNU Free Documentation License 677
xviii

Part IV
Grade 12 - Physics
461


Chapter 21
Motion in Two Dimensions -Grade 12
21.1 Introduction
In Chapter 3, we studied motion in one dimension and briefly looked at vertical motion. In thischapter we will discuss vertical motion and also look at motion in two dimensions. InChapter 12, we studied the conservation of momentum and looked at applications in onedimension. In this chapter we will look at momentum in two dimensions.
21.2 Vertical Projectile Motion
In Chapter 4, we studied the motion of objects in free fall and we saw that an object in free fallfalls with gravitational acceleration g. Now we can consider the motion of objects that arethrown upwards and then fall back to the Earth. We call this projectile motion and we will onlyconsider the situation where the object is thrown straight upwards and then falls straightdownwards - this means that there is no horizontal displacement of the object, only a verticaldisplacement.
21.2.1 Motion in a Gravitational Field
When an object is in a gravitational field, it always accelerates downwards with a constantacceleration g whether the object is moving upward or downward. This is shown in Figure 21.1.
Important: Projectiles moving upwards or downwards always accelerate downwards with aconstant acceleration g.
bobject moving upwards g bobject moving downwardsg
Figure 21.1: Objects moving upwards or downwards, always accelerate downwards.
This means that if an object is moving upwards, it decreases until it stops (vf = 0 m·s−1).This is the maximum height that the object reaches, because after this, the object starts to fall.
Important: Projectiles have zero velocity at their greatest height.
463

21.2 CHAPTER 21. MOTION IN TWO DIMENSIONS - GRADE 12
Consider an object thrown upwards from a vertical height ho. We have seen that the objectwill travel upwards with decreasing velocity until it stops, at which point it starts falling. Thetime that it takes for the object to fall down to height ho is the same as the time taken for theobject to reach its maximum height from height ho.
initial height h0
maximum height
b
(a) time = 0 s
b
(b) time = tm
b
(c) time = 2tm
Figure 21.2: (a) An object is thrown upwards from height h0. (b) After time tm, the objectreaches its maximum height, and starts to fall. (c) After a time 2tm the object returns to heighth0.
Important: Projectiles take the same the time to reach their greatest height from the pointof upward launch as the time they take to fall back to the point of launch.
21.2.2 Equations of Motion
The equations of motion that were used in Chapter 4 to describe free fall can be used forprojectile motion. These equations are the same as those equations that were derived inChapter 3, but with a = g. We use g = 9,8 m · s−2 for our calculations.
vi = initial velocity (m·s−1) at t = 0 s
vf = final velocity (m·s−1) at time t
∆x = height above ground (m)
t = time (s)
∆t = time interval (s)
g = acceleration due to gravity (m·s−2)
vf = vi + gt (21.1)
∆x =(vi + vf )
2t (21.2)
∆x = vit +1
2gt2 (21.3)
v2f = v2
i + 2g∆x (21.4)
Worked Example 132: Projectile motion
Question: A ball is thrown upwards with an initial velocity of 10 m·s−1.
1. Determine the maximum height reached above the thrower’s hand.
2. Determine the time it takes the ball to reach its maximum height.
Answer
464

CHAPTER 21. MOTION IN TWO DIMENSIONS - GRADE 12 21.2
Step 1 : Identify what is required and what is given
We are required to determine the maximum height reached by the ball and howlong it takes to reach this height. We are given the initial velocity vi = 10m·s−1and the acceleration due to gravity g = 9,8 m·s−2.
Step 2 : Determine how to approach the problem
Choose down as positive. We know that at the maximum height the velocity of theball is 0 m·s−1. We therefore have the following:
• vi = −10 m · s−1 (it is negative because we chose upwards as positive)
• vf = 0 m · s−1
• g = +9,8 m · s−2
Step 3 : Identify the appropriate equation to determine the height.
We can use:v2
f = v2i + 2g∆x
to solve for the height.
Step 4 : Substitute the values in and find the height.
v2f = v2
i + 2g∆x
(0)2 = (−10)2 + (2)(9,8)(∆x)
−100 = 19,6∆x
∆x = 5,102...m
The value for the displacement will be negative because the displacement isupwards and we have chosen downward as positive (and upward as negative). Theheight will be a positive number, h = 5.10m.
Step 5 : Identify the appropriate equation to determine the time.
We can use:vf = vi + gt
to solve for the time.
Step 6 : Substitute the values in and find the time.
vf = vi + gt
0 = −10 + 9,8t
10 = 9,8t
t = 1,02...s
Step 7 : Write the final answer.
The ball reaches a maximum height of 5,10 m.The ball takes 1,02 s to reach the top.
Worked Example 133: Height of a projectile
Question: A cricketer hits a cricket ball from the ground so that it goes directlyupwards. If the ball takes, 10 s to return to the ground, determine its maximumheight.
Answer
Step 1 : Identify what is required and what is given
We need to find how high the ball goes. We know that it takes 10 seconds to goup and down. We do not know what the initial velocity of the ball (vi) is.Step 2 : Determine how to approach the problem
465

21.2 CHAPTER 21. MOTION IN TWO DIMENSIONS - GRADE 12
A problem like this one can be looked at asif there are two motions. The first is the ballgoing up with an initial velocity and stoppingat the top (final velocity is zero). The secondmotion is the ball falling, its initial velocity iszero and its final velocity is unknown.
vi = ?
vf = 0 m·s−1 vi = 0 m·s−1
vf = ?
g = 9,8 m·s−2
Choose down as positive. We know that at the maximum height, the velocity ofthe ball is 0 m·s−1. We also know that the ball takes the same time to reach itsmaximum height as it takes to travel from its maximum height to the ground. Thistime is half the total time. We therefore have the following for the motion of theball going down:
• t = 5 s, half of the total time
• vtop = vi = 0 m · s−1
• g = 9,8 m · s−2
• ∆x = ?
Step 3 : Find an appropriate equation to useWe are not given the initial velocity of the ball going up and therefore we do nothave the final velocity of the ball coming down. We need to choose an equationthat does not have vf in it. We can use the following equation to solve for ∆x:
∆x = vit +1
2gt2
Step 4 : Substitute values and find the height.
∆x = (0)(5) +1
2(9,8)(5)2
∆x = 0 + 122,5m
height = 122,5m
Step 5 : Write the final answerThe ball reaches a maximum height of 122,5 m.
Exercise: Equations of Motion
1. A cricketer hits a cricket ball straight up into the air. The cricket ball has aninitial velocity of 20 m·s−1.
A What height does the ball reach before it stops to fall back to the ground.
B How long has the ball been in the air for?
2. Zingi throws a tennis ball up into the air. It reaches a height of 80 cm.
A Determine the initial velocity of the tennis ball.
B How long does the ball take to reach its maximum height?
466
CHAPTER 21. MOTION IN TWO DIMENSIONS - GRADE 12 21.2
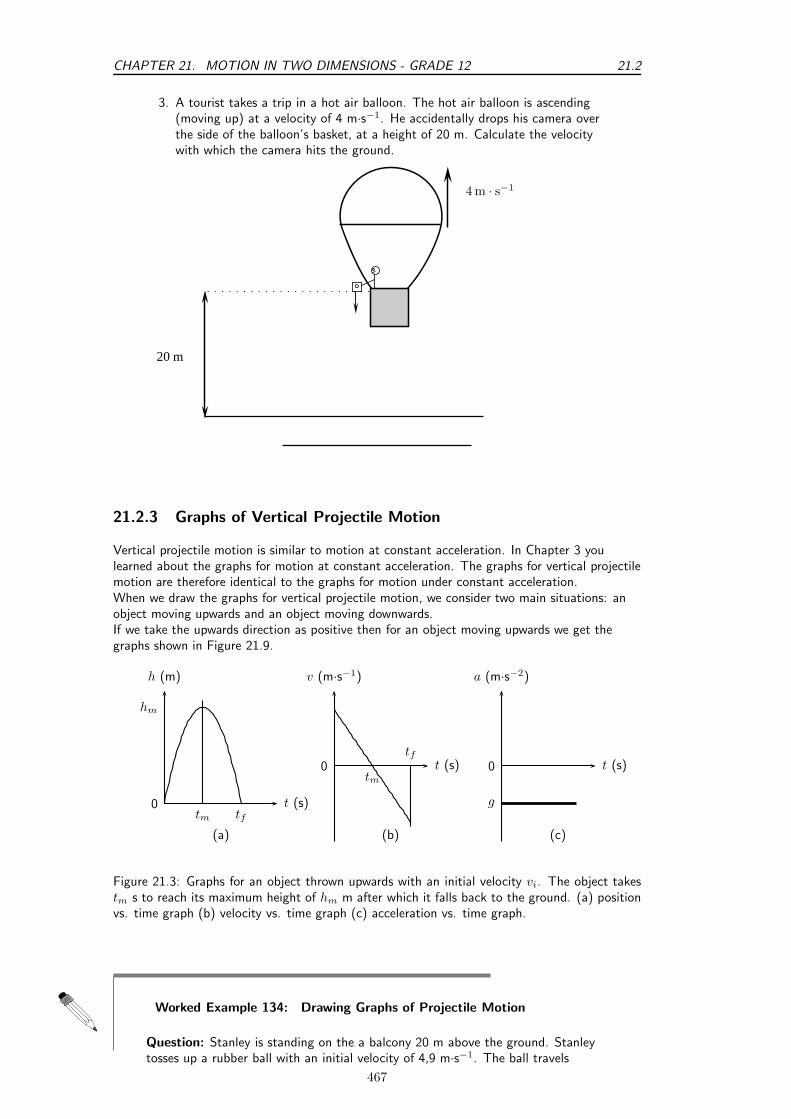
3. A tourist takes a trip in a hot air balloon. The hot air balloon is ascending(moving up) at a velocity of 4 m·s−1. He accidentally drops his camera overthe side of the balloon’s basket, at a height of 20 m. Calculate the velocitywith which the camera hits the ground.
4 m · s−1
20 m
21.2.3 Graphs of Vertical Projectile Motion
Vertical projectile motion is similar to motion at constant acceleration. In Chapter 3 youlearned about the graphs for motion at constant acceleration. The graphs for vertical projectilemotion are therefore identical to the graphs for motion under constant acceleration.When we draw the graphs for vertical projectile motion, we consider two main situations: anobject moving upwards and an object moving downwards.If we take the upwards direction as positive then for an object moving upwards we get thegraphs shown in Figure 21.9.
h (m)
t (s)tm tf
hm
(a)
0
v (m·s−1)
t (s)tm
tf0
(b)
g
a (m·s−2)
t (s)
(c)
0
Figure 21.3: Graphs for an object thrown upwards with an initial velocity vi. The object takestm s to reach its maximum height of hm m after which it falls back to the ground. (a) positionvs. time graph (b) velocity vs. time graph (c) acceleration vs. time graph.
Worked Example 134: Drawing Graphs of Projectile Motion
Question: Stanley is standing on the a balcony 20 m above the ground. Stanleytosses up a rubber ball with an initial velocity of 4,9 m·s−1. The ball travels
467

21.2 CHAPTER 21. MOTION IN TWO DIMENSIONS - GRADE 12
upwards and then falls to the ground. Draw graphs of position vs. time, velocityvs. time and acceleration vs. time. Choose upwards as the positive direction.
Answer
Step 1 : Determine what is required
We are required to draw graphs of
1. ∆x vs. t
2. v vs. t
3. a vs. t
Step 2 : Analysis of problem
There are two parts to the motion of the ball:
1. ball travelling upwards from the building
2. ball falling to the ground
We examine each of these parts separately. Tobe able to draw the graphs, we need to determinethe time taken and displacement for each of themotions.
g = −9,8m·s−2
vi = 4,9m·s−1
vf = 0m·s−1
Step 3 : Find the height and the time taken for the first motion.
For the first part of the motion we have:
• vi = +4,9 m · s−1
• vf = 0 m · s−1
• g = −9,8 m · s−2
Therefore we can use v2f = v2
i + 2g∆x to solve for the height and vf = vi + gt tosolve for the time.
v2f = v2
i + 2g∆x
(0)2 = (4,9)2 + 2 × (−9,8) × ∆x
19,6∆x = (4,9)2
∆x = 1,225 m
vf = vi + gt
0 = 4,9 + (−9,8)× t
9,8t = 4,9
t = 0,5 s
468

CHAPTER 21. MOTION IN TWO DIMENSIONS - GRADE 12 21.2
t = 0,5s∆x = 1,225m
Step 4 : Find the height and the time taken for the second motion.
For the second part of the motion we have:
• vi = 0 m · s−1
• ∆x = −(20 + 1,225) m
• g = −9,8 m · s−2
Therefore we can use ∆x = vit + 1
2gt2 to solve
for the time.
∆x = vit +1
2gt2
−(20 + 1,225) = (0) × t +1
2× (−9,8)× t2
−21,225 = 0 − 4,9t2
t2 = 4,33163...
t = 2,08125... s
20 mg = −9,8 m·s−2
vi = 0 m·s−1
∆x = −21,225 m
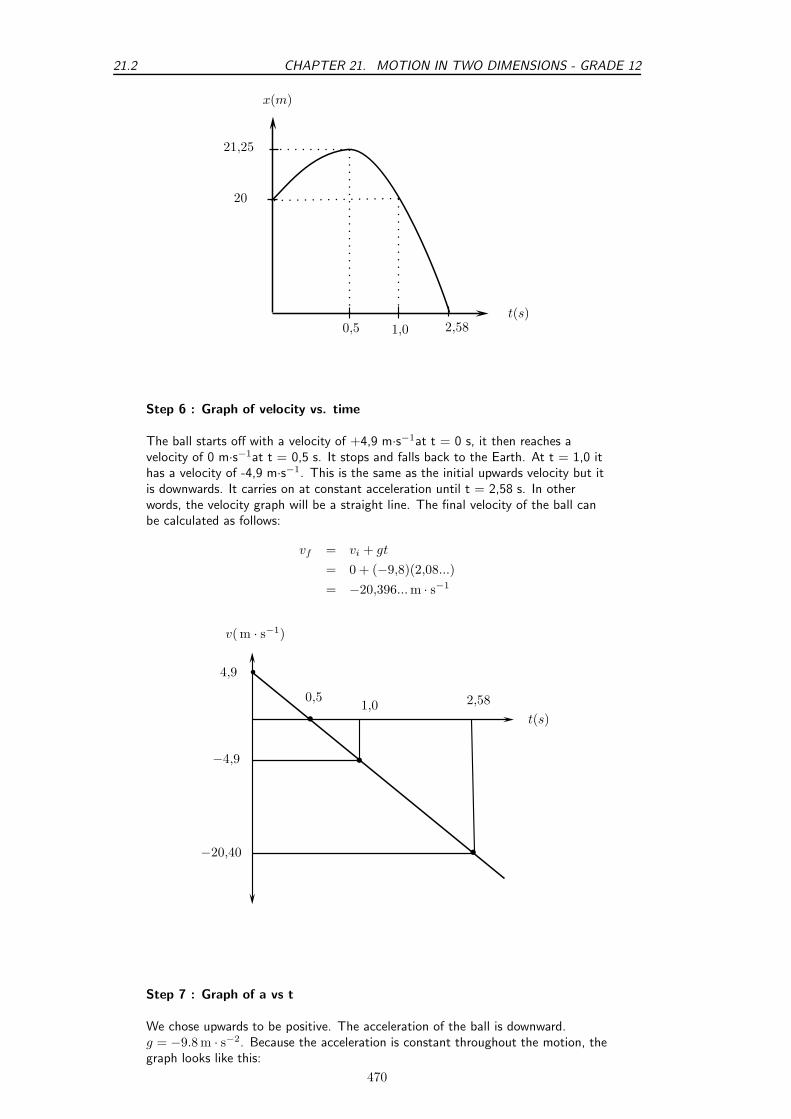
Step 5 : Graph of position vs. time
The ball starts from a position of 20 m (at t = 0 s) from the ground and movesupwards until it reaches (20 + 1,225) m (at t = 0,5 s). It then falls back to 20 m(at t = 0,5 + 0,5 = 1,0 s) and then falls to the ground, ∆ x = 0 m at (t = 0,5 +2,08 = 2,58 s).
469
21.2 CHAPTER 21. MOTION IN TWO DIMENSIONS - GRADE 12
t(s)
x(m)
21,25
20
0,5 1,0 2,58
Step 6 : Graph of velocity vs. time
The ball starts off with a velocity of +4,9 m·s−1at t = 0 s, it then reaches avelocity of 0 m·s−1at t = 0,5 s. It stops and falls back to the Earth. At t = 1,0 ithas a velocity of -4,9 m·s−1. This is the same as the initial upwards velocity but itis downwards. It carries on at constant acceleration until t = 2,58 s. In otherwords, the velocity graph will be a straight line. The final velocity of the ball canbe calculated as follows:
vf = vi + gt
= 0 + (−9,8)(2,08...)
= −20,396... m · s−1
b
b
b t(s)
v(m · s−1)
b4,9
−4,9
−20,40
0,51,0 2,58
Step 7 : Graph of a vs t
We chose upwards to be positive. The acceleration of the ball is downward.g = −9.8 m · s−2. Because the acceleration is constant throughout the motion, thegraph looks like this:
470

CHAPTER 21. MOTION IN TWO DIMENSIONS - GRADE 12 21.2
t(s)
a(m · s−2)
2,58
−9,8
Worked Example 135: Analysing Graphs of Projectile Motion
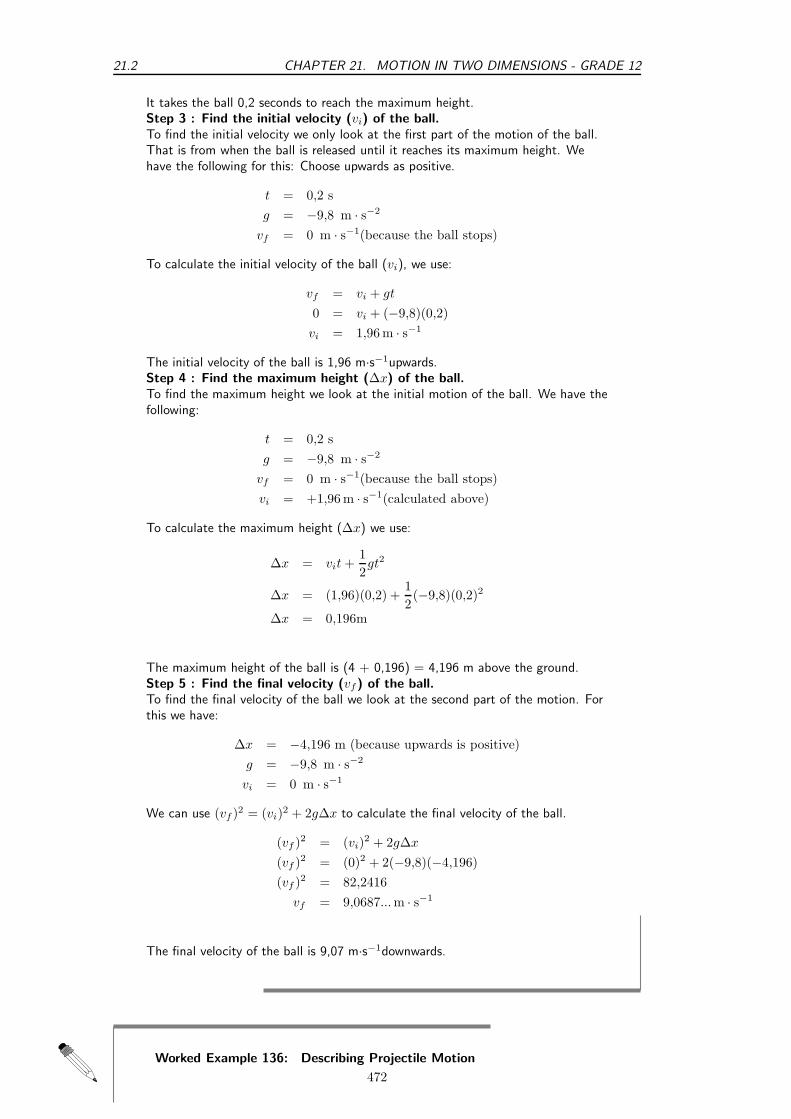
Question: The graph below (not drawn to scale) shows the motion of tennis ballthat was thrown vertically upwards from an open window some distance from theground. It takes the ball 0,2 s to reach its highest point before falling back to theground. Study the graph given and calculate
1. how high the window is above the ground.
2. the time it takes the ball to reach the maximum height.
3. the initial velocity of the ball.
4. the maximum height that the ball reaches.
5. the final velocity of the ball when it reaches the ground.
time (s)
Position (m)
0,2 0,4 ?
1
2
3
4
5
AnswerStep 1 : Find the height of the window.The initial position of the ball will tell us how high the window is. From the y-axison the graph we can see that the ball is 4 m from the ground.The window is therefore 4 m above the ground.Step 2 : Find the time taken to reach the maximum height.The maximum height is where the position-time graph show the maximum position- the top of the curve. This is when t = 0,2 s.
471
21.2 CHAPTER 21. MOTION IN TWO DIMENSIONS - GRADE 12
It takes the ball 0,2 seconds to reach the maximum height.Step 3 : Find the initial velocity (vi) of the ball.To find the initial velocity we only look at the first part of the motion of the ball.That is from when the ball is released until it reaches its maximum height. Wehave the following for this: Choose upwards as positive.
t = 0,2 s
g = −9,8 m · s−2
vf = 0 m · s−1(because the ball stops)
To calculate the initial velocity of the ball (vi), we use:
vf = vi + gt
0 = vi + (−9,8)(0,2)
vi = 1,96 m · s−1
The initial velocity of the ball is 1,96 m·s−1upwards.Step 4 : Find the maximum height (∆x) of the ball.To find the maximum height we look at the initial motion of the ball. We have thefollowing:
t = 0,2 s
g = −9,8 m · s−2
vf = 0 m · s−1(because the ball stops)
vi = +1,96 m · s−1(calculated above)
To calculate the maximum height (∆x) we use:
∆x = vit +1
2gt2
∆x = (1,96)(0,2) +1
2(−9,8)(0,2)2
∆x = 0,196m
The maximum height of the ball is (4 + 0,196) = 4,196 m above the ground.Step 5 : Find the final velocity (vf) of the ball.To find the final velocity of the ball we look at the second part of the motion. Forthis we have:
∆x = −4,196 m (because upwards is positive)
g = −9,8 m · s−2
vi = 0 m · s−1
We can use (vf )2 = (vi)2 + 2g∆x to calculate the final velocity of the ball.
(vf )2 = (vi)2 + 2g∆x
(vf )2 = (0)2 + 2(−9,8)(−4,196)
(vf )2 = 82,2416
vf = 9,0687... m · s−1
The final velocity of the ball is 9,07 m·s−1downwards.
Worked Example 136: Describing Projectile Motion
472

CHAPTER 21. MOTION IN TWO DIMENSIONS - GRADE 12 21.2
Question: A cricketer hits a cricket ball from the ground and the following graphof velocity vs. time was drawn. Upwards was taken as positive. Study the graphand answer the following questions:
1. Describe the motion of the ball according to the graph.
2. Draw a sketch graph of the corresponding displacement-time graph. Label theaxes.
3. Draw a sketch graph of the corresponding acceleration-time graph. Label theaxes.
b
b
b
19,6
-19,6
2 4 time (s)
velo
city
(m·s−
1)
b
b
AnswerStep 1 : Describe the motion of the ball.We need to study the velocity-time graph to answer this question. We will breakthe motion of the ball up into two time zones: t = 0 s to t = 2 s and t = 2 s to t= 4 s.From t = 0 s to t = 2 s the following happens:The ball starts to move at an initial velocity of 19,6 m·s−1and decreases its velocityto 0 m·s−1at t = 2 s. At t = 2 s the velocity of the ball is 0 m·s−1and therefore itstops.From t = 2 s to t = 4 s the following happens:The ball moves from a velocity of 0 m·s−1to 19,6 m·s−1in the opposite direction tothe original motion.If we assume that the ball is hit straight up in the air (and we take upwards aspositive), it reaches its maximum height at t = 2 s, stops, turns around and fallsback to the Earth to reach the ground at t = 4 s.Step 2 : Draw the displacement-time graph.To draw this graph, we need to determine the displacements at t = 2 s and t = 4 s.At t = 2 s:The displacement is equal to the area under the graph:Area under graph = Area of triangleArea = 1
2bh
Area = 1
2× 2 × 19,6
Displacement = 19,6 mAt t = 4 s:The displacement is equal to the area under the whole graph (top and bottom).Remember that an area under the time line must be substracted:Area under graph = Area of triangle 1 + Area of triangle 2Area = 1
2bh + 1
2bh
Area = (1
2× 2 × 19,6) + (1
2× 2 × (-19,6))
Area = 19,6 - 19,6Displacement = 0 mThe displacement-time graph for motion at constant acceleration is a curve. Thegraph will look like this:
473
21.2 CHAPTER 21. MOTION IN TWO DIMENSIONS - GRADE 12
b
b b
19,6
2 4 time (s)
disp
lace
men
t(m
)
b
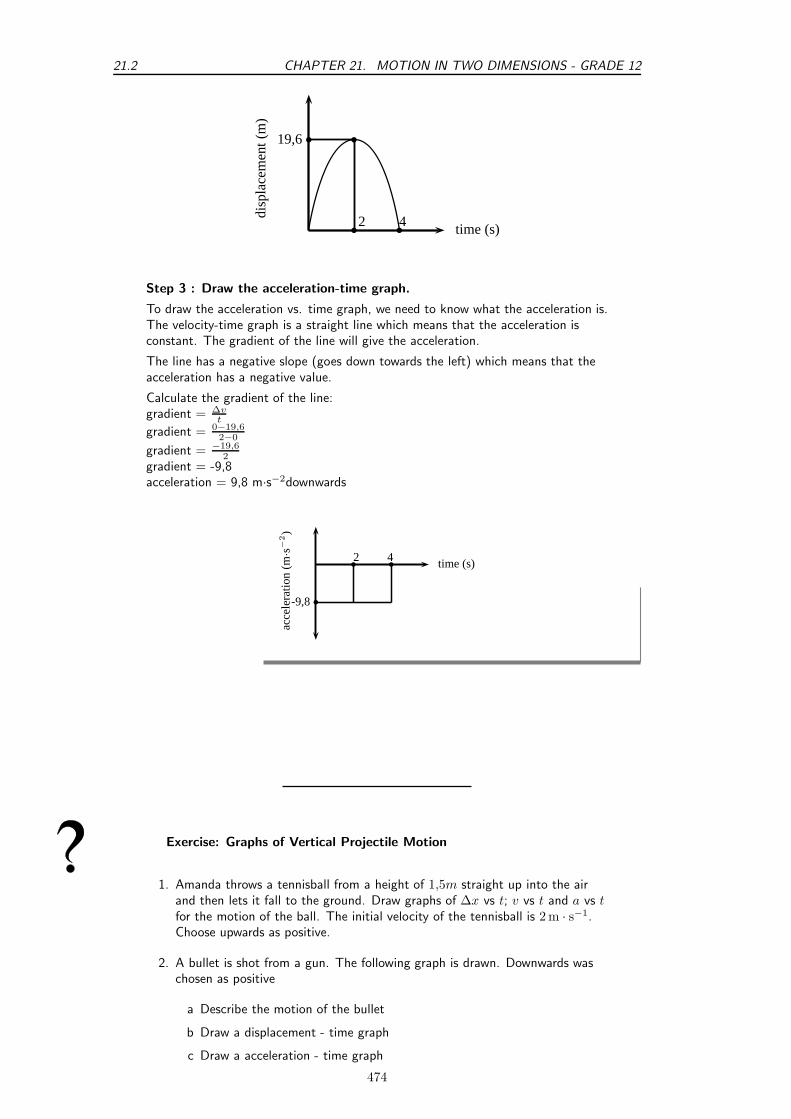
Step 3 : Draw the acceleration-time graph.
To draw the acceleration vs. time graph, we need to know what the acceleration is.The velocity-time graph is a straight line which means that the acceleration isconstant. The gradient of the line will give the acceleration.
The line has a negative slope (goes down towards the left) which means that theacceleration has a negative value.
Calculate the gradient of the line:gradient = ∆v
t
gradient = 0−19,62−0
gradient = −19,62
gradient = -9,8acceleration = 9,8 m·s−2downwards
b
-9,8
2 4 time (s)
acce
lera
tion
(m·s−
2)
b
b
Exercise: Graphs of Vertical Projectile Motion
1. Amanda throws a tennisball from a height of 1,5m straight up into the airand then lets it fall to the ground. Draw graphs of ∆x vs t; v vs t and a vs tfor the motion of the ball. The initial velocity of the tennisball is 2 m · s−1.Choose upwards as positive.
2. A bullet is shot from a gun. The following graph is drawn. Downwards waschosen as positive
a Describe the motion of the bullet
b Draw a displacement - time graph
c Draw a acceleration - time graph
474
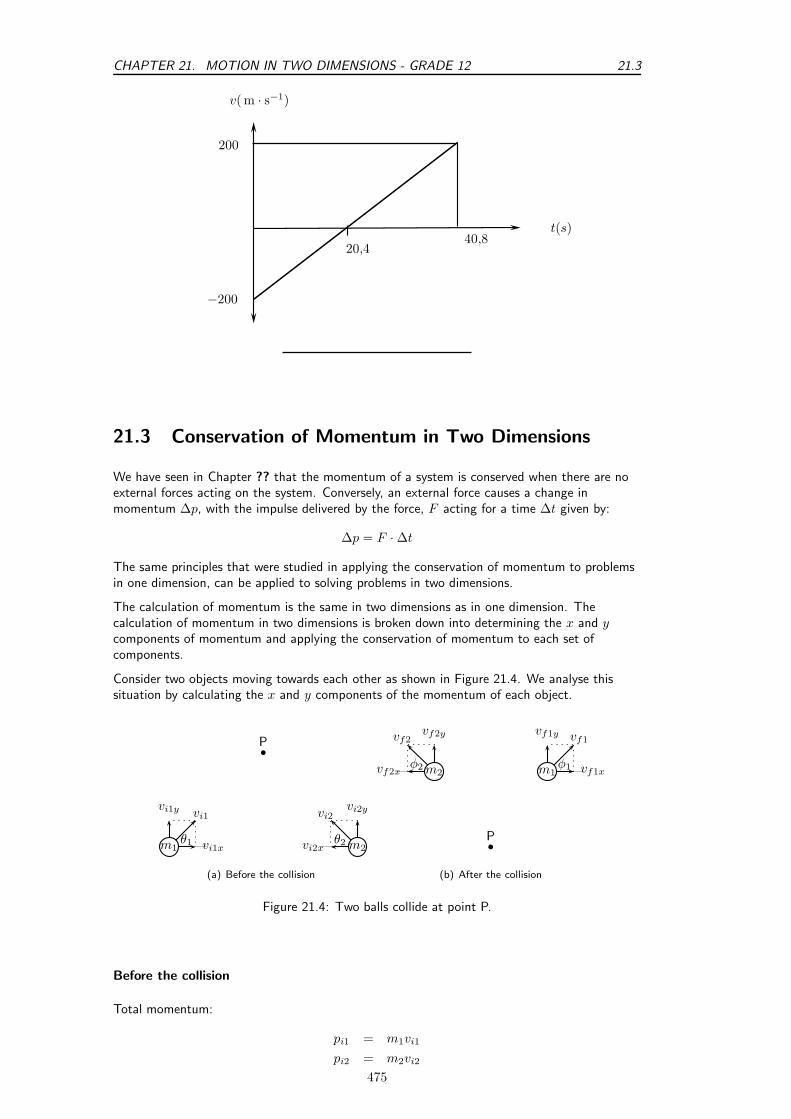
CHAPTER 21. MOTION IN TWO DIMENSIONS - GRADE 12 21.3
t(s)
v(m · s−1)
200
−200
20,440,8
21.3 Conservation of Momentum in Two Dimensions
We have seen in Chapter ?? that the momentum of a system is conserved when there are noexternal forces acting on the system. Conversely, an external force causes a change inmomentum ∆p, with the impulse delivered by the force, F acting for a time ∆t given by:
∆p = F · ∆t
The same principles that were studied in applying the conservation of momentum to problemsin one dimension, can be applied to solving problems in two dimensions.
The calculation of momentum is the same in two dimensions as in one dimension. Thecalculation of momentum in two dimensions is broken down into determining the x and ycomponents of momentum and applying the conservation of momentum to each set ofcomponents.
Consider two objects moving towards each other as shown in Figure 21.4. We analyse thissituation by calculating the x and y components of the momentum of each object.
vi1y
vi1x
vi1
θ1m1
vi2y
vi2x
vi2
θ2 m2
b
P
(a) Before the collision
vf1y
vf1x
vf1
φ1m1
vf2y
vf2x
vf2
φ2 m2
b
P
(b) After the collision
Figure 21.4: Two balls collide at point P.
Before the collision
Total momentum:
pi1 = m1vi1
pi2 = m2vi2
475

21.3 CHAPTER 21. MOTION IN TWO DIMENSIONS - GRADE 12
x-component of momentum:
pi1x = m1vi1x = m1vi1 cos θ1
pi2x = m2ui2x = m2vi2 sin θ2
y-component of momentum:
pi1y = m1vi1y = m1vi1 cos θ1
pi2y = m2vi2y = m2vi2 sin θ2
After the collision
Total momentum:
pf1 = m1vf1
pf2 = m2vf2
x-component of momentum:
pf1x = m1vf1x = m1vf1 cosφ1
pf2x = m2vf2x = m2vf2 sin φ2
y-component of momentum:
pf1y = m1vf1y = m1vf1 cosφ1
pf2y = m2vf2y = m2vf2 sin φ2
Conservation of momentum
The initial momentum is equal to the final momentum:
pi = pf
pi = pi1 + pi2
pf = pf1 + pf2
This forms the basis of analysing momentum conservation problems in two dimensions.
Worked Example 137: 2D Conservation of Momentum
Question: In a rugby game, Player 1 is running with the ball at 5 m·s−1 straightdown the field parallel to the edge of the field. Player 2 runs at 6 m·s−1 an angleof 60 to the edge of the field and tackles Player 1. In the tackle, Player 2 stopscompletely while Player 1 bounces off Player 2. Calculate the velocity (magnitudeand direction) at which Player 1 bounces off Player 2. Both the players have amass of 90 kg.
Answer
Step 1 : Understand what is given and what is being asked
The first step is to draw the picture to work out what the situation is. Mark theinitial velocities of both players in the picture.
476
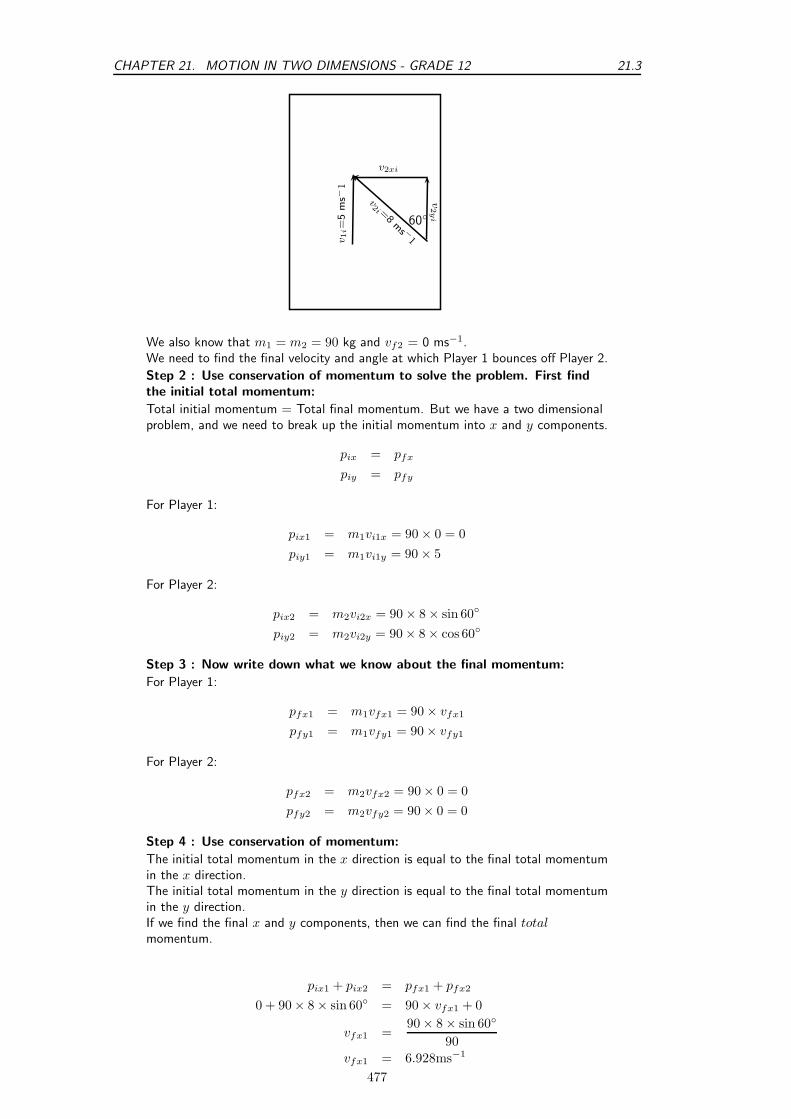
CHAPTER 21. MOTION IN TWO DIMENSIONS - GRADE 12 21.3
60
v1i=
5m
s−1
v2i =
8ms −
1
v2xi
v2y
i
We also know that m1 = m2 = 90 kg and vf2 = 0 ms−1.We need to find the final velocity and angle at which Player 1 bounces off Player 2.
Step 2 : Use conservation of momentum to solve the problem. First findthe initial total momentum:
Total initial momentum = Total final momentum. But we have a two dimensionalproblem, and we need to break up the initial momentum into x and y components.
pix = pfx
piy = pfy
For Player 1:
pix1 = m1vi1x = 90 × 0 = 0
piy1 = m1vi1y = 90 × 5
For Player 2:
pix2 = m2vi2x = 90 × 8 × sin 60
piy2 = m2vi2y = 90 × 8 × cos 60
Step 3 : Now write down what we know about the final momentum:
For Player 1:
pfx1 = m1vfx1 = 90 × vfx1
pfy1 = m1vfy1 = 90 × vfy1
For Player 2:
pfx2 = m2vfx2 = 90 × 0 = 0
pfy2 = m2vfy2 = 90 × 0 = 0
Step 4 : Use conservation of momentum:
The initial total momentum in the x direction is equal to the final total momentumin the x direction.The initial total momentum in the y direction is equal to the final total momentumin the y direction.If we find the final x and y components, then we can find the final totalmomentum.
pix1 + pix2 = pfx1 + pfx2
0 + 90 × 8 × sin 60 = 90 × vfx1 + 0
vfx1 =90 × 8 × sin 60
90
vfx1 = 6.928ms−1
477
21.3 CHAPTER 21. MOTION IN TWO DIMENSIONS - GRADE 12
piy1 + piy2 = pfy1 + pfy2
90 × 5 + 90 × 8 × cos 60 = 90 × vfy1 + 0
vfy1 =90 × 5 + 90 × 8 × cos 60
90
vfy1 = 9.0ms−1
Step 5 : Using the x and y components, calculate the final total vUse Pythagoras’s theorem to find the total final velocity:
θ
vfx1
vf
y1
vfto
t
vftot =√
v2fx1
+ v2fx2
=√
6.9282 + 92
= 11.36
Calculate the angle θ to find the direction of Player 1’s final velocity:
sin θ =vfxy1
vftot
θ = 52.4
Therefore Player 1 bounces off Player 2 with a final velocity of 11.36 m·s−1 at anangle of 52.4 from the horizontal.
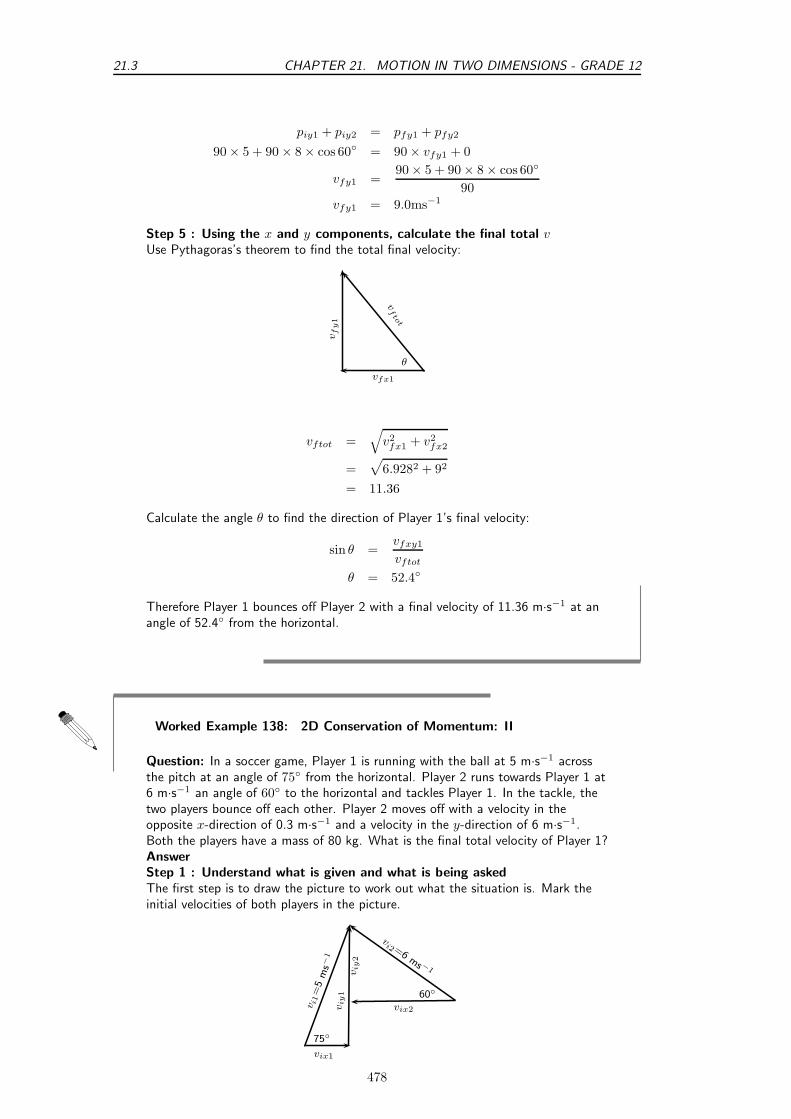
Worked Example 138: 2D Conservation of Momentum: II
Question: In a soccer game, Player 1 is running with the ball at 5 m·s−1 acrossthe pitch at an angle of 75 from the horizontal. Player 2 runs towards Player 1 at6 m·s−1 an angle of 60 to the horizontal and tackles Player 1. In the tackle, thetwo players bounce off each other. Player 2 moves off with a velocity in theopposite x-direction of 0.3 m·s−1 and a velocity in the y-direction of 6 m·s−1.Both the players have a mass of 80 kg. What is the final total velocity of Player 1?AnswerStep 1 : Understand what is given and what is being askedThe first step is to draw the picture to work out what the situation is. Mark theinitial velocities of both players in the picture.
75
60
vix1
vix2
viy
2
viy
1
vi1
=5
ms−
1
vi2=6
ms −1
478
CHAPTER 21. MOTION IN TWO DIMENSIONS - GRADE 12 21.3
We also know that m1 = m2 = 80 kg. And vfx2=-0.3 ms−1 and vfy2=6 ms−1.We need to find the final velocity and angle at which Player 1 bounces off Player 2.
Step 2 : Use conservation of momentum to solve the problem. First findthe initial total momentum:
Total initial momentum = Total final momentum. But we have a two dimensionalproblem, and we need to break up the initial momentum into x and y components.
pix = pfx
piy = pfy
For Player 1:
pix1 = m1vi1x = 80 × 5 × cos 75
piy1 = m1vi1y = 80 × 5 × sin 75
For Player 2:
pix2 = m2vi2x = 80 × 6 × cos 60
piy2 = m2vi2y = 80 × 6 × sin 60
Step 3 : Now write down what we know about the final momentum:
For Player 1:
pfx1 = m1vfx1 = 80 × vfx1
pfy1 = m1vfy1 = 80 × vfy1
For Player 2:
pfx2 = m2vfx2 = 80 × (−0.3)× cos 60
pfy2 = m2vfy2 = 80 × 6 × sin 60
Step 4 : Use conservation of momentum:
The initial total momentum in the x direction is equal to the final total momentumin the x direction.The initial total momentum in the y direction is equal to the final total momentumin the y direction.If we find the final x and y components, then we can find the final totalmomentum.
pix1 + pix2 = pfx1 + pfx2
80 × 5 cos 75 + 80 × cos 60 = 80 × vfx1 + 80 × (−0.3)
vfx1 =80 × 5 cos 75 + 80 × cos 60 + 80 × (−0.3)
80
vfx1 = 2.0ms−1
piy1 + piy2 = pfy1 + pfy2
80 × 5 sin 75 + 80 × sin 60 = 80 × vfy1 + 80 × 6
vfy1 =80 × 5 sin 75 + 80 × sin 60 − 80 × 6
80
vfy1 = 4.0ms−1
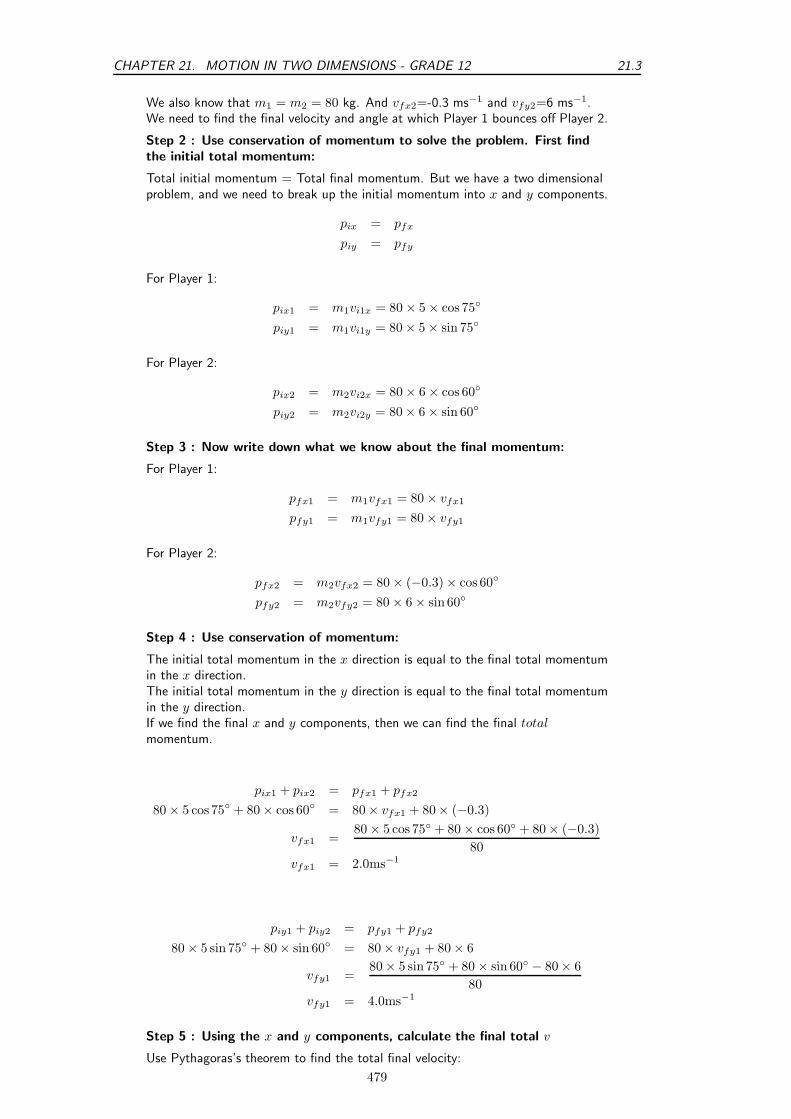
Step 5 : Using the x and y components, calculate the final total v
Use Pythagoras’s theorem to find the total final velocity:
479
21.4 CHAPTER 21. MOTION IN TWO DIMENSIONS - GRADE 12
θ
vfx1
vf
y1
vfto
t
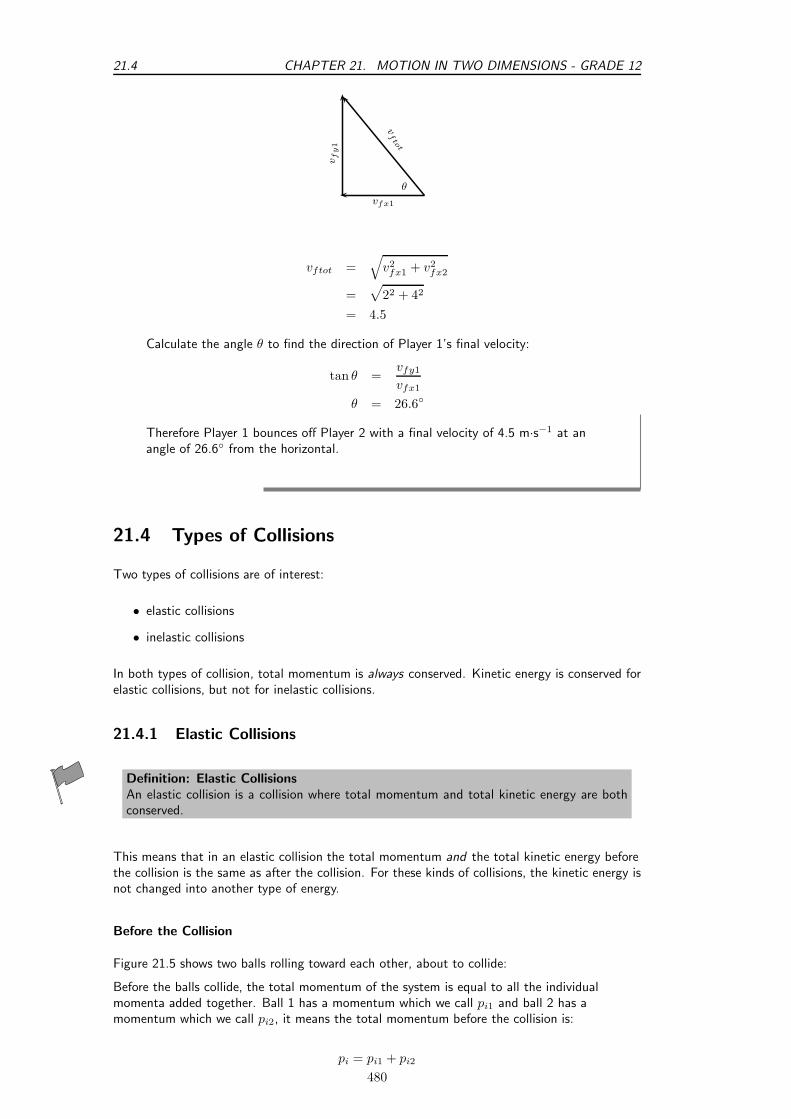
vftot =√
v2fx1
+ v2fx2
=√
22 + 42
= 4.5
Calculate the angle θ to find the direction of Player 1’s final velocity:
tan θ =vfy1
vfx1
θ = 26.6
Therefore Player 1 bounces off Player 2 with a final velocity of 4.5 m·s−1 at anangle of 26.6 from the horizontal.
21.4 Types of Collisions
Two types of collisions are of interest:
• elastic collisions
• inelastic collisions
In both types of collision, total momentum is always conserved. Kinetic energy is conserved forelastic collisions, but not for inelastic collisions.
21.4.1 Elastic Collisions
Definition: Elastic CollisionsAn elastic collision is a collision where total momentum and total kinetic energy are bothconserved.
This means that in an elastic collision the total momentum and the total kinetic energy beforethe collision is the same as after the collision. For these kinds of collisions, the kinetic energy isnot changed into another type of energy.
Before the Collision
Figure 21.5 shows two balls rolling toward each other, about to collide:
Before the balls collide, the total momentum of the system is equal to all the individualmomenta added together. Ball 1 has a momentum which we call pi1 and ball 2 has amomentum which we call pi2, it means the total momentum before the collision is:
pi = pi1 + pi2
480

CHAPTER 21. MOTION IN TWO DIMENSIONS - GRADE 12 21.4
1pi1, KEi1
2pi2, KEi2
Figure 21.5: Two balls before they collide.
We calculate the total kinetic energy of the system in the same way. Ball 1 has a kinetic energywhich we call KEi1 and the ball 2 has a kinetic energy which we call KEi2, it means that thetotal kinetic energy before the collision is:
KEi = KEi1 + KEi2
After the Collision
Figure 21.6 shows two balls after they have collided:
1pf1, KEf1
2pf2, KEf2
Figure 21.6: Two balls after they collide.
After the balls collide and bounce off each other, they have new momenta and new kineticenergies. Like before, the total momentum of the system is equal to all the individual momentaadded together. Ball 1 now has a momentum which we call pf1 and ball 2 now has amomentum which we call pf2, it means the total momentum after the collision is
pf = pf1 + pf2
Ball 1 now has a kinetic energy which we call KEf1 and ball 2 now has a kinetic energy whichwe call KEf2, it means that the total kinetic energy after the collision is:
KEf = KEf1 + KEf2
Since this is an elastic collision, the total momentum before the collision equals the totalmomentum after the collision and the total kinetic energy before the collision equals the totalkinetic energy after the collision. Therefore:
Initial Final
pi = pf (21.5)
pi1 + pi2 = pf1 + pf2
and
KEi = KEf (21.6)
KEi1 + KEi2 = KEf1 + KEf2
Worked Example 139: An Elastic Collision
Question: Consider a collision between two pool balls. Ball 1 is at rest and ball 2is moving towards it with a speed of 2 m·s−1. The mass of each ball is 0.3 kg.After the balls collide elastically, ball 2 comes to an immediate stop and ball 1moves off. What is the final velocity of ball 1?
481

21.4 CHAPTER 21. MOTION IN TWO DIMENSIONS - GRADE 12
AnswerStep 1 : Determine how to approach the problemWe are given:
• mass of ball 1, m1 = 0.3 kg
• mass of ball 2, m2 = 0.3 kg
• initial velocity of ball 1, vi1 = 0 m·s−1
• initial velocity of ball 2, vi2 = 2 m·s−1
• final velocity of ball 2, vf2 = 0 m·s−1
• the collision is elastic
All quantities are in SI units. We are required to determine the final velocity of ball1, vf1. Since the collision is elastic, we know that
• momentum is conserved, m1vi1 + m2vi2 = m1vf1 + m2vf2
• energy is conserved, 1
2(m1v
2i1 + m2v
2i2 = m1v
2f1 + m2v
2f2)
Step 2 : Choose a frame of referenceChoose to the right as positive.Step 3 : Draw a rough sketch of the situation
2
m2, vi2
1
m1, vi1
2
m2, vf2
1
m1, vf1
Before collision After collision
Step 4 : Solve the problemMomentum is conserved. Therefore:
pi = pf
m1vi1 + m2vi2 = m1vf1 + m2vf2
(0,3)(0) + (0,3)(2) = (0,3)vf1 + 0
vf1 = 2 m · s−1
Step 5 : Quote the final answerThe final velocity of ball 1 is 2 m·s−1in the same direction as ball 2.
Worked Example 140: Another Elastic Collision
Question: Consider two 2 marbles. Marble 1 has mass 50 g and marble 2 hasmass 100 g. Edward rolls marble 2 along the ground towards marble 1 in thepositive x-direction. Marble 1 is initially at rest and marble 2 has a velocity of 3m·s−1 in the positive x-direction. After they collide elastically, both marbles aremoving. What is the final velocity of each marble?AnswerStep 1 : Decide how to approach the problemWe are given:
• mass of marble 1, m1=50 g
• mass of marble 2, m2=100 g
• initial velocity of marble 1, vi1=0 m·s−1
• initial velocity of marble 2, vi2=3 m·s−1
• the collision is elastic
482
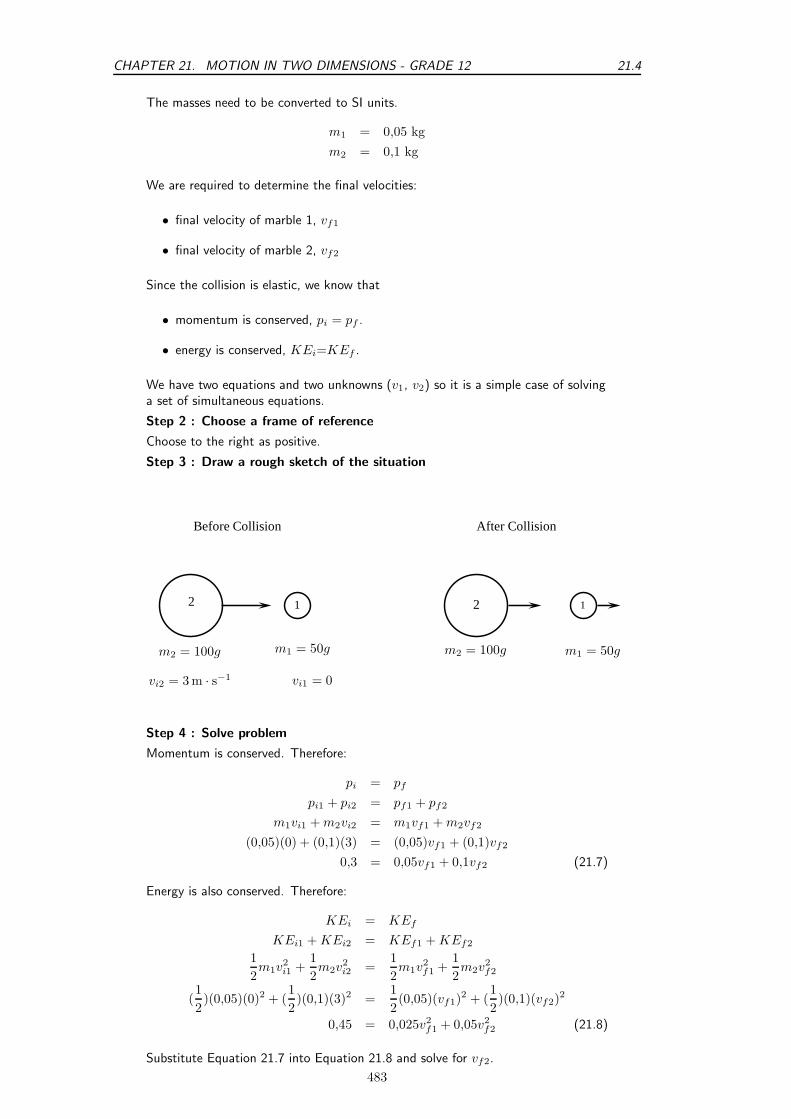
CHAPTER 21. MOTION IN TWO DIMENSIONS - GRADE 12 21.4
The masses need to be converted to SI units.
m1 = 0,05 kg
m2 = 0,1 kg
We are required to determine the final velocities:
• final velocity of marble 1, vf1
• final velocity of marble 2, vf2
Since the collision is elastic, we know that
• momentum is conserved, pi = pf .
• energy is conserved, KEi=KEf .
We have two equations and two unknowns (v1, v2) so it is a simple case of solvinga set of simultaneous equations.
Step 2 : Choose a frame of reference
Choose to the right as positive.
Step 3 : Draw a rough sketch of the situation
2 21 1
Before Collision After Collision
m2 = 100g
vi2 = 3 m · s−1
m1 = 50g
vi1 = 0
m2 = 100g m1 = 50g
Step 4 : Solve problem
Momentum is conserved. Therefore:
pi = pf
pi1 + pi2 = pf1 + pf2
m1vi1 + m2vi2 = m1vf1 + m2vf2
(0,05)(0) + (0,1)(3) = (0,05)vf1 + (0,1)vf2
0,3 = 0,05vf1 + 0,1vf2 (21.7)
Energy is also conserved. Therefore:
KEi = KEf
KEi1 + KEi2 = KEf1 + KEf2
1
2m1v
2i1 +
1
2m2v
2i2 =
1
2m1v
2f1 +
1
2m2v
2f2
(1
2)(0,05)(0)2 + (
1
2)(0,1)(3)2 =
1
2(0,05)(vf1)
2 + (1
2)(0,1)(vf2)
2
0,45 = 0,025v2f1 + 0,05v2
f2 (21.8)
Substitute Equation 21.7 into Equation 21.8 and solve for vf2.
483
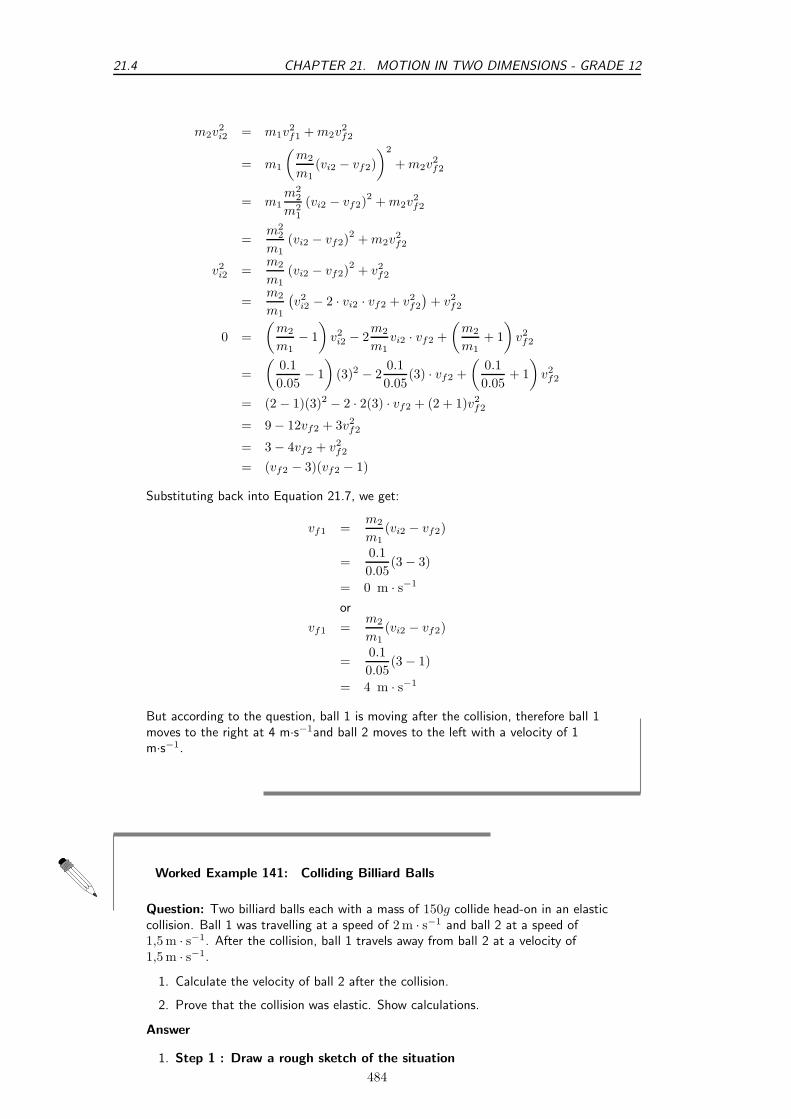
21.4 CHAPTER 21. MOTION IN TWO DIMENSIONS - GRADE 12
m2v2i2 = m1v
2f1 + m2v
2f2
= m1
(
m2
m1
(vi2 − vf2)
)2
+ m2v2f2
= m1
m22
m21
(vi2 − vf2)2 + m2v
2f2
=m2
2
m1
(vi2 − vf2)2 + m2v
2f2
v2i2 =
m2
m1
(vi2 − vf2)2+ v2
f2
=m2
m1
(
v2i2 − 2 · vi2 · vf2 + v2
f2
)
+ v2f2
0 =
(
m2
m1
− 1
)
v2i2 − 2
m2
m1
vi2 · vf2 +
(
m2
m1
+ 1
)
v2f2
=
(
0.1
0.05− 1
)
(3)2 − 20.1
0.05(3) · vf2 +
(
0.1
0.05+ 1
)
v2f2
= (2 − 1)(3)2 − 2 · 2(3) · vf2 + (2 + 1)v2f2
= 9 − 12vf2 + 3v2f2
= 3 − 4vf2 + v2f2
= (vf2 − 3)(vf2 − 1)
Substituting back into Equation 21.7, we get:
vf1 =m2
m1
(vi2 − vf2)
=0.1
0.05(3 − 3)
= 0 m · s−1
or
vf1 =m2
m1
(vi2 − vf2)
=0.1
0.05(3 − 1)
= 4 m · s−1
But according to the question, ball 1 is moving after the collision, therefore ball 1moves to the right at 4 m·s−1and ball 2 moves to the left with a velocity of 1m·s−1.
Worked Example 141: Colliding Billiard Balls
Question: Two billiard balls each with a mass of 150g collide head-on in an elasticcollision. Ball 1 was travelling at a speed of 2 m · s−1 and ball 2 at a speed of1,5 m · s−1. After the collision, ball 1 travels away from ball 2 at a velocity of1,5 m · s−1.
1. Calculate the velocity of ball 2 after the collision.
2. Prove that the collision was elastic. Show calculations.
Answer
1. Step 1 : Draw a rough sketch of the situation
484
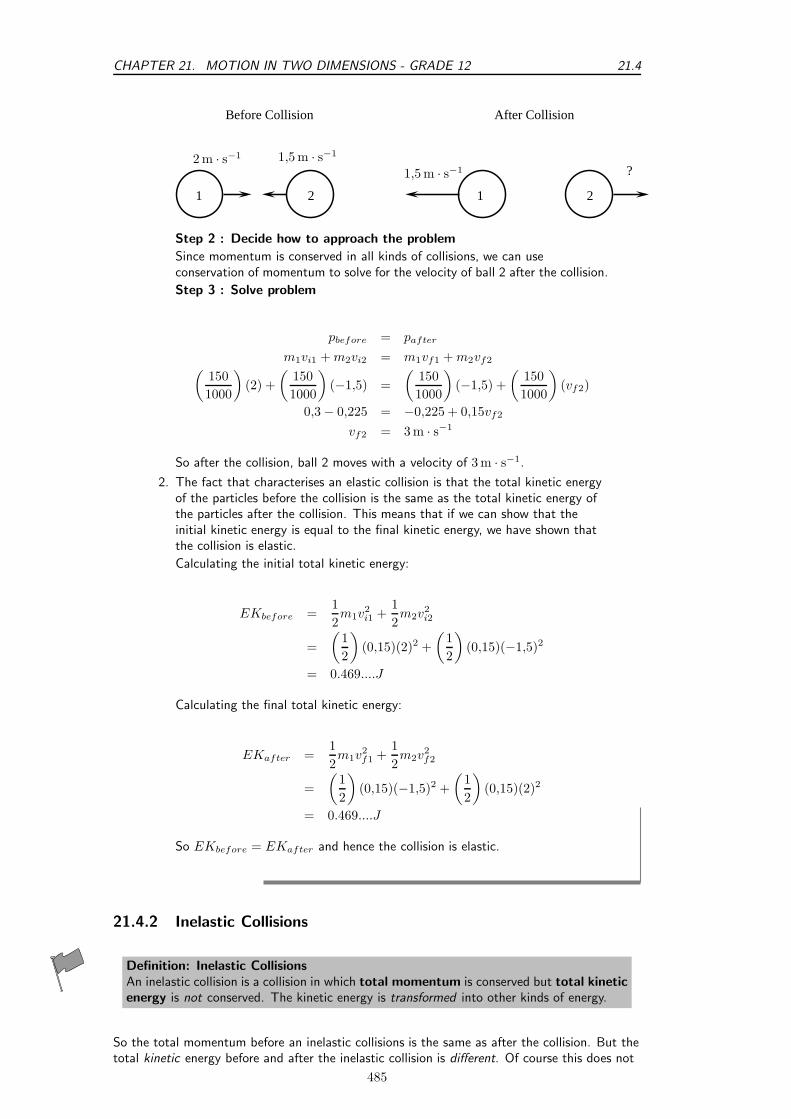
CHAPTER 21. MOTION IN TWO DIMENSIONS - GRADE 12 21.4
1 2 1 2
Before Collision After Collision
?1,5 m · s−1
2 m · s−1 1,5 m · s−1
Step 2 : Decide how to approach the problem
Since momentum is conserved in all kinds of collisions, we can useconservation of momentum to solve for the velocity of ball 2 after the collision.
Step 3 : Solve problem
pbefore = pafter
m1vi1 + m2vi2 = m1vf1 + m2vf2(
150
1000
)
(2) +
(
150
1000
)
(−1,5) =
(
150
1000
)
(−1,5) +
(
150
1000
)
(vf2)
0,3 − 0,225 = −0,225 + 0,15vf2
vf2 = 3 m · s−1
So after the collision, ball 2 moves with a velocity of 3 m · s−1.
2. The fact that characterises an elastic collision is that the total kinetic energyof the particles before the collision is the same as the total kinetic energy ofthe particles after the collision. This means that if we can show that theinitial kinetic energy is equal to the final kinetic energy, we have shown thatthe collision is elastic.
Calculating the initial total kinetic energy:
EKbefore =1
2m1v
2i1 +
1
2m2v
2i2
=
(
1
2
)
(0,15)(2)2 +
(
1
2
)
(0,15)(−1,5)2
= 0.469....J
Calculating the final total kinetic energy:
EKafter =1
2m1v
2f1 +
1
2m2v
2f2
=
(
1
2
)
(0,15)(−1,5)2 +
(
1
2
)
(0,15)(2)2
= 0.469....J
So EKbefore = EKafter and hence the collision is elastic.
21.4.2 Inelastic Collisions
Definition: Inelastic CollisionsAn inelastic collision is a collision in which total momentum is conserved but total kineticenergy is not conserved. The kinetic energy is transformed into other kinds of energy.
So the total momentum before an inelastic collisions is the same as after the collision. But thetotal kinetic energy before and after the inelastic collision is different. Of course this does not
485

21.4 CHAPTER 21. MOTION IN TWO DIMENSIONS - GRADE 12
mean that total energy has not been conserved, rather the energy has been transformed intoanother type of energy.
As a rule of thumb, inelastic collisions happen when the colliding objects are distorted in someway. Usually they change their shape. The modification of the shape of an object requiresenergy and this is where the “missing” kinetic energy goes. A classic example of an inelasticcollision is a motor car accident. The cars change shape and there is a noticeable change in thekinetic energy of the cars before and after the collision. This energy was used to bend themetal and deform the cars. Another example of an inelastic collision is shown in Figure 21.7.
pim, KEim pia, KEia
Before collision
pf , KEf
After collision
Figure 21.7: Asteroid moving towards the Moon.
An asteroid is moving through space towards the Moon. Before the asteroid crashes into theMoon, the total momentum of the system is:
pi = pim + pia
The total kinetic energy of the system is:
KEi = KEim + KEia
When the asteroid collides inelastically with the Moon, its kinetic energy is transformedmostly into heat energy. If this heat energy is large enough, it can cause the asteroid and thearea of the Moon’s surface that it hits, to melt into liquid rock! From the force of impact ofthe asteroid, the molten rock flows outwards to form a crater on the Moon.
After the collision, the total momentum of the system will be the same as before. But sincethis collision is inelastic, (and you can see that a change in the shape of objects has takenplace!), total kinetic energy is not the same as before the collision.Momentum is conserved:
pi = pf
But the total kinetic energy of the system is not conserved:
KEi 6= KEf
Worked Example 142: An Inelastic Collision
Question: Consider the collision of two cars. Car 1 is at rest and Car 2 is movingat a speed of 2 m·s−1 in the negative x-direction. Both cars each have a mass of500 kg. The cars collide inelastically and stick together. What is the resultingvelocity of the resulting mass of metal?AnswerStep 1 : Draw a rough sketch of the situation
Car 1
pi1 = 0
Car 2
pi2
Before collision
Car 1 Car 2
After collision
pf
Step 2 : Determine how to approach the problemWe are given:
486
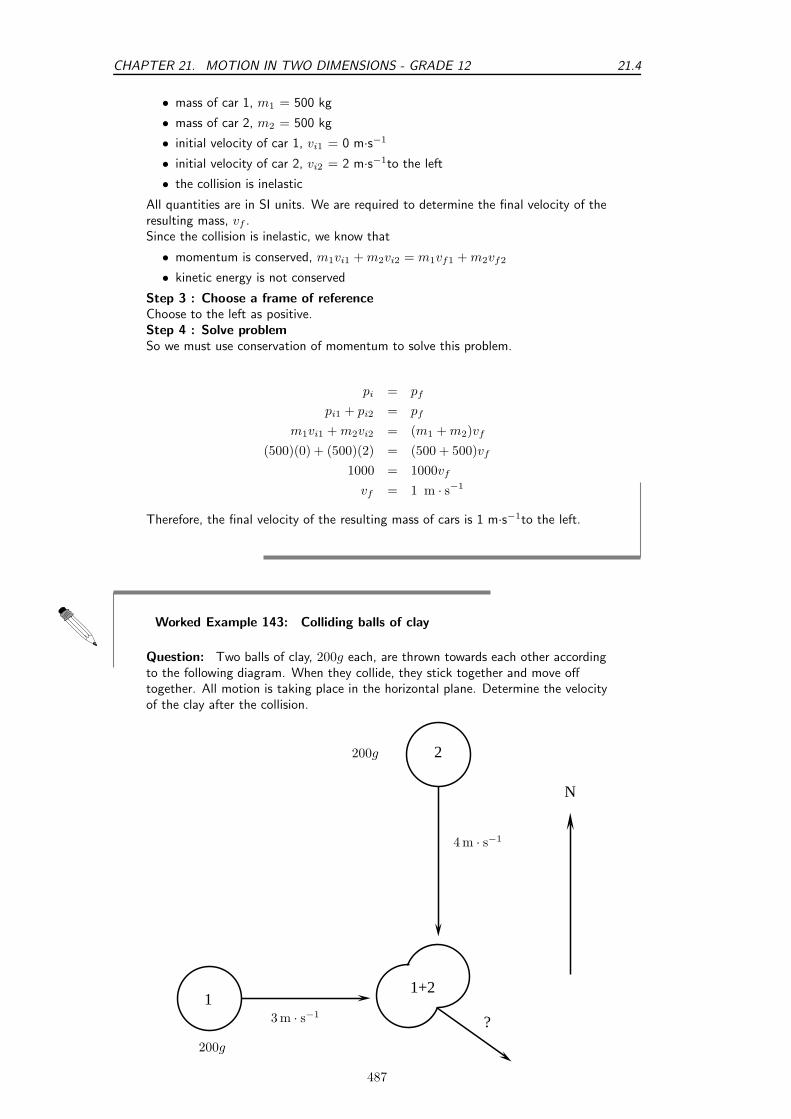
CHAPTER 21. MOTION IN TWO DIMENSIONS - GRADE 12 21.4
• mass of car 1, m1 = 500 kg
• mass of car 2, m2 = 500 kg
• initial velocity of car 1, vi1 = 0 m·s−1
• initial velocity of car 2, vi2 = 2 m·s−1to the left
• the collision is inelastic
All quantities are in SI units. We are required to determine the final velocity of theresulting mass, vf .Since the collision is inelastic, we know that
• momentum is conserved, m1vi1 + m2vi2 = m1vf1 + m2vf2
• kinetic energy is not conserved
Step 3 : Choose a frame of referenceChoose to the left as positive.Step 4 : Solve problemSo we must use conservation of momentum to solve this problem.
pi = pf
pi1 + pi2 = pf
m1vi1 + m2vi2 = (m1 + m2)vf
(500)(0) + (500)(2) = (500 + 500)vf
1000 = 1000vf
vf = 1 m · s−1
Therefore, the final velocity of the resulting mass of cars is 1 m·s−1to the left.
Worked Example 143: Colliding balls of clay
Question: Two balls of clay, 200g each, are thrown towards each other accordingto the following diagram. When they collide, they stick together and move offtogether. All motion is taking place in the horizontal plane. Determine the velocityof the clay after the collision.
2200g
4 m · s−1
1
200g
3 m · s−1
1+2
N
?
487
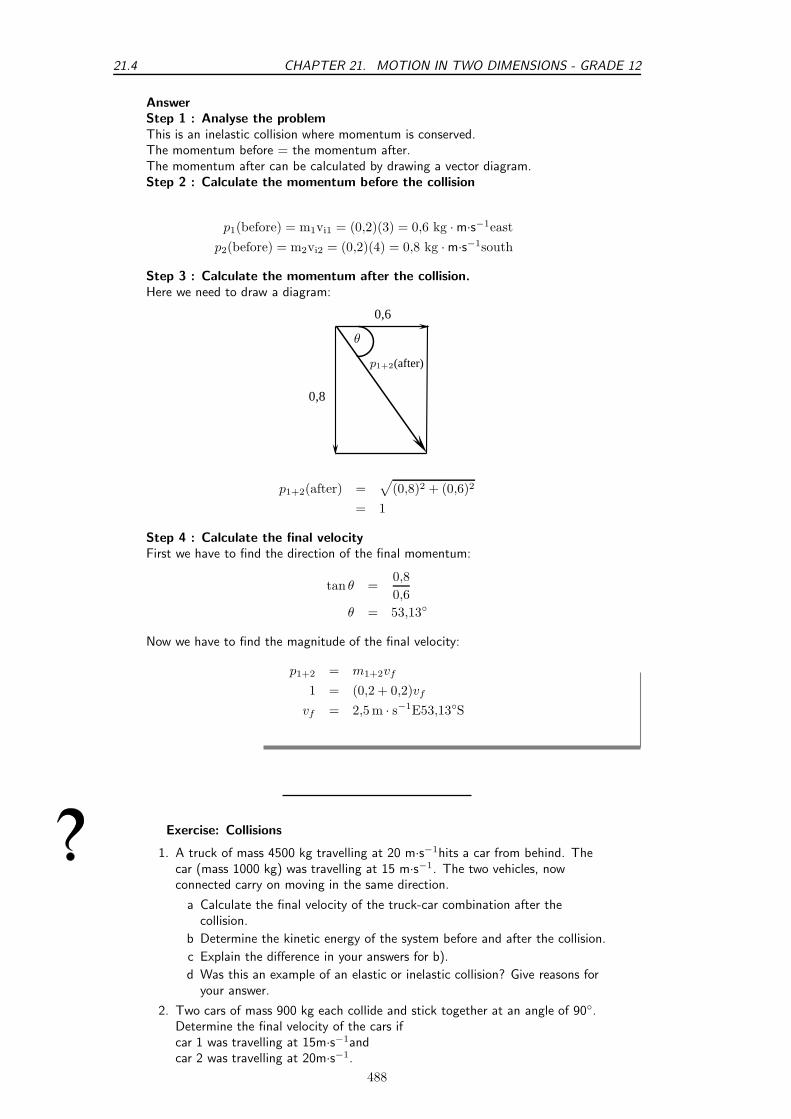
21.4 CHAPTER 21. MOTION IN TWO DIMENSIONS - GRADE 12
AnswerStep 1 : Analyse the problemThis is an inelastic collision where momentum is conserved.The momentum before = the momentum after.The momentum after can be calculated by drawing a vector diagram.Step 2 : Calculate the momentum before the collision
p1(before) = m1vi1 = (0,2)(3) = 0,6 kg · m·s−1east
p2(before) = m2vi2 = (0,2)(4) = 0,8 kg · m·s−1south
Step 3 : Calculate the momentum after the collision.Here we need to draw a diagram:
θ
0,6
0,8
p1+2(after)
p1+2(after) =√
(0,8)2 + (0,6)2
= 1
Step 4 : Calculate the final velocityFirst we have to find the direction of the final momentum:
tan θ =0,8
0,6
θ = 53,13
Now we have to find the magnitude of the final velocity:
p1+2 = m1+2vf
1 = (0,2 + 0,2)vf
vf = 2,5 m · s−1E53,13S
Exercise: Collisions
1. A truck of mass 4500 kg travelling at 20 m·s−1hits a car from behind. Thecar (mass 1000 kg) was travelling at 15 m·s−1. The two vehicles, nowconnected carry on moving in the same direction.
a Calculate the final velocity of the truck-car combination after thecollision.
b Determine the kinetic energy of the system before and after the collision.
c Explain the difference in your answers for b).
d Was this an example of an elastic or inelastic collision? Give reasons foryour answer.
2. Two cars of mass 900 kg each collide and stick together at an angle of 90.Determine the final velocity of the cars ifcar 1 was travelling at 15m·s−1andcar 2 was travelling at 20m·s−1.
488
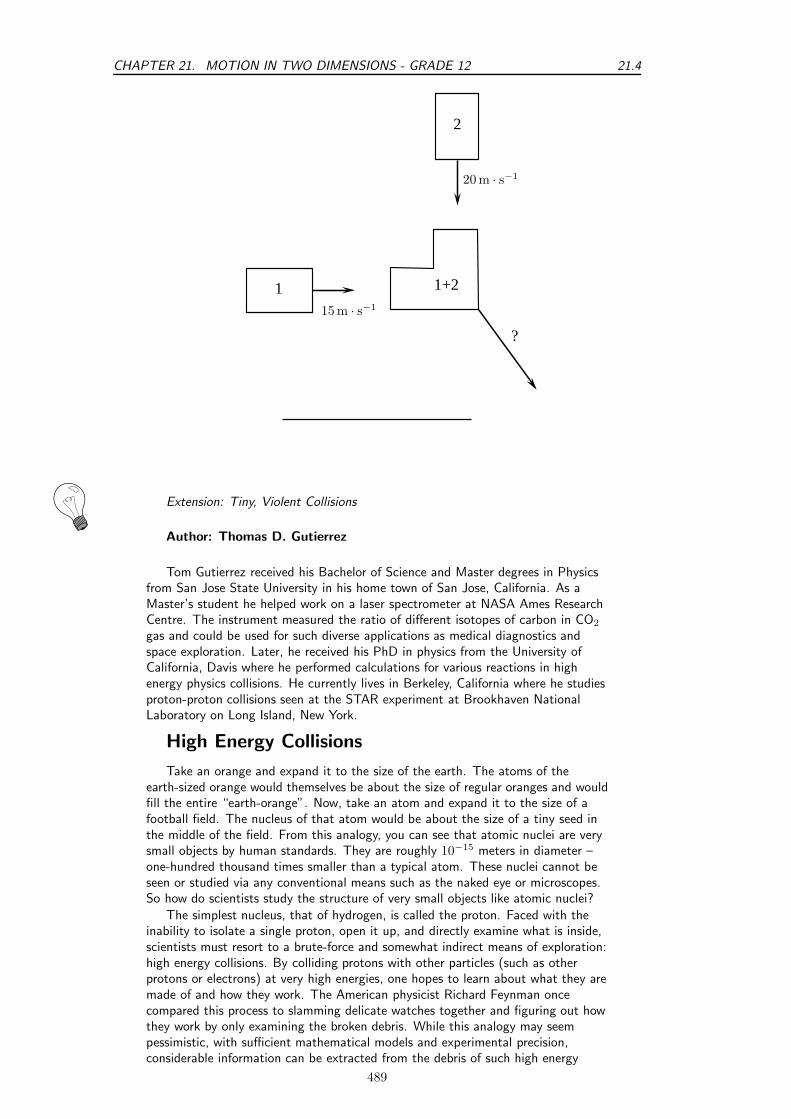
CHAPTER 21. MOTION IN TWO DIMENSIONS - GRADE 12 21.4
2
20 m · s−1
15 m · s−1
1
?
1+2
Extension: Tiny, Violent Collisions
Author: Thomas D. Gutierrez
Tom Gutierrez received his Bachelor of Science and Master degrees in Physicsfrom San Jose State University in his home town of San Jose, California. As aMaster’s student he helped work on a laser spectrometer at NASA Ames ResearchCentre. The instrument measured the ratio of different isotopes of carbon in CO2
gas and could be used for such diverse applications as medical diagnostics andspace exploration. Later, he received his PhD in physics from the University ofCalifornia, Davis where he performed calculations for various reactions in highenergy physics collisions. He currently lives in Berkeley, California where he studiesproton-proton collisions seen at the STAR experiment at Brookhaven NationalLaboratory on Long Island, New York.
High Energy Collisions
Take an orange and expand it to the size of the earth. The atoms of theearth-sized orange would themselves be about the size of regular oranges and wouldfill the entire “earth-orange”. Now, take an atom and expand it to the size of afootball field. The nucleus of that atom would be about the size of a tiny seed inthe middle of the field. From this analogy, you can see that atomic nuclei are verysmall objects by human standards. They are roughly 10−15 meters in diameter –one-hundred thousand times smaller than a typical atom. These nuclei cannot beseen or studied via any conventional means such as the naked eye or microscopes.So how do scientists study the structure of very small objects like atomic nuclei?
The simplest nucleus, that of hydrogen, is called the proton. Faced with theinability to isolate a single proton, open it up, and directly examine what is inside,scientists must resort to a brute-force and somewhat indirect means of exploration:high energy collisions. By colliding protons with other particles (such as otherprotons or electrons) at very high energies, one hopes to learn about what they aremade of and how they work. The American physicist Richard Feynman oncecompared this process to slamming delicate watches together and figuring out howthey work by only examining the broken debris. While this analogy may seempessimistic, with sufficient mathematical models and experimental precision,considerable information can be extracted from the debris of such high energy
489
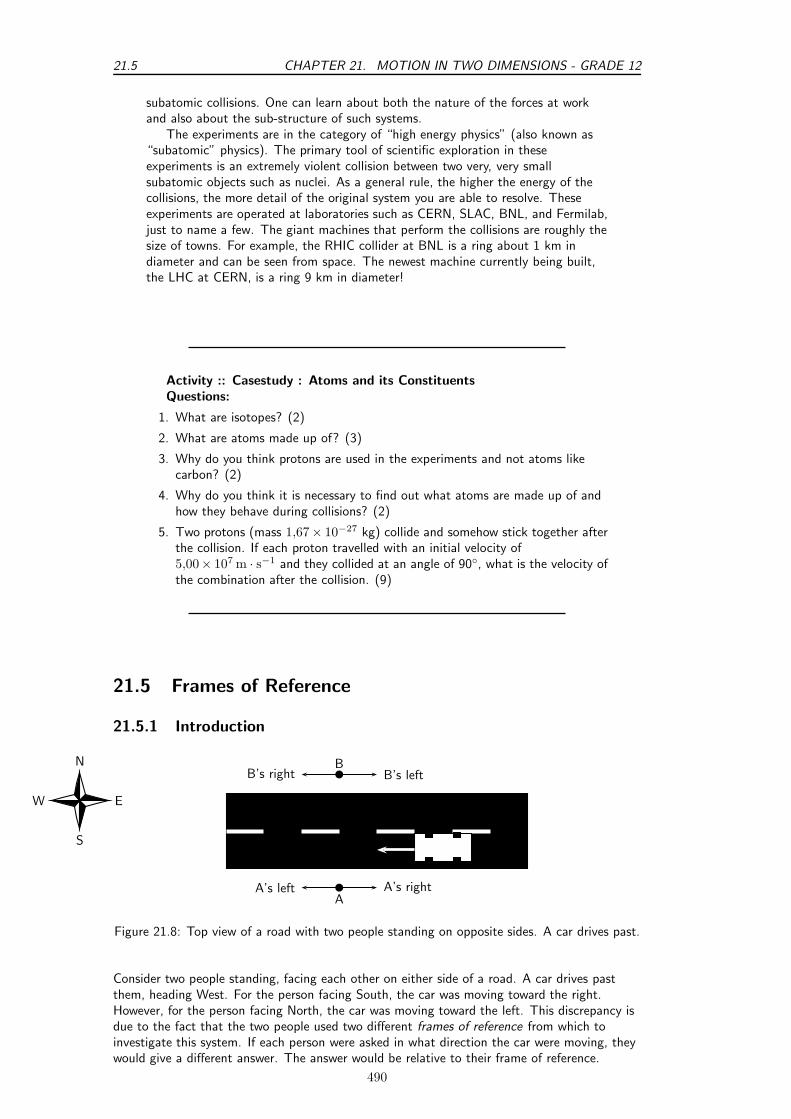
21.5 CHAPTER 21. MOTION IN TWO DIMENSIONS - GRADE 12
subatomic collisions. One can learn about both the nature of the forces at workand also about the sub-structure of such systems.
The experiments are in the category of “high energy physics” (also known as“subatomic” physics). The primary tool of scientific exploration in theseexperiments is an extremely violent collision between two very, very smallsubatomic objects such as nuclei. As a general rule, the higher the energy of thecollisions, the more detail of the original system you are able to resolve. Theseexperiments are operated at laboratories such as CERN, SLAC, BNL, and Fermilab,just to name a few. The giant machines that perform the collisions are roughly thesize of towns. For example, the RHIC collider at BNL is a ring about 1 km indiameter and can be seen from space. The newest machine currently being built,the LHC at CERN, is a ring 9 km in diameter!
Activity :: Casestudy : Atoms and its ConstituentsQuestions:
1. What are isotopes? (2)
2. What are atoms made up of? (3)
3. Why do you think protons are used in the experiments and not atoms likecarbon? (2)
4. Why do you think it is necessary to find out what atoms are made up of andhow they behave during collisions? (2)
5. Two protons (mass 1,67× 10⁻²⁷ kg) collide and somehow stick together afterthe collision. If each proton travelled with an initial velocity of5,00× 107 m · s−1 and they collided at an angle of 90, what is the velocity ofthe combination after the collision. (9)
21.5 Frames of Reference
21.5.1 Introduction
N
S
W E
b
b
A
B
A’s rightA’s left
B’s leftB’s right
Figure 21.8: Top view of a road with two people standing on opposite sides. A car drives past.
Consider two people standing, facing each other on either side of a road. A car drives pastthem, heading West. For the person facing South, the car was moving toward the right.However, for the person facing North, the car was moving toward the left. This discrepancy isdue to the fact that the two people used two different frames of reference from which toinvestigate this system. If each person were asked in what direction the car were moving, theywould give a different answer. The answer would be relative to their frame of reference.
490
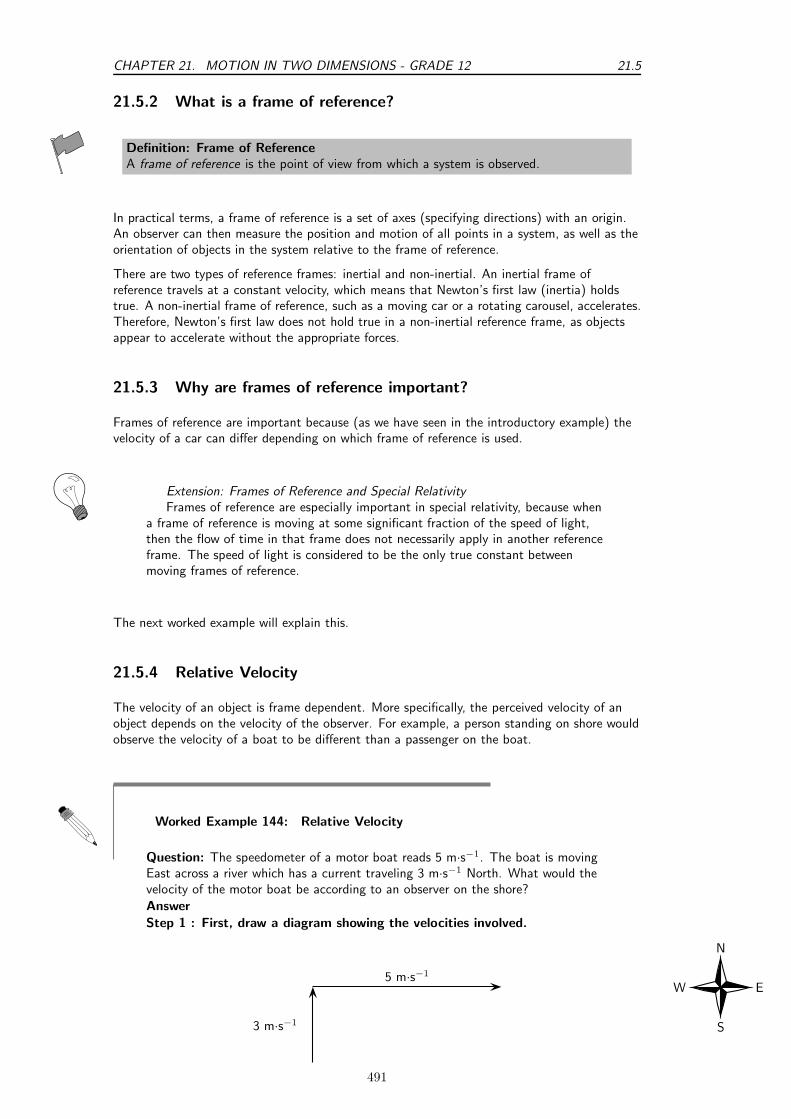
CHAPTER 21. MOTION IN TWO DIMENSIONS - GRADE 12 21.5
21.5.2 What is a frame of reference?
Definition: Frame of ReferenceA frame of reference is the point of view from which a system is observed.
In practical terms, a frame of reference is a set of axes (specifying directions) with an origin.An observer can then measure the position and motion of all points in a system, as well as theorientation of objects in the system relative to the frame of reference.
There are two types of reference frames: inertial and non-inertial. An inertial frame ofreference travels at a constant velocity, which means that Newton’s first law (inertia) holdstrue. A non-inertial frame of reference, such as a moving car or a rotating carousel, accelerates.Therefore, Newton’s first law does not hold true in a non-inertial reference frame, as objectsappear to accelerate without the appropriate forces.
21.5.3 Why are frames of reference important?
Frames of reference are important because (as we have seen in the introductory example) thevelocity of a car can differ depending on which frame of reference is used.
Extension: Frames of Reference and Special RelativityFrames of reference are especially important in special relativity, because when
a frame of reference is moving at some significant fraction of the speed of light,then the flow of time in that frame does not necessarily apply in another referenceframe. The speed of light is considered to be the only true constant betweenmoving frames of reference.
The next worked example will explain this.
21.5.4 Relative Velocity
The velocity of an object is frame dependent. More specifically, the perceived velocity of anobject depends on the velocity of the observer. For example, a person standing on shore wouldobserve the velocity of a boat to be different than a passenger on the boat.
Worked Example 144: Relative Velocity
Question: The speedometer of a motor boat reads 5 m·s−1. The boat is movingEast across a river which has a current traveling 3 m·s−1 North. What would thevelocity of the motor boat be according to an observer on the shore?
Answer
Step 1 : First, draw a diagram showing the velocities involved.
N
S
W E
3 m·s−1
5 m·s−1
491

21.5 CHAPTER 21. MOTION IN TWO DIMENSIONS - GRADE 12
Step 2 : Use the Theorem of Pythagoras to solve for the resultant of thetwo velocities.
R =√
(3)2 + (5)2
=√
34
= 5,8 m · s−1
tan θ =5
3θ = 59,04
N
S
W E3 m·s−1
5 m·s−1
5,8 m·s−1θ
The observer on the shore sees the boat moving with a velocity of 5,8 m·s−1 atN59,04E due to the current pushing the boat perpendicular to its velocity. This iscontrary to the perspective of a passenger on the boat who perceives the velocityof the boat to be 5 m·s−1 due East. Both perspectives are correct as long as theframe of the observer is considered.
Extension:
Worked Example 145: Relative Velocity 2
Question: It takes a man 10 seconds to ride down an escalator. It takesthe same man 15 s to walk back up the escalator against its motion.How long will it take the man to walk down the escalator at the samerate he was walking before?AnswerStep 1 : Determine what is required and what is givenWe are required to determine the time taken for a man to walk down anescalator, with its motion.We are given the time taken for the man to ride down the escalator andthe time taken for the man to walk up the escalator, against it motion.Step 2 : Determine how to approach the problemSelect down as positive and assume that the escalator moves at avelocity ve. If the distance of the escalator is xe then:
ve =xe
10 s(21.9)
Now, assume that the man walks at a velocity vm. Then we have that:
ve − vm =xe
15 s(21.10)
We are required to find t in:
ve + vm =xe
t(21.11)
492
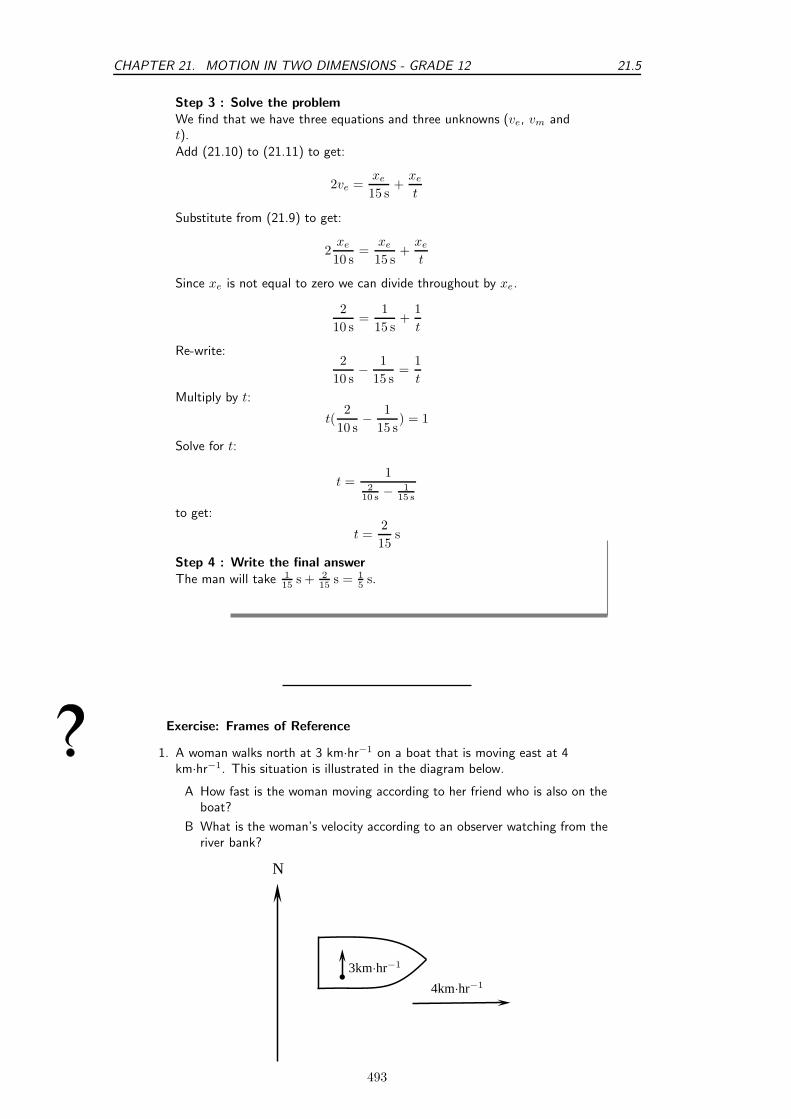
CHAPTER 21. MOTION IN TWO DIMENSIONS - GRADE 12 21.5
Step 3 : Solve the problem
We find that we have three equations and three unknowns (ve, vm andt).
Add (21.10) to (21.11) to get:
2ve =xe
15 s+
xe
t
Substitute from (21.9) to get:
2xe
10 s=
xe
15 s+
xe
t
Since xe is not equal to zero we can divide throughout by xe.
2
10 s=
1
15 s+
1
t
Re-write:2
10 s− 1
15 s=
1
t
Multiply by t:
t(2
10 s− 1
15 s) = 1
Solve for t:
t =1
2
10 s− 1
15 s
to get:
t =2
15s
Step 4 : Write the final answer
The man will take 1
15s + 2
15s = 1
5s.
Exercise: Frames of Reference
1. A woman walks north at 3 km·hr−1 on a boat that is moving east at 4km·hr−1. This situation is illustrated in the diagram below.
A How fast is the woman moving according to her friend who is also on theboat?
B What is the woman’s velocity according to an observer watching from theriver bank?
b3km·hr−1
4km·hr−1
N
493
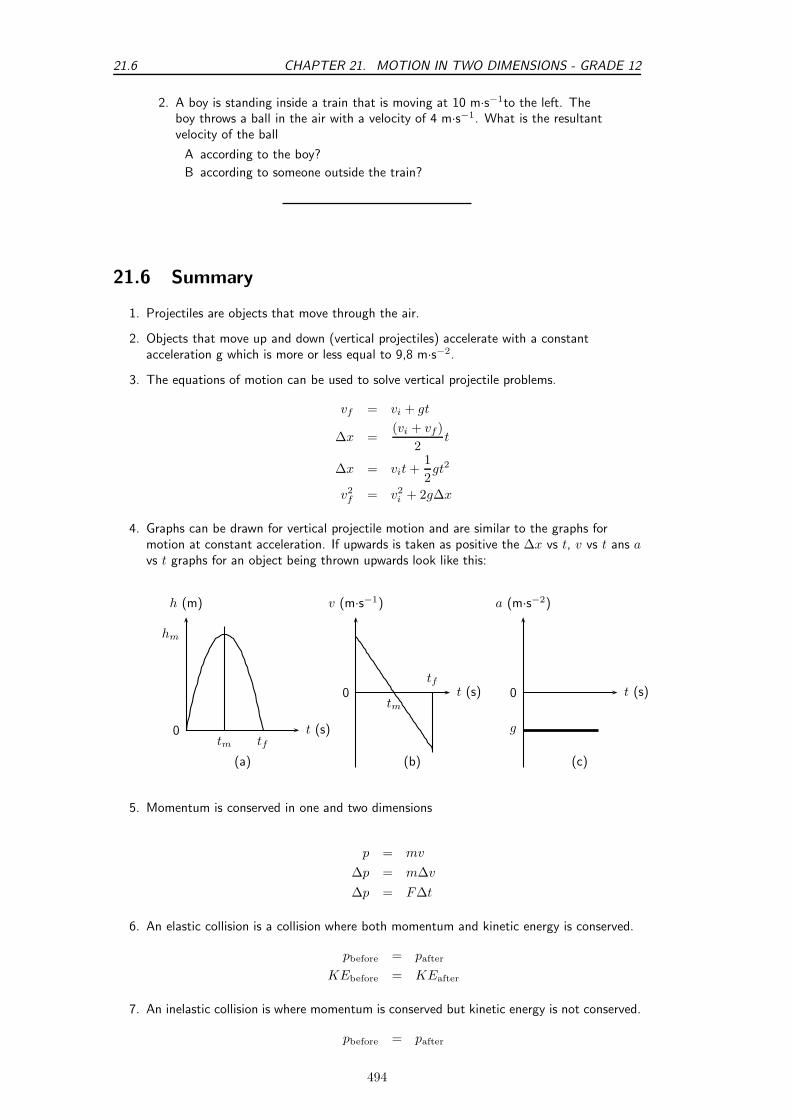
21.6 CHAPTER 21. MOTION IN TWO DIMENSIONS - GRADE 12
2. A boy is standing inside a train that is moving at 10 m·s−1to the left. Theboy throws a ball in the air with a velocity of 4 m·s−1. What is the resultantvelocity of the ball
A according to the boy?
B according to someone outside the train?
21.6 Summary
1. Projectiles are objects that move through the air.
2. Objects that move up and down (vertical projectiles) accelerate with a constantacceleration g which is more or less equal to 9,8 m·s−2.
3. The equations of motion can be used to solve vertical projectile problems.
vf = vi + gt
∆x =(vi + vf )
2t
∆x = vit +1
2gt2
v2f = v2
i + 2g∆x
4. Graphs can be drawn for vertical projectile motion and are similar to the graphs formotion at constant acceleration. If upwards is taken as positive the ∆x vs t, v vs t ans avs t graphs for an object being thrown upwards look like this:
h (m)
t (s)tm tf
hm
(a)
0
v (m·s−1)
t (s)tm
tf0
(b)
g
a (m·s−2)
t (s)
(c)
0
5. Momentum is conserved in one and two dimensions
p = mv
∆p = m∆v
∆p = F∆t
6. An elastic collision is a collision where both momentum and kinetic energy is conserved.
pbefore = pafter
KEbefore = KEafter
7. An inelastic collision is where momentum is conserved but kinetic energy is not conserved.
pbefore = pafter
494

CHAPTER 21. MOTION IN TWO DIMENSIONS - GRADE 12 21.7
KEbefore 6= KEafter
8. The frame of reference is the point of view from which a system is observed.
21.7 End of chapter exercises
1. [IEB 2005/11 HG] Two friends, Ann and Lindiwe decide to race each other by swimmingacross a river to the other side. They swim at identical speeds relative to the water. Theriver has a current flowing to the east.
N
S
W E
b
b b
start
finishAnn Lindiwe
current
Ann heads a little west of north so that she reaches the other side directly across fromthe starting point. Lindiwe heads north but is carried downstream, reaching the otherside downstream of Ann. Who wins the race?
A Ann
B Lindiwe
C It is a dead heat
D One cannot decide without knowing the velocity of the current.
2. [SC 2001/11 HG1] A bullet fired vertically upwards reaches a maximum height and fallsback to the ground.
Which one of the following statements is true with reference to the acceleration of thebullet during its motion, if air resistance is ignored?
A is always downwards
B is first upwards and then downwards
C is first downwards and then upwards
D decreases first and then increases
3. [SC 2002/03 HG1] Thabo suspends a bag of tomatoes from a spring balance heldvertically. The balance itself weighs 10 N and he notes that the balance reads 50 N. Hethen lets go of the balance and the balance and tomatoes fall freely. What would thereading be on the balance while falling?
falls freely
495
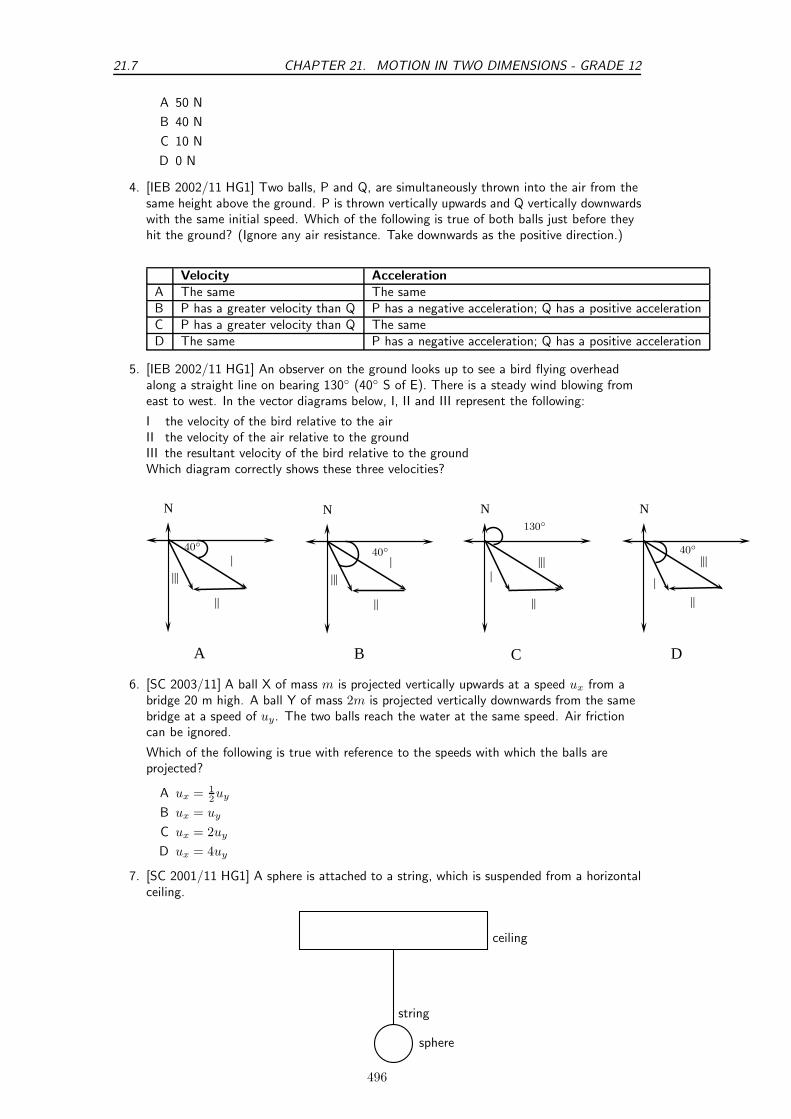
21.7 CHAPTER 21. MOTION IN TWO DIMENSIONS - GRADE 12
A 50 N
B 40 N
C 10 N
D 0 N
4. [IEB 2002/11 HG1] Two balls, P and Q, are simultaneously thrown into the air from thesame height above the ground. P is thrown vertically upwards and Q vertically downwardswith the same initial speed. Which of the following is true of both balls just before theyhit the ground? (Ignore any air resistance. Take downwards as the positive direction.)
Velocity AccelerationA The same The sameB P has a greater velocity than Q P has a negative acceleration; Q has a positive accelerationC P has a greater velocity than Q The sameD The same P has a negative acceleration; Q has a positive acceleration
5. [IEB 2002/11 HG1] An observer on the ground looks up to see a bird flying overheadalong a straight line on bearing 130 (40 S of E). There is a steady wind blowing fromeast to west. In the vector diagrams below, I, II and III represent the following:
I the velocity of the bird relative to the airII the velocity of the air relative to the groundIII the resultant velocity of the bird relative to the groundWhich diagram correctly shows these three velocities?
N
40
||
|
|||
N
40
|||
|
||
D
N
40
||
|
|||
N130
||
||||
A B C
6. [SC 2003/11] A ball X of mass m is projected vertically upwards at a speed ux from abridge 20 m high. A ball Y of mass 2m is projected vertically downwards from the samebridge at a speed of uy. The two balls reach the water at the same speed. Air frictioncan be ignored.
Which of the following is true with reference to the speeds with which the balls areprojected?
A ux = 1
2uy
B ux = uy
C ux = 2uy
D ux = 4uy
7. [SC 2001/11 HG1] A sphere is attached to a string, which is suspended from a horizontalceiling.
ceiling
string
sphere
496

CHAPTER 21. MOTION IN TWO DIMENSIONS - GRADE 12 21.7
The reaction force to the gravitational force exerted by the earth on the sphere is ...
A the force of the sphere on the earth.
B the force of the ceiling on the string.
C the force of the string on the sphere.
D the force of the ceiling on the sphere.
8. [SC 2002/03 HG1] A stone falls freely from rest from a certain height. Which on eof thefollowing quantities could be represented on the y-axis of the graph below?
Y
timeA velocity
B acceleration
C momentum
D displacement
9. A man walks towards the back of a train at 2 m·s−1while the train moves forward at 10m·s−1. The magnitude of the man’s velocity with respect to the ground is
A 2 m·s−1
B 8 m·s−1
C 10 m·s−1
D 12 m·s−1
10. A stone is thrown vertically upwards and it returns to the ground. If friction is ignored,its acceleration as it reaches the highest point of its motion is
A greater than just after it left the throwers hand.
B less than just before it hits the ground.
C the same as when it left the throwers hand.
D less than it will be when it strikes the ground.
11. An exploding device is thrown vertically upwards. As it reaches its highest point, itexplodes and breaks up into three pieces of equal mass. Which one of the followingcombinations is possible for the motion of the three pieces if they all move in a verticalline?
Mass 1 Mass 2 Mass 3A v downwards v downwards v upwardsB v upwards 2v downwards v upwardsC 2v upwards v downwards v upwardsD v upwards 2v downwards v downwards
12. [IEB 2004/11 HG1] A stone is thrown vertically up into the air. Which of the followinggraphs best shows the resultant force exerted on the stone against time while it is in theair? (Air resistance is negligible.)
13. What is the velocity of a ball just as it hits the ground if it is thrown upward at 10m·s−1from a height 5 meters above the ground?
14. [IEB 2005/11 HG1] A breeze of 50 km·hr−1 blows towards the west as a pilot flies hislight plane from town A to village B. The trip from A to B takes 1 h. He then turnswest, flying for 1
2h until he reaches a dam at point C. He turns over the dam and returns
to town A. The diagram shows his flight plan. It is not to scale.
N
W E
497

21.7 CHAPTER 21. MOTION IN TWO DIMENSIONS - GRADE 12
Fres
t
A
0
Fres
t0
B
Fres
t
C
0
Fres
t
D
0
Figure 21.9: Graphs for an object thrown upwards with an initial velocity vi. The object takestm s to reach its maximum height of hm m after which it falls back to the ground. (a) positionvs. time graph (b) velocity vs. time graph (c) acceleration vs. time graph.
C B
A
Wind velocity
50 km·hr−1
The pilot flies at the same altitude at a constant speed of 130 km.h−1 relative to the airthroughout this flight.
a Determine the magnitude of the pilot’s resultant velocity from the town A to thevillage B.
b How far is village B from town A?
c What is the plane’s speed relative to the ground as it travels from village B to thedam at C?
d Determine the following, by calculation or by scale drawing:
i. The distance from the village B to the dam C.
ii. The displacement from the dam C back home to town A.
15. A cannon (assumed to be at ground level) is fired off a flat surface at an angle, θ abovethe horizontal with an initial speed of v0.
a What is the initial horizontal component of the velocity?
b What is the initial vertical component of the velocity?
c What is the horizontal component of the velocity at the highest point of thetrajectory?
d What is the vertical component of the velocity at that point?
e What is the horizontal component of the velocity when the projectile lands?
f What is the vertical component of the velocity when it lands?
16. [IEB 2004/11 HG1] Hailstones fall vertically on the hood of a car parked on a horizontalstretch of road. The average terminal velocity of the hailstones as they descend is 8,0m.s−1 and each has a mass of 1,2 g.
a Explain why a hailstone falls with a terminal velocity.
b Calculate the magnitude of the momentum of a hailstone just before it strikes thehood of the car.
c If a hailstone rebounds at 6,0 m.s−1 after hitting the car’s hood, what is themagnitude of its change in momentum?
498
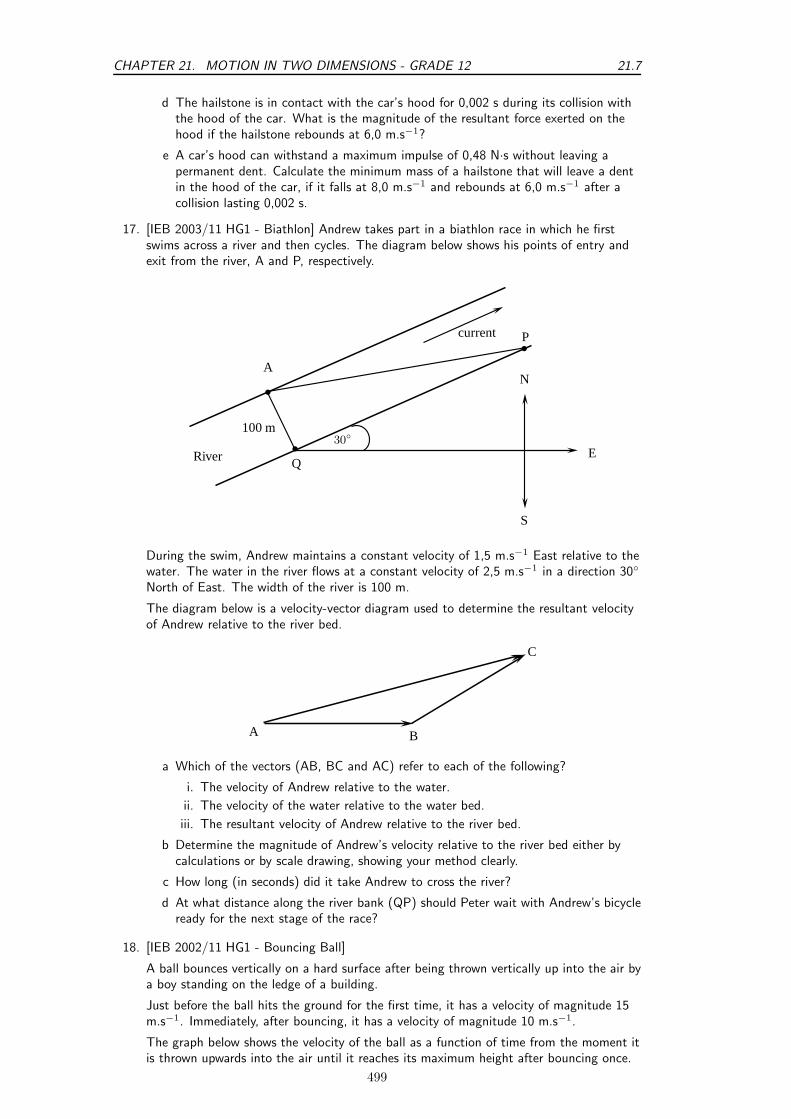
CHAPTER 21. MOTION IN TWO DIMENSIONS - GRADE 12 21.7
d The hailstone is in contact with the car’s hood for 0,002 s during its collision withthe hood of the car. What is the magnitude of the resultant force exerted on thehood if the hailstone rebounds at 6,0 m.s−1?
e A car’s hood can withstand a maximum impulse of 0,48 N·s without leaving apermanent dent. Calculate the minimum mass of a hailstone that will leave a dentin the hood of the car, if it falls at 8,0 m.s−1 and rebounds at 6,0 m.s−1 after acollision lasting 0,002 s.
17. [IEB 2003/11 HG1 - Biathlon] Andrew takes part in a biathlon race in which he firstswims across a river and then cycles. The diagram below shows his points of entry andexit from the river, A and P, respectively.
30
A
Q
P
100 m
River
current
N
E
S
b
b
b
During the swim, Andrew maintains a constant velocity of 1,5 m.s−1 East relative to thewater. The water in the river flows at a constant velocity of 2,5 m.s−1 in a direction 30
North of East. The width of the river is 100 m.
The diagram below is a velocity-vector diagram used to determine the resultant velocityof Andrew relative to the river bed.
A B
C
a Which of the vectors (AB, BC and AC) refer to each of the following?
i. The velocity of Andrew relative to the water.
ii. The velocity of the water relative to the water bed.
iii. The resultant velocity of Andrew relative to the river bed.
b Determine the magnitude of Andrew’s velocity relative to the river bed either bycalculations or by scale drawing, showing your method clearly.
c How long (in seconds) did it take Andrew to cross the river?
d At what distance along the river bank (QP) should Peter wait with Andrew’s bicycleready for the next stage of the race?
18. [IEB 2002/11 HG1 - Bouncing Ball]
A ball bounces vertically on a hard surface after being thrown vertically up into the air bya boy standing on the ledge of a building.
Just before the ball hits the ground for the first time, it has a velocity of magnitude 15m.s−1. Immediately, after bouncing, it has a velocity of magnitude 10 m.s−1.
The graph below shows the velocity of the ball as a function of time from the moment itis thrown upwards into the air until it reaches its maximum height after bouncing once.
499
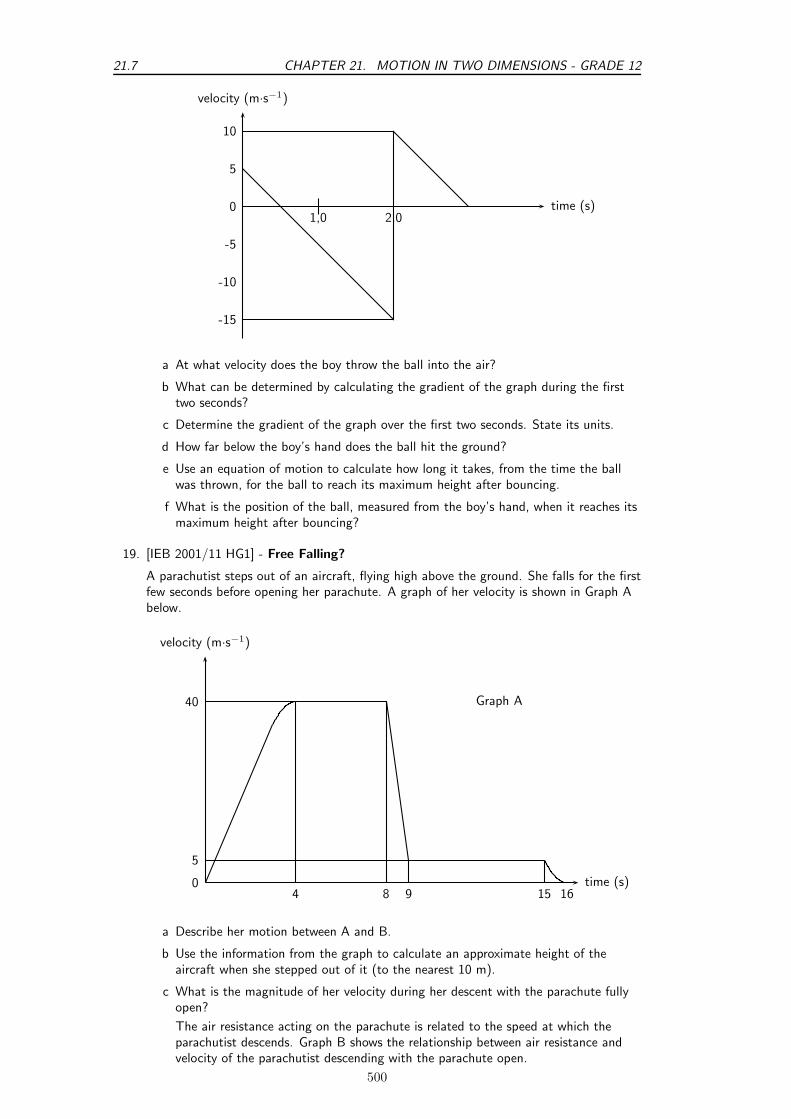
21.7 CHAPTER 21. MOTION IN TWO DIMENSIONS - GRADE 12
time (s)
velocity (m·s−1)
10
5
0
-5
-10
-15
1,0 2,0
a At what velocity does the boy throw the ball into the air?
b What can be determined by calculating the gradient of the graph during the firsttwo seconds?
c Determine the gradient of the graph over the first two seconds. State its units.
d How far below the boy’s hand does the ball hit the ground?
e Use an equation of motion to calculate how long it takes, from the time the ballwas thrown, for the ball to reach its maximum height after bouncing.
f What is the position of the ball, measured from the boy’s hand, when it reaches itsmaximum height after bouncing?
19. [IEB 2001/11 HG1] - Free Falling?
A parachutist steps out of an aircraft, flying high above the ground. She falls for the firstfew seconds before opening her parachute. A graph of her velocity is shown in Graph Abelow.
time (s)
velocity (m·s−1)
Graph A40
5
04 8 9 15 16
a Describe her motion between A and B.
b Use the information from the graph to calculate an approximate height of theaircraft when she stepped out of it (to the nearest 10 m).
c What is the magnitude of her velocity during her descent with the parachute fullyopen?
The air resistance acting on the parachute is related to the speed at which theparachutist descends. Graph B shows the relationship between air resistance andvelocity of the parachutist descending with the parachute open.
500
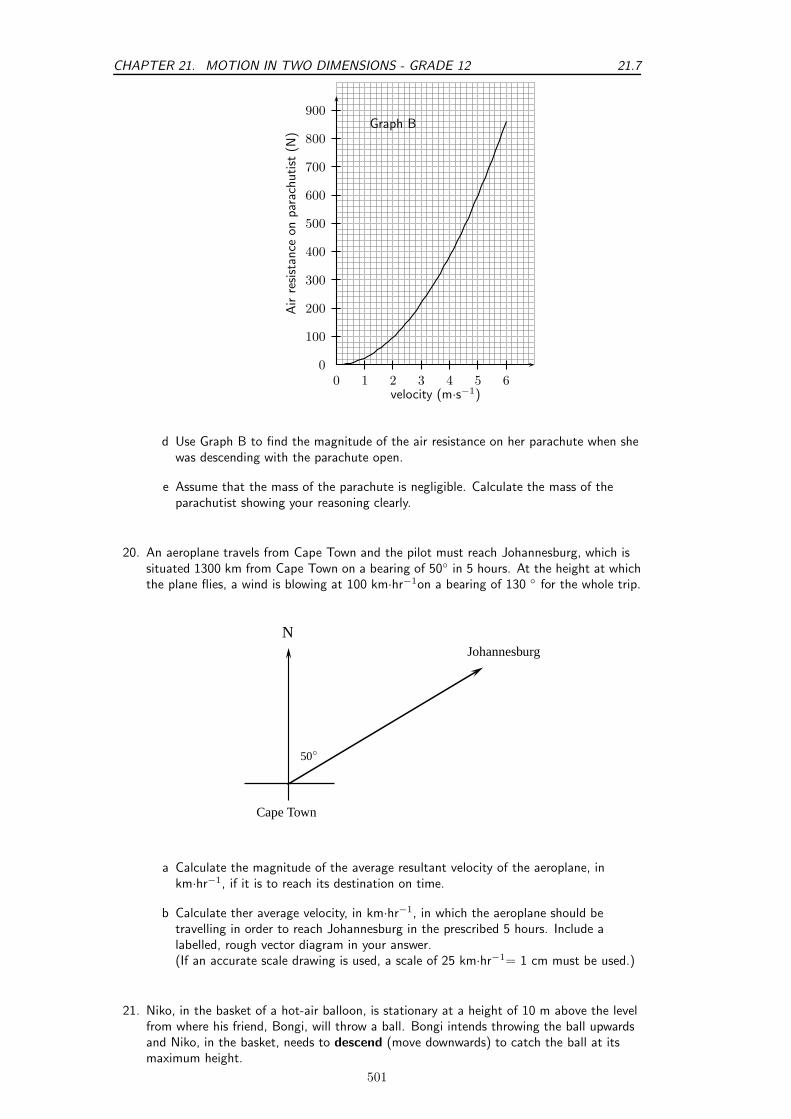
CHAPTER 21. MOTION IN TWO DIMENSIONS - GRADE 12 21.7
0 1 2 3 4 5 60
100
200
300
400
500
600
700
800
900
Air
resist
ance
on
par
achutist
(N)
velocity (m·s−1)
Graph B
d Use Graph B to find the magnitude of the air resistance on her parachute when shewas descending with the parachute open.
e Assume that the mass of the parachute is negligible. Calculate the mass of theparachutist showing your reasoning clearly.
20. An aeroplane travels from Cape Town and the pilot must reach Johannesburg, which issituated 1300 km from Cape Town on a bearing of 50 in 5 hours. At the height at whichthe plane flies, a wind is blowing at 100 km·hr−1on a bearing of 130 for the whole trip.
50
Cape Town
JohannesburgN
a Calculate the magnitude of the average resultant velocity of the aeroplane, inkm·hr−1, if it is to reach its destination on time.
b Calculate ther average velocity, in km·hr−1, in which the aeroplane should betravelling in order to reach Johannesburg in the prescribed 5 hours. Include alabelled, rough vector diagram in your answer.(If an accurate scale drawing is used, a scale of 25 km·hr−1= 1 cm must be used.)
21. Niko, in the basket of a hot-air balloon, is stationary at a height of 10 m above the levelfrom where his friend, Bongi, will throw a ball. Bongi intends throwing the ball upwardsand Niko, in the basket, needs to descend (move downwards) to catch the ball at itsmaximum height.
501

21.7 CHAPTER 21. MOTION IN TWO DIMENSIONS - GRADE 12
b b b
13 m · s−1
10 m
Bongi throws the ball upwards with a velocity of 13 m·s−1. Niko starts his descent at thesame instant the ball is thrown upwards, by letting air escape from the balloon, causing itto accelerate downwards. Ignore the effect of air friction on the ball.
a Calculate the maximum height reached by the ball.
b Calculate the magnitude of the minimum average acceleration the balloon musthave in order for Niko to catch the ball, if it takes 1,3 s for the ball to rach itsmaximum height.
22. Lesedi (mass 50 kg) sits on a massless trolley. The trolley is travelling at a constantspeed of 3 m·s−1. His friend Zola (mass 60 kg) jumps on the trolley with a velocity of 2m·s−1. What is the final velocity of the combination (lesedi, Zola and trolley) if Zolajumps on the trolley from
a the front
b behind
c the side
(Ignore all kinds of friction)
3 m · s−1
Trolley + Lesedi (a)
(b)
(c)
502

Chapter 22
Mechanical Properties of Matter -Grade 12
22.1 Introduction
In this chapter we will look at some mechanical (physical) properties of various materials thatwe use. The mechanical properties of a material are those properties that are affected by forcesbeing applied to the material. These properties are important to consider when we areconstructing buildings, structures or modes of transport like an aeroplane.
22.2 Deformation of materials
22.2.1 Hooke’s Law
Deformation (change of shape) of a solid is caused by a force that can either be compressive ortensile when applied in one direction (plane). Compressive forces try to compress the object(make it smaller or more compact) while tensile forces try to tear it apart. We can study theseeffects by looking at what happens when you compress or expand a spring.
Hooke’s Law describes the relationship between the force applied to a spring and its extension.
Historical Note: Hooke’s LawHooke’s law is named after the seventeenth century physicist Robert Hooke who discoveredit in 1660 (18 July 1635 - 3 March 1703).
Definition: Hooke’s LawIn an elastic spring, the extension varies linearly with the force applied.F = −kx where F is the force in newtons (N), k is the spring constant in N · m−1 and xis the extension in metres (m).
503
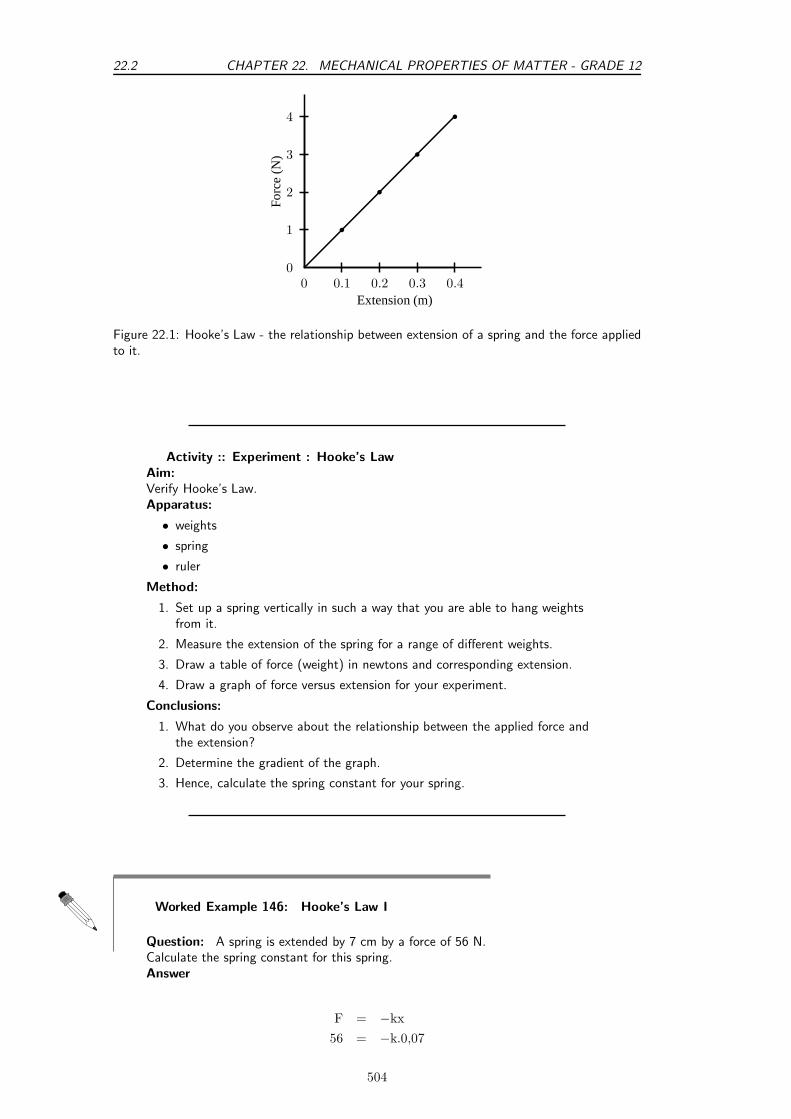
22.2 CHAPTER 22. MECHANICAL PROPERTIES OF MATTER - GRADE 12
0 0.1 0.2 0.3 0.40
1
2
3
4
b
b
b
b
Fo
rce
(N)
Extension (m)
Figure 22.1: Hooke’s Law - the relationship between extension of a spring and the force appliedto it.
Activity :: Experiment : Hooke’s LawAim:Verify Hooke’s Law.Apparatus:
• weights
• spring
• ruler
Method:
1. Set up a spring vertically in such a way that you are able to hang weightsfrom it.
2. Measure the extension of the spring for a range of different weights.
3. Draw a table of force (weight) in newtons and corresponding extension.
4. Draw a graph of force versus extension for your experiment.
Conclusions:
1. What do you observe about the relationship between the applied force andthe extension?
2. Determine the gradient of the graph.
3. Hence, calculate the spring constant for your spring.
Worked Example 146: Hooke’s Law I
Question: A spring is extended by 7 cm by a force of 56 N.Calculate the spring constant for this spring.Answer
F = −kx
56 = −k.0,07
504

CHAPTER 22. MECHANICAL PROPERTIES OF MATTER - GRADE 12 22.2
k =−56
0,07
= −800 N.m−1
Worked Example 147: Hooke’s Law II
Question: A spring of length 20cm stretches to 24cm when a load of 0,6N isapplied to it.
1. Calculate the spring constant for the spring.
2. Determine the extension of the spring if a load of 0,5N is applied to it.
Answer
1.
x = 24 cm − 20 cm
= 4 cm
= 0,04 m
F = −kx
0,6 = −k. 0,04
k = −15 N.m−1
2.F = −kx
x =F
−k
=0,5
15= 0,033 m
= 3,3 cm
Worked Example 148: Hooke’s Law III
Question: A spring has a spring constant of −400 N.m−1. By how much will itstretch if a load of 50 N is applied to it?Answer
F = −kx
50 = −(−400)x
505

22.2 CHAPTER 22. MECHANICAL PROPERTIES OF MATTER - GRADE 12
x =50
400= 0,125 m
= 12,5 cm
22.2.2 Deviation from Hooke’s Law
We know that if you have a small spring and you pull it apart too much it stops ’working’. Itbends out of shape and loses its springiness. When this happens Hooke’s Law no longerapplies, the spring’s behaviour deviates from Hooke’s Law.
Depending on what type of material we are dealing the manner in which it deviates fromHooke’s Law is different. We give classify materials by this deviation. The following graphsshow the relationship between force and extension for different materials and they all deviatefrom Hooke’s Law. Remember that a straight line show proportionality so as soon as the graphis no longer a straight line, Hooke’s Law no longer applies.
Brittle material
Fo
rce
extension
Figure 22.2: A hard, brittle substance
This graph shows the relationship between force and extension for a brittle, but strong material.Note that there is very little extension for a large force but then the material suddenlyfractures. Brittleness is the property of a material that makes it break easily without bending.
Have you ever dropped something made of glass and seen it shatter? Glass does this becauseof its brittleness.
Plastic material
extension
Fo
rce
Figure 22.3: A plastic material’s response to an applied force.
Here the graph shows the relationship between force and extension for a plastic material. Thematerial extends under a small force but it does not fracture.
506

CHAPTER 22. MECHANICAL PROPERTIES OF MATTER - GRADE 12 22.2
Ductile material
extension
Fo
rce
Figure 22.4: A ductile substance.
In this graph the relationship between force and extension is for a material that is ductile. Thematerial shows plastic behaviour over a range of forces before the material finally fractures.Ductility is the ability of a material to be stretched into a new shape without breaking.Ductility is one of the characteristic properties of metals.
A good example of this is aluminium, many things are made of aluminium. Aluminium is usedfor making everything from cooldrink cans to aeroplane parts and even engine blocks for cars.Think about squashing and bending a cooldrink can.
Brittleness is the opposite of ductility.
When a material reaches a point where Hooke’s Law is no longer valid, we say it has reachedits limit of proportionality. After this point, the material will not return to its original shapeafter the force has been removed. We say it has reached its elastic limit.
Definition: Elastic limitThe elastic limit is the point beyond which permanent deformation takes place.
Definition: Limit of proportionalityThe limit of proportionality is the point beyond which Hooke’s Law is no longer obeyed.
Exercise: Hooke’s Law and deformation of materials
1. What causes deformation?
2. Describe Hooke’s Law in words and mathematically.
3. List similarities and differences between ductile, brittle and polymericmaterials, with specific reference to their force-extension graphs.
4. Describe what is meant by the elastic limit.
5. Describe what is meant by the limit of proportionality.
6. A spring of length 15 cm stretches to 27 cm when a load of 0,4 N is appliedto it.
A Calculate the spring constant for the spring.
B Determine the extension of the spring if a load of 0,35 N is applied to it.
7. A spring has a spring constant of −200 N.m−1. By how much will it stretch ifa load of 25 N is applied to it?
8. A spring of length 20 cm stretches to 24 cm when a load of 0,6 N is appliedto it.
507

22.3 CHAPTER 22. MECHANICAL PROPERTIES OF MATTER - GRADE 12
A Calculate the spring constant for the spring.
B Determine the extension of the spring if a load of 0,8 N is applied to it.
22.3 Elasticity, plasticity, fracture, creep
22.3.1 Elasticity and plasticity
Materials are classified as plastic or elastic depending on how they respond to an applied force.It is important to note that plastic substances are not necessarily a type of plastic (polymer)they only behave like plastic. Think of them as being like plastic which you will be familiar with.
A rubber band is a material that has elasticity. It returns to its original shape after an appliedforce is removed, providing that the material is not stretched beyond its elastic limit.
Plasticine is an example of a material that is plastic. If you flatten a ball of plasticine, it willstay flat. A plastic material does not return to its original shape after an applied force isremoved.
• Elastic materials return to their original shape.
• Plastic materials deform easily and do not return to their original shape.
22.3.2 Fracture, creep and fatigue
Some materials are neither plastic nor elastic. These substances will break or fracture when alarge enough force is applied to them. The brittle glass we mentioned earlier is an example.
Creep occurs when a material deforms over a long period of time because of an applied force.An example of creep is the bending of a shelf over time when a heavy object is put on it. Creepmay eventually lead to the material fracturing. The application of heat may lead to an increasein creep in a material.
Fatigue is similar to creep. The difference between the two is that fatigue results from the forcebeing applied and then removed repeatedly over a period of time. With metals this results infailure because of metal fatigue.
• Fracture is an abrupt breaking of the material.
• Creep is a slow deformation process due to a continuous force over a long time.
• Fatigue is weakening of the material due to short forces acting many many times.
Exercise: Elasticity, plasticity, fracture and creep
1. List the similarities and differences between elastic and plastic deformation.
2. List the similarities and differences between creep and fracture as modes offailure in material.
508

CHAPTER 22. MECHANICAL PROPERTIES OF MATTER - GRADE 12 22.4
22.4 Failure and strength of materials
22.4.1 The properties of matter
The strength of a material is defined as the stress (the force per unit cross-sectional area) thatit can withstand. Strength is measured in newtons per square metre (N · m−2).
Stiffness is a measure of how flexible a material is. In Science we measure the stiffness of amaterial by calculating its Young’s Modulus. The Young’s modulus is a ratio of how much itbends to the load applied to it. Stiffness is measure in newtons per metre (N · m−1).
Hardness of a material can be measured by determining what force will cause a permanentdeformation in the material. Hardness can also be measured using a scale like Mohs hardnessscale. On this scale, diamond is the hardest at 10 and talc is the softest at 1.
Interesting
Fact
teresting
FactRemembering that the Mohs scale is the hardness scale and that the softestsubstance is talc will often come in handy for general knowledge quizes.
The toughness of a material is a measure of how it can resist breaking when it is stressed. It isscientifically defined as the amount of energy that a material can absorb before breaking.
A ductile material is a substance that can undergo large plastic deformation without fracturing.Many metals are very ductile and they can be drawn into wires, e.g. copper, silver, aluminiumand gold.
A malleable material is a substance that can easily undergo plastic deformation by hammeringor rolling. Again, metals are malleable substances, e.g. copper can be hammered into sheetsand aluminium can be rolled into aluminium foil.
A brittle material fractures with very little or no plastic deformation. Glassware and ceramicsare brittle.
22.4.2 Structure and failure of materials
Many substances fail because they have a weakness in their atomic structure. There are anumber of problems that can cause these weaknesses in structure. These are vacancies,dislocations, grain boundaries and impurities.
Vacancies occur when there are spaces in the structure of a crystalline solid. These vacanciescause weakness and the substance often fail at these places. Think about bricks in a wall, ifyou started removing bricks the wall would get weaker.
Dislocations occur when there are no strong bonds between two rows in a crystal lattice. Thecrystal will fail along this boundary when sufficient force is applied. The two pieces of thecrystal keep their shape and structure but move along the boundary.
Impurities in a crystal structure can cause a weak spot in the crystal lattice around theimpurity. Like vacancies, the substance often fail from these places in the lattice. This you canthink of as bricks in a wall which don’t fit properly, they are the wrong kind of bricks (atoms)to make the structure strong.
A difference in grain size in a crystal lattice will result in rusting or oxidation at the boundarywhich again will result in failure when sufficient force is applied.
22.4.3 Controlling the properties of materials
There are a number of processes that can be used to ensure that materials are less likely to fail.We shall look at a few methods in this section.
509
22.4 CHAPTER 22. MECHANICAL PROPERTIES OF MATTER - GRADE 12
Cold working
Cold working is a process in which a metal is strengthened by repeatedly being reshaped. Thisis carried out at a temperature below the melting point of the metal. The repeated shaping ofthe metal result in dislocations which then prevent further dislocations in the metal. Coldworking increases the strength of the metal but in so doing, the metal loses its ductility. Wesay the metal is work-hardened.
Annealing
Annealing is a process in which a metal is heated strongly to a temperature that is about halfof its melting point. When the metal cools, it recrystallises which removes vacancies anddislocations in the metal. Annealing is often used before cold working. In annealing the metalcools very very slowly.
Alloying
An alloy is a mixture of a metal with other substances. The other substances can be metal ornon-metal. An alloy often has properties that are very different to the properties of thesubstances from which it is made. The added substances strengthen the metal by preventingdislocations from spreading. Ordinary steel is an alloy of iron and carbon. There are manytypes of steel that also include other metals with iron and carbon. Brass is an alloy of copperand Zinc. Bronze is an alloy of copper and tin. Gold and silver that is used in coins or jewelleryare also alloyed.
Tempering
Tempering is a process in which a metal is melted then quickly cooled. The rapid cooling iscalled quenching. Usually tempering is done a number of times before a metal has the correctproperties that are needed for a particular application.
Sintering
Sintering is used for making ceramic objects among other things. In this process the substanceis heated so that its particles stick together. It is used with substances that have a very highmelting point. The resulting product is often very pure and it is formed in the process into theshape that is wanted. Unfortunately, sintered products are brittle.
22.4.4 Steps of Roman Swordsmithing
• Purifying the iron ore.
• Heating the iron blocks in a furnace with charcoal.
• Hammering and getting into the needed shape. The smith used a hammer to pound themetal into blade shape. He usually used tongs to hold the iron block in place.
• Reheating. When the blade cooled, the smith reheated it to keep it workable. Whilereheated and hammered repeatedly.
• Quenching which involved the process of white heating and cooling in water. Quenchingmade the blade harder and stronger. At the same time it made the blade quite brittle,which was a considerable problem for the sword smiths.
• Tempering was then done to avoid brittleness the blade was tempered. In another wordsit was reheated a final time to a very specific temperature. How the Romans do balancedthe temperature? The smith was guided only by the blade’s color and his own experience.
510
CHAPTER 22. MECHANICAL PROPERTIES OF MATTER - GRADE 12 22.5
Exercise: Failure and strength of materials
1. List the similarities and differences between the brittle and ductile modes offailure.
2. What is meant by the following terms:
A vacancies
B dislocations
C impurities
D grain boundaries
3. What four terms can be used to describe a material’s mechanical properties?
4. What is meant by the following:
A cold working
B annealing
C tempering
D introduction of impurities
E alloying
F sintering
22.5 Summary
1. Hooke’s Law gives the relationship between the extension of a spring and the forceapplied to it. The law says they are proportional.
2. Materials can be classified as plastic or elastic depending on how they respond to anapplied force.
3. Materials can fracture or undergo creep or fatigue when forces are applied to them.
4. Materials have the following mechanical properties to a greater or lesser degree: strength,hardness, ductility, malleability, brittleness, stiffness.
5. Materials can be weakened by have the following problems in their crystal lattice:vacancies, dislocations, impurities, difference in grain size.
6. Materials can have their mechanical properties improved by one or more of the followingprocesses: cold working, annealing, adding impurities, tempering, sintering.
22.6 End of chapter exercise
1. State Hooke’s Law in words.
2. What do we mean by the following terms with respect to Hooke’s Law?
A elastic limit
B limit of proportionality
3. A spring is extended by 18 cm by a force of 90 N. Calculate the spring constant for thisspring.
4. A spring of length 8 cm stretches to 14 cm when a load of 0,8 N is applied to it.
A Calculate the spring constant for the spring.
B Determine the extension of the spring if a load of 0,7 N is applied to it.
511
22.6 CHAPTER 22. MECHANICAL PROPERTIES OF MATTER - GRADE 12
5. A spring has a spring constant of −150 N.m−1. By how much will it stretch if a load of80 N is applied to it?
6. What do we mean by the following terms when speaking about properties of materials?
A hardness
B toughness
C ductility
D malleability
E stiffness
F strength
7. What is Young’s modulus?
8. In what different ways can we improve the material properties of substances?
9. What is a metal alloy?
10. What do we call an alloy of:
A iron and carbon
B copper and zinc
C copper and tin
11. Do some research on what added substances can do to the properties of steel. Presentyou findings in a suitable table.
512

Chapter 23
Work, Energy and Power - Grade12
(NOTE TO SELF: Status: Content is complete. More exercises, worked examples and activitiesare needed.)
23.1 Introduction
Imagine a vendor carrying a basket of vegetables on her head. Is she doing any work? Onewould definitely say yes! However, in Physics she is not doing any work! Again, imagine a boypushing against a wall? Is he doing any work? We can see that his muscles are contracting andexpanding. He may even be sweating. But in Physics, he is not doing any work!
If the vendor is carrying a very heavy load for a long distance, we would say she has lot ofenergy. By this, we mean that she has a lot of stamina. If a car can travel very fast, wedescribe the car as powerful. So, there is a link between power and speed. However, powermeans something different in Physics. This chapter describes the links between work, energyand power and what these mean in Physics.
You will learn that work and energy are closely related. You shall see that the energy of anobject is its capacity to do work and doing work is the process of transferring energy from oneobject or form to another. In other words,
• an object with lots of energy can do lots of work.
• when work is done, energy is lost by the object doing work and gained by the object onwhich the work is done.
Lifting objects or throwing them requires that you do work on them. Even making electricityflow requires that something do work. Something must have energy and transfer it throughdoing work to make things happen.
23.2 Work
Definition: WorkWhen a force exerted on an object causes it to move, work is done on the object (except ifthe force and displacement are at right angles to each other).
This means that in order for work to be done, an object must be moved a distance d by a forceF , such that there is some non-zero component of the force in the direction of thedisplacement. Work is calculated as:
W = F · ∆x cos θ. (23.1)
513
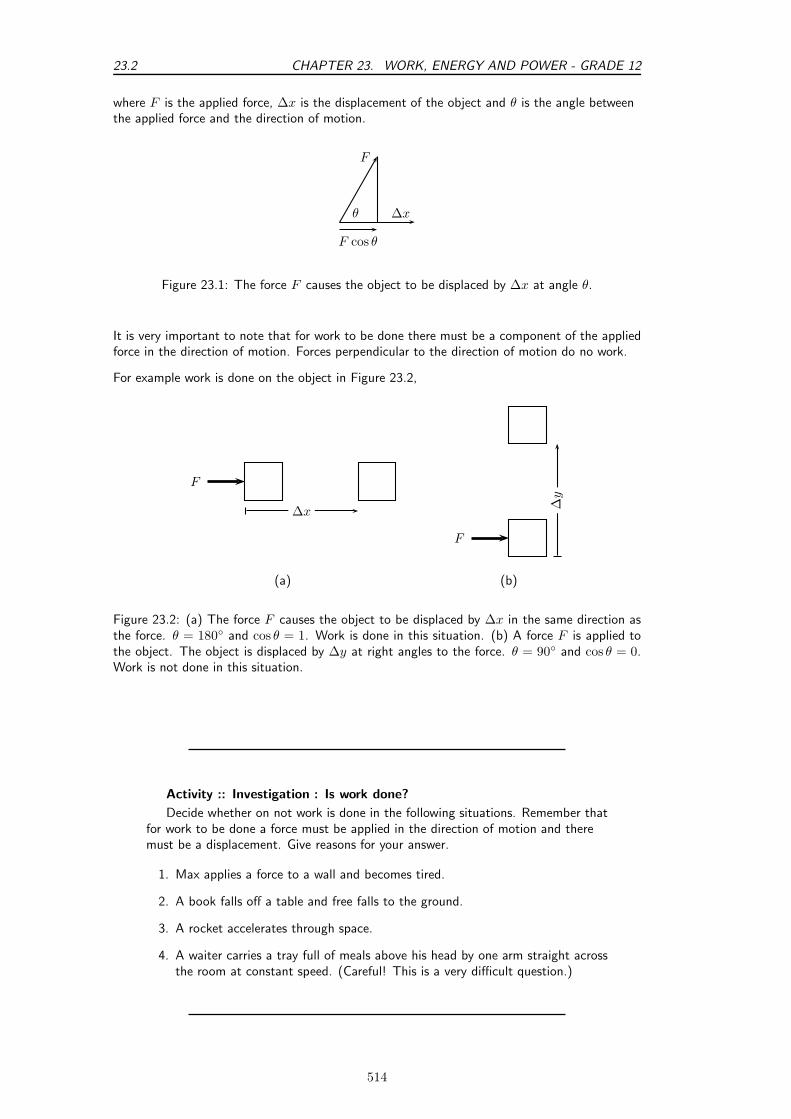
23.2 CHAPTER 23. WORK, ENERGY AND POWER - GRADE 12
where F is the applied force, ∆x is the displacement of the object and θ is the angle betweenthe applied force and the direction of motion.
F
∆xθ
F cos θ
Figure 23.1: The force F causes the object to be displaced by ∆x at angle θ.
It is very important to note that for work to be done there must be a component of the appliedforce in the direction of motion. Forces perpendicular to the direction of motion do no work.
For example work is done on the object in Figure 23.2,
F
∆x
(a)
F
∆y
(b)
Figure 23.2: (a) The force F causes the object to be displaced by ∆x in the same direction asthe force. θ = 180 and cos θ = 1. Work is done in this situation. (b) A force F is applied tothe object. The object is displaced by ∆y at right angles to the force. θ = 90 and cos θ = 0.Work is not done in this situation.
Activity :: Investigation : Is work done?
Decide whether on not work is done in the following situations. Remember thatfor work to be done a force must be applied in the direction of motion and theremust be a displacement. Give reasons for your answer.
1. Max applies a force to a wall and becomes tired.
2. A book falls off a table and free falls to the ground.
3. A rocket accelerates through space.
4. A waiter carries a tray full of meals above his head by one arm straight acrossthe room at constant speed. (Careful! This is a very difficult question.)
514
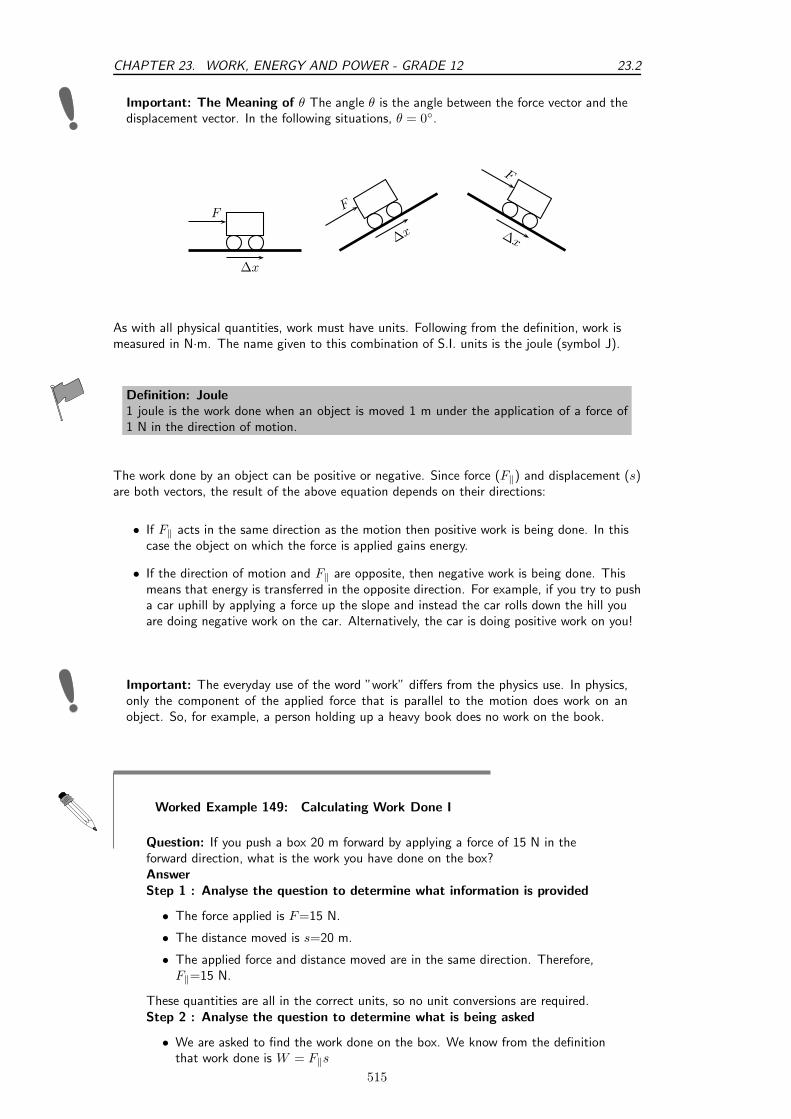
CHAPTER 23. WORK, ENERGY AND POWER - GRADE 12 23.2
Important: The Meaning of θ The angle θ is the angle between the force vector and thedisplacement vector. In the following situations, θ = 0.
F
∆x
F
∆x
F
∆x
As with all physical quantities, work must have units. Following from the definition, work ismeasured in N·m. The name given to this combination of S.I. units is the joule (symbol J).
Definition: Joule1 joule is the work done when an object is moved 1 m under the application of a force of1 N in the direction of motion.
The work done by an object can be positive or negative. Since force (F‖) and displacement (s)are both vectors, the result of the above equation depends on their directions:
• If F‖ acts in the same direction as the motion then positive work is being done. In thiscase the object on which the force is applied gains energy.
• If the direction of motion and F‖ are opposite, then negative work is being done. Thismeans that energy is transferred in the opposite direction. For example, if you try to pusha car uphill by applying a force up the slope and instead the car rolls down the hill youare doing negative work on the car. Alternatively, the car is doing positive work on you!
Important: The everyday use of the word ”work” differs from the physics use. In physics,only the component of the applied force that is parallel to the motion does work on anobject. So, for example, a person holding up a heavy book does no work on the book.
Worked Example 149: Calculating Work Done I
Question: If you push a box 20 m forward by applying a force of 15 N in theforward direction, what is the work you have done on the box?AnswerStep 1 : Analyse the question to determine what information is provided
• The force applied is F=15 N.
• The distance moved is s=20 m.
• The applied force and distance moved are in the same direction. Therefore,F‖=15 N.
These quantities are all in the correct units, so no unit conversions are required.Step 2 : Analyse the question to determine what is being asked
• We are asked to find the work done on the box. We know from the definitionthat work done is W = F‖s
515
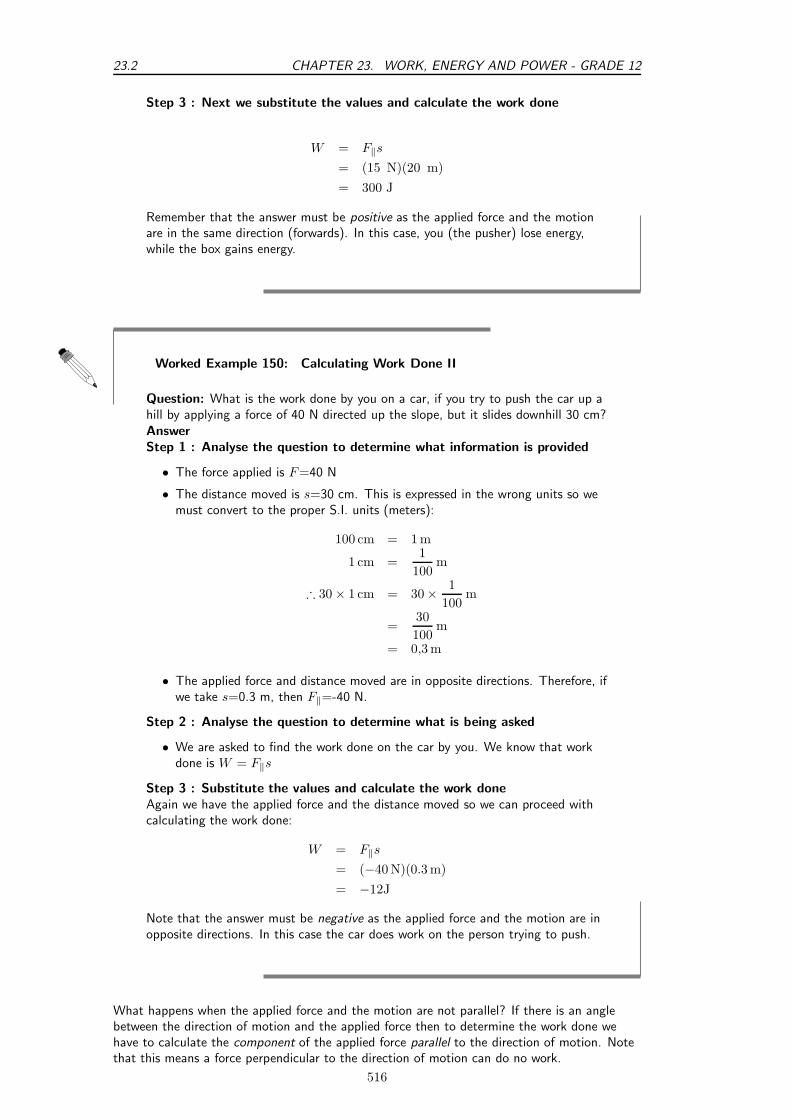
23.2 CHAPTER 23. WORK, ENERGY AND POWER - GRADE 12
Step 3 : Next we substitute the values and calculate the work done
W = F‖s
= (15 N)(20 m)
= 300 J
Remember that the answer must be positive as the applied force and the motionare in the same direction (forwards). In this case, you (the pusher) lose energy,while the box gains energy.
Worked Example 150: Calculating Work Done II
Question: What is the work done by you on a car, if you try to push the car up ahill by applying a force of 40 N directed up the slope, but it slides downhill 30 cm?AnswerStep 1 : Analyse the question to determine what information is provided
• The force applied is F=40 N
• The distance moved is s=30 cm. This is expressed in the wrong units so wemust convert to the proper S.I. units (meters):
100 cm = 1 m
1 cm =1
100m
∴ 30 × 1 cm = 30 × 1
100m
=30
100m
= 0,3 m
• The applied force and distance moved are in opposite directions. Therefore, ifwe take s=0.3 m, then F‖=-40 N.
Step 2 : Analyse the question to determine what is being asked
• We are asked to find the work done on the car by you. We know that workdone is W = F‖s
Step 3 : Substitute the values and calculate the work doneAgain we have the applied force and the distance moved so we can proceed withcalculating the work done:
W = F‖s
= (−40 N)(0.3 m)
= −12J
Note that the answer must be negative as the applied force and the motion are inopposite directions. In this case the car does work on the person trying to push.
What happens when the applied force and the motion are not parallel? If there is an anglebetween the direction of motion and the applied force then to determine the work done wehave to calculate the component of the applied force parallel to the direction of motion. Notethat this means a force perpendicular to the direction of motion can do no work.
516
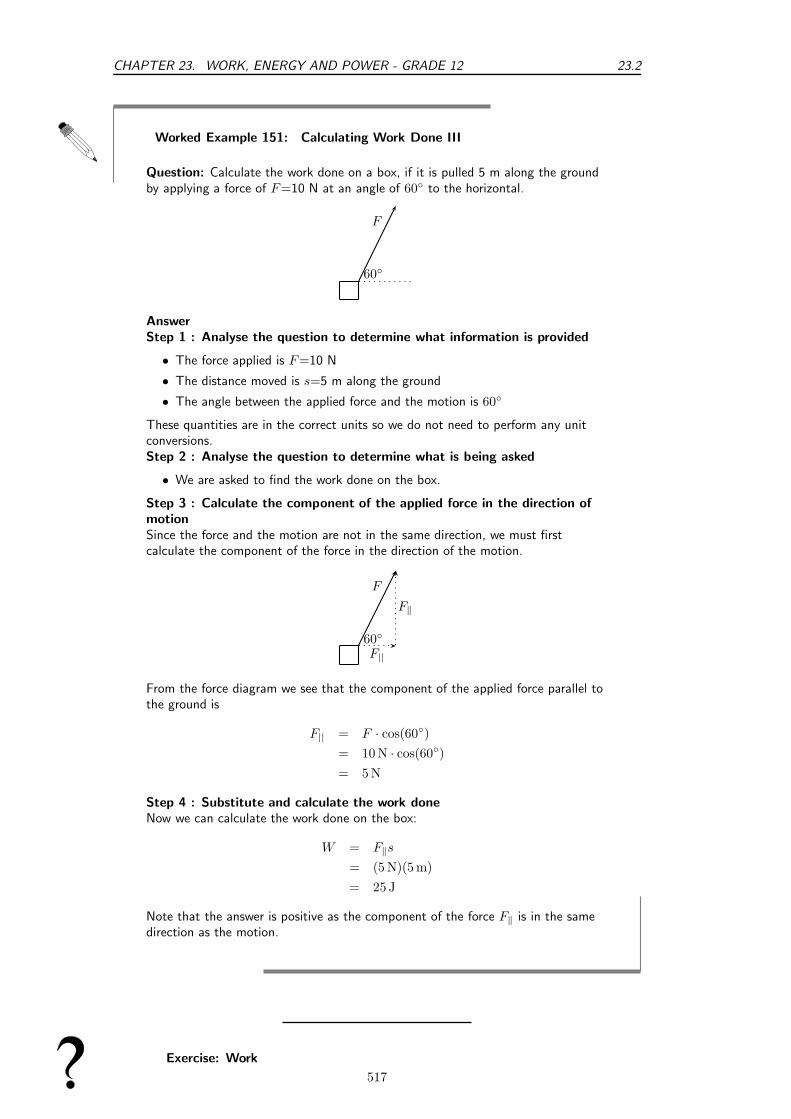
CHAPTER 23. WORK, ENERGY AND POWER - GRADE 12 23.2
Worked Example 151: Calculating Work Done III
Question: Calculate the work done on a box, if it is pulled 5 m along the groundby applying a force of F=10 N at an angle of 60 to the horizontal.
60
F
AnswerStep 1 : Analyse the question to determine what information is provided
• The force applied is F=10 N
• The distance moved is s=5 m along the ground
• The angle between the applied force and the motion is 60
These quantities are in the correct units so we do not need to perform any unitconversions.Step 2 : Analyse the question to determine what is being asked
• We are asked to find the work done on the box.
Step 3 : Calculate the component of the applied force in the direction ofmotionSince the force and the motion are not in the same direction, we must firstcalculate the component of the force in the direction of the motion.
60
F
F||
F‖
From the force diagram we see that the component of the applied force parallel tothe ground is
F|| = F · cos(60)
= 10 N · cos(60)
= 5 N
Step 4 : Substitute and calculate the work doneNow we can calculate the work done on the box:
W = F‖s
= (5 N)(5 m)
= 25 J
Note that the answer is positive as the component of the force F‖ is in the samedirection as the motion.
Exercise: Work
517

23.2 CHAPTER 23. WORK, ENERGY AND POWER - GRADE 12
1. A 10 N force is applied to push a block across a friction free surface for adisplacement of 5.0 m to the right. The block has a weight of 20 N.Determine the work done by the following forces: normal force, weight,applied force.
N
Fg
Fapp
2. A 10 N frictional force slows a moving block to a stop after a displacement of5.0 m to the right. The block has a weight of 20 N. Determine the work doneby the following forces: normal force, weight, frictional force.
N
Fg
Ffriction
3. A 10 N force is applied to push a block across a frictional surface at constantspeed for a displacement of 5.0 m to the right. The block has a weight of20 N and the frictional force is 10 N. Determine the work done by thefollowing forces: normal force, weight, frictional force.
N
Fg
Ffriction Fapp
4. A 20 N object is sliding at constant speed across a friction free surface for adisplacement of 5 m to the right. Determine if there is any work done.
N
Fg
5. A 20 N object is pulled upward at constant speed by a 20 N force for avertical displacement of 5 m. Determine if there is any work done.
T
Fg
6. Before beginning its descent, a roller coaster is always pulled up the first hill toa high initial height. Work is done on the roller coaster to achieve this initialheight. A coaster designer is considering three different incline angles of thehill at which to drag the 2 000 kg car train to the top of the 60 m high hill. Ineach case, the force applied to the car will be applied parallel to the hill. Hercritical question is: which angle would require the least work? Analyze thedata, determine the work done in each case, and answer this critical question.
Angle of Incline Applied Force Distance Work
35 1.1 × 10⁴ N 100 m45 1.3 × 10⁴ N 90 m55 1.5 × 10⁴ N 80 m
7. Big Bertha carries a 150 N suitcase up four flights of stairs (a total height of12 m) and then pushes it with a horizontal force of 60 N at a constant speedof 0.25 m·s−1 for a horizontal distance of 50 m on a frictionless surface. Howmuch work does Big Bertha do on the suitcase during this entire trip?
518

CHAPTER 23. WORK, ENERGY AND POWER - GRADE 12 23.3
8. A mother pushes down on a pram with a force of 50 N at an angle of 30.The pram is moving on a frictionless surface. If the mother pushes the pramfor a horizontal distance of 30 m, how much does she do on the pram?
b
Fapp
θ
9. How much work is done by an applied force to raise a 2 000 N lift 5 floorsvertically at a constant speed? Each floor is 5 m high.
10. A student with a mass of 60 kg runs up three flights of stairs in 15 s, coveringa vertical distance of 10 m. Determine the amount of work done by thestudent to elevate her body to this height. Assume that her speed is constant.
11. (NOTE TO SELF: exercises are needed.)
23.3 Energy
23.3.1 External and Internal Forces
In Grade 10, you saw that mechanical energy was conserved in the absence of external forces.It is important to know whether a force is an internal force or an external force, because this isrelated to whether the force can change an object’s total mechanical energy when it does workupon an object.
Activity :: Investigations : External Forces(NOTE TO SELF: need an activity that helps the learner investigate how
energy is lost when external forces do work on an object.)
When an external force (for example friction, air resistance, applied force) does work on anobject, the total mechanical energy (KE + PE) of that object changes. If positive work is done,then the object will gain energy. If negative work is done, then the object will lose energy. Thegain or loss in energy can be in the form of potential energy, kinetic energy, or both. However,the work which is done is equal to the change in mechanical energy of the object.
Activity :: Investigation : Internal Forces and Energy Conservation(NOTE TO SELF: need an activity that helps the learner investigate how
energy changes form when an internal force does work on an object.)
519
23.3 CHAPTER 23. WORK, ENERGY AND POWER - GRADE 12
When an internal force does work on an object by an (for example, gravitational and springforces), the total mechanical energy (KE + PE) of that object remains constant but theobject’s energy can change form. For example, as an object falls in a gravitational field from ahigh elevation to a lower elevation, some of the object’s potential energy is changed intokinetic energy. However, the sum of the kinetic and potential energies remain constant. Whenthe only forces doing work are internal forces, energy changes forms - from kinetic to potential(or vice versa); yet the total amount of mechanical is conserved.
23.3.2 Capacity to do Work
Energy is the capacity to do work. When positive work is done on an object, the system doingthe work loses energy. In fact, the energy lost by a system is exactly equal to the workdone by the system. An object with larger potential energy has a greater capacity to do work.
Worked Example 152: Work Done on a System
Question: Show that a hammer of mass 2 kg does more work when dropped froma height of 10 m than when dropped from a height of 5 m. Confirm that thehammer has a greater potential energy at 10 m than at 5 m.AnswerStep 5 : Determine what is given and what is requiredWe are given:
• the mass of the hammer, m =2 kg
• height 1, h1=10 m
• height 2, h2=5 m
We are required to show that the hammer does more work when dropped from h1
than from h2. We are also required to confirm that the hammer has a greaterpotential energy at 10 m than at 5 m.Step 6 : Determine how to approach the problem
1. Calculate the work done by the hammer, W1, when dropped from h1 using:
W1 = Fg · h1.
2. Calculate the work done by the hammer, W2, when dropped from h2 using:
W2 = Fg · h2.
3. Compare W1 and W2
4. Calculate potential energy at h1 and h2 and compare using:
PE = m · g · h. (23.2)
Step 7 : Calculate W1
W1 = Fg · h1
= m · g · h1
= (2 kg)(9.8 m · s−2)(10 m)
= 196 J
Step 8 : Calculate W2
W2 = Fg · h2
= m · g · h2
= (2 kg)(9.8 m · s−2)(5 m)
= 98 J
520
CHAPTER 23. WORK, ENERGY AND POWER - GRADE 12 23.3
Step 9 : Compare W1 and W2
We have W1=196 J and W2=98 J. W1 > W2 as required.Step 10 : Calculate potential energy
From 23.2, we see that:
PE = m · g · h= Fg · h= W
This means that the potential energy is equal to the work done. Therefore,PE1 > PE2, because W1 > W2.
This leads us to the work-energy theorem.
Definition: Work-Energy TheoremThe work-energy theorem states that the work done on an object is equal to the change inits kinetic energy:
W = ∆KE = KEf − KEi
The work-energy theorem is another example of the conservation of energy which you saw inGrade 10.
Worked Example 153: Work-Energy Theorem
Question: A ball of mass 1 kg is dropped from a height of 10 m. Calculate thework done on the ball at the point it hits the ground assuming that there is no airresistance?Answer
Step 1 : Determine what is given and what is requiredWe are given:
• mass of the ball: m=1 kg
• initial height of the ball: hi=10 m
• final height of the ball: hf=0 m
We are required to determine the work done on the ball as it hits the ground.
Step 2 : Determine how to approach the problemThe ball is falling freely, so energy is conserved. We know that the work done isequal to the difference in kinetic energy. The ball has no kinetic energy at themoment it is dropped, because it is stationary. When the ball hits the ground, allthe ball’s potential energy is converted to kinetic energy.Step 3 : Determine the ball’s potential energy at hi
PE = m · g · h= (1 kg)(9,8 m · s−2)(10 m)
= 98 J
Step 4 : Determine the work done on the ballThe ball had 98 J of potential energy when it was released and 0 J of kineticenergy. When the ball hit the ground, it had 0 J of potential energy and 98 J ofkinetic energy. Therefore KEi=0 J and KEf=98 J.
521

23.3 CHAPTER 23. WORK, ENERGY AND POWER - GRADE 12
From the work-energy theorem:
W = ∆KE
= KEf − KEi
= 98 J − 0 J
= 98 J
Step 5 : Write the final answer98 J of work was done on the ball.
Worked Example 154: Work-Energy Theorem 2
Question: The driver of a 1 000 kg car traveling at a speed of 16,7 m·s−1 appliesthe car’s brakes when he sees a red robot. The car’s brakes provide a frictionalforce of 8000 N. Determine the stopping distance of the car.AnswerStep 1 : Determine what is given and what is required
We are given:
• mass of the car: m=1 000 kg
• speed of the car: v=16,7 m·s−1
• frictional force of brakes: F=8 000 N
We are required to determine the stopping distance of the car.Step 2 : Determine how to approach the problem
We apply the work-energy theorem. We know that all the car’s kinetic energy islost to friction. Therefore, the change in the car’s kinetic energy is equal to thework done by the frictional force of the car’s brakes.Therefore, we first need to determine the car’s kinetic energy at the moment ofbraking using:
KE =1
2mv2
This energy is equal to the work done by the brakes. We have the force applied bythe brakes, and we can use:
W = F · d
to determine the stopping distance.
Step 3 : Determine the kinetic energy of the car
KE =1
2mv2
=1
2(1 000 kg)(16,7 m · s−1)2
= 139 445 J
Step 4 : Determine the work doneAssume the stopping distance is d0. Then the work done is:
W = F · d= (−8 000 N)(d0)
The force has a negative sign because it acts in a direction opposite to thedirection of motion.Step 5 : Apply the work-enemy theoremThe change in kinetic energy is equal to the work done.
522
CHAPTER 23. WORK, ENERGY AND POWER - GRADE 12 23.3
∆KE = W
KEf − KEi = (−8 000 N)(d0)
0 J − 139 445 J = (−8 000 N)(d0)
∴ d0 =139 445 J
8 000 N= 17,4 m
Step 6 : Write the final answerThe car stops in 17,4 m.
Important: A force only does work on an object for the time that it is in contact with theobject. For example, a person pushing a trolley does work on the trolley, but the road doesno work on the tyres of a car if they turn without slipping (the force is not applied over anydistance because a different piece of tyre touches the road every instant.
Energy isconserved!
Important: Energy Conservation
In the absence of friction, the work done on an object by a system is equal to the energygained by the object.
Work Done = Energy Transferred
In the presence of friction, only some of the energy lost by the system is transferred to usefulenergy. The rest is lost to friction.
Total Work Done = Useful Work Done + Work Done Against Friction
In the example of a falling mass the potential energy is known as gravitational potential energyas it is the gravitational force exerted by the earth which causes the mass to accelerate towardsthe ground. The gravitational field of the earth is what does the work in this case.
Another example is a rubber-band. In order to stretch a rubber-band we have to do work on it.This means we transfer energy to the rubber-band and it gains potential energy. This potentialenergy is called elastic potential energy. Once released, the rubber-band begins to move andelastic potential energy is transferred into kinetic energy.
Extension: Other forms of Potential Energy
1. elastic potential energy - potential energy is stored in a compressed orextended spring or rubber band. This potential energy is calculated by:
1
2kx2
where k is a constant that is a measure of the stiffness of the spring or rubberband and x is the extension of the spring or rubber band.
2. Chemical potential energy is related to the making and breaking of chemicalbonds. For example, a battery converts chemical energy into electrical energy.
3. The electrical potential energy of an electrically charged object is defined asthe work that must be done to move it from an infinite distance away to itspresent location, in the absence of any non-electrical forces on the object.
523

23.3 CHAPTER 23. WORK, ENERGY AND POWER - GRADE 12
This energy is non-zero if there is another electrically charged object nearbyotherwise it is given by:
kq1q2
d
where k is Coulomb’s constant. For example, an electric motor lifting anelevator converts electrical energy into gravitational potential energy.
4. Nuclear energy is the energy released when the nucleus of an atom is split orfused. A nuclear reactor converts nuclear energy into heat.
Some of these forms of energy will be studied in later chapters.
Activity :: Investigation : Energy ResourcesEnergy can be taken from almost anywhere. Power plants use many different
types of energy sources, including oil, coal, nuclear, biomass (organic gases), wind,solar, geothermal (the heat from the earth’s rocks is very hot underground and isused to turn water to steam), tidal and hydroelectric (waterfalls). Most powerstations work by using steam to turn turbines which then drive generators andcreate an electric current.
Most of these sources are dependant upon the sun’s energy, because without itwe would not have weather for wind and tides. The sun is also responsible forgrowing plants which decompose into fossil fuels like oil and coal. All these sourcescan be put under 2 headings, renewable and non-renewable. Renewable sources aresources which will not run out, like solar energy and wind power. Non-renewablesources are ones which will run out eventually, like oil and coal.
It is important that we learn to appreciate conservation in situations like this.The planet has a number of linked systems and if we don’t appreciate thelong-term consequences of our actions we run the risk of doing damage now thatwe will only suffer from in many years time.
Investigate two types of renewable and two types of non-renewable energyresources, listing advantages and disadvantages of each type. Write up the resultsas a short report.
Exercise: Energy
1. Fill in the table with the missing information using the positions of the ball inthe diagram below combined with the work-energy theorem.
A
B C
D E
FG 524
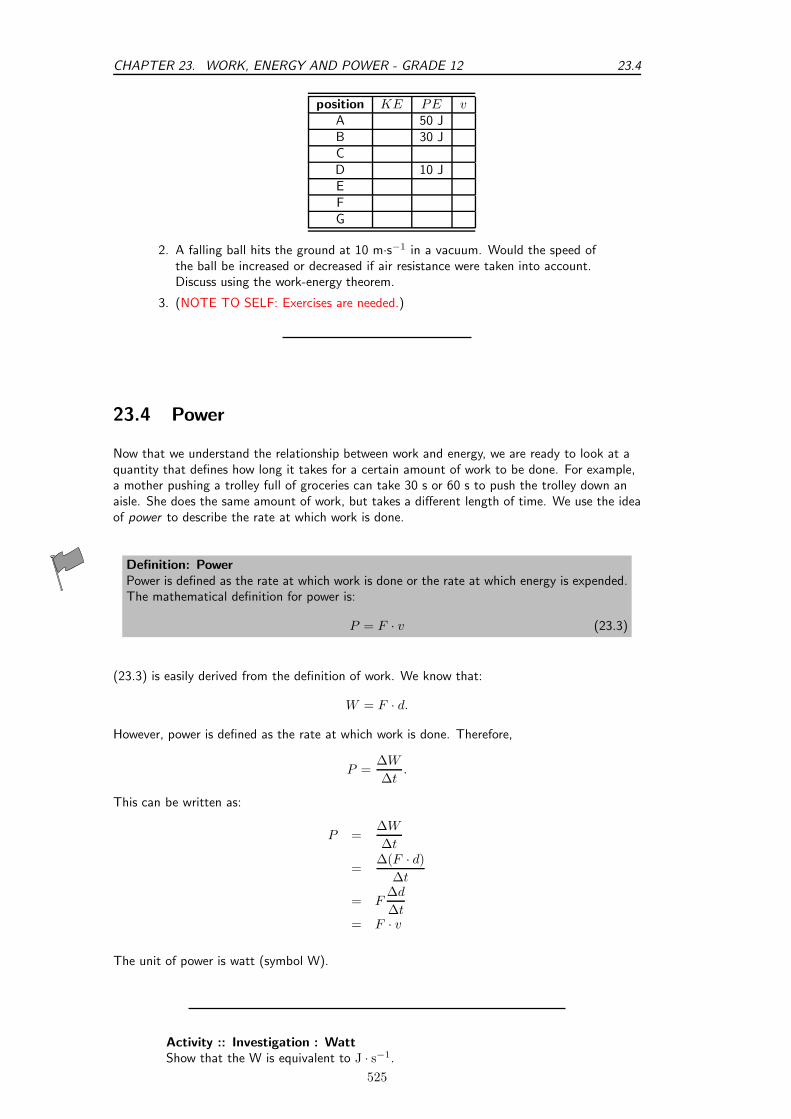
CHAPTER 23. WORK, ENERGY AND POWER - GRADE 12 23.4
position KE PE vA 50 JB 30 JCD 10 JEFG
2. A falling ball hits the ground at 10 m·s−1 in a vacuum. Would the speed ofthe ball be increased or decreased if air resistance were taken into account.Discuss using the work-energy theorem.
3. (NOTE TO SELF: Exercises are needed.)
23.4 Power
Now that we understand the relationship between work and energy, we are ready to look at aquantity that defines how long it takes for a certain amount of work to be done. For example,a mother pushing a trolley full of groceries can take 30 s or 60 s to push the trolley down anaisle. She does the same amount of work, but takes a different length of time. We use the ideaof power to describe the rate at which work is done.
Definition: PowerPower is defined as the rate at which work is done or the rate at which energy is expended.The mathematical definition for power is:
P = F · v (23.3)
(23.3) is easily derived from the definition of work. We know that:
W = F · d.
However, power is defined as the rate at which work is done. Therefore,
P =∆W
∆t.
This can be written as:
P =∆W
∆t
=∆(F · d)
∆t
= F∆d
∆t= F · v
The unit of power is watt (symbol W).
Activity :: Investigation : WattShow that the W is equivalent to J · s−1.
525
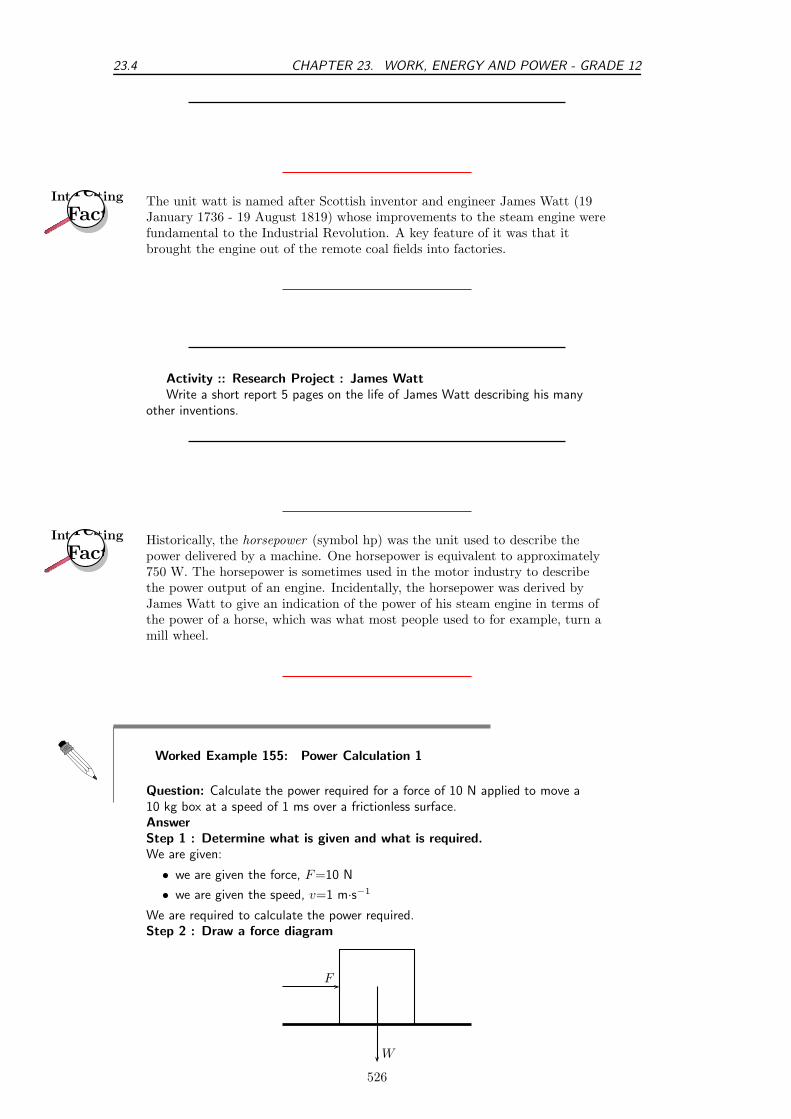
23.4 CHAPTER 23. WORK, ENERGY AND POWER - GRADE 12
Interesting
Fact
teresting
FactThe unit watt is named after Scottish inventor and engineer James Watt (19January 1736 - 19 August 1819) whose improvements to the steam engine werefundamental to the Industrial Revolution. A key feature of it was that itbrought the engine out of the remote coal fields into factories.
Activity :: Research Project : James WattWrite a short report 5 pages on the life of James Watt describing his many
other inventions.
Interesting
Fact
teresting
FactHistorically, the horsepower (symbol hp) was the unit used to describe thepower delivered by a machine. One horsepower is equivalent to approximately750 W. The horsepower is sometimes used in the motor industry to describethe power output of an engine. Incidentally, the horsepower was derived byJames Watt to give an indication of the power of his steam engine in terms ofthe power of a horse, which was what most people used to for example, turn amill wheel.
Worked Example 155: Power Calculation 1
Question: Calculate the power required for a force of 10 N applied to move a10 kg box at a speed of 1 ms over a frictionless surface.AnswerStep 1 : Determine what is given and what is required.We are given:
• we are given the force, F=10 N
• we are given the speed, v=1 m·s−1
We are required to calculate the power required.Step 2 : Draw a force diagram
W
F
526
CHAPTER 23. WORK, ENERGY AND POWER - GRADE 12 23.4
Step 3 : Determine how to approach the problem
From the force diagram, we see that the weight of the box is acting at right anglesto the direction of motion. The weight does not contribute to the work done anddoes not contribute to the power calculation.
We can therefore calculate power from:
P = F · v
Step 4 : Calculate the power required
P = F · v= (10 N)(1 m · s−1)
= 10 W
Step 5 : Write the final answer
10 W of power are required for a force of 10 N to move a 10 kg box at a speed of1 ms over a frictionless surface.
Machines are designed and built to do work on objects. All machines usually have a powerrating. The power rating indicates the rate at which that machine can do work upon otherobjects.
A car engine is an example of a machine which is given a power rating. The power ratingrelates to how rapidly the car can accelerate. Suppose that a 50 kW engine could acceleratethe car from 0 km · hr−1 to 60km · hr−1 in 16 s. Then a car with four times the power rating(i.e. 200 kW) could do the same amount of work in a quarter of the time. That is, a 200 kWengine could accelerate the same car from 0 km · hr−1 to 60km · hr−1 in 4 s.
Worked Example 156: Power Calculation 2
Question: A forklift lifts a crate of mass 100 kg at a constant velocity to a heightof 8 m over a time of 4 s. The forklift then holds the crate in place for 20 s.Calculate how much power the forklift exerts in lifting the crate? How much powerdoes the forklift exert in holding the crate in place?
Answer
Step 1 : Determine what is given and what is required
We are given:
• mass of crate: m=100 kg
• height that crate is raised: h=8 m
• time taken to raise crate: tr=4 s
• time that crate is held in place: ts=20 s
We are required to calculate the power exerted.
Step 2 : Determine how to approach the problem
We can use:
P = F∆x
∆t
to calculate power. The force required to raise the crate is equal to the weight ofthe crate.
Step 3 : Calculate the power required to raise the crate
527
23.4 CHAPTER 23. WORK, ENERGY AND POWER - GRADE 12
P = F∆x
∆t
= m · g∆x
∆t
= (100 kg)(9,8 m · s−2)8 m
4 s= 1 960 W
Step 4 : Calculate the power required to hold the crate in placeWhile the crate is being held in place, there is no displacement. This means thereis no work done on the crate and therefore there is no power exerted.Step 5 : Write the final answer1 960 W of power is exerted to raise the crate and no power is exerted to hold thecrate in place.
Activity :: Experiment : Simple measurements of human powerYou can perform various physical activities, for example lifting measured
weights or climbing a flight of stairs to estimate your output power, using a stopwatch. Note: the human body is not very efficient in these activities, so youractual power will be much greater than estimated here.
Exercise: Power
1. [IEB 2005/11 HG] Which of the following is equivalent to the SI unit of power:
A V·AB V·A−1
C kg · m·s−1
D kg · m · s−2
2. Two students, Bill and Bob, are in the weight lifting room of their local gum.Bill lifts the 50 kg barbell over his head 10 times in one minute while Bob liftsthe 50 kg barbell over his head 10 times in 10 seconds. Who does the mostwork? Who delivers the most power? Explain your answers.
3. Jack and Jill ran up the hill. Jack is twice as massive as Jill; yet Jill ascendedthe same distance in half the time. Who did the most work? Who deliveredthe most power? Explain your answers.
4. Alex (mass 60 kg) is training for the Comrades Marathon. Part of Alex’straining schedule involves push-ups. Alex does his push-ups by applying aforce to elevate his center-of-mass by 20 cm. Determine the number ofpush-ups that Alex must do in order to do 10 J of work. If Alex does all thiswork in 60 s, then determine Alex’s power.
5. When doing a chin-up, a physics student lifts her 40 kg body a distance of0.25 m in 2 s. What is the power delivered by the student’s biceps?
6. The unit of power that is used on a monthly electricity account iskilowatt-hours (symbol kWh). This is a unit of energy delivered by the flow ofl kW of electricity for 1 hour. Show how many joules of energy you get whenyou buy 1 kWh of electricity.
528

CHAPTER 23. WORK, ENERGY AND POWER - GRADE 12 23.5
7. An escalator is used to move 20 passengers every minute from the first floorof a shopping mall to the second. The second floor is located 5-meters abovethe first floor. The average passenger’s mass is 70 kg. Determine the powerrequirement of the escalator in order to move this number of passengers inthis amount of time.
8. (NOTE TO SELF: need a worked example - for example the minimum powerrequired of an electric motor to pump water from a borehole of a particulardepth at a particular rate)
9. (NOTE TO SELF: need a worked example -for example the power of differentkinds of cars operating under different conditions.)
10. (NOTE TO SELF: Some exercises are needed.)
23.5 Important Equations and Quantities
UnitsQuantity Symbol Unit S.I. Units Directionvelocity ~v — m
sor m.s−1 X
momentum ~p — kg.ms
or kg.m.s−1 X
energy E J kg.m2
s2 or kg.m2s−2 —
Work W J N.m or kg.m2.s−2 —Kinetic Energy EK J N.m or kg.m2.s−2 —
Potential Energy EP J N.m or kg.m2.s−2 —Mechanical Energy U J N.m or kg.m2.s−2 —
Table 23.1: Units commonly used in Collisions and Explosions
Momentum:~p = m~v (23.4)
Kinetic energy:
Ek =1
2m~v2 (23.5)
Principle of Conservation of Energy: Energy is never created nor destroyed, but is merelytransformed from one form to another.
Conservation of Mechanical Energy: In the absence of friction, the total mechanical energyof an object is conserved.
When a force moves in the direction along which it acts, work is done.
Work is the process of converting energy.
Energy is the ability to do work.
23.6 End of Chapter Exercises
1. The force vs. displacement graph shows the amount of force applied to an object bythree different people. Abdul applies force to the object for the first 4 m of itsdisplacement, Beth applies force from the 4 m point to the 6 m point, and Charlesapplies force from the 6 m point to the 8 m point. Calculate the work done by eachperson on the object? Which of the three does the most work on the object?
529
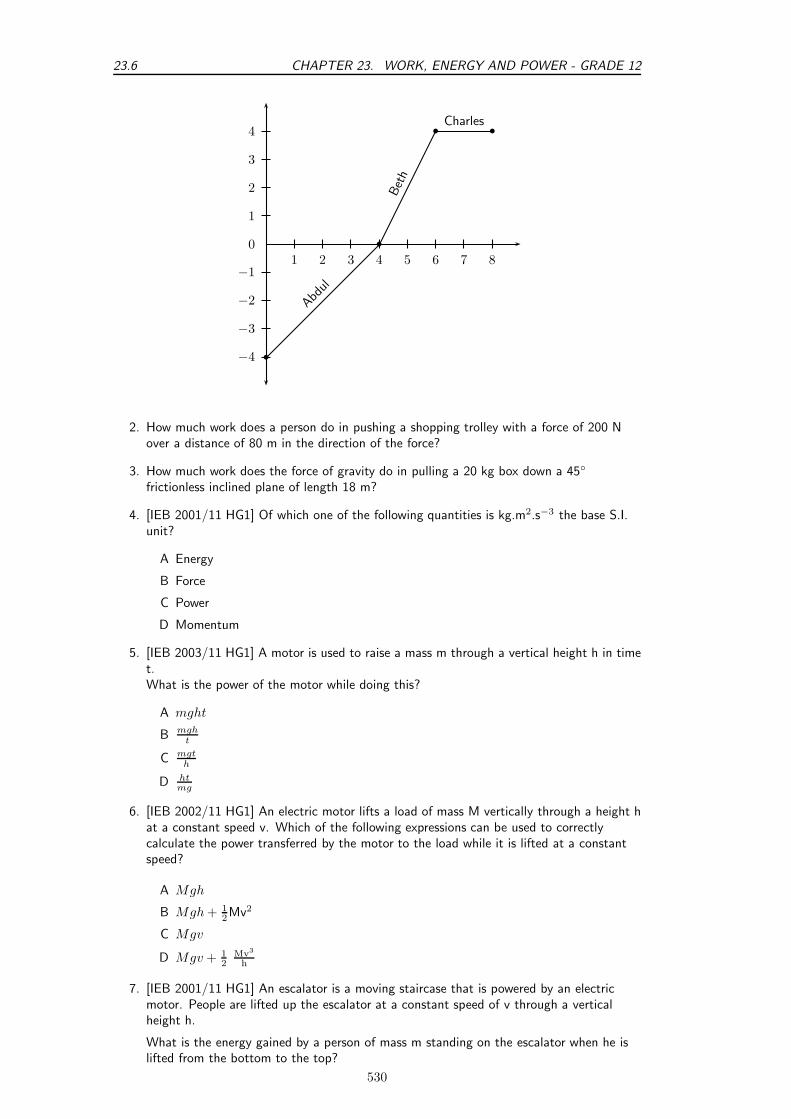
23.6 CHAPTER 23. WORK, ENERGY AND POWER - GRADE 12
1 2 3 4 5 6 7 80
1
2
3
4
−1
−2
−3
−4 b
b
b b
Abdu
l
Bet
h
Charles
2. How much work does a person do in pushing a shopping trolley with a force of 200 Nover a distance of 80 m in the direction of the force?
3. How much work does the force of gravity do in pulling a 20 kg box down a 45
frictionless inclined plane of length 18 m?
4. [IEB 2001/11 HG1] Of which one of the following quantities is kg.m2.s−3 the base S.I.unit?
A Energy
B Force
C Power
D Momentum
5. [IEB 2003/11 HG1] A motor is used to raise a mass m through a vertical height h in timet.What is the power of the motor while doing this?
A mght
B mght
C mgth
D htmg
6. [IEB 2002/11 HG1] An electric motor lifts a load of mass M vertically through a height hat a constant speed v. Which of the following expressions can be used to correctlycalculate the power transferred by the motor to the load while it is lifted at a constantspeed?
A Mgh
B Mgh + 1
2Mv2
C Mgv
D Mgv + 1
2
Mv3
h
7. [IEB 2001/11 HG1] An escalator is a moving staircase that is powered by an electricmotor. People are lifted up the escalator at a constant speed of v through a verticalheight h.
What is the energy gained by a person of mass m standing on the escalator when he islifted from the bottom to the top?
530
CHAPTER 23. WORK, ENERGY AND POWER - GRADE 12 23.6
0 1 2 3 4 50
1
2
3
4
5
A mgh
B mgh sin θ
Cmgh
sin θ
D 1
2mv2
8. [IEB 2003/11 HG1] In which of the following situations is there no work done on theobject?
A An apple falls to the ground.
B A brick is lifted from the ground to the top of a building.
C A car slows down to a stop.
D A box moves at constant velocity across a frictionless horizontal surface.
9. (NOTE TO SELF: exercises are needed.)
531

23.6 CHAPTER 23. WORK, ENERGY AND POWER - GRADE 12
532
Chapter 24
Doppler Effect - Grade 12
24.1 Introduction
Have you noticed how the pitch of a car hooter changes as the car passes by or how the pitchof a radio box on the pavement changes as you drive by? This effect is known as the DopplerEffect and will be studied in this chapter.
Interesting
Fact
teresting
FactThe Doppler Effect is named after Johann Christian Andreas Doppler (29November 1803 - 17 March 1853), an Austrian mathematician and physicistwho first explained the phenomenon in 1842.
24.2 The Doppler Effect with Sound and Ultrasound
As seen in the introduction, there are two situations which lead to the Doppler Effect:
1. When the source moves relative to the observer, for example the pitch of a car hooter asit passes by.
2. When the observer moves relative to the source, for example the pitch of a radio on thepavement as you drive by.
Definition: Doppler EffectThe Doppler effect is the apparent change in frequency and wavelength of a wave when theobserver and the source of the wave move relative to each other.
We experience the Doppler effect quite often in our lives, without realising that it is sciencetaking place. The changing sound of a taxi hooter or ambulance as it drives past are examplesof this as you have seen in the introduction.The question is how does the Doppler effect take place. Let us consider a source of soundwaves with a constant frequency and amplitude. The sound waves can be drawn as concentriccircles where each circle represents another wavefront, like in figure 24.1 below.
The sound source is the dot in the middle and is stationary. For the Doppler effect to takeplace, the source must be moving. Let’s consider the following situation: The source (dot)emits one peak (represented by a circle) that moves away from the source at the same rate inall directions.
533

24.2 CHAPTER 24. DOPPLER EFFECT - GRADE 12
Figure 24.1: Stationary sound source
1 2−1−2
1
2
−1
−2
As this peak moves away, the source also moves and then emits the second peak. Now the twocircles are not concentric any more, but on the one side they are closer together and on theother side they are further apart. This is shown in the next diagram.
1 2−1−2
1
2
−1
−2
If the source continues moving at the same speed in the same direction (i.e. with the samevelocity which you will learn more about later). then the distance between peaks on the rightof the source is the constant. The distance between peaks on the left is also constant but theyare different on the left and right.
534
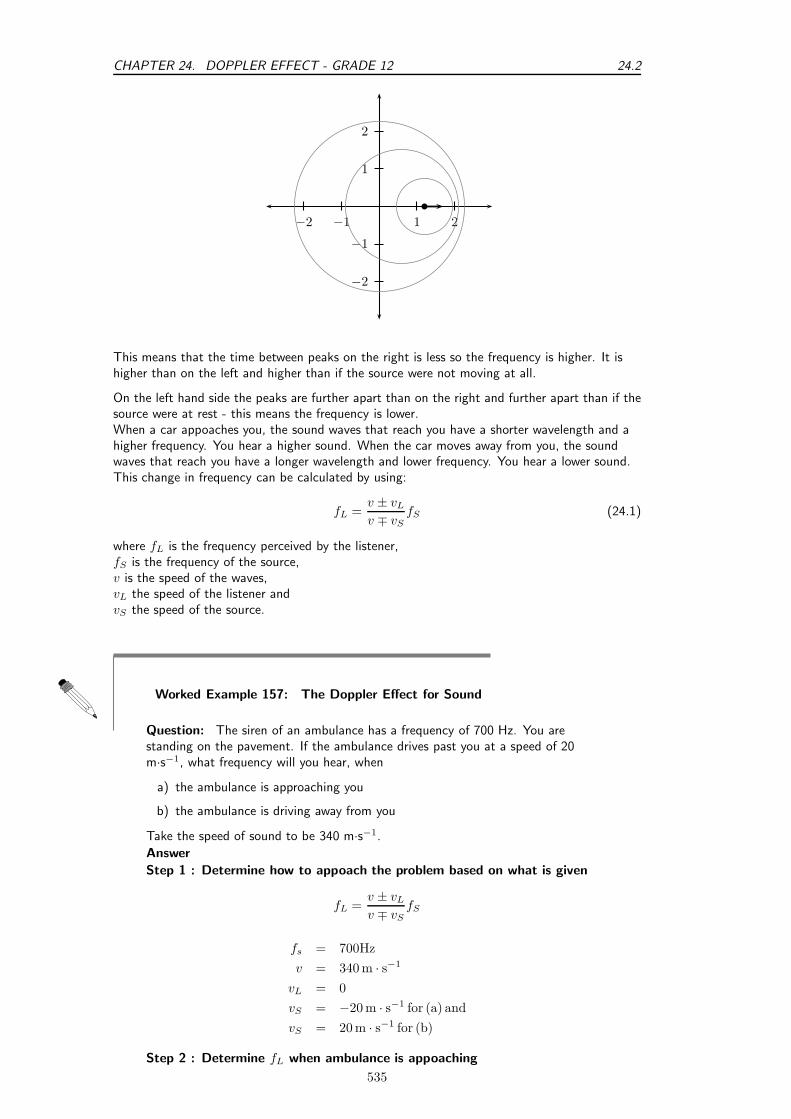
CHAPTER 24. DOPPLER EFFECT - GRADE 12 24.2
1 2−1−2
1
2
−1
−2
This means that the time between peaks on the right is less so the frequency is higher. It ishigher than on the left and higher than if the source were not moving at all.
On the left hand side the peaks are further apart than on the right and further apart than if thesource were at rest - this means the frequency is lower.When a car appoaches you, the sound waves that reach you have a shorter wavelength and ahigher frequency. You hear a higher sound. When the car moves away from you, the soundwaves that reach you have a longer wavelength and lower frequency. You hear a lower sound.This change in frequency can be calculated by using:
fL =v ± vL
v ∓ vS
fS (24.1)
where fL is the frequency perceived by the listener,fS is the frequency of the source,v is the speed of the waves,vL the speed of the listener andvS the speed of the source.
Worked Example 157: The Doppler Effect for Sound
Question: The siren of an ambulance has a frequency of 700 Hz. You arestanding on the pavement. If the ambulance drives past you at a speed of 20m·s−1, what frequency will you hear, when
a) the ambulance is approaching you
b) the ambulance is driving away from you
Take the speed of sound to be 340 m·s−1.
Answer
Step 1 : Determine how to appoach the problem based on what is given
fL =v ± vL
v ∓ vS
fS
fs = 700Hz
v = 340 m · s−1
vL = 0
vS = −20 m · s−1 for (a) and
vS = 20 m · s−1 for (b)
Step 2 : Determine fL when ambulance is appoaching
535

24.2 CHAPTER 24. DOPPLER EFFECT - GRADE 12
fL =340 + 0
340 − 20(700)
= 743,75Hz
Step 3 : Determine fL when ambulance has passed
fL =340 + 0
340 + 20(700)
= 661,11Hz
Worked Example 158: The Doppler Effect for Sound 2
Question: What is the frequency heard by a person driving at 15 m·s−1 toward afactory whistle that is blowing at a frequency of 800 Hz. Assume that the speed ofsound is 340 m·s−1.AnswerStep 1 : Determine how to approach the problem based on what is givenWe can use
fL =v ± vL
v ∓ vS
fS
with:
v = 340,6 m · s−1
vL = +15 m · s−1
vS = 0 m · s−1
fS = 800 Hz
fL = ?
The listener is moving towards the source, so vL is positive.Step 2 : Calculate the frequency
fL =v ± vL
v ∓ vS
fS
=340,6 m · s−1 + 15 m · s−1
340,6 m · s−1 + 0 m · s−1(800 Hz)
= 835 Hz
Step 3 : Write the final answerThe driver hears a frequency of 835 Hz.
Interesting
Fact
teresting
FactRadar-based speed-traps use the Doppler Effect. The radar gun emits radio
waves of a specific frequency. When the car is standing still, the waves reflectedwaves are the same frequency as the waves emitted by the radar gun. Whenthe car is moving the Doppler frequency shift can be used to determine thespeed of the car.
536

CHAPTER 24. DOPPLER EFFECT - GRADE 12 24.3
24.2.1 Ultrasound and the Doppler Effect
Ultrasonic waves (ultrasound) are sound waves with a frequency greater than 20 000 Hz (theupper limit of hearing). These waves can be used in medicine to determine the direction ofblood flow. The device, called a Doppler flow meter, sends out sound waves. The sound wavescan travle through skin and tissue and will be reflected by moving objects in the body (likeblood). The reflected waves return to the flow meter where its frequency (received frequency)is compared to the transmitted frequency. Because of the Doppler effect, blood that is movingtowards the flow meter will change the sound to a higher frequency (blue shift) and blood thatis moving away from the flow meter will cause a lower frequency (red shift).
Skin
Blood
Tissue
red blood cellsdirection of flow
transmitter receiver
Ultrasound can be used to determine whether blood is flowing in the right direction in thecirculation system of unborn babies, or identify areas in the body where blood flow is restricteddue to narrow veins. The use of ultrasound equipment in medicine is called sonography orultrasonography.
Exercise: The Doppler Effect with Sound
1. Suppose a train is approaching you as you stand on the platform at thestation. As the train approaches the station, it slows down. All the while, theengineer is sounding the hooter at a constant frequency of 400 Hz. Describethe pitch and the changes in pitch that you hear.
2. Passengers on a train hear its whistle at a frequency of 740 Hz. Anja isstanding next to the train tracks. What frequency does Anja hear as the trainmoves directly toward her at a speed of 25 m·s−1?
3. A small plane is taxiing directly away from you down a runway. The noise ofthe engine, as the pilot hears it, has a frequency 1,15 times the frequency thatyou hear. What is the speed of the plane?
4. A Doppler flow meter detected a blue shift in frequency while determining thedirection of blood flow. What does a ”blue shift” mean and how does it takeplace?
24.3 The Doppler Effect with Light
Light is a wave and earlier you learnt how you can study the properties of one wave and applythe same ideas to another wave. The same applies to sound and light. We know the Doppler
537
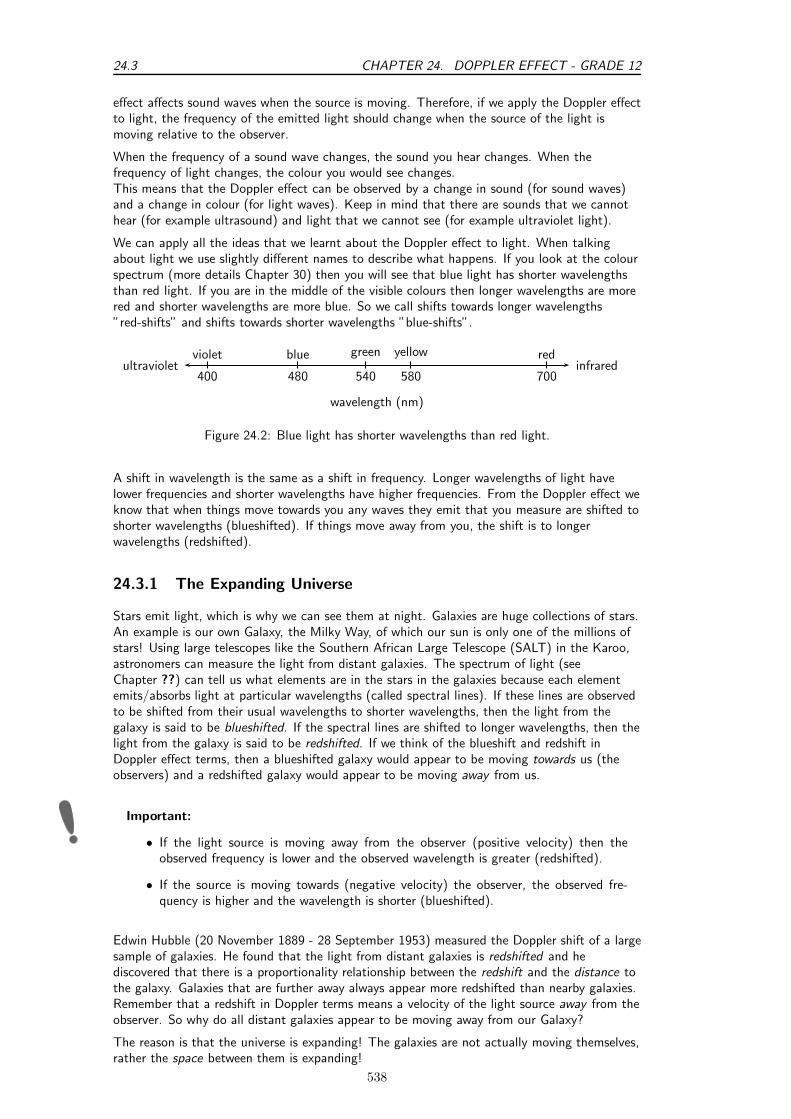
24.3 CHAPTER 24. DOPPLER EFFECT - GRADE 12
effect affects sound waves when the source is moving. Therefore, if we apply the Doppler effectto light, the frequency of the emitted light should change when the source of the light ismoving relative to the observer.
When the frequency of a sound wave changes, the sound you hear changes. When thefrequency of light changes, the colour you would see changes.This means that the Doppler effect can be observed by a change in sound (for sound waves)and a change in colour (for light waves). Keep in mind that there are sounds that we cannothear (for example ultrasound) and light that we cannot see (for example ultraviolet light).
We can apply all the ideas that we learnt about the Doppler effect to light. When talkingabout light we use slightly different names to describe what happens. If you look at the colourspectrum (more details Chapter 30) then you will see that blue light has shorter wavelengthsthan red light. If you are in the middle of the visible colours then longer wavelengths are morered and shorter wavelengths are more blue. So we call shifts towards longer wavelengths”red-shifts” and shifts towards shorter wavelengths ”blue-shifts”.
violet
400
blue
480
green
540
yellow
580
red
700ultraviolet infrared
wavelength (nm)
Figure 24.2: Blue light has shorter wavelengths than red light.
A shift in wavelength is the same as a shift in frequency. Longer wavelengths of light havelower frequencies and shorter wavelengths have higher frequencies. From the Doppler effect weknow that when things move towards you any waves they emit that you measure are shifted toshorter wavelengths (blueshifted). If things move away from you, the shift is to longerwavelengths (redshifted).
24.3.1 The Expanding Universe
Stars emit light, which is why we can see them at night. Galaxies are huge collections of stars.An example is our own Galaxy, the Milky Way, of which our sun is only one of the millions ofstars! Using large telescopes like the Southern African Large Telescope (SALT) in the Karoo,astronomers can measure the light from distant galaxies. The spectrum of light (seeChapter ??) can tell us what elements are in the stars in the galaxies because each elementemits/absorbs light at particular wavelengths (called spectral lines). If these lines are observedto be shifted from their usual wavelengths to shorter wavelengths, then the light from thegalaxy is said to be blueshifted. If the spectral lines are shifted to longer wavelengths, then thelight from the galaxy is said to be redshifted. If we think of the blueshift and redshift inDoppler effect terms, then a blueshifted galaxy would appear to be moving towards us (theobservers) and a redshifted galaxy would appear to be moving away from us.
Important:
• If the light source is moving away from the observer (positive velocity) then theobserved frequency is lower and the observed wavelength is greater (redshifted).
• If the source is moving towards (negative velocity) the observer, the observed fre-quency is higher and the wavelength is shorter (blueshifted).
Edwin Hubble (20 November 1889 - 28 September 1953) measured the Doppler shift of a largesample of galaxies. He found that the light from distant galaxies is redshifted and hediscovered that there is a proportionality relationship between the redshift and the distance tothe galaxy. Galaxies that are further away always appear more redshifted than nearby galaxies.Remember that a redshift in Doppler terms means a velocity of the light source away from theobserver. So why do all distant galaxies appear to be moving away from our Galaxy?
The reason is that the universe is expanding! The galaxies are not actually moving themselves,rather the space between them is expanding!
538
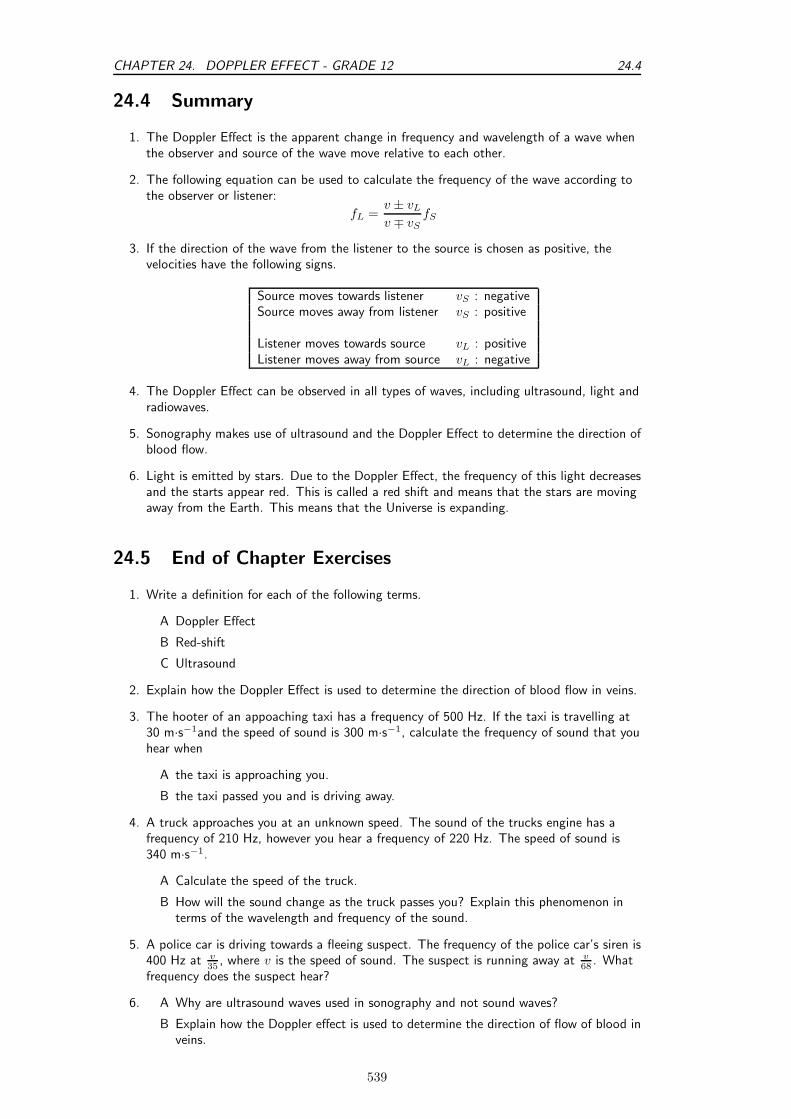
CHAPTER 24. DOPPLER EFFECT - GRADE 12 24.4
24.4 Summary
1. The Doppler Effect is the apparent change in frequency and wavelength of a wave whenthe observer and source of the wave move relative to each other.
2. The following equation can be used to calculate the frequency of the wave according tothe observer or listener:
fL =v ± vL
v ∓ vS
fS
3. If the direction of the wave from the listener to the source is chosen as positive, thevelocities have the following signs.
Source moves towards listener vS : negativeSource moves away from listener vS : positive
Listener moves towards source vL : positiveListener moves away from source vL : negative
4. The Doppler Effect can be observed in all types of waves, including ultrasound, light andradiowaves.
5. Sonography makes use of ultrasound and the Doppler Effect to determine the direction ofblood flow.
6. Light is emitted by stars. Due to the Doppler Effect, the frequency of this light decreasesand the starts appear red. This is called a red shift and means that the stars are movingaway from the Earth. This means that the Universe is expanding.
24.5 End of Chapter Exercises
1. Write a definition for each of the following terms.
A Doppler Effect
B Red-shift
C Ultrasound
2. Explain how the Doppler Effect is used to determine the direction of blood flow in veins.
3. The hooter of an appoaching taxi has a frequency of 500 Hz. If the taxi is travelling at30 m·s−1and the speed of sound is 300 m·s−1, calculate the frequency of sound that youhear when
A the taxi is approaching you.
B the taxi passed you and is driving away.
4. A truck approaches you at an unknown speed. The sound of the trucks engine has afrequency of 210 Hz, however you hear a frequency of 220 Hz. The speed of sound is340 m·s−1.
A Calculate the speed of the truck.
B How will the sound change as the truck passes you? Explain this phenomenon interms of the wavelength and frequency of the sound.
5. A police car is driving towards a fleeing suspect. The frequency of the police car’s siren is400 Hz at v
35, where v is the speed of sound. The suspect is running away at v
68. What
frequency does the suspect hear?
6. A Why are ultrasound waves used in sonography and not sound waves?
B Explain how the Doppler effect is used to determine the direction of flow of blood inveins.
539

24.5 CHAPTER 24. DOPPLER EFFECT - GRADE 12
540

Chapter 25
Colour - Grade 12
25.1 Introduction
We call the light that we humans can see ’visible light’. Visible light is actually just a smallpart of the large spectrum of electromagnetic radiation which you will learn more about inChapter 30. We can think of electromagnetic radiation and visible light as transverse waves.We know that transverse waves can be described by their amplitude, frequency (or wavelength)and velocity. The velocity of a wave is given by the product of its frequency and wavelength:
v = f × λ (25.1)
However, electromagnetic radiation, including visible light, is special because, no matter whatthe frequency, it all moves at a constant velocity (in vacuum) which is known as the speed oflight. The speed of light has the symbol c and is:
c = 3 × 10⁸ m.s−1
Since the speed of light is c, we can then say:
c = f × λ (25.2)
25.2 Colour and Light
Our eyes are sensitive to visible light over a range of wavelengths from 390 nm to 780 nm (1nm = 1 × 10⁻⁹ m). The different colours of light we see are related to specific frequencies(and wavelengths) of visible light. The wavelengths and frequencies are listed in table 25.1.
Colour Wavelength range (nm) Frequency range (Hz)
violet 390 - 455 769 - 659 ×1012
blue 455 - 492 659 - 610 ×1012
green 492 - 577 610 - 520 ×1012
yellow 577 - 597 520 - 503 ×1012
orange 597 - 622 503 - 482 ×1012
red 622 - 780 482 - 385 ×1012
Table 25.1: Colours, wavelengths and frequencies of light in the visible spectrum.
You can see from table 25.1 that violet light has the shortest wavelengths and highestfrequencies while red light has the longest wavelengths and lowest frequencies.
541
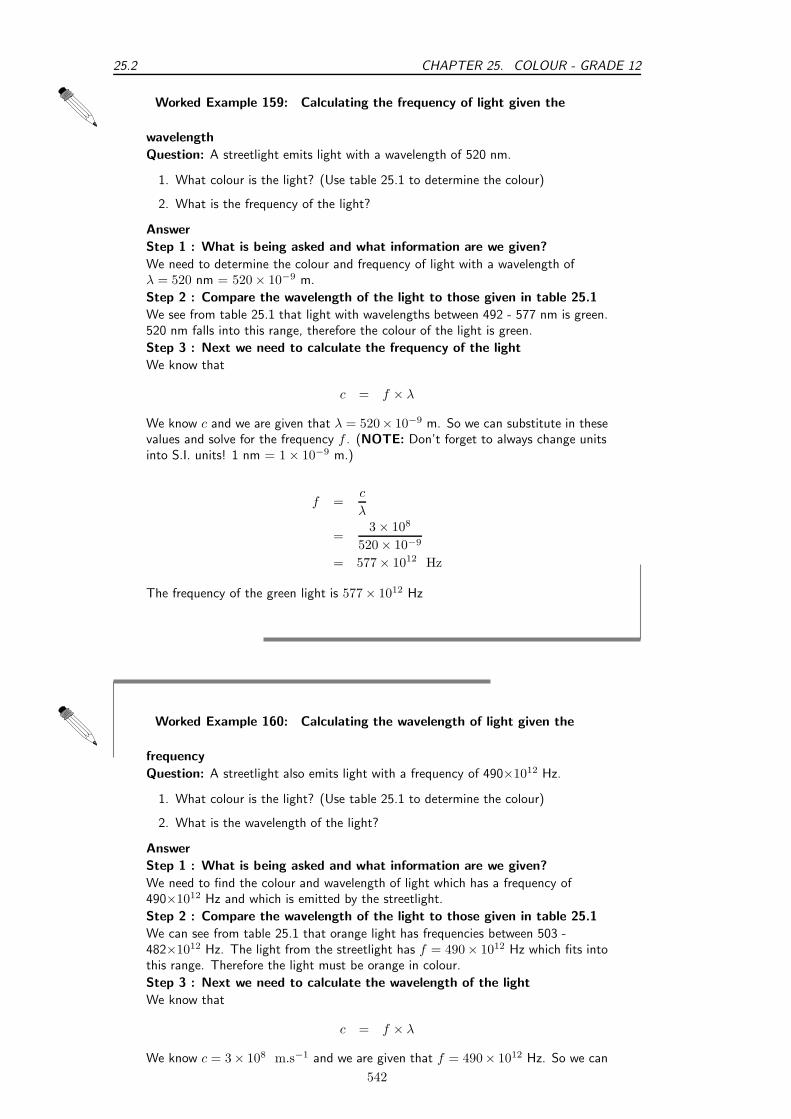
25.2 CHAPTER 25. COLOUR - GRADE 12
Worked Example 159: Calculating the frequency of light given the
wavelength
Question: A streetlight emits light with a wavelength of 520 nm.
1. What colour is the light? (Use table 25.1 to determine the colour)
2. What is the frequency of the light?
Answer
Step 1 : What is being asked and what information are we given?
We need to determine the colour and frequency of light with a wavelength ofλ = 520 nm = 520 × 10−9 m.
Step 2 : Compare the wavelength of the light to those given in table 25.1
We see from table 25.1 that light with wavelengths between 492 - 577 nm is green.520 nm falls into this range, therefore the colour of the light is green.
Step 3 : Next we need to calculate the frequency of the light
We know that
c = f × λ
We know c and we are given that λ = 520× 10−9 m. So we can substitute in thesevalues and solve for the frequency f . (NOTE: Don’t forget to always change unitsinto S.I. units! 1 nm = 1 × 10⁻⁹ m.)
f =c
λ
=3 × 10⁸
520 × 10−9
= 577 × 1012 Hz
The frequency of the green light is 577 × 1012 Hz
Worked Example 160: Calculating the wavelength of light given the
frequency
Question: A streetlight also emits light with a frequency of 490×1012 Hz.
1. What colour is the light? (Use table 25.1 to determine the colour)
2. What is the wavelength of the light?
Answer
Step 1 : What is being asked and what information are we given?
We need to find the colour and wavelength of light which has a frequency of490×1012 Hz and which is emitted by the streetlight.
Step 2 : Compare the wavelength of the light to those given in table 25.1
We can see from table 25.1 that orange light has frequencies between 503 -482×1012 Hz. The light from the streetlight has f = 490× 1012 Hz which fits intothis range. Therefore the light must be orange in colour.
Step 3 : Next we need to calculate the wavelength of the light
We know that
c = f × λ
We know c = 3× 10⁸ m.s−1 and we are given that f = 490× 1012 Hz. So we can
542

CHAPTER 25. COLOUR - GRADE 12 25.2
substitute in these values and solve for the wavelength λ.
λ =c
f
=3 × 10⁸
490 × 1012
= 6.122× 10⁻⁷ m
= 612 × 10−9 m
= 612 nm
Therefore the orange light has a wavelength of 612 nm.
Worked Example 161: Frequency of Green
Question: The wavelength of green light ranges between 500 nm an d 565 nm.Calculate the range of frequencies that correspond to this range of wavelengths.AnswerStep 1 : Determine how to approach the problemUse
c = f × λ
to determine f .Step 2 : Calculate frequency corresponding to upper limit of wavelengthrange
c = f × λ
f =c
λ
=3 × 10⁸ m · s−1
565 × 10−9 m
= 5,31 × 10¹⁴ Hz
Step 3 : Calculate frequency corresponding to lower limit of wavelengthrange
c = f × λ
f =c
λ
=3 × 10⁸ m · s−1
500 × 10−9 m
= 6,00 × 10¹⁴ Hz
Step 4 : Write final answerThe range of frequencies of green light is 5,31 × 10¹⁴ Hz to 6,00 × 10¹⁴ Hz.
Exercise: Calculating wavelengths and frequencies of light
1. Calculate the frequency of light which has a wavelength of 400 nm.(Remember to use S.I. units)
543

25.3 CHAPTER 25. COLOUR - GRADE 12
2. Calculate the wavelength of light which has a frequency of 550 × 1012 Hz.
3. What colour is light which has a wavelength of 470 × 109 m and what is itsfrequency?
4. What is the wavelength of light with a frequency of 510 × 1012 Hz and whatis its color?
25.2.1 Dispersion of white light
White light, like the light which comes from the sun, is made up of all the visible wavelengthsof light. In other words, white light is a combination of all the colours of visible light.
In Chapter 7, you learnt that the speed of light is different in different substances. The speedof light in different substances depends on the frequency of the light. For example, when whitelight travels through glass, light of the different frequencies is slowed down by differentamounts. The lower the frequency, the less the speed is reduced which means that red light(lowest frequency) is slowed down less than violet light (highest frequency). We can see thiswhen white light is incident on a glass prism.
Have a look at the picture below. When the white light hits the edge of the prism, the lightwhich travels through the glass is refracted as it moves from the less dense medium (air) to themore dense medium (glass).
redorange
yellowgreen
blueindigoviolet
white light
• The red light which is slowed down the least, is refracted the least.
• The violet light which is slowed down the most, is refracted the most.
When the light hits the other side of the prism it is again refracted but the angle of the prismedge allows the light to remain separated into its different colours. White light is thereforeseparated into its different colours by the prism and we say that the white light has beendispersed by the prism.
The dispersion effect is also responsible for why we see rainbows. When sunlight hits drops ofwater in the atmosphere, the white light is dispersed into its different colours by the water.
25.3 Addition and Subtraction of Light
25.3.1 Additive Primary Colours
The primary colours of light are red, green and blue. When all the primary colours aresuperposed (added together), white light is produced. Red, green and blue are therefore calledthe additive primary colours. All the other colours can be produced by different combinationsof red, green and blue.
544

CHAPTER 25. COLOUR - GRADE 12 25.3
25.3.2 Subtractive Primary Colours
The subtractive primary colours are obtained by subtracting one of the three additive primarycolours from white light. The subtractive primary colours are yellow, magenta and cyan.Magenta appears as a pinkish-purplish colour and cyan looks greenish-blue. You can see howthe primary colours of light add up to the different subtractive colours in the illustration below.
red green blue white+ + =
red green+ yellow=
red + blue magenta=
green blue cyan+ =
PRIMARY COLOURS SUBTRACTIVEPRIMARY COLOURS
Activity :: Experiment : Colours of lightAim:To investigate the additive properties of colours and determine the complementarycolours of light.Apparatus:You will need two battery operated torches with flat bulb fronts, a large piece ofwhite paper, and some pieces of cellophane paper of the following colours: red,blue, green, yellow, cyan, magenta. (You should easily be able to get these from anewsagents.)Make a table in your workbook like the one below:
Colour 1 Colour 2 Final colour prediction Final colour measured
red bluered greengreen bluemagenta greenyellow bluecyan red
Before you begin your experiment, use what you know about colours of light towrite down in the third column ”Final colour prediction”, what you think the resultof adding the two colours of light will be. You will then be able to test yourpredictions by making the following measurements:Method:Proceed according to the table above. Put the correct colour of cellophane paperover each torch bulb. e.g. the first test will be to put red cellophane on one torchand blue cellophane on the other. Switch on the torch with the red cellophane overit and shine it onto the piece of white paper.What colour is the light?Turn off that torch and turn on the one with blue cellophane and shine it onto thewhite paper.What colour is the light?Now shine both torches with their cellophane coverings onto the same spot on thewhite paper. What is the colour of the light produced? Write this down in thefourth column of your table.Repeat the experiment for the other colours of cellophane so that you cancomplete your table.
Questions:
545

25.3 CHAPTER 25. COLOUR - GRADE 12
1. How did your predictions match up to your measurements?
2. Complementary colours of light are defined as the colours of light which,when added to one of the primary colours, produce white light. From yourcompleted table, write down the complementary colours for red, blue andgreen.
25.3.3 Complementary Colours
Complementary colours are two colours of light which add together to give white.
Activity :: Investigation : Complementary colours for red, green and blueComplementary colours are two colours which add together to give white. Place
a tick in the box where the colours in the first column added to the colours in thetop row give white.
magenta yellow cyan(=red+blue) (=red+green) (=blue+green)
redgreenblue
You should have found that the complementary colours for red, green and blue are:
• Red and Cyan
• Green and Magenta
• Blue and Yellow
25.3.4 Perception of Colour
The light-sensitive lining on the back inside half of the human eye is called the retina. Theretina contains two kinds of light sensitive cells or photoreceptors: the rod cells (sensitive tolow light) and the cone cells (sensitive to normal daylight) which enable us to see. The rodsare not very sensitive to colour but work well in dimly lit conditions. This is why it is possibleto see in a dark room, but it is hard to see any colours. Only your rods are sensitive to the lowlight levels and so you can only see in black, white and grey. The cones enable us to seecolours. Normally, there are three kinds of cones, each containing a different pigment. Thecones are activated when the pigments absorb light. The three types of cones are sensitive to(i.e. absorb) red, blue and green light respectively. Therefore we can perceive all the differentcolours in the visible spectrum when the different types of cones are stimulated by differentamounts since they are just combinations of the three primary colours of light.
The rods and cones have different response times to light. The cones react quickly when brightlight falls on them. The rods take a longer time to react. This is why it takes a while (about 10minutes) for your eyes to adjust when you enter a dark room after being outside on a sunny day.
546
CHAPTER 25. COLOUR - GRADE 12 25.3
Interesting
Fact
teresting
FactColor blindness in humans is the inability to perceive differences between someor all colors that other people can see. Most often it is a genetic problem, butmay also occur because of eye, nerve, or brain damage, or due to exposure tocertain chemicals. The most common forms of human color blindness resultfrom problems with either the middle or long wavelength sensitive conesystems, and involve difficulties in discriminating reds, yellows, and greens fromone another. This is called ”red-green color blindness”. Other forms of colorblindness are much rarer. They include problems in discriminating blues fromyellows, and the rarest forms of all, complete color blindness or monochromasy,where one cannot distinguish any color from grey, as in a black-and-whitemovie or photograph.
Worked Example 162: Seeing Colours
Question: When blue and green light fall on an eye, is cyan light being created?Discuss.
Answer
Cyan light is not created when blue and green light fall on the eye. The blue andgreen receptors are stimulated to make the brain believe that cyan light is beingcreated.
25.3.5 Colours on a Television Screen
If you look very closely at a colour cathode-ray television screen or computer screen, you willsee that there are very many small red, green and blue dots called phosphors on it. These dotsare caused to fluoresce (glow brightly) when a beam of electrons from the cathode-ray tubebehind the screen hits them. Since different combinations of the three primary colours of lightcan produce any other colour, only red, green and blue dots are needed to make picturescontaining all the colours of the visible spectrum.
Exercise: Colours of light
1. List the three primary colours of light.
2. What is the term for the phenomenon whereby white light is split up into itsdifferent colours by a prism?
3. What is meant by the term “complementary colour” of light?
4. When white light strikes a prism which colour of light is refracted the mostand which is refracted the least? Explain your answer in terms of the speed oflight in a medium.
547

25.4 CHAPTER 25. COLOUR - GRADE 12
25.4 Pigments and Paints
We have learnt that white light is a combination of all the colours of the visible spectrum andthat each colour of light is related to a different frequency. But what gives everyday objectsaround us their different colours?
Pigments are substances which give an object its colour by absorbing certain frequencies oflight and reflecting other frequencies. For example, a red pigment absorbs all colours of lightexcept red which it reflects. Paints and inks contain pigments which gives the paints and inksdifferent colours.
25.4.1 Colour of opaque objects
Objects which you cannot see through (i.e. they are not transparent) are called opaque.Examples of some opaque objects are metals, wood and bricks. The colour of an opaque objectis determined by the colours (therefore frequencies) of light which it reflects. For example,when white light strikes a blue opaque object such as a ruler, the ruler will absorb allfrequencies of light except blue, which will be reflected. The reflected blue light is the lightwhich makes it into our eyes and therefore the object will appear blue.
Opaque objects which appear white do not absorb any light. They reflect all the frequencies.Black opaque objects absorb all frequencies of light. They do not reflect at all and thereforeappear to have no colour.
Worked Example 163: Colour of Opaque Objects
Question: If we shine white light on a sheet of paper that can only reflect greenlight, what is the colour of the paper?AnswerSince the colour of an object is determined by that frequency of light that isreflected, the sheet of paper will appear green, as this is the only frequency that isreflected. All the other frequencies are absorbed by the paper.
Worked Example 164: Colour of an opaque object II
Question: The cover of a book appears to have a magenta colour. What coloursof light does it reflect and what colours does it absorb?AnswerWe know that magenta is a combination of red and blue primary colours of light.Therefore the object must be reflecting blue and red light and absorb green.
25.4.2 Colour of transparent objects
If an object is transparent it means that you can see through it. For example, glass, cleanwater and some clear plastics are transparent. The colour of a transparent object is determinedby the colours (frequencies) of light which it transmits (allows to pass through it). Forexample, a cup made of green glass will appear green because it absorbs all the otherfrequencies of light except green, which it transmits. This is the light which we receive in oureyes and the object appears green.
548

CHAPTER 25. COLOUR - GRADE 12 25.4
Worked Example 165: Colour of Transparent Objects
Question: If white light is shone through a glass plate that absorbs light of allfrequencies except red, what is the colour of the glass plate?AnswerSince the colour of an object is determined by that frequency of light that istransmitted, the glass plate will appear red, as this is the only frequency that is notabsorbed.
25.4.3 Pigment primary colours
The primary pigments and paints are cyan, magenta and yellow. When pigments or paints ofthese three colours are mixed together in equal amounts they produce black. Any other colourof paint can be made by mixing the primary pigments together in different quantities. Theprimary pigments are related to the primary colours of light in the following way:
cyan magenta yellow black+ + =
blue=
green=
red=
PRIMARY PIGMENTS
cyan magenta+
cyan yellow+
magenta yellow+
PRIMARYCOLOURSOF LIGHT
PRIMARY PIGMENTS
Interesting
Fact
teresting
FactColour printers only use 4 colours of ink: cyan, magenta, yellow and black. Allthe other colours can be mixed from these!
Worked Example 166: Pigments
Question: What colours of light are absorbed by a green pigment?AnswerIf the pigment is green, then green light must be reflected. Therefore, red and bluelight are absorbed.
549
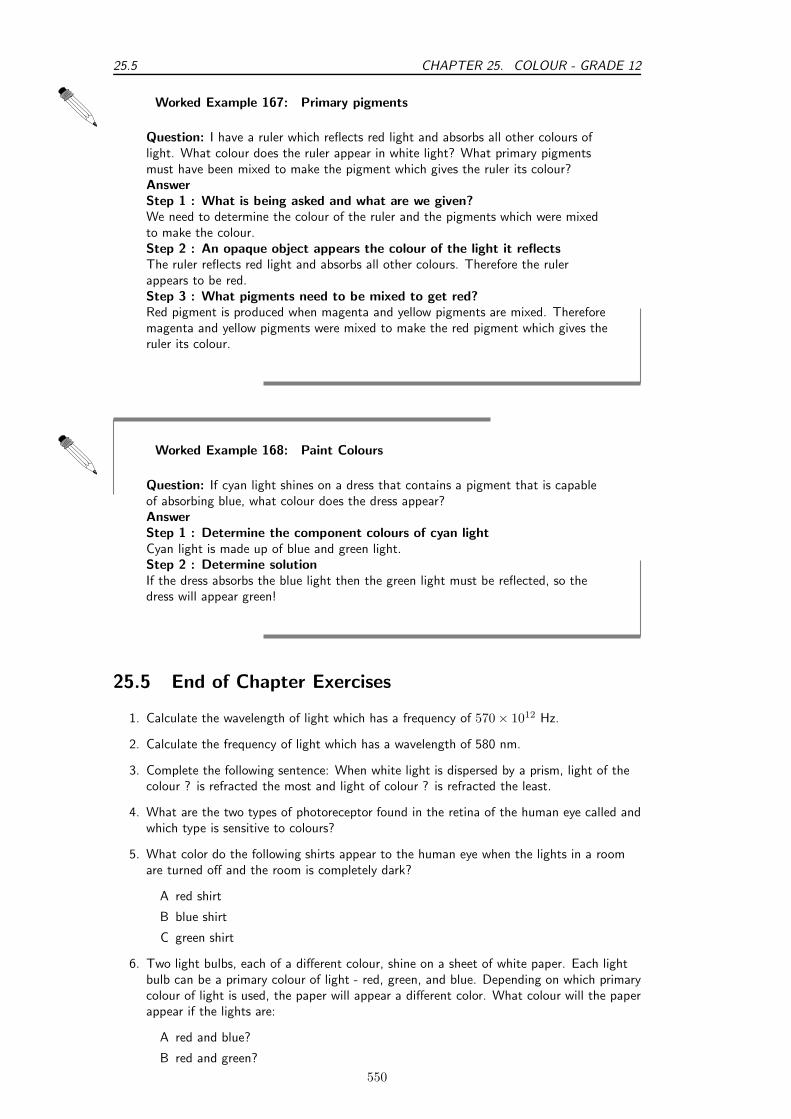
25.5 CHAPTER 25. COLOUR - GRADE 12
Worked Example 167: Primary pigments
Question: I have a ruler which reflects red light and absorbs all other colours oflight. What colour does the ruler appear in white light? What primary pigmentsmust have been mixed to make the pigment which gives the ruler its colour?AnswerStep 1 : What is being asked and what are we given?We need to determine the colour of the ruler and the pigments which were mixedto make the colour.Step 2 : An opaque object appears the colour of the light it reflectsThe ruler reflects red light and absorbs all other colours. Therefore the rulerappears to be red.Step 3 : What pigments need to be mixed to get red?Red pigment is produced when magenta and yellow pigments are mixed. Thereforemagenta and yellow pigments were mixed to make the red pigment which gives theruler its colour.
Worked Example 168: Paint Colours
Question: If cyan light shines on a dress that contains a pigment that is capableof absorbing blue, what colour does the dress appear?AnswerStep 1 : Determine the component colours of cyan lightCyan light is made up of blue and green light.Step 2 : Determine solutionIf the dress absorbs the blue light then the green light must be reflected, so thedress will appear green!
25.5 End of Chapter Exercises
1. Calculate the wavelength of light which has a frequency of 570 × 1012 Hz.
2. Calculate the frequency of light which has a wavelength of 580 nm.
3. Complete the following sentence: When white light is dispersed by a prism, light of thecolour ? is refracted the most and light of colour ? is refracted the least.
4. What are the two types of photoreceptor found in the retina of the human eye called andwhich type is sensitive to colours?
5. What color do the following shirts appear to the human eye when the lights in a roomare turned off and the room is completely dark?
A red shirt
B blue shirt
C green shirt
6. Two light bulbs, each of a different colour, shine on a sheet of white paper. Each lightbulb can be a primary colour of light - red, green, and blue. Depending on which primarycolour of light is used, the paper will appear a different color. What colour will the paperappear if the lights are:
A red and blue?
B red and green?
550

CHAPTER 25. COLOUR - GRADE 12 25.5
C green and blue?
7. Match the primary colour of light on the left to its complementary colour on the right:
Column A Column Bred yellowgreen cyanblue magenta
8. Which combination of colours of light gives magenta?
A red and yellow
B green and red
C blue and cyan
D blue and red
9. Which combination of colours of light gives cyan?
A yellow and red
B green and blue
C blue and magenta
D blue and red
10. If yellow light falls on an object whose pigment absorbs green light, what colour will theobject appear?
11. If yellow light falls on a blue pigment, what colour will it appear?
551

25.5 CHAPTER 25. COLOUR - GRADE 12
552
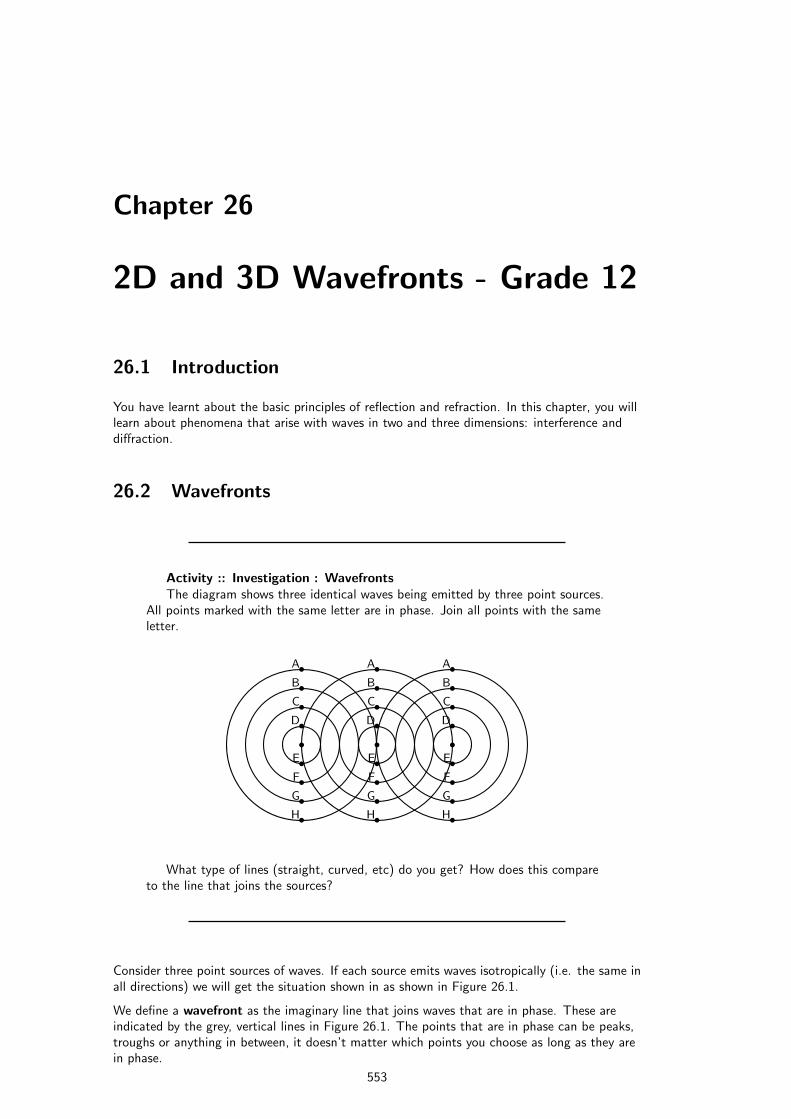
Chapter 26
2D and 3D Wavefronts - Grade 12
26.1 Introduction
You have learnt about the basic principles of reflection and refraction. In this chapter, you willlearn about phenomena that arise with waves in two and three dimensions: interference anddiffraction.
26.2 Wavefronts
Activity :: Investigation : WavefrontsThe diagram shows three identical waves being emitted by three point sources.
All points marked with the same letter are in phase. Join all points with the sameletter.
b b b
bb b
bb b
bb b
bb b
bb b
bb b
bb b
bb b
bb bAA A
BB B
CC C
DD D
EE E
FF F
GG G
HH H
What type of lines (straight, curved, etc) do you get? How does this compareto the line that joins the sources?
Consider three point sources of waves. If each source emits waves isotropically (i.e. the same inall directions) we will get the situation shown in as shown in Figure 26.1.
We define a wavefront as the imaginary line that joins waves that are in phase. These areindicated by the grey, vertical lines in Figure 26.1. The points that are in phase can be peaks,troughs or anything in between, it doesn’t matter which points you choose as long as they arein phase.
553
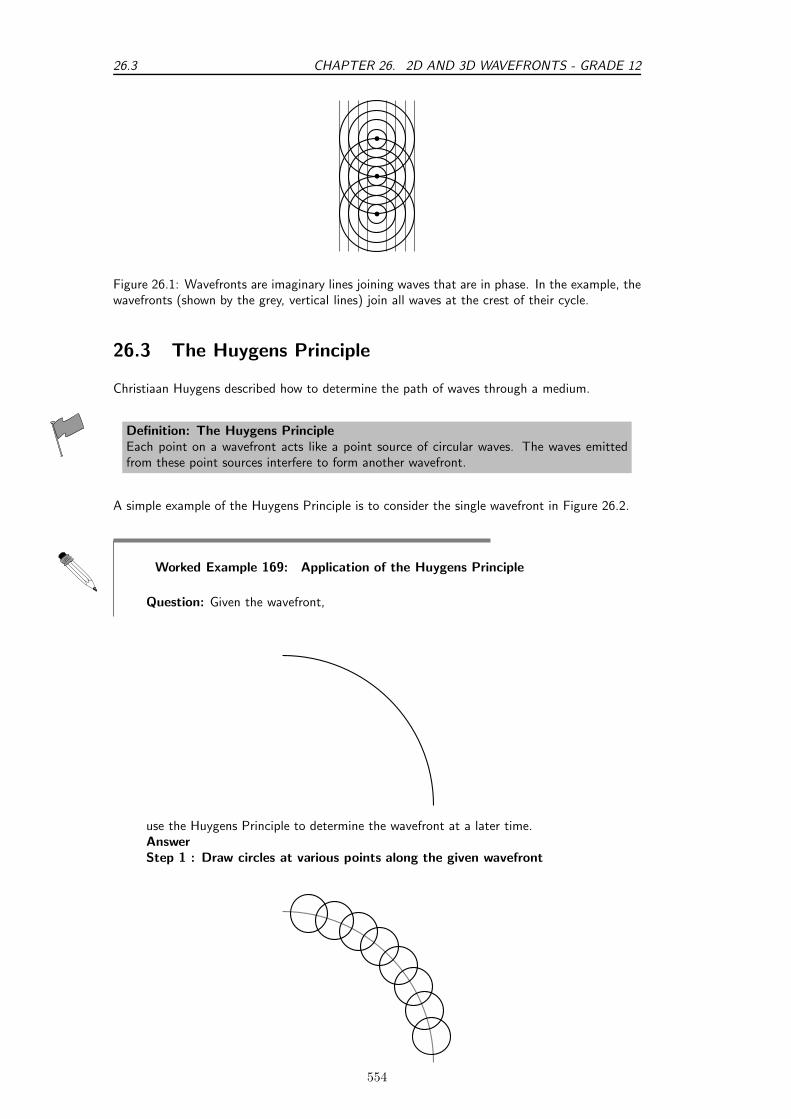
26.3 CHAPTER 26. 2D AND 3D WAVEFRONTS - GRADE 12
b
b
b
Figure 26.1: Wavefronts are imaginary lines joining waves that are in phase. In the example, thewavefronts (shown by the grey, vertical lines) join all waves at the crest of their cycle.
26.3 The Huygens Principle
Christiaan Huygens described how to determine the path of waves through a medium.
Definition: The Huygens PrincipleEach point on a wavefront acts like a point source of circular waves. The waves emittedfrom these point sources interfere to form another wavefront.
A simple example of the Huygens Principle is to consider the single wavefront in Figure 26.2.
Worked Example 169: Application of the Huygens Principle
Question: Given the wavefront,
use the Huygens Principle to determine the wavefront at a later time.AnswerStep 1 : Draw circles at various points along the given wavefront
554

CHAPTER 26. 2D AND 3D WAVEFRONTS - GRADE 12 26.3
wavefront at time t
b
b
b
b
b
wavefront at time tacts a source of circular waves
b
b
b
b
b
wavefront at time t + ∆t
Figure 26.2: A single wavefront at time t acts as a series of point sources of circular waves thatinterfere to give a new wavefront at a time t + ∆t. The process continues and applies to anyshape of waveform.
Step 2 : Join the crests of each circle to get the wavefront at a later time
Interesting
Fact
teresting
FactChristiaan Huygens (14 April 1629 - 8 July 1695), was a Dutch mathematician,astronomer and physicist; born in The Hague as the son of ConstantijnHuygens. He studied law at the University of Leiden and the College of Orangein Breda before turning to science. Historians commonly associate Huygenswith the scientific revolution.
Huygens generally receives minor credit for his role in the development ofmodern calculus. He also achieved note for his arguments that light consisted ofwaves; see: wave-particle duality. In 1655, he discovered Saturn’s moon Titan.He also examined Saturn’s planetary rings, and in 1656 he discovered that thoserings consisted of rocks. In the same year he observed and sketched the OrionNebula. He also discovered several interstellar nebulae and some double stars.
555
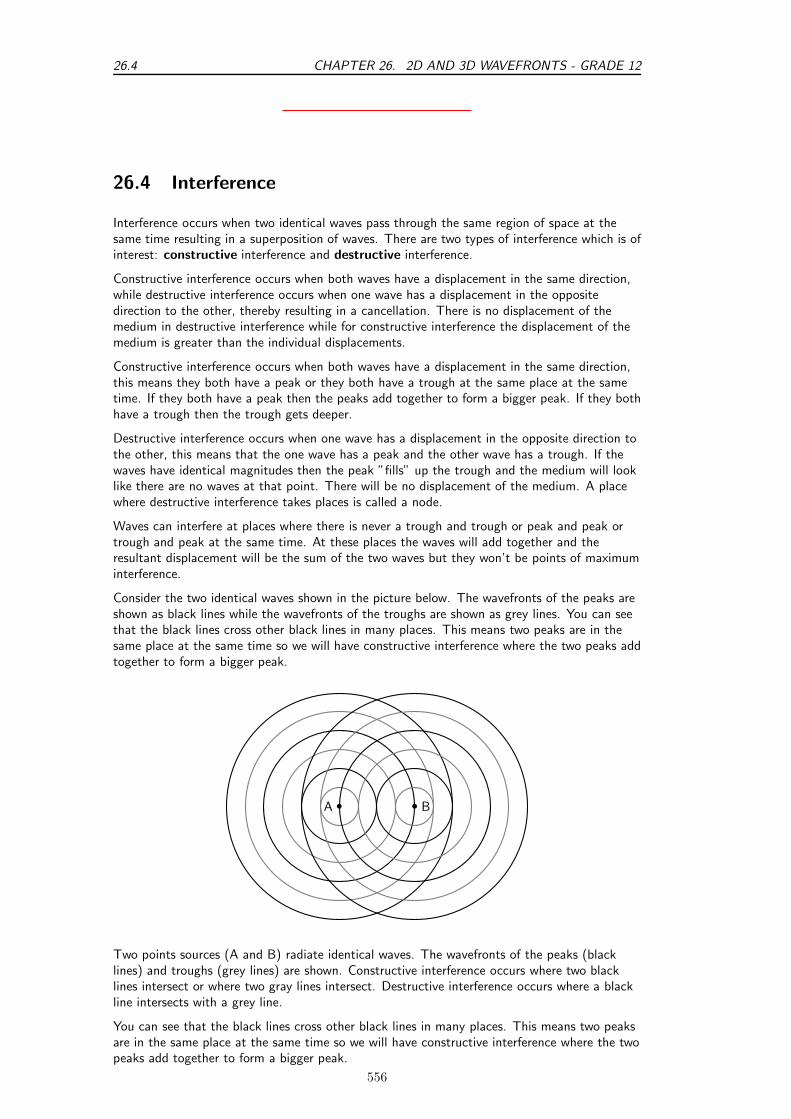
26.4 CHAPTER 26. 2D AND 3D WAVEFRONTS - GRADE 12
26.4 Interference
Interference occurs when two identical waves pass through the same region of space at thesame time resulting in a superposition of waves. There are two types of interference which is ofinterest: constructive interference and destructive interference.
Constructive interference occurs when both waves have a displacement in the same direction,while destructive interference occurs when one wave has a displacement in the oppositedirection to the other, thereby resulting in a cancellation. There is no displacement of themedium in destructive interference while for constructive interference the displacement of themedium is greater than the individual displacements.
Constructive interference occurs when both waves have a displacement in the same direction,this means they both have a peak or they both have a trough at the same place at the sametime. If they both have a peak then the peaks add together to form a bigger peak. If they bothhave a trough then the trough gets deeper.
Destructive interference occurs when one wave has a displacement in the opposite direction tothe other, this means that the one wave has a peak and the other wave has a trough. If thewaves have identical magnitudes then the peak ”fills” up the trough and the medium will looklike there are no waves at that point. There will be no displacement of the medium. A placewhere destructive interference takes places is called a node.
Waves can interfere at places where there is never a trough and trough or peak and peak ortrough and peak at the same time. At these places the waves will add together and theresultant displacement will be the sum of the two waves but they won’t be points of maximuminterference.
Consider the two identical waves shown in the picture below. The wavefronts of the peaks areshown as black lines while the wavefronts of the troughs are shown as grey lines. You can seethat the black lines cross other black lines in many places. This means two peaks are in thesame place at the same time so we will have constructive interference where the two peaks addtogether to form a bigger peak.
A Bb b
Two points sources (A and B) radiate identical waves. The wavefronts of the peaks (blacklines) and troughs (grey lines) are shown. Constructive interference occurs where two blacklines intersect or where two gray lines intersect. Destructive interference occurs where a blackline intersects with a grey line.
You can see that the black lines cross other black lines in many places. This means two peaksare in the same place at the same time so we will have constructive interference where the twopeaks add together to form a bigger peak.
556

CHAPTER 26. 2D AND 3D WAVEFRONTS - GRADE 12 26.5
When the grey lines cross other grey lines there are two troughs are in the same place at thesame time so we will have constructive interference where the two troughs add together toform a bigger trough.
In the case where a grey line crosses a black line we are seeing a trough and peak in the sameplace. These will cancel each other out and the medium will have no displacement at thatpoint.
• black line + black line = peak + peak = constructive interference
• grey line + grey line = trough + trough = constructive interference
• black line + grey line = grey line + black line = peak + trough = trough + peak =destructive interference
On half the picture below, we have marked the constructive interference with a solid blackdiamond and the destructive interference with a hollow diamond.
A Bb b l
l
l
l
l
l
l
l
l
l
l
l
l
l
l
l
ld
ld
ld
ld
ld
ld
ld
ld
ld
ld
ld
ld
ld
ld
To see if you understand it, cover up the half we have marked with diamonds and try to workout which points are constructive and destructive on the other half of the picture. The twohalves are mirror images of each other so you can check yourself.
26.5 Diffraction
One of the most interesting, and also very useful, properties of waves is diffraction.
Definition: DiffractionDiffraction is the ability of a wave to spread out in wavefronts as the wave passes througha small aperture or around a sharp edge.
Extension: DiffractionDiffraction refers to various phenomena associated with wave propagation, such
as the bending, spreading and interference of waves emerging from an aperture. Itoccurs with any type of wave, including sound waves, water waves, electromagneticwaves such as light and radio waves. While diffraction always occurs, its effects aregenerally only noticeable for waves where the wavelength is on the order of thefeature size of the diffracting objects or apertures.
For example, if two rooms are connected by an open doorway and a sound is produced in aremote corner of one of them, a person in the other room will hear the sound as if it originatedat the doorway.
557
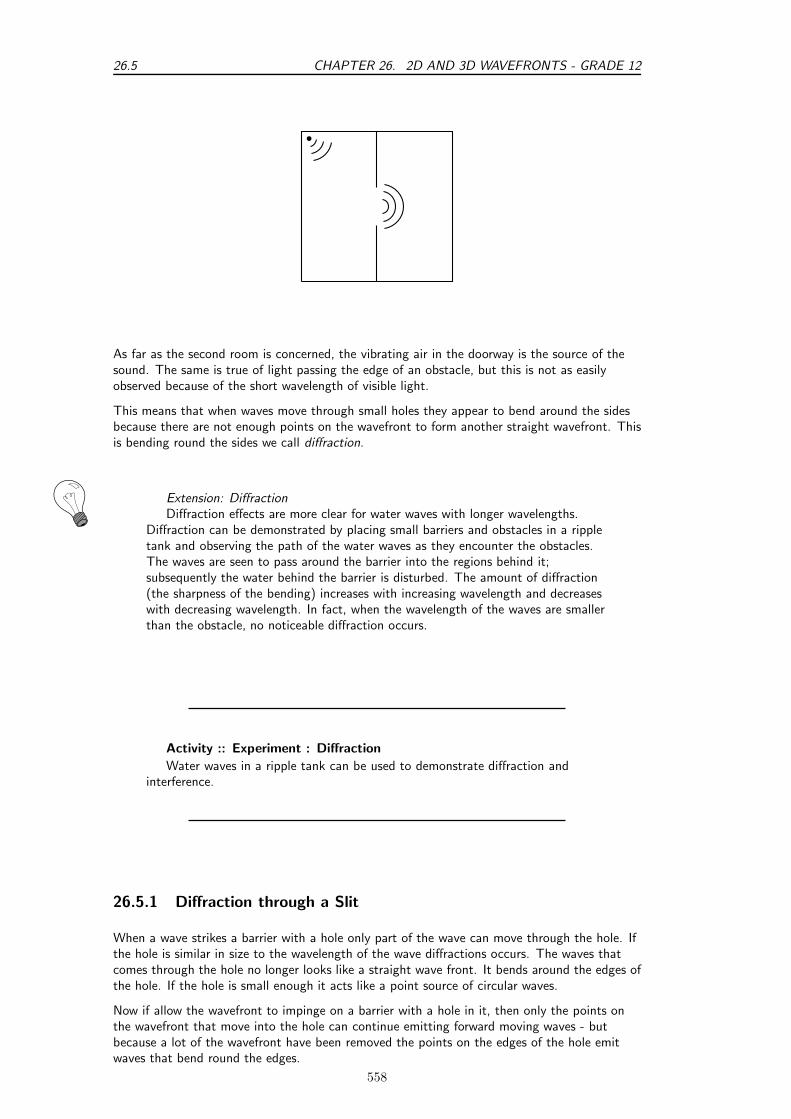
26.5 CHAPTER 26. 2D AND 3D WAVEFRONTS - GRADE 12
b
As far as the second room is concerned, the vibrating air in the doorway is the source of thesound. The same is true of light passing the edge of an obstacle, but this is not as easilyobserved because of the short wavelength of visible light.
This means that when waves move through small holes they appear to bend around the sidesbecause there are not enough points on the wavefront to form another straight wavefront. Thisis bending round the sides we call diffraction.
Extension: DiffractionDiffraction effects are more clear for water waves with longer wavelengths.
Diffraction can be demonstrated by placing small barriers and obstacles in a rippletank and observing the path of the water waves as they encounter the obstacles.The waves are seen to pass around the barrier into the regions behind it;subsequently the water behind the barrier is disturbed. The amount of diffraction(the sharpness of the bending) increases with increasing wavelength and decreaseswith decreasing wavelength. In fact, when the wavelength of the waves are smallerthan the obstacle, no noticeable diffraction occurs.
Activity :: Experiment : Diffraction
Water waves in a ripple tank can be used to demonstrate diffraction andinterference.
26.5.1 Diffraction through a Slit
When a wave strikes a barrier with a hole only part of the wave can move through the hole. Ifthe hole is similar in size to the wavelength of the wave diffractions occurs. The waves thatcomes through the hole no longer looks like a straight wave front. It bends around the edges ofthe hole. If the hole is small enough it acts like a point source of circular waves.
Now if allow the wavefront to impinge on a barrier with a hole in it, then only the points onthe wavefront that move into the hole can continue emitting forward moving waves - butbecause a lot of the wavefront have been removed the points on the edges of the hole emitwaves that bend round the edges.
558
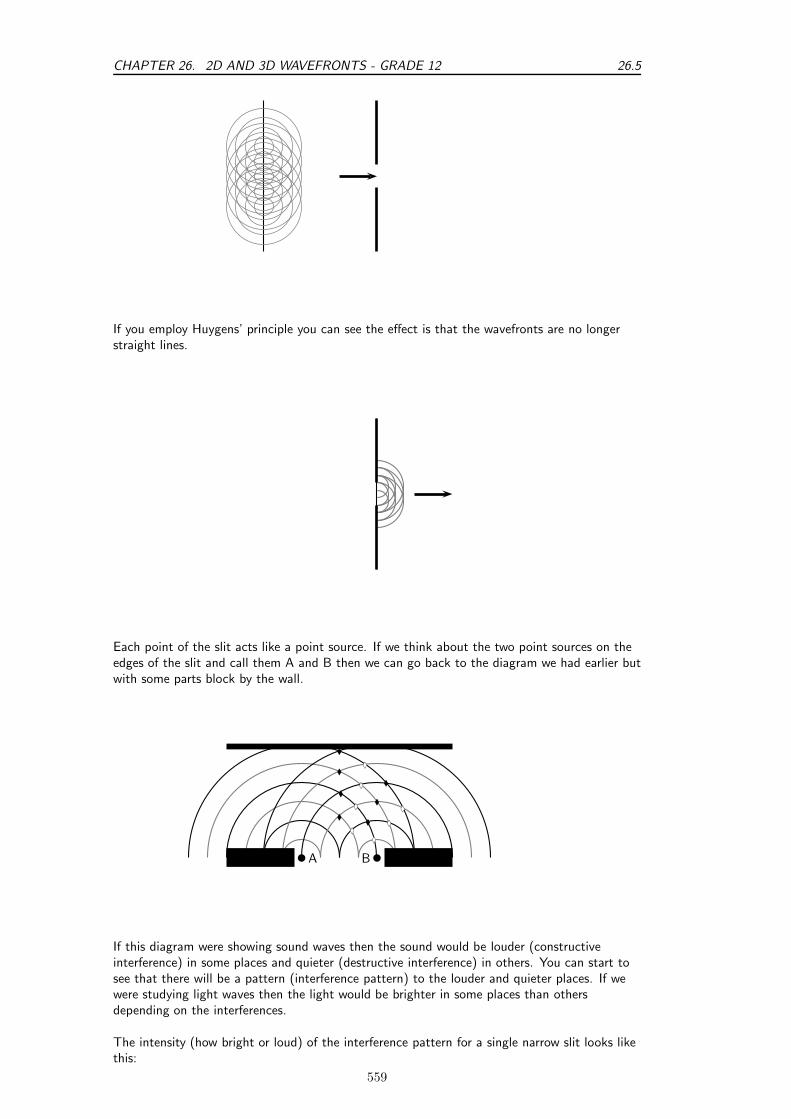
CHAPTER 26. 2D AND 3D WAVEFRONTS - GRADE 12 26.5
If you employ Huygens’ principle you can see the effect is that the wavefronts are no longerstraight lines.
Each point of the slit acts like a point source. If we think about the two point sources on theedges of the slit and call them A and B then we can go back to the diagram we had earlier butwith some parts block by the wall.
A Bb b l
l
l
l
ll
l
l
l
ld
ld
ld
ld
ld
ld
ld
If this diagram were showing sound waves then the sound would be louder (constructiveinterference) in some places and quieter (destructive interference) in others. You can start tosee that there will be a pattern (interference pattern) to the louder and quieter places. If wewere studying light waves then the light would be brighter in some places than othersdepending on the interferences.
The intensity (how bright or loud) of the interference pattern for a single narrow slit looks likethis:
559
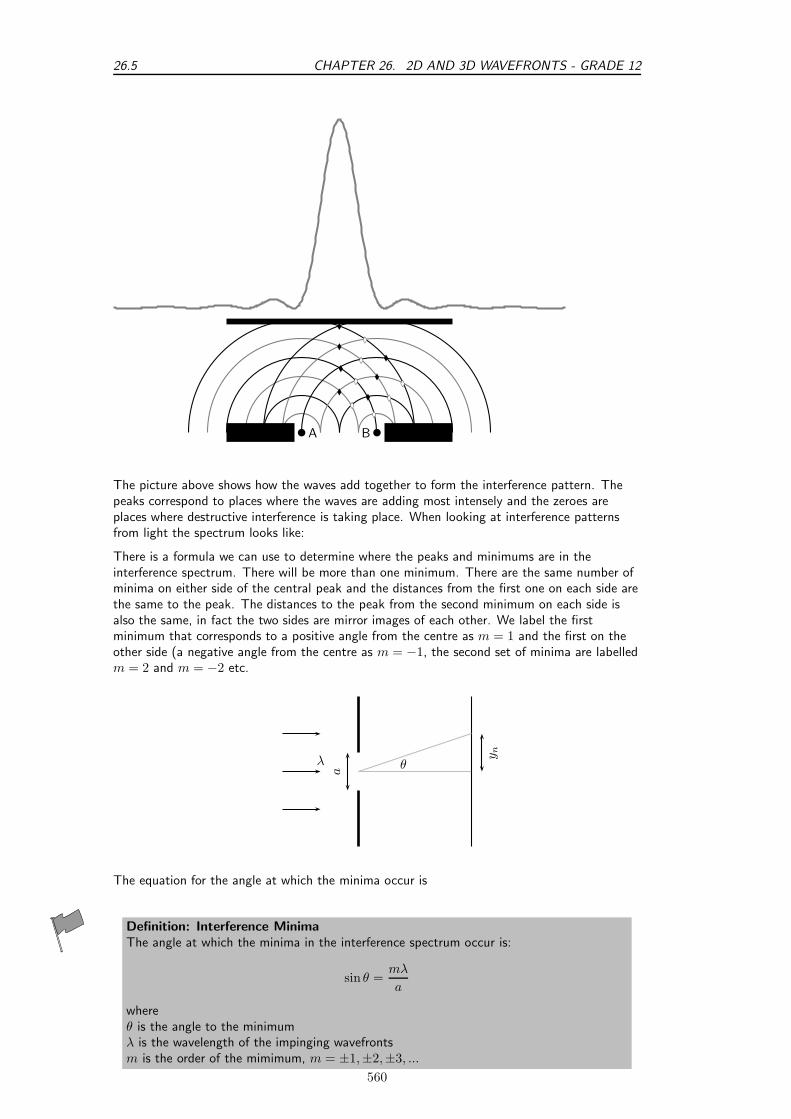
26.5 CHAPTER 26. 2D AND 3D WAVEFRONTS - GRADE 12
A Bb b l
l
l
l
ll
l
l
l
ld
ld
ld
ld
ld
ld
ld
The picture above shows how the waves add together to form the interference pattern. Thepeaks correspond to places where the waves are adding most intensely and the zeroes areplaces where destructive interference is taking place. When looking at interference patternsfrom light the spectrum looks like:
There is a formula we can use to determine where the peaks and minimums are in theinterference spectrum. There will be more than one minimum. There are the same number ofminima on either side of the central peak and the distances from the first one on each side arethe same to the peak. The distances to the peak from the second minimum on each side isalso the same, in fact the two sides are mirror images of each other. We label the firstminimum that corresponds to a positive angle from the centre as m = 1 and the first on theother side (a negative angle from the centre as m = −1, the second set of minima are labelledm = 2 and m = −2 etc.
λ y n
θa
The equation for the angle at which the minima occur is
Definition: Interference MinimaThe angle at which the minima in the interference spectrum occur is:
sin θ =mλ
a
whereθ is the angle to the minimumλ is the wavelength of the impinging wavefrontsm is the order of the mimimum, m = ±1,±2,±3, ...
560
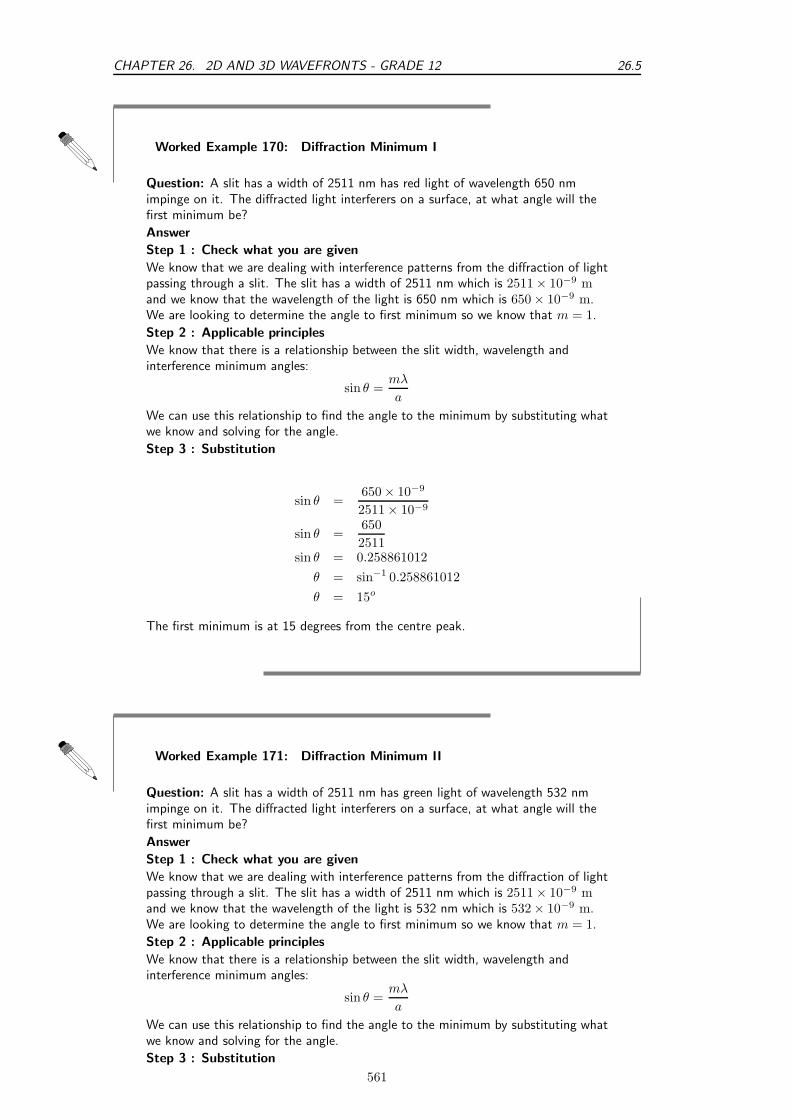
CHAPTER 26. 2D AND 3D WAVEFRONTS - GRADE 12 26.5
Worked Example 170: Diffraction Minimum I
Question: A slit has a width of 2511 nm has red light of wavelength 650 nmimpinge on it. The diffracted light interferers on a surface, at what angle will thefirst minimum be?
Answer
Step 1 : Check what you are given
We know that we are dealing with interference patterns from the diffraction of lightpassing through a slit. The slit has a width of 2511 nm which is 2511 × 10−9 mand we know that the wavelength of the light is 650 nm which is 650 × 10−9 m.We are looking to determine the angle to first minimum so we know that m = 1.
Step 2 : Applicable principles
We know that there is a relationship between the slit width, wavelength andinterference minimum angles:
sin θ =mλ
a
We can use this relationship to find the angle to the minimum by substituting whatwe know and solving for the angle.
Step 3 : Substitution
sin θ =650 × 10−9
2511 × 10−9
sin θ =650
2511sin θ = 0.258861012
θ = sin−1 0.258861012
θ = 15o
The first minimum is at 15 degrees from the centre peak.
Worked Example 171: Diffraction Minimum II
Question: A slit has a width of 2511 nm has green light of wavelength 532 nmimpinge on it. The diffracted light interferers on a surface, at what angle will thefirst minimum be?
Answer
Step 1 : Check what you are given
We know that we are dealing with interference patterns from the diffraction of lightpassing through a slit. The slit has a width of 2511 nm which is 2511 × 10−9 mand we know that the wavelength of the light is 532 nm which is 532 × 10−9 m.We are looking to determine the angle to first minimum so we know that m = 1.
Step 2 : Applicable principles
We know that there is a relationship between the slit width, wavelength andinterference minimum angles:
sin θ =mλ
a
We can use this relationship to find the angle to the minimum by substituting whatwe know and solving for the angle.
Step 3 : Substitution
561

26.6 CHAPTER 26. 2D AND 3D WAVEFRONTS - GRADE 12
sin θ =532 × 10−9
2511 × 10−9
sin θ =532
2511sin θ = 0.211867782
θ = sin−1 0.211867782
θ = 12.2o
The first minimum is at 12.2 degrees from the centre peak.
From the formula you can see that a smaller wavelength for the same slit results in a smallerangle to the interference minimum. This is something you just saw in the two workedexamples. Do a sanity check, go back and see if the answer makes sense. Ask yourself whichlight had the longer wavelength, which light had the larger angle and what do you expect forlonger wavelengths from the formula.
Worked Example 172: Diffraction Minimum III
Question: A slit has a width which is unknown and has green light of wavelength532 nm impinge on it. The diffracted light interferers on a surface, and the firstminimum is measure at an angle of 20.77 degrees?AnswerStep 1 : Check what you are givenWe know that we are dealing with interference patterns from the diffraction of lightpassing through a slit. We know that the wavelength of the light is 532 nm whichis 532× 10−9 m. We know the angle to first minimum so we know that m = 1 andθ = 20.77o.Step 2 : Applicable principlesWe know that there is a relationship between the slit width, wavelength andinterference minimum angles:
sin θ =mλ
a
We can use this relationship to find the width by substituting what we know andsolving for the width.Step 3 : Substitution
sin θ =532 × 10−9
a
sin 20.77 =532 × 10−9
a
a =532 × 10−9
0.354666667
a = 1500× 10−9
a = 1500 nm
The slit width is 1500 nm.
26.6 Shock Waves and Sonic Booms
Now we know that the waves move away from the source at the speed of sound. Whathappens if the source moves at the same time as emitting sounds? Once a sound wave has
562

CHAPTER 26. 2D AND 3D WAVEFRONTS - GRADE 12 26.6
been emitted it is no longer connected to the source so if the source moves it doesn’t changethe way the sound wave is propagating through the medium. This means a source can actuallycatch up with a sound waves it has emitted.
The speed of sound is very fast in air, about 340 m · s−1, so if we want to talk about a sourcecatching up to sound waves then the source has to be able to move very fast. A good source ofsound waves to discuss is a jet aircraft. Fighter jets can move very fast and they are very noisyso they are a good source of sound for our discussion. Here are the speeds for a selection ofaircraft that can fly faster than the speed of sound.
Aircraft speed at altitude (km · h−1) speed at altitude (m · s−1)
Concorde 2 330 647Gripen 2 410 669
Mirage F1 2 573 990Mig 27 1 885 524F 15 2 660 739F 16 2 414 671
26.6.1 Subsonic Flight
Definition: SubsonicSubsonic refers to speeds slower than the speed of sound.
When a source emits sound waves and is moving but slower than the speed of sound you getthe situation in this picture. Notice that the source moving means that the wavefronts andtherefore peaks in the wave are actually closer together in the one direction and further apartin the other.
subsonic flight
If you measure the waves on the side where the peaks are closer together you’ll measure adifferent wavelength than on the other side of the source. This means that the noise from thesource will sound different on the different sides. This is called the Doppler Effect.
Definition: Doppler Effectwhen the wavelength and frequency measured by an observer are different to those emittedby the source due to movement of the source or observer.
26.6.2 Supersonic Flight
Definition: SupersonicSupersonic refers to speeds faster than the speed of sound.
If a plane flies at exactly the speed of sound then the waves that it emits in the direction it isflying won’t be able to get away from the plane. It also means that the next sound waveemitted will be exactly on top of the previous one, look at this picture to see what thewavefronts would look like:
563

26.6 CHAPTER 26. 2D AND 3D WAVEFRONTS - GRADE 12
shock wave at Mach 1
Sometimes we use the speed of sound as a reference to describe the speed of the object(aircraft in our discussion).
Definition: Mach NumberThe Mach Number is the ratio of the speed of an object to the speed of sound in thesurrounding medium.
Mach number is tells you how many times faster than sound the aircraft is moving.
• Mach Number < 1 : aircraft moving slower than the speed of sound
• Mach Number = 1 : aircraft moving at the speed of sound
• Mach Number > 1 : aircraft moving faster than the speed of sound
To work out the Mach Number divide the speed of the aircraft by the speed of sound.
Mach Number =vaircraft
vsound
Remember: the units must be the same before you divide.
If the aircraft is moving faster than the speed of sound then the wavefronts look like this:
supersonic shock wave
If the source moves faster than the speed of sound a cone of wave fronts is created. This iscalled a Mach cone. From constructive interference we know that two peaks that add togetherform a larger peak. In a Mach cone many, many peaks add together to form a very large peak,this is a sound wave so the large peak is a very very loud sound wave. This sounds like a huge”boom” and we call the noise a sonic boom.
Worked Example 173: Mach Speed I
Question: An aircraft flies at 1300 km · h−1 and the speed of sound in air is340 m · s−1. What is the Mach Number of the aircraft?
Answer
Step 1 : Check what you are given
564

CHAPTER 26. 2D AND 3D WAVEFRONTS - GRADE 12 26.6
We know we are dealing with Mach Number. We are given the speed of sound inair, 340 m · s−1, and the speed of the aircraft, 1300 km · h−1. The speed of theaircraft is in different units to the speed of sound so we need to convert the units:
1300km · h−1 = 1300km · h−1
1300km · h−1 = 1300 × 1000m
3600s
1300km · h−1 = 361.1 m · s−1
Step 2 : Applicable principlesWe know that there is a relationship between the Mach Number, the speed ofsound and the speed of the aircraft:
Mach Number =vaircraft
vsound
We can use this relationship to find the Mach Number.Step 3 : Substitution
Mach Number =vaircraft
vsound
Mach Number =361.1
340Mach Number = 1.06
The Mach Number is 1.06.
Definition: Sonic BoomA sonic boom is the sound heard by an observer as a shockwave passes.
Exercise: Mach NumberIn this exercise we will determine the Mach Number for the different aircraft in
the table mentioned above. To help you get started we have calculated the MachNumber for the Concord with a speed of sound vsound = 340 ms−1.
For the Condorde we know the speed and we know that:
Mach Number =vaircraft
vsound
For the Concorde this means that
Mach Number =647
340= 1.9
Aircraft speed at altitude (km · h−1) speed at altitude (m · s−1) Mach Number
Concorde 2 330 647 1.9Gripen 2 410 669
Mirage F1 2 573 990Mig 27 1 885 524F 15 2 660 739F 16 2 414 671
565

26.6 CHAPTER 26. 2D AND 3D WAVEFRONTS - GRADE 12
Now calculate the Mach Numbers for the other aircraft in the table.
26.6.3 Mach Cone
You can see that the shape of the Mach Cone depends on the speed of the aircraft. When theMach Number is 1 there is no cone but as the aircraft goes faster and faster the angle of thecone gets smaller and smaller.
If we go back to the supersonic picture we can work out what the angle of the cone must be.
supersonic shock wave
We build a triangle between how far the plane has moved and how far a wavefront at rightangles to the direction the plane is flying has moved:
An aircraft emits a sound wavefront. The wavefront moves at the speed of sound 340 m · s−1
and the aircraft moves at Mach 1.5, which is 1.5 × 340 = 510 m · s−1. The aircraft travelsfaster than the wavefront. If we let the wavefront travel for a time t then the following diagramwill apply:
We know how fast the wavefront and the aircraft are moving so we know the distances thatthey have traveled:
vsound × tvaircraft × t
θ
566
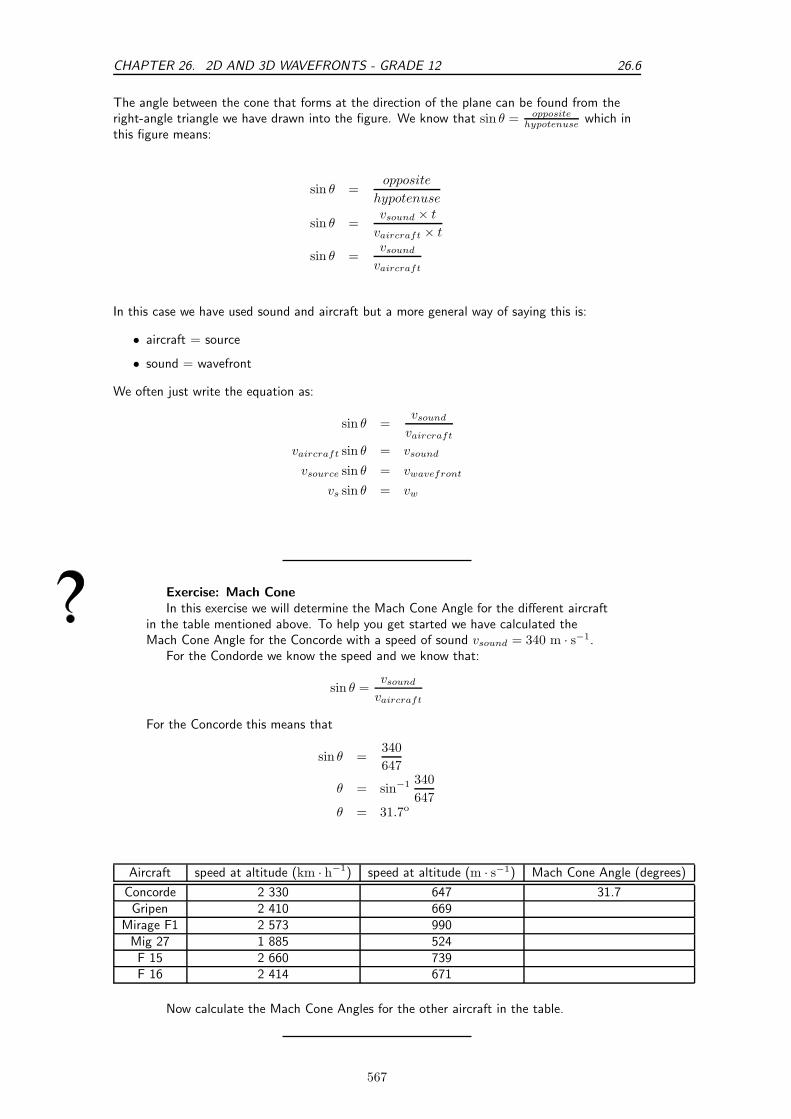
CHAPTER 26. 2D AND 3D WAVEFRONTS - GRADE 12 26.6
The angle between the cone that forms at the direction of the plane can be found from theright-angle triangle we have drawn into the figure. We know that sin θ = opposite
hypotenusewhich in
this figure means:
sin θ =opposite
hypotenuse
sin θ =vsound × t
vaircraft × t
sin θ =vsound
vaircraft
In this case we have used sound and aircraft but a more general way of saying this is:
• aircraft = source
• sound = wavefront
We often just write the equation as:
sin θ =vsound
vaircraft
vaircraft sin θ = vsound
vsource sin θ = vwavefront
vs sin θ = vw
Exercise: Mach ConeIn this exercise we will determine the Mach Cone Angle for the different aircraft
in the table mentioned above. To help you get started we have calculated theMach Cone Angle for the Concorde with a speed of sound vsound = 340 m · s−1.
For the Condorde we know the speed and we know that:
sin θ =vsound
vaircraft
For the Concorde this means that
sin θ =340
647
θ = sin−1 340
647θ = 31.7o
Aircraft speed at altitude (km · h−1) speed at altitude (m · s−1) Mach Cone Angle (degrees)
Concorde 2 330 647 31.7Gripen 2 410 669
Mirage F1 2 573 990Mig 27 1 885 524F 15 2 660 739F 16 2 414 671
Now calculate the Mach Cone Angles for the other aircraft in the table.
567

26.7 CHAPTER 26. 2D AND 3D WAVEFRONTS - GRADE 12
26.7 End of Chapter Exercises
1. In the diagram below the peaks of wavefronts are shown by black lines and the troughsby grey lines. Mark all the points where constructive interference between two waves istaking place and where destructive interference is taking place. Also note whether theinterference results in a peak or a trough.
A B
C
b b
b
2. For an slit of width 1300 nm, calculate the first 3 minima for light of the followingwavelengths:
A blue at 475 nm
B green at 510 nm
C yellow at 570 nm
D red at 650 nm
3. For light of wavelength 540 nm, determine what the width of the slit needs to be to havethe first minimum at:
A 7.76 degrees
B 12.47 degrees
C 21.1 degrees
4. For light of wavelength 635 nm, determine what the width of the slit needs to be to havethe second minimum at:
A 12.22 degrees
B 18.51 degrees
C 30.53 degrees
5. If the first minimum is at 8.21 degrees and the second minimum is at 16.6 degrees, whatis the wavelength of light and the width of the slit? (Hint: solve simultaneously.)
6. Determine the Mach Number, with a speed of sound of 340 m · s−1, for the followingaircraft speeds:
A 640 m · s−1
B 980 m · s−1
C 500 m · s−1
D 450 m · s−1
E 1300 km · h−1
568
CHAPTER 26. 2D AND 3D WAVEFRONTS - GRADE 12 26.7
F 1450 km · h−1
G 1760 km · h−1
7. If an aircraft has a Mach Number of 3.3 and the speed of sound is 340 m · s−1, what isits speed?
8. Determine the Mach Cone angle, with a speed of sound of 340 m · s−1, for the followingaircraft speeds:
A 640 m · s−1
B 980 m · s−1
C 500 m · s−1
D 450 m · s−1
E 1300 km · h−1
F 1450 km · h−1
G 1760 km · h−1
9. Determine the aircraft speed, with a speed of sound of 340 m · s−1, for the followingMach Cone Angles:
A 58.21 degrees
B 49.07 degrees
C 45.1 degrees
D 39.46 degrees
E 31.54 degrees
569

26.7 CHAPTER 26. 2D AND 3D WAVEFRONTS - GRADE 12
570
Chapter 27
Wave Nature of Matter - Grade 12
27.1 Introduction
In chapters 30 and 31 the so called wave-particle duality if light is described. This dualitystates that light displays properties of both waves and of particles, depending on theexperiment performed. For example, interference and diffraction of light are properties of itswave nature, while the photoelectric effect is a property of its particle nature. In fact we call aparticle of light a photon.
Hopefully you have realised that nature loves symmetry. So, if light which was originallybelieved to be a wave also has a particle nature then perhaps particles, also display a wavenature. In other words matter which which we originally thought of as particles may alsodisplay a wave-particle duality.
27.2 de Broglie Wavelength
Einstein showed that for a photon, its momentum, p, is equal to its energy, E divided thespeed of light, c:
p =E
c.
The energy of the photon can also be expressed in terms of the wavelength of the light, λ:
E =hc
λ,
where h is Planck’s constant. Combining these two equations we find that the the momentumof the photon is related to its wavelength
p =hc
cλ=
h
λ,
or equivalently
λ =h
p.
In 1923, Louis de Broglie proposed that this equation not only holds for photons, but also holdsfor particles of matter. This is known as the de Broglie hypothesis
Definition: De Broglie HypothesisA particle of mass m moving with velocity v has a wavelength λ related to is momentump = mv by
λ =h
p=
h
mv(27.1)
This wavelength, λ, is known as the de Broglie wavelength of the particle.
571
27.2 CHAPTER 27. WAVE NATURE OF MATTER - GRADE 12
Since the value of Planck’s constant is incredibly small h = 6.63 × 10⁻³⁴ J · s, the wavelikenature of everyday objects is not really observable.
Interesting
Fact
teresting
FactThe de Broglie hypothesis was proposed by French physicist Louis de Broglie(15 August 1892 – 19 March 1987) in 1923 in his PhD thesis. He was awardedthe Nobel Prize for Physics in 1929 for this work, which made him the firstperson to receive a Nobel Prize on a PhD thesis.
Worked Example 174: de Broglie Wavelength of a Cricket Ball
Question: A cricket ball has a mass of 0,150 kg and is bowled towards a bowler at40 m · s−1. Calculate the de Broglie wavelength of the cricket ball?AnswerStep 1 : Determine what is required and how to approach the problemWe are required to calculate the de Broglie wavelength of a cricket ball given itsmass and speed. We can do this by using:
λ =h
mv
Step 2 : Determine what is givenWe are given:
• The mass of the cricket ball m = 0,150 kg
• The velocity of the cricket ball v = 40 m · s−1
and we know:
• Planck’s constant h = 6,63 × 10⁻³⁴ J · sStep 3 : Calculate the de Broglie wavelength
λ =h
mv
=6,63 × 10⁻³⁴ J · s
(0,150 kg)(40 m · s−1)
= 1,10 × 10⁻³⁴ m
This wavelength is considerably smaller than the diameter of a proton which is approximately10−15 m. Hence the wave-like properties of this cricket ball are too small to be observed.
Worked Example 175: The de Broglie wavelength of an electron
Question: Calculate the de Broglie wavelength of an electron moving at 40 m·s−1.AnswerStep 1 : Determine what is required and how to approach the problem
572
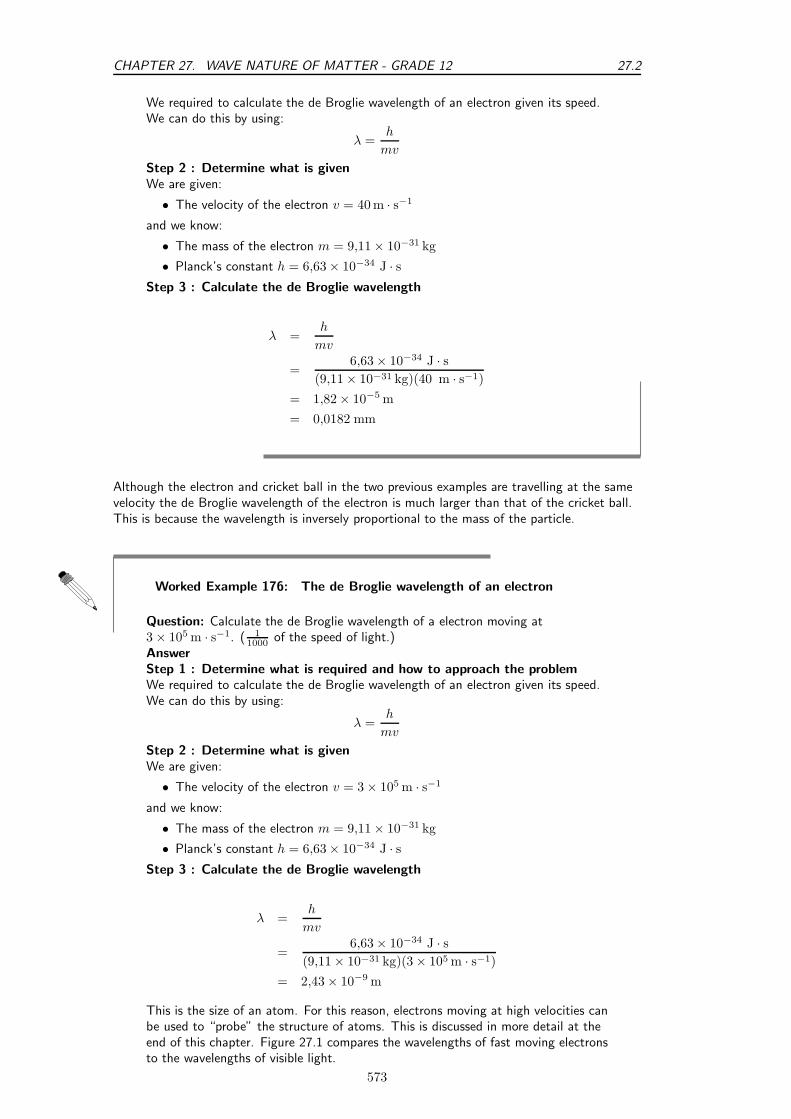
CHAPTER 27. WAVE NATURE OF MATTER - GRADE 12 27.2
We required to calculate the de Broglie wavelength of an electron given its speed.We can do this by using:
λ =h
mv
Step 2 : Determine what is givenWe are given:
• The velocity of the electron v = 40 m · s−1
and we know:
• The mass of the electron m = 9,11 × 10⁻³¹ kg
• Planck’s constant h = 6,63 × 10⁻³⁴ J · sStep 3 : Calculate the de Broglie wavelength
λ =h
mv
=6,63 × 10⁻³⁴ J · s
(9,11 × 10⁻³¹ kg)(40 m · s−1)
= 1,82 × 10⁻⁵ m
= 0,0182 mm
Although the electron and cricket ball in the two previous examples are travelling at the samevelocity the de Broglie wavelength of the electron is much larger than that of the cricket ball.This is because the wavelength is inversely proportional to the mass of the particle.
Worked Example 176: The de Broglie wavelength of an electron
Question: Calculate the de Broglie wavelength of a electron moving at3 × 105 m · s−1. ( 1
1000of the speed of light.)
AnswerStep 1 : Determine what is required and how to approach the problemWe required to calculate the de Broglie wavelength of an electron given its speed.We can do this by using:
λ =h
mv
Step 2 : Determine what is givenWe are given:
• The velocity of the electron v = 3 × 10⁵ m · s−1
and we know:
• The mass of the electron m = 9,11 × 10⁻³¹ kg
• Planck’s constant h = 6,63 × 10⁻³⁴ J · sStep 3 : Calculate the de Broglie wavelength
λ =h
mv
=6,63 × 10⁻³⁴ J · s
(9,11 × 10⁻³¹ kg)(3 × 10⁵ m · s−1)
= 2,43 × 10⁻⁹ m
This is the size of an atom. For this reason, electrons moving at high velocities canbe used to “probe” the structure of atoms. This is discussed in more detail at theend of this chapter. Figure 27.1 compares the wavelengths of fast moving electronsto the wavelengths of visible light.
573

27.3 CHAPTER 27. WAVE NATURE OF MATTER - GRADE 12
Since the de Broglie wavelength of a particle is inversely proportional to its velocity, thewavelength decreases as the velocity increases. This is confirmed in the last two examples withthe electrons. De Broglie’s hypothesis was confirmed by Davisson and Germer in 1927 whenthey observed a beam of electrons being diffracted off a nickel surface. The diffraction meansthat the moving electrons have a wave nature. They were also able to determine the wavelengthof the electrons from the diffraction. To measure a wavelength one needs two or morediffacting centres such as pinholes, slits or atoms. For diffraction to occur the centres must beseparated by a distance about the same size as the wavelength. Theoretically, all objects, notjust sub-atomic particles, exhibit wave properties according to the de Broglie hypothesis.
fast electrons
≈ 2 nm
visible light
≈ 700 nm ≈ 400 nm
wavelength (nm)
Figure 27.1: The wavelengths of the fast electrons are much smaller than that of visible light.
27.3 The Electron Microscope
We have seen that under certain circumstances particles behave like waves. This idea is used inthe electron microscope which is a type of microscope that uses electrons to create an image ofthe target. It has much higher magnification or resolving power than a normal lightmicroscope, up to two million times, allowing it to see smaller objects and details.
Let’s first review how a regular optical microscope works. A beam of light is shone through athin target and the image is then magnified and focused using objective and ocular lenses. Theamount of light which passes through the target depends on the densities of the target sincethe less dens regions allow more light to pass through than the denser regions. This means thatthe beam of light which is partially transmitted through the target carries information aboutthe inner structure of the target.
The original form of the electron microscopy, the transmission electron microscopy, works in asimilar manner using electrons. In the electron microscope, electrons which are emitted by acathode are formed into a beam using magnetic lenses. This electron beam is then passedthrough a very thin target. Again, the regions in the target with higher densities stop theelectrons more easily. So, the amount of electrons which pass through the different regions ofthe target depend their densities. This means that the partially transmitted beam of electronscarries information about the densities of the inner structure of the target. The spatialvariation in this information (the ”image”) is then magnified by a series of magnetic lenses andit is recorded by hitting a fluorescent screen, photographic plate, or light sensitive sensor suchas a CCD (charge-coupled device) camera. The image detected by the CCD may be displayedin real time on a monitor or computer. In figure ?? is an image of the polio virus obtained witha transmission electron microscope.
The structure of an optical and electron microscope are compared in figure 27.3. While theoptical microscope uses light and focuses using lenses, the electron microscope uses electronsand focuses using electromagnets.
Interesting
Fact
teresting
FactThe first electron microscope prototype was built in 1931 by the Germanengineers Ernst Ruska and Maximillion Knoll. It was based on the ideas anddiscoveries of Louis de Broglie. Although it was primitive and was not ideal forpractical use, the instrument was still capable of magnifying objects by fourhundred times. The first practical electron microscope was built at the
574
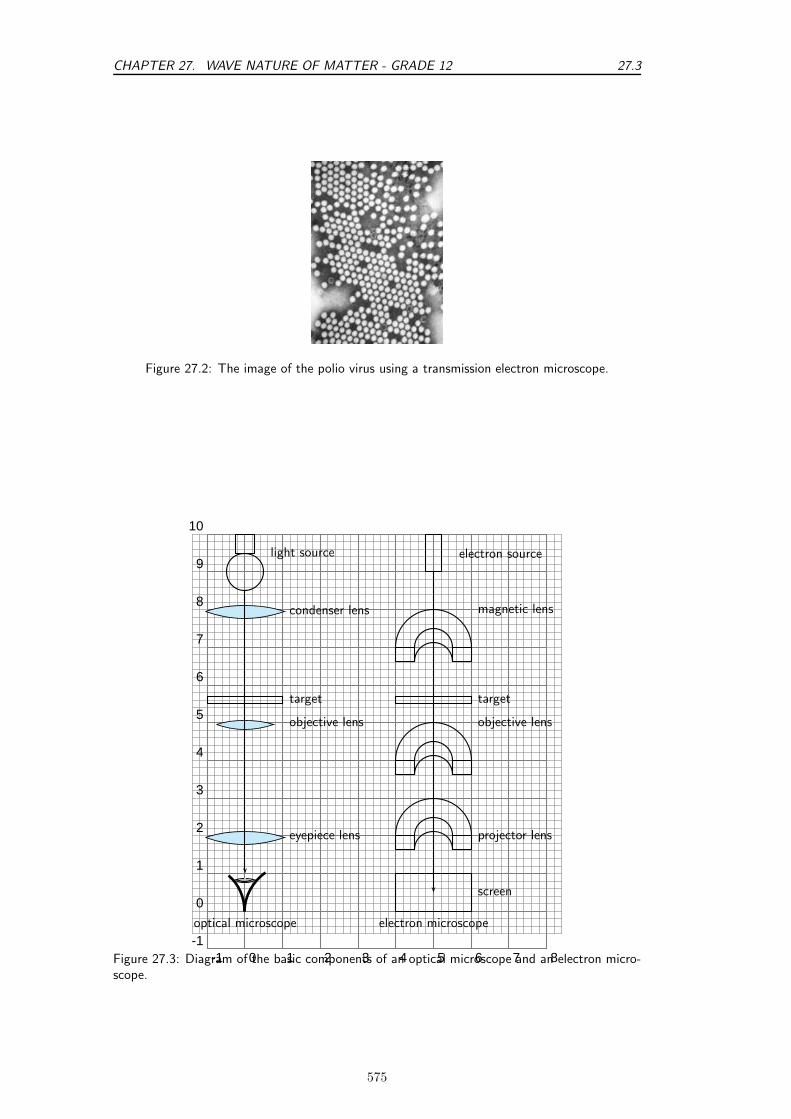
CHAPTER 27. WAVE NATURE OF MATTER - GRADE 12 27.3
Figure 27.2: The image of the polio virus using a transmission electron microscope.
-1 0 1 2 3 4 5 6 7 8-1
0
1
2
3
4
5
6
7
8
9
10
electron source
magnetic lens
target
objective lens
projector lens
screen
electron microscope
light source
condenser lens
target
objective lens
eyepiece lens
optical microscope
Figure 27.3: Diagram of the basic components of an optical microscope and an electron micro-scope.
575

27.3 CHAPTER 27. WAVE NATURE OF MATTER - GRADE 12
Table 27.1: Comparison of Light and Electron MicroscopesLight microscope Electron microscope
Source Bright lamp or laser Electron gunRadiation U.V. or visible light Electron beam produced by heat-
ing metal surface (e.g. tungsten)Lenses Curved glass surfaces Electromagnets
Receiver Eye; photographic emulsion or dig-ital image
Fluorescent screen (for locationand focusing image); photographicemulsion or digital image
Focus Axial movement of lenses (up anddown)
Adjustment of magnetic field inthe electromagnets by changingthe current
Operating Atmospheric High vacuumPressure
University of Toronto in 1938, by Eli Franklin Burton and students Cecil Hall,James Hillier and Albert Prebus.
Although modern electron microscopes can magnify objects up to two milliontimes, they are still based upon Ruska’s prototype and his correlation betweenwavelength and resolution. The electron microscope is an integral part of manylaboratories. Researchers use it to examine biological materials (such asmicroorganisms and cells), a variety of large molecules, medical biopsy samples,metals and crystalline structures, and the characteristics of various surfaces.
Electron microscopes are very useful as they are able to magnify objects to a much higherresolution. This is because their de Broglie wavelengths are so much smaller than that ofvisible light. You hopefully remember that light is diffracted by objects which are separated bya distance of about the same size as the wavelength of the light. This diffraction then preventsyou from being able to focus the transmitted light into an image. So the sizes at whichdiffraction occurs for a beam of electrons is much smaller than those for visible light. This iswhy you can magnify targets to a much higher order of magnification using electrons ratherthan visible light.
Extension: High-Resolution Transmission Electron Microscope (HRTEM)There are high-resolution TEM (HRTEM) which have been built. However
their resolution is limited by spherical and chromatic aberration. Fortunatelythough, software correction of the spherical aberration has allowed the productionof images with very high resolution. In fact the resolution is sufficient to showcarbon atoms in diamond separated by only 89 picometers and atoms in silicon at78 picometers. This is at magnifications of 50 million times. The ability todetermine the positions of atoms within materials has made the HRTEM a veryuseful tool for nano-technologies research. It is also very important for thedevelopment of semiconductor devices for electronics and photonics.
Transmission electron microscopes produce two-dimensional images.
Extension: Scanning Electron Microscope (SEM)The Scanning Electron Microscope (SEM) produces images by hitting the
target with a primary electron beam which then excites the surface of the target.This causes secondary electrons to be emitted from the surface which are thendetected. So the the electron beam in the SEM is moved across the sample, whiledetectors build an image from the secondary electrons.
576

CHAPTER 27. WAVE NATURE OF MATTER - GRADE 12 27.3
Generally, the transmission electron microscope’s resolution is about an order ofmagnitude better than the SEM resolution, however, because the SEM image relieson surface processes rather than transmission it is able to image bulk samples andhas a much greater depth of view, and so can produce images that are a goodrepresentation of the 3D structure of the sample.
27.3.1 Disadvantages of an Electron Microscope
Electron microscopes are expensive to buy and maintain. they are also very sensitive tovibration and external magnetic fields. This means that special facilities are required to housemicroscopes aimed at achieving high resolutions. Also the targets have to be viewed invacuum, as the electrons would scatter with the molecules that make up air.
Extension: Scanning Electron Microscope (SEM)Scanning electron microscopes usually image conductive or semi-conductive
materials best. A common preparation technique is to coat the target with aseveral-nanometer layer of conductive material, such as gold, from a sputteringmachine; however this process has the potential to disturb delicate samples.
The targets have to be prepared in many ways to give proper detail, which mayresult in artifacts purely the result of treatment. This gives the problem ofdistinguishing artifacts from material, particularly in biological samples. Scientistsmaintain that the results from various preparation techniques have been compared,and as there is no reason that they should all produce similar artifacts, it istherefore reasonable to believe that electron microscopy features correlate withliving cells.
Interesting
Fact
teresting
FactThe first electron microscope prototype was built in 1931 by the Germanengineers Ernst Ruska and Maximillion Knoll. It was based on the ideas anddiscoveries of Louis de Broglie. Although it was primitive and was not ideal forpractical use, the instrument was still capable of magnifying objects by fourhundred times. The first practical electron microscope was built at theUniversity of Toronto in 1938, by Eli Franklin Burton and students Cecil Hall,James Hillier and Albert Prebus.
Although modern electron microscopes can magnify objects up to two milliontimes, they are still based upon Ruska’s prototype and his correlation betweenwavelength and resolution. The electron microscope is an integral part of manylaboratories. Researchers use it to examine biological materials (such asmicroorganisms and cells), a variety of large molecules, medical biopsy samples,metals and crystalline structures, and the characteristics of various surfaces.
27.3.2 Uses of Electron Microscopes
Electron microscopes can be used to study:
• the topography of an object − how its surface looks.
• the morphology of particles making up an object − its shape and size.
• the composition of an object − the elements and compounds that the object iscomposed of and the relative amounts of them.
• the crystallographic information of the object − how the atoms are arranged in theobject.
577

27.4 CHAPTER 27. WAVE NATURE OF MATTER - GRADE 12
27.4 End of Chapter Exercises
1. If the following particles have the same velocity, which has the shortest wavelength:electron, hydrogen atom, lead atom?
2. A bullet weighing 30 g is fired at a velocity of 500 m · s−1. What is its wavelength?
3. Calculate the wavelength of an electron which has a kinetic energy of 1.602 × 10⁻¹⁹ J.
4. If the wavelength of an electron is 10−9 m what is its velocity?
5. Considering how one calculates wavelength using slits, try to explain why we would notbe able to physically observe diffraction of the cricket ball in first worked example.
578
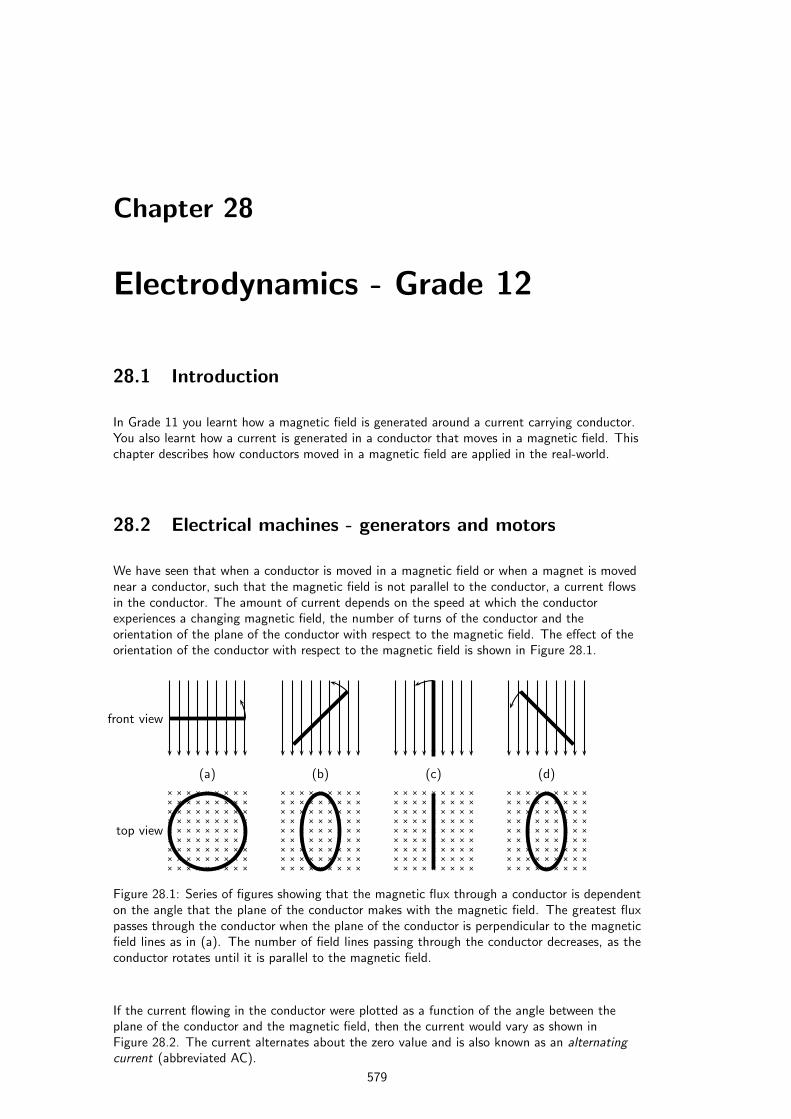
Chapter 28
Electrodynamics - Grade 12
28.1 Introduction
In Grade 11 you learnt how a magnetic field is generated around a current carrying conductor.You also learnt how a current is generated in a conductor that moves in a magnetic field. Thischapter describes how conductors moved in a magnetic field are applied in the real-world.
28.2 Electrical machines - generators and motors
We have seen that when a conductor is moved in a magnetic field or when a magnet is movednear a conductor, such that the magnetic field is not parallel to the conductor, a current flowsin the conductor. The amount of current depends on the speed at which the conductorexperiences a changing magnetic field, the number of turns of the conductor and theorientation of the plane of the conductor with respect to the magnetic field. The effect of theorientation of the conductor with respect to the magnetic field is shown in Figure 28.1.
× × × × × × × × ×× × × × × × × × ×× × × × × × × × ×× × × × × × × × ×× × × × × × × × ×× × × × × × × × ×× × × × × × × × ×× × × × × × × × ×× × × × × × × × ×
× × × × × × × × ×× × × × × × × × ×× × × × × × × × ×× × × × × × × × ×× × × × × × × × ×× × × × × × × × ×× × × × × × × × ×× × × × × × × × ×× × × × × × × × ×
× × × × × × × × ×× × × × × × × × ×× × × × × × × × ×× × × × × × × × ×× × × × × × × × ×× × × × × × × × ×× × × × × × × × ×× × × × × × × × ×× × × × × × × × ×
× × × × × × × × ×× × × × × × × × ×× × × × × × × × ×× × × × × × × × ×× × × × × × × × ×× × × × × × × × ×× × × × × × × × ×× × × × × × × × ×× × × × × × × × ×
top view
front view
(a) (b) (c) (d)
Figure 28.1: Series of figures showing that the magnetic flux through a conductor is dependenton the angle that the plane of the conductor makes with the magnetic field. The greatest fluxpasses through the conductor when the plane of the conductor is perpendicular to the magneticfield lines as in (a). The number of field lines passing through the conductor decreases, as theconductor rotates until it is parallel to the magnetic field.
If the current flowing in the conductor were plotted as a function of the angle between theplane of the conductor and the magnetic field, then the current would vary as shown inFigure 28.2. The current alternates about the zero value and is also known as an alternatingcurrent (abbreviated AC).
579
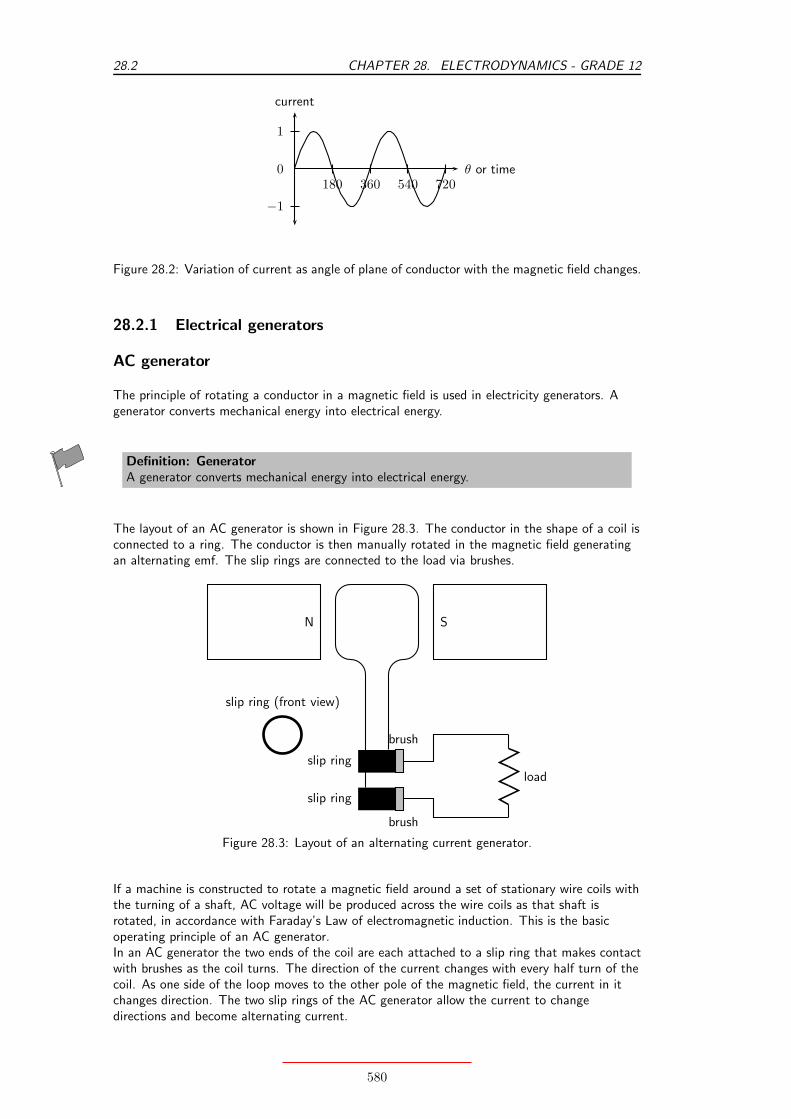
28.2 CHAPTER 28. ELECTRODYNAMICS - GRADE 12
180 360 540 7200
1
−1
θ or time
current
Figure 28.2: Variation of current as angle of plane of conductor with the magnetic field changes.
28.2.1 Electrical generators
AC generator
The principle of rotating a conductor in a magnetic field is used in electricity generators. Agenerator converts mechanical energy into electrical energy.
Definition: GeneratorA generator converts mechanical energy into electrical energy.
The layout of an AC generator is shown in Figure 28.3. The conductor in the shape of a coil isconnected to a ring. The conductor is then manually rotated in the magnetic field generatingan alternating emf. The slip rings are connected to the load via brushes.
N S
brush
brush
slip ring
slip ring
load
slip ring (front view)
Figure 28.3: Layout of an alternating current generator.
If a machine is constructed to rotate a magnetic field around a set of stationary wire coils withthe turning of a shaft, AC voltage will be produced across the wire coils as that shaft isrotated, in accordance with Faraday’s Law of electromagnetic induction. This is the basicoperating principle of an AC generator.In an AC generator the two ends of the coil are each attached to a slip ring that makes contactwith brushes as the coil turns. The direction of the current changes with every half turn of thecoil. As one side of the loop moves to the other pole of the magnetic field, the current in itchanges direction. The two slip rings of the AC generator allow the current to changedirections and become alternating current.
580

CHAPTER 28. ELECTRODYNAMICS - GRADE 12 28.2
Interesting
Fact
teresting
FactAC generators are also known as alternators. They are found in motor cars tocharge the car battery.
DC generator
A DC generator is constructed the same way as an AC generator except that there is one slipring which is split into two pieces, called a commutator, so the current in the external circuitdoes not change direction. The layout of a DC generator is shown in Figure 28.4. Thesplit-ring commutator accommodates for the change in direction of the current in the loop,thus creating DC current going through the brushes and out to the circuit.
N S
split ring
brush brush
load
split ring commutator
Figure 28.4: Layout of a direct current generator.
The shape of the emf from a DC generator is shown in Figure 28.5. The emf is not steady butis more or less the positive halves of a sine wave.
180 360 540 7200
1
−1
θ or time
current
Figure 28.5: Variation of emf in a DC generator.
AC versus DC generators
The problems involved with making and breaking electrical contact with a moving coil shouldbe obvious (sparking and heat), especially if the shaft of the generator is revolving at highspeed. If the atmosphere surrounding the machine contains flammable or explosive vapors, thepractical problems of spark-producing brush contacts are even greater.An AC generator (alternator) does not require brushes and commutators to work, and so isimmune to these problems experienced by DC generators. The benefits of AC over DC withregard to generator design is also reflected in electric motors. While DC motors require the use
581

28.2 CHAPTER 28. ELECTRODYNAMICS - GRADE 12
of brushes to make electrical contact with moving coils of wire, AC motors do not. In fact, ACand DC motor designs are very similar to their generator counterparts. The AC motor beingdependent upon the reversing magnetic field produced by alternating current through itsstationary coils of wire to rotate the rotating magnet around on its shaft, and the DC motorbeing dependent on the brush contacts making and breaking connections to reverse currentthrough the rotating coil every 1/2 rotation (180 degrees).
28.2.2 Electric motors
The basic principles of operation for a motor are the same as that of a generator, except that amotor converts electrical energy into mechanical energy.
Definition: MotorAn electric motor converts electrical energy into mechanical energy.
Both motors and generators can be explained in terms of a coil that rotates in a magnetic field.In a generator the coil is attached to an external circuit and it is mechanically turned, resultingin a changing flux that induces an emf. In a motor, a current-carrying coil in a magnetic fieldexperiences a force on both sides of the coil, creating a torque which makes it turn.Any coil carrying current can feel a force in a magnetic field, the force is the Lorentz force onthe moving charges in the conductor. We know that if the coil is parallel to the magnetic fieldthen the Lorentz force will be zero. The charge of opposite sides of the coil will be in oppositedirections because the charges are moving in opposite directions. This means the coil willrotate.
resultant force is into the page
resultant force is out of the page
Instead of rotating the loops through a magnetic field to create electricity, a current is sentthrough the wires, creating electromagnets. The outer magnets will then repel theelectromagnets and rotate the shaft as an electric motor. If the current is AC, the two sliprings are required to create an AC motor. An AC motor is shown in Figure 28.6
If the current is DC, split-ring commutators are required to create a DC motor. This is shownin Figure 28.7.
28.2.3 Real-life applications
Cars
A car contains an alternator that charges up its battery power the car’s electric system when itsengine is running. Alternators have the great advantage over direct-current generators of notusing a commutator, which makes them simpler, lighter, less costly, and more rugged than aDC generator.
582

CHAPTER 28. ELECTRODYNAMICS - GRADE 12 28.2
N S
brush
brush
slip ring
slip ring
slip ring (front view)
Figure 28.6: Layout of an alternating current motor.
N S
split ring
brush brush
split ring commutator
Figure 28.7: Layout of a direct current motor.
583
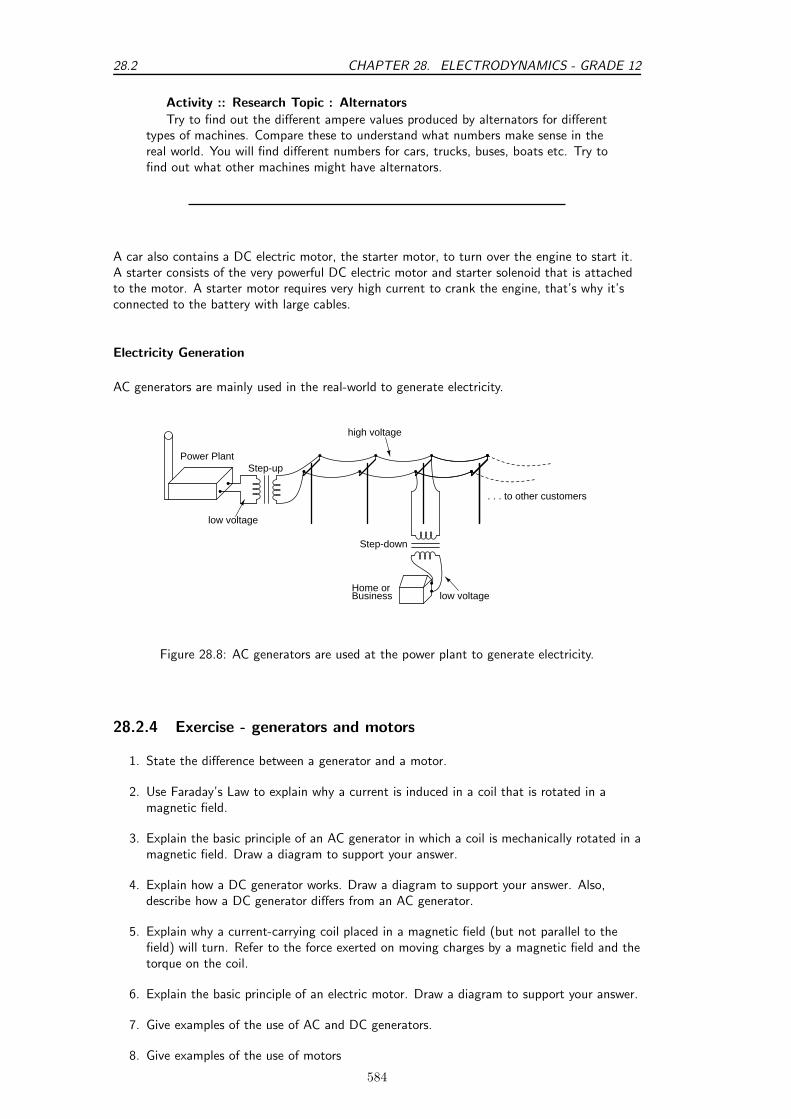
28.2 CHAPTER 28. ELECTRODYNAMICS - GRADE 12
Activity :: Research Topic : Alternators
Try to find out the different ampere values produced by alternators for differenttypes of machines. Compare these to understand what numbers make sense in thereal world. You will find different numbers for cars, trucks, buses, boats etc. Try tofind out what other machines might have alternators.
A car also contains a DC electric motor, the starter motor, to turn over the engine to start it.A starter consists of the very powerful DC electric motor and starter solenoid that is attachedto the motor. A starter motor requires very high current to crank the engine, that’s why it’sconnected to the battery with large cables.
Electricity Generation
AC generators are mainly used in the real-world to generate electricity.
Step-up
Step-down
Power Plant
low voltage
high voltage
low voltage
. . . to other customers
Home orBusiness
Figure 28.8: AC generators are used at the power plant to generate electricity.
28.2.4 Exercise - generators and motors
1. State the difference between a generator and a motor.
2. Use Faraday’s Law to explain why a current is induced in a coil that is rotated in amagnetic field.
3. Explain the basic principle of an AC generator in which a coil is mechanically rotated in amagnetic field. Draw a diagram to support your answer.
4. Explain how a DC generator works. Draw a diagram to support your answer. Also,describe how a DC generator differs from an AC generator.
5. Explain why a current-carrying coil placed in a magnetic field (but not parallel to thefield) will turn. Refer to the force exerted on moving charges by a magnetic field and thetorque on the coil.
6. Explain the basic principle of an electric motor. Draw a diagram to support your answer.
7. Give examples of the use of AC and DC generators.
8. Give examples of the use of motors
584

CHAPTER 28. ELECTRODYNAMICS - GRADE 12 28.3
28.3 Alternating Current
Most students of electricity begin their study with what is known as direct current (DC), whichis electricity flowing in a constant direction. DC is the kind of electricity made by a battery,with definite positive and negative terminals).However, we have seen that the electricity produced by a generator alternates and is thereforeknown as alternating current(AC). The main advantage to AC is that the voltage can bechanged using transformers. That means that the voltage can be stepped up at power stationsto a very high voltage so that electrical energy can be transmitted along power lines at lowcurrent and therefore experience low energy loss due to heating. The voltage can then bestepped down for use in buildings and street lights.
Interesting
Fact
teresting
FactIn South Africa alternating current is generated at a frequency of 50 Hz.
The circuit symbol for alternating current is:
∼
Graphs of voltage against time and current against time for an AC circuit are shown inFigure 28.9
180 360 540 7200
1
−1
θ or time
current
Figure 28.9: Graph of current or voltage in an AC circuit.
In a DC circuit the current and voltage are constant. In an AC circuit the current and voltagevary with time. The value of the current or voltage at any specific moment in time is called theinstantaneous current or voltage and is calculated as follows:
i = Imaxsin(2πft)
v = Vmaxsin(2πft)
i is the instantaneous current. Imax is the maximum current. v is the instantaneous voltage.Vmax is the maximum voltage. f is the frequency of the AC and t is the time at which theinstantaneous current or voltage is being calculated.This average value we use for AC is known as the root mean square (rms) average. This isdefined as:
Irms =Imax√
2
Vrms =Vmax√
2585

28.4 CHAPTER 28. ELECTRODYNAMICS - GRADE 12
Since AC varies sinusoidally, with as much positive as negative, doing a straight average wouldget you zero for the average voltage. The rms value by-passes this problem.
28.3.1 Exercise - alternating current
1. Explain the advantages of alternating current.
2. Write expressions for the current and voltage in an AC circuit.
3. Define the rms (root mean square) values for current and voltage for AC.
4. What is the period of the AC generated in South Africa?
5. If the mains supply is 200 V AC, calculate rms voltage.
6. Draw a graph of voltage vs time and current vs time for an AC circuit.
28.4 Capacitance and inductance
Capacitors and inductors are found in many circuits. Capacitors store an electric field, and areused as temporary power sources as well as minimize power fluctuations in major circuits.Inductors work in conjunction with capacitors for electrical signal processing. Here we explainthe physics and applications of both.
28.4.1 Capacitance
You have learnt about capacitance and capacitors in Grade 11. Please read throughsection 17.5 to recap what you learnt about capacitance in a DC circuit.In this section you will learn about capacitance in an AC circuit. A capacitor in an AC circuithas reactance. Reactance in an AC circuit plays a similar role to resistance in a DC circuit.The reactance of a capacitor XC is defined as:XC = 1
2πfC
where C is the capacitance and f is the AC frequency.If we examine the equation for the reactance of a capacitor, we see that the frequency is in thedenominator. Therefore, when the frequency is low, the capacitive reactance is very high. Thisis why a capacitor blocks the flow of DC and low frequency AC because its reactance increaseswith decreasing frequency.When the frequency is high, the capacitive reactance is low. This is why a capacitor allows theflow of high frequency AC because its reactance decreases with increasing frequency.
28.4.2 Inductance
An inductor is a passive electrical device used in electrical circuits for its property ofinductance. An inductor is usually made as a coil (or solenoid) of conducting material, typicallycopper wire, wrapped around a core either of air or of ferromagnetic material.Electrical current through the conductor creates a magnetic flux proportional to the current. Achange in this current creates a change in magnetic flux that, in turn, generates an emf thatacts to oppose this change in current.Inductance (measured in henries, symbol H) is a measure of the generated emf for a unitchange in current. For example, an inductor with an inductance of 1 H produces an emf of 1 Vwhen the current through the inductor changes at the rate of 1 A·s−1.The inductance of an inductor is determined by several factors:
• the shape of the coil; a short, fat coil has a higher inductance than one that is thin andtall.
• the material that conductor is wrapped around.
• how the conductor is wound; winding in opposite directions will cancel out theinductance effect, and you will have only a resistor.
586

CHAPTER 28. ELECTRODYNAMICS - GRADE 12 28.4
The inductance of a solenoid is defined by:
L = µ0AN2
l
where µ0 is the permeability of the core material (in this case air), A is the cross-sectional areaof the solenoid, N is the number of turns and l is the length of the solenoid.
Definition: PermeabilityPermeability is the property of a material which describes the magnetisation developed inthat material when excited by a source.
Interesting
Fact
teresting
FactThe permeability of free space is 4πx10−7 henry per metre.
Worked Example 177: Inductance I
Question:AnswerDetermine the inductance of a coil with a core material of air. A cross-sectionalarea of 0,3m2, with 1000 turns and a length of 0,1 mStep 1 : Determine how to approach the problemWe are calculating inductance, so we use the equation:
L =µ0AN2
l
The permeability is that for free space:4πx10−7 henry per metre.Step 2 : Solve the problem
L =µ0AN2
l
=(4πtextrmx10−7)(0,3)(1000)
0,1
= 3,8x10⁻³ H/m
Step 3 : Write the final answerThe inductance of the coil is 3,8x10⁻³ H/m.
Worked Example 178: Inductance II
Question: Calculate the inductance of a 5 cm long solenoid with a diameter of 4mm and 2000 turns.AnswerAgain this is an inductance problem, so we use the same formula as the workedexample above.
587
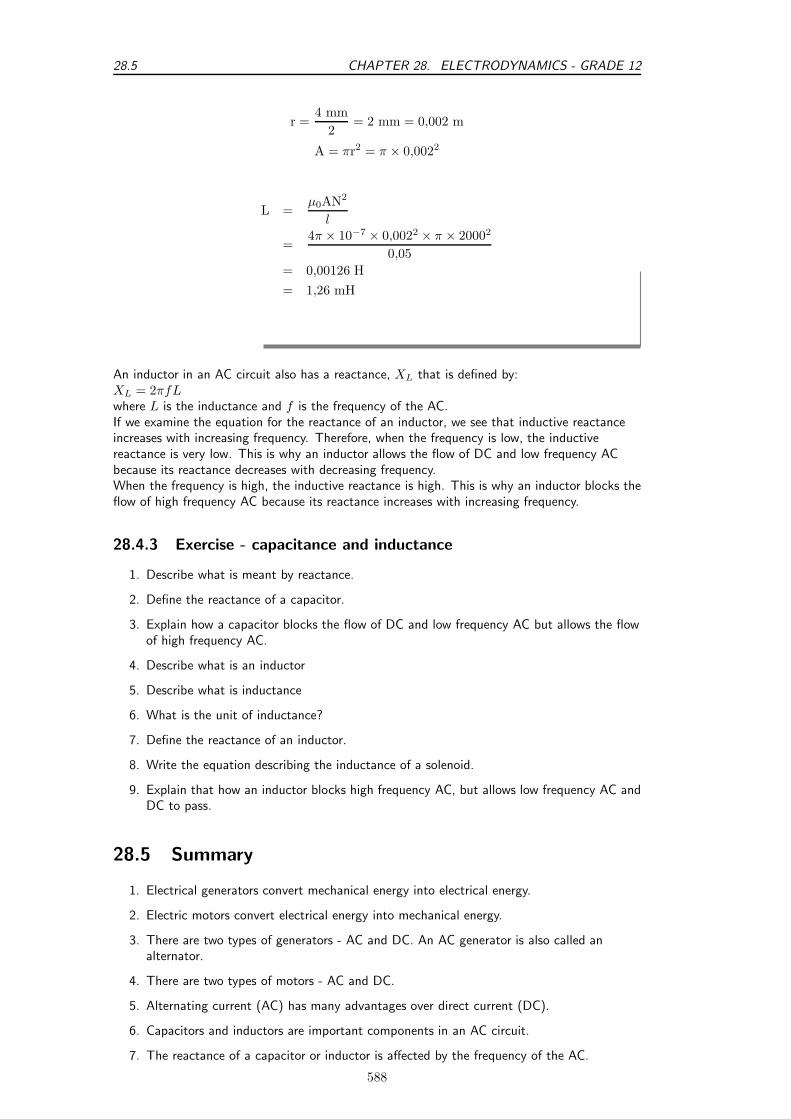
28.5 CHAPTER 28. ELECTRODYNAMICS - GRADE 12
r =4 mm
2= 2 mm = 0,002 m
A = πr2 = π × 0,0022
L =µ0AN2
l
=4π × 10−7 × 0,0022 × π × 20002
0,05
= 0,00126 H
= 1,26 mH
An inductor in an AC circuit also has a reactance, XL that is defined by:XL = 2πfLwhere L is the inductance and f is the frequency of the AC.If we examine the equation for the reactance of an inductor, we see that inductive reactanceincreases with increasing frequency. Therefore, when the frequency is low, the inductivereactance is very low. This is why an inductor allows the flow of DC and low frequency ACbecause its reactance decreases with decreasing frequency.When the frequency is high, the inductive reactance is high. This is why an inductor blocks theflow of high frequency AC because its reactance increases with increasing frequency.
28.4.3 Exercise - capacitance and inductance
1. Describe what is meant by reactance.
2. Define the reactance of a capacitor.
3. Explain how a capacitor blocks the flow of DC and low frequency AC but allows the flowof high frequency AC.
4. Describe what is an inductor
5. Describe what is inductance
6. What is the unit of inductance?
7. Define the reactance of an inductor.
8. Write the equation describing the inductance of a solenoid.
9. Explain that how an inductor blocks high frequency AC, but allows low frequency AC andDC to pass.
28.5 Summary
1. Electrical generators convert mechanical energy into electrical energy.
2. Electric motors convert electrical energy into mechanical energy.
3. There are two types of generators - AC and DC. An AC generator is also called analternator.
4. There are two types of motors - AC and DC.
5. Alternating current (AC) has many advantages over direct current (DC).
6. Capacitors and inductors are important components in an AC circuit.
7. The reactance of a capacitor or inductor is affected by the frequency of the AC.
588
CHAPTER 28. ELECTRODYNAMICS - GRADE 12 28.6
28.6 End of chapter exercise
1. [SC 2003/11] Explain the difference between alternating current (AC) and direct current(DC).
2. Explain how an AC generator works. You may use sketches to support your answer.
3. What are the advantages of using an AC motor rather than a DC motor.
4. Explain how a DC motor works.
5. At what frequency is AC generated by Eskom in South Africa?
IEB 2001/11 HG1 - Work, Energy and Power in Electric CircuitsMr. Smith read through the agreement with Eskom (the electricity provider). He foundout that alternating current is supplied to his house at a frequency of 50 Hz. He thenconsulted a book on electric current, and discovered that alternating current moves toand fro in the conductor. So he refused to pay his Eskom bill on the grounds that everyelectron that entered his house would leave his house again, so therefore Eskom hadsupplied him with nothing!Was Mr. smith correct? Or has he misunderstood something about what he is payingfor? Explain your answer briefly.
6. What do we mean by the following terms in electrodynamics?
A inductance
B reactance
C solenoid
D permeability
589

28.6 CHAPTER 28. ELECTRODYNAMICS - GRADE 12
590
Chapter 29
Electronics - Grade 12
29.1 Introduction
Electronics and electrical devices surround us in daily life. From the street lights and waterpumps to computers and digital phones, electronics have enabled the digital revolution tooccur. All electronics are built on a backbone of simple circuits, and so an understanding ofcircuits is vital in understanding more complex devices.
This chapter will explain the basic physics principles of many of the components of electronicdevices. We will begin with an explanation of capacitors and inductors. We see how these areused in tuning a radio. Next, we look at active components such as transistors and operationalamplifiers. Lastly, the chapter will finish with an explanation of digital electronics, includinglogic gates and counting circuits.
Before studying this chapter, you will want to remind yourself of:
• The meaning of voltage (V ), current (I) and resistance (R), as covered in Grade 10 (seechapter 10), and Grade 11 (see chapter 19).
• Capacitors in electric circuits, as covered in Grade 11 (see section 17.6).
• Semiconductors, as covered in Grade 11 (see chapter 20).
• The meaning of an alternating current (see section 28.3).
• Capacitance (C) and Inductance (L) (see section 28.4).
29.2 Capacitive and Inductive Circuits
Earlier in Grade 12, you were shown alternating currents (a.c.) and you saw that the voltageand the current varied with time. If the a.c. supply is connected to a resistor, then the currentand voltage will be proportional to each other. This means that the current and voltage will‘peak’ at the same time. We say that the current and voltage are in phase. This is shown inFigure 29.1.
When a capacitor is connected to an alternating voltage, the maximum voltage is proportionalto the maximum current, but the maximum voltage does not occur at the same time as themaximum current. The current has its maximum (it peaks) one quarter of a cycle before thevoltage peaks. Engineers say that the ‘current leads the voltage by 90’. This is shown inFigure 29.2.
For a circuit with a capacitor, the instantaneous value of VI
is not constant. However the value
of Vmax
Imax
is useful, and is called the capacitive reactance (XC) of the component. Because itis still a voltage divided by a current (like resistance), its unit is the ohm. The value of XC (C
591
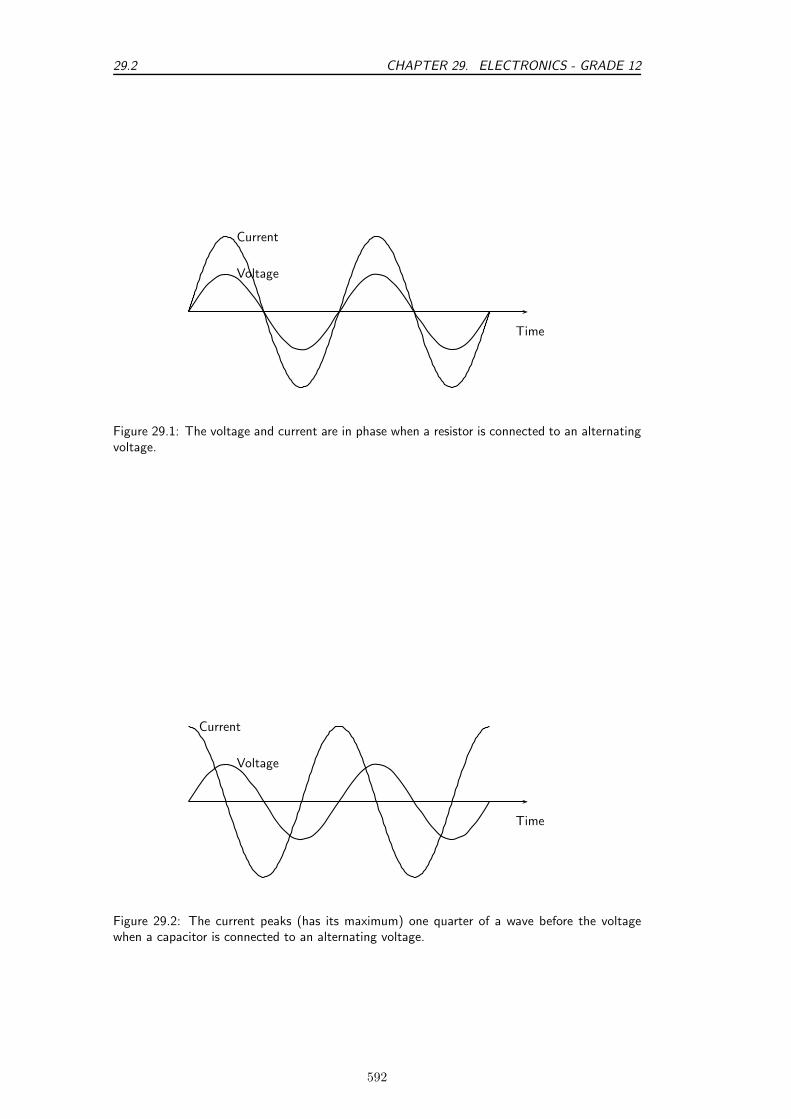
29.2 CHAPTER 29. ELECTRONICS - GRADE 12
Time
Current
Voltage
Figure 29.1: The voltage and current are in phase when a resistor is connected to an alternatingvoltage.
Time
Current
Voltage
Figure 29.2: The current peaks (has its maximum) one quarter of a wave before the voltagewhen a capacitor is connected to an alternating voltage.
592

CHAPTER 29. ELECTRONICS - GRADE 12 29.2
standing for capacitor) depends on its capacitance (C) and the frequency (f) of the alternatingcurrent (in South Africa 50 Hz).
XC =Vmax
Imax
=1
2πfC(29.1)
Inductors are very similar, but the current peaks 90 after the voltage. This is shown inFigure 29.3. Engineers say that the ‘current lags the voltage’. Again, the ratio of maximumvoltage to maximum current is called the reactance — this time inductive reactance (XL).The value of the reactance depends on its inductance (L).
XL =Vmax
Imax
= 2πfL (29.2)
Time
Current
Voltage
Figure 29.3: The current peaks (has its maximum) one quarter of a wave after the voltage whenan inductor is connected to an alternating voltage.
Definition: ReactanceThe ratio of the maximum voltage to the maximum current when a capacitor or inductor isconnected to an alternating voltage. The unit of reactance is the ohm.
While inductive and capacitive reactances are similar, in one sense they are opposites. For aninductor, the current peaks 90 after the voltage. For a capacitor the current peaks 90 aheadof the voltage. When we work out the total reactance for an inductor and a capacitor in series,we use the formula
Xtotal = XL − XC (29.3)
to take this into account. This formula can also be used when there is more than one inductoror more than one capacitor in the circuit. The total reactance is the sum of all of the inductivereactances minus the sum of all the capacitive reactances. The magnitude (number) in thefinal result gives the ratio of maximum voltage to maximum current in the circuit as a whole.The sign of the final result tells you its phase. If it is positive, the current peaks 90 after thevoltage, if it is negative, the current peaks 90 before the voltage.
593

29.2 CHAPTER 29. ELECTRONICS - GRADE 12
If a series circuit contains resistors as well, then the situation is more complicated. Themaximum current is still proportional to the maximum voltage, but the phase differencebetween them won’t be 90. The ratio between the maximum voltage and maximum current iscalled the impedance (Z), and its unit is also the ohm. Impedances are calculated using thisformula:
Z =√
X2 + R2 (29.4)
where X is the total reactance of the inductors and capacitors in the circuit, and R is the totalresistance of the resistors in the circuit.
It is easier to understand this formula by thinking of a right angled triangle. Resistances aredrawn horizontally, reactances are drawn vertically. The hypotenuse of the triangle gives theimpedance. This is shown in Figure 29.4.
Resistance R
Reactance X
Impedance Z
Figure 29.4: Visualizing the relationship between reactance, resistance and impedance.
Definition: ImpedanceThe maximum voltage divided by the maximum current for any circuit. The unit ofimpedance is the ohm.
It is important to remember that when resistors and inductances (or capacitors) are in a circuit,the current will not be in phase with the voltage, so the impedance is not a resistance.Similarly the current won’t be exactly 90 out of phase with the voltage so the impedance isn’ta reactance either.
Worked Example 179: The impedance of a coil
Question: Calculate the maximum current in a coil in a South African motor whichhas a resistance of 5 Ω and an inductance of 3 mH. The maximum voltage acrossthe coil is 6 V. You can assume that the resistance and inductance are in series.Answer
1. Calculate the reactance of the coil XL = 2πfL = 2π × 50 × 0,003 = 0,942 Ω
2. Calculate the impedance of the coilZ =
√X2 + R2 =
√
0,9422 + 52 = 5,09 Ω
594
CHAPTER 29. ELECTRONICS - GRADE 12 29.2
3. Calculate the maximum current Imax = Vmax/Z = 6/5,09 = 1,18 A.
Worked Example 180: An RC circuit
Question: Part of a radio contains a 30 Ω resistor in series with a 3 µF capacitor.What is its impedance at a frequency of 1 kHz?Answer
1. Calculate the reactance of the capacitor
XC =1
2πfC=
1
2π × 103 × 3 × 10−6= 53,05 Ω
2. Calculate the impedance Z =√
X2 + R2 =√
53,052 + 302 = 60,9 Ω
Exercise: Capacitive and Inductive Circuits
1. Why is the instantaneous value of VI
of little use in an a.c. circuit containingan inductor or capacitor?
2. How is the reactance of an inductor different to the reactance of a capacitor?
3. Why can the ratio of the maximum voltage to the maximum current in acircuit with a resistor and an inductor not be called a reactance?
4. An engineer can describe a motor as equivalent to a 30 Ω resistor in serieswith a 30 mH inductor. If the maximum value of the supply voltage is 350 V,what is the maximum current? Assume that the frequency is 50 Hz.
5. A timer circuit in a factory contains a 200 µF capacitor in series with a 10 kΩresistor. What is its impedance? Assume that the frequency is 50 Hz.
6. A 3 mH inductor is connected in series with a 100 µF capacitor. Thereactance of the combination is zero. What is the frequency of the alternatingcurrent?
Interesting
Fact
teresting
FactMost factories containing heavy duty electrical equipment (e.g. large motors)have to pay extra money to their electricity supply company because theinductance of the motor coils causes the current and voltage to get out ofphase. As this makes the electricity distribution network less efficient, afinancial penalty is incurred. The factory engineer can prevent this byconnecting capacitors into the circuit to reduce the reactance to zero, as in thelast question above. The current and voltage are then in phase again. We can’tcalculate the capacitance needed in this chapter, because the capacitors areusually connected in parallel, and we have only covered the reactances andimpedances of series circuits.
595

29.3 CHAPTER 29. ELECTRONICS - GRADE 12
29.3 Filters and Signal Tuning
29.3.1 Capacitors and Inductors as Filters
We have already seen how capacitors and inductors pass current more easily at certainfrequencies than others. To recap: if we examine the equation for the reactance of a capacitor,we see that the frequency is in the denominator. Therefore, when the frequency is low, thecapacitive reactance is very high. This is why a capacitor blocks the flow of DC and lowfrequency AC because its reactance increases with decreasing frequency.
When the frequency is high, the capacitive reactance is low. This is why a capacitor allows theflow of high frequency AC because its reactance decreases with increasing frequency.
Therefore putting a capacitor in a circuit blocks the low frequencies and allows the highfrequencies to pass. This is called a high pass filter. A filter like this can be used in the ‘treble’setting of a sound mixer or music player which controls the amount of high frequency signalreaching the speaker. The more high frequency signal there is, the ‘tinnier’ the sound. A simplehigh pass filter circuit is shown in Figure 29.5.
Similarly, if we examine the equation for the reactance of an inductor, we see that inductivereactance increases with increasing frequency. Therefore, when the frequency is low, theinductive reactance is very low. This is why an inductor allows the flow of DC and lowfrequency AC because its reactance decreases with decreasing frequency.
When the frequency is high, the inductive reactance is high. This is why an inductor blocks theflow of high frequency AC because its reactance increases with increasing frequency.
Therefore putting an inductor in a circuit blocks the high frequencies and allows the lowfrequencies to pass. This is called a low pass filter. A filter like this can be used in the ‘bass’setting of a sound mixer or music player which controls the amount of low frequency signalreaching the speaker. The more low frequency signal there is, the more the sound ‘booms’. Asimple low pass filter circuit is shown in Figure 29.6.
C
L
Figure 29.5: A high pass filter. High frequencies easily pass through the capacitor and into thenext part of the circuit, while low frequencies pass through the inductor straight to ground.
29.3.2 LRC Circuits, Resonance and Signal Tuning
A circuit containing a resistor, a capacitor and an inductor all in series is called an LRC circuit.Because the components are in series, the current through each component at a particular timewill be the same as the current through the others. The voltage across the resistor will be inphase with the current. The voltage across the inductor will be 90 ahead of the current (thecurrent always follows or lags the voltage in an inductor). The voltage across the capacitor willbe 90 behind the current (the current leads the voltage for a capacitor). The phases of thethree voltages are shown in Figure 29.7.
596
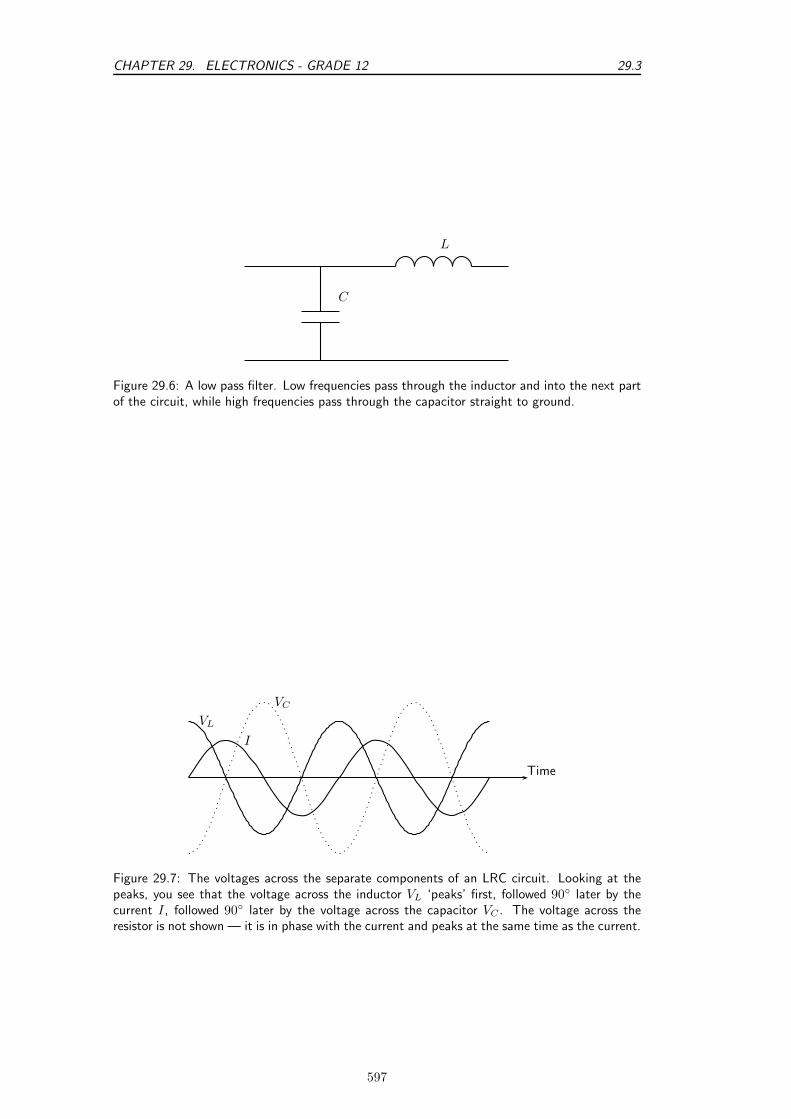
CHAPTER 29. ELECTRONICS - GRADE 12 29.3
C
L
Figure 29.6: A low pass filter. Low frequencies pass through the inductor and into the next partof the circuit, while high frequencies pass through the capacitor straight to ground.
Time
I
VL
VC
Figure 29.7: The voltages across the separate components of an LRC circuit. Looking at thepeaks, you see that the voltage across the inductor VL ‘peaks’ first, followed 90 later by thecurrent I, followed 90 later by the voltage across the capacitor VC . The voltage across theresistor is not shown — it is in phase with the current and peaks at the same time as the current.
597

29.3 CHAPTER 29. ELECTRONICS - GRADE 12
The reactance of the inductor is 2πfL, and the reactance of the capacitor is 1/2πfC but withthe opposite phase. So the total reactance of the LRC circuit is
X = XL − XC = 2πfL − 1
2πfC
The impedance of the circuit as a whole is given by
Z =√
X2 + R2 =
√
(
2πfL − 1
2πfC
)2
+ R2
At different frequencies, the impedance will take different values. The impedance will have itssmallest value when the positive inductive reactance cancels out the negative capacitivereactance. This occurs when
2πfL =1
2πfC
so the frequency of minimum impedance must be
f =1
2π√
LC
This is called the resonant frequency of the circuit. This is the frequency at which you canget the largest current for a particular supply voltage. It is also called the natural frequencyof the circuit. This means the frequency at which the circuit would oscillate by itself.
Definition: ResonanceResonance occurs when a circuit is connected to an alternating voltage at its natural fre-quency. A very large current in the circuit can build up, even with minimal power input.
An LRC circuit is very useful when we have a signal containing many different frequencies, andwe only want one of them. If a signal like this is connected to an LRC circuit, then only theresonant frequency (and other frequencies close to it) will drive measureable currents. Thismeans that an LRC circuit can select one frequency from a range. This process is called signaltuning.
Interesting
Fact
teresting
FactWhen you set up a radio antenna, and amplify the radio signal it receives, youfind many different bands of frequencies — one from each radio station. Whenyou listen to the radio, you only want to listen to one station. An LRC circuitin the radio (the tuning circuit) is set so that its resonant frequency is thefrequency of the station you want to listen to. This means that of the manyradio stations broadcasting, you only hear one. When you adjust the tuningdial on the radio, it changes the capacitance of the capacitor in the tuningcircuit. This changes the resonant frequency, and this changes the radio stationthat you will hear.
Exercise: Filters and Signal Tuning
1. Which component would you use if you wanted to block low frequencies?
598
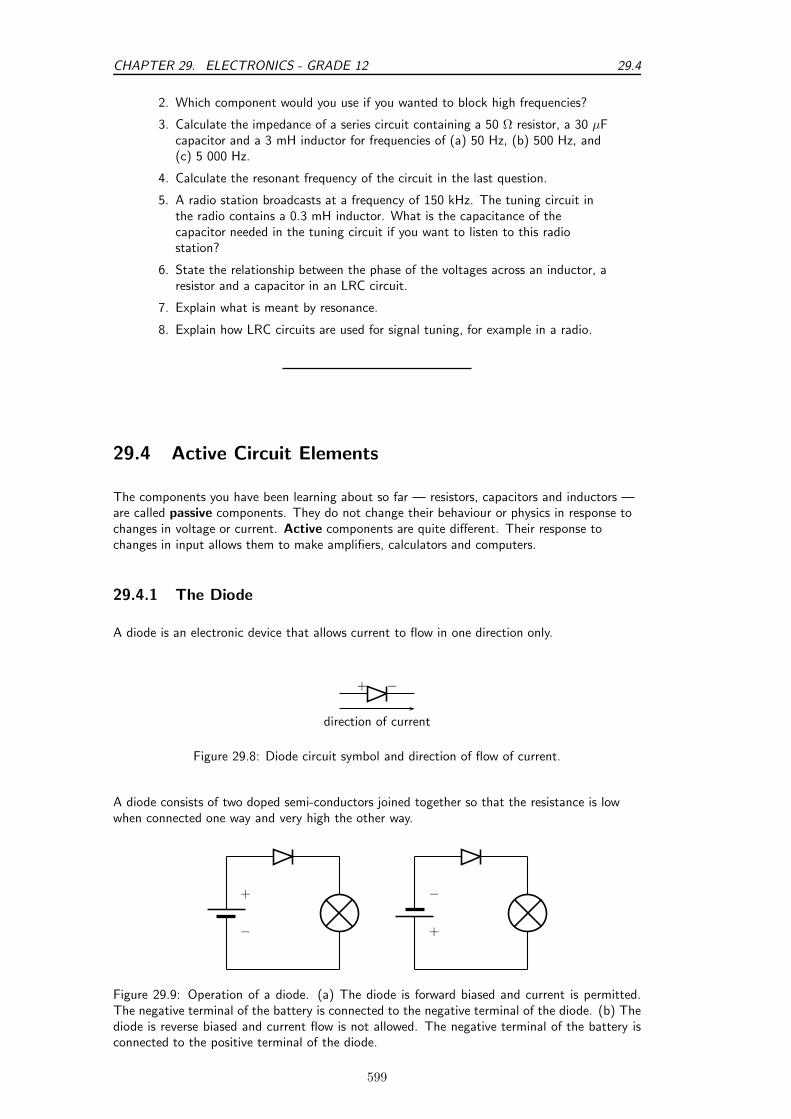
CHAPTER 29. ELECTRONICS - GRADE 12 29.4
2. Which component would you use if you wanted to block high frequencies?
3. Calculate the impedance of a series circuit containing a 50 Ω resistor, a 30 µFcapacitor and a 3 mH inductor for frequencies of (a) 50 Hz, (b) 500 Hz, and(c) 5 000 Hz.
4. Calculate the resonant frequency of the circuit in the last question.
5. A radio station broadcasts at a frequency of 150 kHz. The tuning circuit inthe radio contains a 0.3 mH inductor. What is the capacitance of thecapacitor needed in the tuning circuit if you want to listen to this radiostation?
6. State the relationship between the phase of the voltages across an inductor, aresistor and a capacitor in an LRC circuit.
7. Explain what is meant by resonance.
8. Explain how LRC circuits are used for signal tuning, for example in a radio.
29.4 Active Circuit Elements
The components you have been learning about so far — resistors, capacitors and inductors —are called passive components. They do not change their behaviour or physics in response tochanges in voltage or current. Active components are quite different. Their response tochanges in input allows them to make amplifiers, calculators and computers.
29.4.1 The Diode
A diode is an electronic device that allows current to flow in one direction only.
direction of current
+ −
Figure 29.8: Diode circuit symbol and direction of flow of current.
A diode consists of two doped semi-conductors joined together so that the resistance is lowwhen connected one way and very high the other way.
+
− +
−
Figure 29.9: Operation of a diode. (a) The diode is forward biased and current is permitted.The negative terminal of the battery is connected to the negative terminal of the diode. (b) Thediode is reverse biased and current flow is not allowed. The negative terminal of the battery isconnected to the positive terminal of the diode.
599
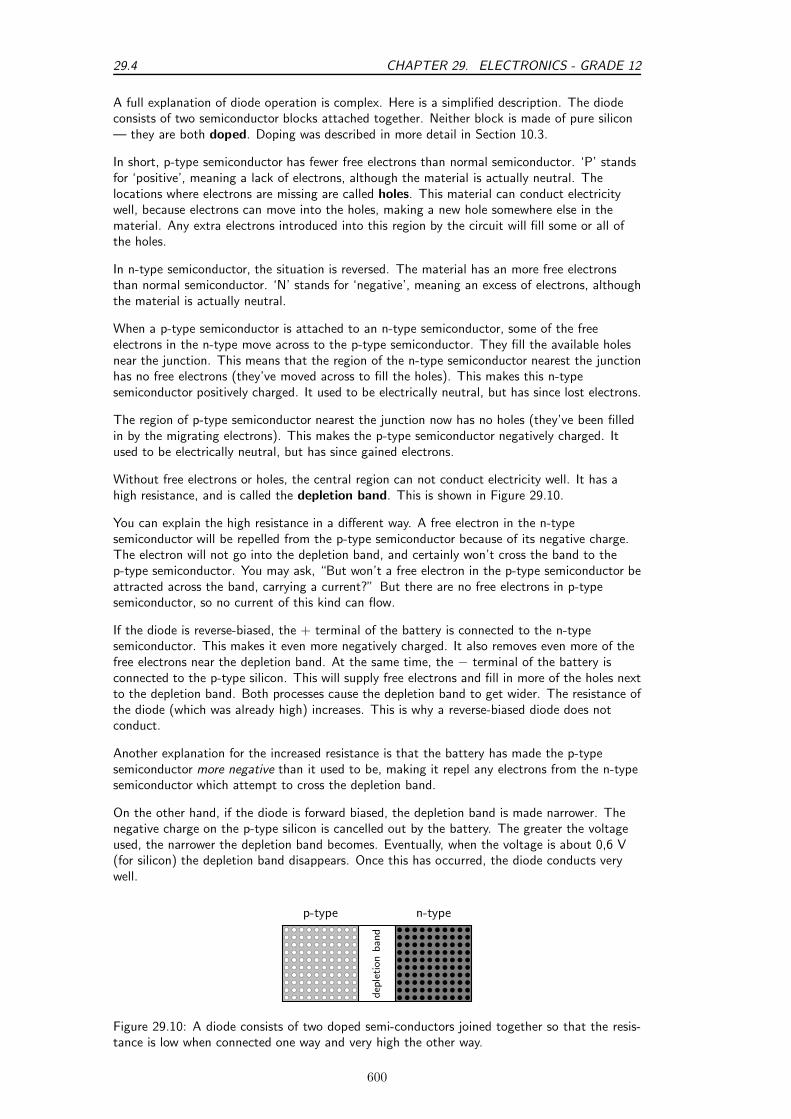
29.4 CHAPTER 29. ELECTRONICS - GRADE 12
A full explanation of diode operation is complex. Here is a simplified description. The diodeconsists of two semiconductor blocks attached together. Neither block is made of pure silicon— they are both doped. Doping was described in more detail in Section 10.3.
In short, p-type semiconductor has fewer free electrons than normal semiconductor. ‘P’ standsfor ‘positive’, meaning a lack of electrons, although the material is actually neutral. Thelocations where electrons are missing are called holes. This material can conduct electricitywell, because electrons can move into the holes, making a new hole somewhere else in thematerial. Any extra electrons introduced into this region by the circuit will fill some or all ofthe holes.
In n-type semiconductor, the situation is reversed. The material has an more free electronsthan normal semiconductor. ‘N’ stands for ‘negative’, meaning an excess of electrons, althoughthe material is actually neutral.
When a p-type semiconductor is attached to an n-type semiconductor, some of the freeelectrons in the n-type move across to the p-type semiconductor. They fill the available holesnear the junction. This means that the region of the n-type semiconductor nearest the junctionhas no free electrons (they’ve moved across to fill the holes). This makes this n-typesemiconductor positively charged. It used to be electrically neutral, but has since lost electrons.
The region of p-type semiconductor nearest the junction now has no holes (they’ve been filledin by the migrating electrons). This makes the p-type semiconductor negatively charged. Itused to be electrically neutral, but has since gained electrons.
Without free electrons or holes, the central region can not conduct electricity well. It has ahigh resistance, and is called the depletion band. This is shown in Figure 29.10.
You can explain the high resistance in a different way. A free electron in the n-typesemiconductor will be repelled from the p-type semiconductor because of its negative charge.The electron will not go into the depletion band, and certainly won’t cross the band to thep-type semiconductor. You may ask, “But won’t a free electron in the p-type semiconductor beattracted across the band, carrying a current?” But there are no free electrons in p-typesemiconductor, so no current of this kind can flow.
If the diode is reverse-biased, the + terminal of the battery is connected to the n-typesemiconductor. This makes it even more negatively charged. It also removes even more of thefree electrons near the depletion band. At the same time, the − terminal of the battery isconnected to the p-type silicon. This will supply free electrons and fill in more of the holes nextto the depletion band. Both processes cause the depletion band to get wider. The resistance ofthe diode (which was already high) increases. This is why a reverse-biased diode does notconduct.
Another explanation for the increased resistance is that the battery has made the p-typesemiconductor more negative than it used to be, making it repel any electrons from the n-typesemiconductor which attempt to cross the depletion band.
On the other hand, if the diode is forward biased, the depletion band is made narrower. Thenegative charge on the p-type silicon is cancelled out by the battery. The greater the voltageused, the narrower the depletion band becomes. Eventually, when the voltage is about 0,6 V(for silicon) the depletion band disappears. Once this has occurred, the diode conducts verywell.
bc
bc
bc
bc
bc
bc
bc
bc
bc
bc
bc
bc
bc
bc
bc
bc
bc
bc
bc
bc
bc
bc
bc
bc
bc
bc
bc
bc
bc
bc
bc
bc
bc
bc
bc
bc
bc
bc
bc
bc
bc
bc
bc
bc
bc
bc
bc
bc
bc
bc
bc
bc
bc
bc
bc
bc
bc
bc
bc
bc
bc
bc
bc
bc
bc
bc
bc
bc
bc
bc
bc
bc
bc
bc
bc
bc
bc
bc
bc
bc
bc
bc
bc
bc
bc
bc
bc
bc
bc
bc
bc
bc
bc
bc
bc
bc
bc
bc
bc
bc
b
b
b
b
b
b
b
b
b
b
b
b
b
b
b
b
b
b
b
b
b
b
b
b
b
b
b
b
b
b
b
b
b
b
b
b
b
b
b
b
b
b
b
b
b
b
b
b
b
b
b
b
b
b
b
b
b
b
b
b
b
b
b
b
b
b
b
b
b
b
b
b
b
b
b
b
b
b
b
b
b
b
b
b
b
b
b
b
b
b
b
b
b
b
b
b
b
b
b
b
p-type n-type
dep
letion
band
Figure 29.10: A diode consists of two doped semi-conductors joined together so that the resis-tance is low when connected one way and very high the other way.
600

CHAPTER 29. ELECTRONICS - GRADE 12 29.4
Exercise: The Diode
1. What is a diode?
2. What is a diode made of?
3. What is the term which means that a diode is connected the ‘wrong way’ andlittle current is flowing?
4. Why is a diode able to conduct electricity in one direction much more easilythan the other?
29.4.2 The Light Emitting Diode (LED)
A light-emitting diode (LED) is a diode device that emits light when charge flows in the correctdirection through it. If you apply a voltage to force current to flow in the direction the LEDallows it will light up.
Extension: Circuit SymbolsThis notation of having two small arrows pointing away from the device is
common to the schematic symbols of all light-emitting semiconductor devices.Conversely, if a device is light-activated (meaning that incoming light stimulatesit), then the symbol will have two small arrows pointing toward it. It is interestingto note, though, that LEDs are capable of acting as light-sensing devices: they willgenerate a small voltage when exposed to light, much like a solar cell on a smallscale. This property can be gainfully applied in a variety of light-sensing circuits.
The color depends on the semiconducting material used to construct the LED, and can be inthe near-ultraviolet, visible or infrared part of the electromagnetic spectrum.
Interesting
Fact
teresting
FactNick Holonyak Jr. (1928 ) of the University of Illinois at Urbana-Champaigndeveloped the first practical visible-spectrum LED in 1962.
Light emission
The wavelength of the light emitted, and therefore its color, depends on the materials formingthe p-n junction. A normal diode, typically made of silicon or germanium, emits invisiblefar-infrared light (so it can’t be seen), but the materials used for an LED have emit lightcorresponding to near-infrared, visible or near-ultraviolet frequencies.
601
29.4 CHAPTER 29. ELECTRONICS - GRADE 12
LED applications
LEDs have many uses. Some of these are given here.
• thin, lightweight message displays, e.g. in public information signs (at airports andrailway stations, among other places)
• status indicators, e.g. on/off lights on professional instruments and consumersaudio/video equipment
• infrared LEDs in remote controls (for TVs, VCRs, etc)
• clusters of LEDs are used in traffic signals, replacing ordinary bulbs behind colored glass
• car indicator lights and bicycle lighting
• calculator and measurement instrument displays (seven segment displays), although nowmostly replaced by LCDs
• red or yellow LEDs are used in indicator and [alpha]numeric displays in environmentswhere night vision must be retained: aircraft cockpits, submarine and ship bridges,astronomy observatories, and in the field, e.g. night time animal watching and militaryfield use
• red or yellow LEDs are also used in photographic darkrooms, for providing lighting whichdoes not lead to unwanted exposure of the film
• illumination, e.g. flashlights (a.k.a. torches, UK), and backlighting for LCD screens
• signaling/emergency beacons and strobes
• movement sensors, e.g. in mechanical and optical computer mice and trackballs
• in LED printers, e.g. high-end color printers
LEDs offer benefits in terms of maintenance and safety.
• The typical working lifetime of a device, including the bulb, is ten years, which is muchlonger than the lifetimes of most other light sources.
• LEDs fail by dimming over time, rather than the abrupt burn-out of incandescent bulbs.
• LEDs give off less heat than incandescent light bulbs and are less fragile than fluorescentlamps.
• Since an individual device is smaller than a centimetre in length, LED-based light sourcesused for illumination and outdoor signals are built using clusters of tens of devices.
Because they are monochromatic, LED lights have great power advantages over white lightswhere a specific color is required. Unlike the white lights, the LED does not need a filter thatabsorbs most of the emitted white light. Colored fluorescent lights are made, but they are notwidely available. LED lights are inherently colored, and are available in a wide range of colors.One of the most recently introduced colors is the emerald green (bluish green, about 500 nm)that meets the legal requirements for traffic signals and navigation lights.
Interesting
Fact
teresting
FactThe largest LED display in the world is 36 m high, at Times Square, NewYork, U.S.A.
602

CHAPTER 29. ELECTRONICS - GRADE 12 29.4
There are applications that specifically require light that does not contain any blue component.Examples are photographic darkroom safe lights, illumination in laboratories where certainphoto-sensitive chemicals are used, and situations where dark adaptation (night vision) must bepreserved, such as cockpit and bridge illumination, observatories, etc. Yellow LED lights are agood choice to meet these special requirements because the human eye is more sensitive toyellow light.
Exercise: The Light Emitting Diode
1. What is an LED?
2. List 5 applications of LEDs.
29.4.3 Transistor
The diode is the simplest semiconductor device, made up of a p-type semiconductor and ann-type semiconductor in contact. It can conduct in only one direction, but it cannot control thesize of an electric current. Transistors are more complicated electronic components which cancontrol the size of the electric current flowing through them.
This enables them to be used in amplifiers. A small signal from a microphone or a radioantenna can be used to control the transistor. In response, the transistor will then increase anddecrease a much larger current which flows through the speakers.
Interesting
Fact
teresting
FactOne of the earliest popular uses of transistors was in cheap and portable radios.Before that, radios were much more expensive and contained glass valves whichwere fragile and needed replacing. In some parts of the world you can still hearpeople talking about their ‘transistor’ — they mean their portable radio.
You can also use a small current to turn the transistor on and off. The transistor then controlsa more complicated or powerful current through other components. When a transistor is usedin this way it is said to be in switching mode as it is acting as a remotely controlled switch. Aswe shall see in the final sections of this chapter, switching circuits can be used in a computerto process and store digital information. A computer would not work without the millions (orbillions) of transistors in it.
There are two main types of transistor - bipolar transistors (NPN or PNP), and field effecttransistors (FETs). Both use doped semiconductors, but in different ways. You are mainlyrequired to know about field effect transistors (FETs), however we have to give a briefdescription of bipolar transistors so that you see the difference.
Bipolar Transistors
Bipolar transistors are made of a doped semiconductor ‘sandwich’. In an NPN transistor, avery thin layer of p-type semiconductor is in between two thicker layers of n-type
603

29.4 CHAPTER 29. ELECTRONICS - GRADE 12
N P NEmitter Collector
Base
Figure 29.11: An NPN transistor. This is a type of bipolar transistor.
semiconductor. This is shown in Figure 29.11. Similarly an PNP transistor consists of a verythin n-type layer in between two thicker layers of p-type semiconductor.
In an NPN transistor a small current of electrons flows from the emitter (E) to the base (B).Simultaneously, a much larger current of electrons flows from the emitter (E) to the collector(C). If you lower the number of electrons able to leave the transistor at the base (B), thetransistor automatically reduces the number of electrons flowing from emitter (E) to collector(C). Similarly, if you increase the current of electrons flowing out of the base (B), the transistorautomatically also increases the current of electrons flowing from emitter (E) to collector (C).The transistor is designed so that the current of electrons from emitter to collector (IEC) isproportional to the current of electrons from emitter to base (IEB). The constant ofproportionality is known as the current gain β. So IEC = βIEB .
How does it do it? The answer comes from our work with diodes. Electrons arriving at theemitter (n-type semiconductor) will naturally flow through into the central p-type since thebase-emitter junction is forward biased. However if none of these electrons are removed fromthe base, the electrons flowing into the base from the emitter will fill all of the available ‘holes’.Accordingly, a large depletion band will be set up. This will act as an insulator preventingcurrent flow into the collector as well. On the other hand, if the base is connected to a positivevoltage, a small number of electrons will be removed by the base connection. This will preventthe ‘holes’ in the base becoming filled up, and no depletion band will form. While someelectrons from the emitter leave via the base connection, the bulk of them flow straight on tothe collector. You may wonder how the electrons get from the base into the collector (it seemsto be reverse biased). The answer is complicated, but the important fact is that the p-typelayer is extremely thin. As long as there is no depletion layer, the bulk of the electrons will haveno difficulty passing straight from the n-type emitter into the n-type collector. A moresatisfactory answer can be given to a university student once band theory has been explained.
Summing up, in an NPN transistor, a small flow of electrons from emitter (E) to base (B)allows a much larger flow of electrons from emitter (E) to collector (C). Given thatconventional current (flowing from + to −) is in the opposite direction to electron flow, we saythat a small conventional current from base to emitter allows a large current to flow fromcollector to emitter.
A PNP transistor works the other way. A small conventional current from emitter to baseallows a much larger conventional current to flow from emitter to collector. The operation ismore complicated to explain since the principal charge carrier in a PNP transistor is not theelectron but the ‘hole’.
The operation of NPN and PNP transistors (in terms of conventional currents) is summarizedin Figure 29.12.
Interesting
Fact
teresting
FactThe transistor is considered by many to be one of the greatest discoveries orinventions in modern history, ranking with banking and the printing press. Keyto the importance of the transistor in modern society is its ability to beproduced in huge numbers using simple techniques, resulting in vanishinglysmall prices. Computer “chips” consist of millions of transistors and sell for
604

CHAPTER 29. ELECTRONICS - GRADE 12 29.4
Figure 29.12: An overview of bipolar transistors as current amplifiers.
Rands, with per-transistor costs in the thousandths-of-cents. The low cost hasmeant that the transistor has become an almost universal tool fornon-mechanical tasks. Whereas a common device, say a refrigerator, wouldhave used a mechanical device for control, today it is often less expensive tosimply use a few million transistors and the appropriate computer program tocarry out the same task through ”brute force”. Today transistors have replacedalmost all electromechanical devices, most simple feedback systems, and appearin huge numbers in everything from computers to cars.
Interesting
Fact
teresting
FactThe transistor was invented at Bell Laboratories in December 1947 (firstdemonstrated on December 23) by John Bardeen, Walter Houser Brattain, andWilliam Bradford Shockley, who were awarded the Nobel Prize in physics in1956.
The Field Effect Transistor (FET)
To control a bipolar transistors, you control the current flowing into or out of its base. Theother type of transistor is the field effect transistor (FET). FETs work using control voltagesinstead. Accordingly they can be controlled with much smaller currents and are much moreeconomic to use.
Interesting
Fact
teresting
FactNo-one would build a computer with billions of bipolar transistors — thecurrent in each transistor’s base might be small, but when you add up all of the
605

29.4 CHAPTER 29. ELECTRONICS - GRADE 12
base currents in the millions of transistors, the computer as a whole would beconsuming a great deal of electricity and making a great deal of heat. Not onlyis this wasteful, it would prevent manufacturers making a computer ofconvenient size. If the transistors were too close together, they would overheat.
N NP
ChannelSource Drain
Gate
Gate
Source
Drain
Figure 29.13: A field effect transistor (FET). The diagram on the left shows the semiconductorstructure. The diagram on the right shows its circuit symbol.
The three terminals of the FET are called the source (S), drain (D) and gate (G), as shown inFigure 29.13. When the gate is not connected, a current of electrons can flow from source (S)to drain (D) easily along the channel. The source is, accordingly, the negative terminal of thetransistor. The drain, where the electrons come out, is the positive terminal of the transistor.A few electrons will flow from the n-type channel into the p-type semiconductor of the gatewhen the device is manufactured. However, as these electrons are not removed (the gate is notconnected), a depletion band is set up which prevents further flow into the gate.
In operation, the gate is connected to negative voltages relative to the source. This makes thep-n junction between gate and channel reverse-biased. Accordingly no current flows from thesource into the gate. When the voltage of the gate is lowered (made more negative), thedepletion band becomes wider. This enlarged depletion band takes up some of the space of thechannel. So the lower the voltage of the gate (the more negative it is relative to the source),the larger the depletion band. The larger the depletion band, the narrower the channel. Thenarrower the channel, the harder it is for electrons to flow from source to drain.
The voltage of the gate is not the only factor affecting the current of electrons between thesource and the drain. If the external circuit has a low resistance, electrons are able to leave thedrain easily. If the external circuit has a high resistance, electrons leave the drain slowly. Thiscreates a kind of ‘traffic jam’ which slows the passage of further electrons. In this way, thevoltage of the drain regulates itself, and is more or less independent of the current demandedfrom the drain.
Once these two factors have been taken into account, it is fair to say that the positive outputvoltage (the voltage of the drain relative to the source) is proportional to the negative inputvoltage (the voltage of the gate relative to the source).
For this reason, the field effect transistor is known as a voltage amplifier. This contrasts withthe bipolar transistor which is a current amplifier.
Exercise: Field Effect Transistors
1. What are the two types of bipolar transistor? How does their constructiondiffer?
2. What are the three connections to a bipolar transistor called?
3. Why are very few electrons able to flow from emitter to collector in an NPNtransistor if the base is not connected?
606
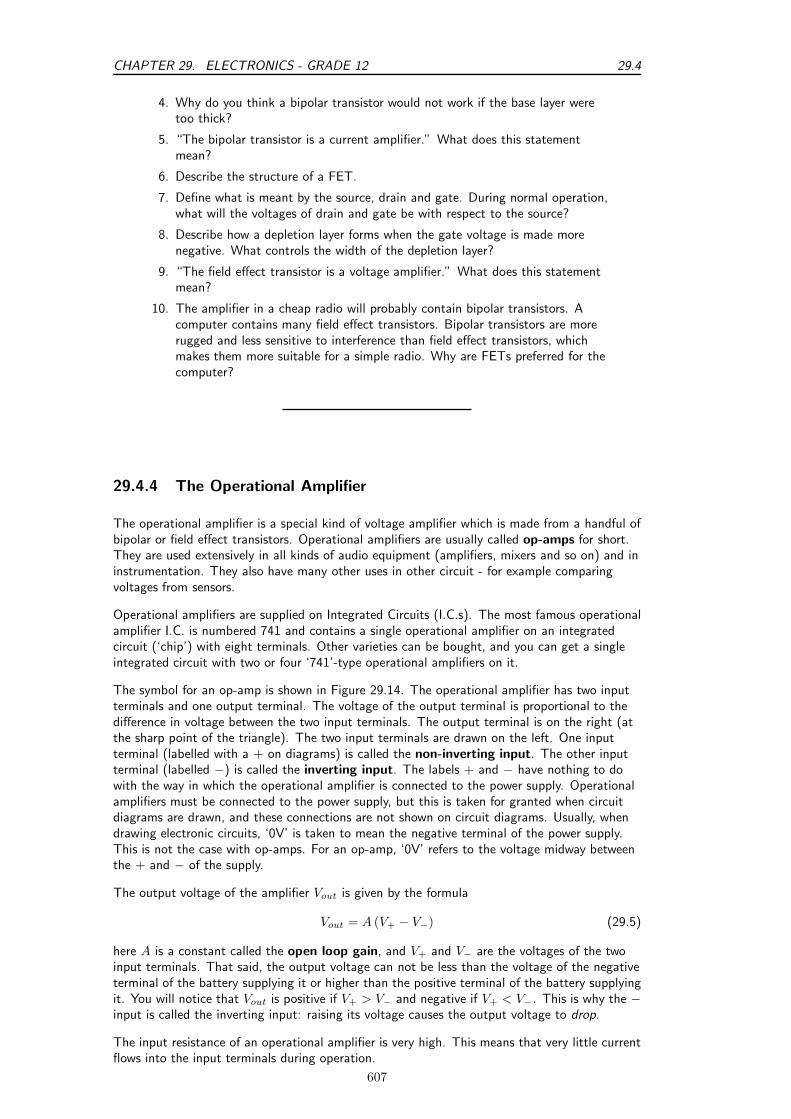
CHAPTER 29. ELECTRONICS - GRADE 12 29.4
4. Why do you think a bipolar transistor would not work if the base layer weretoo thick?
5. “The bipolar transistor is a current amplifier.” What does this statementmean?
6. Describe the structure of a FET.
7. Define what is meant by the source, drain and gate. During normal operation,what will the voltages of drain and gate be with respect to the source?
8. Describe how a depletion layer forms when the gate voltage is made morenegative. What controls the width of the depletion layer?
9. “The field effect transistor is a voltage amplifier.” What does this statementmean?
10. The amplifier in a cheap radio will probably contain bipolar transistors. Acomputer contains many field effect transistors. Bipolar transistors are morerugged and less sensitive to interference than field effect transistors, whichmakes them more suitable for a simple radio. Why are FETs preferred for thecomputer?
29.4.4 The Operational Amplifier
The operational amplifier is a special kind of voltage amplifier which is made from a handful ofbipolar or field effect transistors. Operational amplifiers are usually called op-amps for short.They are used extensively in all kinds of audio equipment (amplifiers, mixers and so on) and ininstrumentation. They also have many other uses in other circuit - for example comparingvoltages from sensors.
Operational amplifiers are supplied on Integrated Circuits (I.C.s). The most famous operationalamplifier I.C. is numbered 741 and contains a single operational amplifier on an integratedcircuit (‘chip’) with eight terminals. Other varieties can be bought, and you can get a singleintegrated circuit with two or four ‘741’-type operational amplifiers on it.
The symbol for an op-amp is shown in Figure 29.14. The operational amplifier has two inputterminals and one output terminal. The voltage of the output terminal is proportional to thedifference in voltage between the two input terminals. The output terminal is on the right (atthe sharp point of the triangle). The two input terminals are drawn on the left. One inputterminal (labelled with a + on diagrams) is called the non-inverting input. The other inputterminal (labelled −) is called the inverting input. The labels + and − have nothing to dowith the way in which the operational amplifier is connected to the power supply. Operationalamplifiers must be connected to the power supply, but this is taken for granted when circuitdiagrams are drawn, and these connections are not shown on circuit diagrams. Usually, whendrawing electronic circuits, ‘0V’ is taken to mean the negative terminal of the power supply.This is not the case with op-amps. For an op-amp, ‘0V’ refers to the voltage midway betweenthe + and − of the supply.
The output voltage of the amplifier Vout is given by the formula
Vout = A (V+ − V−) (29.5)
here A is a constant called the open loop gain, and V+ and V− are the voltages of the twoinput terminals. That said, the output voltage can not be less than the voltage of the negativeterminal of the battery supplying it or higher than the positive terminal of the battery supplyingit. You will notice that Vout is positive if V+ > V− and negative if V+ < V−. This is why the −input is called the inverting input: raising its voltage causes the output voltage to drop.
The input resistance of an operational amplifier is very high. This means that very little currentflows into the input terminals during operation.
607
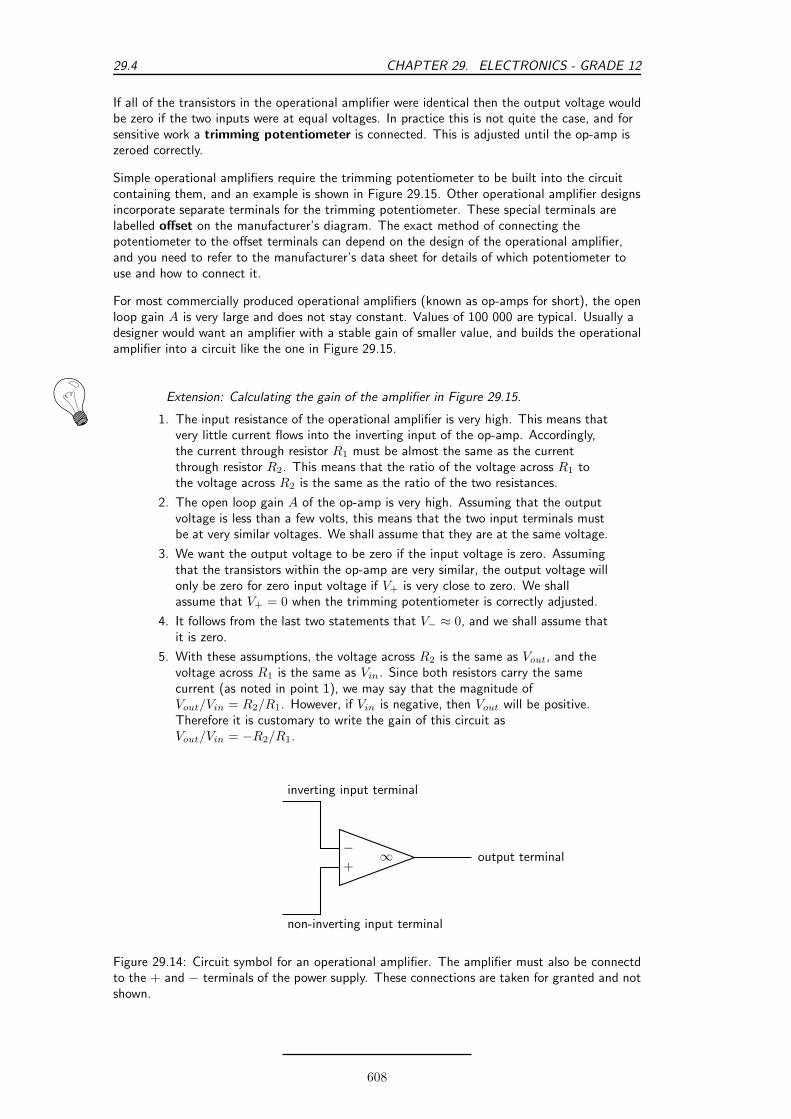
29.4 CHAPTER 29. ELECTRONICS - GRADE 12
If all of the transistors in the operational amplifier were identical then the output voltage wouldbe zero if the two inputs were at equal voltages. In practice this is not quite the case, and forsensitive work a trimming potentiometer is connected. This is adjusted until the op-amp iszeroed correctly.
Simple operational amplifiers require the trimming potentiometer to be built into the circuitcontaining them, and an example is shown in Figure 29.15. Other operational amplifier designsincorporate separate terminals for the trimming potentiometer. These special terminals arelabelled offset on the manufacturer’s diagram. The exact method of connecting thepotentiometer to the offset terminals can depend on the design of the operational amplifier,and you need to refer to the manufacturer’s data sheet for details of which potentiometer touse and how to connect it.
For most commercially produced operational amplifiers (known as op-amps for short), the openloop gain A is very large and does not stay constant. Values of 100 000 are typical. Usually adesigner would want an amplifier with a stable gain of smaller value, and builds the operationalamplifier into a circuit like the one in Figure 29.15.
Extension: Calculating the gain of the amplifier in Figure 29.15.
1. The input resistance of the operational amplifier is very high. This means thatvery little current flows into the inverting input of the op-amp. Accordingly,the current through resistor R1 must be almost the same as the currentthrough resistor R2. This means that the ratio of the voltage across R1 tothe voltage across R2 is the same as the ratio of the two resistances.
2. The open loop gain A of the op-amp is very high. Assuming that the outputvoltage is less than a few volts, this means that the two input terminals mustbe at very similar voltages. We shall assume that they are at the same voltage.
3. We want the output voltage to be zero if the input voltage is zero. Assumingthat the transistors within the op-amp are very similar, the output voltage willonly be zero for zero input voltage if V+ is very close to zero. We shallassume that V+ = 0 when the trimming potentiometer is correctly adjusted.
4. It follows from the last two statements that V− ≈ 0, and we shall assume thatit is zero.
5. With these assumptions, the voltage across R2 is the same as Vout, and thevoltage across R1 is the same as Vin. Since both resistors carry the samecurrent (as noted in point 1), we may say that the magnitude ofVout/Vin = R2/R1. However, if Vin is negative, then Vout will be positive.Therefore it is customary to write the gain of this circuit asVout/Vin = −R2/R1.
−+
∞
non-inverting input terminal
inverting input terminal
output terminal
Figure 29.14: Circuit symbol for an operational amplifier. The amplifier must also be connectdto the + and − terminals of the power supply. These connections are taken for granted and notshown.
608
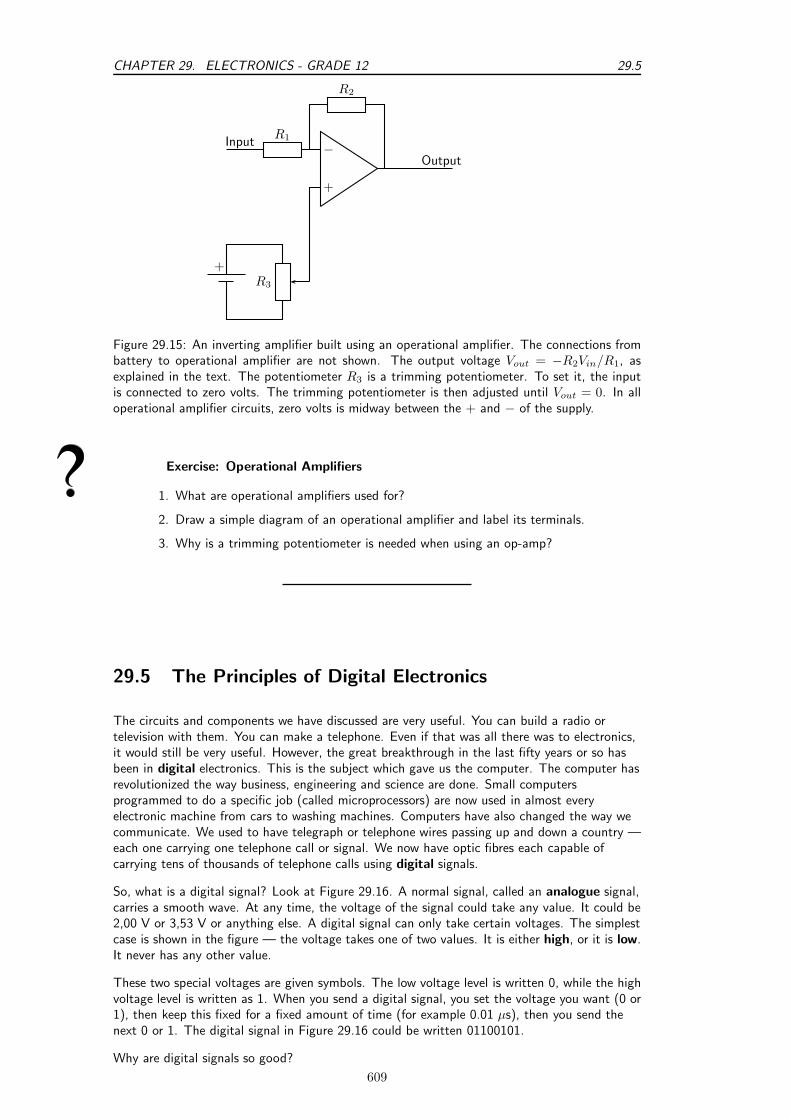
CHAPTER 29. ELECTRONICS - GRADE 12 29.5
+
−R1
R2
Input
Output
R3
+
Figure 29.15: An inverting amplifier built using an operational amplifier. The connections frombattery to operational amplifier are not shown. The output voltage Vout = −R2Vin/R1, asexplained in the text. The potentiometer R3 is a trimming potentiometer. To set it, the inputis connected to zero volts. The trimming potentiometer is then adjusted until Vout = 0. In alloperational amplifier circuits, zero volts is midway between the + and − of the supply.
Exercise: Operational Amplifiers
1. What are operational amplifiers used for?
2. Draw a simple diagram of an operational amplifier and label its terminals.
3. Why is a trimming potentiometer is needed when using an op-amp?
29.5 The Principles of Digital Electronics
The circuits and components we have discussed are very useful. You can build a radio ortelevision with them. You can make a telephone. Even if that was all there was to electronics,it would still be very useful. However, the great breakthrough in the last fifty years or so hasbeen in digital electronics. This is the subject which gave us the computer. The computer hasrevolutionized the way business, engineering and science are done. Small computersprogrammed to do a specific job (called microprocessors) are now used in almost everyelectronic machine from cars to washing machines. Computers have also changed the way wecommunicate. We used to have telegraph or telephone wires passing up and down a country —each one carrying one telephone call or signal. We now have optic fibres each capable ofcarrying tens of thousands of telephone calls using digital signals.
So, what is a digital signal? Look at Figure 29.16. A normal signal, called an analogue signal,carries a smooth wave. At any time, the voltage of the signal could take any value. It could be2,00 V or 3,53 V or anything else. A digital signal can only take certain voltages. The simplestcase is shown in the figure — the voltage takes one of two values. It is either high, or it is low.It never has any other value.
These two special voltages are given symbols. The low voltage level is written 0, while the highvoltage level is written as 1. When you send a digital signal, you set the voltage you want (0 or1), then keep this fixed for a fixed amount of time (for example 0.01 µs), then you send thenext 0 or 1. The digital signal in Figure 29.16 could be written 01100101.
Why are digital signals so good?
609
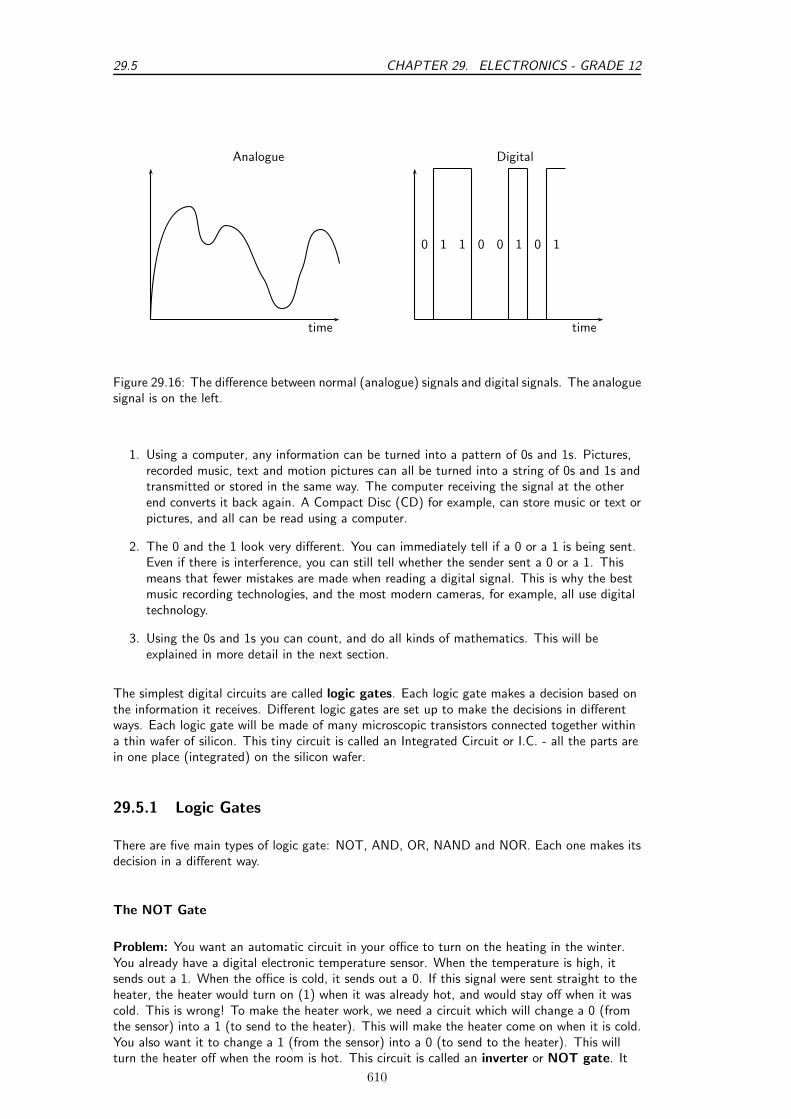
29.5 CHAPTER 29. ELECTRONICS - GRADE 12
time
Analogue
time
Digital
0 1 1 0 0 1 0 1
Figure 29.16: The difference between normal (analogue) signals and digital signals. The analoguesignal is on the left.
1. Using a computer, any information can be turned into a pattern of 0s and 1s. Pictures,recorded music, text and motion pictures can all be turned into a string of 0s and 1s andtransmitted or stored in the same way. The computer receiving the signal at the otherend converts it back again. A Compact Disc (CD) for example, can store music or text orpictures, and all can be read using a computer.
2. The 0 and the 1 look very different. You can immediately tell if a 0 or a 1 is being sent.Even if there is interference, you can still tell whether the sender sent a 0 or a 1. Thismeans that fewer mistakes are made when reading a digital signal. This is why the bestmusic recording technologies, and the most modern cameras, for example, all use digitaltechnology.
3. Using the 0s and 1s you can count, and do all kinds of mathematics. This will beexplained in more detail in the next section.
The simplest digital circuits are called logic gates. Each logic gate makes a decision based onthe information it receives. Different logic gates are set up to make the decisions in differentways. Each logic gate will be made of many microscopic transistors connected together withina thin wafer of silicon. This tiny circuit is called an Integrated Circuit or I.C. - all the parts arein one place (integrated) on the silicon wafer.
29.5.1 Logic Gates
There are five main types of logic gate: NOT, AND, OR, NAND and NOR. Each one makes itsdecision in a different way.
The NOT Gate
Problem: You want an automatic circuit in your office to turn on the heating in the winter.You already have a digital electronic temperature sensor. When the temperature is high, itsends out a 1. When the office is cold, it sends out a 0. If this signal were sent straight to theheater, the heater would turn on (1) when it was already hot, and would stay off when it wascold. This is wrong! To make the heater work, we need a circuit which will change a 0 (fromthe sensor) into a 1 (to send to the heater). This will make the heater come on when it is cold.You also want it to change a 1 (from the sensor) into a 0 (to send to the heater). This willturn the heater off when the room is hot. This circuit is called an inverter or NOT gate. It
610

CHAPTER 29. ELECTRONICS - GRADE 12 29.5
changes 0 into 1 (1 is NOT 0). It changes 1 into 0 (0 is NOT 1). It changes a signal into whatit is NOT.
The symbol for the NOT gate is:
The action of the NOT gate is written in a table called a truth table. The left column showsthe possible inputs on different rows. The right column shows what the output (decision) ofthe circuit will be for that input. The truth table for the NOT gate is shown below.
Input Output
0 11 0
When you read the truth table, the top row says, “If the input is 0, the output will be 1.” Forour heater, this means, “If the room is cold, the heater will turn on.” The bottom row says, “Ifthe input is 1, the output will be 0.” For our heater, this means, “If the room is hot, the heaterwill switch off.”
The AND Gate
Problem: An airliner has two toilets. Passengers get annoyed if they get up from their seatonly to find that both toilets are being used and they have to go back to their seat and wait.You want to fit an automatic circuit to light up a display if both toilets are in use. Thenpassengers know that if the light is off, there will be a free toilet for them to use. There is asensor in each toilet. It gives out a 0 of the toilet is free, and a 1 if it is in use. You want tosend a 1 to the display unit if both sensors are sending 1s. To do this, you use an AND gate.
The symbol for the AND gate is:
Figure 29.17: Symbol for the AND logic gate.
The truth table for the AND gate is shown below. An AND gate has two inputs (the NOT gateonly had one). This means we need four rows in the truth table, one for each possible set ofinputs. The first row, for example, tells us what the AND gate will do if both inputs are 0. Inour airliner, this means that both toilets are free. The right column has a 0 showing that theoutput will be 0, so the display will not light up. The second row has inputs of 0 and 1 (thefirst toilet is free, the other is in use). Again the output is 0. The third row tells us what willhappen if the inputs are 1 and 0 (the first toilet is in use, and the second is free). Finally, thelast line tells us what will happen if both inputs are 1 (both toilets are in use). It is only in thiscase that the output is 1 and the display lights up.
Inputs OutputA B
0 0 00 1 01 0 01 1 1
611
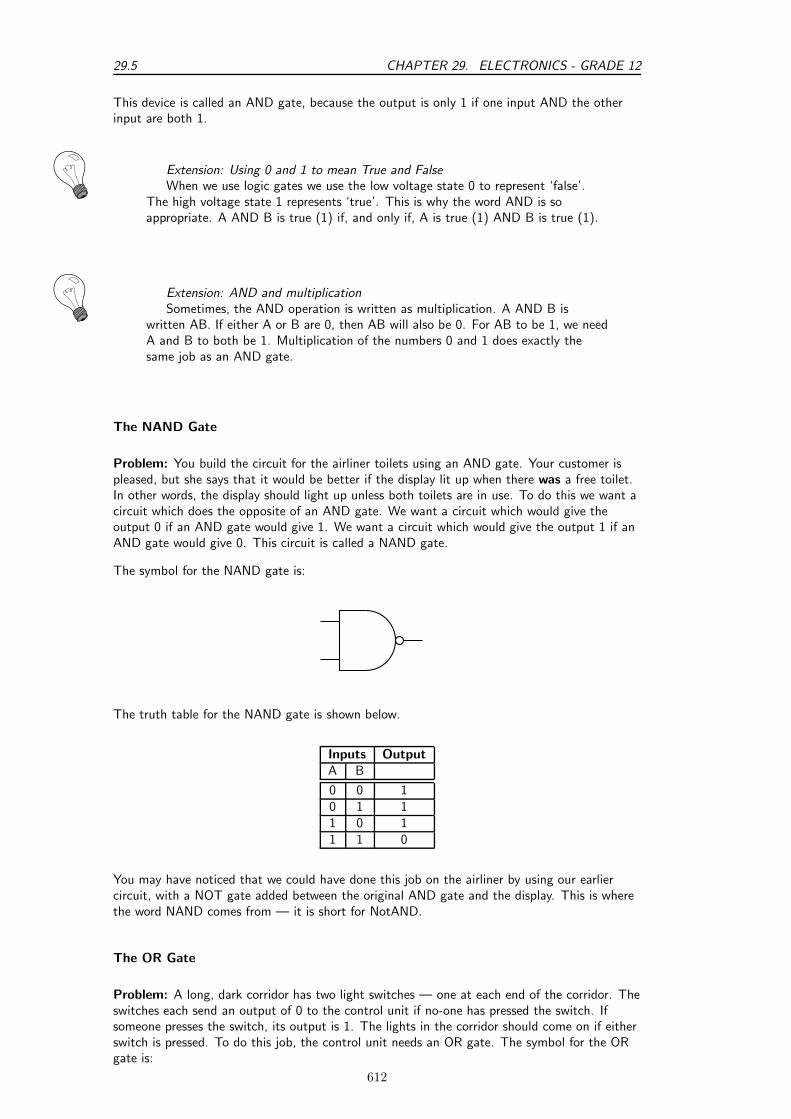
29.5 CHAPTER 29. ELECTRONICS - GRADE 12
This device is called an AND gate, because the output is only 1 if one input AND the otherinput are both 1.
Extension: Using 0 and 1 to mean True and FalseWhen we use logic gates we use the low voltage state 0 to represent ‘false’.
The high voltage state 1 represents ‘true’. This is why the word AND is soappropriate. A AND B is true (1) if, and only if, A is true (1) AND B is true (1).
Extension: AND and multiplicationSometimes, the AND operation is written as multiplication. A AND B is
written AB. If either A or B are 0, then AB will also be 0. For AB to be 1, we needA and B to both be 1. Multiplication of the numbers 0 and 1 does exactly thesame job as an AND gate.
The NAND Gate
Problem: You build the circuit for the airliner toilets using an AND gate. Your customer ispleased, but she says that it would be better if the display lit up when there was a free toilet.In other words, the display should light up unless both toilets are in use. To do this we want acircuit which does the opposite of an AND gate. We want a circuit which would give theoutput 0 if an AND gate would give 1. We want a circuit which would give the output 1 if anAND gate would give 0. This circuit is called a NAND gate.
The symbol for the NAND gate is:
The truth table for the NAND gate is shown below.
Inputs OutputA B
0 0 10 1 11 0 11 1 0
You may have noticed that we could have done this job on the airliner by using our earliercircuit, with a NOT gate added between the original AND gate and the display. This is wherethe word NAND comes from — it is short for NotAND.
The OR Gate
Problem: A long, dark corridor has two light switches — one at each end of the corridor. Theswitches each send an output of 0 to the control unit if no-one has pressed the switch. Ifsomeone presses the switch, its output is 1. The lights in the corridor should come on if eitherswitch is pressed. To do this job, the control unit needs an OR gate. The symbol for the ORgate is:
612
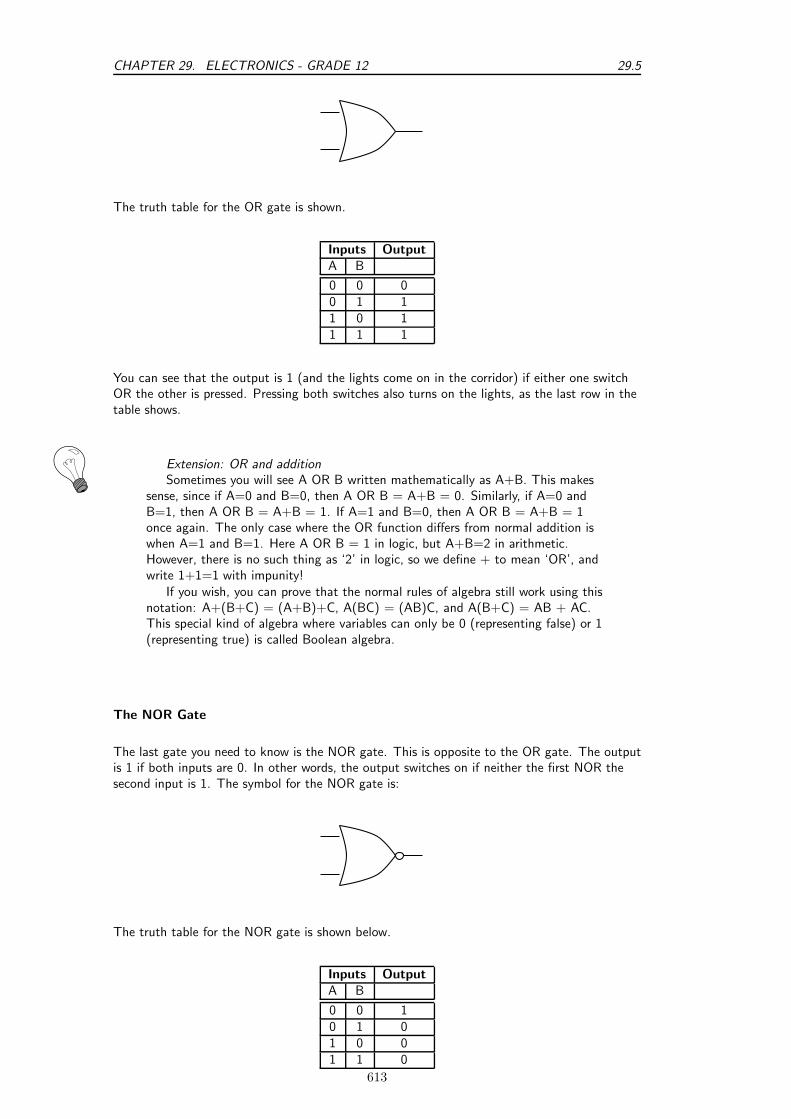
CHAPTER 29. ELECTRONICS - GRADE 12 29.5
The truth table for the OR gate is shown.
Inputs OutputA B
0 0 00 1 11 0 11 1 1
You can see that the output is 1 (and the lights come on in the corridor) if either one switchOR the other is pressed. Pressing both switches also turns on the lights, as the last row in thetable shows.
Extension: OR and additionSometimes you will see A OR B written mathematically as A+B. This makes
sense, since if A=0 and B=0, then A OR B = A+B = 0. Similarly, if A=0 andB=1, then A OR B = A+B = 1. If A=1 and B=0, then A OR B = A+B = 1once again. The only case where the OR function differs from normal addition iswhen A=1 and B=1. Here A OR B = 1 in logic, but A+B=2 in arithmetic.However, there is no such thing as ‘2’ in logic, so we define + to mean ‘OR’, andwrite 1+1=1 with impunity!
If you wish, you can prove that the normal rules of algebra still work using thisnotation: A+(B+C) = (A+B)+C, A(BC) = (AB)C, and A(B+C) = AB + AC.This special kind of algebra where variables can only be 0 (representing false) or 1(representing true) is called Boolean algebra.
The NOR Gate
The last gate you need to know is the NOR gate. This is opposite to the OR gate. The outputis 1 if both inputs are 0. In other words, the output switches on if neither the first NOR thesecond input is 1. The symbol for the NOR gate is:
The truth table for the NOR gate is shown below.
Inputs OutputA B
0 0 10 1 01 0 01 1 0
613

29.5 CHAPTER 29. ELECTRONICS - GRADE 12
The examples given were easy. Each job only needed one logic gate. However any ‘decisionmaking’ circuit can be built with logic gates, no matter how complicated the decision. Here isan example.
Worked Example 181: An Economic Heating Control
Question: A sensor in a building detects whether a room is being used. If it isempty, the output is 0, if it is in use, the output is 1. Another sensor measures thetemperature of the room. If it is cold, the output is 0. If it is hot, the output is 1.The heating comes on if it receives a 1. Design a control circuit so that the heatingonly comes on if the room is in use and it is cold.
Answer
The first sensor tells us whether the room is occupied. The second sensor tells uswhether the room is hot. The heating must come on if the room is occupied ANDcold. This means that the heating should come on if the room is occupied AND(NOT hot). To build the circuit, we first attach a NOT gate to the output of thetemperature sensor. This output of the NOT gate will be 1 only if the room iscold. We then attach this output to an AND gate, together with the output fromthe other sensor. The output of the AND gate will only be 1 if the room isoccupied AND the output of the NOT gate is also 1. So the heating will only comeon if the room is in use and is cold. The circuit is shown below.
Occupied
Hot
Output
Worked Example 182: Solving a circuit with two logic gates
Question: Compile the truth table for the circuit below.
Answer
Firstly, we label the inputs A and B. We also label the point where the two gatesare connected C.
A
BC Output
Next we prepare a truth table. There is a column for each of the inputs, for theintermediate point C and also for the output. The truth table has four rows, sincethere are four possible inputs — 00, 01, 10 and 11.
614

CHAPTER 29. ELECTRONICS - GRADE 12 29.5
A B C Output
0 00 11 01 1
Next we fill in the C column given that we know what a NOR gate does.
A B C Output
0 0 10 1 01 0 01 1 0
Next, we can fill in the output, since it will always be the opposite of C (because ofthe NOT gate).
A B C Output
0 0 1 00 1 0 11 0 0 11 1 0 1
Finally we see that this combination of gates does the same job as an OR gate.
Each logic gate is manufactured from two or more transistors. Other circuits can be madeusing logic gates, as we shall see in the next section. We shall show you how to count andstore numbers using logic gates. This means that if you have enough transistors, and youconnect them correctly to make the right logic gates, you can make circuits which count andstore numbers.
In practice, the cheapest gate to manufacture is usually the NAND gate. Additionally, CharlesPeirce showed that NAND gates alone (as well as NOR gates alone) can be used to reproduceall the other logic gates.
Exercise: The Principles of Digital Electronics
1. Why is digital electronics important to modern technology and informationprocessing?
2. What two symbols are used in digital electronics, to represent a “high” and a“low”? What is this system known as?
3. What is a logic gate?
4. What are the five main types of logic gates? Draw the symbol for each logicgate.
5. Write out the truth tables for each of the five logic gates.
6. Write out the truth table for the following circuit. Which single gate is thiscircuit equivalent to?
7. Write out the truth table for the following circuit. Which single gate is thiscircuit equivalent to?
615
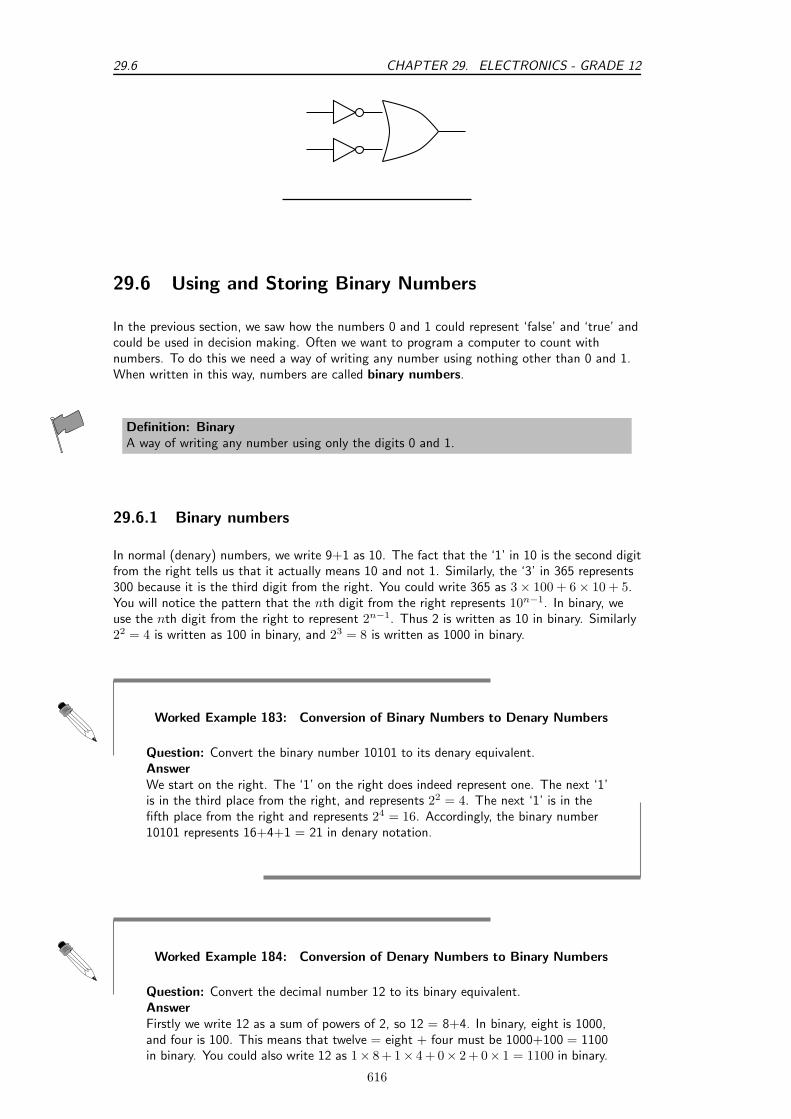
29.6 CHAPTER 29. ELECTRONICS - GRADE 12
29.6 Using and Storing Binary Numbers
In the previous section, we saw how the numbers 0 and 1 could represent ‘false’ and ‘true’ andcould be used in decision making. Often we want to program a computer to count withnumbers. To do this we need a way of writing any number using nothing other than 0 and 1.When written in this way, numbers are called binary numbers.
Definition: BinaryA way of writing any number using only the digits 0 and 1.
29.6.1 Binary numbers
In normal (denary) numbers, we write 9+1 as 10. The fact that the ‘1’ in 10 is the second digitfrom the right tells us that it actually means 10 and not 1. Similarly, the ‘3’ in 365 represents300 because it is the third digit from the right. You could write 365 as 3 × 100 + 6 × 10 + 5.You will notice the pattern that the nth digit from the right represents 10n−1. In binary, weuse the nth digit from the right to represent 2n−1. Thus 2 is written as 10 in binary. Similarly22 = 4 is written as 100 in binary, and 23 = 8 is written as 1000 in binary.
Worked Example 183: Conversion of Binary Numbers to Denary Numbers
Question: Convert the binary number 10101 to its denary equivalent.AnswerWe start on the right. The ‘1’ on the right does indeed represent one. The next ‘1’is in the third place from the right, and represents 22 = 4. The next ‘1’ is in thefifth place from the right and represents 24 = 16. Accordingly, the binary number10101 represents 16+4+1 = 21 in denary notation.
Worked Example 184: Conversion of Denary Numbers to Binary Numbers
Question: Convert the decimal number 12 to its binary equivalent.AnswerFirstly we write 12 as a sum of powers of 2, so 12 = 8+4. In binary, eight is 1000,and four is 100. This means that twelve = eight + four must be 1000+100 = 1100in binary. You could also write 12 as 1× 8 + 1× 4 + 0× 2 + 0× 1 = 1100 in binary.
616
CHAPTER 29. ELECTRONICS - GRADE 12 29.6
Interesting
Fact
teresting
FactHow do you write numbers as a sum of powers of two? The first power of two(the largest) is the largest power of two which is not larger than the numberyou are working with. In our last example, where we wanted to know whattwelve was in binary, the largest power of two which is not larger than 12 is 8.Thus 12 = 8 + something. By arithmetic, the ‘something’ must be 4, and thelargest power of two not larger than this is 4 exactly. Thus 12 = 8 + 4, and wehave finished.
A more complicated example would be to write one hundred in binary. Thelargest power of two not larger than 100 is 64 (1000000 in binary). Subtracting64 from 100 leaves 36. The largest power of two not larger than 36 is 32(100000 in binary). Removing this leaves a remainder of 4, which is a power oftwo itself (100 in binary). Thus one hundred is 64 + 32 + 4, or in binary1000000 + 100000 + 100 = 1100100.
Once a number is written in binary, it can be represented using the low and high voltage levelsof digital electronics. We demonstrate how this is done by showing you how an electroniccounter works.
29.6.2 Counting circuits
To make a counter you need several ‘T flip flops’, sometimes called ‘divide by two’ circuits. AT flip flop is a digital circuit which swaps its output (from 0 to 1 or from 1 to 0) whenever theinput changes from 1 to 0. When the input changes from 0 to 1 it doesn’t change its output.It is called a flip flop because it changes (flips or flops) each time it receives a pulse.
If you put a series of pulses 10101010 into a T flip flop, the result is 01100110. Figure 29.18makes this clearer.
As you can see from Figure 29.18, there are half as many pulses in the output. This is why it iscalled a ‘divide by two’ circuit.
If we connect T flip flops in a chain, then we make a counter which can count pulses. As anexample, we connect three T flip flops in a chain. This is shown in Figure 29.19.
When this circuit is fed with a stream of pulses, the outputs of the different stages change.The table below shows how this happens. Each row shows a different stage, with the first stageat the top. We assume that all of the flip flops have 0 as their output to start with.
617
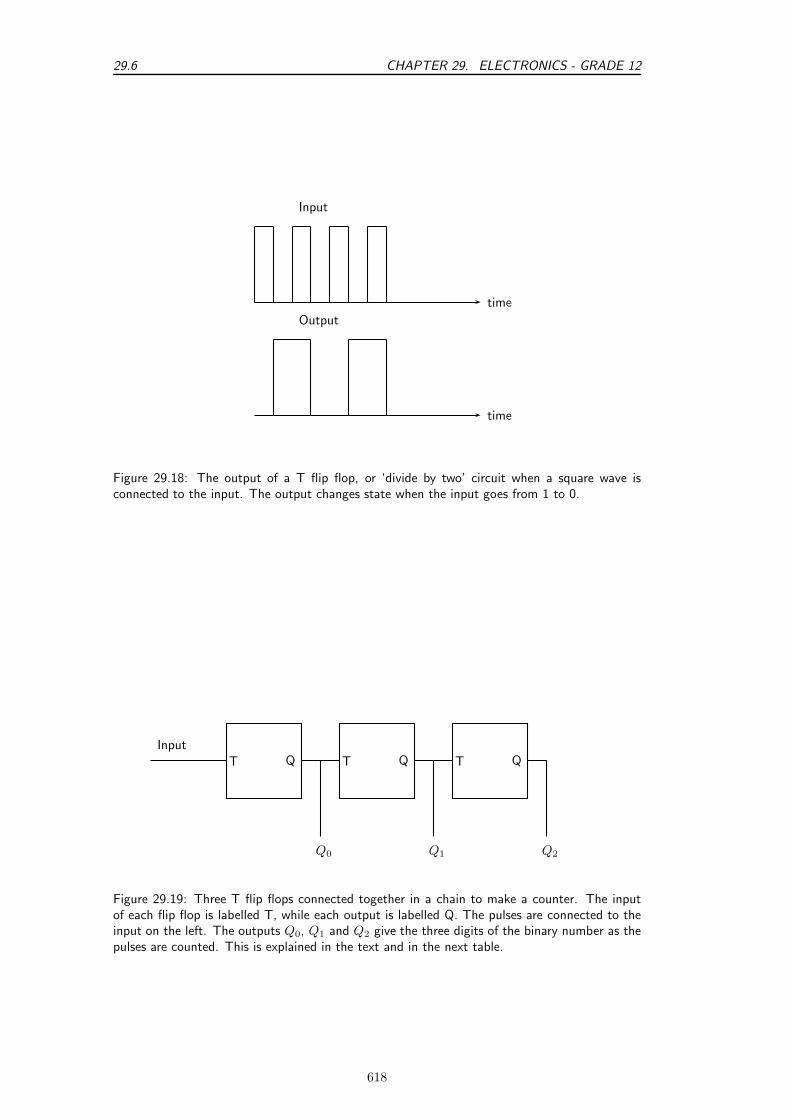
29.6 CHAPTER 29. ELECTRONICS - GRADE 12
time
Output
time
Input
Figure 29.18: The output of a T flip flop, or ‘divide by two’ circuit when a square wave isconnected to the input. The output changes state when the input goes from 1 to 0.
T QInput
T Q
Q0
T Q
Q1 Q2
Figure 29.19: Three T flip flops connected together in a chain to make a counter. The inputof each flip flop is labelled T, while each output is labelled Q. The pulses are connected to theinput on the left. The outputs Q0, Q1 and Q2 give the three digits of the binary number as thepulses are counted. This is explained in the text and in the next table.
618

CHAPTER 29. ELECTRONICS - GRADE 12 29.6
Input Output 1 Output 2 Output 3 Number of pulse Number in binary1 0 0 0 0 0000 1 0 0 1 0011 1 0 0 1 0010 0 1 0 2 0101 0 1 0 2 0100 1 1 0 3 0111 1 1 0 3 0110 0 0 1 4 1001 0 0 1 4 1000 1 0 1 5 1011 1 0 1 5 1010 0 1 1 6 1101 0 1 1 6 1100 1 1 1 7 1111 1 1 1 7 1110 0 0 0 8 10001 0 0 0 8 10000 1 0 0 9 11011 1 0 0 9 1101
The binary numbers in the right hand column count the pulses arriving at the input. You willnotice that the output of the first flip flop gives the right most digit of the pulse count (inbinary). The output of the second flip flop gives the second digit from the right (the ‘twos’digit) of the pulse count. The output of the third flip flop gives the third digit from the right(the ‘fours’ digit) of the pulse count. As there are only three flip flops, there is nothing toprovide the next digit (the ‘eights’ digit), and so the eighth pulse is recorded as 000, not 1000.
This device is called a modulo 8 counter because it can count in eight stages from 000 to 111before it goes back to 000. If you put four flip flops in the counter, it will count in sixteenstages from 0000 to 1111, and it is called a modulo 16 counter because it counts in sixteenstages before going back to 0000.
Definition: ModuloThe modulo of a counter tells you how many stages (or pulses) it receives before going backto 0 as its output. Thus a modulo 8 counter counts in eight stages 000, 001, 010, 011,100, 101, 110, 111, then returns to 000 again.
Interesting
Fact
teresting
FactIf a counter contains n flip flops, it will be a modulo 2n counter. It will countfrom 0 to 2n − 1.
29.6.3 Storing binary numbers
Counting is important. However, it is equally important to be able to remember the numbers.Computers can convert almost anything to a string of 0s and 1s, and therefore to a binarynumber. Unless this number can be stored in the computer’s memory, the computer would beuseless.
The memory in the computer contains many parts. Each part is able to store a single 0 or 1.Since 0 and 1 are the two binary digits, we say that each part of the memory stores one bit.
619
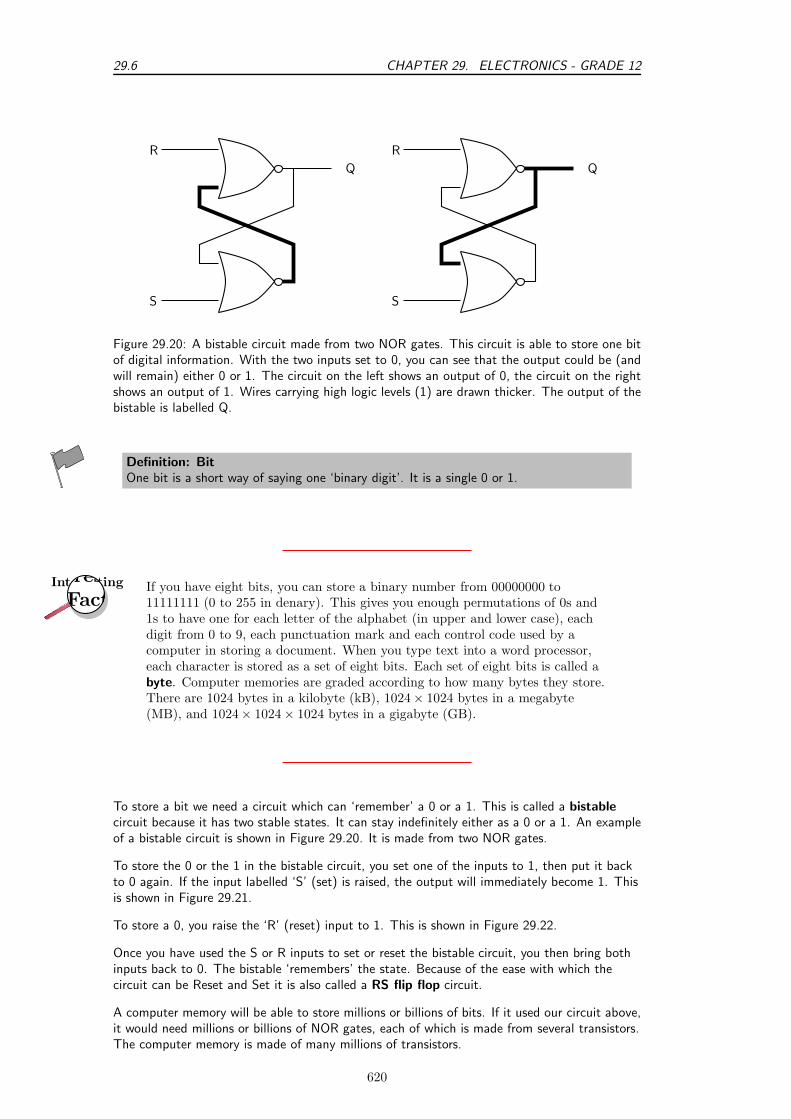
29.6 CHAPTER 29. ELECTRONICS - GRADE 12
R
Q
S
R
Q
S
Figure 29.20: A bistable circuit made from two NOR gates. This circuit is able to store one bitof digital information. With the two inputs set to 0, you can see that the output could be (andwill remain) either 0 or 1. The circuit on the left shows an output of 0, the circuit on the rightshows an output of 1. Wires carrying high logic levels (1) are drawn thicker. The output of thebistable is labelled Q.
Definition: BitOne bit is a short way of saying one ‘binary digit’. It is a single 0 or 1.
Interesting
Fact
teresting
FactIf you have eight bits, you can store a binary number from 00000000 to11111111 (0 to 255 in denary). This gives you enough permutations of 0s and1s to have one for each letter of the alphabet (in upper and lower case), eachdigit from 0 to 9, each punctuation mark and each control code used by acomputer in storing a document. When you type text into a word processor,each character is stored as a set of eight bits. Each set of eight bits is called abyte. Computer memories are graded according to how many bytes they store.There are 1024 bytes in a kilobyte (kB), 1024× 1024 bytes in a megabyte(MB), and 1024× 1024 × 1024 bytes in a gigabyte (GB).
To store a bit we need a circuit which can ‘remember’ a 0 or a 1. This is called a bistablecircuit because it has two stable states. It can stay indefinitely either as a 0 or a 1. An exampleof a bistable circuit is shown in Figure 29.20. It is made from two NOR gates.
To store the 0 or the 1 in the bistable circuit, you set one of the inputs to 1, then put it backto 0 again. If the input labelled ‘S’ (set) is raised, the output will immediately become 1. Thisis shown in Figure 29.21.
To store a 0, you raise the ‘R’ (reset) input to 1. This is shown in Figure 29.22.
Once you have used the S or R inputs to set or reset the bistable circuit, you then bring bothinputs back to 0. The bistable ‘remembers’ the state. Because of the ease with which thecircuit can be Reset and Set it is also called a RS flip flop circuit.
A computer memory will be able to store millions or billions of bits. If it used our circuit above,it would need millions or billions of NOR gates, each of which is made from several transistors.The computer memory is made of many millions of transistors.
620
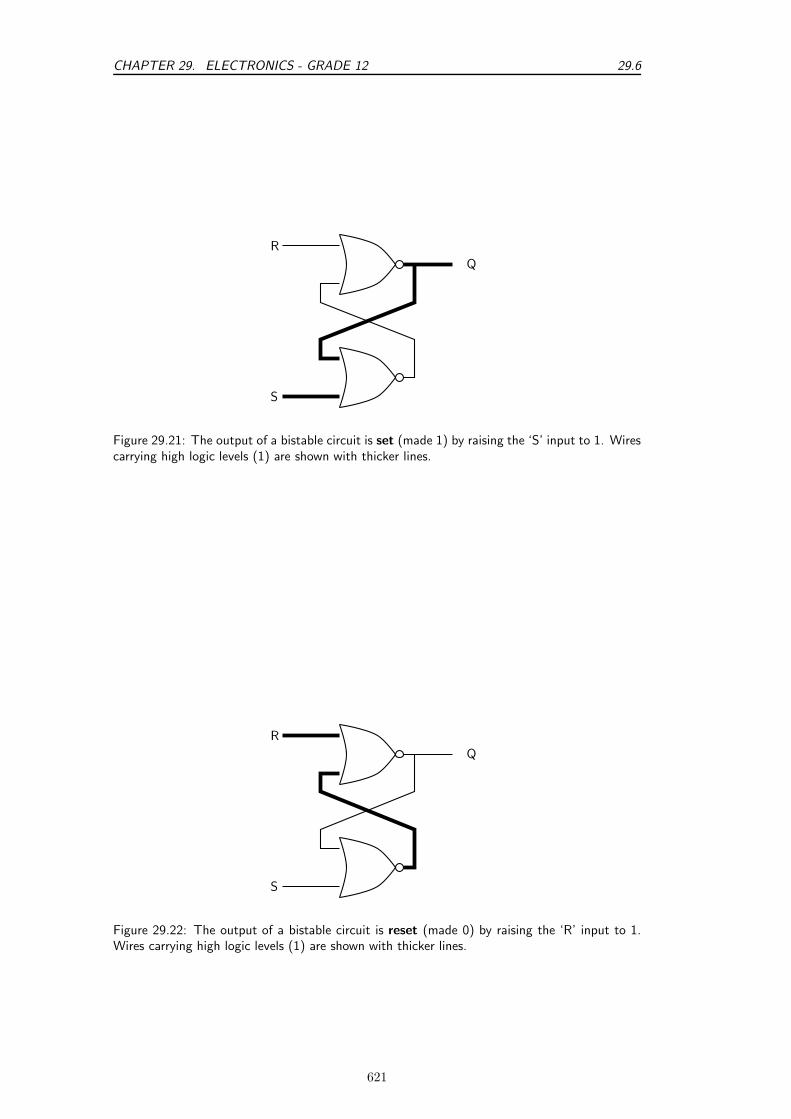
CHAPTER 29. ELECTRONICS - GRADE 12 29.6
R
Q
S
Figure 29.21: The output of a bistable circuit is set (made 1) by raising the ‘S’ input to 1. Wirescarrying high logic levels (1) are shown with thicker lines.
R
Q
S
Figure 29.22: The output of a bistable circuit is reset (made 0) by raising the ‘R’ input to 1.Wires carrying high logic levels (1) are shown with thicker lines.
621

29.6 CHAPTER 29. ELECTRONICS - GRADE 12
Interesting
Fact
teresting
FactThe bistable circuits drawn here don’t remember 0s or 1s for ever — they losethe information if the power is turned off. The same is true for the RAM(Random Access Memory) used to store working and temporary data in acomputer. Some modern circuits contain special memory which can rememberits state even if the power is turned off. This is used in FLASH drives,commonly found in USB data sticks and on the memory cards used with digitalcameras. These bistable circuits are much more complex.
You can also make T flip flops out of logic gates, however these are more complicated to design.
Exercise: Counting Circuits
1. What is the term bit short for?
2. What is 43 in binary?
3. What is 1100101 in denary?
4. What is the highest number a modulo 64 counter can count to? How many Tflip flops does it contain?
5. What is the difference between an RS flip flop and a T flip flop?
6. Draw a circuit diagram for a bistable circuit (RS flip flop). Make three extracopies of your diagram. On the first diagram, colour in the wires which willcarry high voltage levels (digital 1) if the R input is low, and the S input ishigh. On the second diagram, colour in the wires which carry high voltagelevels if the S input of the first circuit is now made low. On the thirddiagram, colour in the wires which carry high voltage levels if the R input isnow made high. On the final diagram, colour in the wires carrying highvoltage levels if the R input is now made low again.
7. Justify the statement: a modern computer contains millions of transistors.
Exercise: End of Chapter Exercises
1. Calculate the reactance of a 3 mH inductor at a frequency of 50 Hz.
2. Calculate the reactance of a 30 µF capacitor at a frequency of 1 kHz.
3. Calculate the impedance of a series circuit containing a 5 mH inductor, a 400µF capacitor and a 2 kΩ resistor at a frequency of 50 kHz.
4. Calculate the frequency at which the impedance of the circuit in the lastquestion will be the smallest.
5. Which component can be used to block low frequencies?
6. Draw a circuit diagram with a battery, diode and resistor in series. Make surethat the diode is forward biased so that a current will flow through it.
622
CHAPTER 29. ELECTRONICS - GRADE 12 29.6
7. When building a complex electronic circuit which is going to be powered by abattery, it is always a good idea to put a diode in series with the battery.Explain how this will protect the circuit if the user puts the battery in thewrong way round.
8. Summarize the differences betwen a bipolar and field effect transistor.
9. What does an operational amplifier (op-amp) do?
10. What is the difference between a digital signal and an analogue signal?
11. What are the advantages of digital signals over analogue signals?
12. Draw the symbols for the five logic gates, and write down their truth tables.
13. Draw a circuit diagram with an AND gate. Each input should be connectedto the output of a separate NOT gate. By writing truth tables show that thiswhole circuit behaves as a NOR gate.
14. Convert the denary number 99 into binary.
15. Convert the binary number 11100111 into denary.
16. Explain how three T flip flops can be connected together to make a modulo 8counter. What is the highest number it can count up to?
17. Draw the circuit diagram for an RS flip flop (bistable) using two NOR gates.
18. Show how the circuit you have just drawn can have a stable output of 0 or 1when both inputs are 0.
19. Operational (and other) amplifiers, logic gates, and flip flops all containtransistors, and would not work without them. Write a short newspaperarticle for an intelligent reader who knows nothing about electronics. Explainhow important transistors are in modern society.
623

29.6 CHAPTER 29. ELECTRONICS - GRADE 12
624
Chapter 30
Electromagnetic Radiation
30.1 Introduction
This chapter will focus on the electromagnetic (EM) radiation. Electromagnetic radiation is aself-propagating wave in space with electric and magnetic components. These componentsoscillate at right angles to each other and to the direction of propagation, and are in phasewith each other. Electromagnetic radiation is classified into types according to the frequency ofthe wave: these types include, in order of increasing frequency, radio waves, microwaves,infrared radiation, visible light, ultraviolet radiation, X-rays and gamma rays.
30.2 Particle/wave nature of electromagnetic radiation
If you watch a colony of ants walking up the wall, they look like a thin continuous black line.But as you look closer, you see that the line is made up of thousands of separated black ants.
Light and all other types of electromagnetic radiation seems like a continuous wave at first, butwhen one performs experiments on the light, one can notice that the light can have both waveand particle like properties. Just like the individual ants, the light can also be made up ofindividual bundles of energy, or quanta of light.
Light has both wave-like and particle-like properties (wave–particle duality), but only shows oneor the other, depending on the kind of experiment we perform. A wave-type experiment showsthe wave nature, and a particle-type experiment shows particle nature. One cannot test thewave and the particle nature at the same time. A particle of light is called a photon.
Definition: PhotonA photon is a quantum (energy packet) of light.
The particle nature of light can be demonstrated by the interaction of photons with matter.One way in which light interacts with matter is via the photoelectric effect, which will bestudied in detail in Chapter 31.
Exercise: Particle/wave nature of electromagnetic radiation
1. Give examples of the behaviour of EM radiation which can best be explainedusing a wave model.
625
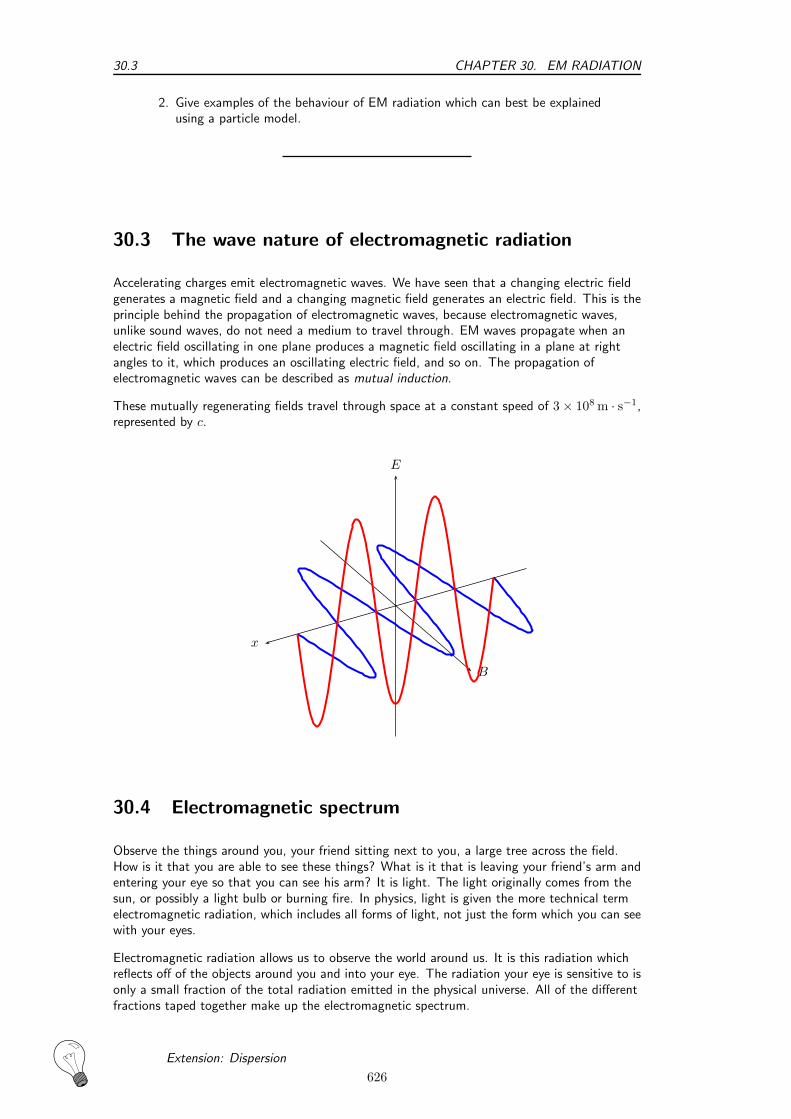
30.3 CHAPTER 30. EM RADIATION
2. Give examples of the behaviour of EM radiation which can best be explainedusing a particle model.
30.3 The wave nature of electromagnetic radiation
Accelerating charges emit electromagnetic waves. We have seen that a changing electric fieldgenerates a magnetic field and a changing magnetic field generates an electric field. This is theprinciple behind the propagation of electromagnetic waves, because electromagnetic waves,unlike sound waves, do not need a medium to travel through. EM waves propagate when anelectric field oscillating in one plane produces a magnetic field oscillating in a plane at rightangles to it, which produces an oscillating electric field, and so on. The propagation ofelectromagnetic waves can be described as mutual induction.
These mutually regenerating fields travel through space at a constant speed of 3 × 10⁸ m · s−1,represented by c.
x
B
E
30.4 Electromagnetic spectrum
Observe the things around you, your friend sitting next to you, a large tree across the field.How is it that you are able to see these things? What is it that is leaving your friend’s arm andentering your eye so that you can see his arm? It is light. The light originally comes from thesun, or possibly a light bulb or burning fire. In physics, light is given the more technical termelectromagnetic radiation, which includes all forms of light, not just the form which you can seewith your eyes.
Electromagnetic radiation allows us to observe the world around us. It is this radiation whichreflects off of the objects around you and into your eye. The radiation your eye is sensitive to isonly a small fraction of the total radiation emitted in the physical universe. All of the differentfractions taped together make up the electromagnetic spectrum.
Extension: Dispersion
626
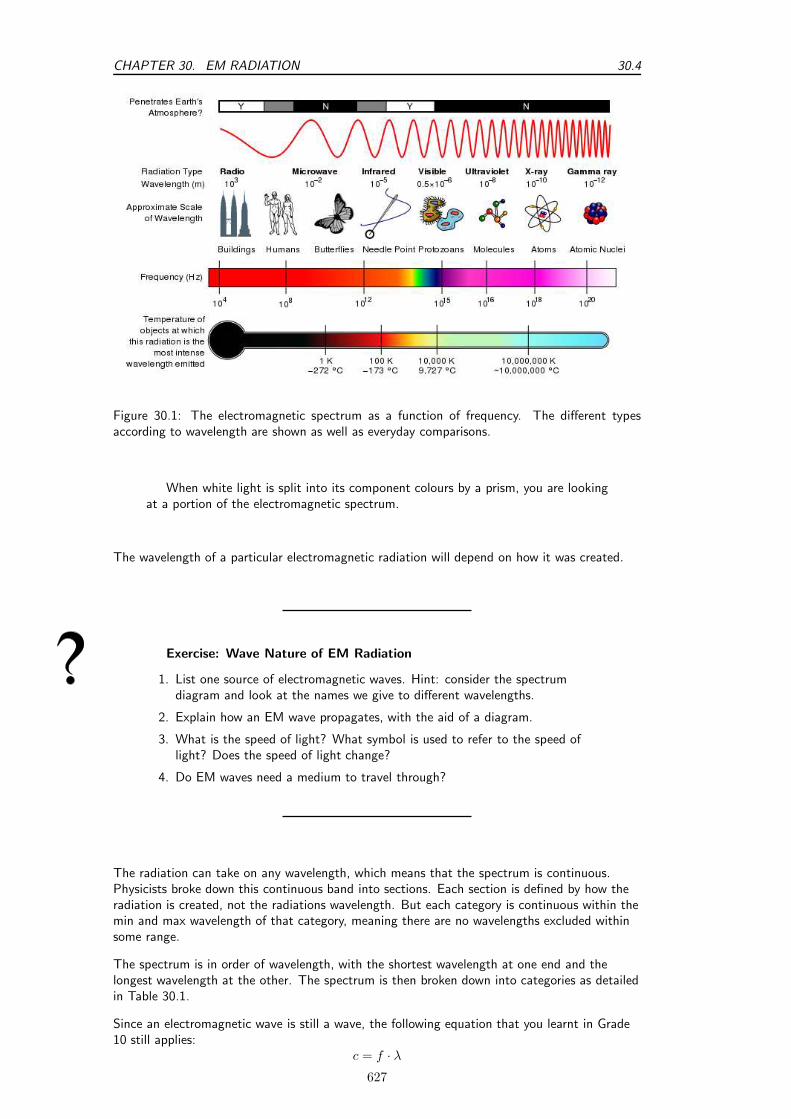
CHAPTER 30. EM RADIATION 30.4
Figure 30.1: The electromagnetic spectrum as a function of frequency. The different typesaccording to wavelength are shown as well as everyday comparisons.
When white light is split into its component colours by a prism, you are lookingat a portion of the electromagnetic spectrum.
The wavelength of a particular electromagnetic radiation will depend on how it was created.
Exercise: Wave Nature of EM Radiation
1. List one source of electromagnetic waves. Hint: consider the spectrumdiagram and look at the names we give to different wavelengths.
2. Explain how an EM wave propagates, with the aid of a diagram.
3. What is the speed of light? What symbol is used to refer to the speed oflight? Does the speed of light change?
4. Do EM waves need a medium to travel through?
The radiation can take on any wavelength, which means that the spectrum is continuous.Physicists broke down this continuous band into sections. Each section is defined by how theradiation is created, not the radiations wavelength. But each category is continuous within themin and max wavelength of that category, meaning there are no wavelengths excluded withinsome range.
The spectrum is in order of wavelength, with the shortest wavelength at one end and thelongest wavelength at the other. The spectrum is then broken down into categories as detailedin Table 30.1.
Since an electromagnetic wave is still a wave, the following equation that you learnt in Grade10 still applies:
c = f · λ627

30.4 CHAPTER 30. EM RADIATION
Table 30.1: Electromagnetic spectrumCategory Range of Wavelengths (nm) Range of Frequencies (Hz)
gamma rays <1 > 3 × 10¹⁹
X-rays 1-10 3 × 10¹⁷-3 × 10¹⁹
ultraviolet light 10-400 7,5 × 10¹⁴-3 × 10¹⁷
visible light 400-700 4,3 × 10¹⁴-7,5 × 10¹⁴
infrared 700-105 3 × 10¹²-4,3 × 10¹⁹
microwave 105 − 108 3 × 10⁹-3 × 10¹²
radio waves > 108 < 3 × 10⁹
Worked Example 185: EM spectrum I
Question: Calculate the frequency of red light with a wavelength of 4,2 × 10⁻⁷ mAnswerWe use the formula: c = fλ to calculate frequency. The speed of light is aconstant 3 × 10⁸m/s.
c = fλ
3 × 108 = f × 4,2 × 10⁻⁷
f = 7,14 × 10¹⁴Hz
Worked Example 186: EM spectrum II
Question: Ultraviolet radiation has a wavelength of 200 nm. What is thefrequency of the radiation?AnswerStep 1 : To calculate the frequency we need to identify the wavelength andthe velocity of the radiation.Recall that all radiation travels at the speed of light (c) in vacuum. Since thequestion does not specify through what type of material the Ultraviolet radiation istraveling, one can assume that it is traveling through a vacuum. We can identifytwo properties of the radiation - wavelength (200 nm) and speed (c). Fromprevious chapters, we know that the period of the wave is the time it takes for awave to complete one cycle or one wavelength.Step 2 : Since we know the wavelength and we know the speed, lets firstcalculate the Period (T).
T =distance
speed
=λ
cdistance = 200 nm
= 200 × 10−9 m
speed = 3.0 × 10⁸ m · s−1
T =200× 10−9 m
3.0 × 10⁸ m · s−1
= 6.67 × 10⁻¹⁶ s
628

CHAPTER 30. EM RADIATION 30.5
Step 3 : From the Period (T), we can calculate the frequency (f).
f =1
T
=1
6.67 × 10⁻¹⁶ s
= 1.5 × 10¹⁵ Hz
Examples of some uses of electromagnetic waves are shown in Table 30.2.
Table 30.2: Uses of EM wavesCategory Uses
gamma rays used to kill the bacteria in marsh-mallows
X-rays used to image bone structuresultraviolet light bees can see into the ultraviolet
because flowers stand out moreclearly at this frequency
visible light used by humans to observe theworld
infrared night vision, heat sensors, lasermetal cutting
microwave microwave ovens, radarradio waves radio, television broadcasts
In theory the spectrum is infinite, although realistically we can only observe wavelengths from afew hundred kilometers to those of gamma rays due to experimental limitations.
Humans experience electromagnetic waves differently depending on their wavelength. Our eyesare sensitive to visible light while our skin is sensitive to infrared, and many wavelengths we donot detect at all.
Exercise: EM Radiation
1. Arrange the following types of EM radiation in order of increasing frequency:infrared, X-rays, ultraviolet, visible, gamma.
2. Calculate the frequency of an EM wave with a wavelength of 400 nm.
3. Give an example of the use of each type of EM radiation, i.e. gamma rays,X-rays, ultraviolet light, visible light, infrared, microwave and radio and TVwaves.
30.5 The particle nature of electromagnetic radiation
When we talk of electromagnetic radiation as a particle, we refer to photons, which are packetsof energy. The energy of the photon is related to the wavelength of electromagnetic radiationaccording to: h is called Planck’s constant.
629
30.5 CHAPTER 30. EM RADIATION
Definition: Planck’s constantPlanck’s constant is a physical constant named after Max Planck.
h = 6,626 × 10−34 J · s
The energy of a photon can be calculated using the formula: E = hf or E = h cλ. Where E is
the energy of the photon in joules (J), h is planck’s constant, c is the speed of light, f is thefrequency in hertz (Hz) and λ is the wavelength in metres (m).
Worked Example 187: Calculating the energy of a photon I
Question: Calculate the energy of a photon with a frequency of 3 × 10¹⁸ HzAnswerWe use the formula: E = hf
E = hf
= 6,6 × 10−34 × 3 × 1018
= 2 × 10⁻¹⁵ J
Worked Example 188: Calculating the energy of a photon II
Question: What is the energy of an ultraviolet photon with a wavelength of200 nm?AnswerStep 1 : Determine what is required and how to approach the problem.We are required to calculate the energy associated with a photon of ultravioletlight with a wavelength of 200 nm.We can use:
E = hc
λ
Step 2 : Solve the problem
E = hc
λ
= (6,626 × 10−34)3 × 10⁸
200 × 10−9
= 9,939 × 10−10 J
30.5.1 Exercise - particle nature of EM waves
1. How is the energy of a photon related to its frequency and wavelength?
2. Calculate the energy of a photon of EM radiation with a frequency of 1012 Hz.
3. Determine the energy of a photon of EM radiation with a wavelength of 600 nm.
630
CHAPTER 30. EM RADIATION 30.6
30.6 Penetrating ability of electromagnetic radiation
Different kinds of electromagnetic radiation have different penetrabilities. For example, if wetake the human body as the object. Infrared light is emitted by the human body. Visible lightis reflected off the surface of the human body, ultra-violet light (from sunlight) damages theskin, but X-rays are able to penetrate the skin and bone and allows for pictures of the inside ofthe human body to be taken.
If we compare the energy of visible light to the energy of X-rays, we find that X-rays have amuch higher energy. Usually, kinds of electromagnetic radiation with higher energy have higherpenetrabilities than those with low energies.
Certain kinds of electromagnetic radiation such as ultra-violet radiation, X-rays and gammarays are very dangerous. Radiation such as these are called ionising radiation. Ionising radiationloses energy as it passes through matter, breaking molecular bonds and creating ions.
Excessive exposure to radiation, including sunlight, X-rays and all nuclear radiations, can causedestruction of biological tissue.
30.6.1 Ultraviolet(UV) radiation and the skin
UVA and UVB are different ranges of frequencies for ultraviolet (UV) light. UVA and UVB candamage collagen fibres which results in the speeding up skin aging. In general, UVA is the leastharmful, but it can contribute to the aging of skin, DNA damage and possibly skin cancer. Itpenetrates deeply and does not cause sunburn. Because it does not cause reddening of the skin(erythema) it cannot be measured in the SPF testing. There is no good clinical measurementof the blocking of UVA radiation, but it is important that sunscreen block both UVA and UVB.
UVB light can cause skin cancer. The radiation excites DNA molecules in skin cells, resultingin possible mutations, which can cause cancer. This cancer connection is one reason forconcern about ozone depletion and the ozone hole.
As a defense against UV radiation, the body tans when exposed to moderate (depending onskin type) levels of radiation by releasing the brown pigment melanin. This helps to block UVpenetration and prevent damage to the vulnerable skin tissues deeper down. Suntan lotion,often referred to as sunblock or sunscreen, partly blocks UV and is widely available. Most ofthese products contain an SPF rating that describes the amount of protection given. Thisprotection, however, applies only to UVB rays responsible for sunburn and not to UVA raysthat penetrate more deeply into the skin and may also be responsible for causing cancer andwrinkles. Some sunscreen lotion now includes compounds such as titanium dioxide which helpsprotect against UVA rays. Other UVA blocking compounds found in sunscreen include zincoxide and avobenzone.
Extension: What makes a good sunscreen?
• UVB protection: Padimate O, Homosalate, Octisalate (octyl salicylate),Octinoxate (octyl methoxycinnamate)
• UVA protection: Avobenzone
• UVA/UVB protection: Octocrylene, titanium dioxide, zinc oxide, Mexoryl(ecamsule)
Another means to block UV is by wearing sun protective clothing. This isclothing that has a UPF rating that describes the protection given against bothUVA and UVB.
631
30.6 CHAPTER 30. EM RADIATION
30.6.2 Ultraviolet radiation and the eyes
High intensities of UVB light are hazardous to the eyes, and exposure can cause welder’s flash(photo keratitis or arc eye) and may lead to cataracts, pterygium and pinguecula formation.
Protective eyewear is beneficial to those who are working with or those who might be exposedto ultraviolet radiation, particularly short wave UV. Given that light may reach the eye from thesides, full coverage eye protection is usually warranted if there is an increased risk of exposure,as in high altitude mountaineering. Mountaineers are exposed to higher than ordinary levels ofUV radiation, both because there is less atmospheric filtering and because of reflection fromsnow and ice.
Ordinary, untreated eyeglasses give some protection. Most plastic lenses give more protectionthan glass lenses. Some plastic lens materials, such as polycarbonate, block most UV. Thereare protective treatments available for eyeglass lenses that need it which will give betterprotection. But even a treatment that completely blocks UV will not protect the eye from lightthat arrives around the lens. To convince yourself of the potential dangers of stray UV light,cover your lenses with something opaque, like aluminum foil, stand next to a bright light, andconsider how much light you see, despite the complete blockage of the lenses. Most contactlenses help to protect the retina by absorbing UV radiation.
30.6.3 X-rays
While x-rays are used significantly in medicine, prolonged exposure to X-rays can lead to celldamage and cancer.
For example, a mammogram is an x-ray of the human breast to detect breast cancer, but if awoman starts having regular mammograms when she is too young, her chances of gettingbreast cancer increases.
30.6.4 Gamma-rays
Due to the high energy of gamma-rays, they are able to cause serious damage when absorbedby living cells.
Gamma-rays are not stopped by the skin and can induce DNA alteration by interfering with thegenetic material of the cell. DNA double-strand breaks are generally accepted to be the mostbiologically significant lesion by which ionising radiation causes cancer and hereditary disease.
A study done on Russian nuclear workers exposed to external whole-body gamma-radiation athigh cumulative doses shows a link between radiation exposure and death from leukaemia,lung, liver, skeletal and other solid cancers.
Extension: Cellphones and electromagnetic radiationCellphone radiation and health concerns have been raised, especially following
the enormous increase in the use of wireless mobile telephony throughout theworld. This is because mobile phones use electromagnetic waves in the microwaverange. These concerns have induced a large body of research. Concerns abouteffects on health have also been raised regarding other digital wireless systems,such as data communication networks.
The World Health Organization has officially ruled out adverse health effectsfrom cellular base stations and wireless data networks, and expects to makerecommendations about mobile phones in 2007-08.
Cellphone users are recommended to minimise radiation, by for example:
1. Use hands-free to decrease the radiation to the head.
2. Keep the mobile phone away from the body.
3. Do not telephone in a car without an external antenna.
632
CHAPTER 30. EM RADIATION 30.7
30.6.5 Exercise - Penetrating ability of EM radiation
1. Indicate the penetrating ability of the different kinds of EM radiation and relate it toenergy of the radiation.
2. Describe the dangers of gamma rays, X-rays and the damaging effect of ultra-violetradiation on skin
30.7 Summary
1. Electromagnetic radiation has both a wave and particle nature.
2. Electromagnetic waves travel at a speed of 3 × 10⁸ m · s−1 in a vaccum.
3. The Electromagnetic consists of the follwing types of radiation: radio waves, microwaves,infrared, visible, ultraviolet, X-rays, gamma-rays.
4. Gamma-rays have the most energy and are the most penetrating, while radio waves havethe lowest energy and are the least penetrating.
30.8 End of chapter exercise
1. What is the energy of a photon of EM radiation with a frequency of 3 × 10⁸ Hz?
2. What is the energy of a photon of light with a wavelength of 660 nm?
3. List the main types of electromagnetic radiation in order of increasing wavelength.
4. List the main uses of:
A radio waves
B infrared
C gamma rays
D X-rays
5. Explain why we need to protect ourselves from ultraviolet radiation from the Sun.
6. List some advantages and disadvantages of using X-rays.
7. What precautions should we take when using cell phones?
8. Write a short essay on a type of electromagnetic waves. You should look at uses,advantages and disadvantages of your chosen radiation.
9. Explain why some types of electromagnetic radiation are more penetrating than others.
633

30.8 CHAPTER 30. EM RADIATION
634
Chapter 31
Optical Phenomena andProperties of Matter - Grade 12
31.1 Introduction
For centuries physicists argued about whether light was a particle or a wave. It was assumedthat light could only be one or the other, but not both.
In earlier chapters on waves (Chapters 6, 24, 25, 26) and optics (Chapters 7 and 13), youstudied how light or other electromagnetic radiation propagates like a wave. The wave natureof light of was demonstrated by the propagation of light in examples such as diffraction,interference, and polarisation of light.
You also saw in Chapter 30 on electromagnetic radiation how light sometimes behaves as aparticle. This chapter looks at evidence supporting the particle model of light. The idea thatlight can have both wave and particle properties was one of the most important discoveries ofthe twentieth century.
31.2 The transmission and scattering of light
31.2.1 Energy levels of an electron
We have seen that the electrons in an atom have different energy levels. When the electronreceives enough energy, it can jump up to a higher energy level. This is called ’exciting’ theelectron. When the electron in a high energy level sheds some energy, it drops to a lowerenergy level.
We have also seen that the energy associated with light at a specific wavelength is given by:
E =hc
λ.
In the particle model of light, this means that each packet of light (photon) at a wavelength λhas energy:
E =hc
λ.
For the electron to receive energy, it absorbs a photon and gets its energy. When an electronloses energy to drop to a lower level, it emits (gives off) a photon with that energy.
635
31.2CHAPTER 31. OPTICAL PHENOMENA AND PROPERTIES OF MATTER - GRADE 12
31.2.2 Interaction of light with metals
When light encounters or passes through a material, the photons of the light interact with theatoms or molecules of the material. Depending on the strength of the interactions and howoften they happen, the light will pass through the material or be scattered in some otherdirection.
Each wavelength of light relates to a particular energy, and the closer that energy is to theenergy difference between two of the levels of the atom, the likelier the photon is to interactwith the atom.
When visible or ultraviolet (UV) radiation shines on a metal, the photons are absorbed by theelectrons in the metal. The electrons are then excited up to a higher energy level. When anelectron returns to a lower energy level, another photon is emitted. This is how light isreflected off a metal surface.
In previous chapters, you have studied geometrical optics, which tells us what happens to raysof light when they are reflected off a surface or refracted through a lens. That tells us whathappens to light rays, made up of many photons, on a large scale. If you look at a smallerlevel, i.e. on a microscopic scale, then reflection and refraction happen by all the photonsinteracting with the atoms of the lens or mirror. The photons get absorbed and re-emittedmany times before emerging as the finals rays of light that we see.
Scattering of light is responsible for many effects in everyday life. We see that certain materialsare red or blue, for example, since they contain materials that have energy level differences thatcorrespond to the energies of the photons that make up red or blue light. These materials thenreflect the red or blue light and absorb the other wavelengths in the visible spectrum. Whiteobjects reflect photons of all wavelengths in the visual spectrum, while black objects absorbthese photons.
Interesting
Fact
teresting
FactBecause a truly black object absorbs all the visual wavelengths of light, anddoes not re-emit photons at visual wavelengths, we can say that ’black’ is not acolour itself, but rather a lack of colour! Also, since black objects absorb visuallight, they heat up more than objects of other colours which reflect light atcertain wavelengths.
Activity :: Investigation : Reflection and absorptionAim:Investigate the interaction of light with differently coloured metal objectsApparatus:Find some differently coloured metal objects (at least 5) which will not bedamaged if left in the sun for 15 minutes. Make sure to include at least one whiteitem and one black item.Method:At the start of your lesson set out your objects in direct sunlight. Leave them therefor around 15 minutes.
Alternatively, if it is a sunny day, you can use your teachers’ cars for thisexperiment - as long as there are some cars of different colours and they have beenstanding in direct sunlight for the same length of time!
After 15 minutes is up, touch each of the items/cars (be careful not to burnyourself!) and compare their temperatures (rate them from 1 to 5 with 1 beingcold and 5 being very hot) in a table such as the example table below:
636

CHAPTER 31. OPTICAL PHENOMENA AND PROPERTIES OF MATTER - GRADE 1231.2
Photon Transmission Photon Scattering
photonincoming outgoing
photon photonincoming outgoing
photon
Figure 31.1: Diagrams of photon transmission (left) and scattering (right).
Object Colour Temperature rating
e.g. car 1 e.g. red e.g. 3
Questions:
1. Which object was the hottest and what was it made of?
2. Which object was the coolest and what was it made of?
3. How did the temperatures of the black and white objects compare to eachother? (which one was hotter and which was cooler?)
4. Try to explain the reasons for the different temperatures of the objects withrespect to their colours and the materials of which they are made.
Metals generally reflect most wavelengths of visible light, but they will reflect the light in acertain direction, given by the laws of reflection in geometrical optics. This is different to mostmaterials, like wood or fabric, which reflect light in all directions. Metals have this propertysince they have electrons that are not bound to atoms and can move freely through the metal.This is unlike most other materials that have their electrons bound closely to the atoms. Thesefree electrons in metals can then absorb and reflect photons of a wide range of energies.
Ultraviolet light (which has shorter wavelengths than visible light) will pass through somesubstances, such as many plastics, because they do not have the right energy levels to absorb itand re-emit it. X-rays (also short wavelengths) will also pass through most materials, since theenergies of X-rays correspond to the energy levels of atomic nuclei. Such nuclei are muchsmaller than atoms, so it is much less likely for an X-ray to hit a nucleus instead of the wholeatom.
Most materials will absorb infrared radiation (longer wavelengths than visible light), since theenergies of that radiation often correspond to rotational or vibrational energy levels ofmolecules.
31.2.3 Why is the sky blue?
The sun emits light in many different wavelengths, including all of the visible wavelengths.Light which is made up of all the visible wavelengths appears white. So what causes the sky tolook blue?
The air is not just full of nitrogen and oxygen gases. It is also full of tiny dust grains. The lightfrom the sun scatters off these many dust grains.
The chance that the light will scatter off one of these dust grains is bigger for shorterwavelengths. The short wavelength blue light is therefore scattered much more than the othercolors. At noon, when the light from the sun is coming straight down (see the picture below),the scattered blue light reaches your eyes from all directions and so the sky appears blue. Theother wavelengths do not get scattered much and therefore miss your line of sight. At sunrise
637

31.3CHAPTER 31. OPTICAL PHENOMENA AND PROPERTIES OF MATTER - GRADE 12
or sunset, the direction of the light coming from the sun is now straight towards your eyes (seepicture below). Therefore the scattered blue light can’t be seen because it is scattered out ofyour line of sight. The redder colours (oranges and reds) can now be seen because they are notscattered as much and still fall in your line of sight.
At noon, sun is overheadsun emits radiationof all wavelengths
blue light scatteredby large angleinto the eye
red light scattered littleand misses the eye
At sunrise/sunset, sun is at horizonblue light scatteredby large angleaway from the eye
red light scatteredinto the eye
Exercise: Transmission and scattering of light
1. Explain how visible light is reflected from metals.
2. Explain why the sky is blue.
31.3 The photoelectric effect
Around the turn of the twentieth century, it was observed by a number of physicists (includingHertz, Thomson and Von Lenard) that when light was shone on a metal, electrons wereemitted by the metal. This is called the photoelectric effect. (photo- for light, electric- for theelectron.)
Definition: The photoelectric effectThe photoelectric effect is the process whereby an electron is emitted by a metal when lightshines on it.
At that time, light was thought to be purely a wave. Therefore, physicists thought that if amore intense (i.e. brighter) light was shone on a metal, then the electrons would be knockedout with greater kinetic energies than if a faint light was shone on them. However, Von Lenard
638
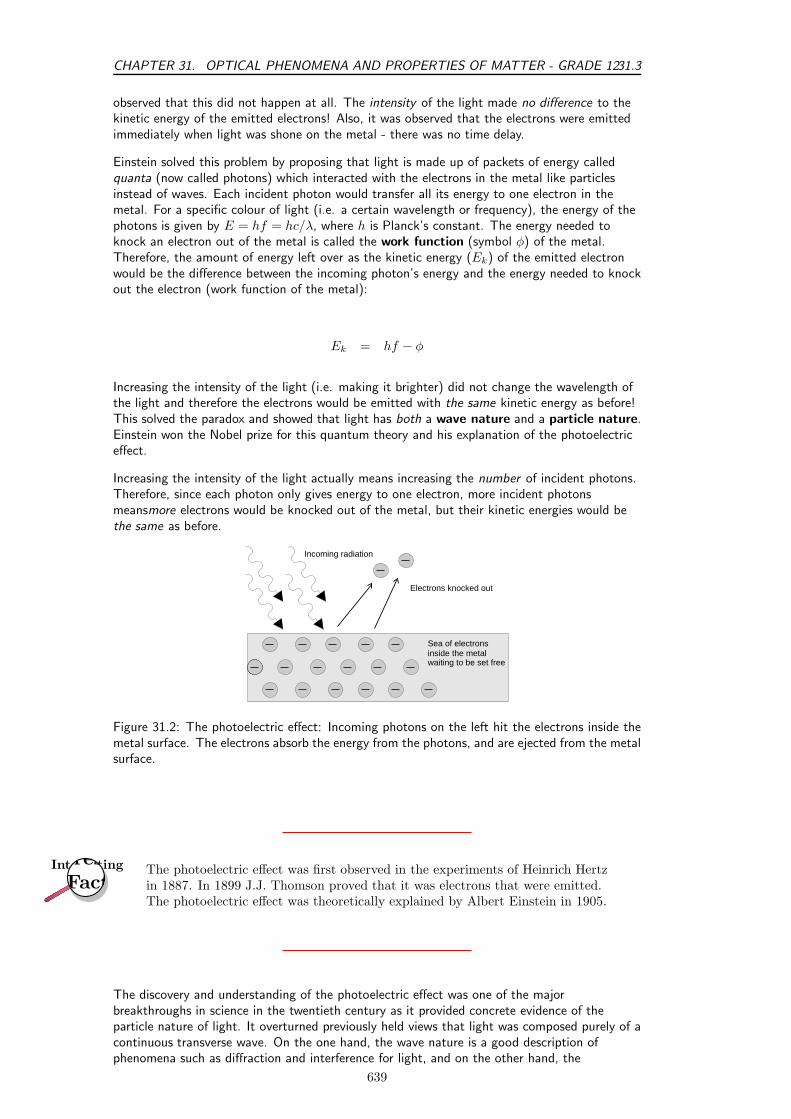
CHAPTER 31. OPTICAL PHENOMENA AND PROPERTIES OF MATTER - GRADE 1231.3
observed that this did not happen at all. The intensity of the light made no difference to thekinetic energy of the emitted electrons! Also, it was observed that the electrons were emittedimmediately when light was shone on the metal - there was no time delay.
Einstein solved this problem by proposing that light is made up of packets of energy calledquanta (now called photons) which interacted with the electrons in the metal like particlesinstead of waves. Each incident photon would transfer all its energy to one electron in themetal. For a specific colour of light (i.e. a certain wavelength or frequency), the energy of thephotons is given by E = hf = hc/λ, where h is Planck’s constant. The energy needed toknock an electron out of the metal is called the work function (symbol φ) of the metal.Therefore, the amount of energy left over as the kinetic energy (Ek) of the emitted electronwould be the difference between the incoming photon’s energy and the energy needed to knockout the electron (work function of the metal):
Ek = hf − φ
Increasing the intensity of the light (i.e. making it brighter) did not change the wavelength ofthe light and therefore the electrons would be emitted with the same kinetic energy as before!This solved the paradox and showed that light has both a wave nature and a particle nature.Einstein won the Nobel prize for this quantum theory and his explanation of the photoelectriceffect.
Increasing the intensity of the light actually means increasing the number of incident photons.Therefore, since each photon only gives energy to one electron, more incident photonsmeansmore electrons would be knocked out of the metal, but their kinetic energies would bethe same as before.
Incoming radiation
Sea of electronsinside the metal
Electrons knocked out
waiting to be set free
Figure 31.2: The photoelectric effect: Incoming photons on the left hit the electrons inside themetal surface. The electrons absorb the energy from the photons, and are ejected from the metalsurface.
Interesting
Fact
teresting
FactThe photoelectric effect was first observed in the experiments of Heinrich Hertzin 1887. In 1899 J.J. Thomson proved that it was electrons that were emitted.The photoelectric effect was theoretically explained by Albert Einstein in 1905.
The discovery and understanding of the photoelectric effect was one of the majorbreakthroughs in science in the twentieth century as it provided concrete evidence of theparticle nature of light. It overturned previously held views that light was composed purely of acontinuous transverse wave. On the one hand, the wave nature is a good description ofphenomena such as diffraction and interference for light, and on the other hand, the
639

31.3CHAPTER 31. OPTICAL PHENOMENA AND PROPERTIES OF MATTER - GRADE 12
photoelectric effect demonstrates the particle nature of light. This is now known as the‘dual-nature’ of light. (dual means two)
While solving problems we need to decide for ourselves whether we should consider the waveproperty or the particle property of light. For example, when dealing with interference anddiffraction, light should be treated as a wave, whereas when dealing with photoelectric effectwe consider the particle nature.
31.3.1 Applications of the photoelectric effect
We have learnt that a metal contains electrons that are free to move between the valence andconduction bands. When a photon strikes the surface of a metal, it gives all its energy to oneelectron in the metal.
• If the photon energy is equal to the energy between two energy levels then the electron isexcited to the higher energy level.
• If the photon energy is greater than or equal to the work function (energy needed toescape from the metal), then the electron is emitted from the surface of the metal (thephotoelectric effect).
The work function is different for different elements. The smaller the work function, the easierit is for electrons to be emitted from the metal. Metals with low work functions make goodconductors. This is because the electrons are attached less strongly to their surroundings andcan move more easily through these materials. This reduces the resistance of the material tothe flow of current i.e. it conducts well. Table 31.1 shows the work functions for a range ofelements.
Element Work Function (J)Aluminium 6,9 × 10⁻¹⁹
Beryllium 8,0 × 10⁻¹⁹
Calcium 4,6 × 10⁻¹⁹
Copper 7,5 × 10⁻¹⁹
Gold 8,2 × 10⁻¹⁹
Lead 6,9 × 10⁻¹⁹
Silicon 1,8 × 10⁻¹⁹
Silver 6,9 × 10⁻¹⁹
Sodium 3,7 × 10⁻¹⁹
Table 31.1: Work functions of selected elements determined from the photoelectric effect.(From the Handbook of Chemistry and Physics.)
Interesting
Fact
teresting
FactThe electron volt is the kinetic energy gained by an electron passing througha potential difference of one volt (1 V). A volt is not a measure of energy, butthe electron volt is a unit of energy. When you connect a 1.5 Volt battery toa circuit, you can give 1.5 eV of energy to every electron.
640
CHAPTER 31. OPTICAL PHENOMENA AND PROPERTIES OF MATTER - GRADE 1231.3
Worked Example 189: The photoelectric effect - I
Question: Ultraviolet radiation with a wavelength of 250 nm is incident on a silverfoil (work function φ = 6,9 × 10⁻¹⁹). What is the maximum kinetic energy of theemitted electrons?AnswerStep 1 : Determine what is required and how to approach the problemWe need to determine the maximum kinetic energy of an electron ejected from asilver foil by ultraviolet radiation.The photoelectric effect tells us that:
Ek = Ephoton − φ
Ek = hc
λ− φ
We also have:Work function of silver: φ = 6,9 × 10⁻¹⁹ JUV radiation wavelength = 250 nm = 250× 10−9 mPlanck’s constant: h = 6,63 × 10⁻³⁴ m2kgs−1
speed of light: c = 3 × 10⁸ ms−1
Step 2 : Solve the problem
Ek =hc
λ− φ
= [6,63 × 10−34 × 3 × 108
250 × 10−9] − 6,9 × 10−19
= 1,06 × 10⁻¹⁹ J
The maximum kinetic energy of the emitted electron will be 1,06 × 10⁻¹⁹ J.
Worked Example 190: The photoelectric effect - II
Question: If we were to shine the same ultraviolet radiation (f = 1,2 × 10¹⁵ Hz),on a gold foil (work function = 8,2 × 10⁻¹⁹ J), would any electrons be emittedfrom the surface of the gold foil?AnswerFor the electrons to be emitted from the surface, the energy of each photon needsto be greater than the work function of the material.Step 1 : Calculate the energy of the incident photons
Ephoton = hf
= 6,63 × 10−34 × 1,2 × 1015
= 7,96 × 10⁻¹⁹ J
Therefore each photon of ultraviolet light has an energy of 7,96 × 10⁻¹⁹ J.Step 2 : Write down the work function for gold.
φgold = 8,2 × 10⁻¹⁹ J
Step 3 : Is the energy of the photons greater or smaller than the workfunction?
641
31.3CHAPTER 31. OPTICAL PHENOMENA AND PROPERTIES OF MATTER - GRADE 12
7,96 × 10⁻¹⁹ J < 8,2 × 10⁻¹⁹ J
Ephotons < φgold
The energy of each photon is less than the work function of gold. Therefore, thephotons do not have enough energy to knock electrons out of the gold. Noelectrons would be emitted from the gold foil.
Extension: Units of energyWhen dealing with calculations at a small scale (like at the level of electrons) it
is more convenient to use different units for energy rather than the Joule (J). Wedefine a unit called the electron-Volt (eV) as the kinetic energy gained by anelectron passing through a potential difference of one volt.
E = q × V
where q is the charge of the electron and V is the potential difference applied. Thecharge of 1 electron is 1,6 × 10⁻¹⁹ C, so 1 eV is calculated to be:
1 eV = (1,610−19 C × 1 V) = 1,6 × 10⁻¹⁹ J
You can see that 1,6 × 10⁻¹⁹ J is a very small amount of energy and so usingelectron-Volts (eV) at this level is easier.Hence, 1eV = 1.6 × 10⁻¹⁹ J which means that 1 J = 6.241 × 10¹⁸ eV
31.3.2 Real-life applications
Solar Cells
The photo-electric effect may seem like a very easy way to produce electricity from the sun.This is why people choose to make solar panels out of materials like silicon, to generateelectricity. In real-life however, the amount of electricity generated is less than expected. Thisis because not every photon knocks out an electron. Other processes such as reflection orscattering also happen. This means that only a fraction ≈ 10% (depends on the material) ofthe photons produce photoelectrons. This drop in efficiency results in a lower measured current.Much work is being done in industry to improve this efficiency so that the panels can generateas high a current as possible, and create as much electricity as possible form the sun. But eventhese smaller electrical currents are useful in applications like solar-powered calculators.
Exercise: The photoelectric effect
1. Describe the photoelectric effect.
2. List two reasons why the observation of the photoelectric effect wassignificant.
3. Refer to Table 31.1: If I shine ultraviolet light with a wavelength of 288 nmonto some aluminium foil, what would be the kinetic energy of the emittedelectrons?
642

CHAPTER 31. OPTICAL PHENOMENA AND PROPERTIES OF MATTER - GRADE 1231.4
4. I shine a light of an unknown wavelength onto some silver foil. The light hasonly enough energy to eject electrons from the silver foil but not enough togive them kinetic energy. (Refer to Table 31.1 when answering the questionsbelow:)
A If I shine the same light onto some copper foil, would electrons beejected?
B If I shine the same light onto some silicon, would electrons be ejected?
C If I increase the intensity of the light shining on the silver foil, whathappens?
D If I increase the frequency of the light shining on the silver foil, whathappens?
31.4 Emission and absorption spectra
31.4.1 Emission Spectra
You have learnt previously about the structure of an atom. The electrons surrounding theatomic nucleus are arranged in a series of levels of increasing energy. Each element has its owndistinct set of energy levels. This arrangement of energy levels serves as the atom’s uniquefingerprint.
In the early 1900s, scientists found that a liquid or solid heated to high temperatures wouldgive off a broad range of colours of light. However, a gas heated to similar temperatures wouldemit light only at certain specific colours (wavelengths). The reason for this observation wasnot understood at the time.Scientists studied this effect using a discharge tube.
various energiesPhotons of
V
Current
GasCurrent
Figure 31.3: Diagram of a discharge tube. The tube is filled with a gas. When a high enoughvoltage is applied to both ends of the tube, the gas ionises and acts like a conductor, allowing acurrent to flow through the circuit. The current excites the atoms of the ionised gas. When theatoms fall back to their ground state, they emit photons to carry off the excess energy.
A discharge tube (Figure 31.3) is a glass gas-filled tube with a metal plate at both ends. If alarge enough voltage difference is applied between the two metal plates, the gas atoms insidethe tube will absorb enough energy to make some of their electrons come off i.e. the gas atomsare ionised. These electrons start moving through the gas and create a current, which raisessome electrons in other atoms to higher energy levels. Then as the electrons in the atoms fall
643
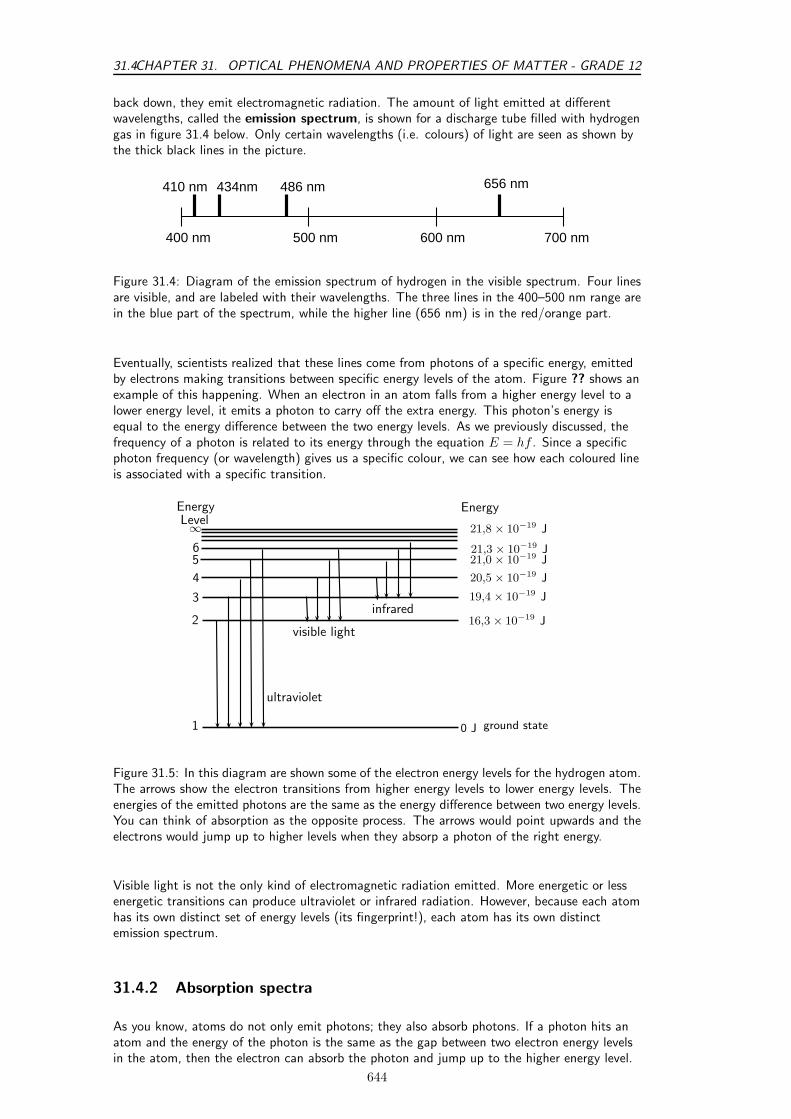
31.4CHAPTER 31. OPTICAL PHENOMENA AND PROPERTIES OF MATTER - GRADE 12
back down, they emit electromagnetic radiation. The amount of light emitted at differentwavelengths, called the emission spectrum, is shown for a discharge tube filled with hydrogengas in figure 31.4 below. Only certain wavelengths (i.e. colours) of light are seen as shown bythe thick black lines in the picture.
400 nm 500 nm 600 nm 700 nm
656 nm410 nm 434nm 486 nm
Figure 31.4: Diagram of the emission spectrum of hydrogen in the visible spectrum. Four linesare visible, and are labeled with their wavelengths. The three lines in the 400–500 nm range arein the blue part of the spectrum, while the higher line (656 nm) is in the red/orange part.
Eventually, scientists realized that these lines come from photons of a specific energy, emittedby electrons making transitions between specific energy levels of the atom. Figure ?? shows anexample of this happening. When an electron in an atom falls from a higher energy level to alower energy level, it emits a photon to carry off the extra energy. This photon’s energy isequal to the energy difference between the two energy levels. As we previously discussed, thefrequency of a photon is related to its energy through the equation E = hf . Since a specificphoton frequency (or wavelength) gives us a specific colour, we can see how each coloured lineis associated with a specific transition.
EnergyLevel
1
2
3
4
56
∞
0 J
16,3 × 10⁻¹⁹ J
19,4 × 10⁻¹⁹ J
20,5 × 10⁻¹⁹ J
21,0 × 10⁻¹⁹ J
21,8 × 10⁻¹⁹ J
21,3 × 10⁻¹⁹ J
ultraviolet
visible light
infrared
ground state
Energy
Figure 31.5: In this diagram are shown some of the electron energy levels for the hydrogen atom.The arrows show the electron transitions from higher energy levels to lower energy levels. Theenergies of the emitted photons are the same as the energy difference between two energy levels.You can think of absorption as the opposite process. The arrows would point upwards and theelectrons would jump up to higher levels when they absorp a photon of the right energy.
Visible light is not the only kind of electromagnetic radiation emitted. More energetic or lessenergetic transitions can produce ultraviolet or infrared radiation. However, because each atomhas its own distinct set of energy levels (its fingerprint!), each atom has its own distinctemission spectrum.
31.4.2 Absorption spectra
As you know, atoms do not only emit photons; they also absorb photons. If a photon hits anatom and the energy of the photon is the same as the gap between two electron energy levelsin the atom, then the electron can absorb the photon and jump up to the higher energy level.
644

CHAPTER 31. OPTICAL PHENOMENA AND PROPERTIES OF MATTER - GRADE 1231.4
If the atom has no energy level differences that equal the incoming photon’s energy, it cannotabsorb the photon, and can only scatter it.
Using this effect, if we have a source of photons of various energies we can obtain theabsorption spectra for different materials. To get an absorption spectrum, just shine whitelight on a sample of the material that you are interested in. White light is made up of all thedifferent wavelengths of visible light put together. In the absorption spectrum, the energy levelscorresponding to the absorbed photons show up as black lines because the photons of thesewavelengths have been absorbed and don’t show up. Because of this, the absorption spectrumis the exact inverse of the emission spectrum. Look at the two figures below. In figure 31.6 youcan see the emission lines of hyrodrogen. Figure 31.7 shows the absorption spectrum. It is theexact opposite of the emission spectrum! Both emission and absorption techniques can be usedto get the same information about the energy levels of an atom.
Figure 31.6: Emission spectrum of Hydrogen.
Figure 31.7: Absorption spectrum of Hydrogen.
Worked Example 191: Absorption
Question: I have an unknown gas in a glass container. I shine a bright white lightthrough one side of the container and measure the spectrum of transmitted light. Inotice that there is a black line (absorption line) in the middle of the visible redband at 642 nm. I have a hunch that the gas might be hydrogen. If I am correct,between which 2 energy levels does this transition occur? (Hint: look at figure 31.5and the transitions which are in the visible part of the spectrum.)
Answer
Step 1 : What is given and what needs to be done?
We have an absorption line at 642 nm. This means that the substance in the glasscontainer absorbed photons with a wavelength of 642 nm. We need to calculatewhich 2 energy levels of hydrogen this transition would correspond to. Thereforewe need to know what energy the absorbed photons had.
Step 2 : Calculate the energy of the absorbed photons
E =hc
λ
=(6,63 × 10−34) × (3 × 108)
642 × 10−9
= 3,1 × 10⁻¹⁹ J
The absorbed photons had energy of 3,1 × 10⁻¹⁹
Step 3 : Find the energy of the transitions resulting in radiation at visiblewavelengths
Figure 31.5 shows various energy level transitions. The transitions related to visiblewavelengths are marked as the transitions beginning or ending on Energy Level 2.Let’s find the energy of those transitions and compare with the energy of theabsorbed photons we’ve just calculated.
645
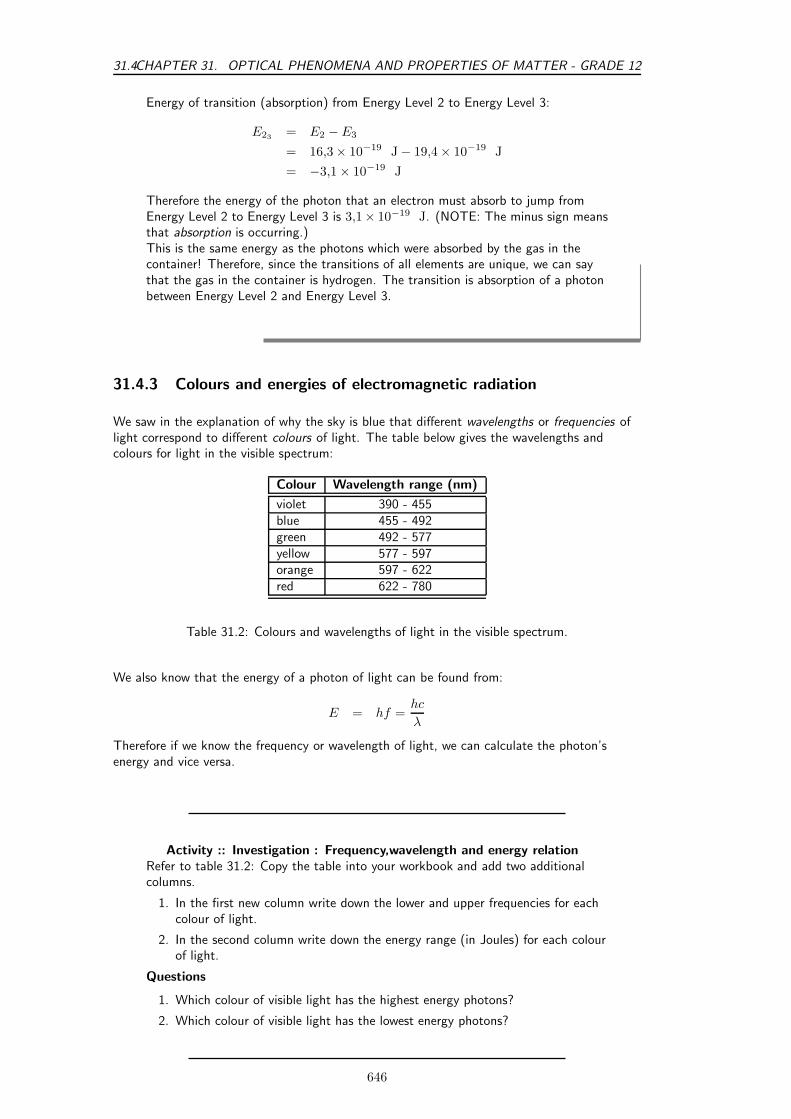
31.4CHAPTER 31. OPTICAL PHENOMENA AND PROPERTIES OF MATTER - GRADE 12
Energy of transition (absorption) from Energy Level 2 to Energy Level 3:
E23= E2 − E3
= 16,3 × 10⁻¹⁹ J − 19,4 × 10⁻¹⁹ J
= −3,1 × 10⁻¹⁹ J
Therefore the energy of the photon that an electron must absorb to jump fromEnergy Level 2 to Energy Level 3 is 3,1× 10⁻¹⁹ J. (NOTE: The minus sign meansthat absorption is occurring.)This is the same energy as the photons which were absorbed by the gas in thecontainer! Therefore, since the transitions of all elements are unique, we can saythat the gas in the container is hydrogen. The transition is absorption of a photonbetween Energy Level 2 and Energy Level 3.
31.4.3 Colours and energies of electromagnetic radiation
We saw in the explanation of why the sky is blue that different wavelengths or frequencies oflight correspond to different colours of light. The table below gives the wavelengths andcolours for light in the visible spectrum:
Colour Wavelength range (nm)
violet 390 - 455blue 455 - 492green 492 - 577yellow 577 - 597orange 597 - 622red 622 - 780
Table 31.2: Colours and wavelengths of light in the visible spectrum.
We also know that the energy of a photon of light can be found from:
E = hf =hc
λ
Therefore if we know the frequency or wavelength of light, we can calculate the photon’senergy and vice versa.
Activity :: Investigation : Frequency,wavelength and energy relationRefer to table 31.2: Copy the table into your workbook and add two additionalcolumns.
1. In the first new column write down the lower and upper frequencies for eachcolour of light.
2. In the second column write down the energy range (in Joules) for each colourof light.
Questions
1. Which colour of visible light has the highest energy photons?
2. Which colour of visible light has the lowest energy photons?
646
CHAPTER 31. OPTICAL PHENOMENA AND PROPERTIES OF MATTER - GRADE 1231.4
Worked Example 192: Colours of light
Question: A photon of wavelength 500 nm is emitted by a traffic light.
1. What is the energy of the photon?
2. What is the frequency of the photon?
3. Use table 31.2 to determine the colour of the light.
AnswerStep 1 : What information is given and what do we need to do find?We are given λ = 500 × 10−9 m and we need to find the photon’s energy,frequency and colour.Step 2 : Use the equation E = hc
λto find the photon’s energy
E =hc
λ
=(6,63 × 10−34) × (3 × 108)
500 × 109
= 3,98 × 10⁻¹⁹ J
The energy of the photon is 3,98 × 10⁻¹⁹ J.Step 3 : We know the energy of the photon, now we can use E = hf tosolve for the frequency
E = hf
f =E
h
=3.98 × 10⁻¹⁹
6,63 × 10−34
= 6 × 10¹⁴ Hz
The frequency of the photon is 6 ×10¹⁴ HzStep 4 : Use the table to find the colour of lightThe wavelength given in the question is 500 nm. We can see in the table that green light haswavelengths between 492 - 577 nm. Therefore 500 nm is in this range and the colour of thelight is green.
Worked Example 193: Colours and energies of light
Question: I have some sources which emit light of the following wavelengths:
1. 400 nm,
2. 580 nm,
3. 650 nm,
4. 300 nm.
What are the colours of light emitted by the sources (see table 31.2) and whichsource emits photons with the highest energy and which with the lowest energy?AnswerStep 1 : What information is given, and what do we need to do?4 wavelengths of light are given and we need to find their colours.
647
31.4CHAPTER 31. OPTICAL PHENOMENA AND PROPERTIES OF MATTER - GRADE 12
We also need to find which colour light photons have the highest energy and whichone has the lowest energy.Step 2 : To find the colours of light, we can compare the wavelengths tothose given in table 31.2
1. 400 nm falls into the range for violet light (390 - 455 nm).
2. 580 nm falls into the range for yellow light (577 - 597 nm).
3. 650 nm falls into the range for red light (622 - 780 nm).
4. 300 nm is not shown in the table. However, this wavelength is just a littleshorter than the shortest wavelength in the violet range. Therefore 300 nm isultraviolet.
Step 3 : To find the colour of the light whose photons have the highest andlowest energies respectively, we need to calculate the energies of all thephotonsWe know E = hc
λFor 400 nm:
E =hc
λ
=(6,63 × 10−34) × (3 × 108)
400 × 10−9
= 4,97 × 10⁻¹⁹ JFor 580 nm:
E =hc
λ
=(6,63 × 10−34) × (3 × 108)
580 × 10−9
= 3,43 × 10⁻¹⁹ JFor 650 nm:
E =hc
λ
=(6,63 × 10−34) × (3 × 108)
650 × 10−9
= 3,06 × 10⁻¹⁹ JFor 300 nm:
E =hc
λ
=(6,63 × 10−34) × (3 × 108)
300 × 10−9
= 6,63 × 10⁻¹⁹ JTherefore, the photons with the highest energy are the ultraviolet photons.The photons with the lowest energy are from light which is red.
31.4.4 Applications of emission and absorption spectra
The study of spectra from stars and galaxies in astronomy is called spectroscopy. Spectroscopyis a tool widely used in astronomy to learn different things about astronomical objects.
Identifying elements in astronomical objects using their spectra
Measuring the spectrum of light from a star can tell astronomers what the star is made of!Since each element emits or absorbs light only at particular wavelengths, astronomers canidentify what elements are in the stars from the lines in their spectra. From studying the
648

CHAPTER 31. OPTICAL PHENOMENA AND PROPERTIES OF MATTER - GRADE 1231.4
spectra of many stars we know that there are many different types of stars which containdifferent elements and in different amounts.
Determining velocities of galaxies using spectroscopy
You have already learned in Chapter 24 about the Doppler effect and how the frequency (andwavelength) of sound waves changes depending on whether the object emitting the sound ismoving towards or away from you. The same thing happens to electromagnetic radiation. Ifthe object emitting the light is moving towards us, then the wavelength of the light appearsshorter (called blue-shifted). If the object is moving away from us, then the wavelength of itslight appears stretched out (called red-shifted).
The Doppler effect affects the spectra of objects in space depending on their motion relative tous on the earth. For example, the light from a distant galaxy, which is moving away from us atsome velocity, will appear red-shifted. This means that the emission and absorption lines in thegalaxy’s spectrum will be shifted to a longer wavelength (lower frequency). Knowing whereeach line in the spectrum would normally be if the galaxy was not moving, and comparing totheir red-shifted positions, allows astronomers to precisely measure the velocity of the galaxyrelative to the earth!
Global warming and greenhouse gases
The sun emits radiation (light) over a range of wavelengths which are mainly in the visible partof the spectrum. Radiation at these wavelengths passes through the gases of the atmosphereto warm the land and the oceans below. The warm earth then radiates this heat at longerinfrared wavelengths. Carbon-dioxide (one of the main greenhouse gases) in the atmospherehas energy levels which correspond to the infrared wavelengths which allow it to absorb theinfrared radiation. It then also emits at infrared wavelengths in all directions. This effect stopsa large amount of the infrared radiation getting out of the atmosphere, which causes theatmosphere and the earth to heat up. More radiation is coming in than is getting back out.
earth radiates long wavelength infrared radiation
the sun emits short wavelength radiation which penetrates the atmosphere
CO2 molecules absorb and re-emitthe infrared radiation in all directions
heating the atmosphere
Therefore increasing the amount of greenhouse gases in the atmosphere increases the amountof trapped infrared radiation and therefore the overall temperature of the earth. The earth is avery sensitive and complicated system upon which life depends and changing the delicatebalances of temperature and atmospheric gas content may have disastrous consequences if weare not careful.
Activity :: Investigation : The greenhouse effectIn pairs try to find the following information (e.g. in books, on the internet) andreport back to the class in a 5 minute presentation which includes the following:
649
31.5CHAPTER 31. OPTICAL PHENOMENA AND PROPERTIES OF MATTER - GRADE 12
1. What other gases besides carbon dioxide are responsible for the greenhouseeffect?
2. Where do greenhouse gases come from? (are they human-made or natural?)
3. Investigate one serious side-effect which could arise if the earth’s temperaturewere to go up significantly. Present some ways in which this effect could beavoided.
Exercise: Emission and absorption spectra
1. Explain how atomic emission spectra arise and how they relate to eachelement on the periodic table.
2. How do the lines on the atomic spectrum relate to electron transitionsbetween energy levels?
3. Explain the difference between of atomic absorption and emission spectra.
4. Describe how the absorption and emission spectra of the gases in theatmosphere give rise to the Greenhouse Effect.
5. Using table 31.2 calculate the frequency range for yellow light.
6. What colour is the light emitted by hydrogen when an electron makes thetransition from energy level 5 down to energy level 2? (Use figure 31.5 to findthe energy of the released photon.)
7. I have a glass tube filled with hydrogen gas. I shine white light onto the tube.The spectrum I then measure has an absorption line at a wavelength of 474nm. Between which two energy levels did the transition occur? (Usefigure 31.5 in solving the problem.)
31.5 Lasers
A laser is a device that produces a special type of light: all the laser photons are identical!They all have the same wavelength (and frequency), amplitude and phase. Since they all havethe same wavelength, this means they all have the same colour and the light is calledmonochromatic. (Note: mono means ”one” or ”single” and chromatic means ”colour”.)This is very different to most other light sources which produce light with a range ofwavelengths (e.g. white light from the sun consists of all the visible wavelengths.)
Laser light is highly directional and can be focused very well. This focus allows laser beams tobe used over long distances, and to pack a lot of energy into the beam while still requiringreasonably small amounts of energy to be generated. Each centimetre of a typical laser beamcontains many billions of photons. These special properties of laser light come from the way inwhich the laser photons are created and the energy levels of the material that makes up thelaser. These properties make laser light extremely useful in many applications from CD playersto eye surgery.The term LASER stands for Light Amplification by the Stimulated Emission of Radiation.This stimulated emission is different to the spontaneous emission already discussed earlier.Let’s review the absorption and emission processes which can occur in atoms.
650

CHAPTER 31. OPTICAL PHENOMENA AND PROPERTIES OF MATTER - GRADE 1231.5
BEFORE AFTER
E1
E2
E2
E1
E2
E1
E2
E1
E2
E1
E2
E1
no photonabsorption
spontaneousemission
stimulatedemission
E=E2-E1
E=E2-E1
E=E2-E1
E=E2-E1
E=E2-E1
a photon with E=E2-E1
which jumps from energy
level E1 to E2
an electron on energy
drop down to energy levelE1 by emitting a photon with
an electron on energy level
incoming photon with E=E2-E1
another photon of E=E2-1to drop down to E1 by emitting
no photon
is absorbed by the electron
level E2 can spontaneously
E=E2-E1
E2 can be stimulated, by an
• Absorption: As you can see in the picture above, absorption happens when an electronjumps up to a higher energy level by absorbing a photon which has an energy equal tothe energy difference between the two energy levels.
• Spontaneous emission: Spontaneous emission is when an electron in a higher energylevel drops down to a lower energy level and a photon is emitted with an energy equal tothe energy difference between the two levels. There is no interference in this processfrom outside factors. Usually spontaneous emission happens very quickly after anelectron gets into an excited state. In other words, the lifetime of the excited state isvery short. However, there are some excited states where an electron can remain in thehigher energy level for a longer time than usual before dropping down to a lower level.These excited states are called metastable states.
• Stimulated emission: As the picture above shows, stimulated emission happens whena photon with an energy equal to the energy difference between two levels interacts withan electron in the higher level. This stimulates the electron to emit an identical photonand drop down to the lower energy level. This process results in two photons at the end.
Definition: Spontaneous EmissionSpontaneous emission occurs when an atom is in an unstable excited state and randomlydecays to a less energetic state, emitting a photon to carry off the excess energy. Theunstable state decays in a characteristic time, called the lifetime.
Definition: Meta-stable stateA meta-stable state is an excited atomic state that has an unusually long lifetime, comparedto the lifetimes of other excited states of that atom. While most excited states have lifetimesmeasured in microseconds and nanoseconds (10−6 s and 10−9 s), meta-stable states canhave lifetimes of milliseconds (10−3 s) or even seconds.
Definition: Stimulated emissionStimulated emission occurs when a photon interacts with an excited atom, causing the atomto decay and emit another identical photon.
651
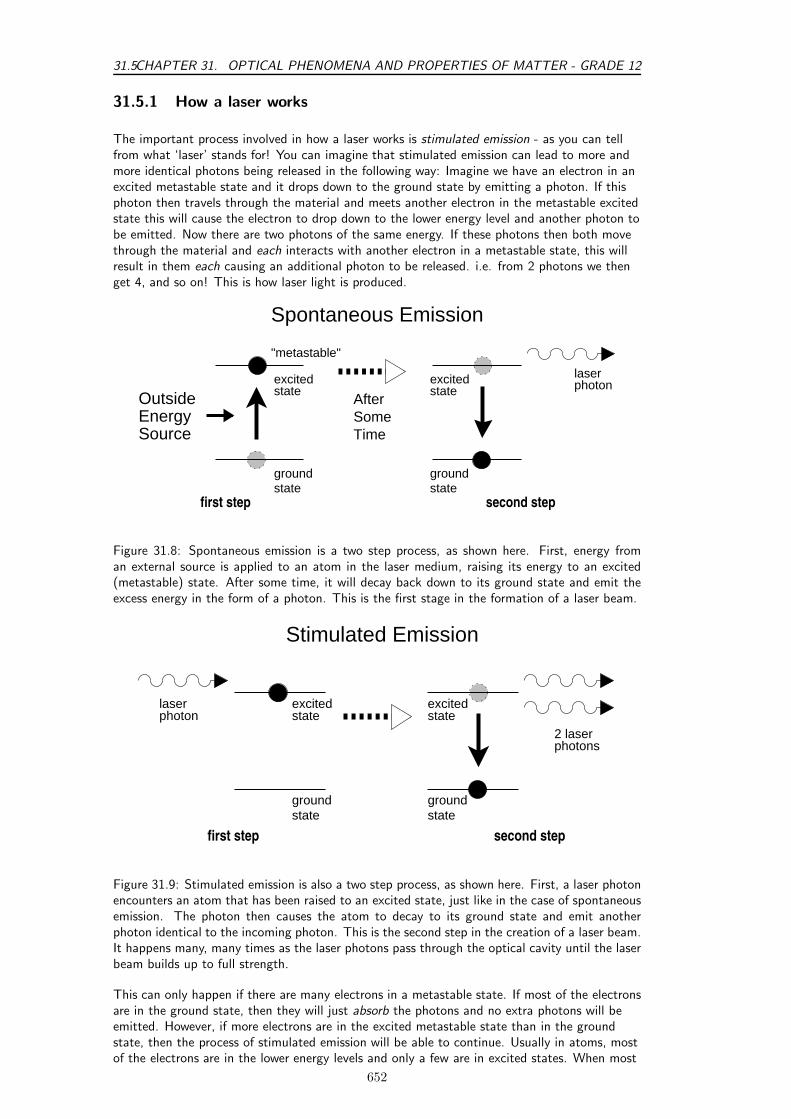
31.5CHAPTER 31. OPTICAL PHENOMENA AND PROPERTIES OF MATTER - GRADE 12
31.5.1 How a laser works
The important process involved in how a laser works is stimulated emission - as you can tellfrom what ‘laser’ stands for! You can imagine that stimulated emission can lead to more andmore identical photons being released in the following way: Imagine we have an electron in anexcited metastable state and it drops down to the ground state by emitting a photon. If thisphoton then travels through the material and meets another electron in the metastable excitedstate this will cause the electron to drop down to the lower energy level and another photon tobe emitted. Now there are two photons of the same energy. If these photons then both movethrough the material and each interacts with another electron in a metastable state, this willresult in them each causing an additional photon to be released. i.e. from 2 photons we thenget 4, and so on! This is how laser light is produced.
groundstate
excitedstateOutside
EnergySource
laserphoton
groundstate
excitedstate
"metastable"
AfterSomeTime
Spontaneous Emission
first step second step
Figure 31.8: Spontaneous emission is a two step process, as shown here. First, energy froman external source is applied to an atom in the laser medium, raising its energy to an excited(metastable) state. After some time, it will decay back down to its ground state and emit theexcess energy in the form of a photon. This is the first stage in the formation of a laser beam.
groundstate
excitedstate
groundstate
excitedstate
laserphoton
Stimulated Emission
2 laserphotons
second stepfirst step
Figure 31.9: Stimulated emission is also a two step process, as shown here. First, a laser photonencounters an atom that has been raised to an excited state, just like in the case of spontaneousemission. The photon then causes the atom to decay to its ground state and emit anotherphoton identical to the incoming photon. This is the second step in the creation of a laser beam.It happens many, many times as the laser photons pass through the optical cavity until the laserbeam builds up to full strength.
This can only happen if there are many electrons in a metastable state. If most of the electronsare in the ground state, then they will just absorb the photons and no extra photons will beemitted. However, if more electrons are in the excited metastable state than in the groundstate, then the process of stimulated emission will be able to continue. Usually in atoms, mostof the electrons are in the lower energy levels and only a few are in excited states. When most
652

CHAPTER 31. OPTICAL PHENOMENA AND PROPERTIES OF MATTER - GRADE 1231.5
of the electrons are in the excited metastable state and only a few are in the ground state, thisis called population inversion (the populations are swapped around) and this is whenstimulated emission can occur. To start off the process, the electrons first have to be excitedup into the metastable state. This is done using an external energy source.
Definition: Population inversionPopulation inversion is when more atoms are in an excited state than in their ground state.It is a necessary condition to sustain a laser beam, so that there are enough excited atomsthat can be stimulated to emit more photons.
ground state
metastablestate
ground state
metastablestate
b b b b b b b b
b b b b b b b bb b b
b b b
usually most electrons are in most electrons in excited metastablestate = population inversionthe ground state
Therefore, materials used to make laser light must must have metastable states which canallow population inversion to occur when an external energy source is applied. Somesubstances which are used to make lasers are listed in table 31.3. You can see that gases (suchas Helium-Neon mixture), liquids (such as dyes), and solids (such as the precious stone ruby)are all used to make lasers.
Material Type Wavelength UsesHelium–Neon gas 632,8 nm scientific research, holographyArgon ion gas 488,0 nm medicine,Carbon dioxide gas 10,6 µm industry (cutting, welding), surgeryHelium–Cadmium vapor 325 nm printing, scientific researchRuby solid–state 694,3 nm holographyNeodymium YAG solid–state 1,064 µm industry, surgery, research(Yttrium AluminiumGarnet)Titanium–Sapphire solid–state 650–1100 nm researchLaser diode semiconductor 375–1080 nm telecommunications, industry,
printing, CD players, laser pointers
Table 31.3: A selection of different lasers. The laser material and general type of each laser isgiven, along with typical wavelengths of the laser light they create. Examples of the real-worldapplications it is used for are also given. All these materials allow a population inversion to beset up.
Interesting
Fact
teresting
FactThe first working laser, using synthetic ruby as the laser material, was made byTheodore H. Maiman at Hughes Research Laboratories in Malibu, California.Later in the same year the Iranian physicist Ali Javan, together with WilliamBennet and Donald Herriot, made the first gas laser using helium and neon.Javan received the Albert Einstein Award in 1993.
653

31.5CHAPTER 31. OPTICAL PHENOMENA AND PROPERTIES OF MATTER - GRADE 12
31.5.2 A simple laser
A laser consists of a number of different parts that work together to create the laser beam.Figure 31.10 shows the different parts of the laser, while Figure 31.11 shows how they createthe laser beam.
SourceEnergy External
Laser BeamLaser Medium
Optical Cavity
Full Mirror Partially−SilveredMirror
Figure 31.10: Diagram of a laser showing the main components.
The basis of the laser is the laser material. The laser material consists of the atoms that areused to create the laser beam. Many different materials can be used as laser material, and theirenergy levels determine the characteristics of the laser. Some examples of different lasers areshown in Table 31.3. The laser material is contained in the optical cavity.Before the laser is turned on, all the atoms in the laser material are in their ground state. Thefirst step in creating a laser beam is to add energy to the laser material to raise most of theelectrons into an excited metastable state. This is called pumping the laser.The creation of the laser beam starts through the process of spontaneous emission, shown inFigure 31.8. An electron drops down to the ground state and emits a photon with energy equalto the energy difference of the two energy levels. This laser photon is the beginning of the laser
4
1
2
35
SourceEnergy External
Laser Beam
Figure 31.11: Diagram of a laser showing the process of creating a laser beam. (1) A sourceof external energy is applied to the laser medium, raising the atoms to an excited state. (2)An excited atom decays though spontaneous emission, emitting a photon. (3) The photonencounters another excited atom and causes it to decay through stimulated emission, creatinganother photon. (4) The photons bounce back and forth through the laser medium betweenthe mirrors, building up more and more photons. (5) A small percentage of the photons passthrough the partially-silvered mirror to become the laser beam we see.
654
CHAPTER 31. OPTICAL PHENOMENA AND PROPERTIES OF MATTER - GRADE 1231.5
beam.Sometimes a laser photon runs into another excited electron. Then stimulated emission occursand the electron drops down to the ground state and emits an additional identical photon asshown in Figure 31.9. Since the laser material typically has a large number of atoms, one laserphoton passing through this material will rapidly cause a large number of photons just like it tobe emitted.The optical cavity keeps the laser photons inside the laser cavity so they can build up the laserbeam. At each end is a concave mirror; one is a full mirror and one is a partial mirror. The fullmirror is totally reflective. The partial mirror transmits a small amount of the light that hitsit(less than 1%). The mirrors are carefully aligned so that photons that reflect off one mirrorbecome “trapped”, and bounce back and forth between the mirrors many times causing moreand more stimulated emission. The photons that eventually escape through thepartially-silvered mirror become the laser beam that we see.As the photons bounce between mirrors, they continually pass through the laser material,stimulating those atoms to emit more photons. This creates an ever increasing beam ofphotons, all with the same characteristics, all traveling in the same direction. In this way, theoptical cavity helps to amplify the original laser photons into a concentrated, intense beam ofphotons.The laser cavity also helps to narrow the frequency range of laser light emitted. The distancebetween the two mirrors defines the cavity mode which only allows light of a narrow range offrequencies to continue being reflected back and forth. Light of other frequencies damped out.(This is just like in the chapter on the physics of music where a pipe of a certain lengthcorresponds to a particular wavelength of sound.) Therefore only a narrow frequency of lightcan be emitted.
Interesting
Fact
teresting
FactIn 1953, Charles H. Townes and graduate students James P. Gordon andHerbert J. Zeiger produced the first maser, a device operating on similarprinciples to the laser, but producing microwave rather than optical radiation.Townes’s maser was incapable of making a continuous beam. Nikolay Basovand Aleksandr Prokhorov of the former Soviet Union worked independently anddeveloped a method of making a continuous beam using more than two energylevels. Townes, Basov and Prokhorov shared the Nobel Prize in Physics in 1964.
31.5.3 Laser applications and safety
Although the first working laser was only produced in 1958, lasers are now found in manyhousehold items. For example, lasers are well-known through their use as cheap laser pointers.However, lasers can be very dangerous to the human eye since a large amount of energy isfocused into a very narrow beam. NEVER POINT A LASER POINTER INTOSOMEBODY’S EYES - it can blind them.
Other uses include:
• Semiconductor lasers which are small, efficient and cheap to make are found in CDplayers.
• He-Ne Lasers are used in most grocery shops to read in the price of items using theirbarcodes. This makes the cashiers’ job much quicker and easier.
• High energy lasers are used in medicine as a cutting and welding tool. Eye surgery inparticular make use of the precision of lasers to reattach the retinas of patients’ eyes.The heat from cutting lasers also helps to stop the bleeding on a wound by burning theedges (called cauterising).
655

31.6CHAPTER 31. OPTICAL PHENOMENA AND PROPERTIES OF MATTER - GRADE 12
Activity :: Case Study : Uses of lasersDo research in a library or on the Internet on one application of laser
technology. Explain how the technology works by using a laser.You will need to present your findings to the class in the form of a poster. You
can think of any useful application, but to give you some ideas of where to start,some applications are listed below:
• laser printers
• laser communication and fibre optics
• optical storage
• using lasers as precision measurement tools
• your own ideas...
Exercise: Lasers
1. Explain what is meant by spontaneous emission of radiation.
2. Explain what is meant by stimulated emission of radiation.
3. List the similarities and differences between spontaneous emission of radiationand stimulated emission of radiation.
4. How is the light emitted by a laser different from the light emitted by a lightbulb?
5. Describe using a simple diagram, how a laser works. Your description shouldinclude the following concepts: metastable state and population inversion.
6. Give examples of some materials that have been used for lasers. What do allthese materials have in common?
7. Describe how the laser cavity affects:
• increasing amplification
• concentrating beam intensity
• narrowing the frequency of the beam
8. List some applications of lasers.
31.6 Summary
1. Light of the correct frequency can emit electrons from a metal. This is called thephotoelectric effect.
2. A metal has a work function which is the minimum energy needed to emit an electronfrom the metal.
3. Emission spectra are formed by glowing gases. The pattern of the spectra ischaracteristic of the specific gas.
4. Absorption spectra are formed when certain frequencies of light is absorbed by a material.
5. Lasers are devices that produce a special type of light that has many uses.
6. Lasers have many uses, including being used in CD and DVD players, to cut material, insurgery, in printing, in telecommunications and as laser pointers.
656

CHAPTER 31. OPTICAL PHENOMENA AND PROPERTIES OF MATTER - GRADE 1231.7
31.7 End of chapter exercise
1. What is the photoelectric effect?
2. Calculate the energy of a photon of red light with a wavelength of 400 nm.
3. Will ultraviolet light with a wavelenth of 990 nm of be able to emit electrons from asheet of calcium with a work function of 2,9 eV?
4. What does the acronym LASER stand for?
5. Name three types of lasers and their uses.
6. Write a short essay on the benefits lasers have had on modern society.
657

31.7CHAPTER 31. OPTICAL PHENOMENA AND PROPERTIES OF MATTER - GRADE 12
658

Appendix A
GNU Free Documentation License
Version 1.2, November 2002Copyright c© 2000,2001,2002 Free Software Foundation, Inc.59 Temple Place, Suite 330, Boston, MA 02111-1307 USAEveryone is permitted to copy and distribute verbatim copies of this license document, butchanging it is not allowed.
PREAMBLE
The purpose of this License is to make a manual, textbook, or other functional and usefuldocument “free” in the sense of freedom: to assure everyone the effective freedom to copy andredistribute it, with or without modifying it, either commercially or non-commercially.Secondarily, this License preserves for the author and publisher a way to get credit for theirwork, while not being considered responsible for modifications made by others.
This License is a kind of “copyleft”, which means that derivative works of the document mustthemselves be free in the same sense. It complements the GNU General Public License, whichis a copyleft license designed for free software.
We have designed this License in order to use it for manuals for free software, because freesoftware needs free documentation: a free program should come with manuals providing thesame freedoms that the software does. But this License is not limited to software manuals; itcan be used for any textual work, regardless of subject matter or whether it is published as aprinted book. We recommend this License principally for works whose purpose is instruction orreference.
APPLICABILITY AND DEFINITIONS
This License applies to any manual or other work, in any medium, that contains a notice placedby the copyright holder saying it can be distributed under the terms of this License. Such anotice grants a world-wide, royalty-free license, unlimited in duration, to use that work underthe conditions stated herein. The “Document”, below, refers to any such manual or work. Anymember of the public is a licensee, and is addressed as “you”. You accept the license if youcopy, modify or distribute the work in a way requiring permission under copyright law.
A “Modified Version” of the Document means any work containing the Document or a portionof it, either copied verbatim, or with modifications and/or translated into another language.
A “Secondary Section” is a named appendix or a front-matter section of the Document thatdeals exclusively with the relationship of the publishers or authors of the Document to theDocument’s overall subject (or to related matters) and contains nothing that could fall directlywithin that overall subject. (Thus, if the Document is in part a textbook of mathematics, a
677
APPENDIX A. GNU FREE DOCUMENTATION LICENSE
Secondary Section may not explain any mathematics.) The relationship could be a matter ofhistorical connection with the subject or with related matters, or of legal, commercial,philosophical, ethical or political position regarding them.
The “Invariant Sections” are certain Secondary Sections whose titles are designated, as beingthose of Invariant Sections, in the notice that says that the Document is released under thisLicense. If a section does not fit the above definition of Secondary then it is not allowed to bedesignated as Invariant. The Document may contain zero Invariant Sections. If the Documentdoes not identify any Invariant Sections then there are none.
The “Cover Texts” are certain short passages of text that are listed, as Front-Cover Texts orBack-Cover Texts, in the notice that says that the Document is released under this License. AFront-Cover Text may be at most 5 words, and a Back-Cover Text may be at most 25 words.
A “Transparent” copy of the Document means a machine-readable copy, represented in aformat whose specification is available to the general public, that is suitable for revising thedocument straightforwardly with generic text editors or (for images composed of pixels) genericpaint programs or (for drawings) some widely available drawing editor, and that is suitable forinput to text formatters or for automatic translation to a variety of formats suitable for input totext formatters. A copy made in an otherwise Transparent file format whose markup, orabsence of markup, has been arranged to thwart or discourage subsequent modification byreaders is not Transparent. An image format is not Transparent if used for any substantialamount of text. A copy that is not “Transparent” is called “Opaque”.
Examples of suitable formats for Transparent copies include plain ASCII without markup,Texinfo input format, LATEX input format, SGML or XML using a publicly available DTD andstandard-conforming simple HTML, PostScript or PDF designed for human modification.Examples of transparent image formats include PNG, XCF and JPG. Opaque formats includeproprietary formats that can be read and edited only by proprietary word processors, SGML orXML for which the DTD and/or processing tools are not generally available, and themachine-generated HTML, PostScript or PDF produced by some word processors for outputpurposes only.
The “Title Page” means, for a printed book, the title page itself, plus such following pages asare needed to hold, legibly, the material this License requires to appear in the title page. Forworks in formats which do not have any title page as such, “Title Page” means the text nearthe most prominent appearance of the work’s title, preceding the beginning of the body of thetext.
A section “Entitled XYZ” means a named subunit of the Document whose title either isprecisely XYZ or contains XYZ in parentheses following text that translates XYZ in anotherlanguage. (Here XYZ stands for a specific section name mentioned below, such as“Acknowledgements”, “Dedications”, “Endorsements”, or “History”.) To “Preserve the Title”of such a section when you modify the Document means that it remains a section “EntitledXYZ” according to this definition.
The Document may include Warranty Disclaimers next to the notice which states that thisLicense applies to the Document. These Warranty Disclaimers are considered to be included byreference in this License, but only as regards disclaiming warranties: any other implication thatthese Warranty Disclaimers may have is void and has no effect on the meaning of this License.
VERBATIM COPYING
You may copy and distribute the Document in any medium, either commercially ornon-commercially, provided that this License, the copyright notices, and the license noticesaying this License applies to the Document are reproduced in all copies, and that you add noother conditions whatsoever to those of this License. You may not use technical measures toobstruct or control the reading or further copying of the copies you make or distribute.However, you may accept compensation in exchange for copies. If you distribute a large enoughnumber of copies you must also follow the conditions in section A.
678
APPENDIX A. GNU FREE DOCUMENTATION LICENSE
You may also lend copies, under the same conditions stated above, and you may publiclydisplay copies.
COPYING IN QUANTITY
If you publish printed copies (or copies in media that commonly have printed covers) of theDocument, numbering more than 100, and the Document’s license notice requires Cover Texts,you must enclose the copies in covers that carry, clearly and legibly, all these Cover Texts:Front-Cover Texts on the front cover, and Back-Cover Texts on the back cover. Both coversmust also clearly and legibly identify you as the publisher of these copies. The front cover mustpresent the full title with all words of the title equally prominent and visible. You may addother material on the covers in addition. Copying with changes limited to the covers, as long asthey preserve the title of the Document and satisfy these conditions, can be treated asverbatim copying in other respects.
If the required texts for either cover are too voluminous to fit legibly, you should put the firstones listed (as many as fit reasonably) on the actual cover, and continue the rest onto adjacentpages.
If you publish or distribute Opaque copies of the Document numbering more than 100, youmust either include a machine-readable Transparent copy along with each Opaque copy, orstate in or with each Opaque copy a computer-network location from which the generalnetwork-using public has access to download using public-standard network protocols acomplete Transparent copy of the Document, free of added material. If you use the latteroption, you must take reasonably prudent steps, when you begin distribution of Opaque copiesin quantity, to ensure that this Transparent copy will remain thus accessible at the statedlocation until at least one year after the last time you distribute an Opaque copy (directly orthrough your agents or retailers) of that edition to the public.
It is requested, but not required, that you contact the authors of the Document well beforeredistributing any large number of copies, to give them a chance to provide you with anupdated version of the Document.
MODIFICATIONS
You may copy and distribute a Modified Version of the Document under the conditions ofsections A and A above, provided that you release the Modified Version under precisely thisLicense, with the Modified Version filling the role of the Document, thus licensing distributionand modification of the Modified Version to whoever possesses a copy of it. In addition, youmust do these things in the Modified Version:
1. Use in the Title Page (and on the covers, if any) a title distinct from that of theDocument, and from those of previous versions (which should, if there were any, be listedin the History section of the Document). You may use the same title as a previousversion if the original publisher of that version gives permission.
2. List on the Title Page, as authors, one or more persons or entities responsible forauthorship of the modifications in the Modified Version, together with at least five of theprincipal authors of the Document (all of its principal authors, if it has fewer than five),unless they release you from this requirement.
3. State on the Title page the name of the publisher of the Modified Version, as thepublisher.
4. Preserve all the copyright notices of the Document.
5. Add an appropriate copyright notice for your modifications adjacent to the othercopyright notices.
679

APPENDIX A. GNU FREE DOCUMENTATION LICENSE
6. Include, immediately after the copyright notices, a license notice giving the publicpermission to use the Modified Version under the terms of this License, in the formshown in the Addendum below.
7. Preserve in that license notice the full lists of Invariant Sections and required Cover Textsgiven in the Document’s license notice.
8. Include an unaltered copy of this License.
9. Preserve the section Entitled “History”, Preserve its Title, and add to it an item statingat least the title, year, new authors, and publisher of the Modified Version as given onthe Title Page. If there is no section Entitled “History” in the Document, create onestating the title, year, authors, and publisher of the Document as given on its Title Page,then add an item describing the Modified Version as stated in the previous sentence.
10. Preserve the network location, if any, given in the Document for public access to aTransparent copy of the Document, and likewise the network locations given in theDocument for previous versions it was based on. These may be placed in the “History”section. You may omit a network location for a work that was published at least fouryears before the Document itself, or if the original publisher of the version it refers togives permission.
11. For any section Entitled “Acknowledgements” or “Dedications”, Preserve the Title of thesection, and preserve in the section all the substance and tone of each of the contributoracknowledgements and/or dedications given therein.
12. Preserve all the Invariant Sections of the Document, unaltered in their text and in theirtitles. Section numbers or the equivalent are not considered part of the section titles.
13. Delete any section Entitled “Endorsements”. Such a section may not be included in theModified Version.
14. Do not re-title any existing section to be Entitled “Endorsements” or to conflict in titlewith any Invariant Section.
15. Preserve any Warranty Disclaimers.
If the Modified Version includes new front-matter sections or appendices that qualify asSecondary Sections and contain no material copied from the Document, you may at youroption designate some or all of these sections as invariant. To do this, add their titles to thelist of Invariant Sections in the Modified Version’s license notice. These titles must be distinctfrom any other section titles.
You may add a section Entitled “Endorsements”, provided it contains nothing but endorsementsof your Modified Version by various parties–for example, statements of peer review or that thetext has been approved by an organisation as the authoritative definition of a standard.
You may add a passage of up to five words as a Front-Cover Text, and a passage of up to 25words as a Back-Cover Text, to the end of the list of Cover Texts in the Modified Version.Only one passage of Front-Cover Text and one of Back-Cover Text may be added by (orthrough arrangements made by) any one entity. If the Document already includes a cover textfor the same cover, previously added by you or by arrangement made by the same entity youare acting on behalf of, you may not add another; but you may replace the old one, on explicitpermission from the previous publisher that added the old one.
The author(s) and publisher(s) of the Document do not by this License give permission to usetheir names for publicity for or to assert or imply endorsement of any Modified Version.
COMBINING DOCUMENTS
You may combine the Document with other documents released under this License, under theterms defined in section A above for modified versions, provided that you include in the
680

APPENDIX A. GNU FREE DOCUMENTATION LICENSE
combination all of the Invariant Sections of all of the original documents, unmodified, and listthem all as Invariant Sections of your combined work in its license notice, and that youpreserve all their Warranty Disclaimers.
The combined work need only contain one copy of this License, and multiple identical InvariantSections may be replaced with a single copy. If there are multiple Invariant Sections with thesame name but different contents, make the title of each such section unique by adding at theend of it, in parentheses, the name of the original author or publisher of that section if known,or else a unique number. Make the same adjustment to the section titles in the list of InvariantSections in the license notice of the combined work.
In the combination, you must combine any sections Entitled “History” in the various originaldocuments, forming one section Entitled “History”; likewise combine any sections Entitled“Acknowledgements”, and any sections Entitled “Dedications”. You must delete all sectionsEntitled “Endorsements”.
COLLECTIONS OF DOCUMENTS
You may make a collection consisting of the Document and other documents released underthis License, and replace the individual copies of this License in the various documents with asingle copy that is included in the collection, provided that you follow the rules of this Licensefor verbatim copying of each of the documents in all other respects.
You may extract a single document from such a collection, and distribute it individually underthis License, provided you insert a copy of this License into the extracted document, and followthis License in all other respects regarding verbatim copying of that document.
AGGREGATION WITH INDEPENDENT WORKS
A compilation of the Document or its derivatives with other separate and independentdocuments or works, in or on a volume of a storage or distribution medium, is called an“aggregate” if the copyright resulting from the compilation is not used to limit the legal rightsof the compilation’s users beyond what the individual works permit. When the Document isincluded an aggregate, this License does not apply to the other works in the aggregate whichare not themselves derivative works of the Document.
If the Cover Text requirement of section A is applicable to these copies of the Document, thenif the Document is less than one half of the entire aggregate, the Document’s Cover Texts maybe placed on covers that bracket the Document within the aggregate, or the electronicequivalent of covers if the Document is in electronic form. Otherwise they must appear onprinted covers that bracket the whole aggregate.
TRANSLATION
Translation is considered a kind of modification, so you may distribute translations of theDocument under the terms of section A. Replacing Invariant Sections with translations requiresspecial permission from their copyright holders, but you may include translations of some or allInvariant Sections in addition to the original versions of these Invariant Sections. You mayinclude a translation of this License, and all the license notices in the Document, and anyWarranty Disclaimers, provided that you also include the original English version of this Licenseand the original versions of those notices and disclaimers. In case of a disagreement betweenthe translation and the original version of this License or a notice or disclaimer, the originalversion will prevail.
If a section in the Document is Entitled “Acknowledgements”, “Dedications”, or “History”, therequirement (section A) to Preserve its Title (section A) will typically require changing the
681
APPENDIX A. GNU FREE DOCUMENTATION LICENSE
actual title.
TERMINATION
You may not copy, modify, sub-license, or distribute the Document except as expressly providedfor under this License. Any other attempt to copy, modify, sub-license or distribute theDocument is void, and will automatically terminate your rights under this License. However,parties who have received copies, or rights, from you under this License will not have theirlicenses terminated so long as such parties remain in full compliance.
FUTURE REVISIONS OF THIS LICENSE
The Free Software Foundation may publish new, revised versions of the GNU FreeDocumentation License from time to time. Such new versions will be similar in spirit to thepresent version, but may differ in detail to address new problems or concerns. Seehttp://www.gnu.org/copyleft/.
Each version of the License is given a distinguishing version number. If the Document specifiesthat a particular numbered version of this License “or any later version” applies to it, you havethe option of following the terms and conditions either of that specified version or of any laterversion that has been published (not as a draft) by the Free Software Foundation. If theDocument does not specify a version number of this License, you may choose any version everpublished (not as a draft) by the Free Software Foundation.
ADDENDUM: How to use this License for your documents
To use this License in a document you have written, include a copy of the License in thedocument and put the following copyright and license notices just after the title page:
Copyright c© YEAR YOUR NAME. Permission is granted to copy, distribute and/ormodify this document under the terms of the GNU Free Documentation License,Version 1.2 or any later version published by the Free Software Foundation; with noInvariant Sections, no Front-Cover Texts, and no Back-Cover Texts. A copy of thelicense is included in the section entitled “GNU Free Documentation License”.
If you have Invariant Sections, Front-Cover Texts and Back-Cover Texts, replace the“with...Texts.” line with this:
with the Invariant Sections being LIST THEIR TITLES, with the Front-Cover Texts beingLIST, and with the Back-Cover Texts being LIST.
If you have Invariant Sections without Cover Texts, or some other combination of the three,merge those two alternatives to suit the situation.
If your document contains nontrivial examples of program code, we recommend releasing theseexamples in parallel under your choice of free software license, such as the GNU General PublicLicense, to permit their use in free software.
682