Velocity Explain why we say all 3 cars are changing their velocity.
date post
19-Dec-2015Category
view
219download
0
Physics 31
Lecture 5:Motion in One Dimension
With Changing Velocity
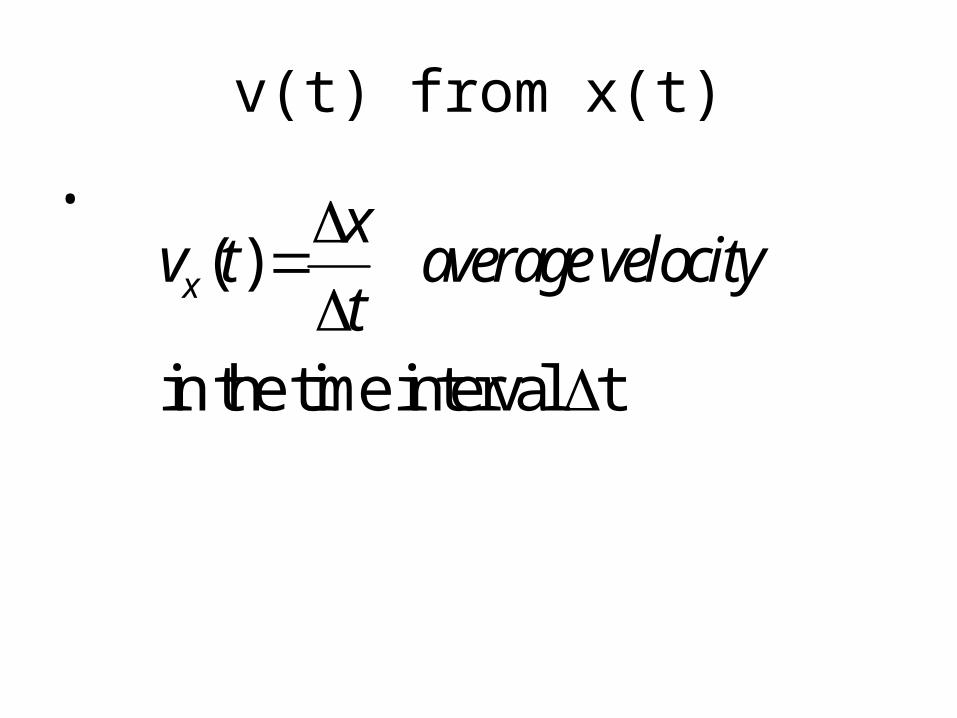
v(t) from x(t)
•
( )
in the time interval t
x
xv t average velocity
t
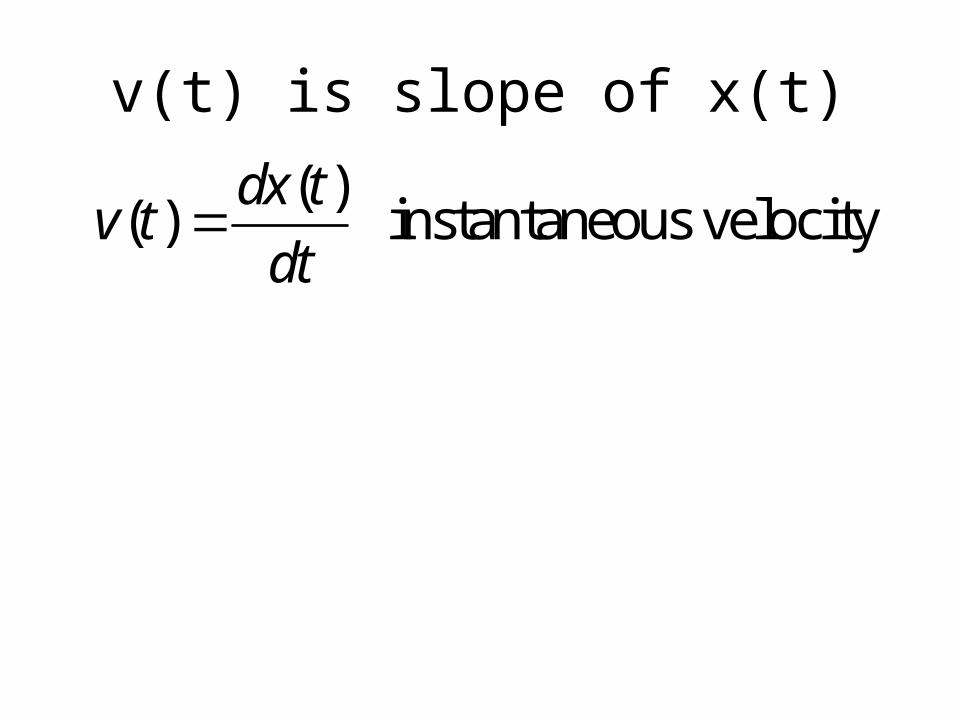
v(t) is slope of x(t)
( )( ) instantaneous velocity
dx tv t
dt

x(t) from v(t)
xx v t v(t)
ttend
What does x(t) look like?
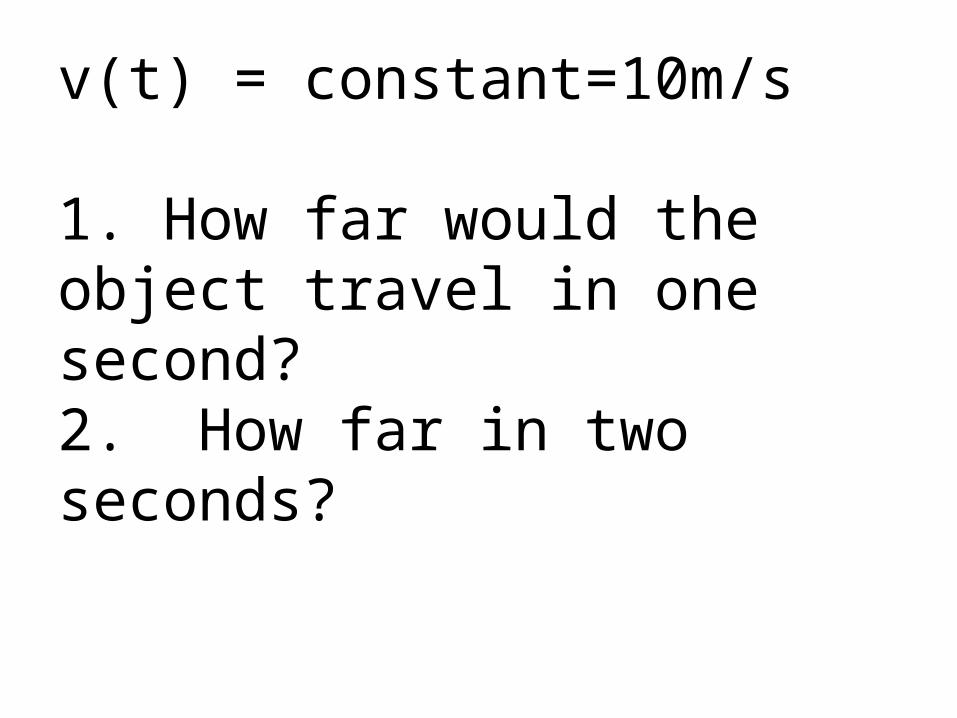
v(t) = constant=10m/s
1. How far would the object travel in one second?2. How far in two seconds?

Slope is v = constant
t
x(t)

Acceleration
Acceleration is:
• The rate of change of velocity
• The slope of a velocity-versus-time graph
Slide 2-20

These four motion diagrams show the motion of a particle along the x-axis. Rank these motion diagrams by the magnitude of the acceleration. There may be ties.
Checking Understanding
Slide 2-21
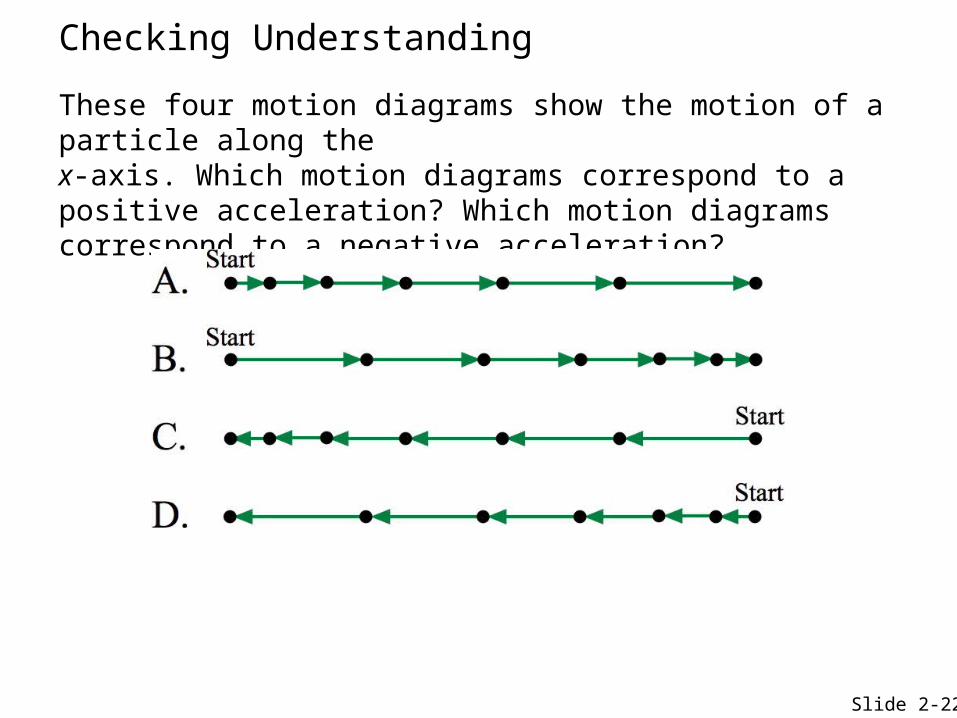
These four motion diagrams show the motion of a particle along the x-axis. Which motion diagrams correspond to a positive acceleration? Which motion diagrams correspond to a negative acceleration?
Slide 2-22
Checking Understanding
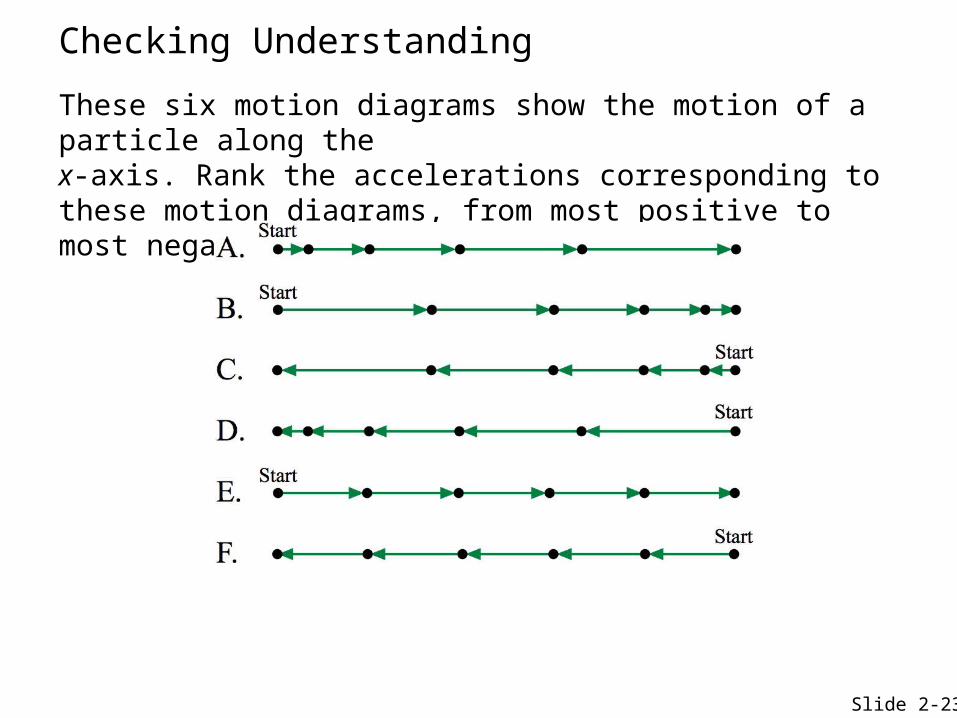
These six motion diagrams show the motion of a particle along the x-axis. Rank the accelerations corresponding to these motion diagrams, from most positive to most negative. There may be ties.
Checking Understanding
Slide 2-23
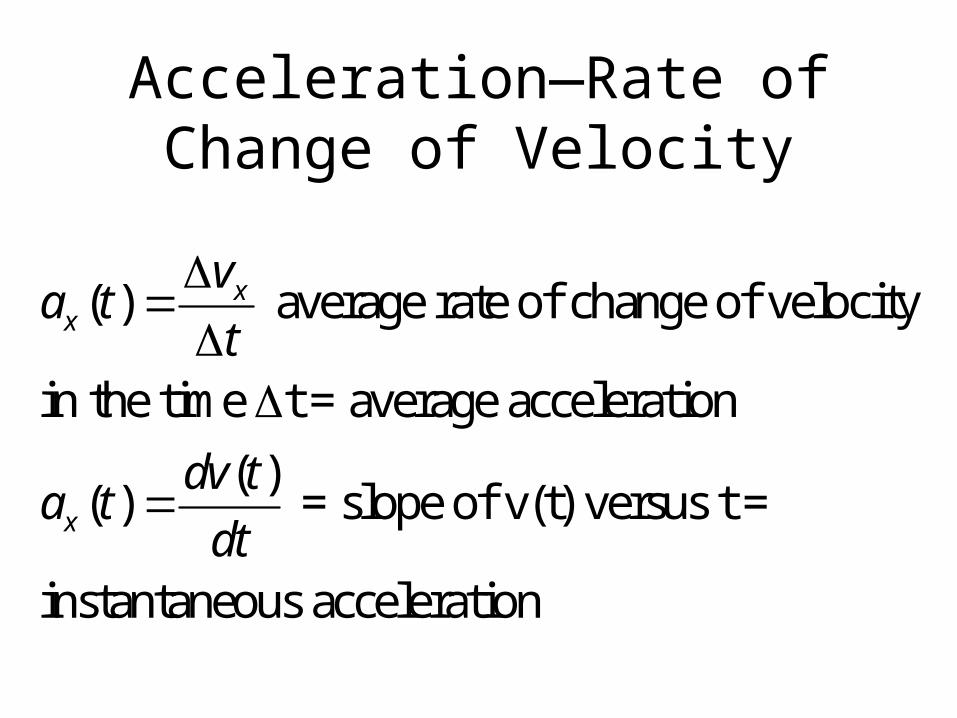
Acceleration—Rate of Change of Velocity
( ) average rate of change of velocity
in the time t = average acceleration
( )( ) = slope of v(t) versus t =
instantaneous acceleration
xx
x
va t
t
dv ta t
dt

v(t) from a(t)
( ) constant
( ) ( ) ( )
( )
f
i
t
i i f it
i
a t a
v t v t a dt v t at at
v t a t
0( )x x xv t v a t

x(t) from v(t)
x(t) is the area under the v(t) vs t curveFor constant a
2
( )
area under curve is:
( ) ( ( ))
1( )
2
f
i
f
i
x ix x
x
t
i xt
t
i ix x i ix f x ft
v t v a t
v
x t x v t dt
x v a t dt x v t a t
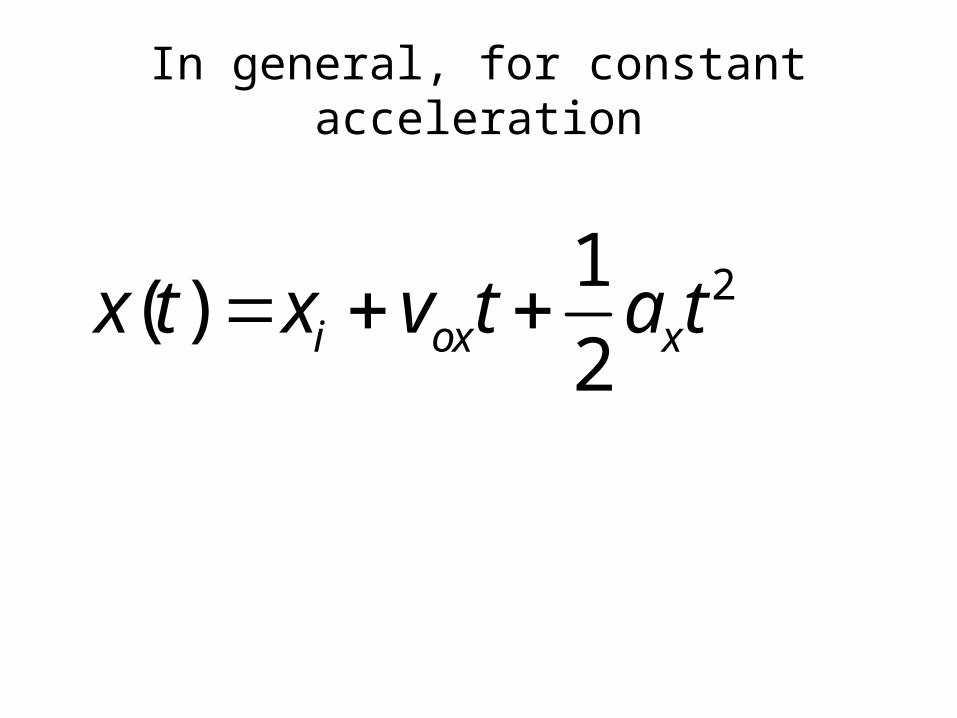
In general, for constant acceleration
21( )
2i ox xx t x v t a t
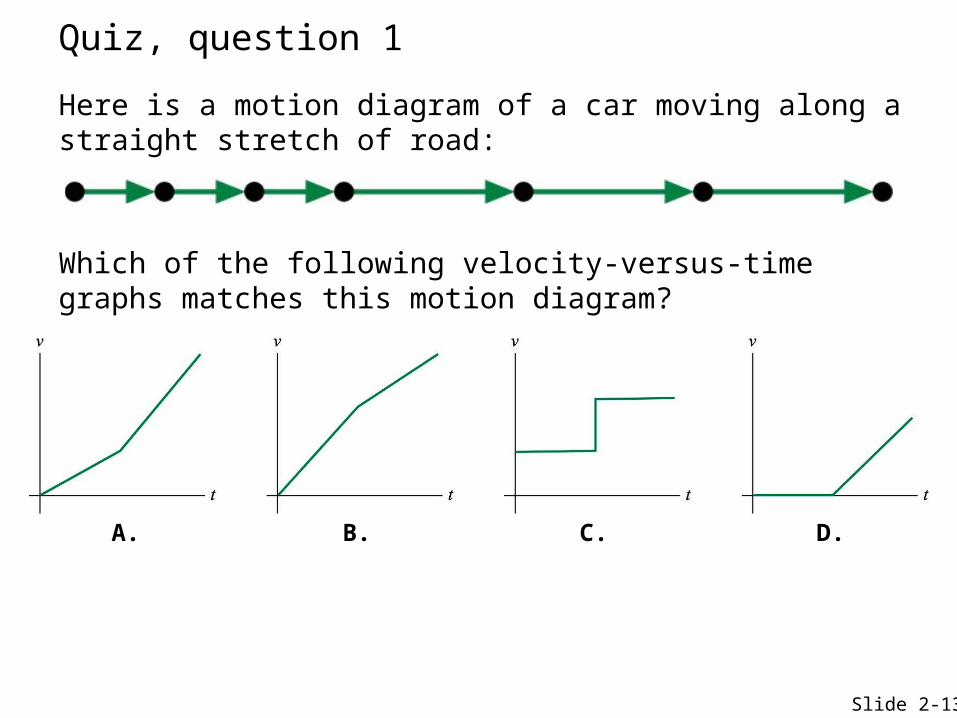
Here is a motion diagram of a car moving along a straight stretch of road:
Which of the following velocity-versus-time graphs matches this motion diagram?
Quiz, question 1
A.
Slide 2-13
B. C. D.

Question 2
Slide 2-15
A graph of position versus time for a basketball player moving down the court appears like so:
Which of the following velocity graphs matches the above position graph?
A. B. C. D.
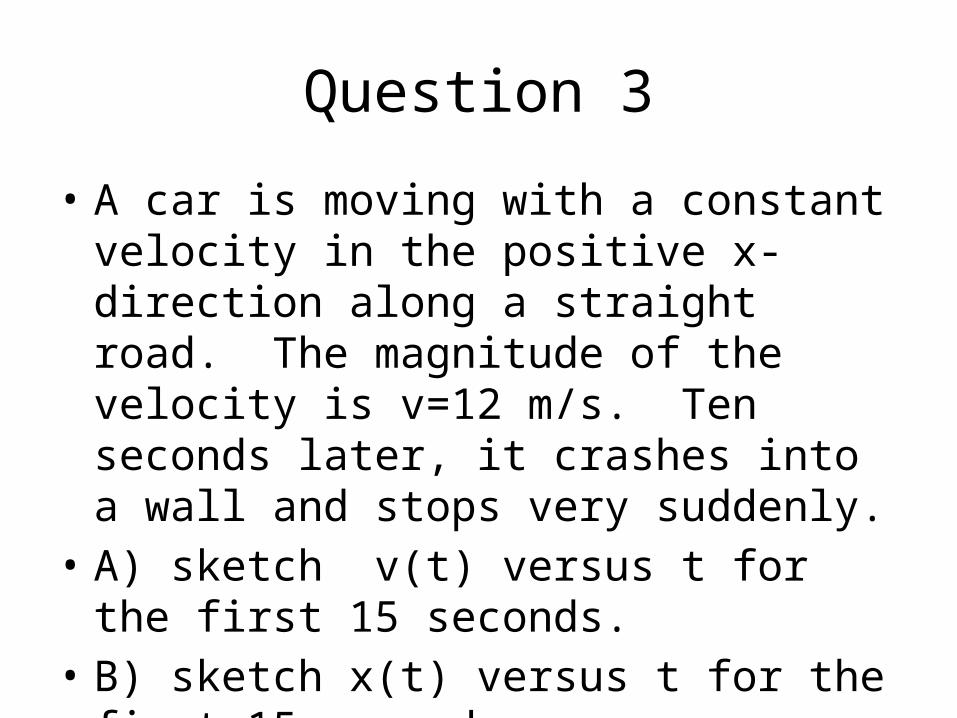
Question 3
• A car is moving with a constant velocity in the positive x-direction along a straight road. The magnitude of the velocity is v=12 m/s. Ten seconds later, it crashes into a wall and stops very suddenly.
• A) sketch v(t) versus t for the first 15 seconds.• B) sketch x(t) versus t for the first 15 seconds.

Homework due Monday
Reading 2: 3-4 Motion with constant accelerationProblems: 2: CQ1, CQ6, MC18, 1, 3, 5, 8, 12