Physics 24 Laboratory - Missouri S&T -...
14
Physics 23 Laboratory Fall 2005 General Information Physics 23 Laboratory Sections meet six times during the semester. ODD numbered sections (L01, L03, ...) one week and EVEN sections (L02, L04, ...) the following week, according the schedule below. Physics 23 Laboratory Schedule Week of ... ODD Sections L01, L03,... EVEN L02, L04, ... Aug 22-26 NO LAB NO LAB Aug 29- Sept 2 O1: Data Studio, Measurement and Errors NO LAB Sept 5 – 9 Sept No Classes Labor Day NO LAB E1: Data Studio, Measurement and Errors, Free Fall NO LABS FOR L02, L04, L06. Make-up on Nov 21 Sept 12 - 16 O2: Projectile Motion NO LAB Sept 19 - 23 NO LAB E2: One Dimensional Motion with Constant Acceleration Sept 26 - 30 O3: Friction NO LAB Oct 3 - 7 NO LAB E3: Shear Modulus Oct 10 - 14 O4: Collisions, Impulse NO LAB Oct 17 - 21 NO LAB E4: Archimedes’ Principle Oct 24 - 28 O5: Rotation with constant a NO LAB Oct 31 – Nov 4 NO LAB E5: Rotational Collisions 1
Transcript of Physics 24 Laboratory - Missouri S&T -...
Physics 23 LaboratoryFall 2005
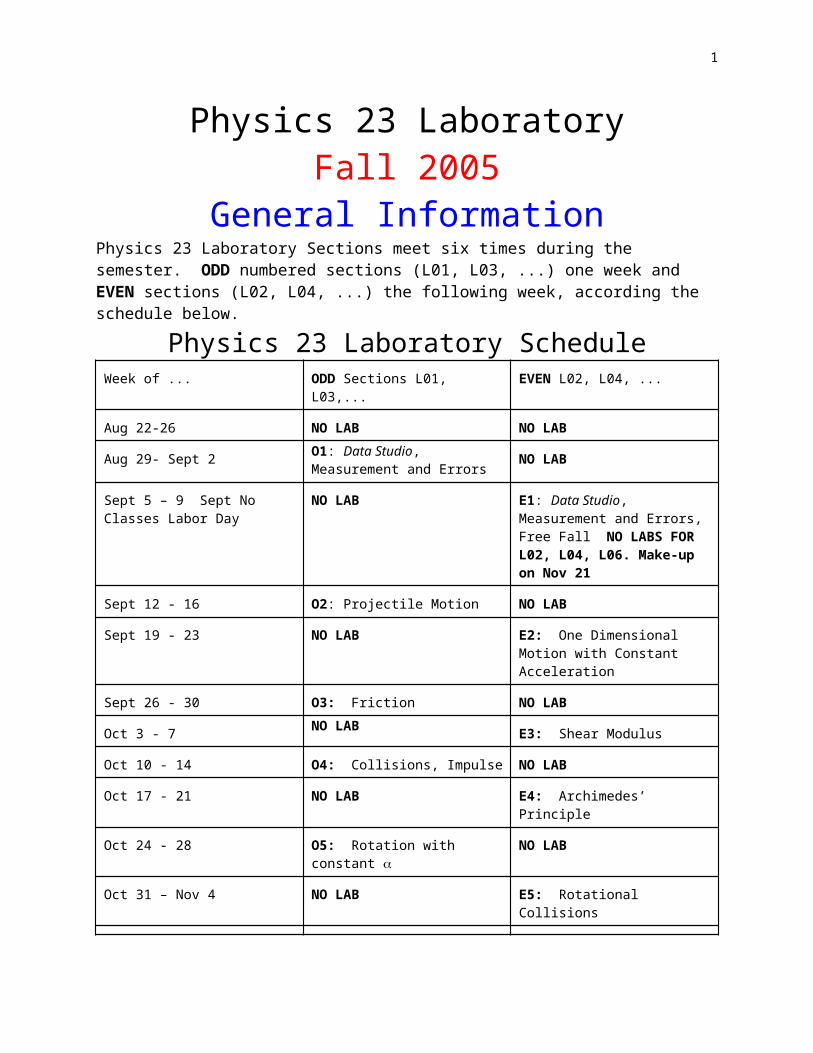
General InformationPhysics 23 Laboratory Sections meet six times during the semester. ODD numbered sections (L01, L03, ...) one week and EVEN sections (L02, L04, ...) the following week, according the schedule below.
Physics 23 Laboratory ScheduleWeek of ... ODD Sections L01, L03,... EVEN L02, L04, ...
Aug 22-26 NO LAB NO LAB
Aug 29- Sept 2 O1: Data Studio, Measurement and Errors NO LAB
Sept 5 – 9 Sept No Classes Labor Day
NO LAB E1: Data Studio, Measurement and Errors, Free Fall NO LABS FOR L02, L04, L06. Make-up on Nov 21
Sept 12 - 16 O2: Projectile Motion NO LAB
Sept 19 - 23 NO LAB E2: One Dimensional Motion with Constant Acceleration
Sept 26 - 30 O3: Friction NO LAB
Oct 3 - 7 NO LAB E3: Shear Modulus
Oct 10 - 14 O4: Collisions, Impulse NO LAB
Oct 17 - 21 NO LAB E4: Archimedes’ Principle
Oct 24 - 28 O5: Rotation with constant a NO LAB
Oct 31 – Nov 4 NO LAB E5: Rotational Collisions
Nov 7 - 11 O6: Oscillatory Motion-The Pendulum
NO LAB
Nov 14 - 18 NO LAB E6: Resonance-Standing Waves
Nov 21 – 22Thanksgiving break
Monday, Makeup for L02, L04, L06 No labs for other sections.
Monday, Makeup for L02, L04, L06 No labs for other sections.
Nov 28 – Dec 2Makeup Labs ALL Sections
Makeup Labs-Sign Up before NOON, Tuesday, Nov 22
Makeup Labs-Sign Up before NOON, Tuesday, Nov 22
Dec 5 - 9 NO LAB-Last week of classes NO LAB-last week of Classes
Dec 12 - 16 NO LAB-Final Exam Week NO LAB-Final Exam Week
1

Your total lab score ( six laboratories and reports at 100 points each ) for 600 possible points. You will be informed by Prof. Vojta how these points contribute to your 23 course grade. There is no separate grade for the laboratory part of Physics 23.The laboratory exercises are designed to be completed during the two-hour laboratory session. This includes making the measurements and writing the report. A sample laboratory report appears at the end of this document.
Your recitation instructor will return laboratory reports to you. It is your responsibility to keep a file of the reports returned to you in case of an error in recording your grade. If you wish to dispute the grading of a laboratory report, you must state your question or complaint in writing and return it to your recitation instructor the day of the report’s return to you. Your laboratory instructor will NOT accept reports for re-grading.
Laboratory Absences are to be handled by completing a make up lab during the scheduled make up sessions. YOU MUST SIGN UP IN ADVANCE FOR MAKE-UP LABS on a sheet that will be posted on the board outside room 215. You may make up ONLY ONE lab during the semester.
Laboratory Report Check List:
IN GENERAL: Laboratory reports are to be written in the passive voice as is standard for scientific reports. “The voltage was measured and recorded.” NOT “We measured the voltage.” See sample report below. This report also reviews how to transfer data and plots from Data Studio to an EXCEL spreadsheet. As you proceed, make sure you save files (Data Studio and WORD or EXCEL files to your account on C/.temp/filename. You may wish to bring a CDROM to save an archival copy of your finished report. This will allow you to recover them in the event of a crash. ONLY ONE COPY of lab report need be submitted for each team. HOWEVER, there must be a cover page attached for EACH team member.
Cover Sheet: Fill out information required. Be sure that you have a cover sheet with your name listed under “NAME” and your partner’s name in the appropriate place. If your copy does not have your name in the correct place, you will not receive credit for the lab report. There must be a cover page attached for EACH team member.
Objectives: This section may be supplied, in whole or part, or you will need to supply it after you understand the purpose of the laboratory exercise.
Reading: References to your textbook relevant to this lab. Include page references.
Introduction: A brief summary of the concepts needed, and how the measurements were performed and analyzed. This section should probably be written, at least in part, after performing the measurements and analysis.
Apparatus: List apparatus used, including any software required. There should be a schematic diagram (may be hand drawn) of the apparatus.
2
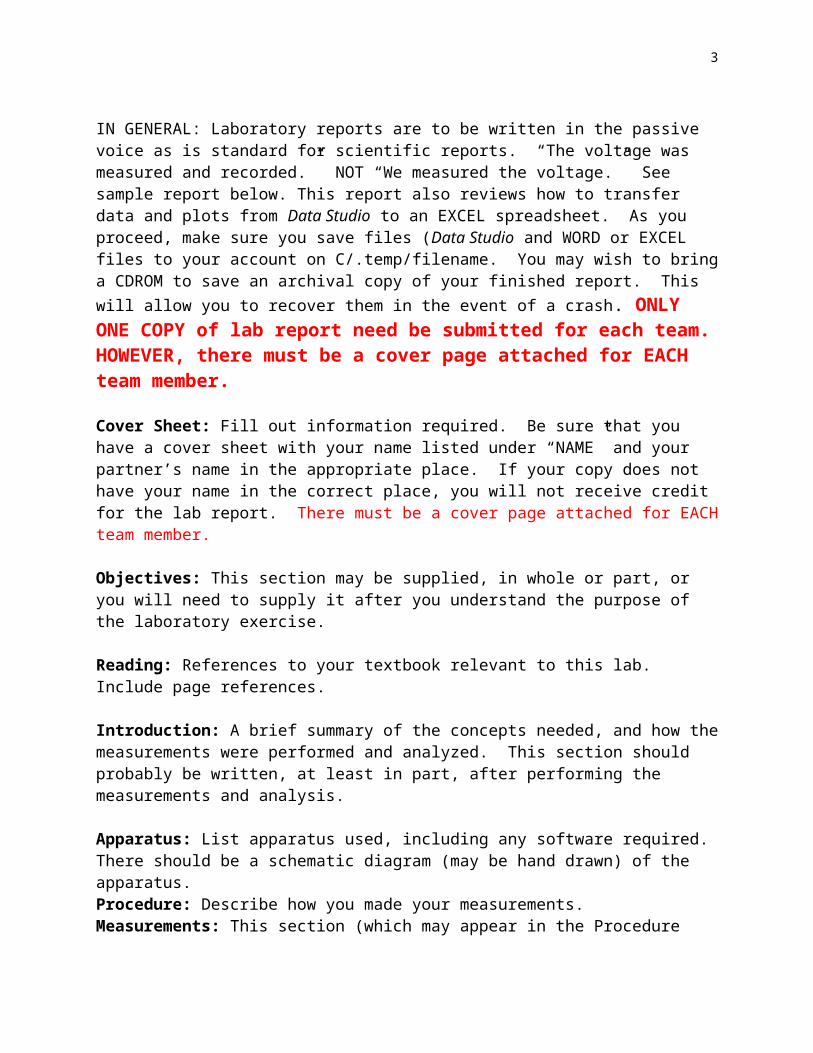
Procedure: Describe how you made your measurements. Measurements: This section (which may appear in the Procedure section) should include your measurements, often in tabular form. What is in the table should be clearly labeled and the table must have a title. (Tables may be copied from Data Studio into EXCEL for some experiments, calculations done and results copy into WORD.) Units need to be included. Graphs may also be appropriate and should have a title and axes labeled.
Analysis: This section should describe what you did to interpret your measurements and derive some quantity, g for example. Also included should be any appropriate analysis of errors. Needed equations should be presented with a reference to your text.
Conclusions: Include a brief summary of your procedure and analysis. Comment on your error analysis. Connect
Proper grammar and spelling are expected, as well clarity and organization.
Course Credit Information
Laboratory points: Six labs and reports @ 100 points/lab = 600 points
Resources:1. Your primary resource is your laboratory instructor. At the first laboratory meeting he or she will provide you with his or her office hours.2. Dr. Ralph Alexander, 204 Physics, 341-4796, My office hours are Monday, Wednesday and Friday, 10:30-11:30, and Wednesday and Friday1:00-2:00. I am usually in my office and you are welcome to drop in. Or to be sure I am there, email for an appointment.3. Dr. Don Hagen, G-7 Norwood Hall, 341-4351, Office Hours are Mondays, Wednesdays and Fridays: 2:30-3:30pm, Thursdays 9:30-10:30am and Fridays 11:30-12:303. The Physics 23 Learning Center can also provide help with the laboratory. The hours are Tuesdays and Thursdays, 2:30-5:00pm and 6:00-8:30pm.4. Your recitation instructor or Dr. Vojta can also help with laboratory questions.
Contact Persons:1. If you have difficulty understanding your laboratory instructor’s language, contact Dr. Alexander, 204 Physics, 341-4796, or Dr. Paul Parris, chairman, Physics, 101 Physics, 341-4790, 2. If you are unable to resolve a problem by talking with your laboratory assistant, contact Dr. Alexander, 204 Physics, 341-4796, or Dr. Don Hagen, G-7 Norwood Hall, 341-4351, or Dr. Paul Parris, Chairman, Physics, 101 Physics, 341-4790, or Dr. Paula Lutz, Dean, College of Arts and Sciences, 121 Fulton Hall, 341-4131, [email protected]
SAMPLE LAB REPORT: Sample instructions given to the student for the lab appear on the next page, followed by a sample of a completed lab report.
3

PHYSICS 23 LABORATORY
LAB X1: Detection of Alien Lab Partners Using Heartbeat Monitors
NAME: DATE:
Partner’s Name:
Laboratory Instructor:
Laboratory Section:
Recitation Instructor:
Recitation Section:
OBJECTIVES: 1. Determine the feasibility of using waveform of heartbeat to detect aliens from Mars.
2. To illustrate how to transfer plots from Data Studio to a WORD document
Important Words:
You supply.
Reading:Supply the appropriate reference to your textbook. Title, Author, Page(s).
Introduction:Vice President Cheney has suggested that aliens from Mars have infiltrated U.S
universities. Although no funding for this purpose has been provided, a method of detecting Martians is needed. Check to see if the waveform of your partner’s heartbeat suggests he or she is a Martian resident.Apparatus:Procedure:Measurements:Analysis:Conclusions: (These are the instructions received by the student. On the pages below is the completed lab report.)
4
PHYSICS 23 LABORATORY
LAB X1: Detection of Alien Lab Partners Using Heartbeat Monitors
NAME: Torrac Hsiddar DATE: May 17, 2020
Partner’s Name: Joe Smith
Laboratory Instructor: Jane Doe
Laboratory Section: L05
Recitation Instructor: Dr. Alexander
Recitation Section: C
OBJECTIVES: 1. Determine the feasibility of using the waveform of a heartbeat to detect aliens from
Mars. It has been suggested that the waveform of the heartbeat of a Martian differs from that of Earth dwellers. In this laboratory exercise, the waveform of a lab partner will be measured and analyzed to determine if it is unusual in any way.
2. To illustrate how to transfer plots from Data Studio to a WORD document.
Important Words:
1. Martian: A permanent resident of Mars.2. Heartbeat: The rhythmic contraction of the circulatory pump of an animal. It may be detected in a number of ways. In this laboratory exercise, the changes in optical transparency of the earlobe or finger web will be used.3. Fourier series: A method of analyzing a periodic waveform by writing it as the sum of
sine and cosine waves whose frequencies are harmonic (i.e. the frequencies are all integer multiples of a fundamental frequency.
4. Period: the time between the peaks of a periodic waveform.
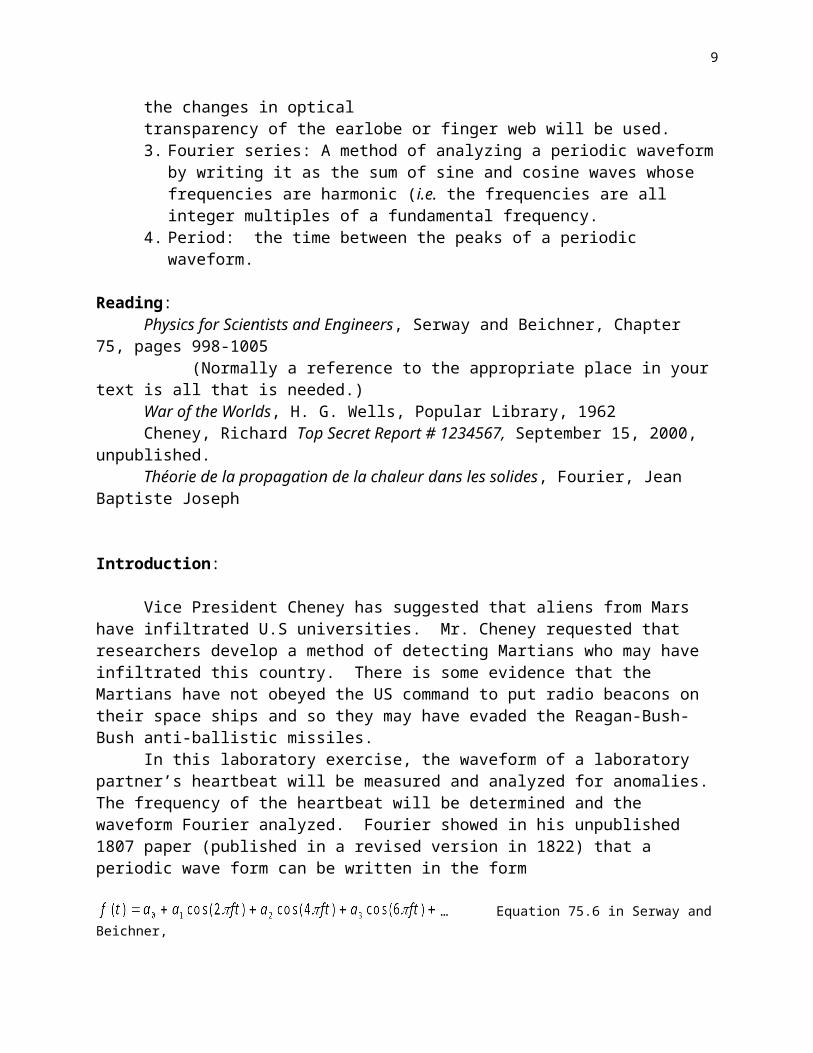
Reading:Physics for Scientists and Engineers, Serway and Beichner, Chapter 75, pages 998-1005
(Normally a reference to the appropriate place in your text is all that is needed.)War of the Worlds, H. G. Wells, Popular Library, 1962Cheney, Richard Top Secret Report # 1234567, September 15, 2000, unpublished.Théorie de la propagation de la chaleur dans les solides, Fourier, Jean Baptiste Joseph
5

Introduction:
Vice President Cheney has suggested that aliens from Mars have infiltrated U.S universities. Mr. Cheney requested that researchers develop a method of detecting Martians who may have infiltrated this country. There is some evidence that the Martians have not obeyed the US command to put radio beacons on their space ships and so they may have evaded the Reagan-Bush-Bush anti-ballistic missiles.
In this laboratory exercise, the waveform of a laboratory partner’s heartbeat will be measured and analyzed for anomalies. The frequency of the heartbeat will be determined and the waveform Fourier analyzed. Fourier showed in his unpublished 1807 paper (published in a revised version in 1822) that a periodic wave form can be written in the form
… Equation 75.6 in Serway and Beichner, page1005
We will use the Fourier Transform feature of Data Studio to see if these series coefficients, ai, of our partner’s heartbeat show any anomalies suggesting a Martian.
Apparatus: Data Studio software, computer and Science Workshop 750 interface and PASCO heartbeat monitor.
Procedure:1. Using Data Studio, the heartbeat monitor was selected from the menu of sensors and
attached to port A. A graph was dragged to port A as was a table. The graph and table displayed the measured voltage from the sensor. The sensor was clipped to the webbing between the fingers of my lab partner. A measurement was started and stopped after 60 seconds.
2. The FFT (Fast Fourier Transform) was dragged to port A to calculate the Fourier Transform of the heartbeat waveform.
Measurements:
Heart Rate Sensor
1.5
1.7
1.9
2.1
2.3
2.5
2.7
0 2 4 6 8 10 12
Time (seconds)
Volta
ge (v
olts
)
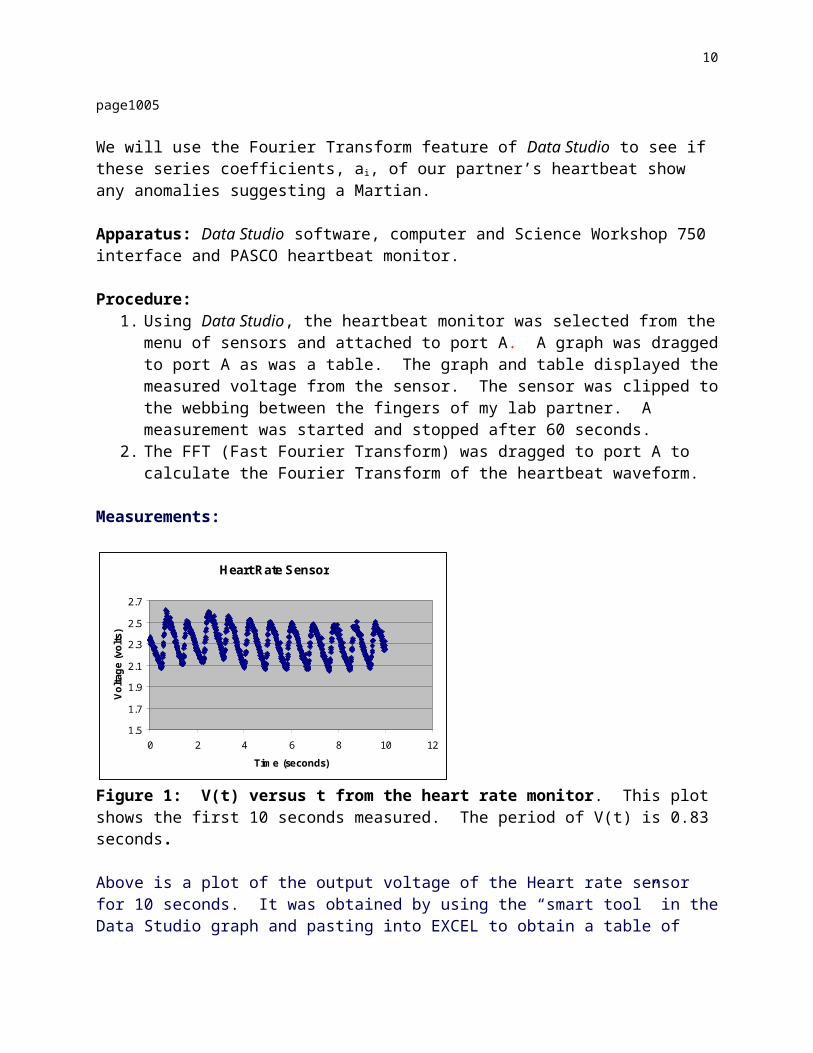
Figure 1: V(t) versus t from the heart rate monitor. This plot shows the first 10 seconds
6
measured. The period of V(t) is 0.83 seconds.
Above is a plot of the output voltage of the Heart rate sensor for 10 seconds. It was obtained by using the “smart tool” in the Data Studio graph and pasting into EXCEL to obtain a table of numbers, (time and voltage.) This was plotted using EXCEL and pasted in here. A short section of the table used in this plot was copied from EXCEL and pasted in below.
The graph generated by the FFT program in Data Studio was pasted (as a table) into EXCEL and plotted as shown. The y-axis, labeled amplitude, is the coefficients ai of the Fourier series.
Fourier Coefficients
0
0.2
0.4
0.6
0.8
1
1.2
0 1 2 3 4 5 6
Frequency (Hz)
Ampl
itude
Figure 2: Fourier coefficients ai from the FFT program.Only points for frequencies less than 5 Hz were kept. The point a0 was discarded as it was much larger than the other coefficients. a0 represents the average value of the V(t) versus t plot. Note the peak at about 1.2 Hz which is the fundamental frequency. Harmonics can be seen at 2.3 and 3.4 Hz, the second and third harmonics of 1.2 Hz.
Alternative method of inserting plots from Data Studio:
Another method of transferring a plot from Data Studio is to go to the plot window and chose “Display” from the menu bar and then “Export picture” from the drop down menu. Save the file to the name you give it. Now open an EXCEL file and chose “Insert” from the menu bar and “Object” and “Create from file” and provide the name of the file you just created in Data Studio. Shown below are the FFT plot of the Fourier series coefficients, ai and below that the V(t) versus t graph from Data Studio.Continued next page
7

Figure 1: Fourier coefficients ai from the FFT program.Only points for frequencies less than 3.5 Hz were kept. The point a0 was discarded as it was much larger than the other coefficients. a0 represents the average value of the V(t) versus t plot. Note the peak at about 1.2 Hz which is the fundamental frequency. Harmonics can be seen at 2.3 and 3.4 Hz, the second and third harmonics of 1.2 Hz.
Figure 2: V(t) versus t from the heart rate monitor. This plot shows all 60 seconds measured. The period of V(t) is 0.83 seconds.
END OF ALTERNATIVE SECTION
8
Here is a short section of the V(t) versus t table pasted from Excel which was promised above. This was included just to show that it could be done.
Voltage, ChA, Run #1Time ( s ) Voltage ( V )
0 2.330.01 2.3360.02 2.350.03 2.360.04 2.2950.05 2.3260.06 2.3190.07 2.3070.08 2.3320.09 2.310.1 2.294
0.11 2.3070.12 2.2850.13 2.2690.14 2.2820.15 2.2660.16 2.2630.17 2.2560.18 2.2410.19 2.2550.2 2.246
0.21 2.2550.22 2.2620.23 2.2360.24 2.2070.25 2.2220.26 2.201
Analysis:When the heart rate monitor is examined, it appears to be a small light source and a light detector. The transparency, and hence the amount of light transmitted, by the finger web of my partner changes with blood flow, producing the voltage, V(t) as a function of t shown in Figure 1 (alternative Figure 2) above. There is a clearly observable periodicity to the function. From the table in Data Studio, it was determined the period T = 0.833 seconds when averaged over 30 cycles. The frequency is f = 1/T = 1.2 Hz = 50 beats per minute. The FFT analysis shown in Figure 2 (alternative Figure 1) shows a plot of the Fourier coefficients ai. However, there are not plotted versus i, but against the frequency fi. It can be seen that the coefficient corresponds to a frequency fi = 1.2 Hz is the largest, with smaller peaks at twice and three times this fundamental frequency. Note this is the same frequency obtained from the V(t) versus t plot, but the FFT plot shows the presence of the harmonics. As V(t) was measured for 60 seconds or 50 heartbeats, the period is expected to have an uncertainty of 1/50 or 2 per cent and since f=1/T, it also has an uncertainty of two per cent. Hence f = 50 +/- 1 Hz.
9
Conclusions:The measurements show my lab partner to have a heart rate of 50 beats per minute, which does not rule out his being from the Earth. The presence of the second and third harmonics is also expected and does not indicate that he is a Martian. Hence, despite his appearance, he does not seem to be a Martian based upon his measured heat beat. Mr. Cheney can leave his cave safely, apparently.
10