Physicochemical Behaviour of Artificial Lime Stabilised...
233
Buttress, Adam James (2013) Physicochemical behaviour of artificial lime stabilised sulfate bearing cohesive soils. PhD thesis, University of Nottingham. Access from the University of Nottingham repository: http://eprints.nottingham.ac.uk/14463/1/Physicochemical_Behaviour_of_Artificial_Lime_Stab ilised_Sulfate_Bearing_Cohesive_Soils.pdf Copyright and reuse: The Nottingham ePrints service makes this work by researchers of the University of Nottingham available open access under the following conditions. This article is made available under the University of Nottingham End User licence and may be reused according to the conditions of the licence. For more details see: http://eprints.nottingham.ac.uk/end_user_agreement.pdf For more information, please contact [email protected]
Transcript of Physicochemical Behaviour of Artificial Lime Stabilised...
Buttress, Adam James (2013) Physicochemical behaviour of artificial lime stabilised sulfate bearing cohesive soils. PhD thesis, University of Nottingham.
Access from the University of Nottingham repository: http://eprints.nottingham.ac.uk/14463/1/Physicochemical_Behaviour_of_Artificial_Lime_Stabilised_Sulfate_Bearing_Cohesive_Soils.pdf
Copyright and reuse:
The Nottingham ePrints service makes this work by researchers of the University of Nottingham available open access under the following conditions.
This article is made available under the University of Nottingham End User licence and may be reused according to the conditions of the licence. For more details see: http://eprints.nottingham.ac.uk/end_user_agreement.pdf
For more information, please contact [email protected]
Physicochemical Behaviour ofArtificial Lime Stabilised Sulfate
Bearing Cohesive Soils
Adam James Buttress BSc. MRSCJanuary, 2013
Thesis submitted to the University of Nottingham for the degree
of Doctor of Philosophy
ii
ABSTRACT
Soil stabilisation is a useful civil engineering technique that enables the insitu material to
be used as part of an engineered structure. Stabilised layers are used in road foundation;
working platforms and for slope stabilisation and sea defences. Chemical stabilisation
involves the use of a hydraulic binder (and sometimes additional pozzolans). Commonly,
quicklime (CaO) or slaked-lime (Ca(OH)2) is used. On mixing into the ground, this reacts
with the aluminosilicates of the clay fraction, reducing its overall water content and
plasticity. Further additions increase the insitu pH. Above pH 10.4, the aluminosilicates
become soluble in the pore solution. They are then able to form a range of insoluble
mineral hydrates which constitute a cementitious matrix. This results in both an increase
in mechanical strength and a decrease in dimensional stability.
If the insitu material contains sulfur bearing mineralogies, these can react with the
hydraulic binder and the aluminosilicates to form expansive minerals. If this occurs after
the initial setting and hardening of the stabilised layer has occurred, it can lead to severe
dimensional instability and mechanical weakening. This is termed sulfate heave and the
principal agent of this heave is a hydrous calcium sulfoaluminate hydrate, ettringite (AFt).
The fundamental processes of ettringite formation and associated expansion are little
understood in stabilised soils.
This research used a range of artificial sulfate bearing, lime stabilised blended soil
samples subject to two immersion tests used for material suitability assessment in the
UK. The physicochemical response (in terms of dimensional heave and mechanical
weakening) was assessed as a function of soil composition and the environmental
conditions imposed by the two immersion tests. The fundamental microstructure and
phase composition was characterised using a range of analytical techniques (XRD, SEM-
EDX, dTGA). The relationship between the observed macro-physical properties and
underlying chemical environment and microstructure was explored.
Key findings include that the mechanism of ettringite formation and expansion was found
to be governed by the fundamental structure of the bulk clay. This explained the greater
swell response of the kaolin based soils compared to those of the montmorillonite. The
SEM-EDX analysis identified a primitive, Ca-rich, AFt phase termed ‘ball ettringite’, in
stabilised soils. This has only relatively recently been reported in studies of cement
mortars. Also, small amounts of sulfate in the bulk soil actually increase soil strength. It
was suggested that the preferential formation of monosulfate (AFm) plays an important
role in this mechanism. The introduction of water to the pore solution is key to the

formation of ettringite. This was evidenced by X-Ray CT of the damage caused to soil
specimens on immersion, as well as low angle XRD studies of the principal AFt peak.
Based on the limited testing undertaken one of the immersion tests (European
accelerated volumetic swell test, EN13286-49), appears to be more onerous than the
other (UK CBR linear swell test, BS1924-2).

iv
ACKNOWLEDGEMENTS
The author would like to acknowledge the early support for this work by URS Corp and
subsequently, the Engineering and Physical Sciences Research Council (EPSRC) for
their further funding of this research.
I would like to thank my academic supervisors Prof. Gordon Airey and Dr. James Grenfell
for their invaluable help and light-hearted banter over the last five years.
I would particularly like to thank Dr.’s P.E and J. Edwards. They gave me the opportunity
to start this work and I am greatful for their support and encouragement during its
undertaking.
Thanks also to the staff of the Department of Mechanical, Materials and Manufacturing
Engineering at the University of Nottingham, in particular Dr. Nigel Neate, who has
always taken the time to assist me with the analysis of a never-ending stream of samples.

Finally, special thanks go to
Lisa Dring, Beau, plus work-in-progress.... it’s finally finished!!
Dedicated to the memory of George Henry Allen, (1927 – 2009).

vi
“The most exciting phrase to hear in science, the one that heralds the most discoveries, is
not “Eureka!” (I found it!) but “That’s funny…”
Isaac Asimov (1920 – 1992)
TABLE OF CONTENTS
1. Introduction ................................................................................................. 13
1.1. Problem Statement ............................................................................................... 13
1.2. Aim and Objectives............................................................................................... 14
1.2.1. Aim .................................................................................................................. 14
1.2.2. Objectives ....................................................................................................... 15
1.3. Thesis Structure.................................................................................................... 15
2. Background................................................................................................. 18
2.1. Pavement Structure and Basic Design Considerations........................................ 18
2.2. Composition of Natural Soils ................................................................................ 21
2.3. Clay Mineralogy .................................................................................................... 22
2.3.1. Formation of clay materials............................................................................. 22
2.3.2. Structure and swelling characteristics ............................................................ 25
2.4. Soil Stabilisation ................................................................................................... 29
2.4.1. Definition and applications .............................................................................. 29
2.4.2. Chemical principles of lime stabilisation ......................................................... 31
2.4.3. Deleterious processes affecting stabilised soils ............................................. 33
2.5. Summary .............................................................................................................. 34
3. Literature Review........................................................................................ 37
3.1. Introduction ........................................................................................................... 37
3.2. Case Studies of Sulfate Heave Failures............................................................... 37
3.3. Structure of Ettringite and Monosulfate ................................................................ 38
3.4. Formation of Ettringite in Portland Cement .......................................................... 40
3.4.1. Physico-chemical factors affecting cementitious reactions ............................ 41
3.4.2. Ettringite formation.......................................................................................... 42
3.4.3. Hydration of tricalcium aluminate.................................................................... 43
3.4.4. Sulfate attack on cementitious systems and Delayed Ettringite Formation
(DEF) 45
3.5. Formation of Ettringite in Stabilised Soils ............................................................. 46
3.6. Mechanisms of Formation and Expansion ........................................................... 49
3.6.1. Topochemical Mechanism .............................................................................. 49
3.6.2. Through-solution mechanism.......................................................................... 50
3.6.3. Theories of Expansion .................................................................................... 52
3.7. Mitigtion of Sulfate Heave..................................................................................... 53
viii
3.8. Other factors Affecting Formation and Expansion ................................................54
3.8.1. Sulfate type and concentration........................................................................54
3.8.2. Soil pH.............................................................................................................58
3.8.3. Clay mineralogy...............................................................................................58
3.9. Laboratory Test Methods ......................................................................................59
3.10. Laboratory Studies of Sulfate Heave in Stabilised Soils.......................................62
3.11. Summary...............................................................................................................65
4. Materals and Methods.................................................................................66
4.1. Introduction ...........................................................................................................66
4.2. Materials................................................................................................................66
4.2.1. Material classification ......................................................................................68
4.2.2. Mixture design .................................................................................................69
4.3. Macrophysical Property Testing............................................................................72
4.3.1. Introduction......................................................................................................72
4.3.2. UK Soaked CBR Swell test Procedure (BS1924-2)........................................73
4.3.3. European Accelerated Volumetric Test (EN13286-49)...................................75
4.3.4. Summary .........................................................................................................77
4.4. Early Age Study ....................................................................................................78
4.4.1. Introduction......................................................................................................78
4.4.2. Methodology....................................................................................................79
4.5. Analytical Methodology .........................................................................................79
4.5.1. Sample Preparation ........................................................................................80
4.5.2. X-Ray Diffraction (XRD) ..................................................................................80
4.5.3. Scanning Electron Microscope and Energy Dispersive X-ray Analysis (SEM-
EDX) 81
4.5.4. Differential Thermal Gravimetric Analysis (DTGA) .........................................82
4.5.5. X-Ray Computer Tomography ........................................................................82
5. Macrophysical Property Testing ..................................................................84
5.1. Introduction ...........................................................................................................84
5.2. Physical Response to the UK Linear CBR Swell Test (BS1924-2) ......................84
5.2.1. Early age linear swell at 7 days immersion.....................................................84
5.2.2. Soil strength (CBR value) after 7 days immersion ..........................................87
5.2.3. Linear swell over extended 28 days immersion ..............................................89
5.2.4. Soil strengths (CBR value) after 28 days immersion ......................................91
5.2.5. Selected long-term (9 month) swell tests ........................................................92
5.3. Physical Response to the European Accelerated Swell Test (EN13286-49) .......95
5.3.1. Kaolin based soils ...........................................................................................95
5.3.2. Montmorillonite based soils .............................................................................96
5.4. Discussion ............................................................................................................ 98
5.5. Summary ............................................................................................................ 104
6. Phase Composition and Microstructure..................................................... 106
6.1. Introduction ......................................................................................................... 106
6.2. X-Ray Diffraction................................................................................................. 106
6.2.1. Kaolin soils (UK linear CBR swell test) ......................................................... 107
6.2.2. Montmorillonite Soils (UK linear CBR swell test) .......................................... 108
6.2.3. European accelerated volumetric test .......................................................... 110
6.2.4. Low angle studies ......................................................................................... 113
6.2.5. Long term testing .......................................................................................... 116
6.2.6. Discussion..................................................................................................... 118
6.3. Thermal Gravimetric Analysis (TGA).................................................................. 120
6.3.1. Control soils .................................................................................................. 121
6.3.2. Lime stabilised sulfate soils .......................................................................... 123
6.3.3. Discussion..................................................................................................... 127
6.4. SEM-EDX ........................................................................................................... 130
6.4.1. Introduction ................................................................................................... 130
6.4.2. Control Soils.................................................................................................. 131
6.4.3. High sulfate ................................................................................................... 133
6.4.4. Medium sulfate.............................................................................................. 138
6.4.5. Low sulfate .................................................................................................... 141
6.4.6. Long term tests ............................................................................................. 148
6.4.7. Discussion..................................................................................................... 150
6.5. Summary ............................................................................................................ 152
7. Time Dependent Study using European Accelerated Volumetric Swell Test
(EN13286-49) .................................................................................................. 154
7.1. Volumetric Swell Testing .................................................................................... 155
7.2. Microstructural Analysis by X-Ray CT ................................................................ 157
7.3. X-Ray Diffraction................................................................................................. 159
7.4. Thermalgravimetric Analysis .............................................................................. 161
7.5. SEM-EDX Analysis ............................................................................................. 165
7.5.1. High Sulfate Kaolin Soil (K4L5S) .................................................................. 165
7.5.2. High Sulfate Montmorillonite soil (M6L5S).................................................... 172
7.6. Discussion .......................................................................................................... 178
7.7. Summary ............................................................................................................ 181
8. MacroPhysical, Microstructural and Chemical Relationships..................... 183
8.1. Introduction ......................................................................................................... 183
x
8.2. Ettringite Quantification.......................................................................................183
8.3. Ettringite Induced Heave and Soil Sulafte Content.............................................186
8.3.1. UK linear CBR swell test ...............................................................................186
8.3.2. European accelerated volumetric swell test..................................................190
8.4. Mechanism of Ettringite Growth and Expansion.................................................191
8.5. Other Factors Affecting the Physicochemical Response....................................193
8.5.1. Clay mineralogy.............................................................................................193
8.5.2. Sulfate content ..............................................................................................195
8.5.3. Swell test conditions......................................................................................195
9. Conclusions and Recommendations for Further Work ..............................197
REFERENCES ................................................................................................202
Appendix A - Material Classification and Mixture Testing.................................222
Appendix B - Synthetic Ettringite......................................................................229
Appendix C - Soil Composition by Fused Bead XRF........................................232
GLOSSARY OF TERMS
ACEC Aggressive Chemical Environment Class
AFt Ettringite.
AFm Monosulfate
AFmc Carbo-substituted AFm (Friedel’s Salt)
AS Amorphous Silica
ASTM American Society for Testing and Materials
ASS Acid Soluble Sulfate
BRE Building Research Establishment
BS British Standard
BSI British Standards Institute
CAH Calcium Alumina Hydrate
CASH Calcium Alumina Silicate Hydrate
CBR California Bearing Ratio
CEC Cation Exchange Capacity
CPS Counts per Second
CSH Calcium Silicate Hydrate
DEF Delayed Ettringite Formation
DoT Department of Transport
DMRB Design Manual for Roads and Bridges
DS Design Sulfate Class
DSC Differential Scanning Calorimetry
dTGA Derivative Thermo-gravimetric Analysis
EDX Energy Dispersive X-ray Spectroscopy
EN European Standard
FA Fly Ash
GGBS Ground Granulated Blast-furnace Slag
Gv Volumetric Expansion
HBM Hydraulically Bound Mixture
HL Hydrated Lime (also known as slaked lime)
ICL Initial Consumption of Lime
ICP-AES Inductively Coupled Plasma-Atomic Emission Spectroscopy
Imax Intensity Maximum
K Rate Constant
Ksp Rate Constant at equilibrium
LOI Loss on Ignition
MCHW Manual of Contract Documents for Highways Works
12
MDD Maximum Dry Density
OPC Ordinary Portland Cement
OWC Optimum Water Content
PI Plasticity Index
PQC Pavement Quality Concrete
PSD Particle Size Distribution
PFA Pulverised Fuel-Ash
QL Quick Lime
QXRD Quantitative X-Ray Diffraction
S Sulfur (elemental)
SC Soil Cement
SCM Supplementary cementitious Materials
SE Secondary Electron
SHW Specification for Highways Works
SL Soil Lime
SS Soil Stabilisation
TPS Total Potential Sulfate
TRL Transport Research Laboratory
Tx-DOT Texas Department of Transport
WC Water Content
WSS Water Soluble Sulfate
X-Ray CT X-Ray Computer Tomography
XRD X-Ray Diffraction
XRF X-Ray Fluorescence
CEMENT NOMENCLATURE
C CaO
S SiO2
S̄ SO4
A Al2O3
H H2O
AFt Ca6Al2(SO4)3(OH)12.26H2O or C6AS̄3H32
AFm Ca4Al2O6(SO4).14H2O or C4AS̄H14
13
1. INTRODUCTION
1.1. PROBLEM STATEMENT
This research is concerned with the effect that deleterious sulfate reactions have on the
durability and hence long term performance of stabilised soils that may be incorporated
into a pavement foundation. These reactions can cause a range of problems dependent
on the mode of attack such as volumetric disruptions (manifested as vertical and lateral
heave of the pavement) and a loss of mechanical strength. This may result in insufficient
support to the over-laying foundation that can result in the ultimate failure of the
pavement foundation.
Where deleterious sulfate reactions have contributed to this loss of durability, the
formation of ettringite and thaumasite is often found to the cause. The formation of the
highly expansive sulfate mineral ettringite, after the initial setting and hardening has
occurred, (termed delayed ettringite formation, Taylor 2001, Neville 2004) can severely
damage a stabilized soil layer and allied structures due to the expansive forces
associated with its formation. This can result in a loss of structural integrity caused by
microstructural damage to the cementitious matrix. The formation of thaumasite can not
only cause damage due to expansive effects, but also breakdown the hydrated mineral
elements associated with the strength giving properties of cemented materials (Hartshorn
et al. 1999)
A number of case studies have been reported on the failure of stabilized soils through
these mechanisms (Hunter, 1988; Mitchell and Dermatas 1990; Petry and Little, 1992;
Rajendran and Lytton 1997; Rollings et al. 1999; and Puppala et al. 2001)
Current UK practice attempts to mitigate the risk by:
Imposing limits on chemical constituents, both in the soil itself and surrounding
environment;
Utilising a number of laboratory test procedures to assess the durability and
performance of the stabilised soil.
Historically, the durability of a stabilised material has been evaluated using the California
Bearing ratio (CBR) linear swell test (BS 1924-2, 1990) which measures the strength of
the soil after it has been subjected to a period of immersion in water. The soil is deemed
14 Chapter One - Introduction
suitable if it retains a minimum strength after soaking and does not exhibit a linear swell in
excess of a defined maximum. European harmonisation of standards has seen the
introduction of a number of alternative procedures:
BS EN 13286-47 (2004) - Test method for the determination of California Bearing
Ratio, immediate bearing index and linaer swelling;
BS EN 13286-49 (2004) - Accelerated swelling test for soil treated by lime and/or
hydraulic binder;
The Manual of Contract Documents for Highways Works Volume 1 (MCHW1) Series 800
(Specification for Highways Works. Road pavements – unbound, cement and other
hydraulically bound materials) in clause 880.4 also specifies a loss of strength on
immersion test for the evaluation of HBM durability. The purpose of these tests is to
simulate in the laboratory, the insitu conditions of the proposed mixture design. This then
allows the engineer to evaluate the likely durability and hence suitability of the soil for
stabilisation.
Preliminary work has been undertaken (Notman, 2008) which evaluated the relative
pass/fail criteria of each test and the affect that workmanship has on the ultimate
durability of stabilised soils.
Further work is required to more fully understand the relationship between the change in
physical properties of the stabilised soil subject to deleterious processes and the
fundamental chemical behaviour that gives rise to these processes.
1.2. AIM AND OBJECTIVES
1.2.1. Aim
The aim of this research is to provide a fundamental understanding of the link between
the physicochemical properties of idealised ‘artificial’, laboratory blended soil samples
and their mechanical/physical properties associated with the principal failure criteria of
dimensional instability and mechanical weakening.
This aim will be achieved through the use of chemical and spectroscopic techniques to
study the behaviour of a range of sulfated lime stabilised soils subject to the test
conditions imposed by two laboratory swell tests:
Chapter One – Introduction 15
UK CBR Swell test - BS1924-2, 1990 (widely used in the UK); and
Accelerated European volumetric swell test - EN 138642-49, 2004
1.2.2. Objectives
In order to achieve the aim of the research the following objectives need to be met:
I. Undertake swell testing on a range of sulfated lime stabilised soils using the
British (BS 1924-2: 1999) and the Accelerated European swell test (EN 13286-
49: 2004) to determine the macro-physical properties of these materials, namely
linear expansion, soaked CBR value and volumetric expansion.
II. Investigate the chemical response of the sulfated lime stabilised soils to the
conditions imposed by the swell tests defined in Objective I, in particular those
attributed to dimensional instability and mechanical weakening.
III. Relate the underlying chemical behaviour to the observed macro-physical soil
properties and investigate the factors affecting this relationship, in particular: clay
mineralogy; sulfate concentration; temperature and duration of curing and
immersion.
1.3. THESIS STRUCTURE
Chapter Two – Background
Provides a general introduction to soil stabilisation. It describes where soil stabilisation
techniques can be used in the pavement foundation and the modern performance based
design process used. Fundamental material characteristics, such as clay mineralogy, the
basic chemical principles of soil stabilisation and the problems which can affect it are also
reported
Chapter Three – Literature Review
Provides a literature review of work undertaken on the formation of ettringite in
cementitious systems and its role in the deterioration of lime stabilised cohesive soils. It
considers the structure of ettringite and the the mechanisms of its formation in Portland
cements (both primary and secondary) by through-solution or topochemical reaction, in
addition to current thermodynamic treatments of its formation. Material dependent
parameters such as the effect of clay type, sulfate source, sulfate cation, temperature,
void structure and binder type (in soil systems) are also considered. The swelling
16 Chapter One - Introduction
mechanism is evaluated based on the two current expansion theories, namely: crystal
growth vs crystal swelling theory. The laboratory tests used for the evaluation of sulfate
swell and analytical techniques used to characterise the underlying chemical environment
are also discussed
Chapter Four – Materials and Methods
This chapter describes the research strategy and the materials used in the study As well
as the design procedure taken from current UK guidance and specifications to design of
the twelve artificial soil test mixtures in addition to the swell tests used in the research.
The analytical techniques used to characterise the phenomena of deleterious ettringite
formation in lime stabilised cohesive soils are also described.
Chapter Five – Macrophysical Property Testing
The macro-physical results of the swell testing using the twelve artificial soil mixtures are
reported. Correlations between observed volumetric stability, loss of mechanical strength
and sulfate content are explored. Results are discussed in the context of the conditions
imposed by the swell tests used in the research.
Chapter Six – Microstructure and Phase Composition
Presents the results derived from the analysis of the underlying chemical environment
including the microstructural information of the soils subject to extensive swell testing.
The quantification of important phases is reported in particular ettringite and monosulfate
in all the soils. Analytical techniques used include: Quantitative X-Ray Diffraction (QXRD);
Thermal Analysis (TA); Scanning Electron Microscope (SEM); Energy Dispersive X-Ray
Spectroscopy (EDX)
Chapter Seven – Interval Study using EN 13286-49
This chapter reports both the physical response and compositional analysis of an ‘early
age’ study using the European accelerated volumetric swell test. Using the high sulfate
soil mixtures of both clays, the volumetric swell (Gv) is monitored for an extended period.
Samples are taken at specific times to determine the how the microstructure and phase
composition changes over time. Results are evaluated based on the physical response of
the specimens in relation to the test conditions.
Chapter Seven – Macrophysical, Microstructural Chemical Relationships
This chapter brings the two strands of research together. That is, macro-physical swell
testing and the analysis of the microstructure and phase composition. Correlations

Chapter One – Introduction 17
between ettringite formation and the observed dimensional changes and loss of strength
are derived. Material effects such are clay type and sulfate content are explored, as well
as test specific conditions such as curing duration, temperature, and specimen type are
considered.
Chapter Nine - Conclusions
Presents the conclusions derived from the work and recommendations for future
research.
18
2. BACKGROUND
2.1. PAVEMENT STRUCTURE AND BASIC DESIGN CONSIDERATIONS
A pavement is a composite structure made from layers of material that is designed to
safely support the movement of passing vehicle traffic and dissipate the forces generated
by the associated loading to the subgrade, without exceeding the supporting capacity of
the subgrade (Wang, 2002).
Pavement structures are constructed using high volume, relatively low cost materials. As
such, the pavement engineer can realise significant economic and environmental savings
through careful selection of materials and rational design that meets the optimum
performance and durability requirements of the scheme. As such many design options
are available to the engineer, particularly, as recent revision of The Highways Agency
Specifications for Highways Works (SHW) has resulted in the incorporation of
Hydraulically Bound Mixtures (HBMs) into the specifications and design guidance. This
allows the use of recycled and secondary materials in both standard designs and using
non-standard ‘analytical’ designs subject to the appropriate additional testing and
specification (HD26/06, DMRB, Vol 7 part 2 SHW).
There are three generic classes of pavement structure:
Rigid – has a Pavement Quality Concrete (PQC) slab as the main structural layer
Flexible – comprised entirely of unbound material and asphalt
Composite – asphalt surface overlaying a hydraulically bound base
Figure 1 shows the basic structure of a pavement. Generally the performance (in terms of
strength and stiffness), and hence cost of the pavement layers increases nearer to the
surface, as the forces they are required to withstand increase. As a result of this, the
required thickness of the upper layers also tends to be lower.
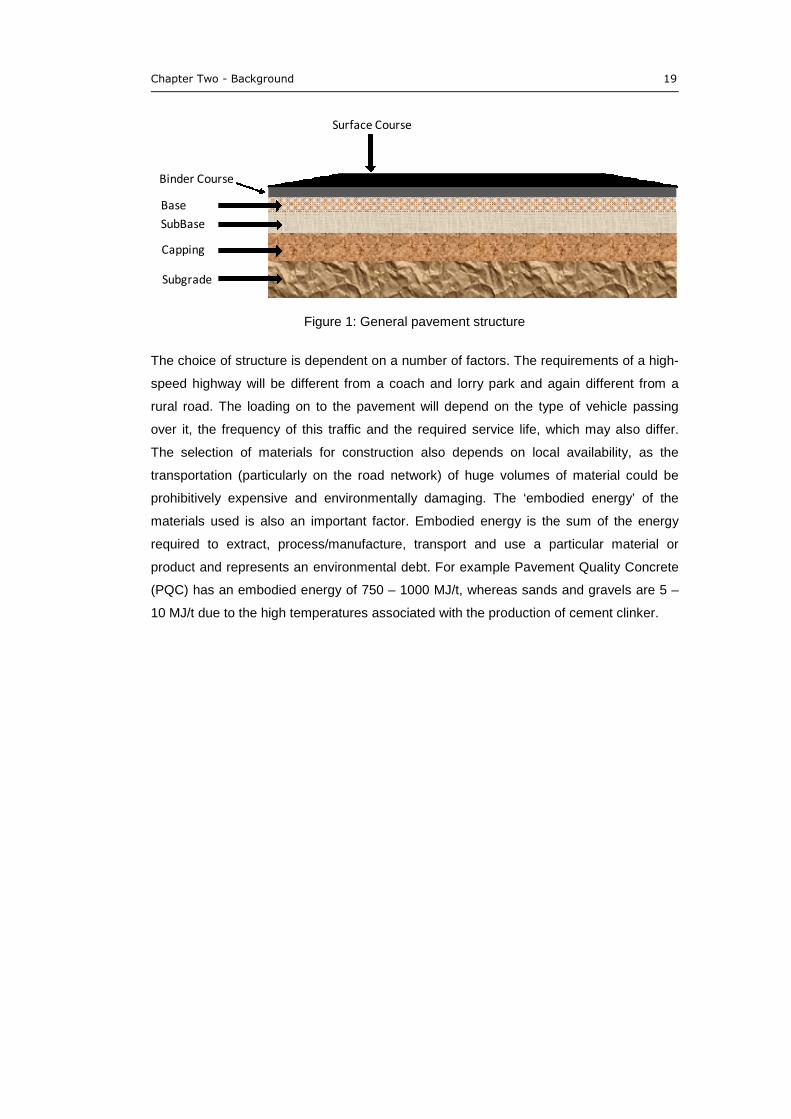
Chapter Two - Background 19
Figure 1: General pavement structure
The choice of structure is dependent on a number of factors. The requirements of a high-
speed highway will be different from a coach and lorry park and again different from a
rural road. The loading on to the pavement will depend on the type of vehicle passing
over it, the frequency of this traffic and the required service life, which may also differ.
The selection of materials for construction also depends on local availability, as the
transportation (particularly on the road network) of huge volumes of material could be
prohibitively expensive and environmentally damaging. The ‘embodied energy’ of the
materials used is also an important factor. Embodied energy is the sum of the energy
required to extract, process/manufacture, transport and use a particular material or
product and represents an environmental debt. For example Pavement Quality Concrete
(PQC) has an embodied energy of 750 – 1000 MJ/t, whereas sands and gravels are 5 –
10 MJ/t due to the high temperatures associated with the production of cement clinker.
Surface Course
Binder Course
SubBase
Capping
Subgrade
Base
20 Chapter Three - Literature Review
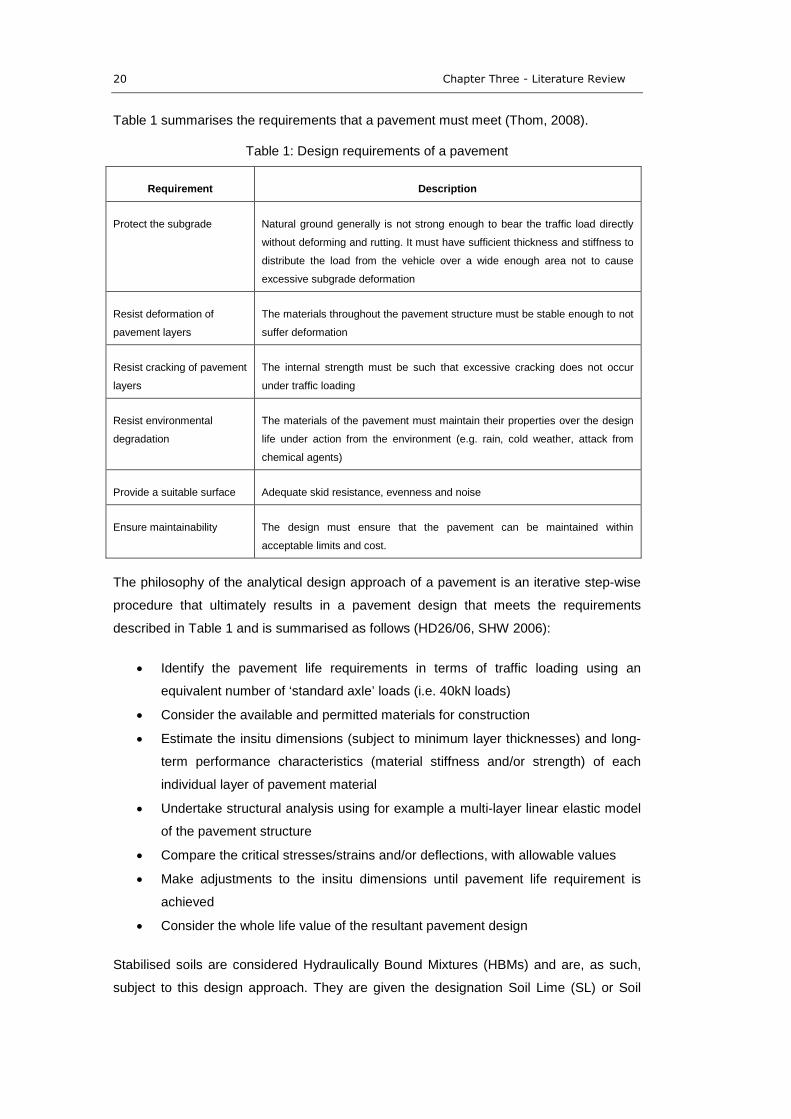
Table 1 summarises the requirements that a pavement must meet (Thom, 2008).
Table 1: Design requirements of a pavement
Requirement Description
Protect the subgrade Natural ground generally is not strong enough to bear the traffic load directly
without deforming and rutting. It must have sufficient thickness and stiffness to
distribute the load from the vehicle over a wide enough area not to cause
excessive subgrade deformation
Resist deformation of
pavement layers
The materials throughout the pavement structure must be stable enough to not
suffer deformation
Resist cracking of pavement
layers
The internal strength must be such that excessive cracking does not occur
under traffic loading
Resist environmental
degradation
The materials of the pavement must maintain their properties over the design
life under action from the environment (e.g. rain, cold weather, attack from
chemical agents)
Provide a suitable surface Adequate skid resistance, evenness and noise
Ensure maintainability The design must ensure that the pavement can be maintained within
acceptable limits and cost.
The philosophy of the analytical design approach of a pavement is an iterative step-wise
procedure that ultimately results in a pavement design that meets the requirements
described in Table 1 and is summarised as follows (HD26/06, SHW 2006):
Identify the pavement life requirements in terms of traffic loading using an
equivalent number of ‘standard axle’ loads (i.e. 40kN loads)
Consider the available and permitted materials for construction
Estimate the insitu dimensions (subject to minimum layer thicknesses) and long-
term performance characteristics (material stiffness and/or strength) of each
individual layer of pavement material
Undertake structural analysis using for example a multi-layer linear elastic model
of the pavement structure
Compare the critical stresses/strains and/or deflections, with allowable values
Make adjustments to the insitu dimensions until pavement life requirement is
achieved
Consider the whole life value of the resultant pavement design
Stabilised soils are considered Hydraulically Bound Mixtures (HBMs) and are, as such,
subject to this design approach. They are given the designation Soil Lime (SL) or Soil
Chapter Two - Background 21
Cement (SC) in the European standards (BS EN 14227: 2006). Stabilised soils are
introduced in Section 2.4.
2.2. COMPOSITION OF NATURAL SOILS
Knowledge of soil properties and behaviour is key to understanding soil stabilisation. The
following section summarises the formation of natural soils, particularly the clay minerals
with are of fundamental importance to this research.
Natural soils are formed from mechanical and chemical weathering of their parent rocks.
Abrasion by natural forces, such as ice water and wind, breaks down the rock into
successively smaller fragments. Where the weathering products remain in place, they are
termed residual soils. If the weathering products are moved elsewhere (again by the
action of natural forces) they are termed transported soils. The mechanical processes
involved in the movement of these soils influence their characteristics. Residual and
transported soils are further altered in place by continued weathering, resulting in layers
of deposited material known as horizons. Chemical weathering alters some rock minerals
and selectively removes others, resulting in a chemically different material.
The action of water underpins many weathering processes. It dissolves carbon dioxide,
organic acids (products of the decomposition of organic matter) and other salts as it flows
through the ground, altering rock minerals as it goes. Hydrolysis, cation exchange,
chelation, oxidation and carbonation also contribute to the weathering of parent rock to
form soils. Ultimately, all the characteristics and engineering properties of soils are
determined by a combination of these processes, as mechanical and chemical
weathering effects rarely act alone (Rollings and Rollings, 1996).
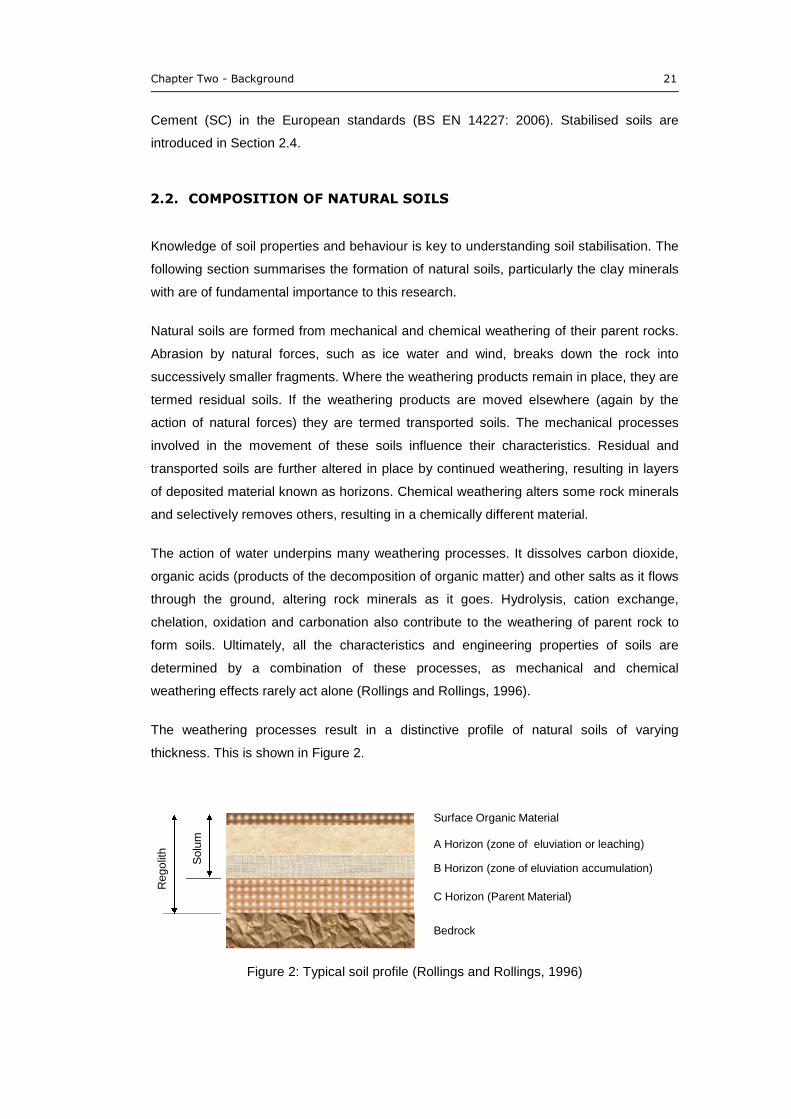
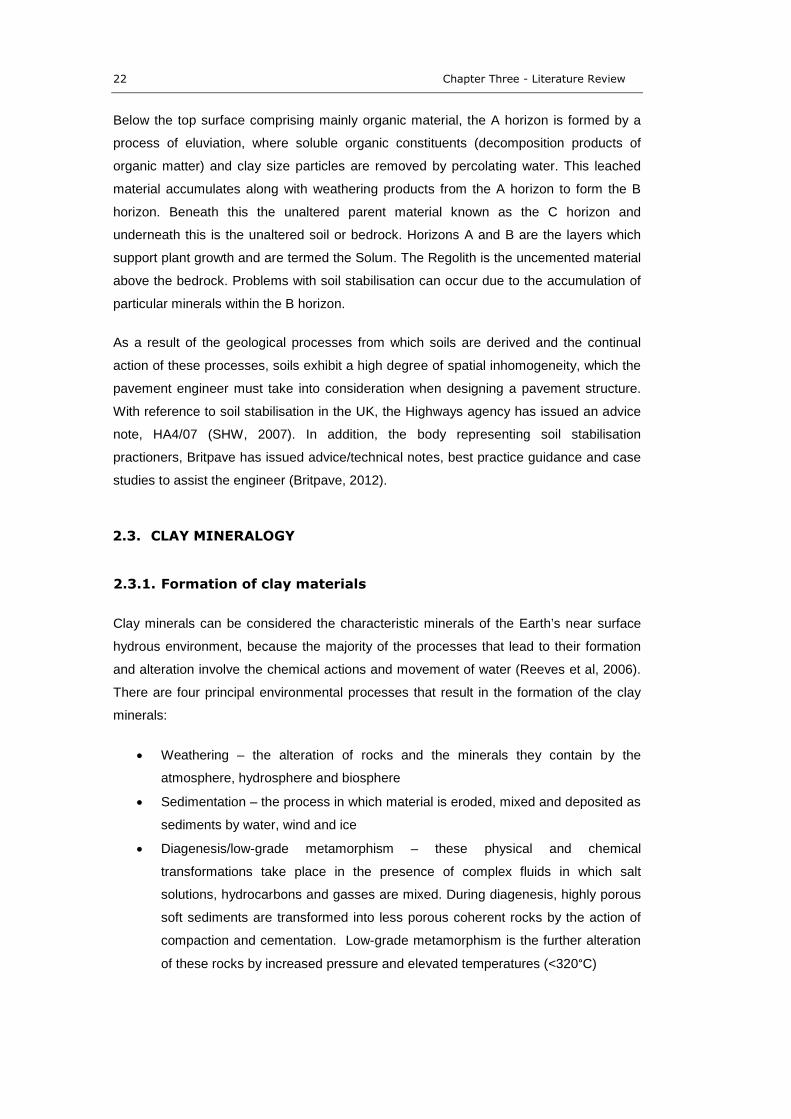
The weathering processes result in a distinctive profile of natural soils of varying
thickness. This is shown in Figure 2.
Figure 2: Typical soil profile (Rollings and Rollings, 1996)
So
lum
Re
go
lith
B Horizon (zone of eluviation accumulation)
A Horizon (zone of eluviation or leaching)
Surface Organic Material
C Horizon (Parent Material)
Bedrock
22 Chapter Three - Literature Review
Below the top surface comprising mainly organic material, the A horizon is formed by a
process of eluviation, where soluble organic constituents (decomposition products of
organic matter) and clay size particles are removed by percolating water. This leached
material accumulates along with weathering products from the A horizon to form the B
horizon. Beneath this the unaltered parent material known as the C horizon and
underneath this is the unaltered soil or bedrock. Horizons A and B are the layers which
support plant growth and are termed the Solum. The Regolith is the uncemented material
above the bedrock. Problems with soil stabilisation can occur due to the accumulation of
particular minerals within the B horizon.
As a result of the geological processes from which soils are derived and the continual
action of these processes, soils exhibit a high degree of spatial inhomogeneity, which the
pavement engineer must take into consideration when designing a pavement structure.
With reference to soil stabilisation in the UK, the Highways agency has issued an advice
note, HA4/07 (SHW, 2007). In addition, the body representing soil stabilisation
practioners, Britpave has issued advice/technical notes, best practice guidance and case
studies to assist the engineer (Britpave, 2012).
2.3. CLAY MINERALOGY
2.3.1. Formation of clay materials
Clay minerals can be considered the characteristic minerals of the Earth’s near surface
hydrous environment, because the majority of the processes that lead to their formation
and alteration involve the chemical actions and movement of water (Reeves et al, 2006).
There are four principal environmental processes that result in the formation of the clay
minerals:
Weathering – the alteration of rocks and the minerals they contain by the
atmosphere, hydrosphere and biosphere
Sedimentation – the process in which material is eroded, mixed and deposited as
sediments by water, wind and ice
Diagenesis/low-grade metamorphism – these physical and chemical
transformations take place in the presence of complex fluids in which salt
solutions, hydrocarbons and gasses are mixed. During diagenesis, highly porous
soft sediments are transformed into less porous coherent rocks by the action of
compaction and cementation. Low-grade metamorphism is the further alteration
of these rocks by increased pressure and elevated temperatures (<320°C)
Chapter Two - Background 23
Hydrothermal alteration – processes occurring between during the interaction of
heated water and rock.
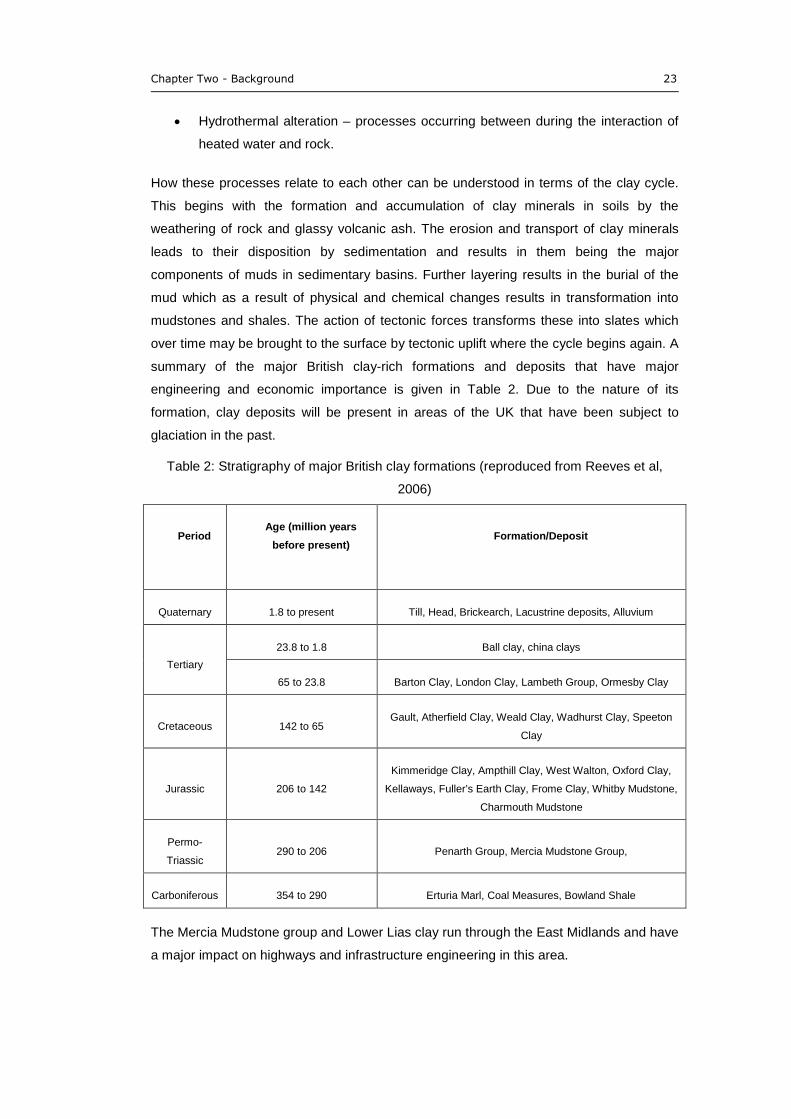
How these processes relate to each other can be understood in terms of the clay cycle.
This begins with the formation and accumulation of clay minerals in soils by the
weathering of rock and glassy volcanic ash. The erosion and transport of clay minerals
leads to their disposition by sedimentation and results in them being the major
components of muds in sedimentary basins. Further layering results in the burial of the
mud which as a result of physical and chemical changes results in transformation into
mudstones and shales. The action of tectonic forces transforms these into slates which
over time may be brought to the surface by tectonic uplift where the cycle begins again. A
summary of the major British clay-rich formations and deposits that have major
engineering and economic importance is given in Table 2. Due to the nature of its
formation, clay deposits will be present in areas of the UK that have been subject to
glaciation in the past.
Table 2: Stratigraphy of major British clay formations (reproduced from Reeves et al,
2006)
PeriodAge (million years
before present)Formation/Deposit
Quaternary 1.8 to present Till, Head, Brickearch, Lacustrine deposits, Alluvium
Tertiary
23.8 to 1.8 Ball clay, china clays
65 to 23.8 Barton Clay, London Clay, Lambeth Group, Ormesby Clay
Cretaceous 142 to 65Gault, Atherfield Clay, Weald Clay, Wadhurst Clay, Speeton
Clay
Jurassic 206 to 142
Kimmeridge Clay, Ampthill Clay, West Walton, Oxford Clay,
Kellaways, Fuller’s Earth Clay, Frome Clay, Whitby Mudstone,
Charmouth Mudstone
Permo-
Triassic290 to 206 Penarth Group, Mercia Mudstone Group,
Carboniferous 354 to 290 Erturia Marl, Coal Measures, Bowland Shale
The Mercia Mudstone group and Lower Lias clay run through the East Midlands and have
a major impact on highways and infrastructure engineering in this area.
24 Chapter Three - Literature Review
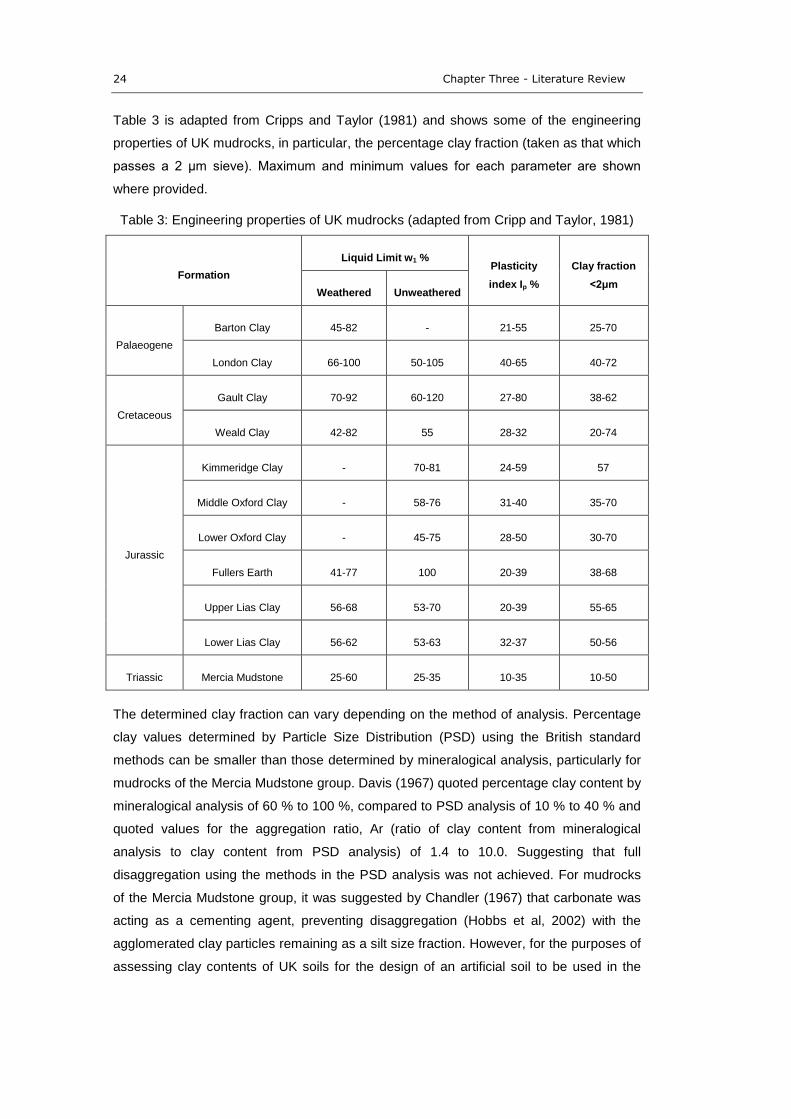
Table 3 is adapted from Cripps and Taylor (1981) and shows some of the engineering
properties of UK mudrocks, in particular, the percentage clay fraction (taken as that which
passes a 2 μm sieve). Maximum and minimum values for each parameter are shown
where provided.
Table 3: Engineering properties of UK mudrocks (adapted from Cripp and Taylor, 1981)
Formation
Liquid Limit w1 %Plasticity
index Ip %
Clay fraction
<2μm Weathered Unweathered
Palaeogene
Barton Clay 45-82 21-55 25-70
London Clay 66-100 50-105 40-65 40-72
Cretaceous
Gault Clay 70-92 60-120 27-80 38-62
Weald Clay 42-82 55 28-32 20-74
Jurassic
Kimmeridge Clay 70-81 24-59 57
Middle Oxford Clay 58-76 31-40 35-70
Lower Oxford Clay 45-75 28-50 30-70
Fullers Earth 41-77 100 20-39 38-68
Upper Lias Clay 56-68 53-70 20-39 55-65
Lower Lias Clay 56-62 53-63 32-37 50-56
Triassic Mercia Mudstone 25-60 25-35 10-35 10-50
The determined clay fraction can vary depending on the method of analysis. Percentage
clay values determined by Particle Size Distribution (PSD) using the British standard
methods can be smaller than those determined by mineralogical analysis, particularly for
mudrocks of the Mercia Mudstone group. Davis (1967) quoted percentage clay content by
mineralogical analysis of 60 % to 100 %, compared to PSD analysis of 10 % to 40 % and
quoted values for the aggregation ratio, Ar (ratio of clay content from mineralogical
analysis to clay content from PSD analysis) of 1.4 to 10.0. Suggesting that full
disaggregation using the methods in the PSD analysis was not achieved. For mudrocks
of the Mercia Mudstone group, it was suggested by Chandler (1967) that carbonate was
acting as a cementing agent, preventing disaggregation (Hobbs et al, 2002) with the
agglomerated clay particles remaining as a silt size fraction. However, for the purposes of
assessing clay contents of UK soils for the design of an artificial soil to be used in the
Chapter Two - Background 25
research, Table 3 provides useful information. Clay contents range from as low as 10 %
(Mercia Mudstone) to as high as 74 % for Weld Clay.
2.3.2. Structure and swelling characteristics
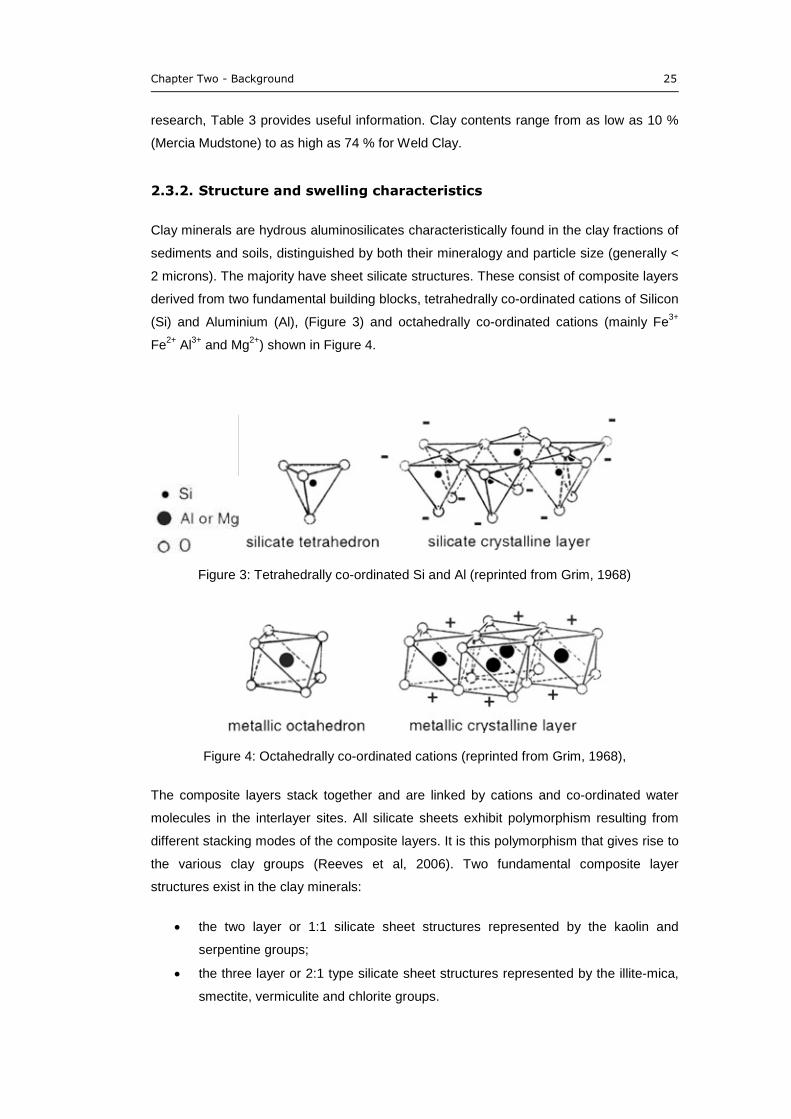
Clay minerals are hydrous aluminosilicates characteristically found in the clay fractions of
sediments and soils, distinguished by both their mineralogy and particle size (generally <
2 microns). The majority have sheet silicate structures. These consist of composite layers
derived from two fundamental building blocks, tetrahedrally co-ordinated cations of Silicon
(Si) and Aluminium (Al), (Figure 3) and octahedrally co-ordinated cations (mainly Fe3+
Fe2+
Al3+
and Mg2+
) shown in Figure 4.
Figure 3: Tetrahedrally co-ordinated Si and Al (reprinted from Grim, 1968)
Figure 4: Octahedrally co-ordinated cations (reprinted from Grim, 1968),
The composite layers stack together and are linked by cations and co-ordinated water
molecules in the interlayer sites. All silicate sheets exhibit polymorphism resulting from
different stacking modes of the composite layers. It is this polymorphism that gives rise to
the various clay groups (Reeves et al, 2006). Two fundamental composite layer
structures exist in the clay minerals:
the two layer or 1:1 silicate sheet structures represented by the kaolin and
serpentine groups;
the three layer or 2:1 type silicate sheet structures represented by the illite-mica,
smectite, vermiculite and chlorite groups.
26 Chapter Three - Literature Review
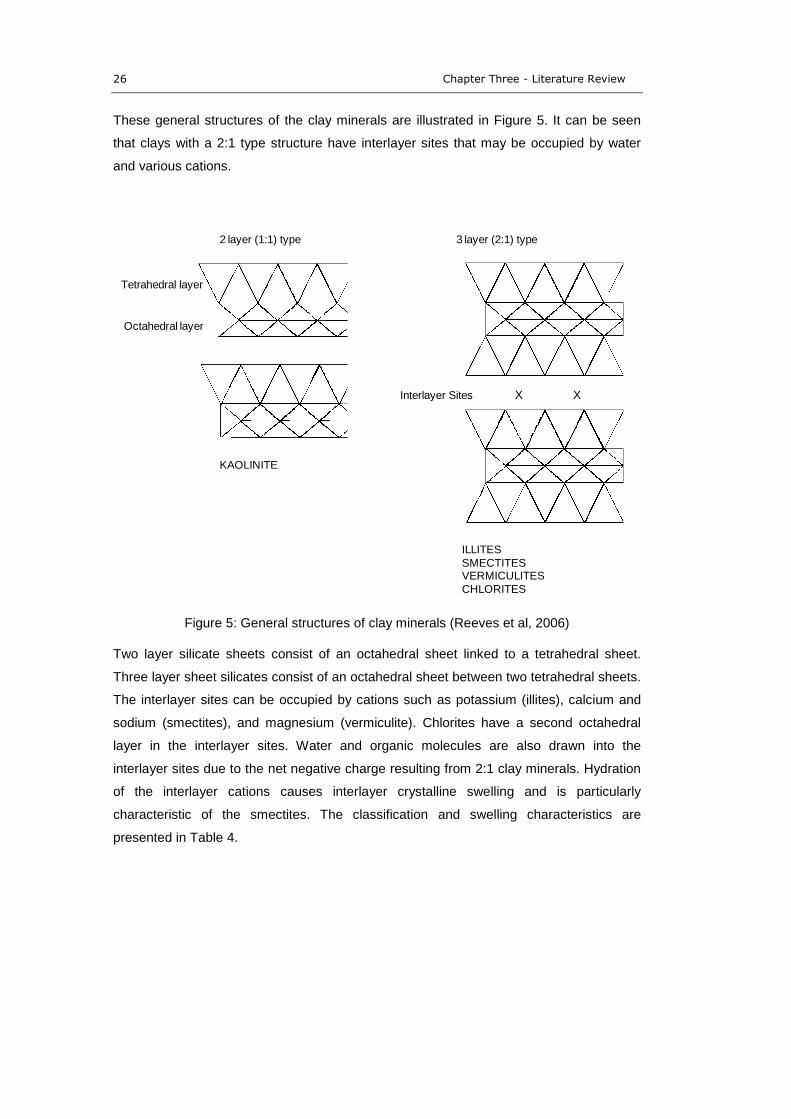
These general structures of the clay minerals are illustrated in Figure 5. It can be seen
that clays with a 2:1 type structure have interlayer sites that may be occupied by water
and various cations.
Figure 5: General structures of clay minerals (Reeves et al, 2006)
Two layer silicate sheets consist of an octahedral sheet linked to a tetrahedral sheet.
Three layer sheet silicates consist of an octahedral sheet between two tetrahedral sheets.
The interlayer sites can be occupied by cations such as potassium (illites), calcium and
sodium (smectites), and magnesium (vermiculite). Chlorites have a second octahedral
layer in the interlayer sites. Water and organic molecules are also drawn into the
interlayer sites due to the net negative charge resulting from 2:1 clay minerals. Hydration
of the interlayer cations causes interlayer crystalline swelling and is particularly
characteristic of the smectites. The classification and swelling characteristics are
presented in Table 4.
2 layer (1:1) type
Tetrahedral layer
Octahedral layer
KAOLINITE
3 layer (2:1) type
Interlayer Sites X X
ILLITESSMECTITESVERMICULITESCHLORITES
Chapter Two - Background 27
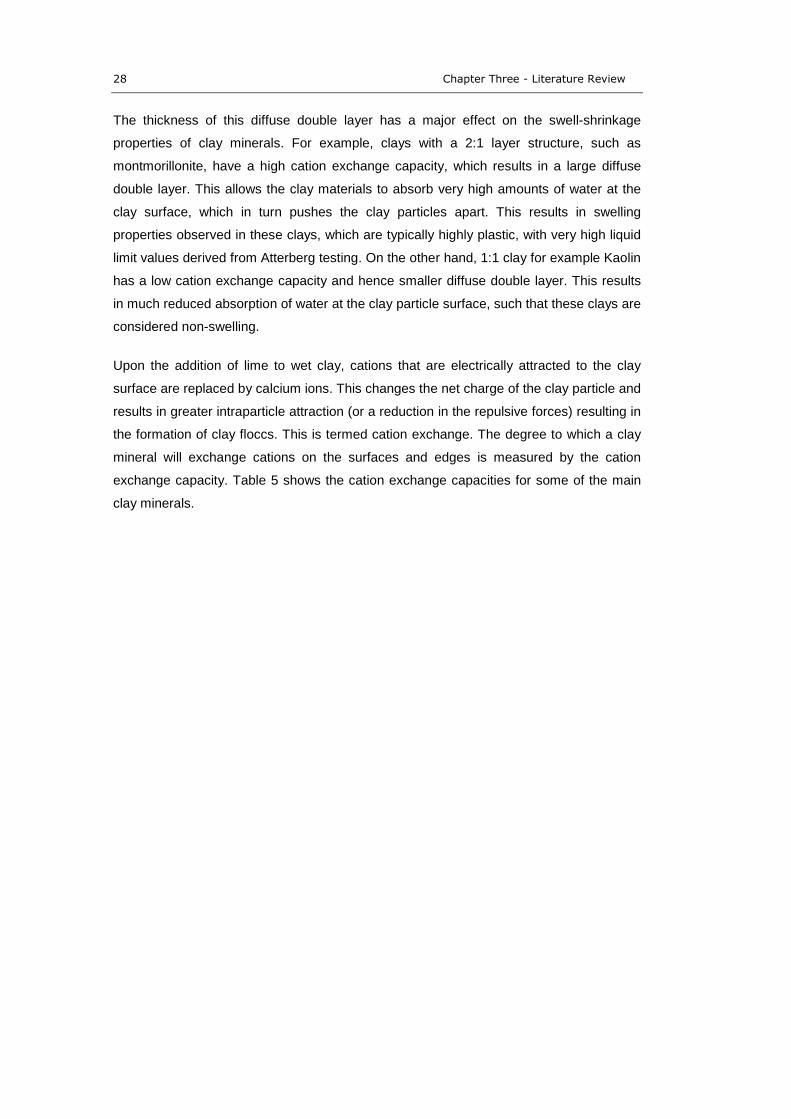
Table 4: Classification of clay minerals
Silicate Sheet type Clay Swelling Property
1:1 Type Kaolin No
2:1 Type
Illites No
Smectites (Montmorillonites) Yes
Vermiculites Yes
Mixed layer clays with smectite/vermiculite Yes
Palygorskite and sepiolite No
Chlorites No
Clay minerals exhibit a propensity to exchange cations at their particle edges in aqueous
solution. This is termed cation exchange and has a significant effect on the behaviour of
clay soils.
Idealised 1:1 layered clays have neutral composite layer structures, but typically have a
small net negative charge offset by a degree of cationic substitution. 2:1 layer clays have
a net negative charge on their composite layers due to the following cationic substitutions:
Al3+
for Si4+
and Fe2+ ;
Mg2+
for Al3+
and Fe3+
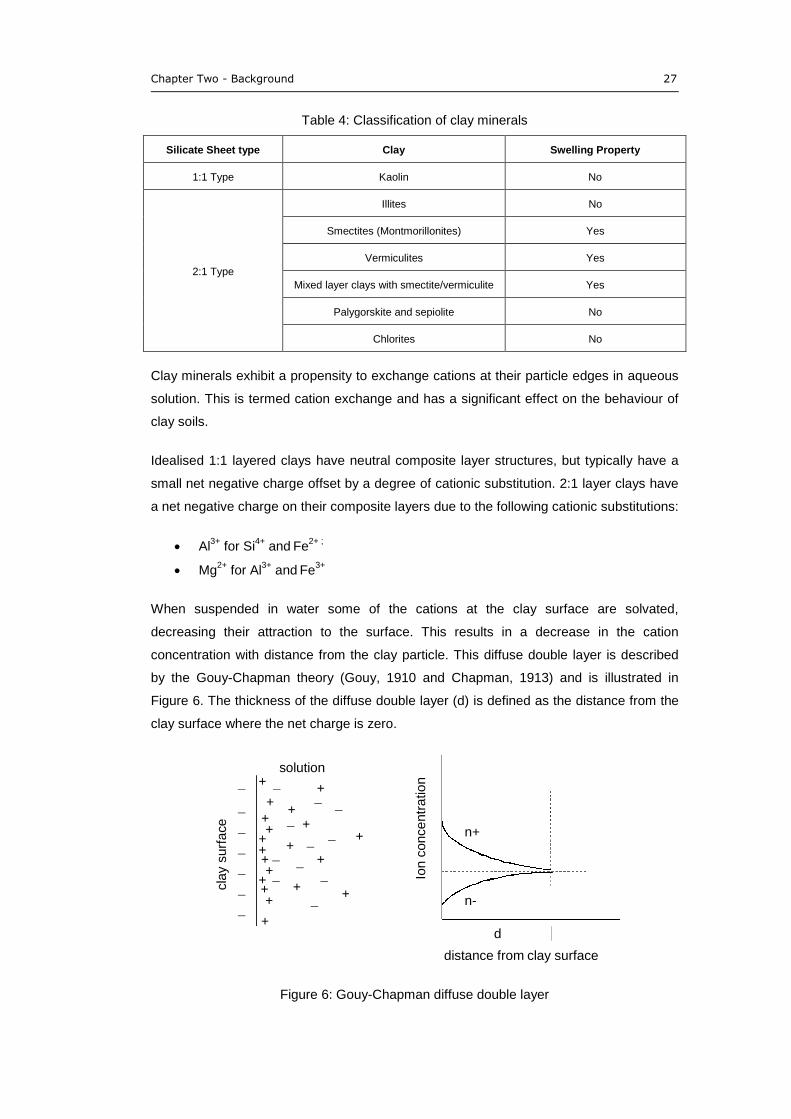
When suspended in water some of the cations at the clay surface are solvated,
decreasing their attraction to the surface. This results in a decrease in the cation
concentration with distance from the clay particle. This diffuse double layer is described
by the Gouy-Chapman theory (Gouy, 1910 and Chapman, 1913) and is illustrated in
Figure 6. The thickness of the diffuse double layer (d) is defined as the distance from the
clay surface where the net charge is zero.
Figure 6: Gouy-Chapman diffuse double layer
solution
cla
ysurf
ace
¯
¯
¯
¯
¯
¯
¯¯
¯¯
¯
¯
¯
+
++
+
+
+
+
+
+
+
+
+
++
+
+
+
+
++
¯
¯
¯
¯
¯
n+
n-
d
distance from clay surface
Ion
conce
ntr
atio
n
28 Chapter Three - Literature Review
The thickness of this diffuse double layer has a major effect on the swell-shrinkage
properties of clay minerals. For example, clays with a 2:1 layer structure, such as
montmorillonite, have a high cation exchange capacity, which results in a large diffuse
double layer. This allows the clay materials to absorb very high amounts of water at the
clay surface, which in turn pushes the clay particles apart. This results in swelling
properties observed in these clays, which are typically highly plastic, with very high liquid
limit values derived from Atterberg testing. On the other hand, 1:1 clay for example Kaolin
has a low cation exchange capacity and hence smaller diffuse double layer. This results
in much reduced absorption of water at the clay particle surface, such that these clays are
considered non-swelling.
Upon the addition of lime to wet clay, cations that are electrically attracted to the clay
surface are replaced by calcium ions. This changes the net charge of the clay particle and
results in greater intraparticle attraction (or a reduction in the repulsive forces) resulting in
the formation of clay floccs. This is termed cation exchange. The degree to which a clay
mineral will exchange cations on the surfaces and edges is measured by the cation
exchange capacity. Table 5 shows the cation exchange capacities for some of the main
clay minerals.
Chapter Two - Background 29
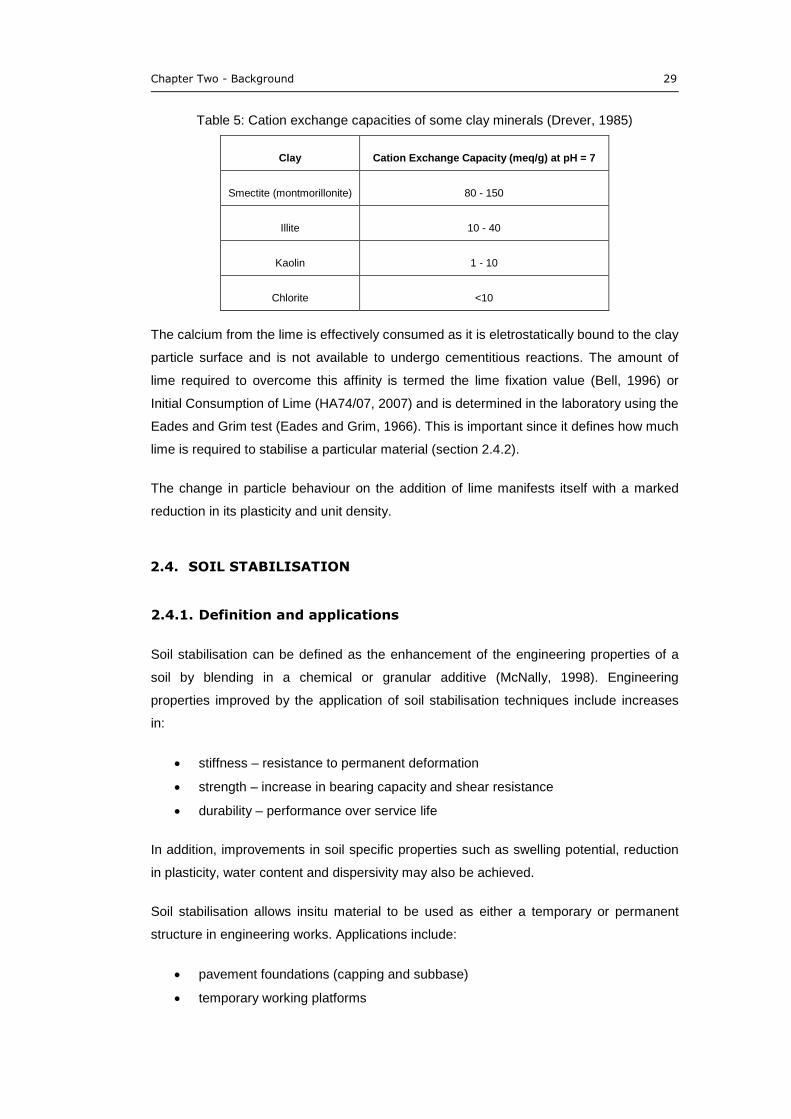
Table 5: Cation exchange capacities of some clay minerals (Drever, 1985)
Clay Cation Exchange Capacity (meq/g) at pH = 7
Smectite (montmorillonite) 80 - 150
Illite 10 - 40
Kaolin 1 - 10
Chlorite <10
The calcium from the lime is effectively consumed as it is eletrostatically bound to the clay
particle surface and is not available to undergo cementitious reactions. The amount of
lime required to overcome this affinity is termed the lime fixation value (Bell, 1996) or
Initial Consumption of Lime (HA74/07, 2007) and is determined in the laboratory using the
Eades and Grim test (Eades and Grim, 1966). This is important since it defines how much
lime is required to stabilise a particular material (section 2.4.2).
The change in particle behaviour on the addition of lime manifests itself with a marked
reduction in its plasticity and unit density.
2.4. SOIL STABILISATION
2.4.1. Definition and applications
Soil stabilisation can be defined as the enhancement of the engineering properties of a
soil by blending in a chemical or granular additive (McNally, 1998). Engineering
properties improved by the application of soil stabilisation techniques include increases
in:
stiffness – resistance to permanent deformation
strength – increase in bearing capacity and shear resistance
durability – performance over service life
In addition, improvements in soil specific properties such as swelling potential, reduction
in plasticity, water content and dispersivity may also be achieved.
Soil stabilisation allows insitu material to be used as either a temporary or permanent
structure in engineering works. Applications include:
pavement foundations (capping and subbase)
temporary working platforms
30 Chapter Three - Literature Review
sea defences
slope stabilisation.
Under UK specifications (Specifications for Highways Works, SHW), if a pavement
foundation is to be constructed on a weak subgrade (CBR <5%), a stabilised capping
layer (with improved engineering performance) can be constructed, so that sufficient
support is provided to the overlaying pavement. This incorporates the insitu material into
the final works and also allows a reduction in the thickness of the overlaying layers
(McNally, 1998). Economic and environmental benefits are realised through a reduction in
primary material use, fewer lorry movements, avoidance of landfill tax (associated with
the disposal of excavated material) and reductions in embodied energies (Britpave, Case
Studies 1 – 10, 2010 – 2011). Thus the aims of stabilisation are:
Reduction in construction time by improving early traffic-ability of poorly
performing insitu material
Performance enhancement of marginal material, such as an increase in tensile
strength of a sub-base material to meet base-course performance requirements
Subgrade improvement through reduction in water content and increase in
stiffness, reducing the thickness of overlaying pavement layers
Reduction in permeability to the subgrade, particularly at road shoulders where
permeable bases comprising coarse graded crushed rock is used.
The blending of two marginal soils together to produce a product with an improved
grading profile and thus greater mechanical interlock is termed mechanical stabilisation.
The addition of supplementary materials, which act on the soil through chemical
processes/transformations, is called chemical stabilisation. The choice of stabilisation
route will be dependent on the insitu soil composition, intended use, climatic
considerations (particularly where cement is to be used), economic factors and availability
of suitable equipment and trained operators. Table 6 is adapted from McNally (1998) and
summarises the different types and engineering improvements that can be achieved
using stabilisation techniques.
Chapter Two - Background 31
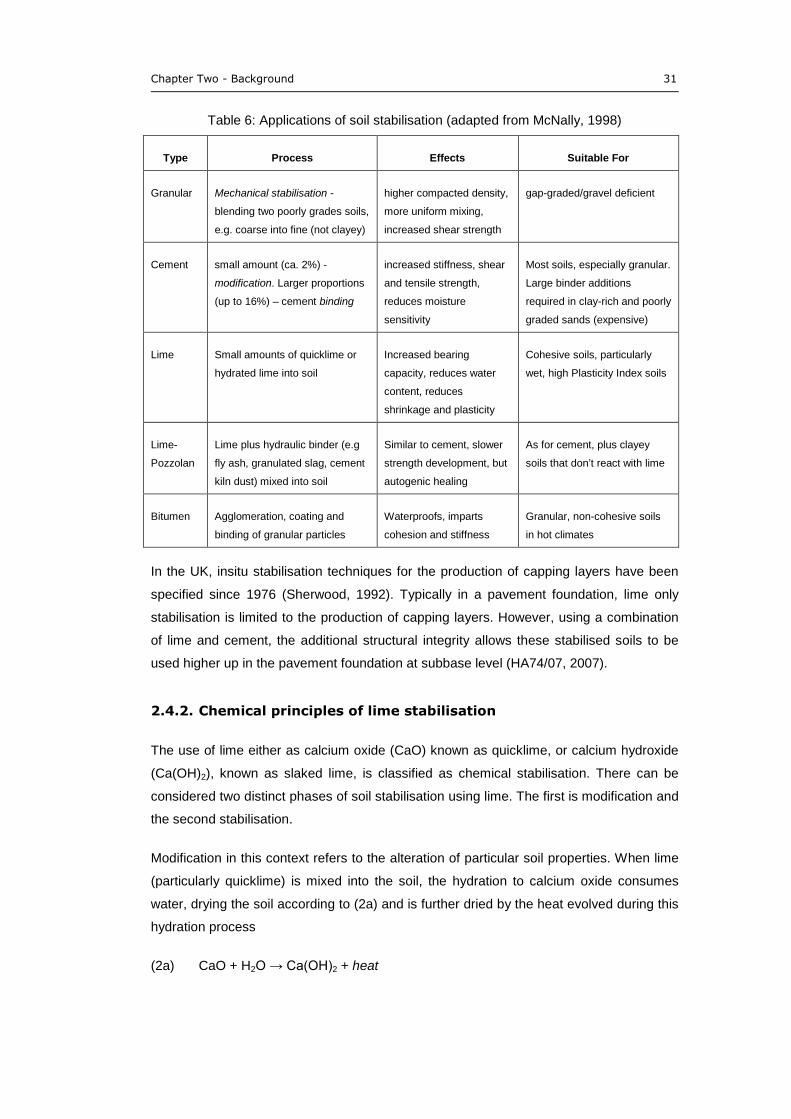
Table 6: Applications of soil stabilisation (adapted from McNally, 1998)
Type Process Effects Suitable For
Granular Mechanical stabilisation -
blending two poorly grades soils,
e.g. coarse into fine (not clayey)
higher compacted density,
more uniform mixing,
increased shear strength
gap-graded/gravel deficient
Cement small amount (ca. 2%) -
modification. Larger proportions
(up to 16%) – cement binding
increased stiffness, shear
and tensile strength,
reduces moisture
sensitivity
Most soils, especially granular.
Large binder additions
required in clay-rich and poorly
graded sands (expensive)
Lime Small amounts of quicklime or
hydrated lime into soil
Increased bearing
capacity, reduces water
content, reduces
shrinkage and plasticity
Cohesive soils, particularly
wet, high Plasticity Index soils
Lime-
Pozzolan
Lime plus hydraulic binder (e.g
fly ash, granulated slag, cement
kiln dust) mixed into soil
Similar to cement, slower
strength development, but
autogenic healing
As for cement, plus clayey
soils that don’t react with lime
Bitumen Agglomeration, coating and
binding of granular particles
Waterproofs, imparts
cohesion and stiffness
Granular, non-cohesive soils
in hot climates
In the UK, insitu stabilisation techniques for the production of capping layers have been
specified since 1976 (Sherwood, 1992). Typically in a pavement foundation, lime only
stabilisation is limited to the production of capping layers. However, using a combination
of lime and cement, the additional structural integrity allows these stabilised soils to be
used higher up in the pavement foundation at subbase level (HA74/07, 2007).
2.4.2. Chemical principles of lime stabilisation
The use of lime either as calcium oxide (CaO) known as quicklime, or calcium hydroxide
(Ca(OH)2), known as slaked lime, is classified as chemical stabilisation. There can be
considered two distinct phases of soil stabilisation using lime. The first is modification and
the second stabilisation.
Modification in this context refers to the alteration of particular soil properties. When lime
(particularly quicklime) is mixed into the soil, the hydration to calcium oxide consumes
water, drying the soil according to (2a) and is further dried by the heat evolved during this
hydration process
(2a) CaO + H2O → Ca(OH)2 + heat
32 Chapter Three - Literature Review
In addition to drying of the soil, the clay particles also undergo cation exchange
processes at clay particle edges. This has the effect of reducing the inter-particle
repulsive forces, increasing the tendency to flocculate. This is manifested by an increase
in the measured plastic limit and a reduction in unit density of cohesive soils treated with
lime (HA74/07). The resulting material has improved workability, particularly marked
when stabilising heavy clays such as london and gault clay, due to their high cation
exchange capacities (Reeves et al, 2006).
If the amount of lime added to the soil is sufficient, then stabilisation of the soil may take
place. This is termed a pozzolanic effect. A pozzolana can be defined as a material that
can react with lime and water at ambient temperatures to produce a cementitious material
(Sherwood, 1992). Sufficient lime (also termed the fixation level or initial consumption of
lime) is added to the system when the pH of the soil reaches pH 12.4 as a result of the
disassociation of calcium hydroxide (2b):
(2b) Ca(OH)2 → Ca2+
+ 2(OH)¯
This is determined experimentally using Eades and Grim test, which is more recently
referred to as the Initial Consumption of Lime (ICL) test (see Section 684.2.1). When the
material is then compacted, under this highly alkaline environment, the aluminosilicate
sheets of the clay become soluble at pH >10.4. Optimum solubility is achieved at pH 12.4
(Bell 1996). The disassociation of clay minerals under alkaline conditions is shown in (2c):
(2c) Al2Si4O10(OH)2.nH2O + 2(OH)¯
+ 10H2O → 2{2Al(OH)4¯+ 4H4SiO4} + nH2O
This then enables the solubilised clay particles to react with free calcium ions in solution
to form calcium silicate hydrates (CSH), calcium aluminate hydrates (CAH) and calcium
aluminium silicate hydrates (CASH), usually described using general formulas. These are
groups of cementitious products that may be final products or meta-stable intermediates,
the co-dependent reactivity of which contributes to the complexity and difficulty in the
study of cementitious systems. For example the hydrated minerals with cementitious
properties: C4AH13; C3AH11; CAH10; C3S2H3 and C2ASH8 (see List of Terms and
Abbreviations for definition of cement nomenclature) have all been identified in stabilised
soils (Bell, 1996).
These cementitious products are equivalent to those formed during the hydration of
cement pastes (see Chapter Three). The insoluble hydrates form a cementitious matrix
which fills void spaces within the soil to encompass unreacted clay particles. Subsequent
curing of this cementitious matrix results in material with increased engineering
performance. This is illustrated in Figure 7:
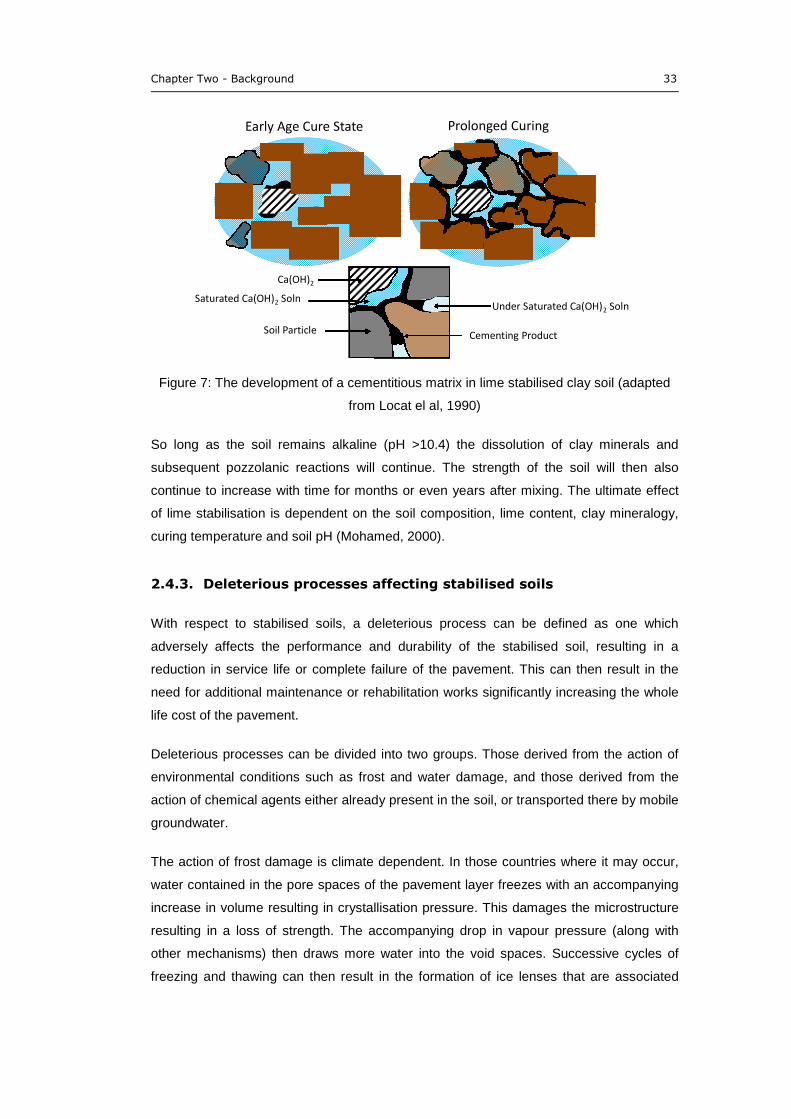
Chapter Two - Background 33
Figure 7: The development of a cementitious matrix in lime stabilised clay soil (adapted
from Locat el al, 1990)
So long as the soil remains alkaline (pH >10.4) the dissolution of clay minerals and
subsequent pozzolanic reactions will continue. The strength of the soil will then also
continue to increase with time for months or even years after mixing. The ultimate effect
of lime stabilisation is dependent on the soil composition, lime content, clay mineralogy,
curing temperature and soil pH (Mohamed, 2000).
2.4.3. Deleterious processes affecting stabilised soils
With respect to stabilised soils, a deleterious process can be defined as one which
adversely affects the performance and durability of the stabilised soil, resulting in a
reduction in service life or complete failure of the pavement. This can then result in the
need for additional maintenance or rehabilitation works significantly increasing the whole
life cost of the pavement.
Deleterious processes can be divided into two groups. Those derived from the action of
environmental conditions such as frost and water damage, and those derived from the
action of chemical agents either already present in the soil, or transported there by mobile
groundwater.
The action of frost damage is climate dependent. In those countries where it may occur,
water contained in the pore spaces of the pavement layer freezes with an accompanying
increase in volume resulting in crystallisation pressure. This damages the microstructure
resulting in a loss of strength. The accompanying drop in vapour pressure (along with
other mechanisms) then draws more water into the void spaces. Successive cycles of
freezing and thawing can then result in the formation of ice lenses that are associated
Early Age Cure State Prolonged Curing
Soil Particle
Saturated Ca(OH)2 Soln
Ca(OH)2
Cementing Product
Under Saturated Ca(OH)2 Soln
34 Chapter Three - Literature Review
with heave of the soil (Yongtang and Deng, 2008). The risk of frost heave is mitigated by
specifying that all pavement materials used within 450 mm of the surface must be frost
resistant (Thom, 2008).
The influence of water on pavement performance and hence design is significant. The
long-term equilibrium water content of subgrade soils and the position of the water table
is a major obstacle for pavement engineers. The effect of water on the subgrade can be
dramatic. Soil behaviour in terms of stiffness and strength is very different at its plastic
and liquid limit. The subgrade may exhibit significant loss of strength and stiffness due the
phenomenon of subgrade softening when the water content of the soil rises. This can
result in lack of support to the overlaying pavement layers causing permanent
deformation of the pavement under loading. It would be extremely difficult, if not
impossible to prevent water entering the pavement or subgrade it is built on. Therefore
the effects of water ingress are mitigated by making adequate provision for drainage and
implementing a suitably robust design to minimise the variability of the subgrade.
Damage to pavements can also occur through the action of chemical agents whose
reactions result in disruptive dimensional changes, commonly termed soil heave
(Sherwood, 1962) and/or attack on the cementitious matrix itself (Snedker and Temporal,
1990; Neville, 2004).
One of the major deleterious processes that affect stabilised soils is sulfate heave. This
occurs when sulfate minerals already present in the soil or transported there by mobile
ground water, react with the lime and/or cement used in the stabilisation along with
alumina from dissolved clay particles to form expansive minerals called Ettringite,
Monosulfate and Thaumasite. When these minerals form after the stabilised layer has
been mixed and compacted, they exert pressure on the soil, because they have a greater
unit volume than the reactants they were derived from (Little, 2010). This results in
volumetric expansion known as sulfate heave and causes significant damage to the
entire pavement structure, which can manifest itself as both transverse and longitudal
ridges and cracks in the pavement surface, as well as discreet areas where the strength
loss in the foundation is so severe that significant permanent deformation can occur
(Section 3.2). The phenomenon of sulfate heave in stabilised soils is considered in detail
in Chapter 3.
2.5. SUMMARY
The technique of soil stabilisation can be used to produce a capping layer from a weak
sub-grade that has improved engineering performance and durability properties. This can
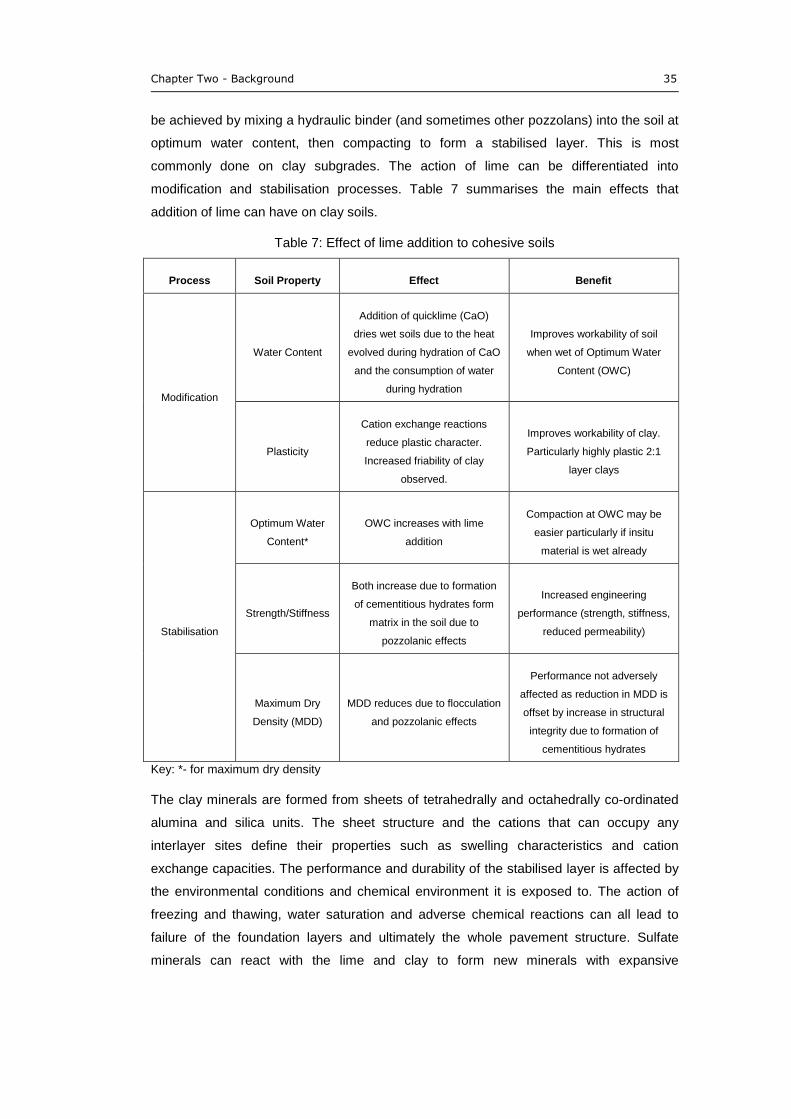
Chapter Two - Background 35
be achieved by mixing a hydraulic binder (and sometimes other pozzolans) into the soil at
optimum water content, then compacting to form a stabilised layer. This is most
commonly done on clay subgrades. The action of lime can be differentiated into
modification and stabilisation processes. Table 7 summarises the main effects that
addition of lime can have on clay soils.
Table 7: Effect of lime addition to cohesive soils
Process Soil Property Effect Benefit
Modification
Water Content
Addition of quicklime (CaO)
dries wet soils due to the heat
evolved during hydration of CaO
and the consumption of water
during hydration
Improves workability of soil
when wet of Optimum Water
Content (OWC)
Plasticity
Cation exchange reactions
reduce plastic character.
Increased friability of clay
observed.
Improves workability of clay.
Particularly highly plastic 2:1
layer clays
Stabilisation
Optimum Water
Content*
OWC increases with lime
addition
Compaction at OWC may be
easier particularly if insitu
material is wet already
Strength/Stiffness
Both increase due to formation
of cementitious hydrates form
matrix in the soil due to
pozzolanic effects
Increased engineering
performance (strength, stiffness,
reduced permeability)
Maximum Dry
Density (MDD)
MDD reduces due to flocculation
and pozzolanic effects
Performance not adversely
affected as reduction in MDD is
offset by increase in structural
integrity due to formation of
cementitious hydrates
Key: *- for maximum dry density
The clay minerals are formed from sheets of tetrahedrally and octahedrally co-ordinated
alumina and silica units. The sheet structure and the cations that can occupy any
interlayer sites define their properties such as swelling characteristics and cation
exchange capacities. The performance and durability of the stabilised layer is affected by
the environmental conditions and chemical environment it is exposed to. The action of
freezing and thawing, water saturation and adverse chemical reactions can all lead to
failure of the foundation layers and ultimately the whole pavement structure. Sulfate
minerals can react with the lime and clay to form new minerals with expansive

36 Chapter Three - Literature Review
characteristics. These can damage the stabilised layer. This process is termed sulfate
heave.
37
3. LITERATURE REVIEW
3.1. INTRODUCTION
As briefly touched upon in chapter two, the formation of hydrous calcium sulfoaluminates
(in this case ettringite and monosulfate) can have a significant impact on the physical
properties and behaviour characteristics of lime stabilised soils. Knowledge of the
mechanisms by which these compounds form and subsequently damage the micro-
structure of materials, has been attained from the study of what are generically termed
Portland cements and other ‘simpler’ cementitious systems. As such, this literature review
considers the relevant work previously undertaken in the field of cement chemistry, as
well as that of the direct study of soil systems. This chapter describes some of the
pavement failures attributed to deleterious mineral formation. It describes the structure of
the relevant hydrous calcium sulfoaluminates and the mechanisms of their formation and
expansion. It considers the previous studies of expansive mineral formation, both in
cement and soil systems, as well as current damage mitigation measures relating to their
formation in cementitious materials.
3.2. CASE STUDIES OF SULFATE HEAVE FAILURES
Pavement failures attributed to the formation of ettringite are numerous (Mitchell, 1986;
Hunter, 1988; Perrin, 1992; Kota et al, 1996; Snedker and Temporal, 1990; Puppala,
1999; and Rollings et al 1999; Cerato & Miller, 2011). A number of factors were common
to all of these:
a source of sulfate - either as a sulfate salt or oxidisable deposit
sufficient water - provided by ingress of rain water run-off through areas of
pavement weakness, or by dynamic movement of ground-waters
a source of reactive alumina - generally provided by the dissolution of clay
minerals
alkaline conditions resulting from the use of a calcium based activator (typically
lime) or sufficient cement.
Pavement failures in which the failure was attributed to deleterious sulfate mineral
formation in the stabilised soil layer, commonly exhibited a number of similar features. In
particular, there were discrete areas of lateral and vertical heave of the pavement
38 Chapter Three - Literature Review
structure, frequently in areas where water ingress is likely, as well as a significant loss of
strength and corresponding loss of support to overlaying pavement layers. Snedker and
Temporal (1990) showed in their investigation of the M40 to Banbury failure, that
excessive sulfate contents of the insitu material, were not detected during the initial
material suitability testing. The laboratory sulfate test used at the time was unable to
detect the contribution reduced forms of sulfur (in this case pyritic deposits) can make to
the total sulfate content of the soil. These can oxidise when the ground is disturbed
during the stabilisation process, to form sulfate salts (Hawkins and Pinches, 1997).
Cerato et al (2011) reported on the failure of Oklahoma State Highway 412. Following
lime stabilisation of the subgrade, the stabilised layer heaved. This was observed as
undulations in both the subgrade and road surface. The pavement was constructed
through an area in which significant quantities of gypsiferous deposits had accumulated
in the insitu soil through natural geological processes. The failure investigated by Rollings
et al (1999) involved the development of discrete areas of heave that were 3.1 m wide
and up to 63 mm high. Excavation to the cement stabilised base course found expansion
and cracking of this layer was the cause of the failure. Water samples taken from a well
used in the construction contained appreciable levels of sulfate – approximately 10%
sulfur (expressed as SO3). The composition of the soil which comprised the base course
was reported as a clayey sand, that had clay sized particles of up to 13% that were
composed of clay minerals relatively rich in alumina. In the failure investigated by Hunter
(1988), vertical heave of up to 30 cm was observed in some sections of the Stewart
Highway in Las Vegas. Areas of degradation often corresponded with construction joints,
drainage structures and areas of standing water resulting from the run-off from nearby
buildings. Deterioration was also observed in areas where the clay content was as little as
10%.
In the case studies reviewed, the use of lime (CaO), slaked lime (Ca(OH)2) or cement,
provided conditions that were sufficiently alkaline, to promote the dissolution of reactive
alumina. The formation of expansive calcium sulfoaluminates, typically identified as
ettringite and thaumasite, was promoted by sufficient quantities of water entering the
stabilised layer. The binder addition was of sufficient quantity to maintain the necessary
alkaline conditions so that they also remained stable enough to cause expansion and
damage to the pavement.
3.3. STRUCTURE OF ETTRINGITE AND MONOSULFATE
The ettringite group of natural minerals have the generalised formula
Ca6X2Y(OH)12.24+ZH2O, where X can be Al(III), Cr(III), Mn(IV), Fe(III), or Si(IV). Y can be
Chapter Three – Literature Review 39
SO42-
, CO32-
, BO33-
, and OH-. The sulfate ion (SO4
2-) can be partially replaced with
carbonate (CO32-
) and silicon(IV) ions to form thaumasite (Ca3Si(CO3)(SO4)(OH)6.12H2O).
When the cation is Mn(IV+), jouravskite is formed (Ca3Mn(SO4,CO3)2(OH)6.12(H2O).
These examples illustrate relative ease that other ions can be substituted into the
ettringite structure.
Formation of ettringite in cementitious systems belongs to an ettringite sub-group, whose
occurrence in nature is relatively rare (Taylor, 1973). However, it occurs in both the early
and late stages of Portland cement hydration (Gougar, 1996) and in stabilised soils of
certain composition and environmental conditions. It occurs in a large number of phase’s
dependent on chloride, carbonate and alkali substitutions (Taylor 1990).
While ettringite plays a significant role in both the deterioration of cement and stabilised
soils. Related to it, but not in the ettringite group is monosulfate. Both are calcium
sulfoaluminate hydrates, but monosulfate is not considered to be deleterious (Clark and
Brown, 1999; Mitchell and Dermitas, 1990; Ouhadi and Yong, 2008). Ettringite is a
trisulfate phase, while monosulfate has a single sulfate anion per molecule and is simply
referred to as monosulfate (the former given the designation AFt and the latter AFm).
These can be considered high and low sulfate phases respectively (Smolczyk, 1961).
They have both different structures and chemical properties.
The AFt trisulfate form of ettringite has the chemical formula Ca6[Al(OH)6]2(SO4)3.26H2O
(or C6AS̄ 3H32 in cement chemistry nomenclature). Its crystals are hexagonal prisms
which are highly elongated or acicular (Moore and Taylor 1970). The crystal has two
distinct structural components: columns of {Ca6[Al(OH)6]2.24H2O}6+
and channels of
{(SO4)3.2H2O}6-
, (Gouger et al, 1996). The columns consist of Al(OH)63-
octahedra
alternating with triangular groups of edge-sharing CaO86-
polyhedra. Hydrogen atoms
from co-ordinated water molecules make up the cylindrical surface of the columns. The
channels contain four sites per formula unit of the column structure which contains six
calcium atoms. Three of these sites are occupied by SO42-
ions and the remaining site by
two by H2O molecules. The large number of ettringite phases is possible because of the
extensive substitution afforded by the column and channel-like structure (Baur et al,
2003). The hydrogen bonding network of AFt and its role in the stabilisation of the
ettringite structure is provided by Hartman and Berliner (2005). The column structure of
AFt is shown in Figure 8A and the cross-section showing the channel sites in Figure 8B.
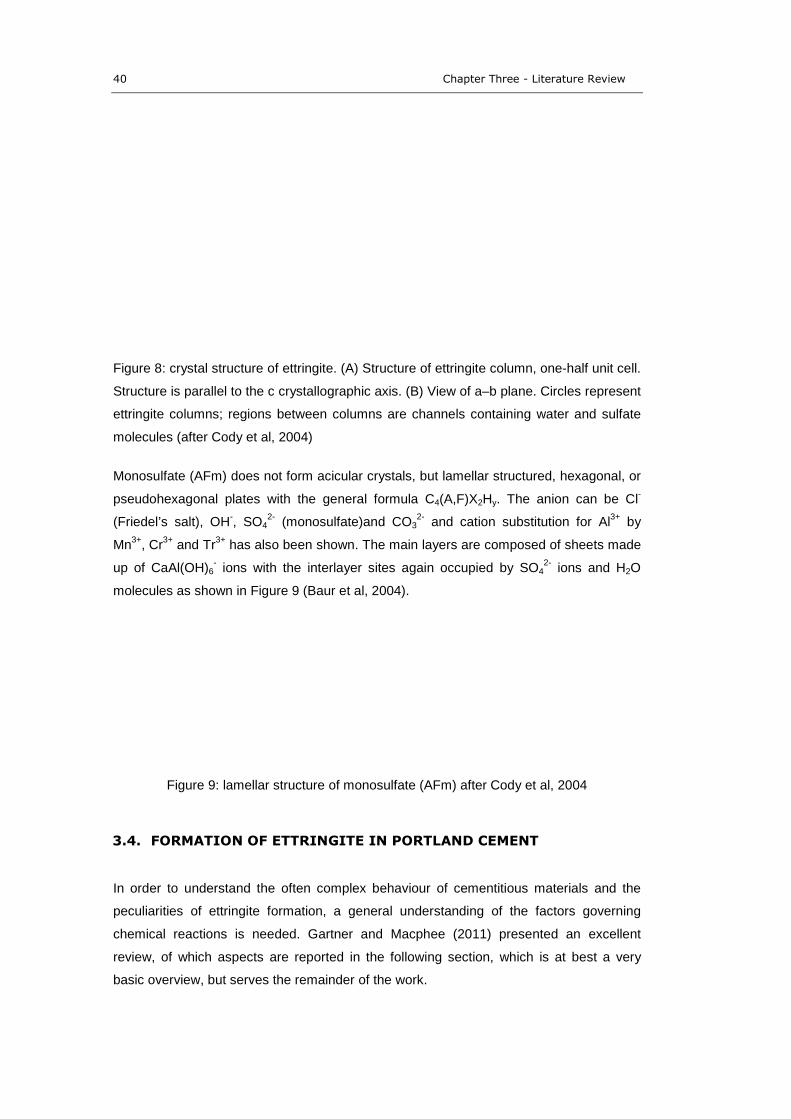
40 Chapter Three - Literature Review
Figure 8: crystal structure of ettringite. (A) Structure of ettringite column, one-half unit cell.
Structure is parallel to the c crystallographic axis. (B) View of a–b plane. Circles represent
ettringite columns; regions between columns are channels containing water and sulfate
molecules (after Cody et al, 2004)
Monosulfate (AFm) does not form acicular crystals, but lamellar structured, hexagonal, or
pseudohexagonal plates with the general formula C4(A,F)X2Hy. The anion can be Cl-
(Friedel’s salt), OH-, SO4
2-(monosulfate)and CO3
2-and cation substitution for Al
3+by
Mn3+
, Cr3+
and Tr3+
has also been shown. The main layers are composed of sheets made
up of CaAl(OH)6-
ions with the interlayer sites again occupied by SO42-
ions and H2O
molecules as shown in Figure 9 (Baur et al, 2004).
Figure 9: lamellar structure of monosulfate (AFm) after Cody et al, 2004
3.4. FORMATION OF ETTRINGITE IN PORTLAND CEMENT
In order to understand the often complex behaviour of cementitious materials and the
peculiarities of ettringite formation, a general understanding of the factors governing
chemical reactions is needed. Gartner and Macphee (2011) presented an excellent
review, of which aspects are reported in the following section, which is at best a very
basic overview, but serves the remainder of the work.
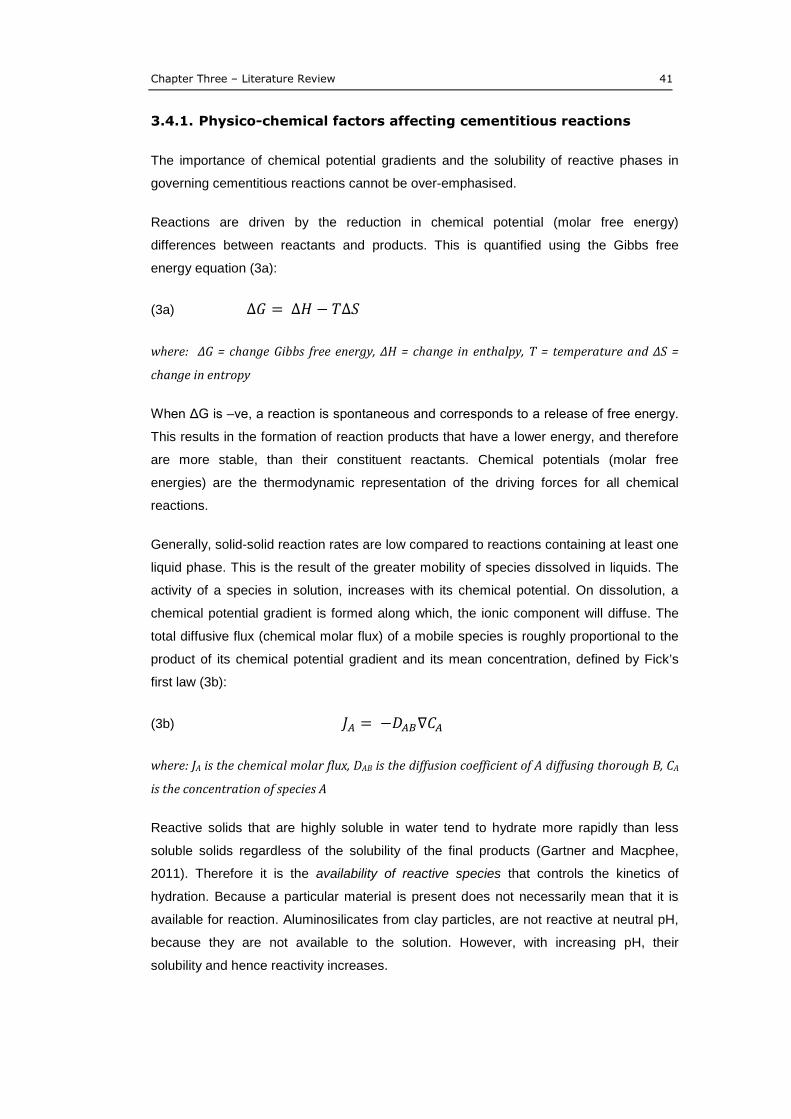
Chapter Three – Literature Review 41
3.4.1. Physico-chemical factors affecting cementitious reactions
The importance of chemical potential gradients and the solubility of reactive phases in
governing cementitious reactions cannot be over-emphasised.
Reactions are driven by the reduction in chemical potential (molar free energy)
differences between reactants and products. This is quantified using the Gibbs free
energy equation (3a):
(3a) ܩ∆ = ܪ∆ − ܶ∆ܵ
where: ΔG = change Gibbs free energy, ΔH = change in enthalpy, T = temperature and ΔS =
change in entropy
When ΔG is –ve, a reaction is spontaneous and corresponds to a release of free energy.
This results in the formation of reaction products that have a lower energy, and therefore
are more stable, than their constituent reactants. Chemical potentials (molar free
energies) are the thermodynamic representation of the driving forces for all chemical
reactions.
Generally, solid-solid reaction rates are low compared to reactions containing at least one
liquid phase. This is the result of the greater mobility of species dissolved in liquids. The
activity of a species in solution, increases with its chemical potential. On dissolution, a
chemical potential gradient is formed along which, the ionic component will diffuse. The
total diffusive flux (chemical molar flux) of a mobile species is roughly proportional to the
product of its chemical potential gradient and its mean concentration, defined by Fick’s
first law (3b):
(3b) ܬ = ܥ∇ܦ−
where: JA is the chemical molar flux, DAB is the diffusion coefficient of A diffusing thorough B, CA
is the concentration of species A
Reactive solids that are highly soluble in water tend to hydrate more rapidly than less
soluble solids regardless of the solubility of the final products (Gartner and Macphee,
2011). Therefore it is the availability of reactive species that controls the kinetics of
hydration. Because a particular material is present does not necessarily mean that it is
available for reaction. Aluminosilicates from clay particles, are not reactive at neutral pH,
because they are not available to the solution. However, with increasing pH, their
solubility and hence reactivity increases.
42 Chapter Three - Literature Review
Cementitious hydration reactions involve the dissolution of one solid phase and the
formation (usually by precipitation) of another. Dissolution and precipitation are
considered surface reactions and occur at the boundary between the solid and the
surrounding solvent (in this case water). This is called the solid-solution interface.
Dissolution-precipitation of well-ordered crystalline solids is different to those of more
disordered (amorphous) phases. For a given set of conditions, the precipitation of a
disordered phase, is more likely at high super saturations, than a closely related, more
ordered phase, that cannot nucleate or grow fast enough under the same conditions. This
is related to Ostwald’s step rule. This states that if more than one modification of the
crystal can occur, then the most stable modification, which has the lowest free energy, is
never formed first. Rather, the spontaneous decrease in free energy occurs step-by-step,
through a series of intermediate, metastable, crystalline phases. This is evidenced by the
evolution of a hydrated cementitious matrix over time. It is also the reason that
monosulfate will convert to ettringite under certain conditions (as described in Section
3.5).
3.4.2. Ettringite formation
Ettringite formation can occur in both cements and stabilised soils. In cement paste,
silicate phases (C3S and C2S) hydrate after an initial induction period and provide long-
term mechanical strength, whereas the aluminate phases (C3A and C4AF) hydrate rapidly
with no induction period (Black et al, 2006). Hardened Portland cement results from the
development of an insoluble crystalline cementitious matrix. This matrix is the product of
the hydration and precipitation of a number of clinker hydrate phases (some previously
mentioned) generically termed calcium silicate hydrates (CSH) and calcium aluminate
hydrates (CAH). The process is exothermic and the phases and crystalline structure
continue to change as the cement ages (Gougar et al, 1996).
The formation of ettringite in Portland cements has a major influence on early strength
development, setting times and, at later ages, their durability, particularly in precast steam
cured concrete blocks (Collepardi, 2003). The formation of sulfate containing
mineralogies that have an adverse effect on a materials performance and durability is
often referred to as sulfate attack (Rollings et al, 1999; Neville 2004). The formation of
ettringite after the initial setting and hardening of the cement has occurred is known as
Delayed Ettringite Formation (Taylor, 1990; Lawrence, 1998; Neville, 2004). This is
considered deleterious, resulting in a loss of strength, as well as cracking and spalling of
the hardened concrete (Diamond, 1996). It is also reasonable to use this term to describe
the formation of ettringite in stabilised soils, because the deleterious processes are much
Chapter Three – Literature Review 43
the same (generally manifested as disruptive volumetric changes (heave/swelling) and
mechanical weakening).
3.4.3. Hydration of tricalcium aluminate
Ettringite rapidly forms in the majority of Portland cements at defined water/cement ratios
and temperatures (Taylor 1990), as a result of the hydration of C3A. Typically, X-ray
peaks of ettringite are detectable within a few hours and reach a maximum at 1 day. This
so called primary ettringite formation contributes to the early strength of concrete (Cody,
et al, 2003). It forms by the reaction of tricalcium aluminate (C3A) with gypsum (CS̄H2)
and water (H) according to (3c) or (3d):
(3c) 3CaO.Al2O3 + 3CaSO4 + 26H2O → Ca6Al2(SO4)3(OH)12.26H2O
(3d) C3A + 3CS̄ + 26H → C6AS̄3H32
Its formation at the early stages of cement hydration is often desired. By varying starting
composition of the cement clinker, the quantity of AFt/AFm formed can be controlled
which in turn allows the rate at which the cement sets to be controlled (Taylor, 1990) This
cement is often termed ‘regulated set cement’ (Terai et al, 2006). These slow setting
cements are often used in the lining of deep oil wells (Kosmatka et al, 2003). The
formation of either ettringite or monosulfate in this context has no deleterious effects,
because the cement is still in a plastic state and can accommodate the formation of
expansive cement hydrates.
The retardation of cement setting occurs by slowing the hydration of the highly reactive
C3A phase. Cements with substantial quantities of C3A are characterised by the tendency
to ‘flash set’. This is a rapid setting of the cement, characterised by the evolution of much
heat, plasticity that is not regained on continued mixing and poor strength development
(Taylor, 1990). The addition of gypsum to the cement, upon hydration, causes the rapid
development of a dense coherent three dimensional nano-crystal network of ettringite
(C6AS̄3H32) on the surface of the C3A grain. This retards the diffusion of dissolving ions
into the pore solution and hinders the formation of hexagonal hydrates of C3A, such as
C4AH19, C2AH8 and ultimately the cubic hydrogarnet phase (C3AH6) which are associated
with early-stage hardening of cement (Black, 2006) resulting in longer workability times.
Many researchers have attributed the formation of this AFt layer on the surface of C3A
grains to the observed reduction of rates of hydration. Figure 10 is adapted from
Rajasekaran (2005) and shows a schematic representation of the inhibition of C3A
hydration resulting from formation of ettringite on the surface of the C3A particle:
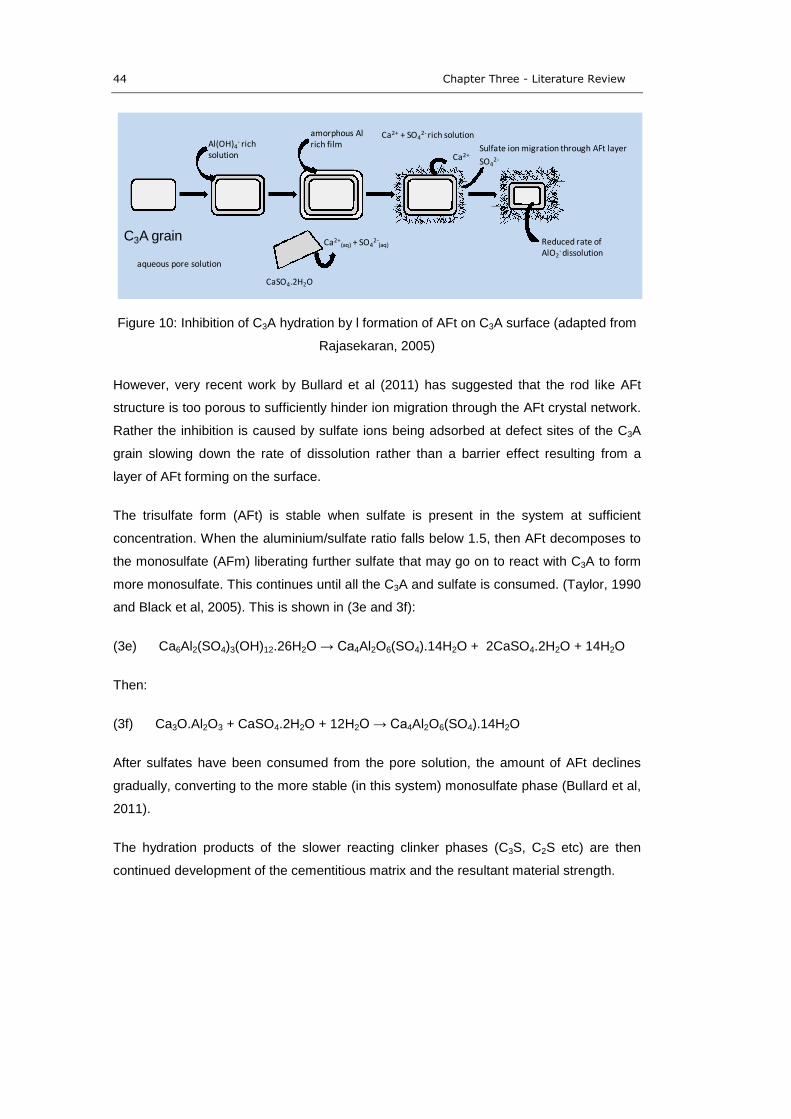
44 Chapter Three - Literature Review
Figure 10: Inhibition of C3A hydration by l formation of AFt on C3A surface (adapted from
Rajasekaran, 2005)
However, very recent work by Bullard et al (2011) has suggested that the rod like AFt
structure is too porous to sufficiently hinder ion migration through the AFt crystal network.
Rather the inhibition is caused by sulfate ions being adsorbed at defect sites of the C3A
grain slowing down the rate of dissolution rather than a barrier effect resulting from a
layer of AFt forming on the surface.
The trisulfate form (AFt) is stable when sulfate is present in the system at sufficient
concentration. When the aluminium/sulfate ratio falls below 1.5, then AFt decomposes to
the monosulfate (AFm) liberating further sulfate that may go on to react with C3A to form
more monosulfate. This continues until all the C3A and sulfate is consumed. (Taylor, 1990
and Black et al, 2005). This is shown in (3e and 3f):
(3e) Ca6Al2(SO4)3(OH)12.26H2O → Ca4Al2O6(SO4).14H2O + 2CaSO4.2H2O + 14H2O
Then:
(3f) Ca3O.Al2O3 + CaSO4.2H2O + 12H2O → Ca4Al2O6(SO4).14H2O
After sulfates have been consumed from the pore solution, the amount of AFt declines
gradually, converting to the more stable (in this system) monosulfate phase (Bullard et al,
2011).
The hydration products of the slower reacting clinker phases (C3S, C2S etc) are then
continued development of the cementitious matrix and the resultant material strength.
C3A grain
Al(OH)4- rich
solution
amorphous Alrich film
CaSO4.2H2O
Ca2+(aq) + SO4
2-(aq)
Ca2+ + SO42- rich solution
Reduced rate ofAlO2
-dissolution
Ca2+SO4
2-
Sulfate ion migration through AFt layer
aqueous pore solution
Chapter Three – Literature Review 45
3.4.4. Sulfate attack on cementitious systems and Delayed Ettringite
Formation (DEF)
Sulfate attack is considered deleterious because its formation occurs after the material
has set and the associated expansion causes damage to the cementitious microstructure.
It is sometimes referred to as secondary ettringite (Batica et al, 2000). It is often
manifested in precast concretes that have been steam cured (Collepardi 2003; Pavoine et
al, 2006) and is termed Delayed Ettringite Formation (DEF). Pavoine et al (2006) defined
the main parameters involved in DEF and are much the same as those defined in section
2.4.3 for its formation in stabilised soils:
temperature – increased temperatures modify the chemical equilibrium during
cement hydration. High early temperatures are required for the manifestation of
DEF
water – the presence of water in contact with the concrete is necessary. Included
in this are concretes which have undergone steam curing
alkaline conditions are required for ettringite stability
initial cracking of the concrete – affects the kinetics and extent of expansion
sulfates and aluminates in the cement – provide a source of reactants for
ettringite formation
The source of the sulfates differentiates whether the mode of attack is internal or external
(Brown and Hooton, 2002 and Neville, 2004). When sulfates migrate into the cement
through the movement of water containing dissolved sulfate salts, it is termed external
sulfate attack - often referred to as Type 1 sulfate attack. If the source of sulfates is
already contained in the cement, it is termed internal sulfate attack or Type 2 sulfate
attack (Collepardi 2003). Ettringite has been found to precipitate in the pore structure and
in pre-existing cracks (Kalousek and Benton, 1970).
A combination of compositional and permeability control has been used to mitigate DEF.
Limits have been placed on C3A content and the water/cement (w/c) ratio in American
standards and building codes (Brown and Hooton, 2002). Reducing the amount of C3A
correspondingly reduces the amount of alumina available for ettringite formation.
Decreasing the w/c decreases the porosity and reduces the rate of water transport (Boyd
and Mindess, 2004; Brunetaud et al, 2007).
46 Chapter Three - Literature Review
3.5. FORMATION OF ETTRINGITE IN STABILISED SOILS
Three important characteristics differentiate stabilised soils from cements: particle size,
dissolution properties at high pH and interaction with the environment. The flocculation
and subsequent agglomeration of colloidal clay particles subjected to lime treatment –
termed modification (see chapter two) result in a much reduced surface area over the
active components of Portland cement clinker. The crystal structure of clay minerals also
results in much slower dissolution rates of alumina under alkaline conditions compared to
cement. Weathering and other natural geological processes also create significant
variation in insitu soil composition, such that the formation of ettringite may not just be
dependent on reactant concentration in the soil (Little et al, 2010).
To date, it has been extremely difficult to correlate the quantity of ettringite formed with
the degree of sulfate heave in soils and free swelling in cements given the number of
interdependent factors that affect these parameters (Yan et al, 2004; Little et al, 2010;
Cerato et al, 2011;). For stabilised soils, many factors influence their behaviour: clay type;
percentage clay fraction; presence of organics; particle size distribution; sulfate cation;
temperature; duration of conditioning and the effects of mobile ground water (Mitchell and
Dermatas, 1992; Bell, 1996; Chomtid 2000; Viyanant 2000; Czerewko, 2003; Puppala,
2005; Wang, 2005; Little 2010).
The formation of ettringite in a stabilised soil is so damaging because it often occurs after
the layer has been laid and compacted, frequently when the overlaying pavement layers
have been placed (Hunter, 1988, Snedker and Temporal, 1990). On formation, ettringite
occupies a much greater volume than its constituent reactants. At the micro-scale, if the
pore volume of the soil is less than the volume required to accommodate the ettringite
formed, then expansive forces are applied to the localised area. This damages the
cementitious microstructure resulting from the formation of CAH and CSH, ultimately
resulting in a loss of strength (mechanical weakening). Furthermore, the fracturing of the
material increases the porosity, greatly increasing the risk of water ingress into the
structure, which may accelerate the rate of degradation even more.
Using molar calculations of the simple ettringite precipitation reaction (3g) and known
surface area values, Little et al (2010) predicted that when sulfate concentration is the
limiting factor in the soil system, the relationship between soluble sulfates and ettringite
formation is linear. Considering the formation of AFt from C3A, both Basista & Weglewski
(2009) and Little et al (2010) used simple calculations for component molar masses (3h)
and corresponding molar volumes (3i) to estimate the degree of expansion:
(3g) 3CaO.Al2O3 + 3CaSO4 + 26H2O → Ca6Al2(SO4)3(OH)12.26H2O
Chapter Three – Literature Review 47
(3h) mass (g/mol) 270.2 + (3 × 172.1) + (26 × 18.0) = + 1254.5 gmol-1
(3i) volume (cm3/mol) 88.8 + (3 × 71.1) + (26 × 18.0) = + 725.1 cm
3mol
-1
It also follows therefore, that assuming expansion is solely due to ettringite formation, it
too, is also directly proportional to sulfate content and, for the same system, can be
predicted.
Expansion in this system only occurs when the water consumed during ettringite
formation comes from an external source (Little et al 2010). That is, outside the localised
cementitious matrix. The volume occupied by the precipitated ettringite is much greater
that that volume occupied by the reactant soil components and results in a positive
volumetric change (swelling).
Sulfate heave in stabilised soils has also been shown to occur by both Type 1 (sufates
dissolved in mobile ground water as reported by Rollings et al, 1999) and by Type 2
(sulfate bearing deposits in the soil Snedker & Temporal, 1990; Hunter 1988) modes of
attack. By either mechanism heterogeneous (non-uniform) expansion results from the
formation of ettringite, because its resultant molar volume is much larger than the
component phases (Basista & Weglewski 2009; Little et al, 2010). The crystallisation
pressure is greater than the strength of the cementitious matrix, resulting in damage
which can be evidenced by micro-cracking of the structure and a corresponding loss of
strength (Brown et al, 2004).
The principal difference between ettringite formation in lime stabilised soils compared to
Portland cements, is the source of reactive alumina. As previously described, this is
tricalcium aluminate (C3A) in Portland cements and results in almost instantaneous
ettringite formation. In stabilised soils, the reactive alumina is derived from the dissolution
of clay minerals at high pH (Sherwood, 1962). A geochemical description was first
proposed by Hunter (1988) during his investigation of the Stewart Highway failure in Las
Vegas. As described in chapter two, the addition of lime to a soil containing clay minerals
increases the pH to > 10.5 (3j) prompting the dissolution of aluminosilicates into the pore
solution (3k):
(3j) Ca(OH)2 → Ca2+
+ 2(OH)¯
(3k) Al2Si4O10(OH)2.nH2O + 2(OH)¯
+ 10H2O → 2{2Al(OH)4¯+ 4H4SiO4} + nH2O
The aluminate ions - Al(OH)4¯
react with sulfate ions from the dissolution of gypsum (3l) to
form ettringite shown in (3m):
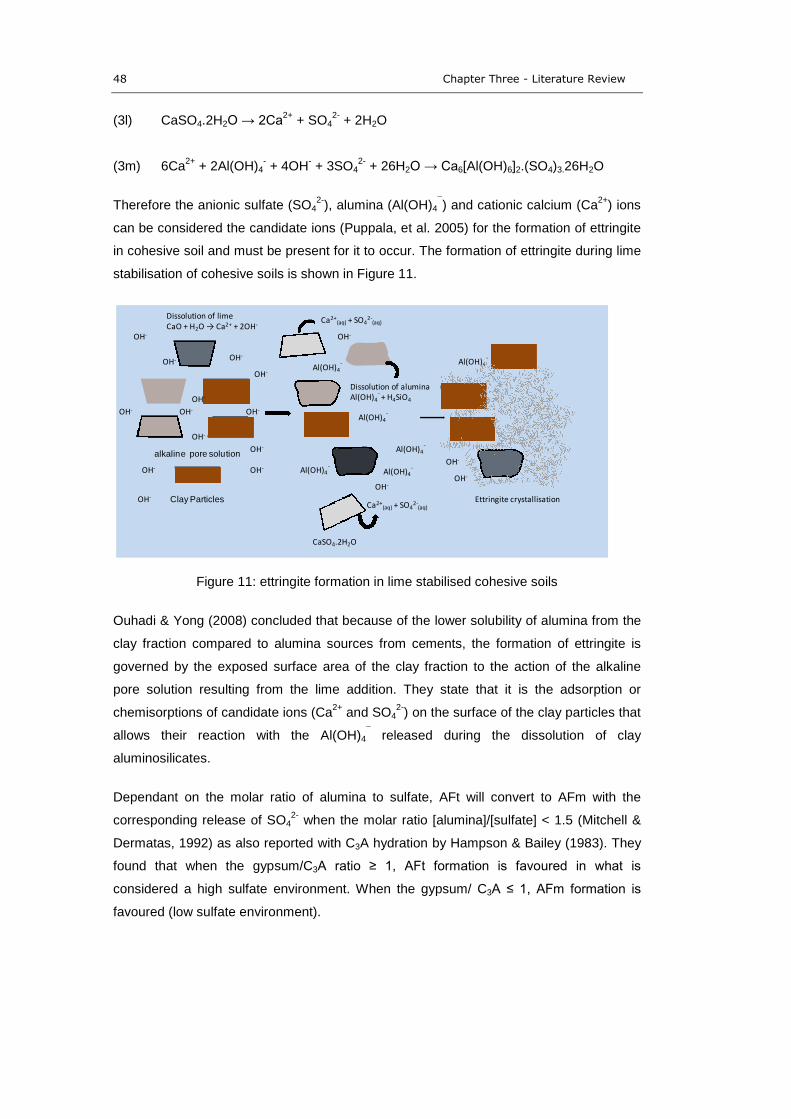
48 Chapter Three - Literature Review
(3l) CaSO4.2H2O → 2Ca2+
+ SO42-
+ 2H2O
(3m) 6Ca2+
+ 2Al(OH)4-+ 4OH
-+ 3SO4
2-+ 26H2O → Ca6[Al(OH)6]2.(SO4)3.26H2O
Therefore the anionic sulfate (SO42-
), alumina (Al(OH)4¯) and cationic calcium (Ca
2+) ions
can be considered the candidate ions (Puppala, et al. 2005) for the formation of ettringite
in cohesive soil and must be present for it to occur. The formation of ettringite during lime
stabilisation of cohesive soils is shown in Figure 11.
Figure 11: ettringite formation in lime stabilised cohesive soils
Ouhadi & Yong (2008) concluded that because of the lower solubility of alumina from the
clay fraction compared to alumina sources from cements, the formation of ettringite is
governed by the exposed surface area of the clay fraction to the action of the alkaline
pore solution resulting from the lime addition. They state that it is the adsorption or
chemisorptions of candidate ions (Ca2+
and SO42-
) on the surface of the clay particles that
allows their reaction with the Al(OH)4¯
released during the dissolution of clay
aluminosilicates.
Dependant on the molar ratio of alumina to sulfate, AFt will convert to AFm with the
corresponding release of SO42-
when the molar ratio [alumina]/[sulfate] < 1.5 (Mitchell &
Dermatas, 1992) as also reported with C3A hydration by Hampson & Bailey (1983). They
found that when the gypsum/C3A ratio ≥ 1, AFt formation is favoured in what is
considered a high sulfate environment. When the gypsum/ C3A ≤ 1, AFm formation is
favoured (low sulfate environment).
OH-
OH-
OH-
Dissolution of limeCaO + H2O → Ca2+ + 2OH-
OH-
Clay Particles
alkaline pore solution
OH-
OH-
OH-
OH-
OH-
OH-
OH-
OH-
OH-
OH-
OH-
CaSO4.2H2O
Ca2+(aq) + SO4
2-(aq)
Dissolution of aluminaAl(OH)4
¯ + H4SiO4
Al(OH)4¯
Al(OH)4¯
Al(OH)4¯
Al(OH)4¯Al(OH)4
¯
Ca2+(aq) + SO4
2-(aq)
Al(OH)4¯
Ettringite crystallisation
OH-
OH-
Chapter Three – Literature Review 49
3.6. MECHANISMS OF FORMATION AND EXPANSION
Much of the research on ettringite formation and expansion has been done on cements
and associated cementitious systems. Directly ascribing the characteristics and behaviour
of cements and the like to soil systems would be inappropriate. They have different
physical and chemical characteristics. However, as described in the following sections,
the two are related and much can be learned from this vast body of work. It must
nonetheless be considered in context.
With regard to the mechanism by which ettringite can form, Basista & Weglewski (2009)
summarised early work described in the literature that derived two competing theories:
the ‘topochemical’ mechanism (Kalousek and Benton 1970; Mather 1973; Soroka
1980; Ogawa & Roy 1981, 1982,; Cohen, 1983; Odler & Gasser 1988; Brown &
Taylor 1999) and
the ‘through-solution’ mechanism (Mehta 1973; Mehta 1976; Mehta & Hu 1978;
Mehta & Wang 1982; Ogawa & Roy 1982; Odler & Glasser 1988; Ping &
Beaudoin 1992; Min & Tang, 1994 and Taylor et al. 2011).
The work supporting both ettringite formation theories is considered. At the time of
writing, the issue is still unresolved. Although as discussed later in this chapter, both are
probably valid. The propensity of ettringite to form by one mechanism over the other is
ultimately governed by the composition of the cementitious system.
3.6.1. Topochemical Mechanism
In the topochemical mechanism, crystal growth occurs at the solid-solution interface. This
can occur when the rate of ettringite crystallisation is greater than the dissolution rate of
the candidate ions. Again considering the almost instantaneous hydration of tricalcium
aluminate - C3A (Kirchheim et al, 2009), by the topochemical mechanism, the dissolving
aluminate ions Al(OH)4-
cannot migrate far into the pore solution, because the
supersaturation of the liquid phase with respect to ettringite is so low. By this mechanism,
damage occurs when the regions of crystal growth intersect and mutually exert pressure,
forcing the particles apart (Cohen, 1983).
Ogawa and Roy (1982) studied the hydration products of C4A3S̄ and found by
microstructural observation that AFt crystallised radially around unreacted C4A3S̄
particles. Some voids remained in the structure indicating a topochemical reaction
mechanism.
50 Chapter Three - Literature Review
3.6.2. Through-solution mechanism
In the through-solution model, on hydration, the solid particles begin to dissolve and their
corresponding ions move into aqueous solution. These are termed candidate ions
(Puppala, 2005). When the pore solution becomes supersaturated with respect to
ettringite, then ettringite crystallises out (as shown in 3n, see below). In this manner, it
can form away from the source of alumina, generally in the bulk pore solution and is
characterised by nucleation and crystal growth at many sites, frequently in void spaces
throughout the material (Deng and Tang, 1993). Because of this ability to migrate through
the pore solution and crystallise in parts of the material which can accommodate crystal
growth, the occurrence of ettringite in this case is not considered deleterious. No damage
to the cementitious matrix may necessarily occur, due to the air-entrainment void space
being able to accommodate the crystal growth. As such, the through-solution mechanism
is considered less deleterious than formation by the topochemical mechanism (Kalousek
& Benton 1970 and Soroka 1979).
Mehta (1976) concluded that AFt forms from C3A by a through solution mechanism
because AFt nucleation and crystal growth was observed throughout the system, not just
at the solid-solution interface of C3A grains. They concluded that the AFt layer was not
dense enough around the C3A particles to sufficiently reduce the dissolution of reactive
ions into the pore solution. Inhibition of C3A hydration was the result of the reduced
sulfate ion concentration resulting from the reduced solubility of sulfate under alkaline
conditions.
Min and Tang (1993) also support the through solution mechanism of AFt formation in
high-alumina cement pastes. AFt will precipitate from solution when the candidate ions in
the pore solution are saturated with respect to AFt:
(3n) 6Ca2+
+ 2Al(OH)4¯
+ 4OH¯
+ 3(SO4)2-
+ 26H2O ↔ Ca6[Al(OH)6]2.(SO4)3.26H2O
The rate constant is therefore (3o):
(3o) K = [Ca2+
]6
[Al(OH)4¯]2[OH
¯]4[SO4
2-]3
If Ksp is the representative value of K at equilibrium (known as the solubility product) then
the ratio K/Ksp can serve as measure of the degree of supersaturation of the pore solution
with respect to AFt. Ettringite formation results from two processes: nucleation and crystal
growth, governed by the rate equation (3p):
(3p) =ܫ ܣ exp{−ିܶܤଷ ( ݈݊
ೞ)ିଶ}
Chapter Three – Literature Review 51
Where: A and B are characteristic parameters of the system. T = temperature (°C), K = rate
constant, Ksp = rate constant at equilibrium.
Equation (3p) shows that when K/Ksp is large, AFt nucleation is rapid. When K/Ksp is
small the rate will tend to zero. Rapid nucleation of AFt is characteristic of a topochemical
mechanism, while lower rates nucleation rates are required for AFt to form by the
through-solution mechanism (Ping & Beaudoin 1992; Min & Tang, 1994 and Taylor et al.
2011). The ion concentrations taken from Xue et al (1983) are shown in Table 8.
Table 8: Compositions of pore solutions
Cement
Concentrations (mmol/l)
OH- K+ Na+ Ca2+ SO42- Al(OH)4
- K/Ksp
Portland Cement 195 138 38.4 5.0 0.5 0.008 106.39
Sulfoaluminate Cement 0.046 13.0 12.6 26.4 35.5 0.36 105.07
Note: [ion] measured after 3 days
The propensity of ettringite to form in a cementitious system by topochemical or through
solution mechanism appears to be dependent on the hydroxide ion concentration ([OH-]).
In Portland cement paste, the high [OH-] ion concentration reduces [Ca
2+] and increases
the [SO42-
] and [Al(OH)4-
] in the pore solution. Diffusion of Al(OH)4-
is slow due to its low
concentration gradient, so the interface zone between pore solution and the hydrating
grains is supersaturated with respect to AFt, leading to many nucleation sites (large
K/Ksp). In Table 8, this is illustrated by the comparatively low concentration of candidate
ions (Ca2+
, SO42-
and Al(OH)4-) found in the pore solution because they have precipitated
out as ettringite.
In sulfoaluminate cements low [OH-] results in the ionic strength and hence mobility of
Ca2+
and SO42-
being low. Al(OH)4-
ions of a higher concentration can therefore diffuse
into the pore solution before nucleation can occur and is not restricted to the interface
zone. The concentration of the candidate ions in the pore solution of the sulfoaluminate
cement is much higher, indicating that ettringite has not formed at the solid-solution
interface, but can precipitate from the pore solution, which is characteristic of a through-
solution mechanism. Few nuclei resulting from slow nucleation, grow into large crystals in
both the bulk solution and the interface zone (small K/Ksp).
Therefore, at high [OH-] AFt crystallises from many nucleation sites at the near surface
region associated with a topochemical formation mechanism and the crystals are very
small. When [OH-] is low, the candidate ions are able to migrate into the pore solution,
52 Chapter Three - Literature Review
AFt crystallises away from the solid solution interface, forming much larger crystals
associated with the through solution mechanism .
3.6.3. Theories of Expansion
Section 3.6.1 and 3.6.2 described the theories of ettringite formation, but they do not fully
explain how ettringite formation leads to expansion and the associated damage to the
cementitious microstructure. Early work on damage mechanisms of cementitious
materials resulted in two competing theories being proposed which were summarised by
Cohen (1983):
the ‘crystal growth’ theory (Nakamura, 1960; Schwiete, 1966; Kalousek 1970;
Ish-Salom and Bentur 1974; Ogawa and Roy, 1982;)’; and
the ‘crystal swelling’ theory (Mehta, 1973, 1976; Chen and Mehta 1982; Min and
Tang, 1993).
In the crystal growth theory, expansion occurs when reaction zones of ettringite formation
intersect, continue growing and mutually exert pressure, this can result from crystals
growing on the surface of other particles (topochemically) or in the pore solution (through-
solution).
In the crystal swelling theory, expansion is caused by the swelling of relatively small
ettringite crystals that are colloidal or gel size. Expansive stress results from the
conversion of free energy of the reaction to work. (Kalousek & Benton, 1970).
Ogawa and Roy (1982) as described in Section 3.6.1 observed the formation of ettringite
on the surface of C4A3S̄ particles. These grew radially out into the pore solution.
Expansion began when these reaction zones intersected and mutually exerted pressure.
Schwiete et al (1966) studied the CaO-Al2O3-CaSO4-H2O system. They concluded that
the crystallisation pressure was the result of topochemical AFt formation on the surface of
C3A particles. Because the AFt crystals occupy a bigger volume than the C3A grains, they
eventually peel off. It is this on-going process that eventually results in the crystallisation
pressure.
Nakamura et al (1968) in their studies of the C4A3S̄-CH-CS system, found that at high
[OH-] AFt formation is topochemical and expansion is caused by the intersection of
reaction zones resulting from crystal growth. These crystals were comparatively fine.
Conversely when the [OH-] is low, AFt formed by through-solution mechanism
precipitating large crystals in the pore solution.
Chapter Three – Literature Review 53
In the crystal swelling theory, ettringite forms by the through-solution mechanism. The
crystals are very small - gel-like and colloidal in size (Mehta, 1973). The tiny crystals
have a high specific surface area with unsatisfied surface charges. They can absorb ions
and water molecules to decrease their surface energy creating an electric double layer
around the ettringite crystals in a similar manner to that which causes the swelling of
particular clays as described in Chapter two (Little et al, 2010). Intersection of these
layers produces the crystal swelling pressure (Deng & Tang, 1994). Mehta and Hu (1978)
found that an increase in the amount of absorbed water corresponded to an increase in
volumetric expansion. Ouhadi and Young (2008), showed that AFt can swell by the order
of 50% and its fluid retention increase by as much as 400% in the soils studies in their
research. They concluded that it is the crystal swelling mechanism that is responsible for
ettringite induced heave.
Mehta (1973) stated that for colloidal ettringite to cause expansion, it must be in contact
with outside water.
[Quoting Ouhadi and Yong (2008) ‘the availability and flow of pore water is the single
most important factor controlling lime-induced heave. Without an abundance of water AFt
cannot form’. And Little et al (2010) ‘the presence of external water is a decisive factor in
causing deleterious reactions in stabilised soils.’]
3.7. MITIGTION OF SULFATE HEAVE
Recently, research has been undertaken on the use of supplementary cementitious
materials (SCMs) as a way of reducing the deleterious effects of sulfate induced heave.
The use of Ground Granulated Blast Furnace Slag (GGBS), Fly Ash (FA) and Amorphous
Silica (AS) in conjunction with lime have been shown to reduce the degree of heave
(Beeghly, 2003; Wang et al, 2005; Wild et al. 1998; 1999; Higgins, 2005).
It is thought that this reduction is brought about by a combination of effects:
a reduction in material permeability, resulting from the addition of more fine
material; and
inhibition of ettringite formation resulting from a reduction in pore solution alumina
concentration due to the competitive hydration of the high silica content of the
SCMs.
A reduction in the permeability of the stabilised soil reduces the ingress of water, thereby
limiting expansive ettringite formation. This may be the result of the increased fines
54 Chapter Three - Literature Review
content filling the void structure, but can also result from the crystallisation of cementitious
hydration products from the pore solution (Wild et al, 1999).
Wild et al (1998) suggested that a combination of GGBS and lime inhibits the formation of
ettringite, because the increased amounts of CSH gel produced absorb Al(OH)4-
ions
from the dissolving clay, as well as the competitive consumption of lime, such that it is not
available for ettringite formation. They also observed increased strengths of these
materials that were attributed to the formation of CSH gels.
Wang et al (2005) also found that the addition of SCMs to cement stabilised sulfate
bearing soils, reduced the amount of ettringite formed and correspondingly, the degree of
observed heave. They concluded that in addition to more beneficial cementing product
forming, the reduction in swell was a result of a change in the mechanistic pathway of
ettringite formation. Recalling Section 3.6, when the lime hydroxide ion content is high,
ettringite precipitates crystals of colloidal or gel size on or near the surface of clay
particles, causing expansion by the crystal swelling mechanism. However, when the
hydroxide ion concentration is low, as a result of reaction with SCMs, ettringite can
migrate into the pore solution where large crystals are precipitated. As the void structure
can accommodate the crystal growth to a degree, reduced levels of expansion are
observed.
3.8. OTHER FACTORS AFFECTING FORMATION AND EXPANSION
In the previous sections it has been shown that the mechanism of ettringite formation and
expansion is a function of the availability of an external water source, dissolved alumina
and hydroxide ion concentration. It is also affected by: sulfate type and content;
conditioning time; water content on compaction; and curing time.
3.8.1. Sulfate type and concentration
The cation associated with the sulfate anion also has an effect on ettringite formation and
expansion. Gypsum (CaSO4.2H2O) is relatively insoluble at 2.58g/L and is regarded as
‘sparingly soluble’ (Burkart et al, 1999) and is even less soluble under alkaline conditions
(Little et al 2010). Other sulfate salts are more soluble, leading to greater concentration
within the pore solution, resulting in higher reaction rates (Little et al 2010).
Table 9 shows the solubility of commonly found sulfate salts.
Chapter Three – Literature Review 55
Table 9: Solubility of commonly found sulfate salts
Sulfate Salt Chemical Formula Solubility g/L (20°C)
Gypsum CaSO4.2H2O 2.58
Glauber’s Salt Na2SO4.10H2O 47.6
Epsomite MgSO4.7H2O 255
Brown et al’s (2004) studies of the microstructural changes in concretes with sulfate
exposure found that those concretes immersed in epsomite solutions (5.0%) evidenced a
lower degree of sulfate attack which did not penetrate as far as those immersed in
Glauber’s salt solution (again 5.0%). This was thought to be the result of magnesium
containing compounds being deposited on the surface structure and reducing the
permeability of the concrete. This conclusion is supported by earlier work by Brown and
Hooton (2002). This benefit is unlikely to occur in stabilised soils due to their much
greater void content and hence permeability.
Sodium sulfate (Na2SO4.10H2O) is able to react with hydrated lime to form gypsum and
sodium hydroxide (3q):
(3q) Ca(OH)2 + Na2SO4.10H2O → CaSO4.2H2O + 2NaOH + 8H2O
This reaction consumes lime, thereby reducing the available lime content (Sridhran et al,
1995). It also forms sodium hydroxide, which is a strong alkali, and so increases or at
least maintains the pH of the pore solution. The effect this has on ettringite formation
however, is unclear.
Much effort has been directed towards finding threshold trigger levels of sulfate content
that cause deleterious processes to occur in both cement (in the surrounding environment
in which it is placed) and stabilised soils.
Table 10 is adapted from Rolling and Burkes (1999) and shows assessment of risk
associated with sulfate levels that pose a threat to lime and cement stabilised soils.
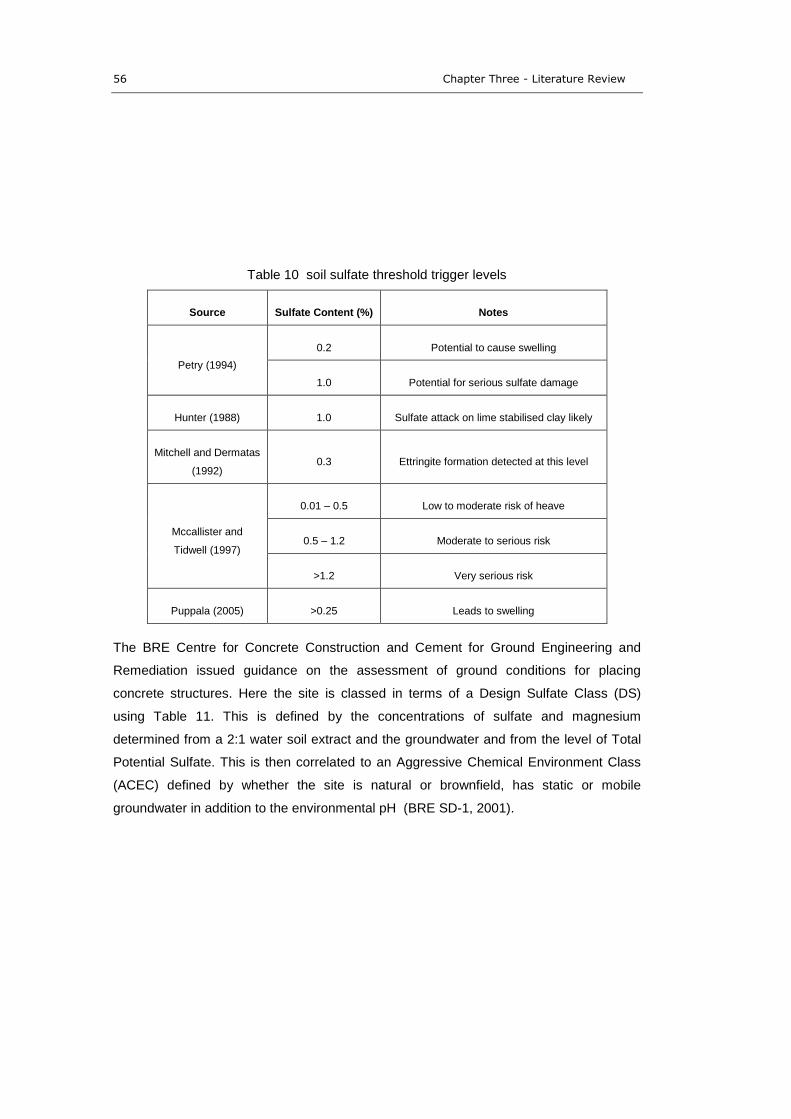
56 Chapter Three - Literature Review
Table 10 soil sulfate threshold trigger levels
Source Sulfate Content (%) Notes
Petry (1994)
0.2 Potential to cause swelling
1.0 Potential for serious sulfate damage
Hunter (1988) 1.0 Sulfate attack on lime stabilised clay likely
Mitchell and Dermatas
(1992)0.3 Ettringite formation detected at this level
Mccallister and
Tidwell (1997)
0.01 – 0.5 Low to moderate risk of heave
0.5 – 1.2 Moderate to serious risk
>1.2 Very serious risk
Puppala (2005) >0.25 Leads to swelling
The BRE Centre for Concrete Construction and Cement for Ground Engineering and
Remediation issued guidance on the assessment of ground conditions for placing
concrete structures. Here the site is classed in terms of a Design Sulfate Class (DS)
using Table 11. This is defined by the concentrations of sulfate and magnesium
determined from a 2:1 water soil extract and the groundwater and from the level of Total
Potential Sulfate. This is then correlated to an Aggressive Chemical Environment Class
(ACEC) defined by whether the site is natural or brownfield, has static or mobile
groundwater in addition to the environmental pH (BRE SD-1, 2001).
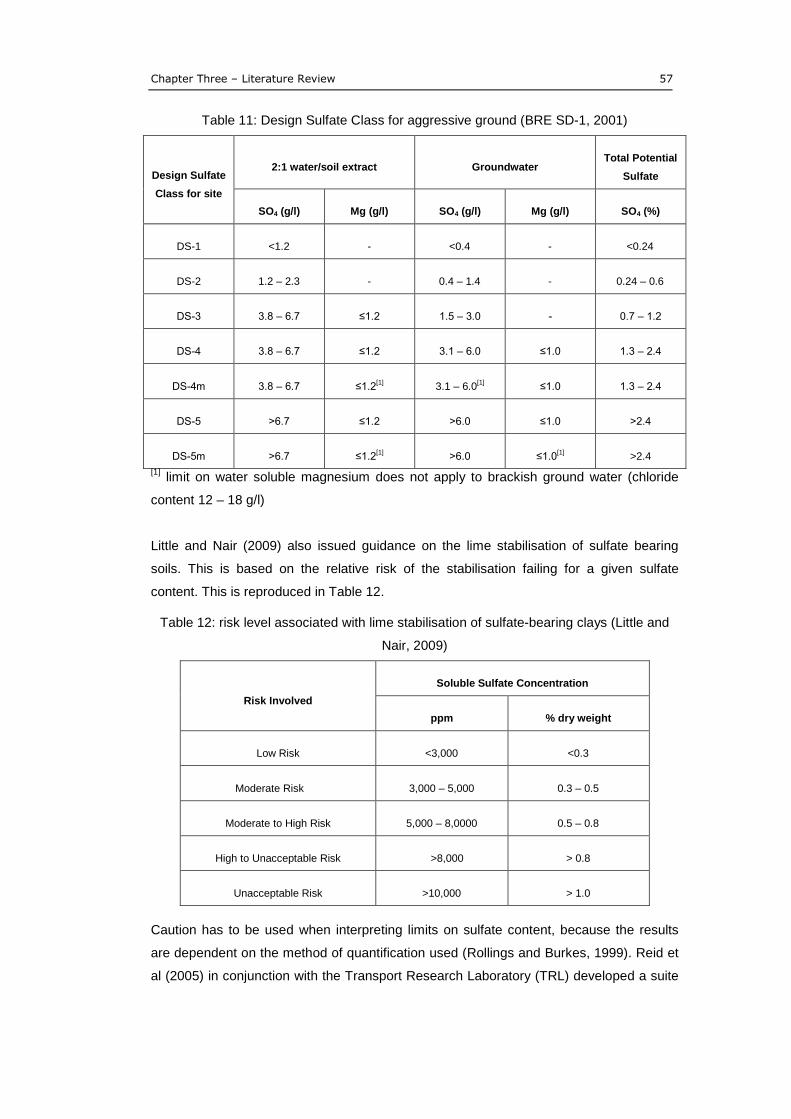
Chapter Three – Literature Review 57
Table 11: Design Sulfate Class for aggressive ground (BRE SD-1, 2001)
Design Sulfate
Class for site
2:1 water/soil extract GroundwaterTotal Potential
Sulfate
SO4 (g/l) Mg (g/l) SO4 (g/l) Mg (g/l) SO4 (%)
DS-1 <1.2 <0.4 <0.24
DS-2 1.2 – 2.3 0.4 – 1.4 0.24 – 0.6
DS3 3.8 – 6.7 ≤1.2 1.5 – 3.0 0.7 – 1.2
DS4 3.8 – 6.7 ≤1.2 3.1 – 6.0 ≤1.0 1.3 – 2.4
DS4m 3.8 – 6.7 ≤1.2[1] 3.1 – 6.0[1] ≤1.0 1.3 – 2.4
DS5 >6.7 ≤1.2 >6.0 ≤1.0 >2.4
DS5m >6.7 ≤1.2[1] >6.0 ≤1.0[1] >2.4
[1]limit on water soluble magnesium does not apply to brackish ground water (chloride
content 12 – 18 g/l)
Little and Nair (2009) also issued guidance on the lime stabilisation of sulfate bearing
soils. This is based on the relative risk of the stabilisation failing for a given sulfate
content. This is reproduced in Table 12.
Table 12: risk level associated with lime stabilisation of sulfate-bearing clays (Little and
Nair, 2009)
Risk Involved
Soluble Sulfate Concentration
ppm % dry weight
Low Risk <3,000 <0.3
Moderate Risk 3,000 – 5,000 0.3 – 0.5
Moderate to High Risk 5,000 – 8,0000 0.5 – 0.8
High to Unacceptable Risk >8,000 > 0.8
Unacceptable Risk >10,000 > 1.0
Caution has to be used when interpreting limits on sulfate content, because the results
are dependent on the method of quantification used (Rollings and Burkes, 1999). Reid et
al (2005) in conjunction with the Transport Research Laboratory (TRL) developed a suite
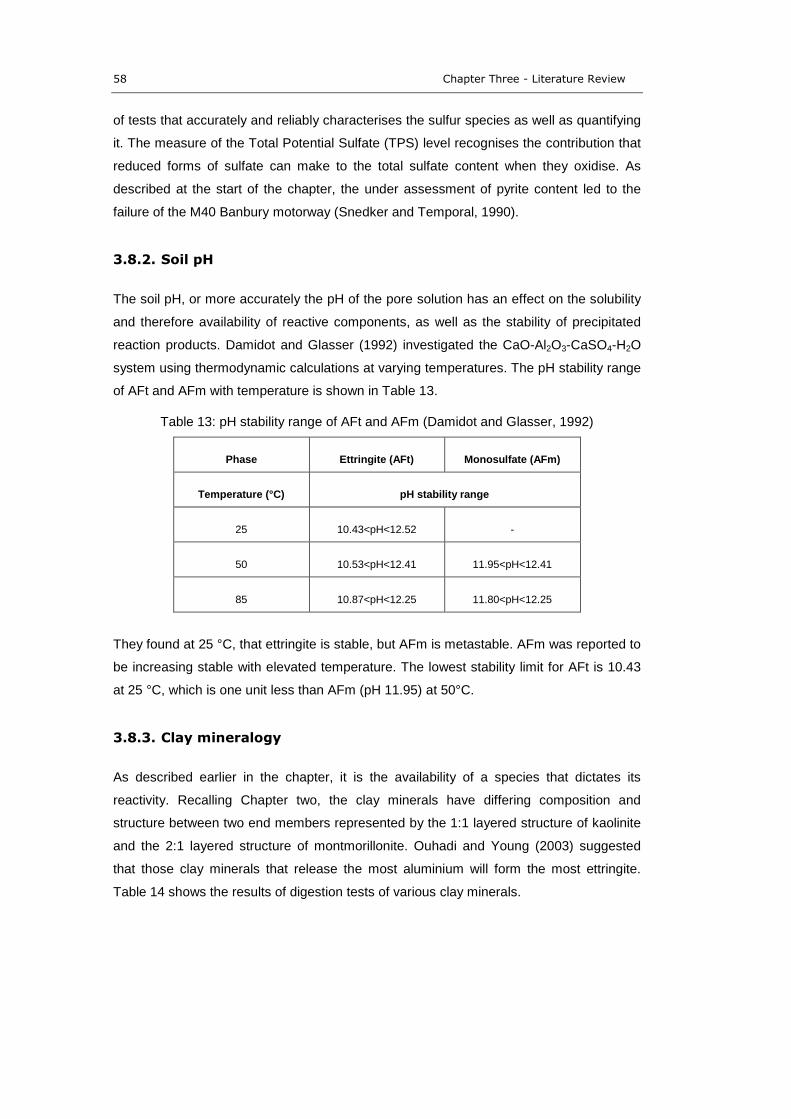
58 Chapter Three - Literature Review
of tests that accurately and reliably characterises the sulfur species as well as quantifying
it. The measure of the Total Potential Sulfate (TPS) level recognises the contribution that
reduced forms of sulfate can make to the total sulfate content when they oxidise. As
described at the start of the chapter, the under assessment of pyrite content led to the
failure of the M40 Banbury motorway (Snedker and Temporal, 1990).
3.8.2. Soil pH
The soil pH, or more accurately the pH of the pore solution has an effect on the solubility
and therefore availability of reactive components, as well as the stability of precipitated
reaction products. Damidot and Glasser (1992) investigated the CaO-Al2O3-CaSO4-H2O
system using thermodynamic calculations at varying temperatures. The pH stability range
of AFt and AFm with temperature is shown in Table 13.
Table 13: pH stability range of AFt and AFm (Damidot and Glasser, 1992)
Phase Ettringite (AFt) Monosulfate (AFm)
Temperature (°C) pH stability range
25 10.43<pH<12.52
50 10.53<pH<12.41 11.95<pH<12.41
85 10.87<pH<12.25 11.80<pH<12.25
They found at 25 °C, that ettringite is stable, but AFm is metastable. AFm was reported to
be increasing stable with elevated temperature. The lowest stability limit for AFt is 10.43
at 25 °C, which is one unit less than AFm (pH 11.95) at 50°C.
3.8.3. Clay mineralogy
As described earlier in the chapter, it is the availability of a species that dictates its
reactivity. Recalling Chapter two, the clay minerals have differing composition and
structure between two end members represented by the 1:1 layered structure of kaolinite
and the 2:1 layered structure of montmorillonite. Ouhadi and Young (2003) suggested
that those clay minerals that release the most aluminium will form the most ettringite.
Table 14 shows the results of digestion tests of various clay minerals.
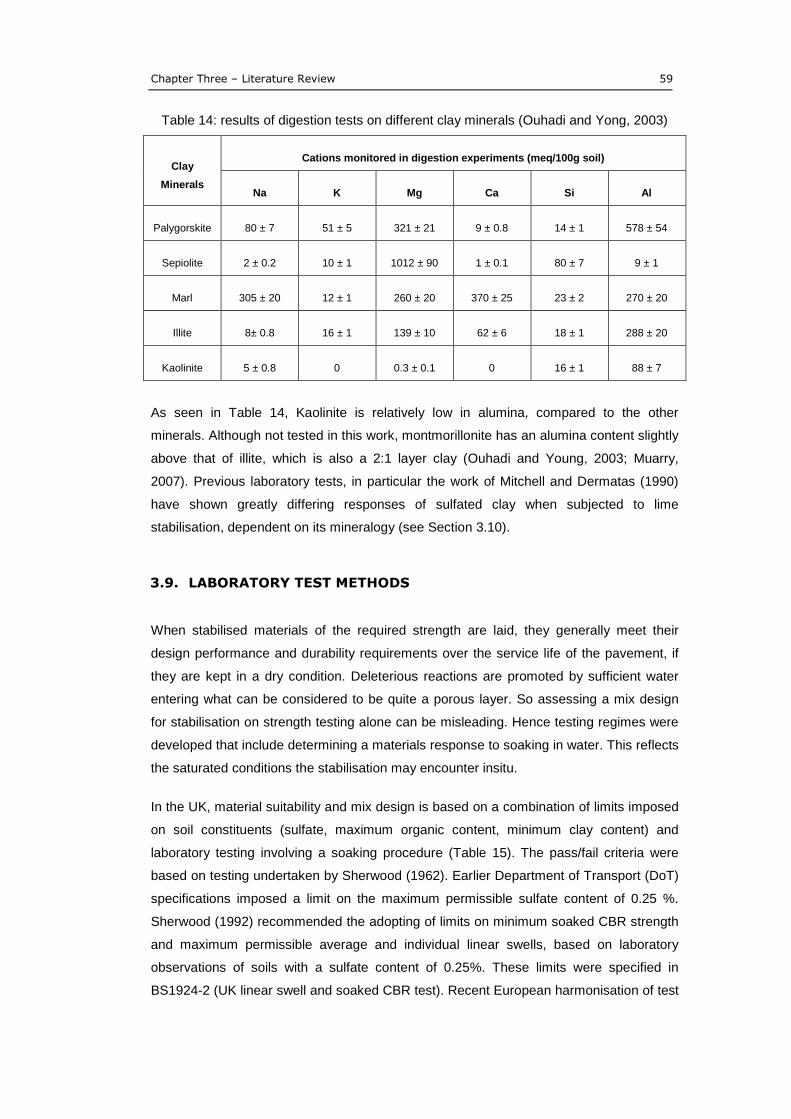
Chapter Three – Literature Review 59
Table 14: results of digestion tests on different clay minerals (Ouhadi and Yong, 2003)
Clay
Minerals
Cations monitored in digestion experiments (meq/100g soil)
Na K Mg Ca Si Al
Palygorskite 80 ± 7 51 ± 5 321 ± 21 9 ± 0.8 14 ± 1 578 ± 54
Sepiolite 2 ± 0.2 10 ± 1 1012 ± 90 1 ± 0.1 80 ± 7 9 ± 1
Marl 305 ± 20 12 ± 1 260 ± 20 370 ± 25 23 ± 2 270 ± 20
Illite 8± 0.8 16 ± 1 139 ± 10 62 ± 6 18 ± 1 288 ± 20
Kaolinite 5 ± 0.8 0 0.3 ± 0.1 0 16 ± 1 88 ± 7
As seen in Table 14, Kaolinite is relatively low in alumina, compared to the other
minerals. Although not tested in this work, montmorillonite has an alumina content slightly
above that of illite, which is also a 2:1 layer clay (Ouhadi and Young, 2003; Muarry,
2007). Previous laboratory tests, in particular the work of Mitchell and Dermatas (1990)
have shown greatly differing responses of sulfated clay when subjected to lime
stabilisation, dependent on its mineralogy (see Section 3.10).
3.9. LABORATORY TEST METHODS
When stabilised materials of the required strength are laid, they generally meet their
design performance and durability requirements over the service life of the pavement, if
they are kept in a dry condition. Deleterious reactions are promoted by sufficient water
entering what can be considered to be quite a porous layer. So assessing a mix design
for stabilisation on strength testing alone can be misleading. Hence testing regimes were
developed that include determining a materials response to soaking in water. This reflects
the saturated conditions the stabilisation may encounter insitu.
In the UK, material suitability and mix design is based on a combination of limits imposed
on soil constituents (sulfate, maximum organic content, minimum clay content) and
laboratory testing involving a soaking procedure (Table 15). The pass/fail criteria were
based on testing undertaken by Sherwood (1962). Earlier Department of Transport (DoT)
specifications imposed a limit on the maximum permissible sulfate content of 0.25 %.
Sherwood (1992) recommended the adopting of limits on minimum soaked CBR strength
and maximum permissible average and individual linear swells, based on laboratory
observations of soils with a sulfate content of 0.25%. These limits were specified in
BS1924-2 (UK linear swell and soaked CBR test). Recent European harmonisation of test
60 Chapter Three - Literature Review
standards has been the slight modification of BS1924-2 into EN 13286-47, although the
procedure and pass/fail criteria remain largely unchanged. UK practitioners also have the
option of using the less well known European accelerated swell test (EN 13286-49), in
which 3-dimensional swell is measured on relatively small specimens, completely
exposed to water on all sides, at elevated temperatures.
The purpose of any swell testing is to simulate the behaviour of a stabilised material in
the field, under less than ideal conditions, to ensure the designed soil is fit for purpose.
The relative severity of the pass/fail criteria used in the soaked CBR tests, were based on
swell responses of soils with a maximum permissible sulfate content in 1992. Subsequent
research up-holds the view that soils <3,000 ppm sulfate are suitable for stabilisation
without problems, or the need for mitigating measures. The merits of one test over
another are subject to the engineering judgement and experience of the engineer. But the
adoption of pass/fail criteria that ensures the stabilisation is fit for purpose, without being
so onerous that a perfectly suitable material/design is rejected because it cannot meet the
durability requirement of the soaking test, is also critical.
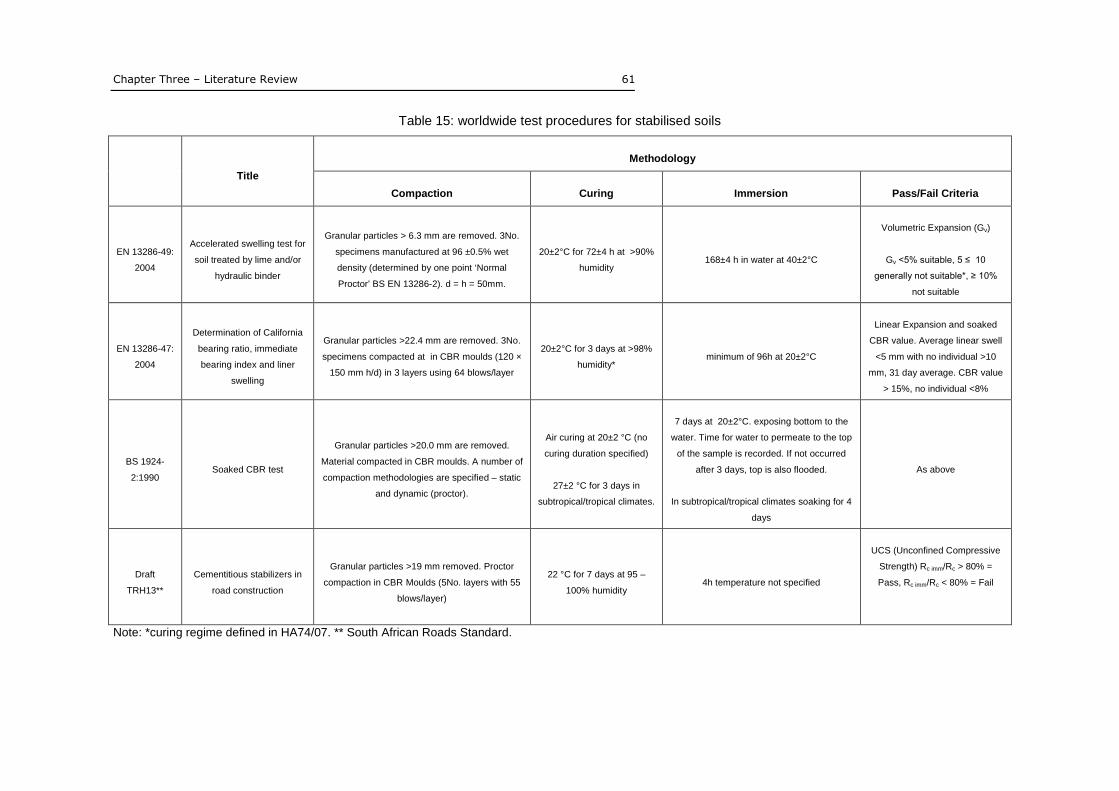
Chapter Three – Literature Review 61
Table 15: worldwide test procedures for stabilised soils
Title
Methodology
Compaction Curing Immersion Pass/Fail Criteria
EN 13286-49:
2004
Accelerated swelling test for
soil treated by lime and/or
hydraulic binder
Granular particles > 6.3 mm are removed. 3No.
specimens manufactured at 96 ±0.5% wet
density (determined by one point ‘Normal
Proctor’ BS EN 13286-2). d = h = 50mm.
20±2°C for 72±4 h at >90%
humidity168±4 h in water at 40±2°C
Volumetric Expansion (Gv)
Gv <5% suitable, 5 ≤ 10
generally not suitable*, ≥ 10%
not suitable
EN 13286-47:
2004
Determination of California
bearing ratio, immediate
bearing index and liner
swelling
Granular particles >22.4 mm are removed. 3No.
specimens compacted at in CBR moulds (120 ×
150 mm h/d) in 3 layers using 64 blows/layer
20±2°C for 3 days at >98%
humidity*minimum of 96h at 20±2°C
Linear Expansion and soaked
CBR value. Average linear swell
<5 mm with no individual >10
mm, 31 day average. CBR value
> 15%, no individual <8%
BS 1924-
2:1990Soaked CBR test
Granular particles >20.0 mm are removed.
Material compacted in CBR moulds. A number of
compaction methodologies are specified – static
and dynamic (proctor).
Air curing at 20±2 °C (no
curing duration specified)
27±2 °C for 3 days in
subtropical/tropical climates.
7 days at 20±2°C. exposing bottom to the
water. Time for water to permeate to the top
of the sample is recorded. If not occurred
after 3 days, top is also flooded.
In subtropical/tropical climates soaking for 4
days
As above
Draft
TRH13**
Cementitious stabilizers in
road construction
Granular particles >19 mm removed. Proctor
compaction in CBR Moulds (5No. layers with 55
blows/layer)
22 °C for 7 days at 95 –
100% humidity4h temperature not specified
UCS (Unconfined Compressive
Strength) Rc imm/Rc > 80% =
Pass, Rc imm/Rc < 80% = Fail
Note: *curing regime defined in HA74/07. ** South African Roads Standard.
62 Chapter Three - Literature Review
American methods do not solely rely on swell testing against pass/fail suitability criteria.
The Texas Department of Transport (Tx-DOT) uses a design procedure based on the risk
level according to the soil Sulfate Content (SC). At <3,000 ppm, their standard mix design
and construction practices are used (TxDOT, 2004) with a minimum 24 hour conditioning
time specified. At 3,000 < SC ≤ 8,000 ppm, a ‘modified treatment’ is recommended. This
involves a single lime addition, then a mix design test where the soil is compacted at a
range of water contents and conditioned for varying amounts of time. The combination in
which soluble sulfate content is measured (Tex-145-E Part II) at <3,000 ppm is then used
in the construction. For SC >8,000 ppm, alternative methods are required, such as
reducing the SC to below 3,000 ppm by mixing in low sulfate soil from another source, or
completely replacing the soil from a suitable borrow pit. Alternative binders such as
Ground Granulated Blast Furnace Slag (GGBS) or Fly-Ash (FA) can also be used to
reduce the potential sulfate heave (Wild et al, 1998; Wang et al, 2005; and Higgins et al,
2005).
3.10.LABORATORY STUDIES OF SULFATE HEAVE IN STABILISED
SOILS
Mitchell and Dematas (1990) undertook an extensive laboratory study based on the lime
stabilisation of artificial soils containing 30 % kaolin or montmorillonite clay and 70%
quartz sand. Other variables investigated were: lime; gypsum; sodium sulfate and calcium
carbonate content; duration of curing and soaking time; and also composition of the
immersion liquid - either distilled water or 10% sodium sulfate, prior to curing at 20 °C at
100% relative humidity. They measured linear swell, compressive strength and undertook
compositional analysis using XRD and SEM.
Their results indicated the presence of ettringite in all specimens except those that did not
contain any lime, sulfates or those only cured for 1 day. Drying of the kaolin based soils
during sample preparation caused the disappearance of the ettringite peaks, which was
not the case of the montmorillonite soils. This was attributed to the preferential formation
of monosulfate (AFm) in the kaolin based soils, based on the molar ratio of [Al2O3]/[SO4] =
1.54. Monosulfate is only stable in a wet environment and is known to decompose on
drying, whereas the molar ratio in the montmorillonite soils was [Al2O3]/[SO4] = 0.84,
favouring ettringite (AFt) formation, confirmed by the detection of characteristic XRD
peaks of AFt in both wet and dry samples. However kaolin soil subject to extended curing
of 6 and 20 months showed both stronger and sharper reflections that persisted on
drying. This was attributed to a significant drop in the soil pH, thereby reducing the
[alumina] resulting in AFt becoming the more stable phase. Although based on the pH
Chapter Three – Literature Review 63
studies in section 3.8.2, the conversion of AFm to AFt is more likely to be the result of the
pH dropping below the stability field of AFm rather than as a result of alumina
concentration.
The strength of both soils was found to increase with curing time. Montmorillonite soils
exhibited higher total strengths than the kaolin soils. The strength of these soils did not
however increase with greater lime content, but was exhibited with the montmorillonite
soils. Swell measurements of samples soaked at 20 °C were in the range of about 2 -
5%. This evolved rapidly, in less than two days, and was accompanied by visual evidence
of specimen deterioration. Little swell was observed in specimens in which monosulfate
was detected as the majority phase. However, the same specimens subject to the 6
month curing regime underwent significant volume increase, around 19%. This swelling
developed slowly, initiating after 4 days of soaking and stopping after 15 days and was
attributed to the conversion of AFm to AFt during the extended curing period. They also
found that the temperature of the soaking solution had a significant impact on the amount
of swelling observed in the kaolin soils. This was attributed to the temperature increasing
the reaction rate of the conversion of AFm to AFt. They surprisingly found that the
montmorillonite soils did not swell at all, irrespective of sulfate content or curing duration.
It was suggested that this was the result of the slow release of alumina from the
montmorillonite clay resulting in relatively little ettringite formation, which was unable to
overcome the confining effect of the developing cementitious matrix. This conflicts with
Burkart et al (1999) who stated that’ ‘montmorillonite is the source of most of the alumina
in the ettringite reactions of problem soils’. SEM analysis detected relatively large crystals
of AFt, ranging from 5 μm 30 μm in length and 0.2 μm to 1.8 μm in width in the kaolin
soils. They reported that in the montmorillonite soils, identification of ettringite crystals
was difficult, due to their small size (1 μm 5 μm in length and 0.05 μm to 2 μm in width.
Dermatas (1995) in later work concluded that ‘previous work conducted in this area where
the availability of alumina bearing phases from clay minerals was shown to be a key and
perhaps in some cases the factor defining the rate of ettringite formation.’
Berger et al (2002) conducted a study on the stabilisation of clay soils containing
approximately 0, 5, and 8 % sulfates with lime (4% quicklime) and lime/flyash (4 and 8%
respectively). Although they carried out the Eades and Grim test to determine the lime
addition required for stabilisation, subsequent pH measurements of test specimens were
found to be in the range 9.8 < pH < 12.2, too low for the dissolution of clay minerals and
the formation of expansive minerals. This was evidenced by poor strength gains and little
response to soaking in sulfate solution. This highlights importance of alkaline conditions,
not only for beneficial pozzolanic reactions, but for deleterious reactions such as the
formation of AFt and AFm.
64 Chapter Three - Literature Review
Puppala et al (2005) undertook swell tests on lime stabilised kaolin that was compacted
with a synthetic AFt and compacted with AFt induced to form in the soil by manufacture
with a candidate ion solution (Na2SO4). They found that the soils in which AFt was added,
exhibited greater strength, and less swell than those were AFt formation was induced.
This could be attributed to the interlocking AFt-soil matrix reinforcing the material, making
it resistant to free swell upon immersion in water. It is also suggested that little damage to
the cementitious matrix occurred on immersion, because AFt was present on compaction
and did not form insitu, with the associated volumetric expansion. Small swell strains
were observed and attributed to crystal swelling. The authors reported that crystal
swelling is known to be a smaller force than crystal formation and subsequent growth.
In a second set of experiments , they tested a kaolin, kaolin plus 8% Ca(OH)2, solid
Na2SO4 mixed with the soil compaction and kaolin plus 8% Ca(OH)2 with Na2SO4
dissolved in the manufacturing water. Swell strains were 24, 19 and 29% respectively.
The biggest AFt XRD peaks were detected in the third set, where the candidate ions were
already in solution. They also comments on the relatively slow dissolution of alumina from
kaolin based soils.
Finally in a third set of experiments they varied the lime addition as well as the amount of
sodium sulfate. Increasing the amount of lime used from 4 to 8 % resulted in less swell for
the equivalent sulfate level, but was associated with increased formation of CaCO3. They
concluded that ‘results indicate that the threshold problematic sulfate levels for inducing
heaving in subgrade soils depend on soil type, including clay mineralogy, lime dosages,
reactive alumina, pH conditions, sulfate amounts as well as the amount and size of voids
present in the compacted soils.’
Little et al (2010) tested three soil with added soluble sulfates in order to form AFt insitu
as well as testing soils with added synthesised AFt. Quantification of AFt was achieved by
Differential Scanning Calorimetry (DSC) and correlated with sulfate content. Their results
suggested a threshold sulfate level at which problematic reactions occur between 1680 –
3680 ppm. Their concluding remarks were ‘mineralogy strongly impacts activities, and
mineralogy may vary widely (in quantity and type) from one soil to another. Besides a
uniform pH regime, uniformity in mixing and water content is the best way to support
uniform and rapid crystal growth’ and ‘aluminium availability is primarily influenced by soil
mineralogy.’
Chapter Three – Literature Review 65
3.11.SUMMARY
Deleterious reactions in lime stabilised soils are associated with the formation of
expansive minerals. This expansion damages the cementitious matrix leading to a loss of
strength and dimensional stability. The minerals commonly implicated in these processes
are hydrous calcium aluminosulfats, ettringite (AFt) and monosulfate. These are formed in
alkaline soil conditions provided there is a source of reactive candidate ions: Ca2+
,
Al(OH)4-, SO4
2-and sufficient water. The mechanism of formation is complex. It can occur
topochemically, where ettringite crystal nucleation and growth occurs on the surface of
another solid, or by through-solution mechanism in which crystal growth and nucleation
occurs in the pore solution. This is characterised by ettringite formation away from the
sources of candidate ions. The mechanism by which ettringite formation is deleterious is
thought to occur by two processes:
the crystal growth theory where-by ettringite forms large crystals topochemically
and expansion results from the intersection of crystal reaction zones.
the crystal swelling theory, where ettringite forms by the through-solution
mechanism forming very small crystals that are colloidal or gel-like. These absorb
water resulting in swelling and expansive stress.
The propensity of a cementitious system to expand by a particular mechanism is
governed by the availability of the candidate ions. This is related to their chemical
potential, ion concentration and diffusive flux. The hydroxide ion (OH-) concentration has
been shown to play an important role in swelling mechanisms. When it is high AFt forms
small crystals suggesting crystal swelling mechanism of expansion. When it is low, AFt
forms large crystals suggesting crystal growth swelling mechanism of expansion.
The correlation of ettringite formation and expansion of a cementitious material is thought
to be extremely difficult. The precipitation of ettringite in the existing pore structure of a
material is not thought to contribute to expansion. The inherent variability of soils results
in difficulty in characterising and thereby quantifying the degree of expansion. Overall
ettringite and monosulfate formation is dependent on many factors. However, the
available alumina content and an excess of water are considered critical.
66
4. MATERALS AND METHODS
4.1. INTRODUCTION
This chapter details the methodology of the experimental programme, the selection and
classification of materials and the analytical techniques used in the study. The
methodology is divided into three phases. The first is the classification of the materials to
determine the composition of the artificial soil and the evaluation of their physical
response to sulfate based deleterious reactions using two laboratory swell tests (Section
4.3.2 and 4.3.3). The second is the investigation of the underlying chemical behaviour,
using a range of analytical techniques presented in Section 4.5. The third part uses the
data derived from the study to define the relationship between the physical response of
the sulfates artificial stabilised soils and the underlying chemical behaviour. Then
hypothesise the physicochemical response, which is validated with another round of
laboratory swell testing.
4.2. MATERIALS
A kaolin and montmorillionite clay have been selected for use in the research. As
described in chapter two, these cohesive soils have differing fundamental mineralogy and
have been shown to exhibit behaviour that is markedly different in terms of both macro-
physical and chemical characteristics when subject to stabilisation (Mitchell and Dimitris,
1990).
Clay that had undergone an industrial manufacturing process was selected for a number
of reasons; the typical spatial inhomogeneities of natural soils make studying their
behaviour under stabilisation difficult. Organic, sulfide/sulfate and other minor
constituents, typical of a natural soil, have been removed in the processed material, so it
is of known composition. This allows the physicochemical properties of a particular soil
mixture to be attributed to the imposed mixture composition and/or test condition. Again, if
a natural soil were used in the research, other effects such as expansion/relaxation (a risk
with consolidated clays), oxidation of pyritic deposits and action of autotrophic bacteria
mean that changes in the characteristics of natural clay are likely over time. Again making
control over mixture composition difficult. To make the soil easier to work with and more
closely reflect the composition of insitu soils, a quartz sand was also incorporated into the
soil mixtures.
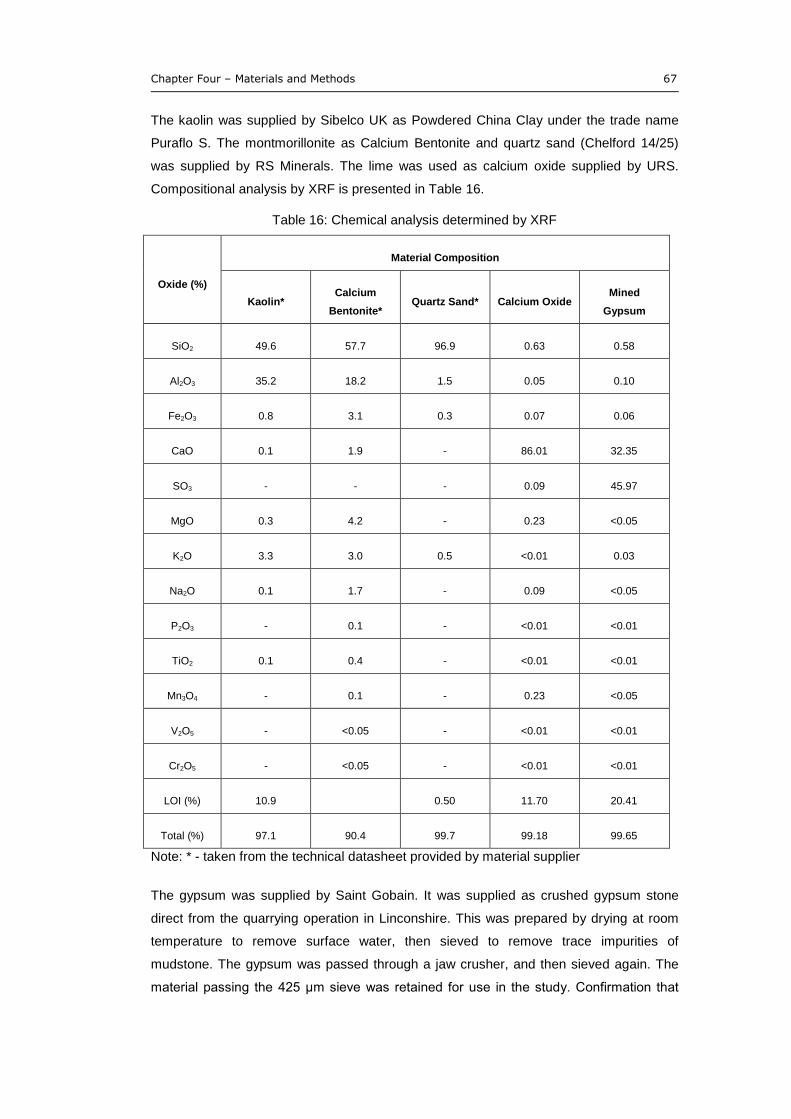
Chapter Four – Materials and Methods 67
The kaolin was supplied by Sibelco UK as Powdered China Clay under the trade name
Puraflo S. The montmorillonite as Calcium Bentonite and quartz sand (Chelford 14/25)
was supplied by RS Minerals. The lime was used as calcium oxide supplied by URS.
Compositional analysis by XRF is presented in Table 16.
Table 16: Chemical analysis determined by XRF
Oxide (%)
Material Composition
Kaolin*Calcium
Bentonite*Quartz Sand* Calcium Oxide
Mined
Gypsum
SiO2 49.6 57.7 96.9 0.63 0.58
Al2O3 35.2 18.2 1.5 0.05 0.10
Fe2O3 0.8 3.1 0.3 0.07 0.06
CaO 0.1 1.9 86.01 32.35
SO3 0.09 45.97
MgO 0.3 4.2 0.23 <0.05
K2O 3.3 3.0 0.5 <0.01 0.03
Na2O 0.1 1.7 0.09 <0.05
P2O3 0.1 <0.01 <0.01
TiO2 0.1 0.4 <0.01 <0.01
Mn3O4 0.1 0.23 <0.05
V2O5 <0.05 <0.01 <0.01
Cr2O5 <0.05 <0.01 <0.01
LOI (%) 10.9 0.50 11.70 20.41
Total (%) 97.1 90.4 99.7 99.18 99.65
Note: * - taken from the technical datasheet provided by material supplier
The gypsum was supplied by Saint Gobain. It was supplied as crushed gypsum stone
direct from the quarrying operation in Linconshire. This was prepared by drying at room
temperature to remove surface water, then sieved to remove trace impurities of
mudstone. The gypsum was passed through a jaw crusher, and then sieved again. The
material passing the 425 μm sieve was retained for use in the study. Confirmation that
68 Chapter Four – Materials and Methods
the material was the dihydrate was obtained by TGA. This along with the XRF and QXRD
(see section 4.5) was used to determine the purity of the material:
Purity of mined gypsum: 97.3% w/w CaSO4.2H2O
The purity of the lime was also determined by TGA:
Purity of quicklime: 95.6% w/w CaO
Also determined was the carbonate impurity content of 0.98% w/w CaCO3 and 3.45%
w/w Ca(OH)2. This differs from the XRF analysis, where CaO content was determined as
86%. The handling of the material on sample preparation may have introduced moisture
to the sample increasing the Ca(OH)2 content, which is inferred by the LOI of 11.7%. The
XRD patterns and TGA plots for all starting materials are supplemented in Appendix A.
4.2.1. Material classification
Material classification was undertaken in accordance with the current HA guidance on soil
stabilisation for capping and subbase. The classification tests included in the programme
are taken from Table 3/1 Soil Tests for Suitability and Design (HA74/07, DMRB, 2007).
The detailed classification data is appended in Appendix 1. The soils used in the
investigation are defined by the following Classes (Figure 3/1 HA74/07, 2007):
Class 7E – cohesive material improved with lime for lime stabilisation
Class 9D – cohesive material stabilised by lime
The following classification tests were undertaken on the starting materials and blended
soil samples (note, XRF was used for determination of SO4 content):
Plasticity Index (BS 1377-2);
Particle Size Distribution (PSD, BS 1377-2);
Initial Consumption of Lime (ICL, BS 1924-2); and
Optimum Water Content (OWC, BS 1924-2)
All the classification tests were undertaken on the blended soil mixtures except for PI,
organic matter content and PSD which were undertaken on both the starting materials
and the blended soil mixtures.
The level of organic matter is expected to be negligible given that the soil is ‘artificial’.
Excessive levels of organic material in a soil affect the pH because organic matter
decomposes to form a number of organic acids. These lower the pH and thus increase
the amount of lime required for stabilisation (Sherwood, 1992).
Chapter Four – Materials and Methods 69
Outcomes from the classification testing will define the lime binder addition (from ICL test)
and Optimum Water Content (OWC). The Initial Consumption of Lime (ICL) test is used to
determine the minimum amount of lime required for stabilisation to occur. It corresponds
to an increase in the pH of a soil solution to 12.4. At pH 12.4 the alumina and silica from
the clay fraction become soluble and are available to undergo cementitious reactions (see
Chapter two).
The OWC defines the water content of the soil at which the maximum dry density (MDD)
of the soil can be achieved for a given compactive effort. The ultimate strength of a
stabilised soil foundation is proportional to the density of the layer. Too dry and the air
voids ratio is large. If the material is too wet, then the high water content displaces the soil
material leading to a reduction in density.
Total Potential Sulfate (TPS) testing will also be carried out to confirm the correct dosing
of the soil with gypsum. The TPS of a soil defines the maximum possible sulfate content.
This is important in natural soils where historically the sulfate content was determined by
acid digestion (termed Acid Soluble Sulfate, ASS) or dissolution in water (termed Water
Soluble Sulfate, WSS). The contribution to the total sulfate content by reduced forms of
sulphur (commonly pyritic deposits) was not included, since it couldn’t be detected with
these two methods. Thus, the sulfate content during ground investigations was not
correctly assessed in some cases leading ultimately to the failure of the stabilised layer
(Snedker and Temporal, 1990). This was addressed by the Transport Research
Laboratory (TRL) resulting in the publication of TRL Report 447 (Reid et al, 2005) which
details a standard laboratory test protocol to take account of sulfides (particularly pyrite)
in clay soils which may be oxidised leading to enhanced sulfate levels (Czerewko et al,
2003). It recommends that total potential sulfate be determined by Inductively Coupled
Plasma-Atomic Emission Spectroscopy (ICP-AES) to determine total elemental sulphur
(S), which is then factored to give a total sulfate content as SO42-
. In the case of the soils
used in this study, the sulfate is supplied by a relatively pure form of gypsum, which can
be determined by ASS testing only. However, the use of ICP-AES allows a relatively
quick and accurate determination of sulfate content.
4.2.2. Mixture design
As described in Section 5.2.1 a quartz sand will be added to the clay to improve the
handling characteristics of the soil on manufacturing the specimens and also produce a
soil similar to that found insitu. Four dosage levels of calcium sulfate (gypsum) will be
added to the clay/sand mix. These are also classified by their Design Sulfate Class (DS)
as developed by BRE (BRE SD-1, 2004):
70 Chapter Four – Materials and Methods
0.0% TPS (DS-1) – this will act as a control group, both with lime stabilisation and
without lime stabilisation ;
0.5% TPS (DS-2) – reported as the lower limit in the literature in some cases at
which sulfates can cause deleterious effects;
1.5% TPS (DS-4) – taken as a median value and one which is 0.5% higher than
the upper limit for soils suitable for stabilisation;
5.0% TPS (DS-5) – a relatively high sulfate content will represent an extreme
case and should lead to severe volumetric instability and loss of strength.
The soil compositions used in the experimental programme are shown in Table 18. The
lime content is determined by the ICL test + 2.5% in accordance with the
recommendations in HA74/07 (2007). The amount of lime required (ICL) was determined
in accordance with the procedure set out in BS 1924-2, the results of which are presented
in Table 17 and are rounded to the nearest 0.5%.
Table 17: Results of Initial Consumption of Lime testing (BS1924-2)
Clay Initial Consumption of Lime (ICL) + 2.5 (%)
Kaolinite 4.0
Montmorillonite 6.0
Based on the above additions, the amount of ‘free’ lime in the soil mixtures of each clay
type will be equal. The montmorillonite was expected to have a higher ICL value due to
the greater cation exchange capacity of this clay (Drever, 1985).
The clay content was fixed at 60% and the remainder comprising a silica sand and
sulfate. This was done so that the equivalent concentrations of clay/lime/sulfate were
equal over the two clay types. The silica sand is inert and was primarily included to
improve the handling characteristics of the soil during specimen manufacture and testing
and also produce an artificial soil that more closely reflects that found insitu.
The soil samples were produced by first blending the dry powders of the clay, sand and
gypsum (as required) in a 40 L rotary drum mixer. Demineralised water was then added
to the OWC+2%. This was thoroughly mixed through the soil before quicklime was
added. This was blended into the sample, after which it was sealed in a plastic sack and
conditioned for 24 ± 1 hour at 20 ±2 °C. Following conditioning, the soil was transferred
back to the drum mixer and adjusted with further demineralised water back to OWC+2%,
on account of the drying effect resulting from the quicklime addition. The sample was then
used to produce swell test specimens according to the procedure defined in the relevant
standard (see Section 4.3.2 and 4.3.3).
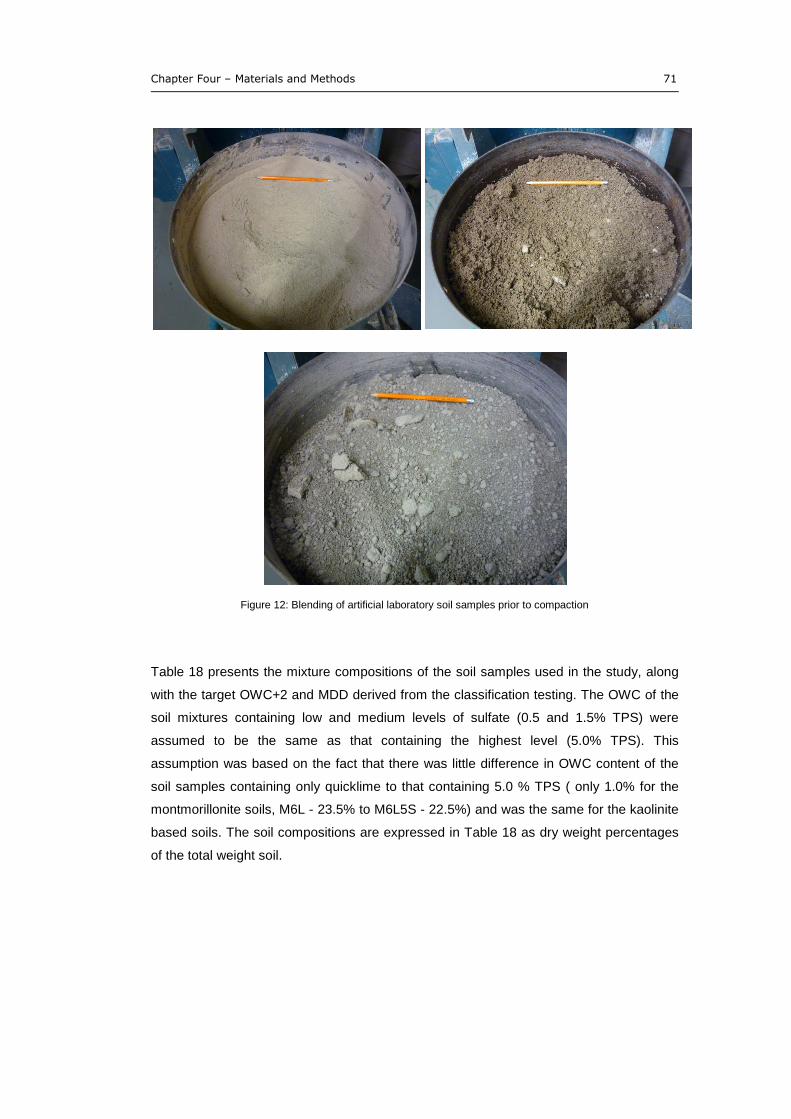
Chapter Four – Materials and Methods 71
Figure 12: Blending of artificial laboratory soil samples prior to compaction
Table 18 presents the mixture compositions of the soil samples used in the study, along
with the target OWC+2 and MDD derived from the classification testing. The OWC of the
soil mixtures containing low and medium levels of sulfate (0.5 and 1.5% TPS) were
assumed to be the same as that containing the highest level (5.0% TPS). This
assumption was based on the fact that there was little difference in OWC content of the
soil samples containing only quicklime to that containing 5.0 % TPS ( only 1.0% for the
montmorillonite soils, M6L - 23.5% to M6L5S - 22.5%) and was the same for the kaolinite
based soils. The soil compositions are expressed in Table 18 as dry weight percentages
of the total weight soil.
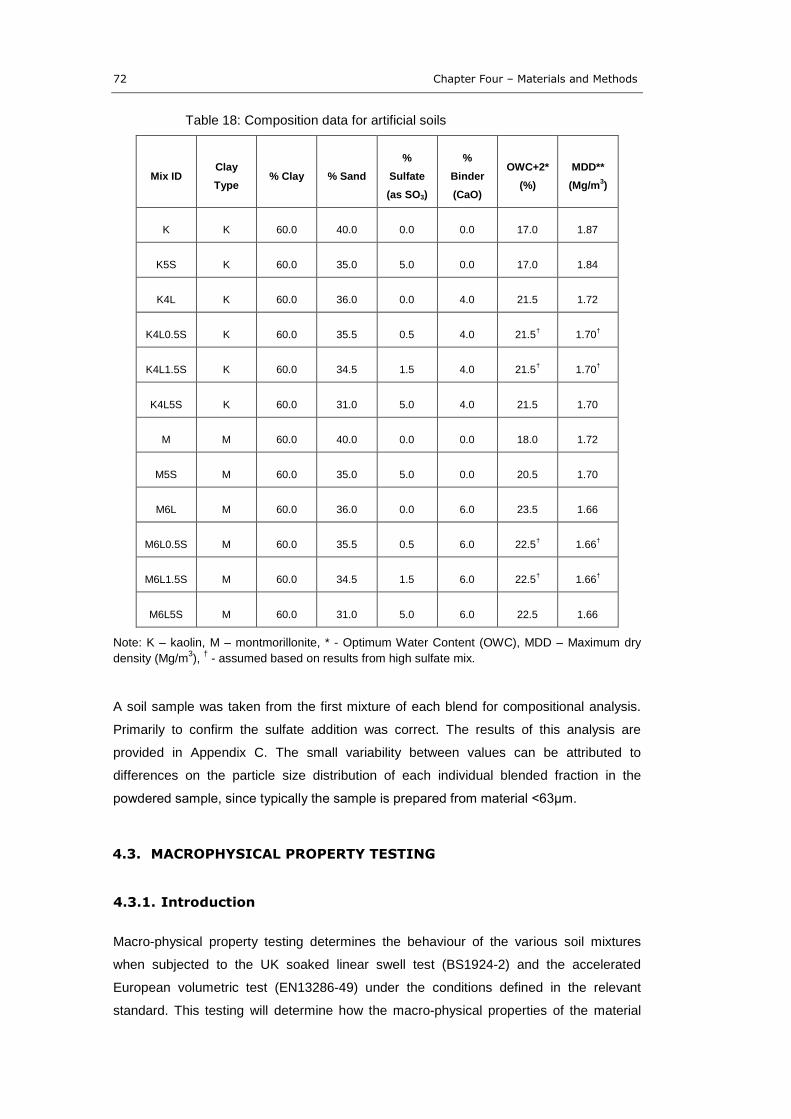
72 Chapter Four – Materials and Methods
Table 18: Composition data for artificial soils
Mix IDClay
Type% Clay % Sand
%
Sulfate
(as SO3)
%
Binder
(CaO)
OWC+2*
(%)
MDD**
(Mg/m3)
K K 60.0 40.0 0.0 0.0 17.0 1.87
K5S K 60.0 35.0 5.0 0.0 17.0 1.84
K4L K 60.0 36.0 0.0 4.0 21.5 1.72
K4L0.5S K 60.0 35.5 0.5 4.0 21.5† 1.70†
K4L1.5S K 60.0 34.5 1.5 4.0 21.5† 1.70†
K4L5S K 60.0 31.0 5.0 4.0 21.5 1.70
M M 60.0 40.0 0.0 0.0 18.0 1.72
M5S M 60.0 35.0 5.0 0.0 20.5 1.70
M6L M 60.0 36.0 0.0 6.0 23.5 1.66
M6L0.5S M 60.0 35.5 0.5 6.0 22.5† 1.66†
M6L1.5S M 60.0 34.5 1.5 6.0 22.5† 1.66†
M6L5S M 60.0 31.0 5.0 6.0 22.5 1.66
Note: K – kaolin, M – montmorillonite, * - Optimum Water Content (OWC), MDD – Maximum dry
density (Mg/m3),
†- assumed based on results from high sulfate mix.
A soil sample was taken from the first mixture of each blend for compositional analysis.
Primarily to confirm the sulfate addition was correct. The results of this analysis are
provided in Appendix C. The small variability between values can be attributed to
differences on the particle size distribution of each individual blended fraction in the
powdered sample, since typically the sample is prepared from material <63μm.
4.3. MACROPHYSICAL PROPERTY TESTING
4.3.1. Introduction
Macro-physical property testing determines the behaviour of the various soil mixtures
when subjected to the UK soaked linear swell test (BS1924-2) and the accelerated
European volumetric test (EN13286-49) under the conditions defined in the relevant
standard. This testing will determine how the macro-physical properties of the material
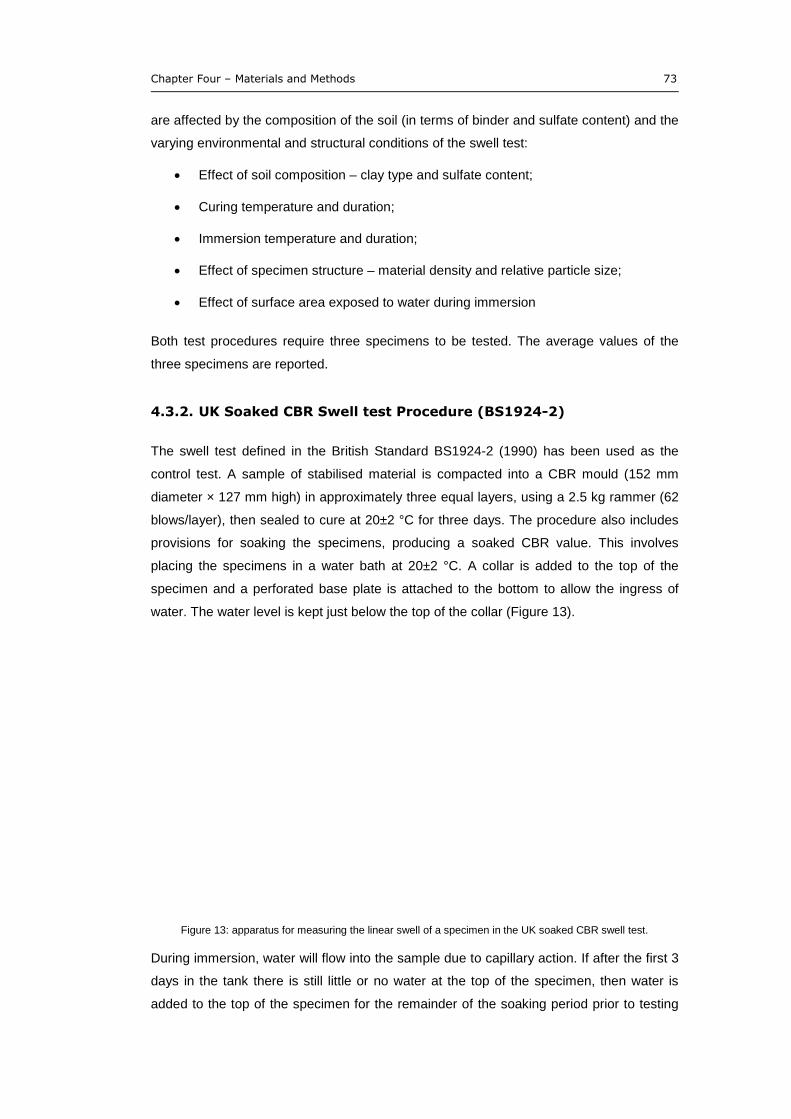
Chapter Four – Materials and Methods 73
are affected by the composition of the soil (in terms of binder and sulfate content) and the
varying environmental and structural conditions of the swell test:
Effect of soil composition – clay type and sulfate content;
Curing temperature and duration;
Immersion temperature and duration;
Effect of specimen structure – material density and relative particle size;
Effect of surface area exposed to water during immersion
Both test procedures require three specimens to be tested. The average values of the
three specimens are reported.
4.3.2. UK Soaked CBR Swell test Procedure (BS1924-2)
The swell test defined in the British Standard BS1924-2 (1990) has been used as the
control test. A sample of stabilised material is compacted into a CBR mould (152 mm
diameter × 127 mm high) in approximately three equal layers, using a 2.5 kg rammer (62
blows/layer), then sealed to cure at 20±2 °C for three days. The procedure also includes
provisions for soaking the specimens, producing a soaked CBR value. This involves
placing the specimens in a water bath at 20±2 °C. A collar is added to the top of the
specimen and a perforated base plate is attached to the bottom to allow the ingress of
water. The water level is kept just below the top of the collar (Figure 13).
Figure 13: apparatus for measuring the linear swell of a specimen in the UK soaked CBR swell test.
During immersion, water will flow into the sample due to capillary action. If after the first 3
days in the tank there is still little or no water at the top of the specimen, then water is
added to the top of the specimen for the remainder of the soaking period prior to testing
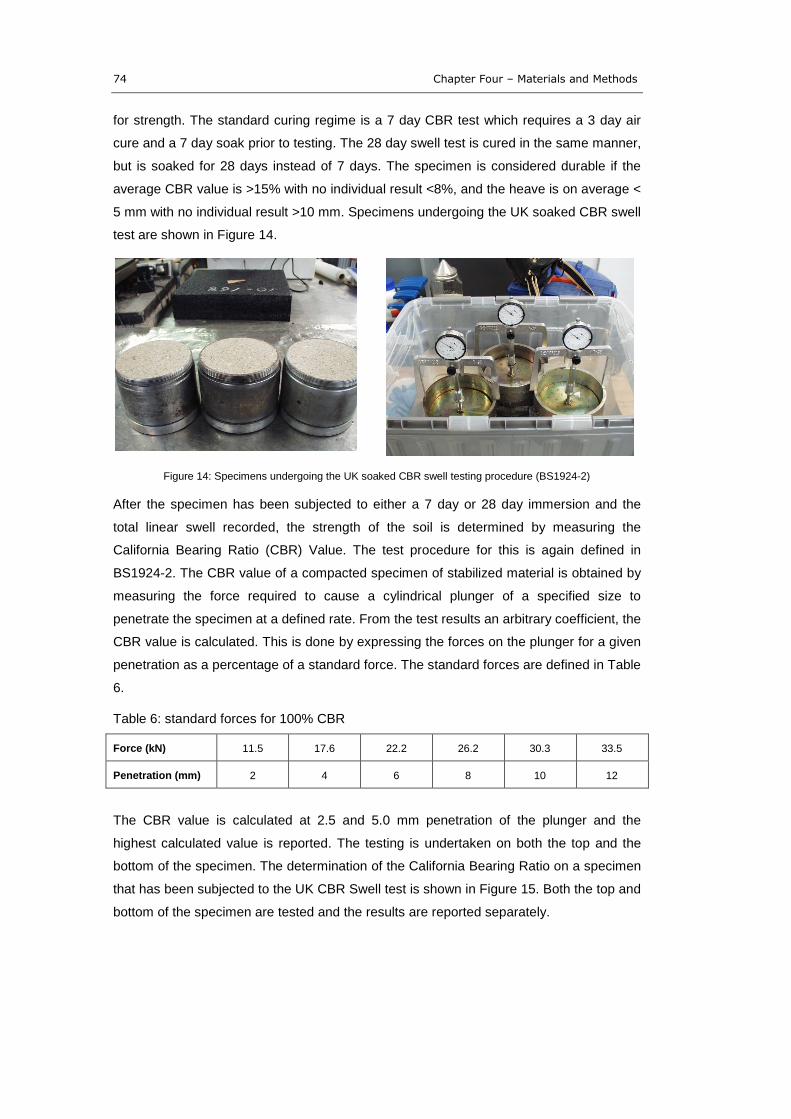
74 Chapter Four – Materials and Methods
for strength. The standard curing regime is a 7 day CBR test which requires a 3 day air
cure and a 7 day soak prior to testing. The 28 day swell test is cured in the same manner,
but is soaked for 28 days instead of 7 days. The specimen is considered durable if the
average CBR value is >15% with no individual result <8%, and the heave is on average <
5 mm with no individual result >10 mm. Specimens undergoing the UK soaked CBR swell
test are shown in Figure 14.
Figure 14: Specimens undergoing the UK soaked CBR swell testing procedure (BS1924-2)
After the specimen has been subjected to either a 7 day or 28 day immersion and the
total linear swell recorded, the strength of the soil is determined by measuring the
California Bearing Ratio (CBR) Value. The test procedure for this is again defined in
BS1924-2. The CBR value of a compacted specimen of stabilized material is obtained by
measuring the force required to cause a cylindrical plunger of a specified size to
penetrate the specimen at a defined rate. From the test results an arbitrary coefficient, the
CBR value is calculated. This is done by expressing the forces on the plunger for a given
penetration as a percentage of a standard force. The standard forces are defined in Table
6.
Table 6: standard forces for 100% CBR
Force (kN) 11.5 17.6 22.2 26.2 30.3 33.5
Penetration (mm) 2 4 6 8 10 12
The CBR value is calculated at 2.5 and 5.0 mm penetration of the plunger and the
highest calculated value is reported. The testing is undertaken on both the top and the
bottom of the specimen. The determination of the California Bearing Ratio on a specimen
that has been subjected to the UK CBR Swell test is shown in Figure 15. Both the top and
bottom of the specimen are tested and the results are reported separately.
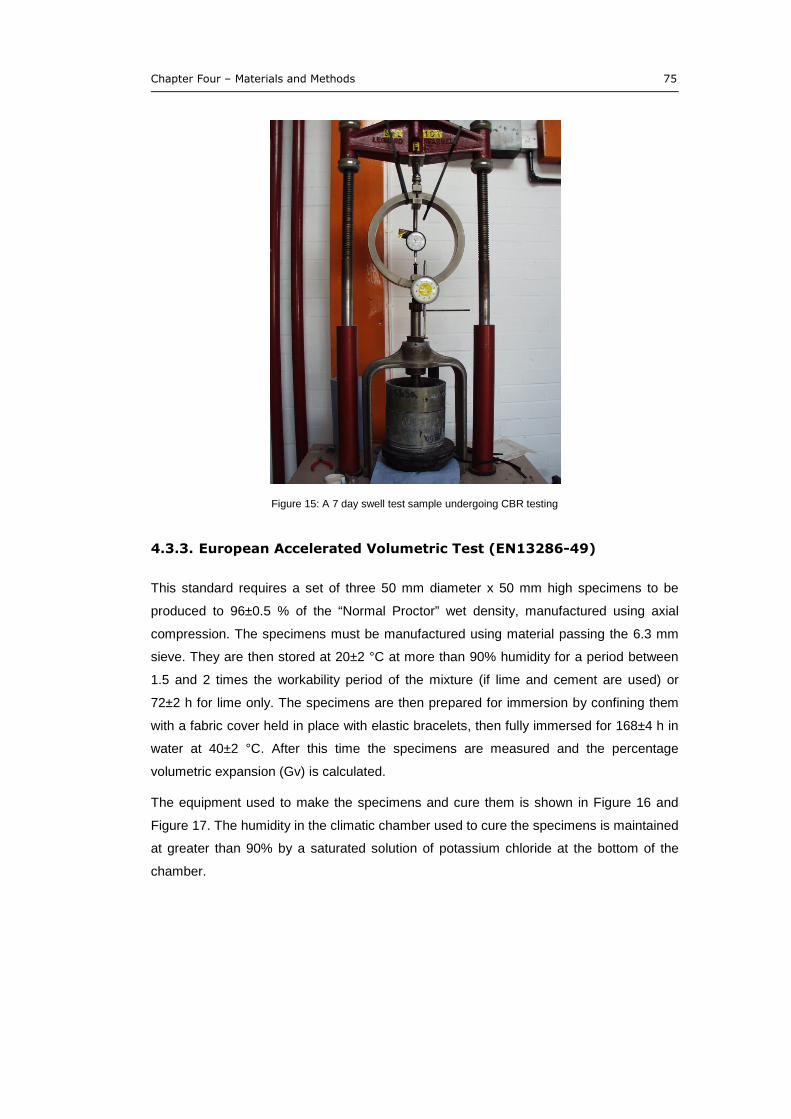
Chapter Four – Materials and Methods 75
Figure 15: A 7 day swell test sample undergoing CBR testing
4.3.3. European Accelerated Volumetric Test (EN13286-49)
This standard requires a set of three 50 mm diameter x 50 mm high specimens to be
produced to 96±0.5 % of the “Normal Proctor” wet density, manufactured using axial
compression. The specimens must be manufactured using material passing the 6.3 mm
sieve. They are then stored at 20±2 °C at more than 90% humidity for a period between
1.5 and 2 times the workability period of the mixture (if lime and cement are used) or
72±2 h for lime only. The specimens are then prepared for immersion by confining them
with a fabric cover held in place with elastic bracelets, then fully immersed for 168±4 h in
water at 40±2 °C. After this time the specimens are measured and the percentage
volumetric expansion (Gv) is calculated.
The equipment used to make the specimens and cure them is shown in Figure 16 and
Figure 17. The humidity in the climatic chamber used to cure the specimens is maintained
at greater than 90% by a saturated solution of potassium chloride at the bottom of the
chamber.

76 Chapter Four – Materials and Methods
Figure 16: Specimen moulds and soil specimens produced to EN 13286-49
Figure 17: Climatic air curing chamber and wrapped specimens prior to immersion (EN 13286-49)
Digital callipers are used to measure the dimensions of the specimen periodically during
the immersion period. The volume of the specimen is calculated from the average height
(determined from two measurements) and the average diameter (three measurements) in
accordance with Figure 7.
Figure 18: Method for determining the volume of a specimen
Chapter Four – Materials and Methods 77
The initial volume (V0) after demoulding is measured prior to immersion. The volume after
immersion (V1) is measured at the end of the soaking period. The volume of the
specimen and the confinement wrapping is V2. Volumetric expansion (Gv) is given by
(4a):
(4a) (%)௩ܩ = 100 ×[(భି�మ)]
బ
where: V0 is the initial volume, V1 is the volume after immersion , V2 is the volume of the
confinement wrapping
The European accelerated swelling test is unconfined and allows expansion in all
directions. The pass/fail criteria for this test is given in the European standard prEN
14227-11 (2006) ‘Hydraulically bound mixtures, Specifications - Part 11: Soil treated by
lime’. It defines that if the volumetric swell (Gv) at the end of the test is greater than 5%
then the soil is not suitable for stabilisation. However it does note that ‘where the
volumetric swelling is greater than 5% but does not exceed 10%, the use of the mixture
is generally not possible; however a complementary study can be made according to
experience at the place of use.’
4.3.4. Summary
Table 19 provides a summary of the conditions required for swell testing using the test
procedures BS1924-2 and EN 13286-49. BS1924-2 specifies immersion in water for 7
and 28 days. This has been extended in the study to 90 days to determine the effect
long-term immersion has on the material behaviour and composition. Similarly specimens
undergoing EN 13286-49 were also immersed for up to 14 days (336 hours) in some
cases (see Chapter 7).
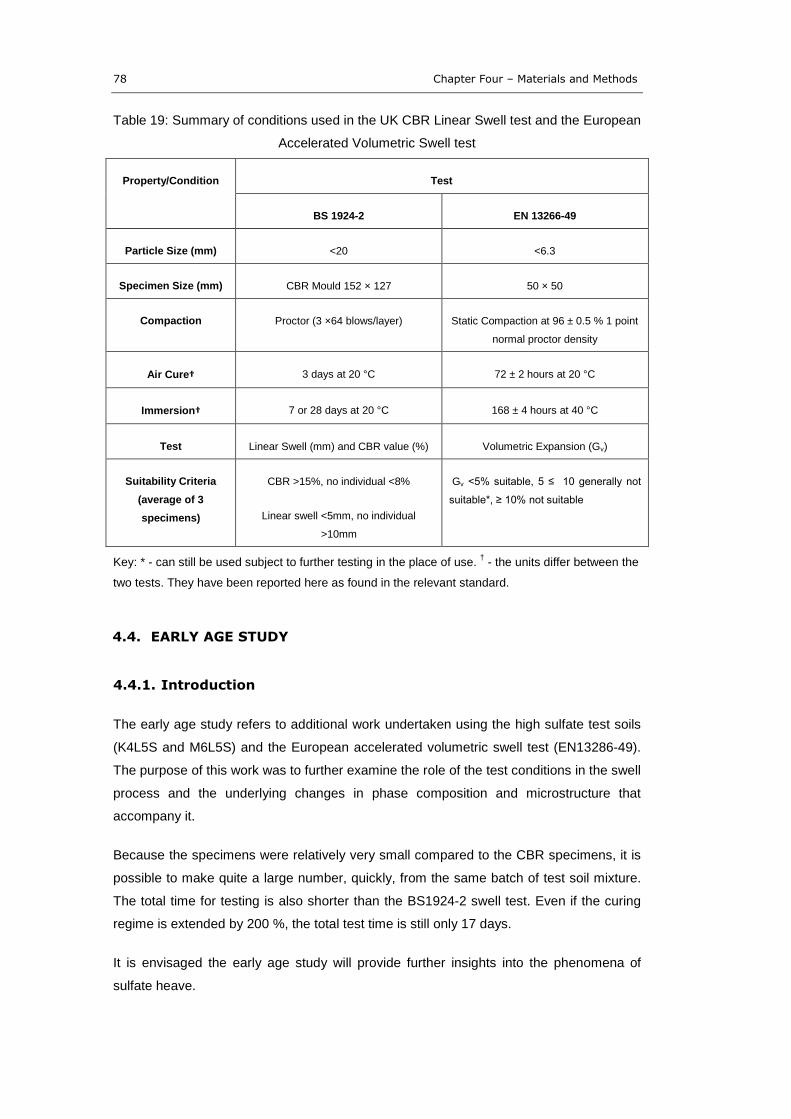
78 Chapter Four – Materials and Methods
Table 19: Summary of conditions used in the UK CBR Linear Swell test and the European
Accelerated Volumetric Swell test
Property/Condition Test
BS 1924-2 EN 13266-49
Particle Size (mm) <20 <6.3
Specimen Size (mm) CBR Mould 152 × 127 50 × 50
Compaction Proctor (3 ×64 blows/layer) Static Compaction at 96 ± 0.5 % 1 point
normal proctor density
Air Cure† 3 days at 20 °C 72 ± 2 hours at 20 °C
Immersion† 7 or 28 days at 20 °C 168 ± 4 hours at 40 °C
Test Linear Swell (mm) and CBR value (%) Volumetric Expansion (Gv)
Suitability Criteria
(average of 3
specimens)
CBR >15%, no individual <8%
Linear swell <5mm, no individual
>10mm
Gv <5% suitable, 5 ≤ 10 generally not
suitable*, ≥ 10% not suitable
Key: * - can still be used subject to further testing in the place of use.†
- the units differ between the
two tests. They have been reported here as found in the relevant standard.
4.4. EARLY AGE STUDY
4.4.1. Introduction
The early age study refers to additional work undertaken using the high sulfate test soils
(K4L5S and M6L5S) and the European accelerated volumetric swell test (EN13286-49).
The purpose of this work was to further examine the role of the test conditions in the swell
process and the underlying changes in phase composition and microstructure that
accompany it.
Because the specimens were relatively very small compared to the CBR specimens, it is
possible to make quite a large number, quickly, from the same batch of test soil mixture.
The total time for testing is also shorter than the BS1924-2 swell test. Even if the curing
regime is extended by 200 %, the total test time is still only 17 days.
It is envisaged the early age study will provide further insights into the phenomena of
sulfate heave.
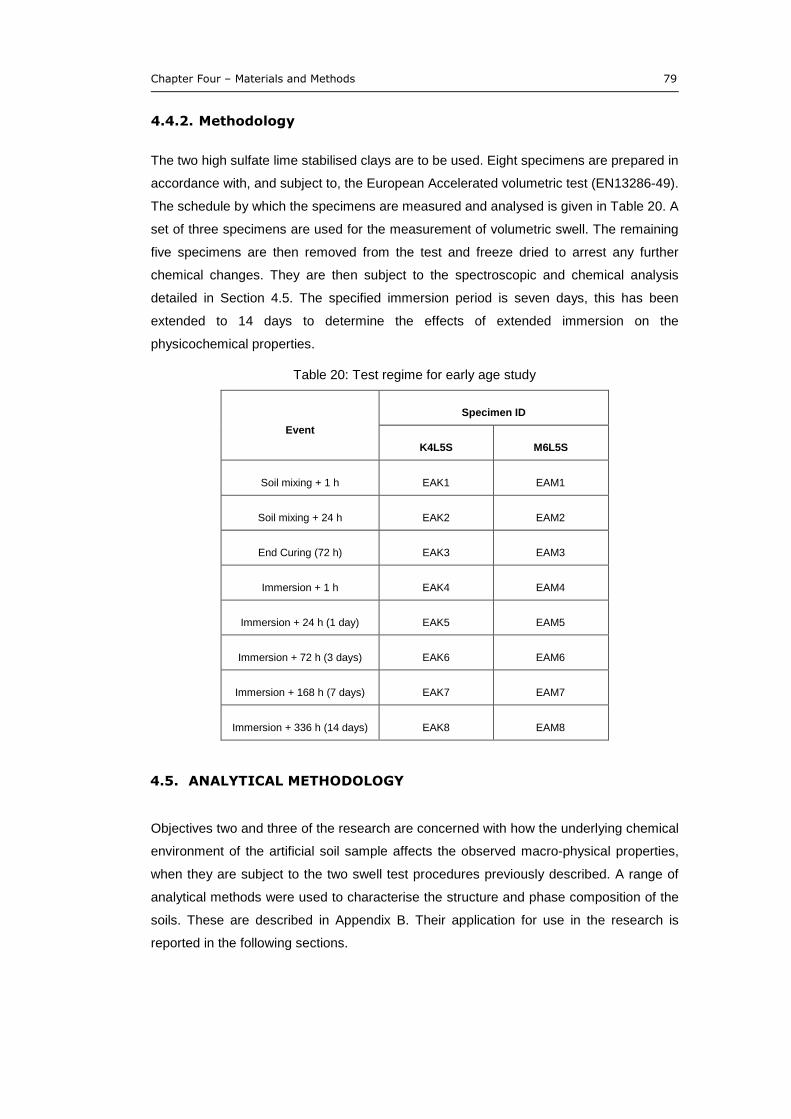
Chapter Four – Materials and Methods 79
4.4.2. Methodology
The two high sulfate lime stabilised clays are to be used. Eight specimens are prepared in
accordance with, and subject to, the European Accelerated volumetric test (EN13286-49).
The schedule by which the specimens are measured and analysed is given in Table 20. A
set of three specimens are used for the measurement of volumetric swell. The remaining
five specimens are then removed from the test and freeze dried to arrest any further
chemical changes. They are then subject to the spectroscopic and chemical analysis
detailed in Section 4.5. The specified immersion period is seven days, this has been
extended to 14 days to determine the effects of extended immersion on the
physicochemical properties.
Table 20: Test regime for early age study
Event
Specimen ID
K4L5S M6L5S
Soil mixing + 1 h EAK1 EAM1
Soil mixing + 24 h EAK2 EAM2
End Curing (72 h) EAK3 EAM3
Immersion + 1 h EAK4 EAM4
Immersion + 24 h (1 day) EAK5 EAM5
Immersion + 72 h (3 days) EAK6 EAM6
Immersion + 168 h (7 days) EAK7 EAM7
Immersion + 336 h (14 days) EAK8 EAM8
4.5. ANALYTICAL METHODOLOGY
Objectives two and three of the research are concerned with how the underlying chemical
environment of the artificial soil sample affects the observed macro-physical properties,
when they are subject to the two swell test procedures previously described. A range of
analytical methods were used to characterise the structure and phase composition of the
soils. These are described in Appendix B. Their application for use in the research is
reported in the following sections.
80 Chapter Four – Materials and Methods
4.5.1. Sample Preparation
Samples were taken from the top 5 mm of the CBR moulds after they had undergone
testing in accordance with the UK linear swell test procedure and from the side of the
European accelerated swell test specimens using a palette knife. This material was
crumbled into glass dishes. These were then freeze-dried by first freezing at -80°C
overnight, then vacuum dried. This procedure halted the hydration reactions thus
preserving the phase assemblage and what original micro-structure remained
(petrographic analysis is difficult to perform on low strength materials due to the cutting
and polishing required to produce a surface suitable for analysis). Samples for Scanning
Electron Microscope (SEM) were reserved as is. Those for XRD and TGA were gently
ground with a mortar and pestle then passed through a 425 μm sieve to yield a
homogenous powder.
4.5.2. X-Ray Diffraction (XRD)
The X-ray diffraction pattern of a crystalline material is unique. This pattern is defined by
the spacing of the crystallographic planes according to Braggs Law (4b):
(4b) =ߣ݊ 2dsinθ
where: n is an integer, λ is the wavelength of radiation used, d is the spacing of the crystallographic
planes, and θ the angle of the diffraction peak.
The peak intensity is determined by the type of constituent atom and their positions in the
crystal lattice by the structure factor (4c):
(4c) ℎ݈݇)ܨ ) = ∑ ݂ேூ ߨ2݁ݔ (݅ℎݔ + ݕ݇ + (݈ݖ
where: hkl are the Miller indices of the reflecting planes, fn the atomic structure factor, and xn, yn,
and zn are the coordinates of the nth atom in the unit cell containing N atoms
X-Ray Diffraction (XRD) was used to identify the crystalline phases of the soil samples
before, during and after swell testing. It was also used to quantify the key phases involved
in the formation of deleterious sulfate phases.
The prepared soil powders were analysed on standard 27 mm sample holders using a
Siemens D500 diffractometer using CuKα radiation at an accelerating voltage of 40 kV
and 25 mA current. Two scan programmes were used:
Scan 1: 5 – 70° 2θ, 0.05° step at 5s/step
Scan 2: 8 – 10.5° 2θ, 0.02° step at 60s/step
Chapter Four – Materials and Methods 81
Scan 1 was used for phase identification by pattern fitting against the reference patterns
of the International Centre for Powder Diffraction (ICDD), database PDF-2 (2011). Scan 2
was used for quantification of ettringite and monosulfate. The 100 (hkl) reflection (along
the crystallographic axis) of ettringite occurs around 9.1° 2θ and a broader reflection of
monosulfate around 9.65 – 9.8 2°θ (Cohen et al, 1983). A relatively long count time at
each step (60s) increases the accuracy of the peak measurement and hence phase
quantification. The standard deviation (SD) of discrete counts is given by (4d):
(4d) ܵܦ = √ே
ே
where N = total number of counts
The [100] peak recorded from the soils in the low angle studies was compared to the
[100] reflection of a laboratory synthesised ettringite ‘standard’ for comparison The
synthesis methodology and analysis of the ettringite reference standard is contained in
Appendix B.
Samples were analysed after the soil mixtures had completed the both the UK Linear
Swell test and the European Accelerated Swell test. Additional samples were taken to
analyse the changes in chemical composition on stabilisation and at various stages of the
swell test (Chapter Seven).
4.5.3. Scanning Electron Microscope and Energy Dispersive X-ray
Analysis (SEM-EDX)
Soil samples were analysed using a Philips FEI XL30 Scanning Electron Microscope
(SEM) to investigate the morphology of the crystalline phases and as far as possible the
microstructure. After freeze-drying, specimens were mounted on SEM stubs using carbon
discs. The samples were then coated with Platinum using a Polaron SC7640 sputter
coater. Analysis was undertaken in high vacuum at a pressure of about 3.5 × 10⁻⁶
mbar,
using an accelerating voltage of 5 – 20 kV, working distance of 10 – 20 mm, and a spot
size of 2 – 5 (arbitrary units). The image was composed from detection of secondary
electron emissions.
Energy Dispersive X-ray (EDX) spectroscopy was undertaken to determine the elemental
composition using point analysis. This was achieved using an accelerating voltage of 15
kV, a working distance of 15 mm and a spot size of approximately 5 (arbitrary units). The
INCA EDX software programme was used for data and image processing.
82 Chapter Four – Materials and Methods
4.5.4. Differential Thermal Gravimetric Analysis (DTGA)
Differential Thermal Gravimetric Analysis (dTGA) measures the change in mass of a
material as a function of temperature. Typically this is a loss in mass brought about when
an increase in the temperature causes dehydration and or decomposition of a phase. The
results are most easily analysed by plotting the derivative mass loss as a function of
temperature. A phase can be identified by determining its characteristic mass loss at
specific temperatures. For example the dehydration of gypsum to anhydrite occurs at 105
°C (4e):
(4e) CaSO4.2H2O → CaSO4 + 2H2O
The calculation of the gypsum content is therefore (4f):
(4f) ݉ݑݏݕܩ �(%) = �ܹ �(%) ×�ቀெௌைర.2ுమை
ெுమைቁ
Where: Wl – percentage weight loss determined by TGA, MrCaSO4.2H2O – molar weight gypsum,
MrH2O – molar weight water.
Perkins & Palmer (1998) described the analysis of pure AFt at 40 – 900 °C. The mass
loss occurred over four distinct temperature intervals:
40 – 180 C, 33% mass loss, loosely bound water
200 – 280 C, 4.3% mass loss, 3 remaining H2O
280 – 500 C, 4.2% mass loss, 3 more H2O
600 – 900C, 3.8% mass loss, 3 more H2O
For the pure ettringite phase this represents a total mass loss of 45.9 %, equating to 31.5
water molecules.
The soil samples used in the XRD analysis were also subject to TGA under nitrogen at
20ml/min, using the following programme:
Hold for 10min at 30°C
Heat from 30°C to 180°C at 2°/min;
Hold for 5min at 180°C; and
Heat from 180°C to 900°C at 10°/min.
4.5.5. X-Ray Computer Tomography
X-Ray Computer Tomography (X-Ray CT) is an imaging technique that allows a three-
dimensional image to be compiled from two-dimensional X-Ray images taken around a

Chapter Four – Materials and Methods 83
single axis of rotation. It is used here along with the image processing software ImageJ to
characterise the void structure of swell test specimens produced in accordance with the
two swell test procedures. A XTEC X-ray CT analyser was used in the analysis. All
images were acquired using the mini-focus 350kV X-ray source system and linear
detector. The images were processed using the software IMPS III
Specimens produced for the European Accelerated Swell test (EN 13286-49) were run as
is. However, the specimens produced for the UK linear Swell test (BS 1924-2) are
manufactured in CBR moulds. These specimens had to be extruded from the mould
before analysis. It was assumed that the extrusion process had a negligible effect on the
existing void structure.
84
5. MACROPHYSICAL PROPERTY TESTING
5.1. INTRODUCTION
This chapter reports the results of the macro-physical property testing of the artificial
soils. The methodology of the two swell tests used, are described in chapter four. The
measured dimensional changes on immersion in water, as well as the strength of the soil
are provided.
The UK linear swell test (BS1924-2) measures the strength of both the top and bottom of
the specimen (as % CBR value) as well as the linear swell of soil specimens that are
immersed in water for a period of 7 or 28 days. In current UK guidance (HA74/07), for a
soil mixture design to be suitable for use it must fulfil the following criteria:
the average linear swell at 28 days must be <5 mm, with no individual being > 10
mm; and
the average CBR value must be >15 %, with no individual <8 %.
The European accelerated volumetric swell test (EN13286-49) measures only the
volumetric swell (Gv) of specimens immersed at an elevated temperature (40 °C) for a
period of 168 hours (7 days), the requirements are:
the soil design is considered suitable for use if the volumetric swell is <5 %;
if 5 < Gv ≤ 10 %, then the material is not considered suitable, but may still be
used subject to additional testing in the place of use; and
if Gv ≥ 10 %, the soil design is not suitable.
Note: All swell and strength tests of BS1924-2 and EN13286-49 are average values
determined from the testing three specimens per soil mixture.
5.2. PHYSICAL RESPONSE TO THE UK LINEAR CBR SWELL TEST
(BS1924-2)
5.2.1. Early age linear swell at 7 days immersion
Figure 19 shows the linear swell response of the artificial soil mixtures up to an immersion
period of 7 days.
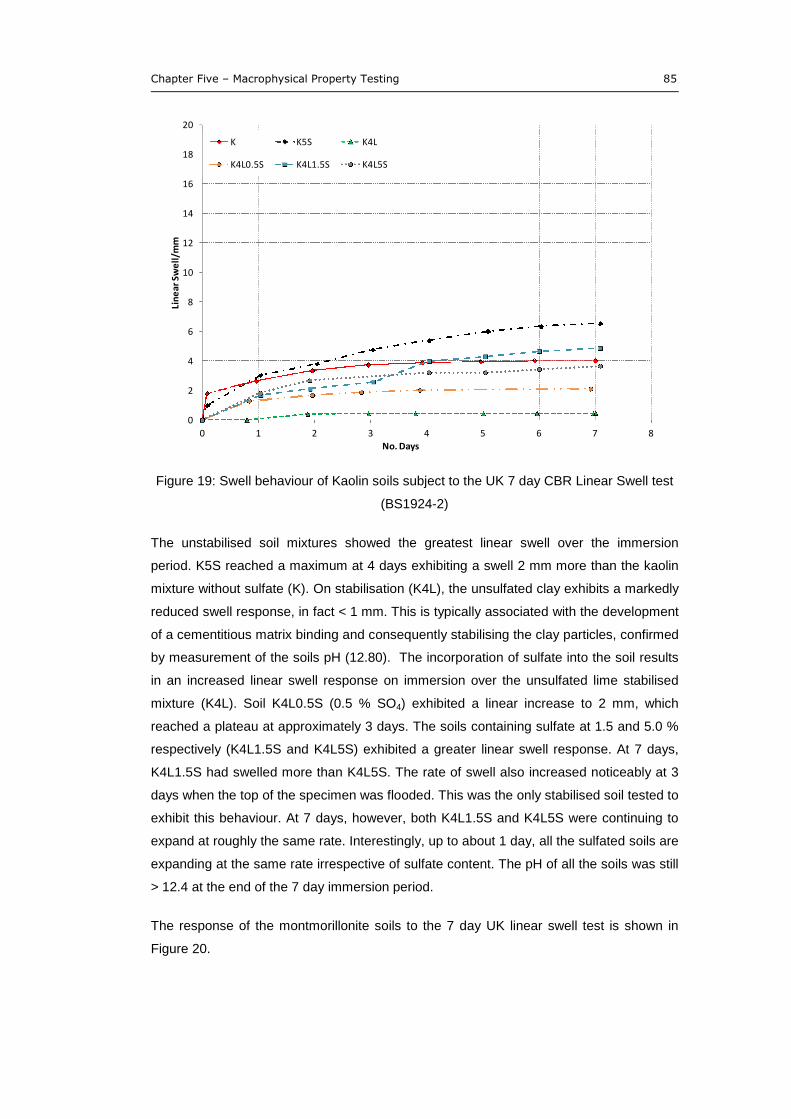
Chapter Five – Macrophysical Property Testing 85
Figure 19: Swell behaviour of Kaolin soils subject to the UK 7 day CBR Linear Swell test
(BS1924-2)
The unstabilised soil mixtures showed the greatest linear swell over the immersion
period. K5S reached a maximum at 4 days exhibiting a swell 2 mm more than the kaolin
mixture without sulfate (K). On stabilisation (K4L), the unsulfated clay exhibits a markedly
reduced swell response, in fact < 1 mm. This is typically associated with the development
of a cementitious matrix binding and consequently stabilising the clay particles, confirmed
by measurement of the soils pH (12.80). The incorporation of sulfate into the soil results
in an increased linear swell response on immersion over the unsulfated lime stabilised
mixture (K4L). Soil K4L0.5S (0.5 % SO4) exhibited a linear increase to 2 mm, which
reached a plateau at approximately 3 days. The soils containing sulfate at 1.5 and 5.0 %
respectively (K4L1.5S and K4L5S) exhibited a greater linear swell response. At 7 days,
K4L1.5S had swelled more than K4L5S. The rate of swell also increased noticeably at 3
days when the top of the specimen was flooded. This was the only stabilised soil tested to
exhibit this behaviour. At 7 days, however, both K4L1.5S and K4L5S were continuing to
expand at roughly the same rate. Interestingly, up to about 1 day, all the sulfated soils are
expanding at the same rate irrespective of sulfate content. The pH of all the soils was still
> 12.4 at the end of the 7 day immersion period.
The response of the montmorillonite soils to the 7 day UK linear swell test is shown in
Figure 20.
0
2
4
6
8
10
12
14
16
18
20
0 1 2 3 4 5 6 7 8
Lin
ear
Swe
ll/m
m
No. Days
K K5S K4L
K4L0.5S K4L1.5S K4L5S
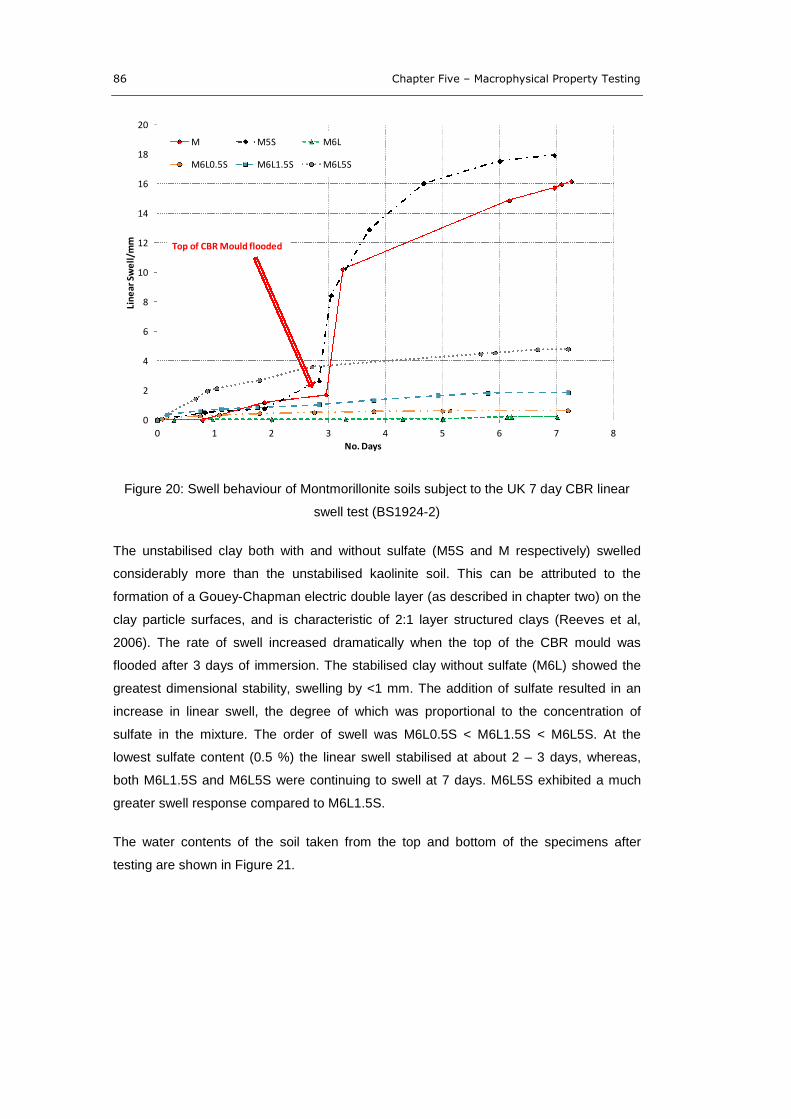
86 Chapter Five – Macrophysical Property Testing
Figure 20: Swell behaviour of Montmorillonite soils subject to the UK 7 day CBR linear
swell test (BS1924-2)
The unstabilised clay both with and without sulfate (M5S and M respectively) swelled
considerably more than the unstabilised kaolinite soil. This can be attributed to the
formation of a Gouey-Chapman electric double layer (as described in chapter two) on the
clay particle surfaces, and is characteristic of 2:1 layer structured clays (Reeves et al,
2006). The rate of swell increased dramatically when the top of the CBR mould was
flooded after 3 days of immersion. The stabilised clay without sulfate (M6L) showed the
greatest dimensional stability, swelling by <1 mm. The addition of sulfate resulted in an
increase in linear swell, the degree of which was proportional to the concentration of
sulfate in the mixture. The order of swell was M6L0.5S < M6L1.5S < M6L5S. At the
lowest sulfate content (0.5 %) the linear swell stabilised at about 2 – 3 days, whereas,
both M6L1.5S and M6L5S were continuing to swell at 7 days. M6L5S exhibited a much
greater swell response compared to M6L1.5S.
The water contents of the soil taken from the top and bottom of the specimens after
testing are shown in Figure 21.
0
2
4
6
8
10
12
14
16
18
20
0 1 2 3 4 5 6 7 8
Lin
ear
Swe
ll/m
m
No. Days
M M5S M6L
M6L0.5S M6L1.5S M6L5S
Top of CBR Mould flooded
Chapter Five – Macrophysical Property Testing 87
Figure 21: water content of soils after 7 days immersion (BS1924-2)
The kaolin soils exhibit relatively little variation in water content compared to the
montmorillonite soils. The mixtures containing sulfates have water contents
approximating that of mixture K4L. In addition, little variation is found between the water
content from the top and bottom of the specimens. The montmorillonite soils on the other
hand have greater water content than the kaolinite soils across the series, with the
unstabilised clays (M and M5S) measuring water contents of nearly 60 % from the top of
the CBR mould. The sulfated soils M6L0.5S and M6L1.5S approximated that of the
stabilised clay without sulfate (M6L). However, mixture M6L5S had a water content
nearing that of the unstabilised material and exhibited the greatest difference in water
content measured from the top and bottom of the specimens of all the stabilised clays
tested.
5.2.2. Soil strength (CBR value) after 7 days immersion
The results of the strength testing (CBR) of the soils after 7 days immersion, as well as
other data for both soils are presented in Table 21 and Table 22.
Table 21: Kaolin soil mixtures CBR strength at 7 days
Mix ID K K5S K4L K4L0.5S K4L1.5S K4L5S
Dry Density (Mg/m3) 1.75 1.69 1.61 1.64 1.62 1.59
CBR Top (%) 2.0 1.0 18 16 18 11
CBR Bottom (%) 7.7 7.1 18 32* 44* 24*
pH (CBR Top) 12.76 12.87 12.98 12.92
Note: *maximum strength of superficial ‘crust’. At depths of >2.5 mm CBR value tended to <10 %.
88 Chapter Five – Macrophysical Property Testing
Table 21 shows that the CBR value of the unstabilised kaolin soils is not affected by the
addition of sulfate. Both are considered extremely weak with CBR values of 2.0 and 1.0%
(K and K5S respectively) at the top and 7.7 and 7.1% on the bottom. On stabilisation
(K4L) the strength is increased by the same degree at either end of the specimen. The
effect of sulfate on the soil (K4L0.5S, K4L1.5S, K4L5S) is a general trend of increasing
the CBR strength on the bottom of the specimens, while the top remains largely
unaffected, despite the proportional increase in dimensional instability with increasing
sulfate content (Figure 19). The bottom of the specimens, in which the soil is confined by
the swell plate, exhibited a pronounced increase in soil strength compared to the
stabilised control (K4L) however, the results are misleading. The standard used (BS1924-
2) required the calculation of the CBR strength at two penetration points (2.54 and 5.0
mm) with the highest value being reported as the percentage CBR strength of the soil.
The stabilised sulfated soils appeared to form a superficial ‘crust’ of about 2.5 – 3.0 mm in
thickness, which was relatively strong. Once the CBR plunger had penetrated through
this, the material underneath was relatively weak and lacked any measureable soil
strength. Consequently although the CBR values appear high, the true soil strength is
much less, taking into account much weaker soil directly under the surface of the
specimen. The pH of all the soils subjected to stabilisation was maintained at >12.4,
confirming that pozzolanic development of a cementitious matrix was on-going, and that
should ettringite have formed, it would remain stable.
Table 22: Montmorillonite soil mixtures CBR strength at 7 days
Mix ID M (2) M3S (4) M6L (5)M6L0.5S
(13)
M6L1.5S
(7)M6L5S (6)
Dry Density (Mg/m3) 1.43 1.37 1.41 1.46 1.30 1.38
CBR Top (%) <1 <1 25 30 6.0 2.0
CBR Bottom (%) 2.4 2.8 51 41 27 18
pH (CBR Top) 12.87 12.93 12.91 12.85
The unstabilised montmorillonite soils (M and M5S) exhibited very low strengths after 7
days immersion. On stabilisation, the degree of increase in soil strength was much
greater than that of the kaolin soils, although a greater degree of variation exists between
the top and bottom of the specimens. M6L0.5S showed a marginal increase in strength
on the top face of the specimen, but a reduction on the bottom. The soils M6L1.5S and
M6L3S exhibited much reduced strength on the top face - almost to that of the
unstabilised clays. The bottom faces showed higher strengths, but again trending towards
a decrease in strength with increasing sulfate content. The strength of the soils followed
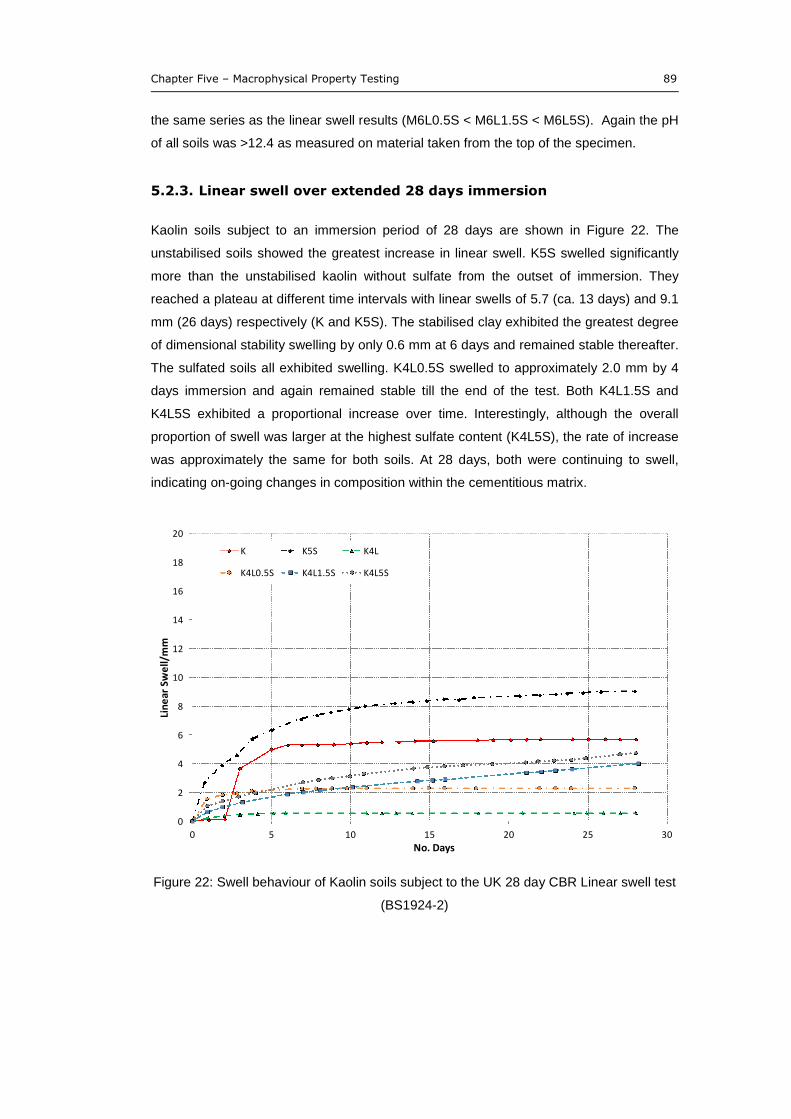
Chapter Five – Macrophysical Property Testing 89
the same series as the linear swell results (M6L0.5S < M6L1.5S < M6L5S). Again the pH
of all soils was >12.4 as measured on material taken from the top of the specimen.
5.2.3. Linear swell over extended 28 days immersion
Kaolin soils subject to an immersion period of 28 days are shown in Figure 22. The
unstabilised soils showed the greatest increase in linear swell. K5S swelled significantly
more than the unstabilised kaolin without sulfate from the outset of immersion. They
reached a plateau at different time intervals with linear swells of 5.7 (ca. 13 days) and 9.1
mm (26 days) respectively (K and K5S). The stabilised clay exhibited the greatest degree
of dimensional stability swelling by only 0.6 mm at 6 days and remained stable thereafter.
The sulfated soils all exhibited swelling. K4L0.5S swelled to approximately 2.0 mm by 4
days immersion and again remained stable till the end of the test. Both K4L1.5S and
K4L5S exhibited a proportional increase over time. Interestingly, although the overall
proportion of swell was larger at the highest sulfate content (K4L5S), the rate of increase
was approximately the same for both soils. At 28 days, both were continuing to swell,
indicating on-going changes in composition within the cementitious matrix.
Figure 22: Swell behaviour of Kaolin soils subject to the UK 28 day CBR Linear swell test
(BS1924-2)
0
2
4
6
8
10
12
14
16
18
20
0 5 10 15 20 25 30
Lin
ear
Swe
ll/m
m
No. Days
K K5S K4L
K4L0.5S K4L1.5S K4L5S
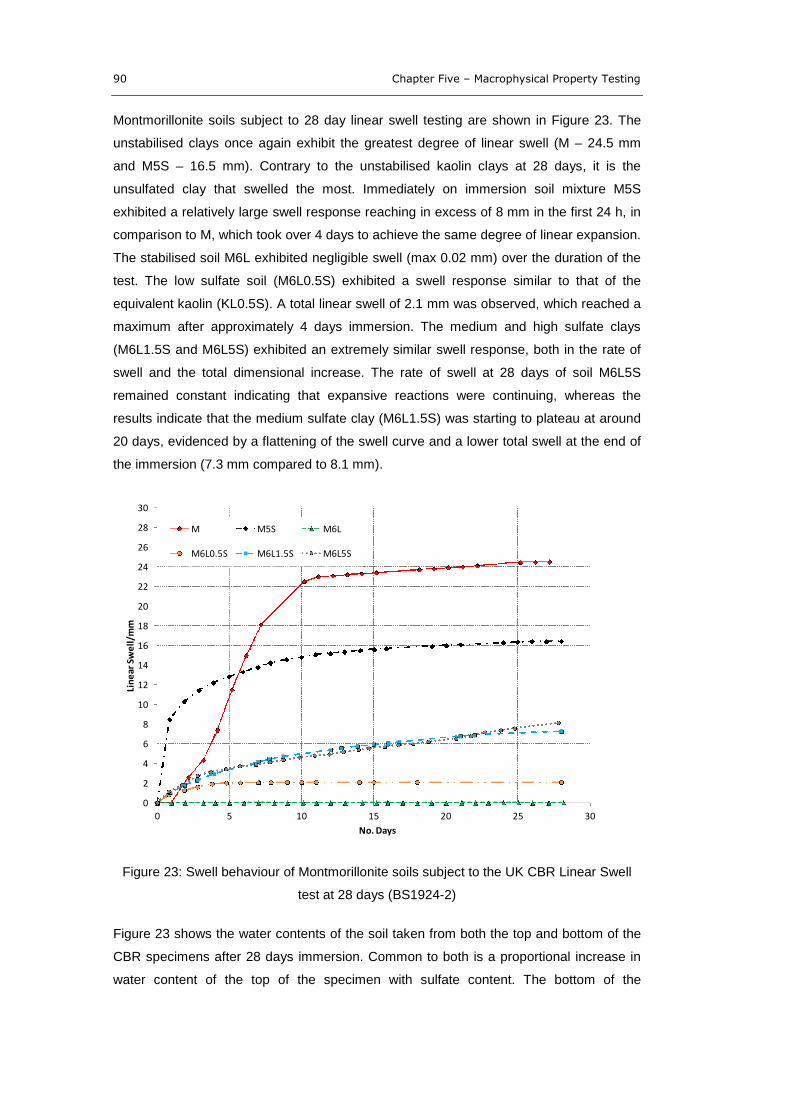
90 Chapter Five – Macrophysical Property Testing
Montmorillonite soils subject to 28 day linear swell testing are shown in Figure 23. The
unstabilised clays once again exhibit the greatest degree of linear swell (M – 24.5 mm
and M5S – 16.5 mm). Contrary to the unstabilised kaolin clays at 28 days, it is the
unsulfated clay that swelled the most. Immediately on immersion soil mixture M5S
exhibited a relatively large swell response reaching in excess of 8 mm in the first 24 h, in
comparison to M, which took over 4 days to achieve the same degree of linear expansion.
The stabilised soil M6L exhibited negligible swell (max 0.02 mm) over the duration of the
test. The low sulfate soil (M6L0.5S) exhibited a swell response similar to that of the
equivalent kaolin (KL0.5S). A total linear swell of 2.1 mm was observed, which reached a
maximum after approximately 4 days immersion. The medium and high sulfate clays
(M6L1.5S and M6L5S) exhibited an extremely similar swell response, both in the rate of
swell and the total dimensional increase. The rate of swell at 28 days of soil M6L5S
remained constant indicating that expansive reactions were continuing, whereas the
results indicate that the medium sulfate clay (M6L1.5S) was starting to plateau at around
20 days, evidenced by a flattening of the swell curve and a lower total swell at the end of
the immersion (7.3 mm compared to 8.1 mm).
Figure 23: Swell behaviour of Montmorillonite soils subject to the UK CBR Linear Swell
test at 28 days (BS1924-2)
Figure 23 shows the water contents of the soil taken from both the top and bottom of the
CBR specimens after 28 days immersion. Common to both is a proportional increase in
water content of the top of the specimen with sulfate content. The bottom of the
0
2
4
6
8
10
12
14
16
18
20
22
24
26
28
30
0 5 10 15 20 25 30
Lin
ear
Swe
ll/m
m
No. Days
M M5S M6L
M6L0.5S M6L1.5S M6L5S
Chapter Five – Macrophysical Property Testing 91
specimens remained broadly similar through the whole range of soil mixtures. Again (and
as expected) the unstabilised montmorillonite soils exhibited higher water contents then
the kaolin equivalents. The stabilised mixtures (K4L and M6L) had similar water contents.
The difference between the top and bottom increased with sulfate content and linear
swell. Surprisingly the high sulfate montmorillonite (M6L5S) had a lower water content at
28 days than at 7 days - 48% and 3% compared to 64% and 50% (CBR top and CBR
bottom face respectively).
Figure 23: water content of soils after 28 days immersion (BS1924-2)
5.2.4. Soil strengths (CBR value) after 28 days immersion
Table 23 presents the soil strength of the kaolin mixtures after 28 days immersion. The
unstabilised clays had CBR values of < 1% tested at both the top and bottom of the
specimens. The low sulfate mixture K4L0.5S had a higher strength than the control (K4L),
measuring 7% higher on the top and 35% higher on the bottom. Both the medium and
high sulfate mixtures had strengths lower than the control, with K4L5S approaching that
of the unstabilised soils measured on the top of the CBR specimen. Again the bottom
faces of the sulfated kaolin soils developed a ‘crust’ of material that gave an artificially
high strength as measured by the CBR test. The pH of all the specimens remained
sufficiently alkaline despite the extended duration of immersion.
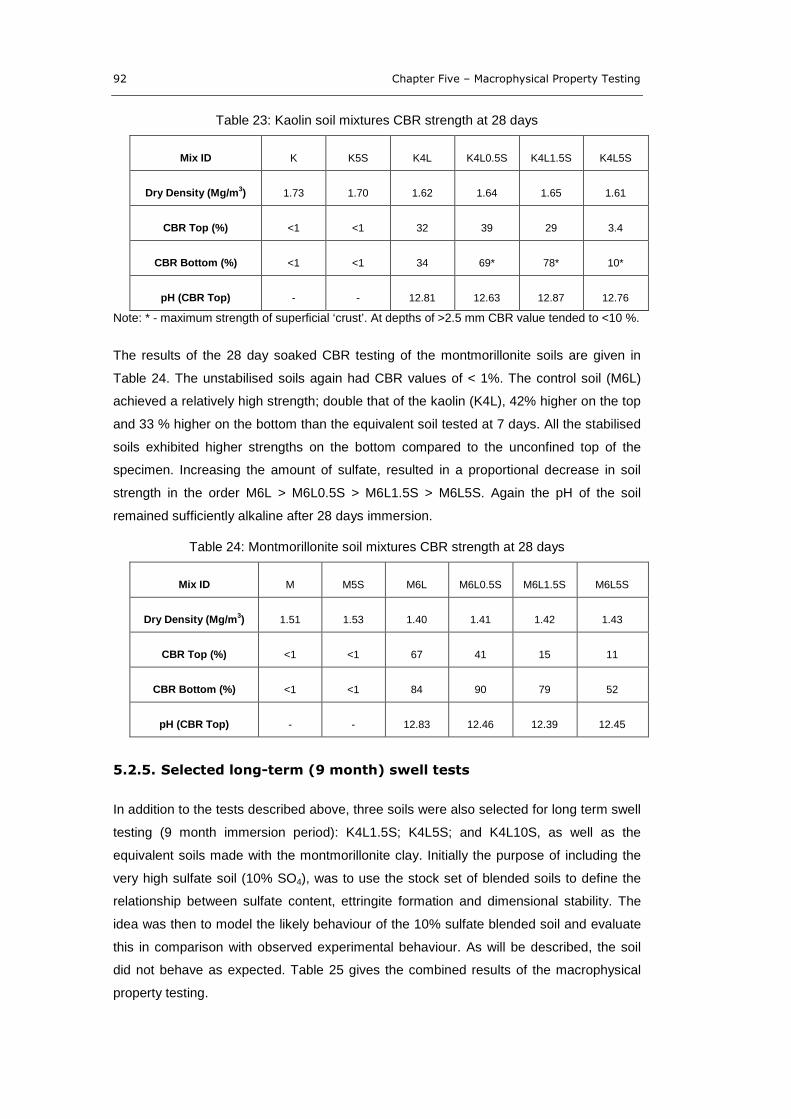
92 Chapter Five – Macrophysical Property Testing
Table 23: Kaolin soil mixtures CBR strength at 28 days
Mix ID K K5S K4L K4L0.5S K4L1.5S K4L5S
Dry Density (Mg/m3) 1.73 1.70 1.62 1.64 1.65 1.61
CBR Top (%) <1 <1 32 39 29 3.4
CBR Bottom (%) <1 <1 34 69* 78* 10*
pH (CBR Top) 12.81 12.63 12.87 12.76
Note: * - maximum strength of superficial ‘crust’. At depths of >2.5 mm CBR value tended to <10 %.
The results of the 28 day soaked CBR testing of the montmorillonite soils are given in
Table 24. The unstabilised soils again had CBR values of < 1%. The control soil (M6L)
achieved a relatively high strength; double that of the kaolin (K4L), 42% higher on the top
and 33 % higher on the bottom than the equivalent soil tested at 7 days. All the stabilised
soils exhibited higher strengths on the bottom compared to the unconfined top of the
specimen. Increasing the amount of sulfate, resulted in a proportional decrease in soil
strength in the order M6L > M6L0.5S > M6L1.5S > M6L5S. Again the pH of the soil
remained sufficiently alkaline after 28 days immersion.
Table 24: Montmorillonite soil mixtures CBR strength at 28 days
Mix ID M M5S M6L M6L0.5S M6L1.5S M6L5S
Dry Density (Mg/m3) 1.51 1.53 1.40 1.41 1.42 1.43
CBR Top (%) <1 <1 67 41 15 11
CBR Bottom (%) <1 <1 84 90 79 52
pH (CBR Top) 12.83 12.46 12.39 12.45
5.2.5. Selected long-term (9 month) swell tests
In addition to the tests described above, three soils were also selected for long term swell
testing (9 month immersion period): K4L1.5S; K4L5S; and K4L10S, as well as the
equivalent soils made with the montmorillonite clay. Initially the purpose of including the
very high sulfate soil (10% SO4), was to use the stock set of blended soils to define the
relationship between sulfate content, ettringite formation and dimensional stability. The
idea was then to model the likely behaviour of the 10% sulfate blended soil and evaluate
this in comparison with observed experimental behaviour. As will be described, the soil
did not behave as expected. Table 25 gives the combined results of the macrophysical
property testing.
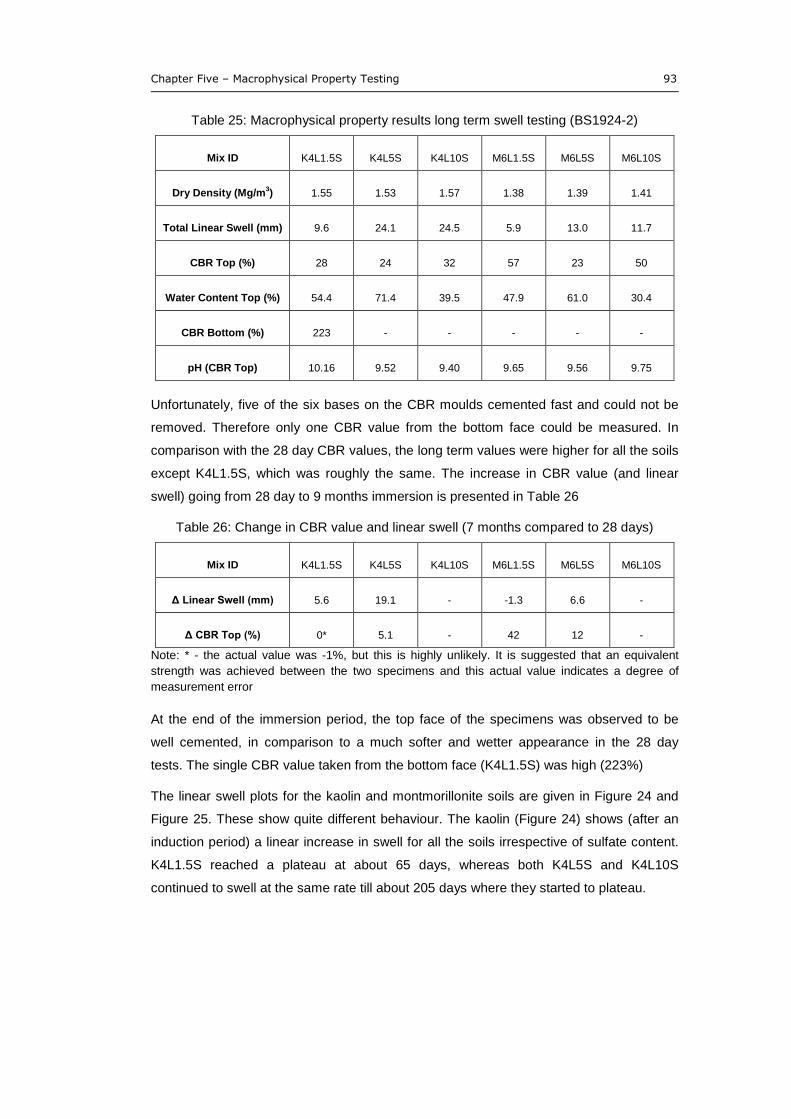
Chapter Five – Macrophysical Property Testing 93
Table 25: Macrophysical property results long term swell testing (BS1924-2)
Mix ID K4L1.5S K4L5S K4L10S M6L1.5S M6L5S M6L10S
Dry Density (Mg/m3) 1.55 1.53 1.57 1.38 1.39 1.41
Total Linear Swell (mm) 9.6 24.1 24.5 5.9 13.0 11.7
CBR Top (%) 28 24 32 57 23 50
Water Content Top (%) 54.4 71.4 39.5 47.9 61.0 30.4
CBR Bottom (%) 223
pH (CBR Top) 10.16 9.52 9.40 9.65 9.56 9.75
Unfortunately, five of the six bases on the CBR moulds cemented fast and could not be
removed. Therefore only one CBR value from the bottom face could be measured. In
comparison with the 28 day CBR values, the long term values were higher for all the soils
except K4L1.5S, which was roughly the same. The increase in CBR value (and linear
swell) going from 28 day to 9 months immersion is presented in Table 26
Table 26: Change in CBR value and linear swell (7 months compared to 28 days)
Mix ID K4L1.5S K4L5S K4L10S M6L1.5S M6L5S M6L10S
Δ Linear Swell (mm) 5.6 19.1 -1.3 6.6
Δ CBR Top (%) 0* 5.1 42 12
Note: * - the actual value was -1%, but this is highly unlikely. It is suggested that an equivalent
strength was achieved between the two specimens and this actual value indicates a degree of
measurement error
At the end of the immersion period, the top face of the specimens was observed to be
well cemented, in comparison to a much softer and wetter appearance in the 28 day
tests. The single CBR value taken from the bottom face (K4L1.5S) was high (223%)
The linear swell plots for the kaolin and montmorillonite soils are given in Figure 24 and
Figure 25. These show quite different behaviour. The kaolin (Figure 24) shows (after an
induction period) a linear increase in swell for all the soils irrespective of sulfate content.
K4L1.5S reached a plateau at about 65 days, whereas both K4L5S and K4L10S
continued to swell at the same rate till about 205 days where they started to plateau.
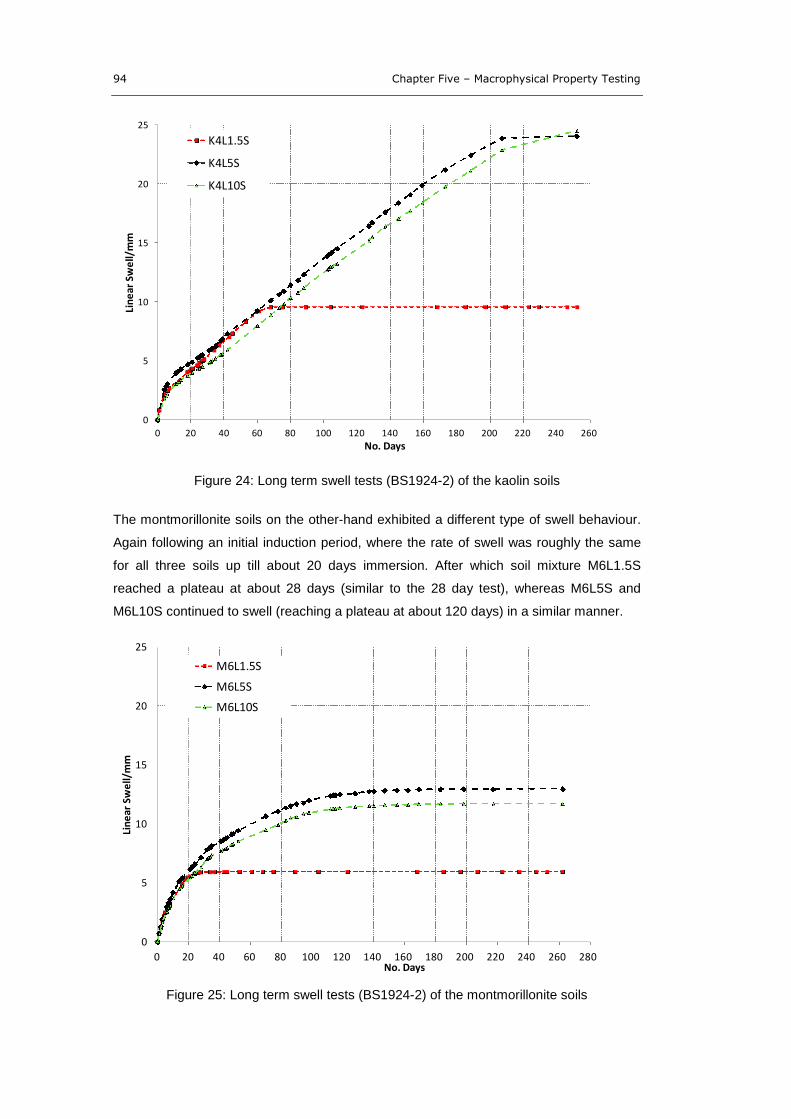
94 Chapter Five – Macrophysical Property Testing
Figure 24: Long term swell tests (BS1924-2) of the kaolin soils
The montmorillonite soils on the other-hand exhibited a different type of swell behaviour.
Again following an initial induction period, where the rate of swell was roughly the same
for all three soils up till about 20 days immersion. After which soil mixture M6L1.5S
reached a plateau at about 28 days (similar to the 28 day test), whereas M6L5S and
M6L10S continued to swell (reaching a plateau at about 120 days) in a similar manner.
Figure 25: Long term swell tests (BS1924-2) of the montmorillonite soils
0
5
10
15
20
25
0 20 40 60 80 100 120 140 160 180 200 220 240 260
Lin
ear
Swe
ll/m
m
No. Days
K4L1.5S
K4L5S
K4L10S
0
5
10
15
20
25
0 20 40 60 80 100 120 140 160 180 200 220 240 260 280
Lin
ear
Swe
ll/m
m
No. Days
M6L1.5S
M6L5S
M6L10S
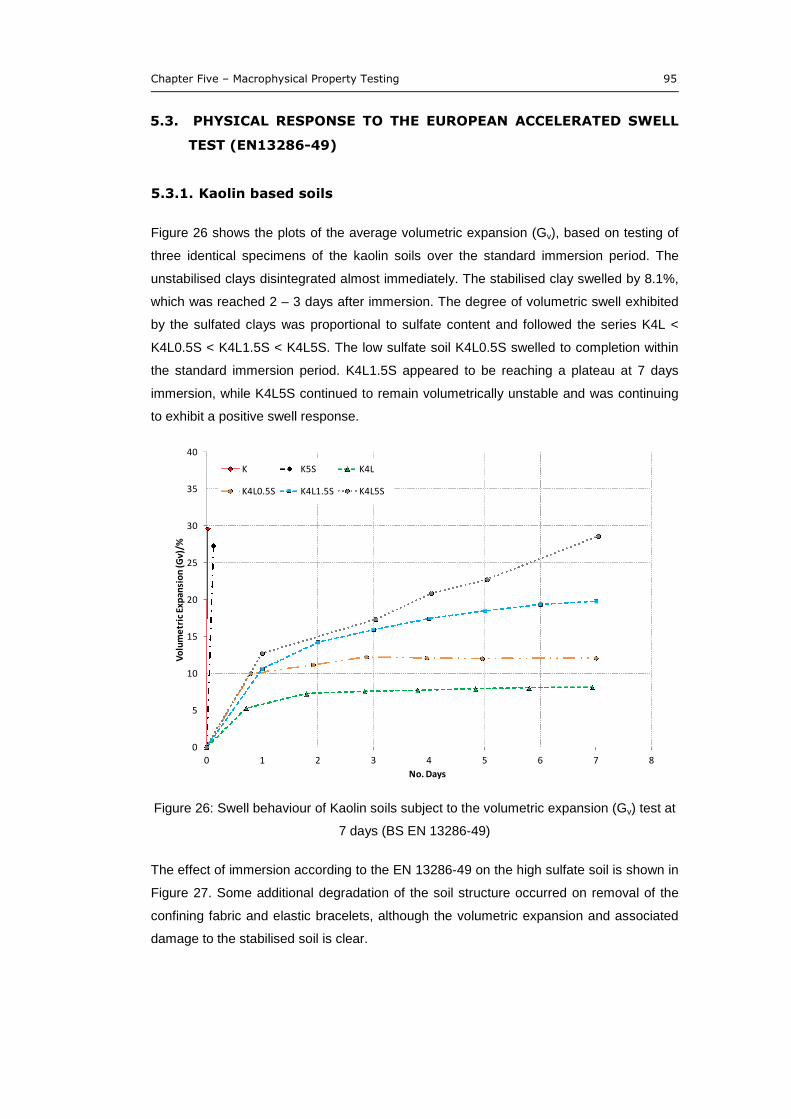
Chapter Five – Macrophysical Property Testing 95
5.3. PHYSICAL RESPONSE TO THE EUROPEAN ACCELERATED SWELL
TEST (EN13286-49)
5.3.1. Kaolin based soils
Figure 26 shows the plots of the average volumetric expansion (Gv), based on testing of
three identical specimens of the kaolin soils over the standard immersion period. The
unstabilised clays disintegrated almost immediately. The stabilised clay swelled by 8.1%,
which was reached 2 – 3 days after immersion. The degree of volumetric swell exhibited
by the sulfated clays was proportional to sulfate content and followed the series K4L <
K4L0.5S < K4L1.5S < K4L5S. The low sulfate soil K4L0.5S swelled to completion within
the standard immersion period. K4L1.5S appeared to be reaching a plateau at 7 days
immersion, while K4L5S continued to remain volumetrically unstable and was continuing
to exhibit a positive swell response.
Figure 26: Swell behaviour of Kaolin soils subject to the volumetric expansion (Gv) test at
7 days (BS EN 13286-49)
The effect of immersion according to the EN 13286-49 on the high sulfate soil is shown in
Figure 27. Some additional degradation of the soil structure occurred on removal of the
confining fabric and elastic bracelets, although the volumetric expansion and associated
damage to the stabilised soil is clear.
0
5
10
15
20
25
30
35
40
0 1 2 3 4 5 6 7 8
Vo
lum
etr
icEx
pan
sio
n(G
v)/%
No. Days
K K5S K4L
K4L0.5S K4L1.5S K4L5S
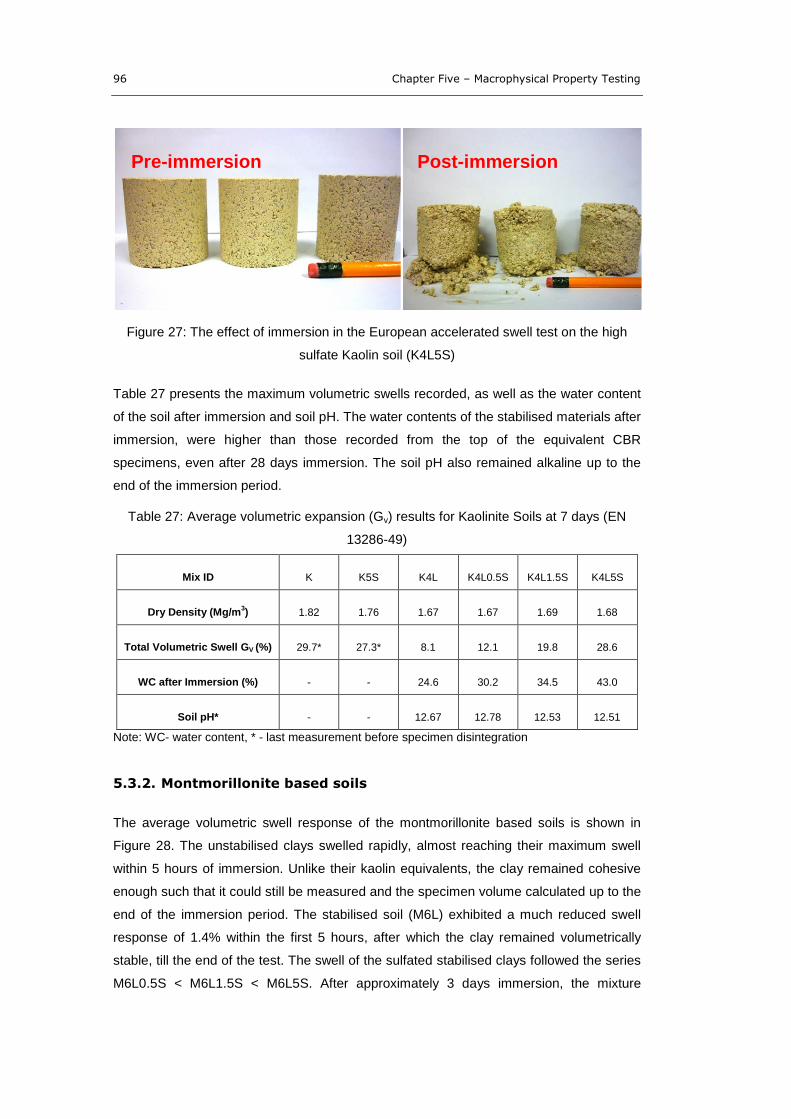
96 Chapter Five – Macrophysical Property Testing
Figure 27: The effect of immersion in the European accelerated swell test on the high
sulfate Kaolin soil (K4L5S)
Table 27 presents the maximum volumetric swells recorded, as well as the water content
of the soil after immersion and soil pH. The water contents of the stabilised materials after
immersion, were higher than those recorded from the top of the equivalent CBR
specimens, even after 28 days immersion. The soil pH also remained alkaline up to the
end of the immersion period.
Table 27: Average volumetric expansion (Gv) results for Kaolinite Soils at 7 days (EN
13286-49)
Mix ID K K5S K4L K4L0.5S K4L1.5S K4L5S
Dry Density (Mg/m3) 1.82 1.76 1.67 1.67 1.69 1.68
Total Volumetric Swell GV (%) 29.7* 27.3* 8.1 12.1 19.8 28.6
WC after Immersion (%) 24.6 30.2 34.5 43.0
Soil pH* 12.67 12.78 12.53 12.51
Note: WC- water content, * - last measurement before specimen disintegration
5.3.2. Montmorillonite based soils
The average volumetric swell response of the montmorillonite based soils is shown in
Figure 28. The unstabilised clays swelled rapidly, almost reaching their maximum swell
within 5 hours of immersion. Unlike their kaolin equivalents, the clay remained cohesive
enough such that it could still be measured and the specimen volume calculated up to the
end of the immersion period. The stabilised soil (M6L) exhibited a much reduced swell
response of 1.4% within the first 5 hours, after which the clay remained volumetrically
stable, till the end of the test. The swell of the sulfated stabilised clays followed the series
M6L0.5S < M6L1.5S < M6L5S. After approximately 3 days immersion, the mixture
Pre-immersion Post-immersion
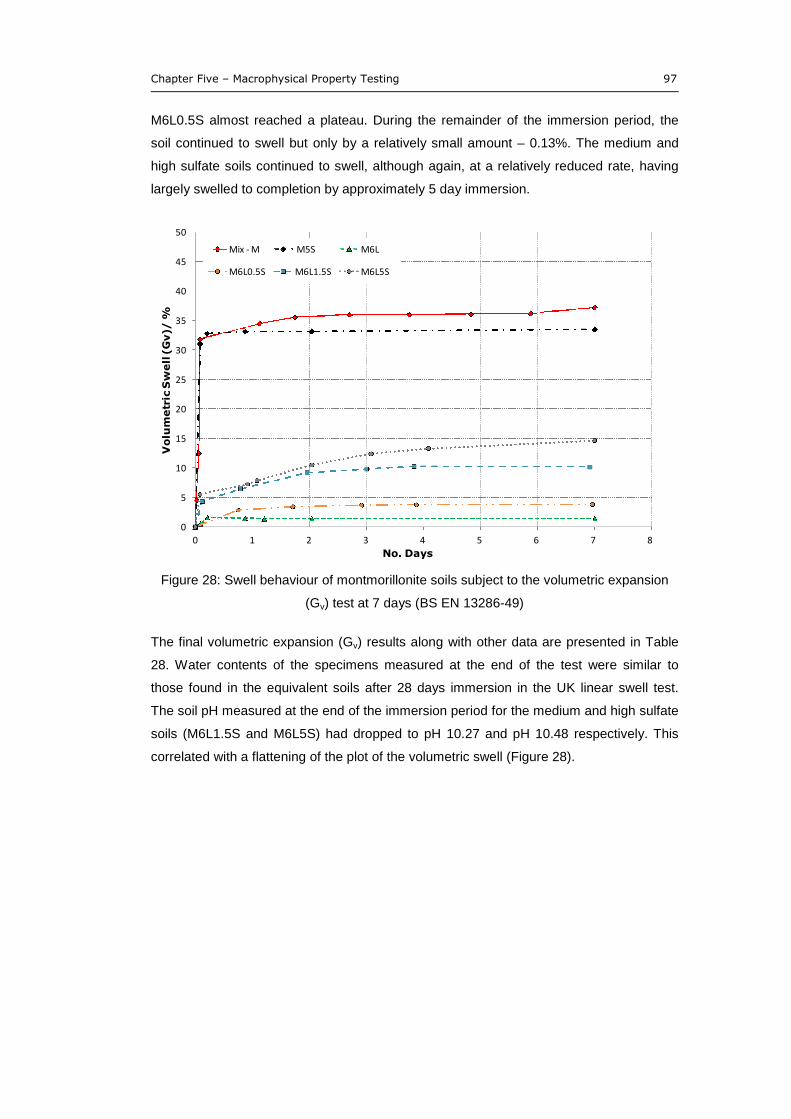
Chapter Five – Macrophysical Property Testing 97
M6L0.5S almost reached a plateau. During the remainder of the immersion period, the
soil continued to swell but only by a relatively small amount – 0.13%. The medium and
high sulfate soils continued to swell, although again, at a relatively reduced rate, having
largely swelled to completion by approximately 5 day immersion.
Figure 28: Swell behaviour of montmorillonite soils subject to the volumetric expansion
(Gv) test at 7 days (BS EN 13286-49)
The final volumetric expansion (Gv) results along with other data are presented in Table
28. Water contents of the specimens measured at the end of the test were similar to
those found in the equivalent soils after 28 days immersion in the UK linear swell test.
The soil pH measured at the end of the immersion period for the medium and high sulfate
soils (M6L1.5S and M6L5S) had dropped to pH 10.27 and pH 10.48 respectively. This
correlated with a flattening of the plot of the volumetric swell (Figure 28).
0
5
10
15
20
25
30
35
40
45
50
0 1 2 3 4 5 6 7 8
Vo
lum
etr
icS
we
ll(G
v)/
%
No. Days
Mix - M M5S M6L
M6L0.5S M6L1.5S M6L5S
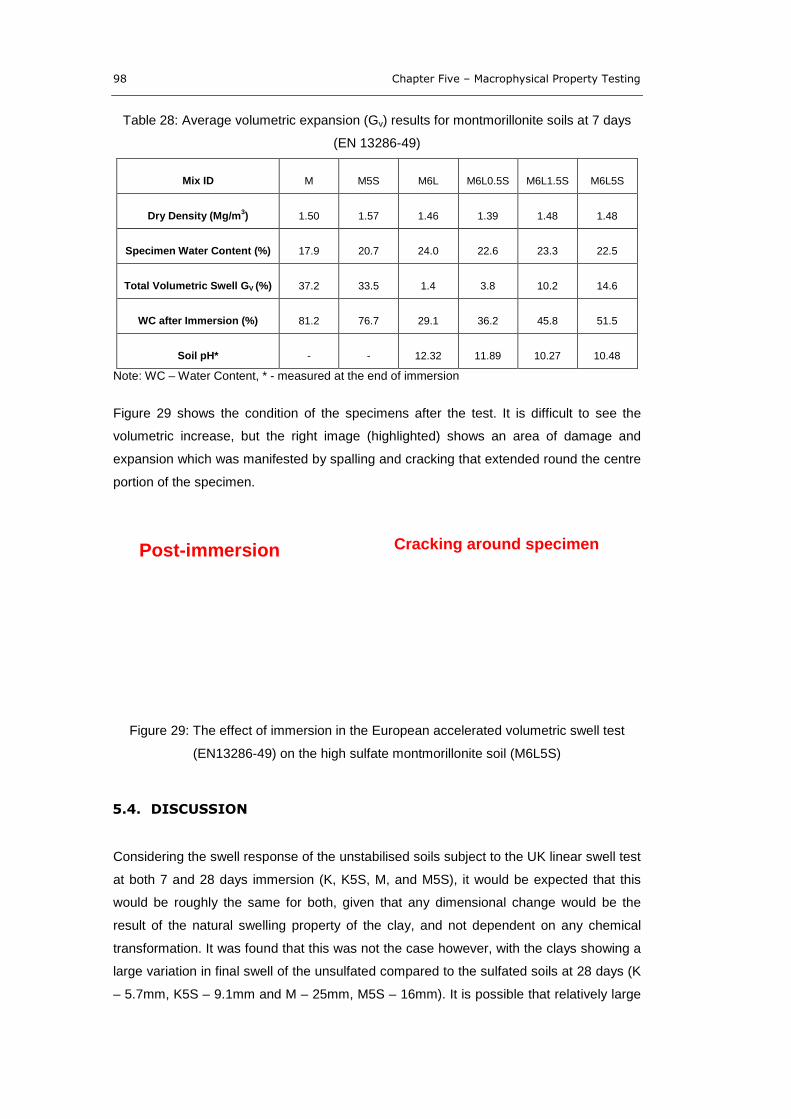
98 Chapter Five – Macrophysical Property Testing
Table 28: Average volumetric expansion (Gv) results for montmorillonite soils at 7 days
(EN 13286-49)
Mix ID M M5S M6L M6L0.5S M6L1.5S M6L5S
Dry Density (Mg/m3) 1.50 1.57 1.46 1.39 1.48 1.48
Specimen Water Content (%) 17.9 20.7 24.0 22.6 23.3 22.5
Total Volumetric Swell GV (%) 37.2 33.5 1.4 3.8 10.2 14.6
WC after Immersion (%) 81.2 76.7 29.1 36.2 45.8 51.5
Soil pH* 12.32 11.89 10.27 10.48
Note: WC – Water Content, * - measured at the end of immersion
Figure 29 shows the condition of the specimens after the test. It is difficult to see the
volumetric increase, but the right image (highlighted) shows an area of damage and
expansion which was manifested by spalling and cracking that extended round the centre
portion of the specimen.
Figure 29: The effect of immersion in the European accelerated volumetric swell test
(EN13286-49) on the high sulfate montmorillonite soil (M6L5S)
5.4. DISCUSSION
Considering the swell response of the unstabilised soils subject to the UK linear swell test
at both 7 and 28 days immersion (K, K5S, M, and M5S), it would be expected that this
would be roughly the same for both, given that any dimensional change would be the
result of the natural swelling property of the clay, and not dependent on any chemical
transformation. It was found that this was not the case however, with the clays showing a
large variation in final swell of the unsulfated compared to the sulfated soils at 28 days (K
– 5.7mm, K5S – 9.1mm and M – 25mm, M5S – 16mm). It is possible that relatively large
Post-immersion Cracking around specimen
Chapter Five – Macrophysical Property Testing 99
variances in swell of the unstabilised clays are a result of small differences in the
permeability of the soils, introduced during specimen manufacture. This could result in
differences in the rate of water uptake of the clay and the associated swell response,
rather than fundamental differences in material behavior, caused by chemical
transformations on the addition of sulfate to the unstabilised control soil. The unstabilised
clays for both soils exhibited characteristically high swelling and extremely low strengths
after immersion. As would be expected, the montmorillonite swelled significantly more
than the kaolin and is characteristic of 2:1 layer structure clays (Reeves, 2006). The
variation in the ultimate linear swell values was greater for the sulfated clays over their
unsulfated counterparts, while the ultimate volumetric swell was similar for both. This
could be further evidence of variation in the permeability of the top layer of the soil in the
CBR moulds, resulting in varying swell rates. Specimens undergoing the EN13286-49
test are completely exposed to the immersion water on all sides. The saturation rate (or
permeability) is likely to be similar, leading to the broadly equivalent volumetric
expansions observed.
The unstabilised kaolin soils both degraded and lost any degree of cohesiveness within
the first hour of immersion. The montmorillonite soils exhibited a very large swell
response, but also retained a degree of cohesiveness, such that the dimensions of the
specimens could be determined through the duration of immersion. It is suggested that
the interaction of the Gouy-Chapman charge double layer of one clay particle with
another, results in a degree of bonding, such that the clay (although swells significantly)
still retains a degree of cohesiveness.
Table 29 and Table 30 show the final strength and swell values of all the soils subject to
the two swell tests presented in relation to the pass/fail criteria of the test.
Table 29. Swell test results for kaolin soils referenced against relevant suitability criteria
Mix ID Test Property K K5S K4L
K4L+
0.5S 1.5S 5S
BS1924-2
CBR (top) (%) <1 (F) <1 (F) 32 (P) 39 (P) 29 (P) 3.4 (F)
Linear Swell
(mm)5.7 (F) 9.1 (F) 0.6 (P) 2.3 (P) 4.0 (P) 4.8 (P)
EN13286-49 Gv (%) 30 (F) 27 (F) 8.1 (F/P) 12 (F) 20 (F) 29 (F)
Note: F –fail, F/P – maybe suitable for use subject to further testing, P – pass
In terms of the relative severity of the tests used and their associated suitability criteria,
the European accelerated volumetric swell test (EN13286-49) appears to be more
100 Chapter Five – Macrophysical Property Testing
onerous than the UK linear swell test (BS1924-2) on account of both the control soil (K4L)
being considered suitable only subject to further testing (5 < Gv < 10 %) – in other words
a marginal material. The low sulfate soil (K4L0.5S) is considered unsuitable (Gv ≥ 10)
while testing to BS1924-2 considers both soil mixtures suitable (linear swell/CBR –
0.6mm/32% and 2.3mm/39% respectively).
Considering the montmorillonite soils in Table 30, both tests failed the medium and high
sulfate soils (M6L1.5S and M6L5S), but passed M6L0.5S.
Table 30. Swell test results for montmorillonite soils referenced against relevant suitabilitycriteria
Mix ID Test Property M M5S M6L
M6L+
0.5S 1.5S 5S
BS1924-2
(28 day)
CBR Top (%) <1 (F) <1 (F) 67 (P) 41 (P) 15 (F) 11 (F)
Linear Swell
(mm)25 (F) 16 (F) <1 (P) 2.1 (P) 7.3 (F) 8.1 (F)
EN13286-49 Gv (%) 37 (F) 34 (F) 1.4 (P) 3.8 (P) 10 (F) 15 (F)
Note: F –fail, F/P – maybe suitable for use subject to further testing, P - pass
The effect of lime stabilisation is apparent, both in terms of a reduction in linear and
volumetric swell and an increase in CBR strength. This can be attributed to the
development of a cementitious matrix, resulting from the pozzolanic reactions forming
calcium silicate hydrates (CSH), calcium aluminosilicate hydrates (CASH) and calcium
aluminate hydrates (CAH) under the localised alkaline conditions within the soil matrix
(Rajasekaran, 1995; Bell, 1996; Mohamad, 2000). The strengths of the soils at both 7
and 28 days immersion for kaolin and montmorillonite are summarised in Figure 30.
Chapter Five – Macrophysical Property Testing 101
Figure 30: CBR strengths of kaolin and montmorillonite soils at 7 and 28 days (BS1924-2)
For the lime stabilised soils, generally, higher strengths were measured at 28 days than 7
days immersion. The increase in strength was much more pronounced for the
montmorillonite soil than for the kaolin. The slower rate of strength gain of lime stabilised
kaolin soils has been reported by Bell (1996), who found that ultimate strengths tended to
be higher over the long term. This was born out with the 9 month immersion tests
(BS1924-2) where the kaolin soils (despite containing sulfates) exhibited higher strengths
then the montmorillonite equivalents. It is interesting to note that the cessation of linear
swell was relatively abrupt in the long-term tests, particularly for the medium sulfate soils
of both clays. Possible reasons for this could be the consumption of one or more
102 Chapter Five – Macrophysical Property Testing
candidate ions (Al(OH)4ˉ, SO4
2, OH
ˉand Ca
2+) thereby preventing the further formation of
ettringite (assuming this is responsible for the observed swell). The pH of the soils after
the test was found to be ca. pH <10. This suggests that it was the consumption of OHˉ
ion that caused the cessation of swell since ettringite is thought not to be stable at pH’s <
10.43 at 25°C (Damidot and Glasser, 1992). The availability of alumina is also much
reduced due to its lower solubility at this pH (Berger et al, 2002). In addition, the swell
profiles of the two clays are markedly different. The kaolin was relatively linear whereas
the montmorillonite was not. In reaction kinetics, graphs of rate equations giving a linear
plot are indicative of first order reactions, whereas non-linear plots are indicative of
second order kinetics. This could be evidence of differing mechanisms of ettringite
formation and growth in the two soils, although this also could be purely coincidental and
also a gross over-simplification. Again this is explored further in chapter nine.
Again considering the long-term tests, the behaviour of the 5% compared to the 10%
sulfate soil was unexpected. They exhibited broadly similar swell responses throughout
the duration of the testing. Clearly there are one or more limiting factors preventing the
10% sulfate soils swelling more than the 5%. The kinetics of ettringite formation are fast,
so the extent of nucleation and crystal growth depends on the availability of the limiting
reagent in solution (Little et al, 2010). Since a chemical reaction is only as fast as the rate
limiting (or slowest) step, this limiting factor would manifest in the pore solution of the
soils by a through-solution mechanism (Min and Tang, 1994) or at the solid-solution
interface by a topochemical mechanism (Odler and Glasser, 1988) dependent on the
mode of ettringite formation. It may be that gypsum has already reached saturation at 5%,
so the further addition of gypsum to the soil does not result in an increase in SO42ˉ
concentration. The dissolution of alumina as well as hydroxide ion concentration may also
play a part. This is explored further in Chapter Eight.
The plot of the high sulfate soils (K4L5S and M6L5S) in the European accelerated
volumetric swell test (EN13286-49) shows some variation in the rate of swell evident by
the shape of the swell plot. When the soil increases in volume, the confinement of the soil
by the elasticated bracelets results in an uneven distribution of volumetric swell, as such,
the error in measurements used for calculating the specimen volume increase with
greater swelling. Efforts were taken to record (as far as is reasonable) measurements that
were representative of the specimen, but taking them from the same positions at each
time interval.
The addition of increasing amounts of sulfate to the soils resulted in an incremental
decrease in soil strength and an increase in both linear and volumetric swell (see also
Chapter Eight). Given the relative stability of the control soil (M6L and K4L), this can be
attributed to deleterious sulfate reactions within the soil matrix. Expansive sulfate
Chapter Five – Macrophysical Property Testing 103
reactions, in particular the formation of ettringite, would account for the increase in heave,
as well as the loss of strength resulting from damage to the cementitious matrix (Little et
al, 2010). The dimensional instability and loss of strength also correlated with a general
increase in measured water content of specimens from both tests. The formation of both
AFt and AFm could contribute to the observed increase, given that AFt has an extensive
Hydrogen-bonded network of water molecules stabilising the structure and its ability to
form an electric double layer of water like a swelling clay (Min and Tang, 1994; Hartman
and Berliner, 2005). However, it is unlikely that this solely accounts for all of the water.
Damage resulting from the linear swell and volumetric expansion could also expose
unstabilised clay particles within the soil matrix to the immersion water. Saturation of
these particles could also increase the water content. Also, the expansion and associated
damage to the microstructure could create cracks and further void spaces increasing the
permeability of the soil, as well as allowing it to hold more water than the undamaged (in
terms of sulfate heave) controls.
The strength measured at the bottom of the CBR specimens of sulfated kaolin soils,
exhibited a degree of superficial strength, not observed at the top face, or in any of the
montmorillonite soils. An increase in strength has been reported in the literature when
small quantities of sulfate are present in lime stabilised soils (Ktnuthia and Wild, 2001).
The mechanism of this phenomenon was not alluded to however. In the present study, it
was initially thought that expansion resulting from AFt formation under confinement of the
bottom swell plate, caused a localised densification of the soil. If this were the case, then
a similar behaviour would be expected in the equivalent montmorillonite soils, but was not
observed. As all other parameters are equal, it then follows that it is a specific property of
the kaolin clay itself causing the behaviour. In comparison to the montmorillonite, a kaolin
clay releases more alumina into solution at high pH (Mitchell and Dermatas, 1992). As
reported in Chapter Three, when the ratio of [Al2O3]/[SO4] >1 (Hampson and Bailey, 1983;
Mitchell and Dermatas, 1992), or [Al2O3]/[SO4] >1.5 (Black et al, 2005), then the formation
of monosulfate (AFm) is favoured over ettringite (AFt). It is possible therefore, that it is the
formation of monosulfate, which has a plate like morphology (Baur et al, 2004) that is
causing the localised increase in soil strength. This would need to be confirmed by
analysis of the material to determine the composition of the soil at the bottom of the CBR
specimen compared to that of the top (see Chapter Six). In the study of cement and
concrete, it has been widely reported that AFt formation causes the early strength gains
of Portland cements and indeed results in the phenomena of ‘flash-set’ (Taylor, 1990). It
is also considered that the formation of monosulfate is neither expansive nor contributes
to the strength of a cementitious material (Mitchell and Dermatas, 1992).
104 Chapter Five – Macrophysical Property Testing
Considering the pH of the soil after testing, all the soils except those of the sulfated
montmorillonite subject to EN13286-49, maintained a pH >12.4. Those soils exhibited a
drop in soil pH to ca. pH 10.4. The lower stability limit of AFt at 25°C has been reported
by Damidot and Glasser (1992) as pH 10.43. Microstructural and phase compositional
analysis will determine if ettringite has persisted in these specimens. It is suggested that
the drop observed in the montmorillonite soils is a result of its higher cation exchange
capacity than the kaolin. Recalling Section 2.3.2, on the addition of lime to a clay soil,
unsatisfied electrostatic charge on the surface of clay particles attracts the calcium ion
(Ca2+
) released on the dissolution of lime in aqueous solution. This displaces cations
already on the surface and results in the consumption of the lime in the process. It is
suggested that the elevated temperatures of the European accelerated volumetric swell
test, coupled with the greater surface area of the specimen exposed to the immersion
water, increases the reaction rate of the CEC process, evidenced by the drop in pH, not
found in the equivalent soils subjected to the UK linear soaked CBR swell test. A drop in
soil pH to below that required for stabilisation was reported by Berger et al (2002), despite
initially having a sufficient lime addition to raise the pH of the soil to 12.4. The
composition of the soil was not reported however.
For both tests, the degree of reaction can be considered a function of the rate of swell.
Considering the results of the kaolin based soils; in BS1924-2, at 28 days, both the
medium (1.5S) and high sulfate (5S) were continuing to swell indicating on-going
deleterious reactions. The low sulfate soil (0.5S) had reached a plateau relatively early. In
EN13286-49, the low and medium sulfate soils had reached a plateau relatively early,
while the high sulfate soil was continuing to expand, although in the montmorillonite soil, it
had started to level off. This is considered in more detail in Chapter Seven.
5.5. SUMMARY
The macro-physical properties (CBR strength, linear swell and volumetric expansion) of
twelve soil mixtures were subject to swell testing using two swell test procedures:
UK linear CBR swell test (BS1924-2); and
European Accelerated Volumetric swell test (EN13286-49)
The two unstabilised control soils of both the kaolin and montmorillonite exhibited the
greatest swell response and lowest CBR strength post immersion. Unexpected
differences in the linear swell response were attributed to variation in the permeability of
the CBR specimens. The addition of lime to the unsulfated control soils resulted in a
Chapter Five – Macrophysical Property Testing 105
significant reduction in the swell response and an increase in strength which can be
attributed to pozzolanic reactions within the soil matrix.
The addition of sulfate to both soils resulted in a proportional decrease in volumetric
stability and a corresponding loss of soil strength in the order CL > CL0.5S > CL1.5S >
CL5S (where C – clay, L – lime, S – sulfate). Measured water contents of the specimens
after testing also showed a proportional increase with sulfate content. Preliminary
conclusions suggested that this is due to the formation of the hydrous calcium
aluminosulfates ettringite (AFt) and possibly monosulfate (AFm). It is suggested that the
formation of AFm may be responsible for the superficially high CBR strength values
measured at the bottom of the low sulfate stabilised kaolin soil mixtures.
Comparing the results of the two swell test procedures in conjunction with the pass/fail
criteria for each (Table 29 and Table 30), it was suggested that the European accelerated
volumetric swell test (EN13286-49) is more onerous than the UK linear CBR swell test
(BS1924-2). It is also suggested that the complete immersion of the specimens and the
elevated temperatures used in EN13286-49, promote the soil reactions in both clays to a
greater degree, than the conditions of BS1924-2. This was based on the concept of a
‘degree of reaction’ which compares the time taken for the dimensional changes of a soil
to plateau during an immersion procedure.
Long-term testing of selected sulfate soils (including a 10% sulfate soil) showed that
expansion is governed by a rate limiting step, possibly the saturation concentration of
SO42
ions in the pore solution. Although it is reasonable to suggest that either of the other
candidate ions are involved in the rate limiting step.
The swell profiles of the long-term kaolin and montmorillonite soils are markedly different.
This may be indicative of different mechanisms of ettringite formation and subsequent
expansion at play in each soil.
106 Chapter Six - Phase Composition and Microstructure
6. PHASE COMPOSITION AND
MICROSTRUCTURE
6.1. INTRODUCTION
This chapter reports the finding of the analysis of the phase composition and
microstructure of the soils tested using the two immersion tests. The purpose this work is
to achieve Objective 2. Namely:
O2: ‘Investigate the chemical response of the sulfated lime stabilised soils to the
conditions imposed by the swell tests. In particular those attributed to
dimensional instability and mechanical weakening’.
And provide sufficient insight to realise Objective 3:
O3: ‘Relate the underlying chemical behaviour to the observed macro-physical
soil properties and investigate the factors affecting this relationship. In particular:
clay mineralogy; sulfate concentration; temperature and duration of curing and
immersion’.
The analysis was undertaken using XRD, SEM-EDX and dTGA, details of which were
given in Chapter Five. The results derived from each are presented and discussed
separately. These sections are arranged in a way which best suits a comparative analysis
for that particular analytical technique. The work is then summated and interim
conclusions made in Section 6.5.
6.2. X-RAY DIFFRACTION
X-ray diffraction analysis was undertaken on all of the soil specimens using a Siemens
D5001 diffractometer using CuKα radiation of wavelength λ=1.5406nm. Two scan
methods were used the first was a wide angle scan between 5 – 70° 2θ, with a 0.05° step
size and 5s count time. The second, used in the low angle studies, was 8 – 10.5° 2θ with
a 0.02° step and a count time of 60s.
The purpose of this analysis is to define the phase composition of the soils after testing to
the UK CBR linear swell test (at both 7 and 28 days) and the European accelerated
Chapter Six - Phase Composition and Microstructure 107
volumetric swell test. The scan files were processed using the Bruker XRD software EVA.
Diffraction lines were attributed to a particular powder phase were identified by matching
to the ICCD database PDF-2 (2011).
6.2.1. Kaolin soils (UK linear CBR swell test)
The XRD patterns of the kaolin soils subject to the UK 7 and 28 day CBR linear swell test
are shown in Figure 31 and Figure 32 respectively. The strongest diffraction lines in terms
of intensity are those belonging to gypsum (PDF. 01-086-0945); kaolinite (PDF. 01-083-
0987) and quartz (PDF. 01-085-0154). Minor amounts of feldspar (PDF. 01-084-0710),
residual hydrated lime (PDF. 44-1481), precipitated calcium carbonate (calcite PDF. 00-
005-0586) and ettringite (PDF. 01-072-0646) were also found.
Figure 31: XRD pattern of kaolin soils after UK 7 day CBR linear swell test (BS1924-2). I
– illite, E – ettringite, G – gypsum, K – kaolinite, F – Feldspar, L – portlandite (hydrated
lime), C – calcite, Q - quartz
Residual gypsum, that is, gypsum that had not reacted within the soil, was only found in
the high sulfate soils (K4L5S, peak at ca. 11.6° 2θ) and was still present even when
immersed for 28 days. A small amount of carbonate contamination was also found. This
was initially present in the calcium oxide (see Appendix A) but may also have formed in
the soil, if the CaO reacts with dissolved carbon dioxide (CO2) in the immersion water. A
small peak attributed to monosulfate 12-hydrate, AFm-12 (PDF. 00-045-0158) was also
found, but this is considered further in Section 6.2.4.
108 Chapter Six - Phase Composition and Microstructure
Figure 32: XRD pattern of kaolin soils after UK 28 day CBR linear swell test (BS1924-2). I
– illite, E – ettringite, G – gypsum, K – kaolinite, L – portlandite (hydrated lime), C –
calcite, Q - quartz
Gypsum was only detected in the high sulfate clay (K4L5S) at 12.3° 2θ. This could be
due to it being below the level of detection of the diffractometer and method (unlikely), or
that the gypsum in the low and medium sulfate soils was consumed over the course of
the test. Monosulfate (AFm-12, PDF. 00-45-0158) was also found (circled red in Figure
32), at 9.98° 2θ as reported by Black et al (2006), but only in the low sulfate soil
(K4L0.5S). A reduction in the hydrated lime content was also observed as a reduction in
the peak intensity at 17.8° 2θ.
6.2.2. Montmorillonite Soils (UK linear CBR swell test)
The XRD patterns of the montmorillonite soils after testing to BS1924-2 (7 days
immersion) are shown in Figure 33. Peaks attributable to ettringite and calcium carbonate
were found. As found in the kaolin soils, only in the high sulfate soils (M5S and M6L5S)
was any gypsum detected.
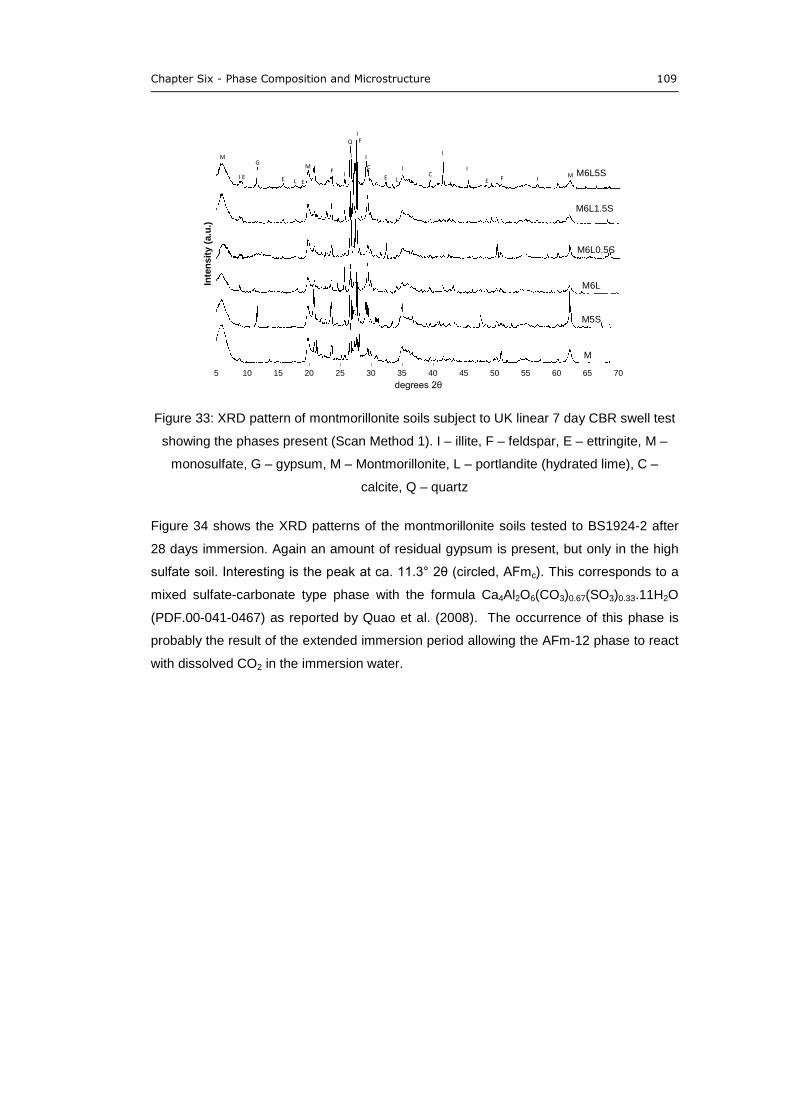
Chapter Six - Phase Composition and Microstructure 109
Figure 33: XRD pattern of montmorillonite soils subject to UK linear 7 day CBR swell test
showing the phases present (Scan Method 1). I – illite, F – feldspar, E – ettringite, M –
monosulfate, G – gypsum, M – Montmorillonite, L – portlandite (hydrated lime), C –
calcite, Q – quartz
Figure 34 shows the XRD patterns of the montmorillonite soils tested to BS1924-2 after
28 days immersion. Again an amount of residual gypsum is present, but only in the high
sulfate soil. Interesting is the peak at ca. 11.3° 2θ (circled, AFmc). This corresponds to a
mixed sulfate-carbonate type phase with the formula Ca4Al2O6(CO3)0.67(SO3)0.33.11H2O
(PDF.00-041-0467) as reported by Quao et al. (2008). The occurrence of this phase is
probably the result of the extended immersion period allowing the AFm-12 phase to react
with dissolved CO2 in the immersion water.
5 10 15 20 25 30 35 40 45 50 55 60 65 70
Inte
ns
ity
(a.u
.)
degrees 2θ
M
M6L5S
M6L0.5S
M6L
G
L EE E
I
I
C
Q
C
M
E
M
I
LI
I
I I
II E
M5S
M6L1.5S
MF
F
F
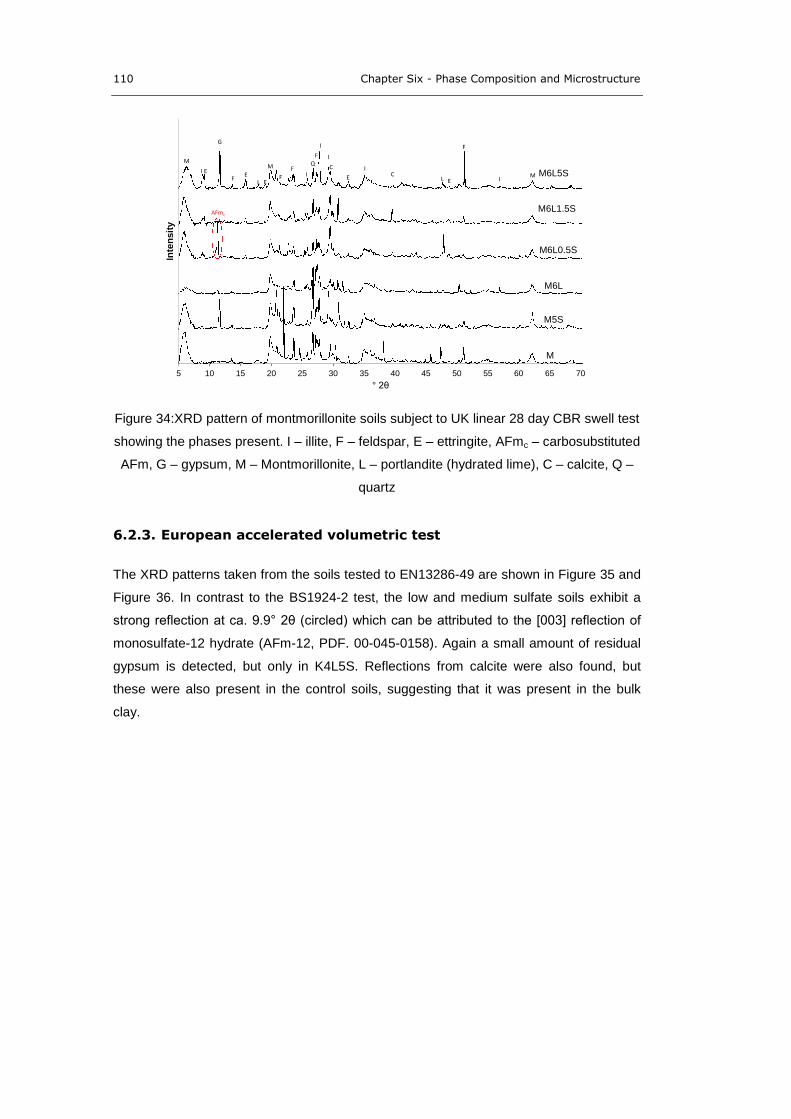
110 Chapter Six - Phase Composition and Microstructure
Figure 34:XRD pattern of montmorillonite soils subject to UK linear 28 day CBR swell test
showing the phases present. I – illite, F – feldspar, E – ettringite, AFmc – carbosubstituted
AFm, G – gypsum, M – Montmorillonite, L – portlandite (hydrated lime), C – calcite, Q –
quartz
6.2.3. European accelerated volumetric test
The XRD patterns taken from the soils tested to EN13286-49 are shown in Figure 35 and
Figure 36. In contrast to the BS1924-2 test, the low and medium sulfate soils exhibit a
strong reflection at ca. 9.9° 2θ (circled) which can be attributed to the [003] reflection of
monosulfate-12 hydrate (AFm-12, PDF. 00-045-0158). Again a small amount of residual
gypsum is detected, but only in K4L5S. Reflections from calcite were also found, but
these were also present in the control soils, suggesting that it was present in the bulk
clay.
5 10 15 20 25 30 35 40 45 50 55 60 65 70
Inte
nsit
y
° 2θ
M
M6L5S
M6L0.5S
M6L
G
L E
EE
I
I
C
QC
M
E
MI I
L II E
M5S
M6L1.5S
M
AFmc
F
F
F
F
F
Chapter Six - Phase Composition and Microstructure 111
Figure 35: XRD pattern of kaolin soils subject to the European accelerated volumetric
swell test (EN13286-49) the phases present. I – illite, F - feldspar, Mn – monosulfate, G –
gypsum, L – portlandite (hydrated lime), C – calcite, Q – quartz
Considering Figure 36, it can be seen that the gypsum peak in the high sulfate soils
(M6L5S) is much reduced compared to the unstabilised control. The difference is also
much more marked than the soil tested to BS1924-2 at either 7 or 28 days. The higher
temperature of the immersion water would contribute to this reduction by not only
increasing the solubility of the gypsum phase, but also promote the formation of ettringite.
The formation ettringite and monosulfate in all of the soils is considered fully using low
angle studies of their principal reflection lines in Section 6.2.4.
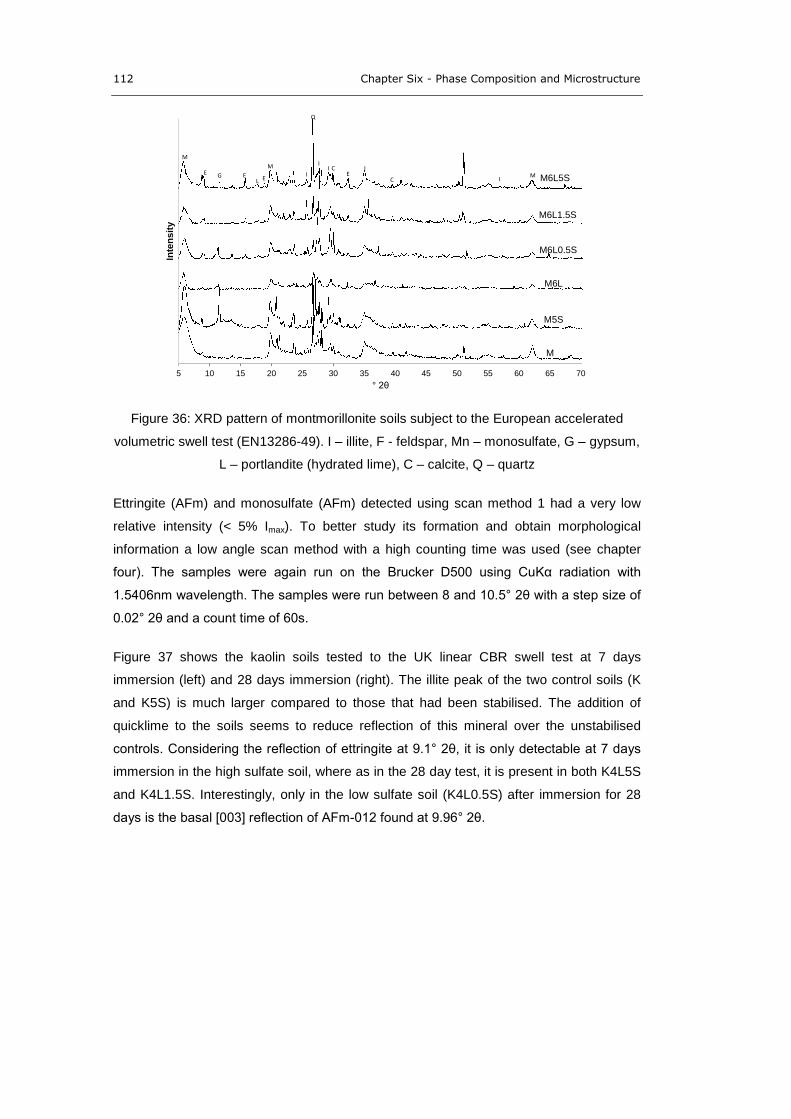
112 Chapter Six - Phase Composition and Microstructure
Figure 36: XRD pattern of montmorillonite soils subject to the European accelerated
volumetric swell test (EN13286-49). I – illite, F - feldspar, Mn – monosulfate, G – gypsum,
L – portlandite (hydrated lime), C – calcite, Q – quartz
Ettringite (AFm) and monosulfate (AFm) detected using scan method 1 had a very low
relative intensity (< 5% Imax). To better study its formation and obtain morphological
information a low angle scan method with a high counting time was used (see chapter
four). The samples were again run on the Brucker D500 using CuKα radiation with
1.5406nm wavelength. The samples were run between 8 and 10.5° 2θ with a step size of
0.02° 2θ and a count time of 60s.
Figure 37 shows the kaolin soils tested to the UK linear CBR swell test at 7 days
immersion (left) and 28 days immersion (right). The illite peak of the two control soils (K
and K5S) is much larger compared to those that had been stabilised. The addition of
quicklime to the soils seems to reduce reflection of this mineral over the unstabilised
controls. Considering the reflection of ettringite at 9.1° 2θ, it is only detectable at 7 days
immersion in the high sulfate soil, where as in the 28 day test, it is present in both K4L5S
and K4L1.5S. Interestingly, only in the low sulfate soil (K4L0.5S) after immersion for 28
days is the basal [003] reflection of AFm012 found at 9.96° 2θ.
5 10 15 20 25 30 35 40 45 50 55 60 65 70
Inte
ns
ity
° 2θ
M
M6L5S
M6L0.5S
M6L
GL
E E
II
C
Q
C
M
E
M
I
I
I
II E
M5S
M6L1.5S
M
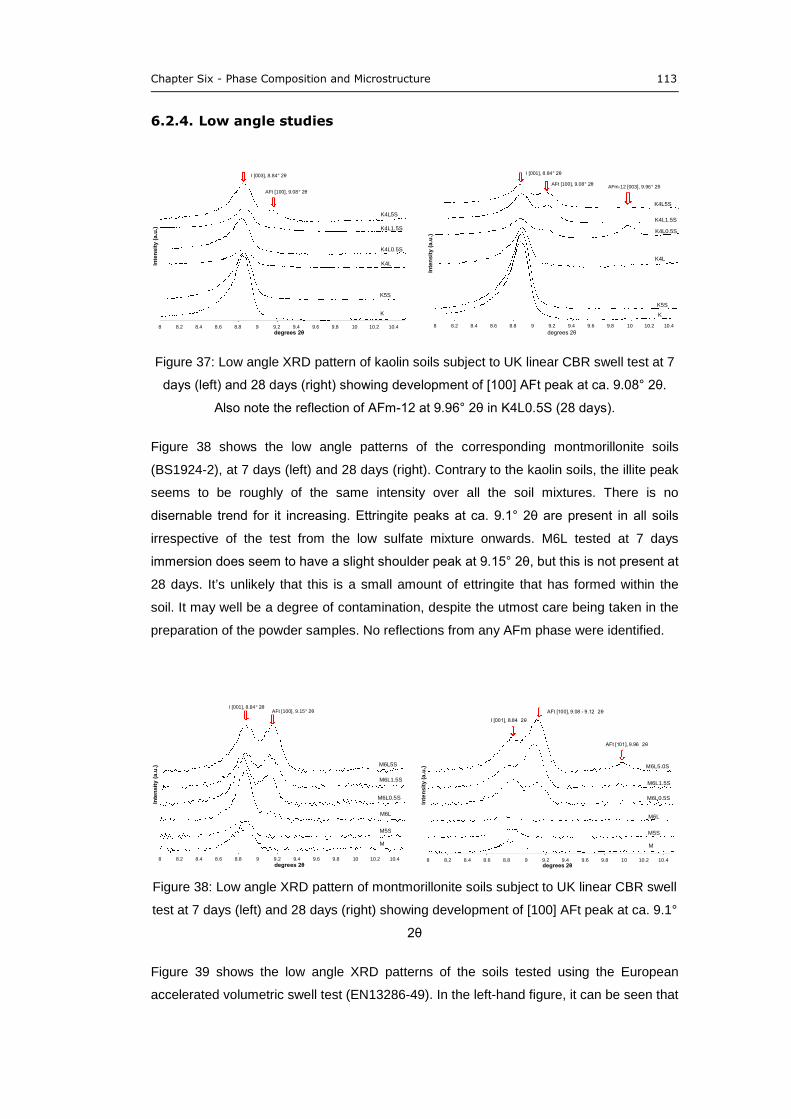
Chapter Six - Phase Composition and Microstructure 113
6.2.4. Low angle studies
Figure 37: Low angle XRD pattern of kaolin soils subject to UK linear CBR swell test at 7
days (left) and 28 days (right) showing development of [100] AFt peak at ca. 9.08° 2θ.
Also note the reflection of AFm12 at 9.96° 2θ in K4L0.5S (28 days).
Figure 38 shows the low angle patterns of the corresponding montmorillonite soils
(BS1924-2), at 7 days (left) and 28 days (right). Contrary to the kaolin soils, the illite peak
seems to be roughly of the same intensity over all the soil mixtures. There is no
disernable trend for it increasing. Ettringite peaks at ca. 9.1° 2θ are present in all soils
irrespective of the test from the low sulfate mixture onwards. M6L tested at 7 days
immersion does seem to have a slight shoulder peak at 9.15° 2θ, but this is not present at
28 days. It’s unlikely that this is a small amount of ettringite that has formed within the
soil. It may well be a degree of contamination, despite the utmost care being taken in the
preparation of the powder samples. No reflections from any AFm phase were identified.
Figure 38: Low angle XRD pattern of montmorillonite soils subject to UK linear CBR swell
test at 7 days (left) and 28 days (right) showing development of [100] AFt peak at ca. 9.1°
2θ
Figure 39 shows the low angle XRD patterns of the soils tested using the European
accelerated volumetric swell test (EN13286-49). In the left-hand figure, it can be seen that
8 8.2 8.4 8.6 8.8 9 9.2 9.4 9.6 9.8 10 10.2 10.4
Inte
nsit
y(a
.u.)
degrees 2θ
K4L
K4L5S
K4L1.5S
K4L0.5S
I [003], 8.84° 2θ
AFt [100], 9.08° 2θ
K
K5S
8 8.2 8.4 8.6 8.8 9 9.2 9.4 9.6 9.8 10 10.2 10.4
Inte
nsit
y(a
.u.)
degrees 2θ
K5S
K4L5S
K4L1.5S
K4L0.5S
I [001], 8.84° 2θ
AFt [100], 9.08° 2θAFm-12 [003], 9.96° 2θ
K
K4L
8 8.2 8.4 8.6 8.8 9 9.2 9.4 9.6 9.8 10 10.2 10.4
Inte
nsit
y(a
.u.)
degrees 2θ
M5S
M6L5S
M6L1.5S
M6L0.5S
I [001], 8.84° 2θAFt [100], 9.15° 2θ
M
M6L
8 8.2 8.4 8.6 8.8 9 9.2 9.4 9.6 9.8 10 10.2 10.4
Inte
ns
ity
(a.u
.)
degrees 2θ
M5S
M6L5.0S
M6L1.5S
M6L0.5S
I [001], 8.84 2θ
AFt [100], 9.08 9.12 2θ
M
M6L
AFt [101], 9.96 2θ
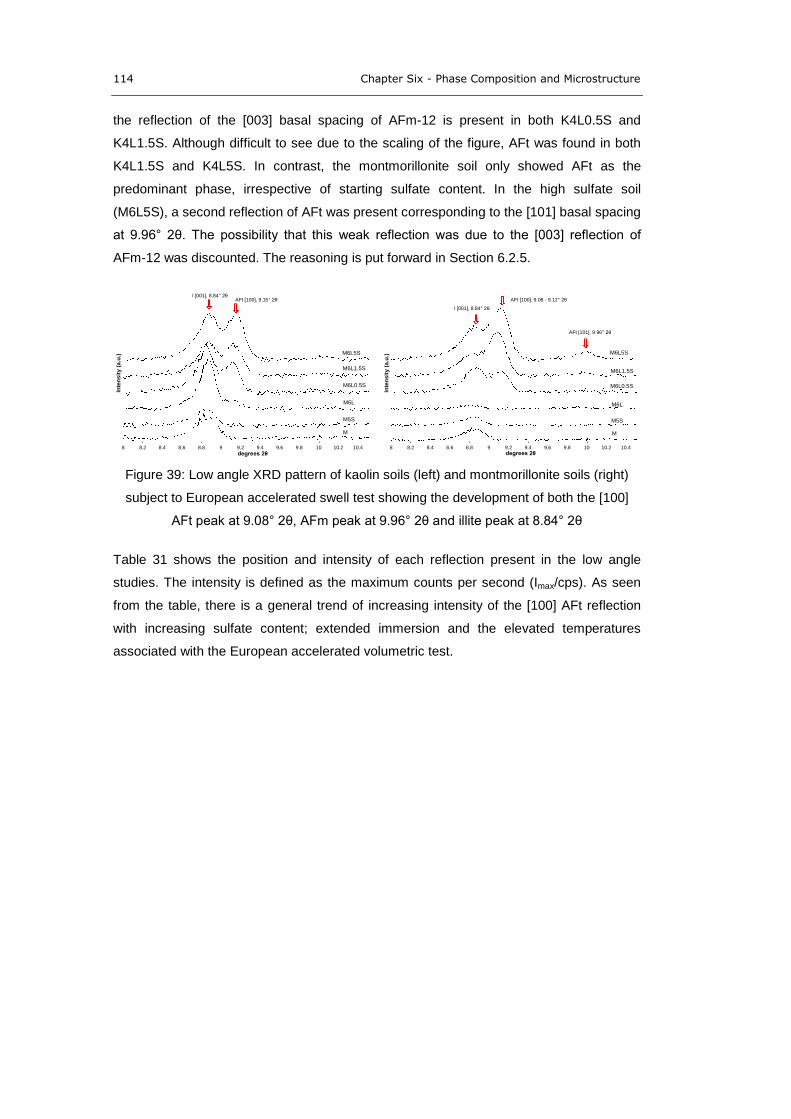
114 Chapter Six - Phase Composition and Microstructure
the reflection of the [003] basal spacing of AFm-12 is present in both K4L0.5S and
K4L1.5S. Although difficult to see due to the scaling of the figure, AFt was found in both
K4L1.5S and K4L5S. In contrast, the montmorillonite soil only showed AFt as the
predominant phase, irrespective of starting sulfate content. In the high sulfate soil
(M6L5S), a second reflection of AFt was present corresponding to the [101] basal spacing
at 9.96° 2θ. The possibility that this weak reflection was due to the [003] reflection of
AFm-12 was discounted. The reasoning is put forward in Section 6.2.5.
Figure 39: Low angle XRD pattern of kaolin soils (left) and montmorillonite soils (right)
subject to European accelerated swell test showing the development of both the [100]
AFt peak at 9.08° 2θ, AFm peak at 9.96° 2θ and illite peak at 8.84° 2θ
Table 31 shows the position and intensity of each reflection present in the low angle
studies. The intensity is defined as the maximum counts per second (Imax/cps). As seen
from the table, there is a general trend of increasing intensity of the [100] AFt reflection
with increasing sulfate content; extended immersion and the elevated temperatures
associated with the European accelerated volumetric test.
8 8.2 8.4 8.6 8.8 9 9.2 9.4 9.6 9.8 10 10.2 10.4
Inte
nsit
y(a
.u.)
degrees 2θ
M5S
M6L5S
M6L1.5S
M6L0.5S
I [001], 8.84° 2θAFt [100], 9.15° 2θ
M
M6L
8 8.2 8.4 8.6 8.8 9 9.2 9.4 9.6 9.8 10 10.2 10.4
Inte
nsit
y(a
.u.)
degrees 2θ
M5S
M6L5S
M6L1.5S
M6L0.5S
I [001], 8.84° 2θ
AFt [100], 9.08 - 9.12° 2θ
M
M6L
AFt [101], 9.96° 2θ
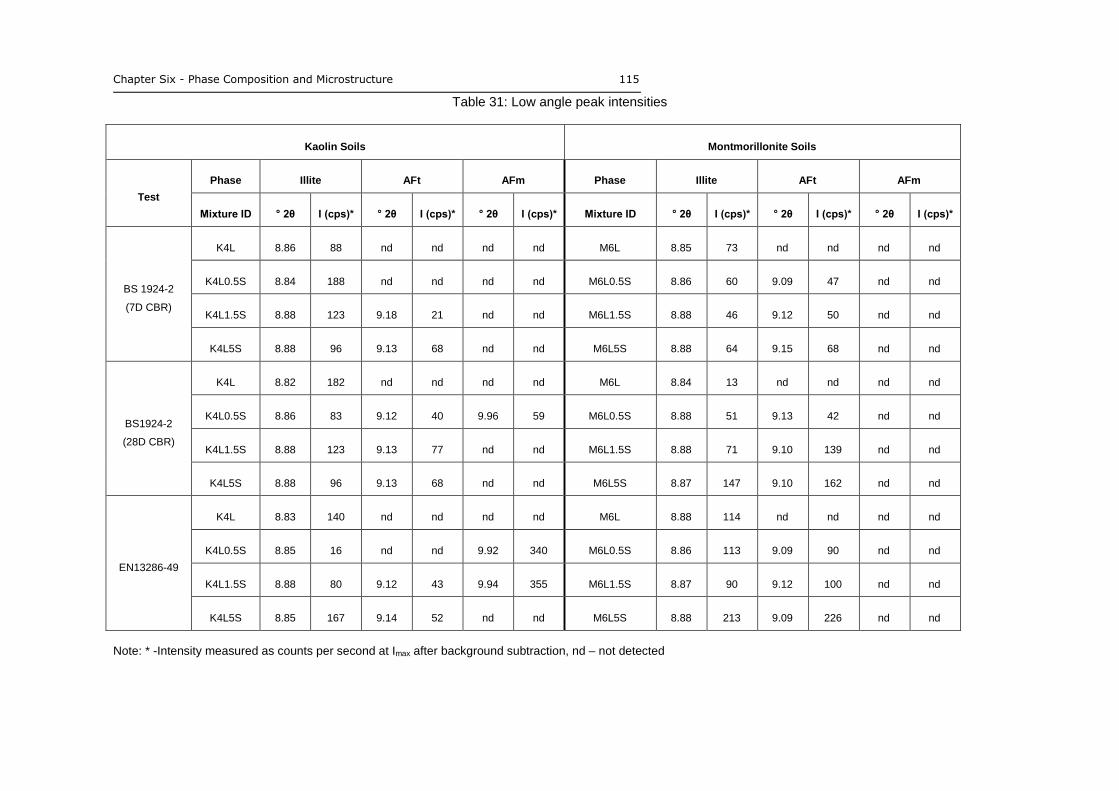
Chapter Six - Phase Composition and Microstructure 115
Table 31: Low angle peak intensities
Note: * -Intensity measured as counts per second at Imax after background subtraction, nd – not detected
Kaolin Soils Montmorillonite Soils
Test
Phase Illite AFt AFm Phase Illite AFt AFm
Mixture ID ° 2θ I (cps)* ° 2θ I (cps)* ° 2θ I (cps)* Mixture ID ° 2θ I (cps)* ° 2θ I (cps)* ° 2θ I (cps)*
BS 1924-2
(7D CBR)
K4L 8.86 88 nd nd nd nd M6L 8.85 73 nd nd nd nd
K4L0.5S 8.84 188 nd nd nd nd M6L0.5S 8.86 60 9.09 47 nd nd
K4L1.5S 8.88 123 9.18 21 nd nd M6L1.5S 8.88 46 9.12 50 nd nd
K4L5S 8.88 96 9.13 68 nd nd M6L5S 8.88 64 9.15 68 nd nd
BS1924-2
(28D CBR)
K4L 8.82 182 nd nd nd nd M6L 8.84 13 nd nd nd nd
K4L0.5S 8.86 83 9.12 40 9.96 59 M6L0.5S 8.88 51 9.13 42 nd nd
K4L1.5S 8.88 123 9.13 77 nd nd M6L1.5S 8.88 71 9.10 139 nd nd
K4L5S 8.88 96 9.13 68 nd nd M6L5S 8.87 147 9.10 162 nd nd
EN13286-49
K4L 8.83 140 nd nd nd nd M6L 8.88 114 nd nd nd nd
K4L0.5S 8.85 16 nd nd 9.92 340 M6L0.5S 8.86 113 9.09 90 nd nd
K4L1.5S 8.88 80 9.12 43 9.94 355 M6L1.5S 8.87 90 9.12 100 nd nd
K4L5S 8.85 167 9.14 52 nd nd M6L5S 8.88 213 9.09 226 nd nd
116 Chapter Six - Phase Composition and Microstructure
6.2.5. Long term testing
The wide angle XRD patterns of the kaolin soils subject to extended immersion (9
months) using the UK CBR linear swell test is shown in Figure 40. In the mixture
K4L1.5S, the AFm phase predominates with minor reflection of AFt. The AFt phase is
found exclusively in the soils with higher sulfate contents (K4L5S and K4L10S). Only a
very small reflection from gypsum (12.03° 2θ) was found in K4L1.5S, indicating that it had
largely been consumed in the formation of the AFm phase. Surprisingly, K4L5S exhibited
a larger gypsum reflection at 12.03° 2θ than K4L10S. Despite the Imax reflection of AFt
being roughly equal (see Figure 42).
Figure 40: XRD pattern of kaolin soils subject to extended immersion (9months). K –
kaolin, I – illite, , E – ettringite (AFt), Mn – monosulfate (AFm), G – gypsum, C – calcite, Q
– quartz
In Figure 41, the equivalent montmorillonite soils are shown. In contrast to the kaolin
soils, no monosulfate was found in the 1.5S sulfate soil (M6L1.5S). The predominant
sulfate bearing phase was AFt for all the soils. Residual gypsum was only found in
M6L10S, indicating that in the other two soils it had been largely consumed in the
formation of ettringite.
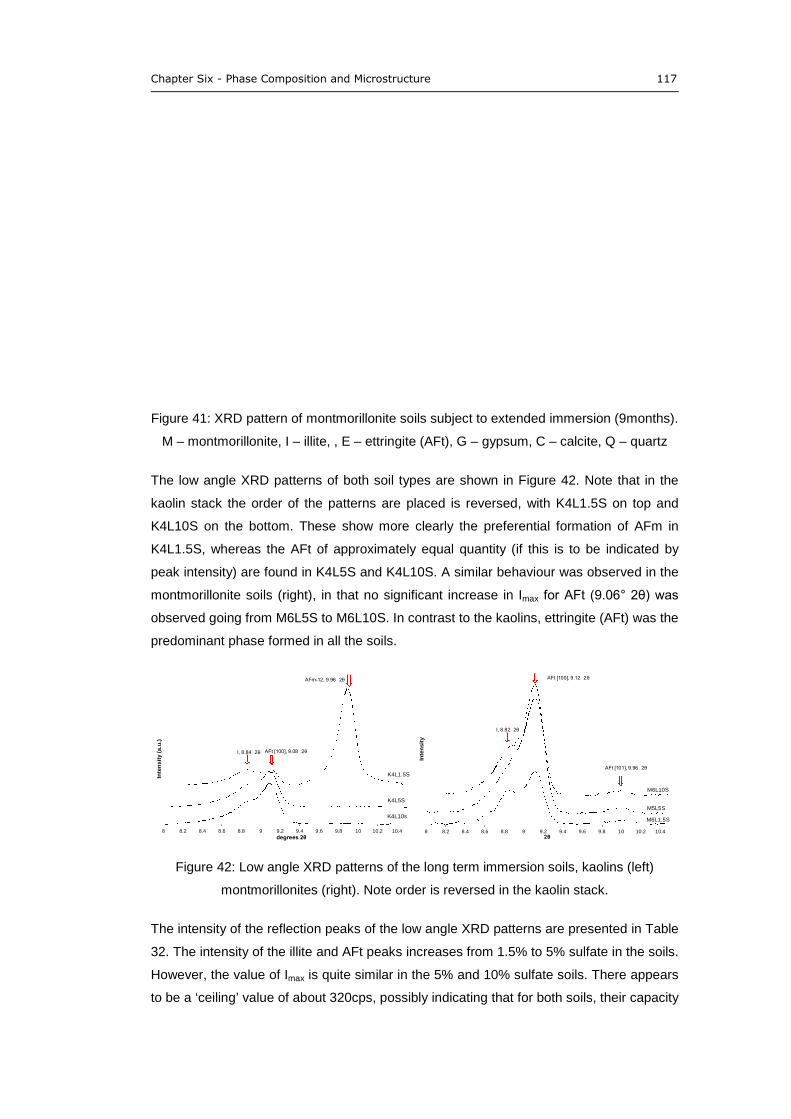
Chapter Six - Phase Composition and Microstructure 117
Figure 41: XRD pattern of montmorillonite soils subject to extended immersion (9months).
M – montmorillonite, I – illite, , E – ettringite (AFt), G – gypsum, C – calcite, Q – quartz
The low angle XRD patterns of both soil types are shown in Figure 42. Note that in the
kaolin stack the order of the patterns are placed is reversed, with K4L1.5S on top and
K4L10S on the bottom. These show more clearly the preferential formation of AFm in
K4L1.5S, whereas the AFt of approximately equal quantity (if this is to be indicated by
peak intensity) are found in K4L5S and K4L10S. A similar behaviour was observed in the
montmorillonite soils (right), in that no significant increase in Imax for AFt (9.06° 2θ) was
observed going from M6L5S to M6L10S. In contrast to the kaolins, ettringite (AFt) was the
predominant phase formed in all the soils.
Figure 42: Low angle XRD patterns of the long term immersion soils, kaolins (left)
montmorillonites (right). Note order is reversed in the kaolin stack.
The intensity of the reflection peaks of the low angle XRD patterns are presented in Table
32. The intensity of the illite and AFt peaks increases from 1.5% to 5% sulfate in the soils.
However, the value of Imax is quite similar in the 5% and 10% sulfate soils. There appears
to be a ‘ceiling’ value of about 320cps, possibly indicating that for both soils, their capacity
8 8.2 8.4 8.6 8.8 9 9.2 9.4 9.6 9.8 10 10.2 10.4
Inte
ns
ity
(a.u
.)
degrees 2θ
K4L10s
K4L1.5S
K4L5S
I, 8.84 2θ AFt [100], 9.08 2θ
AFm12, 9.96 2θ
8 8.2 8.4 8.6 8.8 9 9.2 9.4 9.6 9.8 10 10.2 10.4
Inte
ns
ity
2θ
M5L5S
I, 8.82 2θ
AFt [100], 9.12 2θ
M6L1.5S
M6L10S
AFt [101], 9.96 2θ
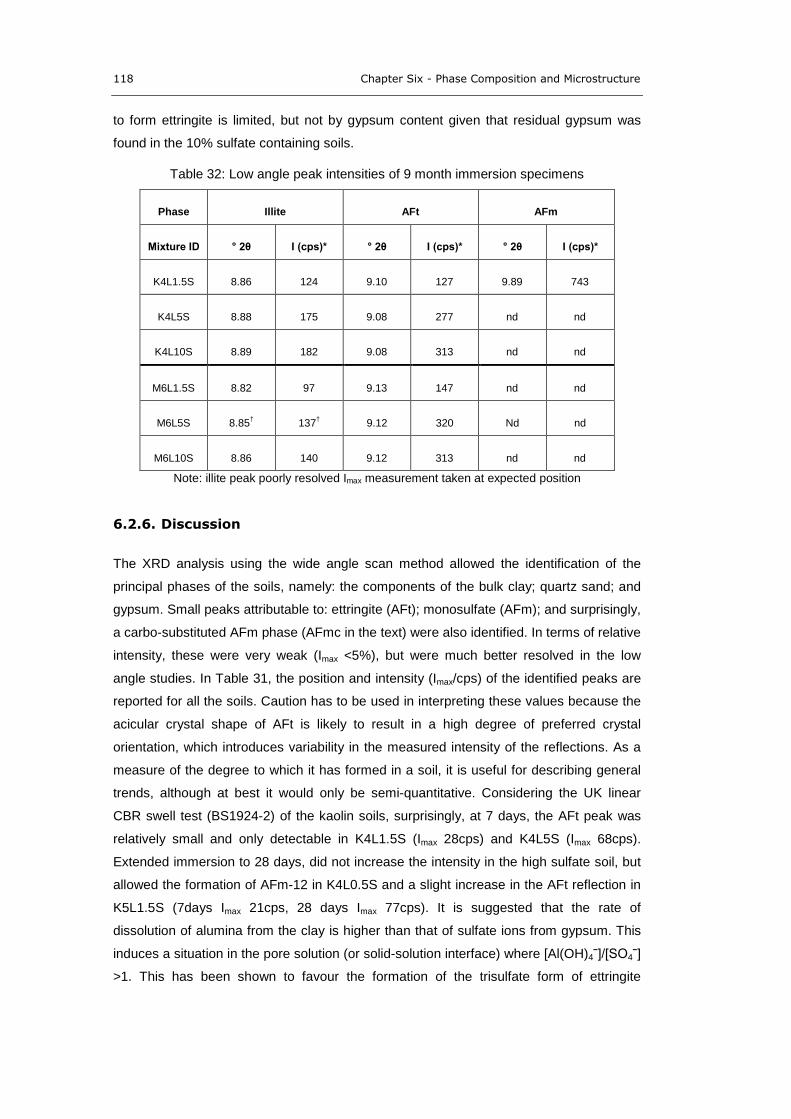
118 Chapter Six - Phase Composition and Microstructure
to form ettringite is limited, but not by gypsum content given that residual gypsum was
found in the 10% sulfate containing soils.
Table 32: Low angle peak intensities of 9 month immersion specimens
Phase Illite AFt AFm
Mixture ID ° 2θ I (cps)* ° 2θ I (cps)* ° 2θ I (cps)*
K4L1.5S 8.86 124 9.10 127 9.89 743
K4L5S 8.88 175 9.08 277 nd nd
K4L10S 8.89 182 9.08 313 nd nd
M6L1.5S 8.82 97 9.13 147 nd nd
M6L5S 8.85† 137† 9.12 320 Nd nd
M6L10S 8.86 140 9.12 313 nd nd
Note: illite peak poorly resolved Imax measurement taken at expected position
6.2.6. Discussion
The XRD analysis using the wide angle scan method allowed the identification of the
principal phases of the soils, namely: the components of the bulk clay; quartz sand; and
gypsum. Small peaks attributable to: ettringite (AFt); monosulfate (AFm); and surprisingly,
a carbo-substituted AFm phase (AFmc in the text) were also identified. In terms of relative
intensity, these were very weak (Imax <5%), but were much better resolved in the low
angle studies. In Table 31, the position and intensity (Imax/cps) of the identified peaks are
reported for all the soils. Caution has to be used in interpreting these values because the
acicular crystal shape of AFt is likely to result in a high degree of preferred crystal
orientation, which introduces variability in the measured intensity of the reflections. As a
measure of the degree to which it has formed in a soil, it is useful for describing general
trends, although at best it would only be semi-quantitative. Considering the UK linear
CBR swell test (BS1924-2) of the kaolin soils, surprisingly, at 7 days, the AFt peak was
relatively small and only detectable in K4L1.5S (Imax 28cps) and K4L5S (Imax 68cps).
Extended immersion to 28 days, did not increase the intensity in the high sulfate soil, but
allowed the formation of AFm-12 in K4L0.5S and a slight increase in the AFt reflection in
K5L1.5S (7days Imax 21cps, 28 days Imax 77cps). It is suggested that the rate of
dissolution of alumina from the clay is higher than that of sulfate ions from gypsum. This
induces a situation in the pore solution (or solid-solution interface) where [Al(OH)4ˉ]/[SO4ˉ]
>1. This has been shown to favour the formation of the trisulfate form of ettringite
Chapter Six - Phase Composition and Microstructure 119
(Hampson and Bailey, 1983; Mitchell and Dematas, 1990). Ettringite becomes
thermodynamically unstable when [Al(OH)4ˉ]/[SO4ˉ] <1, at which point the system enters
the stability field of monosulfate (Hampson and Bailey, 1983). Localised variations in pore
solution ion concentration probably allow for the formation of both the AFt and AFm
phase concurrently, given that K4L0.5S at 28 days also had a reflection of AFt. No AFm
was detected in the low sulfate montmorillonite soils. The dissolution of alumina from 2:1
layer clays is known to be slower than 1:1 types clays like kaolin. 2:1 layer clays have a
higher silica content because their structures are comprised of SiO4 tetrahedra with a
AlO4 octohedral sheet between. The dissolution of this three layer clay under alkaline
conditions is effectively a serial reaction, with the silicate sheets having to dissolve before
the Alumina sheet is exposed. This ultimately results in lower [Al(OH)4ˉ] for the
montmorillonite than the kaolin (Bauer and Berger, 1997).
Irrespective of the test conditions used, the reflections of ettringite formed in the
montmorillonite based soils are better defined than those from the equivalent kaolins
(Figure 37 and Figure 39). It has been reported in the literature that small amorphous
crystals do not reflect X-rays as well because they have a low degree of crystallinity, as
opposed to those that are larger and well formed (Odler and Abdrl-Maula, 1984; Yang,
1996). This leads to the conclusion that the crystals formed in the kaolins are smaller and
more amorphous than those in the montmorillonites. Early work has established that
ettringite morphology is greatly affected by the candidate ion concentration in the pore
solution (Nakamura, 1968; Cohen, 1983; Min and Tang, 1994; and Wang, 2005). When
the hydroxide ion concentration is high ([OHˉ]), the system favours the formation of small
colloidal size ettringite, when low, larger AFt crystals are favoured. When all other
variables are equal, it then follows that [OHˉ] is governed by the chemical properties of
the bulk clay. Montmorillonite has a much higher cation exchange capacity than kaolin, so
would effectively ‘consume’ hydroxide ion at a faster rate and ultimately to a greater
degree.
The increase in immersion period did have an effect on those soils that favoured the
formation of AFm (K4L0.5S). At 28 days monosulfate was found as a carbo-substituted
AFm phase. This is likely to be the result of AFm reacting with dissolved carbon dioxide
(CO2) in the immersion water, with the short immersion period (7 days) being not enough
time for this to permeate the compacted specimens.
Interestingly, the measured Imax value of AFt from the specimens subject to long term
immersion (BS1924-2) appeared to have a ‘ceiling’ value of about 320cps. This was
found in both the 5% and 10% sulfate soils, despite residual gypsum being found in the
soils containing 10% SO4 of both clays. It is suggested that the formation of AFt was then
limited by the consumption of the calcium hydroxide and its depletion from the pore
120 Chapter Six - Phase Composition and Microstructure
solution. This was evidenced by the relatively rapid cessation of the measured linear
swells and the marked drop in soil pH (Chapter Five) preventing the continued formation
of ettringite.
The extended immersion tests also reveal that the formation of the AFm phase is
favoured in the medium sulfate kaolin soil. The continuing dissolution of alumina from the
bulk clay after the source of sulfate has been exhausted would result in [Al(OH)4ˉ]/[SO42
]
>1, promoting the dissolution of the trisulfate phase in favour of the formation of AFm. In
the equivalent montmorillonite (M6L1.5S) AFt remained the stable phase throughout,
indicative of a slower rate of alumina dissolution and maintenance of the pore solution
with [Al(OH)4ˉ]/[SO42
] <1. The 5% sulfate soils both favoured the formation of the AFt
phase.
The Imax of the reflection taken from the unstabilised control soils (K5S and M5S) could be
used as the reference standard and any reduction in this peak intensity used to infer the
formation of AFm and AFt phases. This is explored further in Chapter Eight.
6.3. THERMAL GRAVIMETRIC ANALYSIS (TGA)
Derivative Thermal Gravimetric Analysis (dTGA) was undertaken using the equipment
and scan method described in Chapter Four. The results are plotted as the percentage
square of their derivative function to produce a positive peak profile and aid in peak
identification.
Quantification in a multiphase material by dTGA is difficult. It requires knowledge of each
phase present and the theoretical mass loss associated with each thermal event (Brown,
2001). Due to the high water content of ettringite and the difficulty in ascribing a mass
loss of water to each dehydration step, dTGA has only been used for identification, not
quantification of cementitious hydrates (including AFt and AFm), although the use of
dTGA for the quantification of hydrated lime has been wide-spread (Ukrainczyk et al,
2006; Jung and Santagata, 2009). In those cases, measurement of hydrated lime
(portlandite) in cements is used to measure the degree of hydration of the cement paste
in question. Such a measurement applied to this study has been attempted (see Section
6.3.3). It offers a measurement of the soils response to lime induced stabilisation, but
includes all those processes that consume lime: cation exchange; and pozzolanic as well
as deleterious reactions.
Chapter Six - Phase Composition and Microstructure 121
6.3.1. Control soils
Figure 43 (left) shows the results of testing the kaolin soils to BS1924-2 after 7 days
immersion. The unstabilised soils (K and K5S) show large peaks at 450 - 650° C
attributed to the dehydroxlyation of the kaolin (4) (Guggenheim and Koster van Groos,
2001). In addition soil mixture K exhibited a peak at around 30 °C (1) due to the loss of
absorbed water on the clay surface. The stabilised control (K4L) again exhibited a peak
due to dehydroxlyation (4) at higher temperature (peak inflection ca. 700°C). This could
be due to modification of the clay surface by cation exchange processes following the
lime addition. A residual lime peak was also detected at ca. 400°C in the stabilised
control (K4L) (3). Figure 43 (right) shows the dTGA plot of the equivalent montmorillonite
soils at 7 days. Again the soils exhibited a loss of adsorbed water (1) at ca.50 °C
(Dellisanti et al, 2005). In addition soil mixture M5S also exhibited a mass loss at ca. 80
°C. This has previously been attributed to the desorption of interlayer H2O (2) present in
2:1 layer clays such as montmorillonite (Bray and Redfern, 1999). But its absence from
the unsulfated (M) and lime stabilised control (M6L), suggests this thermal event is
associated with the dehydration of gypsum to anhydrite, despite the literature reporting
this to occur at ca. 130°C (Fleck et al. 1960) and analysis of the mined gypsum used in
this study also showing the main thermal dehydration to anhydrite at 130°C (see
Appendix A). Dehydroxylation of montmorillonite (4) occurs at 650 – 750 °C (Drits et al.
2012) again exhibited by these control soils. The peak at ca. 475°C corresponds to the
decomposition of residual hydrated lime (Kolias et al, 2005) in the soil mixture M6L (3).
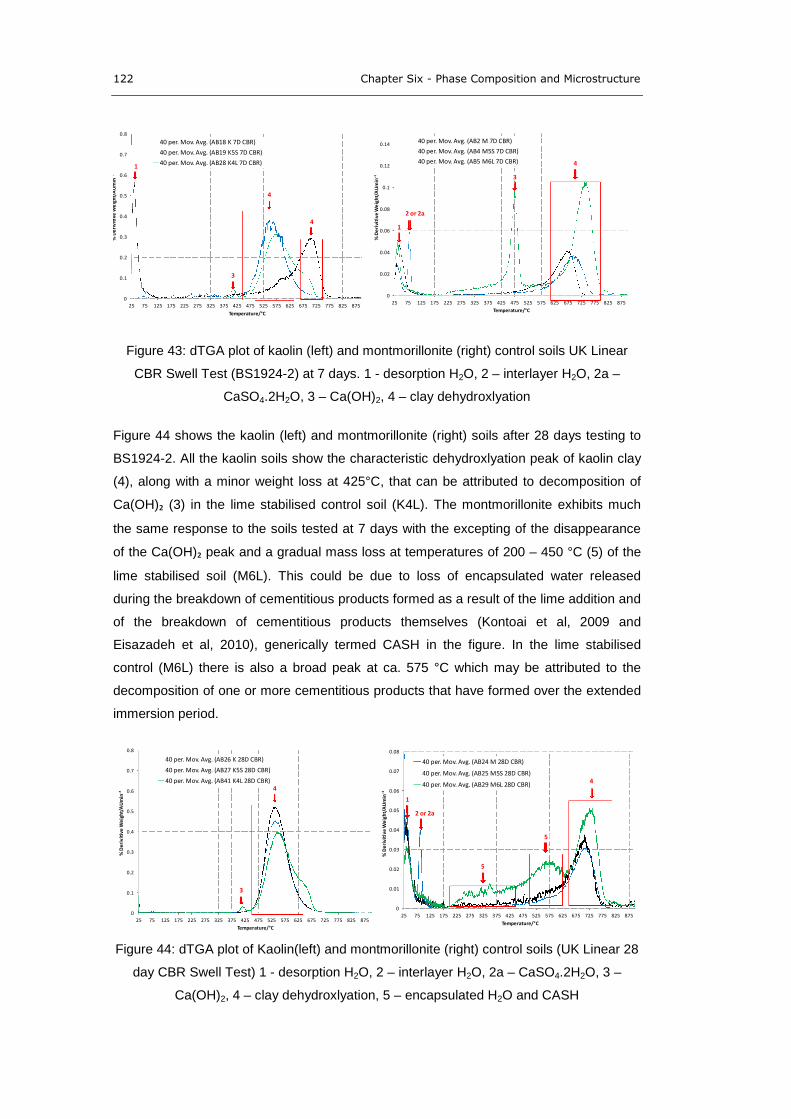
122 Chapter Six - Phase Composition and Microstructure
Figure 43: dTGA plot of kaolin (left) and montmorillonite (right) control soils UK Linear
CBR Swell Test (BS1924-2) at 7 days. 1 - desorption H2O, 2 – interlayer H2O, 2a –
CaSO4.2H2O, 3 – Ca(OH)2, 4 – clay dehydroxlyation
Figure 44 shows the kaolin (left) and montmorillonite (right) soils after 28 days testing to
BS1924-2. All the kaolin soils show the characteristic dehydroxlyation peak of kaolin clay
(4), along with a minor weight loss at 425°C, that can be attributed to decomposition of
Ca(OH)₂ (3) in the lime stabilised control soil (K4L). The montmorillonite exhibits much
the same response to the soils tested at 7 days with the excepting of the disappearance
of the Ca(OH)₂ peak and a gradual mass loss at temperatures of 200 – 450 °C (5) of the
lime stabilised soil (M6L). This could be due to loss of encapsulated water released
during the breakdown of cementitious products formed as a result of the lime addition and
of the breakdown of cementitious products themselves (Kontoai et al, 2009 and
Eisazadeh et al, 2010), generically termed CASH in the figure. In the lime stabilised
control (M6L) there is also a broad peak at ca. 575 °C which may be attributed to the
decomposition of one or more cementitious products that have formed over the extended
immersion period.
Figure 44: dTGA plot of Kaolin(left) and montmorillonite (right) control soils (UK Linear 28
day CBR Swell Test) 1 - desorption H2O, 2 – interlayer H2O, 2a – CaSO4.2H2O, 3 –
Ca(OH)2, 4 – clay dehydroxlyation, 5 – encapsulated H2O and CASH
0
0.1
0.2
0.3
0.4
0.5
0.6
0.7
0.8
25 75 125 175 225 275 325 375 425 475 525 575 625 675 725 775 825 875
й��ĞƌŝǀŝƟǀĞ
�tĞŝŐŚƚͬ�hŵŝŶЁϷ
Temperature/°C
40 per. Mov. Avg. (AB18 K 7D CBR)
40 per. Mov. Avg. (AB19 K5S 7D CBR)
40 per. Mov. Avg. (AB28 K4L 7D CBR)1
4
3
4
0
0.02
0.04
0.06
0.08
0.1
0.12
0.14
25 75 125 175 225 275 325 375 425 475 525 575 625 675 725 775 825 875
й��ĞƌŝǀŝƟǀĞ
�tĞŝŐŚƚͬ�hŵŝŶЁϷ
Temperature/°C
40 per. Mov. Avg. (AB2 M 7D CBR)
40 per. Mov. Avg. (AB4 M5S 7D CBR)
40 per. Mov. Avg. (AB5 M6L 7D CBR)
3
4
1
2 or 2a
0
0.1
0.2
0.3
0.4
0.5
0.6
0.7
0.8
25 75 125 175 225 275 325 375 425 475 525 575 625 675 725 775 825 875
й��ĞƌŝǀŝƟǀĞ
�tĞŝŐŚƚͬ�hŵŝŶЁϷ
Temperature/°C
40 per. Mov. Avg. (AB26 K 28D CBR)
40 per. Mov. Avg. (AB27 K5S 28D CBR)
40 per. Mov. Avg. (AB41 K4L 28D CBR)
3
4
0
0.01
0.02
0.03
0.04
0.05
0.06
0.07
0.08
25 75 125 175 225 275 325 375 425 475 525 575 625 675 725 775 825 875
й��ĞƌŝǀŝƟǀĞ
�tĞŝŐŚƚͬ�hŵŝŶЁϷ
Temperature/°C
40 per. Mov. Avg. (AB24 M 28D CBR)
40 per. Mov. Avg. (AB25 M5S 28D CBR)
40 per. Mov. Avg. (AB29 M6L 28D CBR)4
1
2 or 2a
5
5
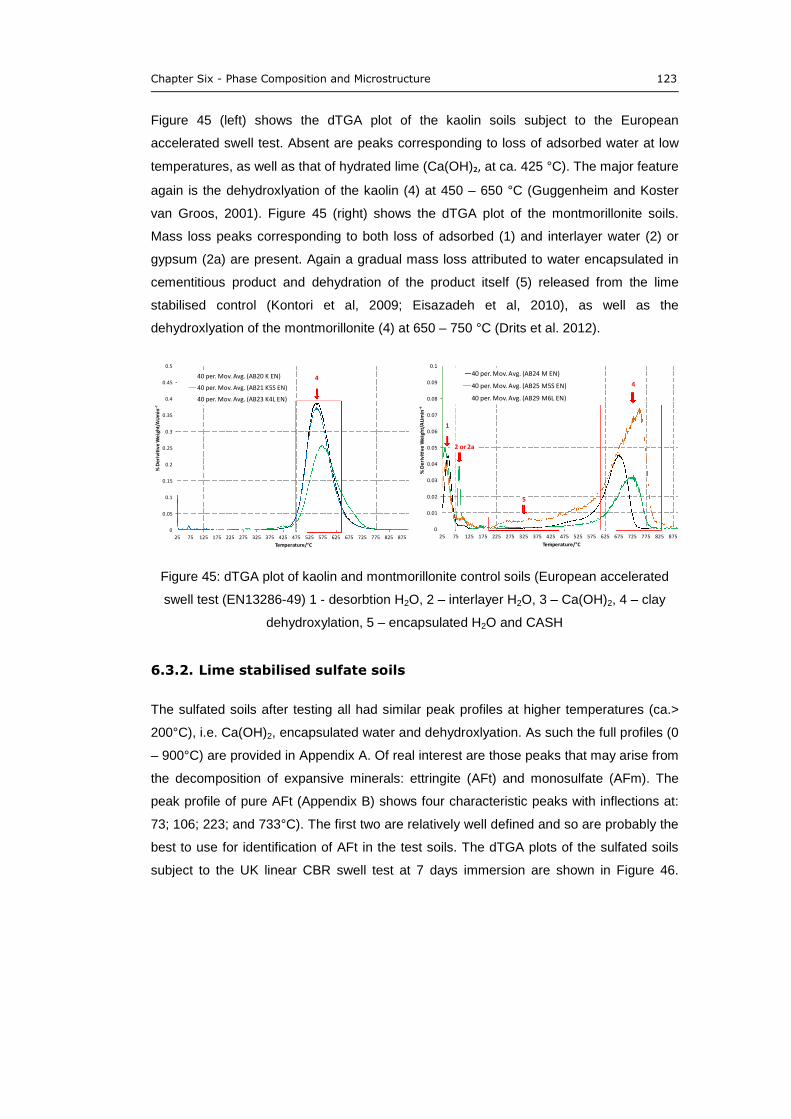
Chapter Six - Phase Composition and Microstructure 123
Figure 45 (left) shows the dTGA plot of the kaolin soils subject to the European
accelerated swell test. Absent are peaks corresponding to loss of adsorbed water at low
temperatures, as well as that of hydrated lime (Ca(OH)₂, at ca. 425 °C). The major feature
again is the dehydroxlyation of the kaolin (4) at 450 – 650 °C (Guggenheim and Koster
van Groos, 2001). Figure 45 (right) shows the dTGA plot of the montmorillonite soils.
Mass loss peaks corresponding to both loss of adsorbed (1) and interlayer water (2) or
gypsum (2a) are present. Again a gradual mass loss attributed to water encapsulated in
cementitious product and dehydration of the product itself (5) released from the lime
stabilised control (Kontori et al, 2009; Eisazadeh et al, 2010), as well as the
dehydroxlyation of the montmorillonite (4) at 650 – 750 °C (Drits et al. 2012).
Figure 45: dTGA plot of kaolin and montmorillonite control soils (European accelerated
swell test (EN13286-49) 1 - desorbtion H2O, 2 – interlayer H2O, 3 – Ca(OH)2, 4 – clay
dehydroxylation, 5 – encapsulated H2O and CASH
6.3.2. Lime stabilised sulfate soils
The sulfated soils after testing all had similar peak profiles at higher temperatures (ca.>
200°C), i.e. Ca(OH)2, encapsulated water and dehydroxlyation. As such the full profiles (0
– 900°C) are provided in Appendix A. Of real interest are those peaks that may arise from
the decomposition of expansive minerals: ettringite (AFt) and monosulfate (AFm). The
peak profile of pure AFt (Appendix B) shows four characteristic peaks with inflections at:
73; 106; 223; and 733°C). The first two are relatively well defined and so are probably the
best to use for identification of AFt in the test soils. The dTGA plots of the sulfated soils
subject to the UK linear CBR swell test at 7 days immersion are shown in Figure 46.
0
0.05
0.1
0.15
0.2
0.25
0.3
0.35
0.4
0.45
0.5
25 75 125 175 225 275 325 375 425 475 525 575 625 675 725 775 825 875
й��ĞƌŝǀŝƟǀĞ
�tĞŝŐŚƚͬ�hŵŝŶЁϷ
Temperature/°C
40 per. Mov. Avg. (AB20 K EN)
40 per. Mov. Avg. (AB21 K5S EN)
40 per. Mov. Avg. (AB23 K4L EN)
4
0
0.01
0.02
0.03
0.04
0.05
0.06
0.07
0.08
0.09
0.1
25 75 125 175 225 275 325 375 425 475 525 575 625 675 725 775 825 875
й��ĞƌŝǀŝƟǀĞ
�tĞŝŐŚƚͬ�hŵŝŶЁϷ
Temperature/°C
40 per. Mov. Avg. (AB24 M EN)
40 per. Mov. Avg. (AB25 M5S EN)
40 per. Mov. Avg. (AB29 M6L EN)
1
2 or 2a
5
4
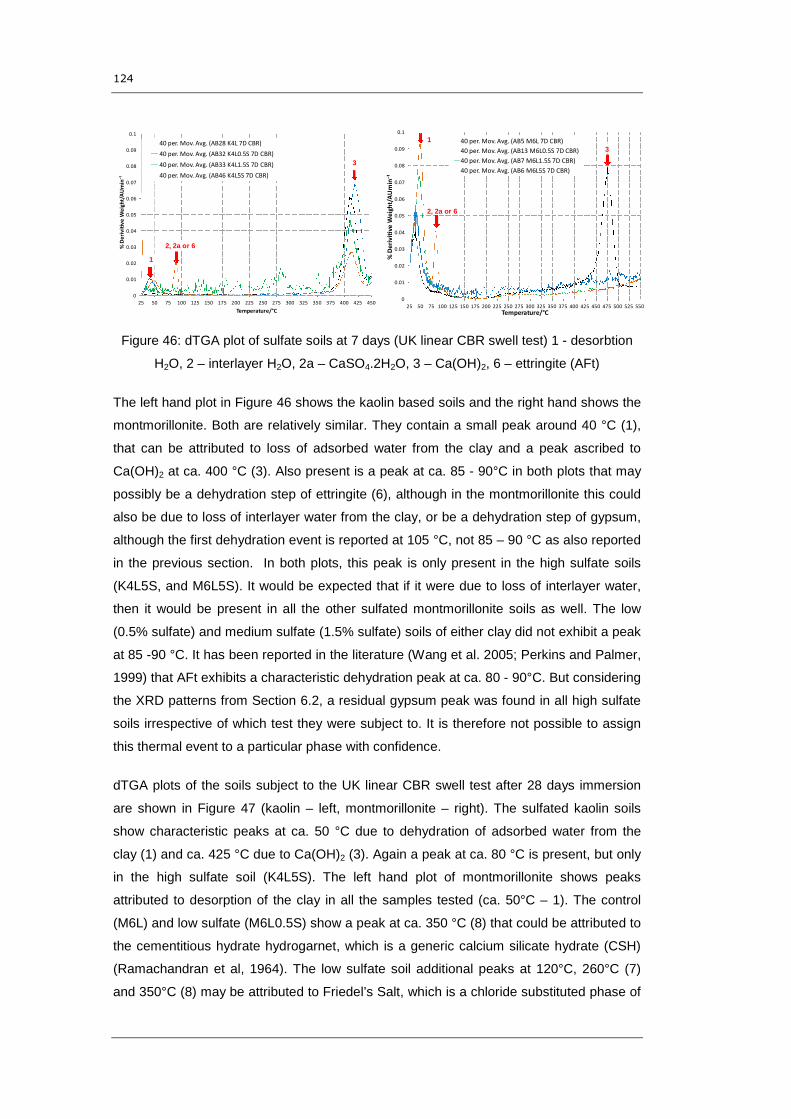
124
Figure 46: dTGA plot of sulfate soils at 7 days (UK linear CBR swell test) 1 - desorbtion
H2O, 2 – interlayer H2O, 2a – CaSO4.2H2O, 3 – Ca(OH)2, 6 – ettringite (AFt)
The left hand plot in Figure 46 shows the kaolin based soils and the right hand shows the
montmorillonite. Both are relatively similar. They contain a small peak around 40 °C (1),
that can be attributed to loss of adsorbed water from the clay and a peak ascribed to
Ca(OH)2 at ca. 400 °C (3). Also present is a peak at ca. 85 - 90°C in both plots that may
possibly be a dehydration step of ettringite (6), although in the montmorillonite this could
also be due to loss of interlayer water from the clay, or be a dehydration step of gypsum,
although the first dehydration event is reported at 105 °C, not 85 – 90 °C as also reported
in the previous section. In both plots, this peak is only present in the high sulfate soils
(K4L5S, and M6L5S). It would be expected that if it were due to loss of interlayer water,
then it would be present in all the other sulfated montmorillonite soils as well. The low
(0.5% sulfate) and medium sulfate (1.5% sulfate) soils of either clay did not exhibit a peak
at 85 -90 °C. It has been reported in the literature (Wang et al. 2005; Perkins and Palmer,
1999) that AFt exhibits a characteristic dehydration peak at ca. 80 - 90°C. But considering
the XRD patterns from Section 6.2, a residual gypsum peak was found in all high sulfate
soils irrespective of which test they were subject to. It is therefore not possible to assign
this thermal event to a particular phase with confidence.
dTGA plots of the soils subject to the UK linear CBR swell test after 28 days immersion
are shown in Figure 47 (kaolin – left, montmorillonite – right). The sulfated kaolin soils
show characteristic peaks at ca. 50 °C due to dehydration of adsorbed water from the
clay (1) and ca. 425 °C due to Ca(OH)2 (3). Again a peak at ca. 80 °C is present, but only
in the high sulfate soil (K4L5S). The left hand plot of montmorillonite shows peaks
attributed to desorption of the clay in all the samples tested (ca. 50°C – 1). The control
(M6L) and low sulfate (M6L0.5S) show a peak at ca. 350 °C (8) that could be attributed to
the cementitious hydrate hydrogarnet, which is a generic calcium silicate hydrate (CSH)
(Ramachandran et al, 1964). The low sulfate soil additional peaks at 120°C, 260°C (7)
and 350°C (8) may be attributed to Friedel’s Salt, which is a chloride substituted phase of
0
0.01
0.02
0.03
0.04
0.05
0.06
0.07
0.08
0.09
0.1
25 50 75 100 125 150 175 200 225 250 275 300 325 350 375 400 425 450
й��ĞƌŝǀŝƟǀĞ
�tĞŝŐŚƚͬ�hŵŝŶЁϷ
Temperature/°C
40 per. Mov. Avg. (AB28 K4L 7D CBR)
40 per. Mov. Avg. (AB32 K4L0.5S 7D CBR)
40 per. Mov. Avg. (AB33 K4L1.5S 7D CBR)
40 per. Mov. Avg. (AB46 K4L5S 7D CBR)
2, 2a or 6
3
1
0
0.01
0.02
0.03
0.04
0.05
0.06
0.07
0.08
0.09
0.1
25 50 75 100 125 150 175 200 225 250 275 300 325 350 375 400 425 450 475 500 525 550
й��ĞƌŝǀŝƟǀĞ�t
ĞŝŐŚ
ƚͬ�hŵŝŶЁϷ
Temperature/°C
40 per. Mov. Avg. (AB5 M6L 7D CBR)
40 per. Mov. Avg. (AB13 M6L0.5S 7D CBR)
40 per. Mov. Avg. (AB7 M6L1.5S 7D CBR)
40 per. Mov. Avg. (AB6 M6L5S 7D CBR)
1
3
2, 2a or 6
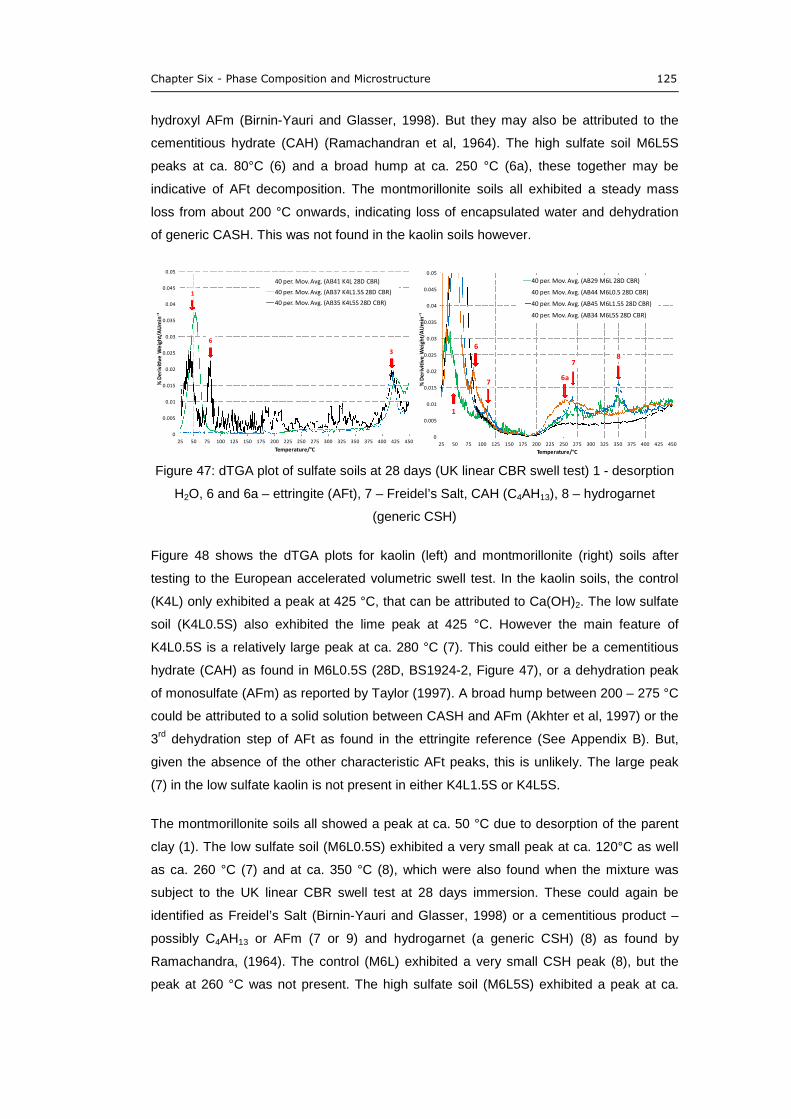
Chapter Six - Phase Composition and Microstructure 125
hydroxyl AFm (Birnin-Yauri and Glasser, 1998). But they may also be attributed to the
cementitious hydrate (CAH) (Ramachandran et al, 1964). The high sulfate soil M6L5S
peaks at ca. 80°C (6) and a broad hump at ca. 250 °C (6a), these together may be
indicative of AFt decomposition. The montmorillonite soils all exhibited a steady mass
loss from about 200 °C onwards, indicating loss of encapsulated water and dehydration
of generic CASH. This was not found in the kaolin soils however.
Figure 47: dTGA plot of sulfate soils at 28 days (UK linear CBR swell test) 1 - desorption
H2O, 6 and 6a – ettringite (AFt), 7 – Freidel’s Salt, CAH (C4AH13), 8 – hydrogarnet
(generic CSH)
Figure 48 shows the dTGA plots for kaolin (left) and montmorillonite (right) soils after
testing to the European accelerated volumetric swell test. In the kaolin soils, the control
(K4L) only exhibited a peak at 425 °C, that can be attributed to Ca(OH)2. The low sulfate
soil (K4L0.5S) also exhibited the lime peak at 425 °C. However the main feature of
K4L0.5S is a relatively large peak at ca. 280 °C (7). This could either be a cementitious
hydrate (CAH) as found in M6L0.5S (28D, BS1924-2, Figure 47), or a dehydration peak
of monosulfate (AFm) as reported by Taylor (1997). A broad hump between 200 – 275 °C
could be attributed to a solid solution between CASH and AFm (Akhter et al, 1997) or the
3rd
dehydration step of AFt as found in the ettringite reference (See Appendix B). But,
given the absence of the other characteristic AFt peaks, this is unlikely. The large peak
(7) in the low sulfate kaolin is not present in either K4L1.5S or K4L5S.
The montmorillonite soils all showed a peak at ca. 50 °C due to desorption of the parent
clay (1). The low sulfate soil (M6L0.5S) exhibited a very small peak at ca. 120°C as well
as ca. 260 °C (7) and at ca. 350 °C (8), which were also found when the mixture was
subject to the UK linear CBR swell test at 28 days immersion. These could again be
identified as Freidel’s Salt (Birnin-Yauri and Glasser, 1998) or a cementitious product –
possibly C4AH13 or AFm (7 or 9) and hydrogarnet (a generic CSH) (8) as found by
Ramachandra, (1964). The control (M6L) exhibited a very small CSH peak (8), but the
peak at 260 °C was not present. The high sulfate soil (M6L5S) exhibited a peak at ca.
0
0.005
0.01
0.015
0.02
0.025
0.03
0.035
0.04
0.045
0.05
25 50 75 100 125 150 175 200 225 250 275 300 325 350 375 400 425 450
й��ĞƌŝǀŝƟǀĞ
�tĞŝŐŚƚͬ�hŵŝŶЁϷ
Temperature/°C
40 per. Mov. Avg. (AB41 K4L 28D CBR)
40 per. Mov. Avg. (AB37 K4L1.5S 28D CBR)
40 per. Mov. Avg. (AB35 K4L5S 28D CBR)
6
1
3
0
0.005
0.01
0.015
0.02
0.025
0.03
0.035
0.04
0.045
0.05
25 50 75 100 125 150 175 200 225 250 275 300 325 350 375 400 425 450
й��ĞƌŝǀŝƟǀĞ
�tĞŝŐŚƚͬ�hŵŝŶЁϷ
Temperature/°C
40 per. Mov. Avg. (AB29 M6L 28D CBR)
40 per. Mov. Avg. (AB44 M6L0.5 28D CBR)
40 per. Mov. Avg. (AB45 M6L1.5S 28D CBR)
40 per. Mov. Avg. (AB34 M6L5S 28D CBR)
1
6
6a
78
7
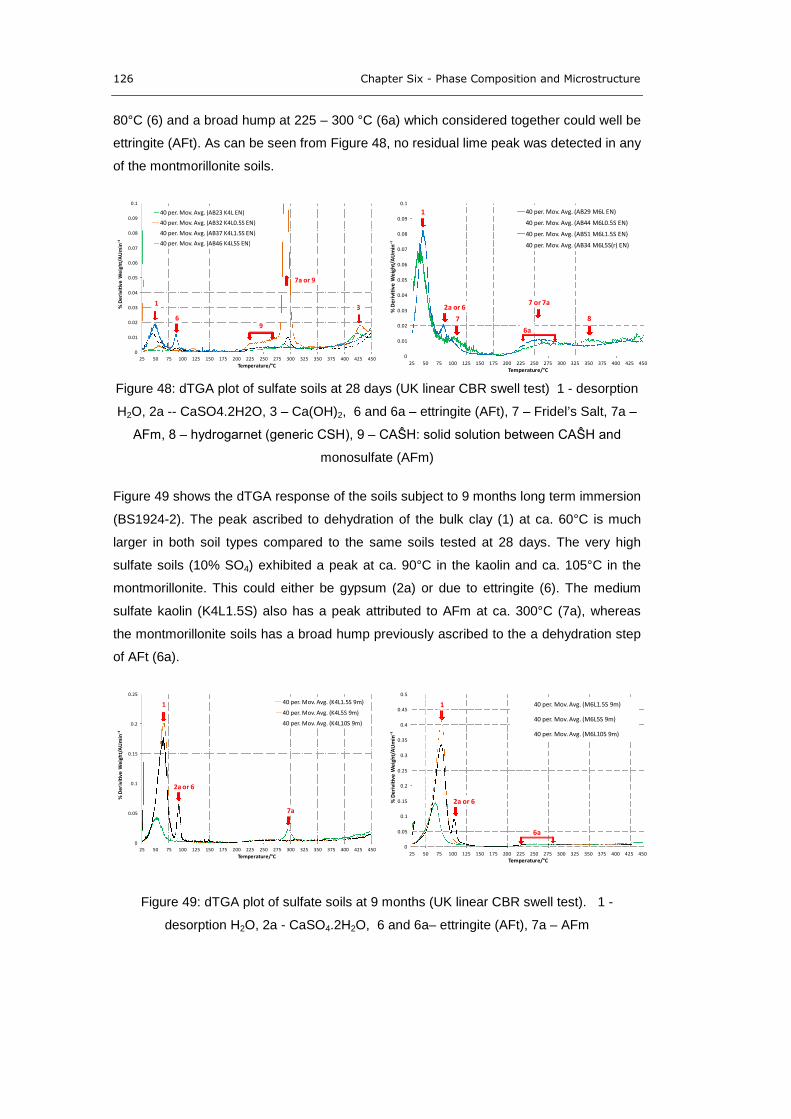
126 Chapter Six - Phase Composition and Microstructure
80°C (6) and a broad hump at 225 – 300 °C (6a) which considered together could well be
ettringite (AFt). As can be seen from Figure 48, no residual lime peak was detected in any
of the montmorillonite soils.
Figure 48: dTGA plot of sulfate soils at 28 days (UK linear CBR swell test) 1 - desorption
H2O, 2a -- CaSO4.2H2O, 3 – Ca(OH)2, 6 and 6a – ettringite (AFt), 7 – Fridel’s Salt, 7a –
AFm, 8 – hydrogarnet (generic CSH), 9 – CAŜH: solid solution between CAŜH and
monosulfate (AFm)
Figure 49 shows the dTGA response of the soils subject to 9 months long term immersion
(BS1924-2). The peak ascribed to dehydration of the bulk clay (1) at ca. 60°C is much
larger in both soil types compared to the same soils tested at 28 days. The very high
sulfate soils (10% SO4) exhibited a peak at ca. 90°C in the kaolin and ca. 105°C in the
montmorillonite. This could either be gypsum (2a) or due to ettringite (6). The medium
sulfate kaolin (K4L1.5S) also has a peak attributed to AFm at ca. 300°C (7a), whereas
the montmorillonite soils has a broad hump previously ascribed to the a dehydration step
of AFt (6a).
Figure 49: dTGA plot of sulfate soils at 9 months (UK linear CBR swell test). 1 -
desorption H2O, 2a - CaSO4.2H2O, 6 and 6a– ettringite (AFt), 7a – AFm
0
0.01
0.02
0.03
0.04
0.05
0.06
0.07
0.08
0.09
0.1
25 50 75 100 125 150 175 200 225 250 275 300 325 350 375 400 425 450
й��ĞƌŝǀŝƟǀĞ
�tĞŝŐŚƚͬ�hŵŝŶЁϷ
Temperature/°C
40 per. Mov. Avg. (AB23 K4L EN)
40 per. Mov. Avg. (AB32 K4L0.5S EN)
40 per. Mov. Avg. (AB37 K4L1.5S EN)
40 per. Mov. Avg. (AB46 K4L5S EN)
6
1
7a or 9
3
9
0
0.01
0.02
0.03
0.04
0.05
0.06
0.07
0.08
0.09
0.1
25 50 75 100 125 150 175 200 225 250 275 300 325 350 375 400 425 450
й��ĞƌŝǀŝƟǀĞ
�tĞŝŐŚƚͬ�hŵŝŶЁϷ
Temperature/°C
40 per. Mov. Avg. (AB29 M6L EN)
40 per. Mov. Avg. (AB44 M6L0.5S EN)
40 per. Mov. Avg. (AB51 M6L1.5S EN)
40 per. Mov. Avg. (AB34 M6L5S(r) EN)
2a or 6
1
7 or 7a
8
6a
7
0
0.05
0.1
0.15
0.2
0.25
25 50 75 100 125 150 175 200 225 250 275 300 325 350 375 400 425 450
й��ĞƌŝǀŝƟǀĞ
�tĞŝŐŚƚͬ�hŵŝŶЁϷ
Temperature/°C
40 per. Mov. Avg. (K4L1.5S 9m)
40 per. Mov. Avg. (K4L5S 9m)
40 per. Mov. Avg. (K4L10S 9m)
2a or 6
1
7a
0
0.05
0.1
0.15
0.2
0.25
0.3
0.35
0.4
0.45
0.5
25 50 75 100 125 150 175 200 225 250 275 300 325 350 375 400 425 450
й��ĞƌŝǀŝƟǀĞ
�tĞŝŐŚƚͬ�hŵŝŶЁϷ
Temperature/°C
40 per. Mov. Avg. (M6L1.5S 9m)
40 per. Mov. Avg. (M6L5S 9m)
40 per. Mov. Avg. (M6L10S 9m)
2a or 6
1
6a
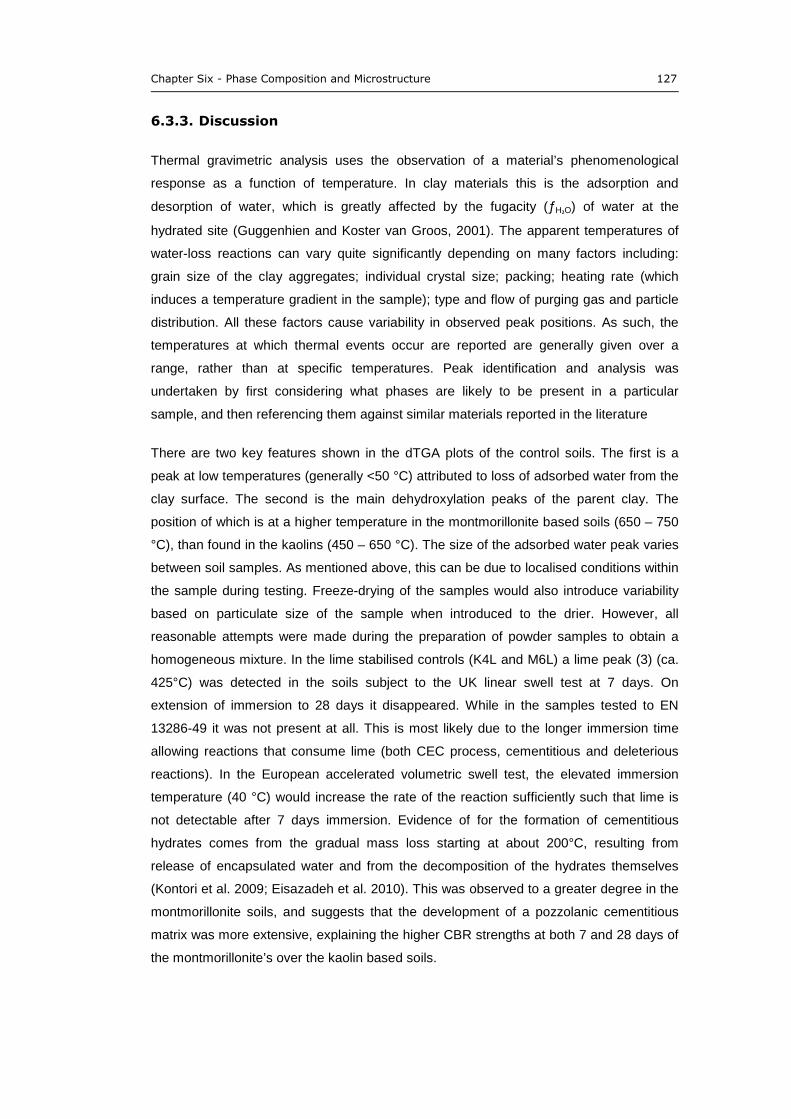
Chapter Six - Phase Composition and Microstructure 127
6.3.3. Discussion
Thermal gravimetric analysis uses the observation of a material’s phenomenological
response as a function of temperature. In clay materials this is the adsorption and
desorption of water, which is greatly affected by the fugacity (ƒH₂O) of water at the
hydrated site (Guggenhien and Koster van Groos, 2001). The apparent temperatures of
water-loss reactions can vary quite significantly depending on many factors including:
grain size of the clay aggregates; individual crystal size; packing; heating rate (which
induces a temperature gradient in the sample); type and flow of purging gas and particle
distribution. All these factors cause variability in observed peak positions. As such, the
temperatures at which thermal events occur are reported are generally given over a
range, rather than at specific temperatures. Peak identification and analysis was
undertaken by first considering what phases are likely to be present in a particular
sample, and then referencing them against similar materials reported in the literature
There are two key features shown in the dTGA plots of the control soils. The first is a
peak at low temperatures (generally <50 °C) attributed to loss of adsorbed water from the
clay surface. The second is the main dehydroxylation peaks of the parent clay. The
position of which is at a higher temperature in the montmorillonite based soils (650 – 750
°C), than found in the kaolins (450 – 650 °C). The size of the adsorbed water peak varies
between soil samples. As mentioned above, this can be due to localised conditions within
the sample during testing. Freeze-drying of the samples would also introduce variability
based on particulate size of the sample when introduced to the drier. However, all
reasonable attempts were made during the preparation of powder samples to obtain a
homogeneous mixture. In the lime stabilised controls (K4L and M6L) a lime peak (3) (ca.
425°C) was detected in the soils subject to the UK linear swell test at 7 days. On
extension of immersion to 28 days it disappeared. While in the samples tested to EN
13286-49 it was not present at all. This is most likely due to the longer immersion time
allowing reactions that consume lime (both CEC process, cementitious and deleterious
reactions). In the European accelerated volumetric swell test, the elevated immersion
temperature (40 °C) would increase the rate of the reaction sufficiently such that lime is
not detectable after 7 days immersion. Evidence of for the formation of cementitious
hydrates comes from the gradual mass loss starting at about 200°C, resulting from
release of encapsulated water and from the decomposition of the hydrates themselves
(Kontori et al. 2009; Eisazadeh et al. 2010). This was observed to a greater degree in the
montmorillonite soils, and suggests that the development of a pozzolanic cementitious
matrix was more extensive, explaining the higher CBR strengths at both 7 and 28 days of
the montmorillonite’s over the kaolin based soils.

128 Chapter Six - Phase Composition and Microstructure
Considering the sulfated soils, temperatures below 450 °C are of the most interest, as it
has been shown in the literature that the thermal events linked to AFt, AFm and
cementitious hydrates occur in this area (Akhter et al. 1997; Ramachandran et al, 1964).
All of the soils exhibited evidence of cementitious hydrate formation due to the gradual
mass loss starting around 200 °C (5) as would be expected following the addition of lime
sufficient to raise the pH to >12.4. The mass loss appears to be more significant with the
montmorillonite based soils, which again, is consistent with the formation of more
cementitious products resulting from pozzolanic reactions. This would be dependent on a
more fundamental property of the clay, namely the dissolution rate of aluminosilicates into
the pore solution. It could also be the result of the 2:1 layer clay structure allowing more
water to be encapsulated within the cementitious matrix compared to the 1:1 layer kaolin
based soils.
After the positive identification of ettringite and monosulfate from XRD analysis (section
6.2), the use of dTGA to also identify these deleterious minerals exposes the limitations of
the technique. Three possible thermal events have been identified that could give rise to
a peak at ca. 80°C:
Loss of interlayer water from 2:1 layer clay;
Dehydration of gypsum to anhydrite; and
1st
dehydration event of ettringite.
Table 33 summarises in which soils the peak at 80°C has been found.
Table 33: Presence of peak at ca. 80°C in dTGA
Test
Kaolin Soils Montmorillonite Soils
K K5S K4L
K4L+
M M5S M6L
M6L+
0.5S 1.5S 5S 0.5S 1.5S 5S
BS1924-2
(7d) y* y y y
BS1924-2
(28 day) y* y y y
EN13286-49 y* y y y
Note: y – yes, * - very small peak.
As seen from the table, the peak is only present in the high sulfate soils (including the
unstabilised control), irrespective of which immersion test they have been subjected to. If
Chapter Six - Phase Composition and Microstructure 129
it were due to dehydration of the parent clay, then it should be present in the clay
samples, particularly those of the montmorillonites. It may well be a 1st
dehydration step
of AFt, but without any sign of the other three peaks, but it seems unlikely. This leads to
the conclusion that it must be due to a dehydration step of gypsum, despite occurring at a
temperature 40°C less than analysis of the bulk mined gypsum sample. This also
corresponds with the XRD analysis (Section 6.2), which only found gypsum in the high
sulfate clays (both with and without lime stabilisation). If ettringite is present in the soil,
then it would not be possible to resolve it due to the peak overlap.
The results of XRD analysis (see Section 6.2) show that AFt is formed in even the low
sulfate soil of the 7D UK linear CBR swell test. Thermal gravimetric analysis may
therefore lack the resolution to detect AFt at the quantities formed from the soil mixtures
(and indeed gypsum) at a starting sulfate content of 0.5% and 1.5%. The analysis of the
long term specimens, in which a soil mixture contained 10% sulfate revealed a peak at
ca. 90°C in the kaolin and ca. 105°C in the montmorillonite. Again it is difficult to
differentiate this between gypsum and ettringite. XRD analysis revealed extensive
formation of AFt in all the long-term specimens, but only residual gypsum in the 10%
sulfate specimens.
The results do show however, that the final phase composition of the soils is both
affected by the testing regime and starting sulfate content. Extending the duration of
immersion in the UK linear CBR swell test (Figure 46 and Figure 47) has a greater affect
on the montmorillonite soils than the kaolins, given that, as described earlier, thermal
events attributed to formation of cementitious hydrates were found to be larger in soils
subject to 28 days immersion compared to 7 days. Pozzolanic reactions are known to be
relatively slow at ambient temperatures (Rojas and Cabrera, 2001) so this is not
surprising. The fact that these were not found in the medium and high sulfate soils
(M6L1.5S and M6L5S) is however. It leads to the possibility that the higher concentration
of sulfate reduces pozzolanic cementitious hydrate formation in some way. It’s possible
that formation of AFt/AFm is more thermodynamically favourable, so is formed
preferentially in relatively high sulfate conditions. Maybe sufficient lime is consumed on
ettringite formation, that conditions are no longer sufficiently alkaline for pozzolanic
development of a cementitious matrix. pH measurements of soils after testing show
however that all the soils still had a pH >12.4 at the end of the immersion period (see
chapter five). In comparison, the kaolins appeared to be relatively unreactive at both 7
and 28 days with peaks from CSH (8) not present, again supporting the finding that they
had lower mechanical strengths (CBR value).
Most interesting is the behaviour of the low sulfate soil. Characteristic peaks of a solid
solution between AFm and C4AH13 were found in K4L0.5S subject to the European test,
130 Chapter Six - Phase Composition and Microstructure
but not in the UK linear CBR swell test at 28 days. The increased immersion temperature
(40°C compared to 20°C) must have a significant effect on the composition of the pore
solution and solubility of reaction products. The low sulfate montmorillonite exhibited
peaks characteristic of Friedel’s Salt. It is reasonable that this would form in this soil,
since XRF analysis (see Appendix C) of the montmorillonite soils showed chloride
contents of 0.08%, compared to <0.01% for the kaolin. Birnin-Yauri and Glasser (1998)
showed Friedel’s Salt to be thermodynamically more stable than monosulfate.
6.4. SEM-EDX
6.4.1. Introduction
A combination of Scanning Electron Microscopy (SEM) and Energy Dispersive X-ray
Spectroscopy (EDX) was used to investigate the composition of the soils after testing.
Particular attention was paid to what remained of the soil microstructure and the
morphology of the AFt and AFm found. EDX point analysis was used to differentiate
similar looking structures and provide elemental composition to aid in the identification of
the phases present. Details of the equipment used, sample preparation and experimental
conditions are provided in Chapter Four.
The section has been arranged by presenting the controls soils (both unstabilised and
stabilised) first, then the high (5%), medium (1.5%) and low (0.5%) sulfate test soils
subject to the UK linear swell test at 7 days , 28 days and then the European accelerated
volumetric swell test .
Regarding the analysis itself, in an attempt at brevity, analysis of every soil mixture
subject to both swell tests has not been reported. The purpose of the SEM-EDX analysis
was to determine the representative microstructure and composition of the test soils, as
well as looking for standout features that would aid in furthering the understanding of the
deleterious processes in question.
The field of view is extremely small compared to the size of the sample holder. In the
analysis of each sample, many areas were scanned so that the representative structure
could be determined. For example, if in the low sulfate mixtures an image was taken of
extensive AFt formation (maybe due to gypsum being initially present in that particular
part of the specimen when under test), it would be misleading to report that image, if the
remainder of the SEM analysis revealed the sample to be relatively AFt free. Therefore
the images reported in the following section are those representing the typical
microstructure and composition of that soil mixture.
Chapter Six - Phase Composition and Microstructure 131
6.4.2. Control Soils
Analysis of the control soils revealed platy and lamellar structures of clays. No difference
in microstructure was found irrespective of the test the soil mixtures were subjected to,
which is expected, since without the addition of a hydraulic binder, neither modification or
stabilisation of the soils can occur. Figure 50 shows the SEM-EDX of the sulfated kaolin
control soil (K5S) after testing to EN13286-49. The typical plate-like particle morphology
of kaolin clay (Yan et al, 2010) can be seen in the top micrograph. EDX point analysis
reveals the expected strong emission peaks of Si, Al, and O – consistent with the
tetrahedral/octahedral aluminosilicate sheets of clay minerals (see Chapter Two), in
addition to minor peaks of K and the Pt coating. The lower micrograph illustrates the use
of EDX analysis in phase identification. This particle was identified as gypsum from the
characteristic strong emission spectrum of the elements Ca, S and O.
Figure 50: Sulfated kaolin control soil mixture (K3S, EN13286-49)
In Figure 51, the typical morphology of the lime stabilised kaolin control can be seen. It is
difficult to make out the structure of any cementitious product formed. Evidence of cation
exchange processes are found from the EDX point analysis showing a strong emission
from calcium in addition to Si, Al and O expected from the aluminsilicate clay minerals.
132 Chapter Six - Phase Composition and Microstructure
Figure 51: K4L (BS1924-2, 28 day immersion) showing formation of cementitious
hydrates
Figure 52 again shows the same soil, but this time cementitious hydrates are clearer. The
EDX point analysis shows an area rich in Ca, Si and O, which is possibly evidence of
CSH formation. Long acicular crystals were also found. It is unlikely that these are AFt
since no sulphur was detected in the EDX pattern, nor did the specimens swell on testing.
It is possible that these are in fact fibrous CASH as reported by Bérubé et al. (1990).
Figure 52: K4L (BS1924-2, 28 days immersion) showing evidence of cementitious
hydrate formation
Figure 53 shows micrographs taken from the control soils (K4L and M6L) after testing to
EN13286-49. In the kaolin soil (top images) the typical morphology of clay particles (1)
can be seen as well as the formation of cementitious product (Kim and Kim, 2011) on the
surface of the clay particle (2). In the bottom set of images, smectitie lamellae, typical of
montmorillonite clay can be seen as found by Yilmaz and Civelekoglu (2009), in addition
to cementitious material of similar morphology to that found in the kaolin (4). The typical
Chapter Six - Phase Composition and Microstructure 133
acicular crystal appearance of ettringite or the lamellar crystal structure of monosulfate
were not found in any of the control specimens.
Figure 53: Control soils after European accelerated volumetric test, EN13286-49 (K) top,
(M) bottom.
6.4.3. High sulfate
Figure 54 shows M6L5S after 7 days immersion (BS1924-2). Acicular crystals of two
different morphologies are shown. In the left micrograph, they are shorter and thicker (ca.
1μm × 0.4μm), whereas in the right micrograph, they are longer, but thinner in width (ca.
2μm × 0.2μm). As will be seen in subsequent analysis of the lime stabilised sulfate soils,
these crystals were identified as ettringite.
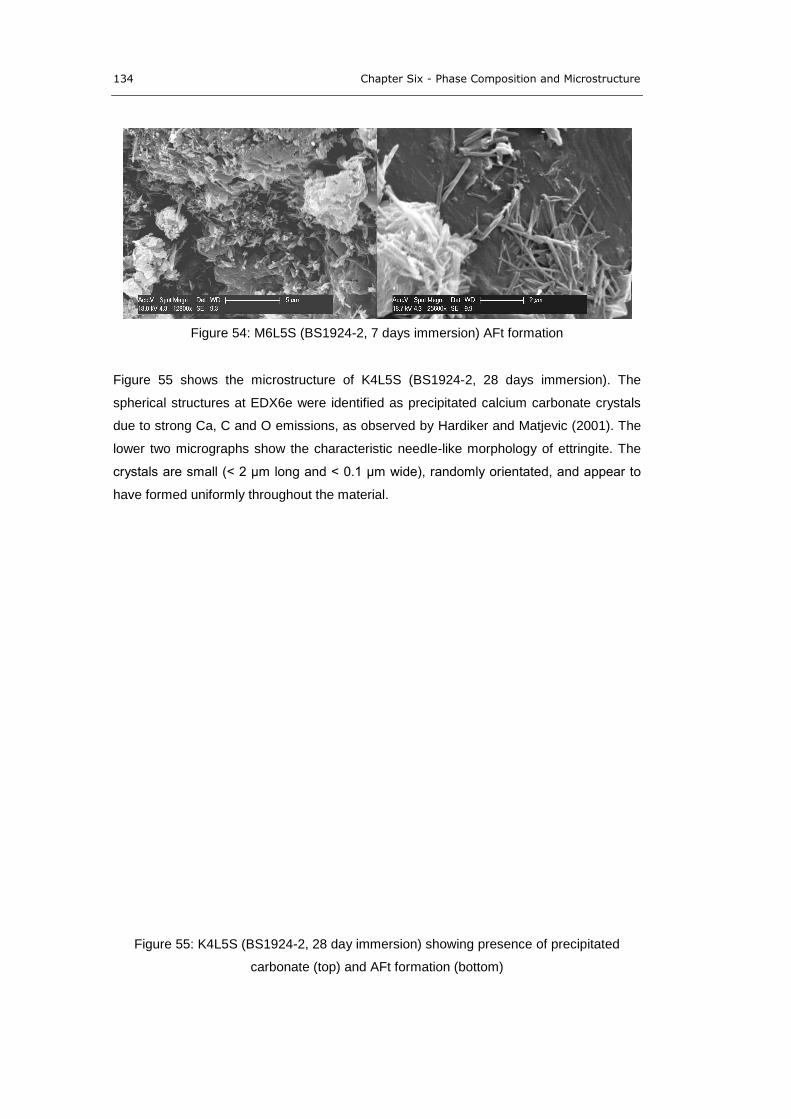
134 Chapter Six - Phase Composition and Microstructure
Figure 54: M6L5S (BS1924-2, 7 days immersion) AFt formation
Figure 55 shows the microstructure of K4L5S (BS1924-2, 28 days immersion). The
spherical structures at EDX6e were identified as precipitated calcium carbonate crystals
due to strong Ca, C and O emissions, as observed by Hardiker and Matjevic (2001). The
lower two micrographs show the characteristic needle-like morphology of ettringite. The
crystals are small (< 2 μm long and < 0.1 μm wide), randomly orientated, and appear to
have formed uniformly throughout the material.
Figure 55: K4L5S (BS1924-2, 28 day immersion) showing presence of precipitated
carbonate (top) and AFt formation (bottom)
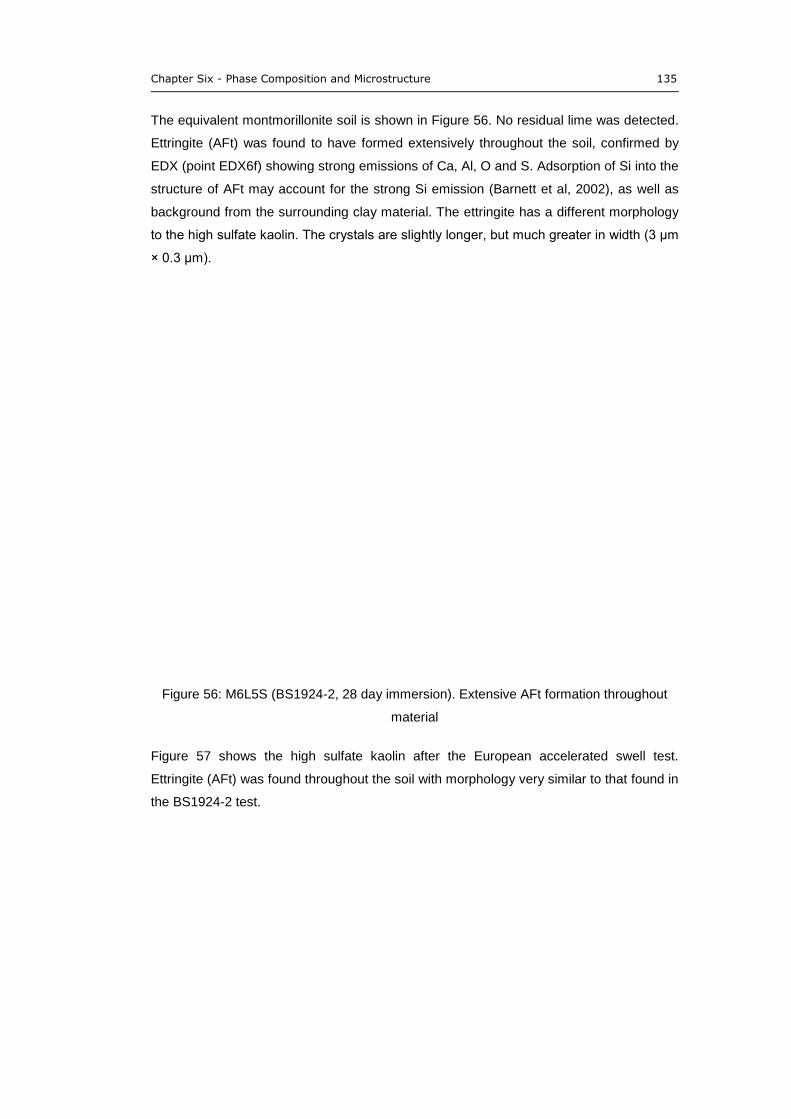
Chapter Six - Phase Composition and Microstructure 135
The equivalent montmorillonite soil is shown in Figure 56. No residual lime was detected.
Ettringite (AFt) was found to have formed extensively throughout the soil, confirmed by
EDX (point EDX6f) showing strong emissions of Ca, Al, O and S. Adsorption of Si into the
structure of AFt may account for the strong Si emission (Barnett et al, 2002), as well as
background from the surrounding clay material. The ettringite has a different morphology
to the high sulfate kaolin. The crystals are slightly longer, but much greater in width (3 μm
× 0.3 μm).
Figure 56: M6L5S (BS1924-2, 28 day immersion). Extensive AFt formation throughout
material
Figure 57 shows the high sulfate kaolin after the European accelerated swell test.
Ettringite (AFt) was found throughout the soil with morphology very similar to that found in
the BS1924-2 test.
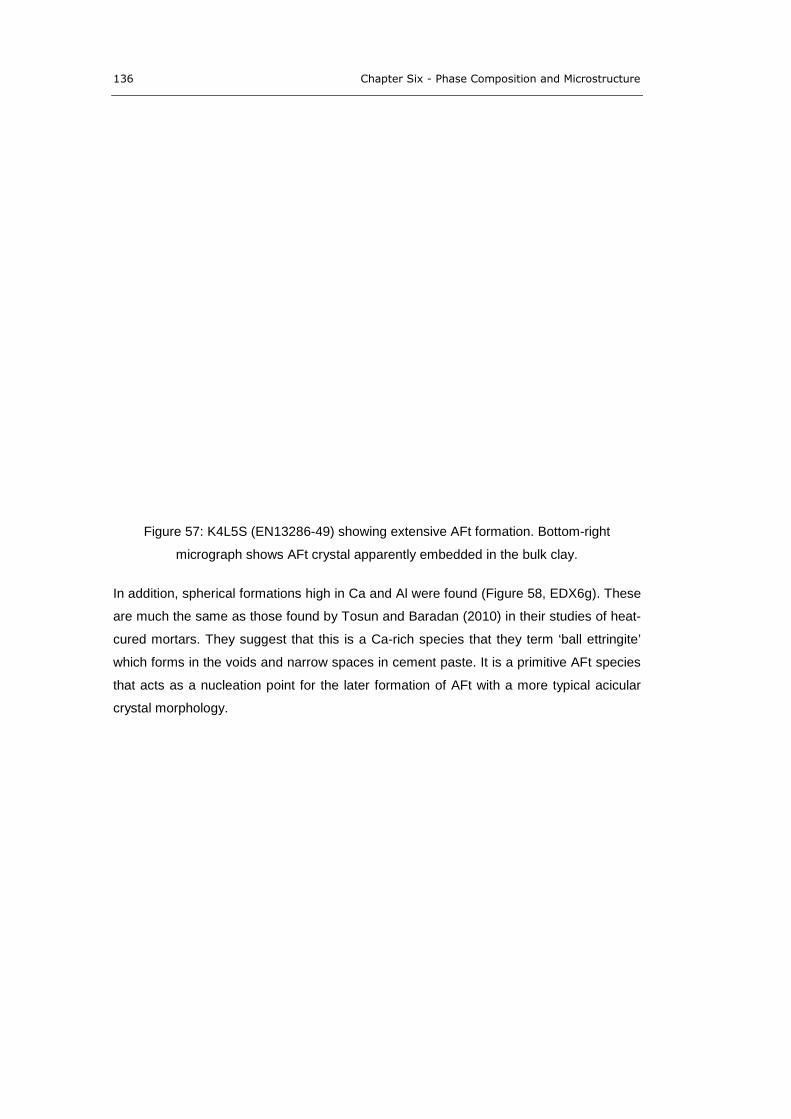
136 Chapter Six - Phase Composition and Microstructure
Figure 57: K4L5S (EN13286-49) showing extensive AFt formation. Bottom-right
micrograph shows AFt crystal apparently embedded in the bulk clay.
In addition, spherical formations high in Ca and Al were found (Figure 58, EDX6g). These
are much the same as those found by Tosun and Baradan (2010) in their studies of heat-
cured mortars. They suggest that this is a Ca-rich species that they term ‘ball ettringite’
which forms in the voids and narrow spaces in cement paste. It is a primitive AFt species
that acts as a nucleation point for the later formation of AFt with a more typical acicular
crystal morphology.
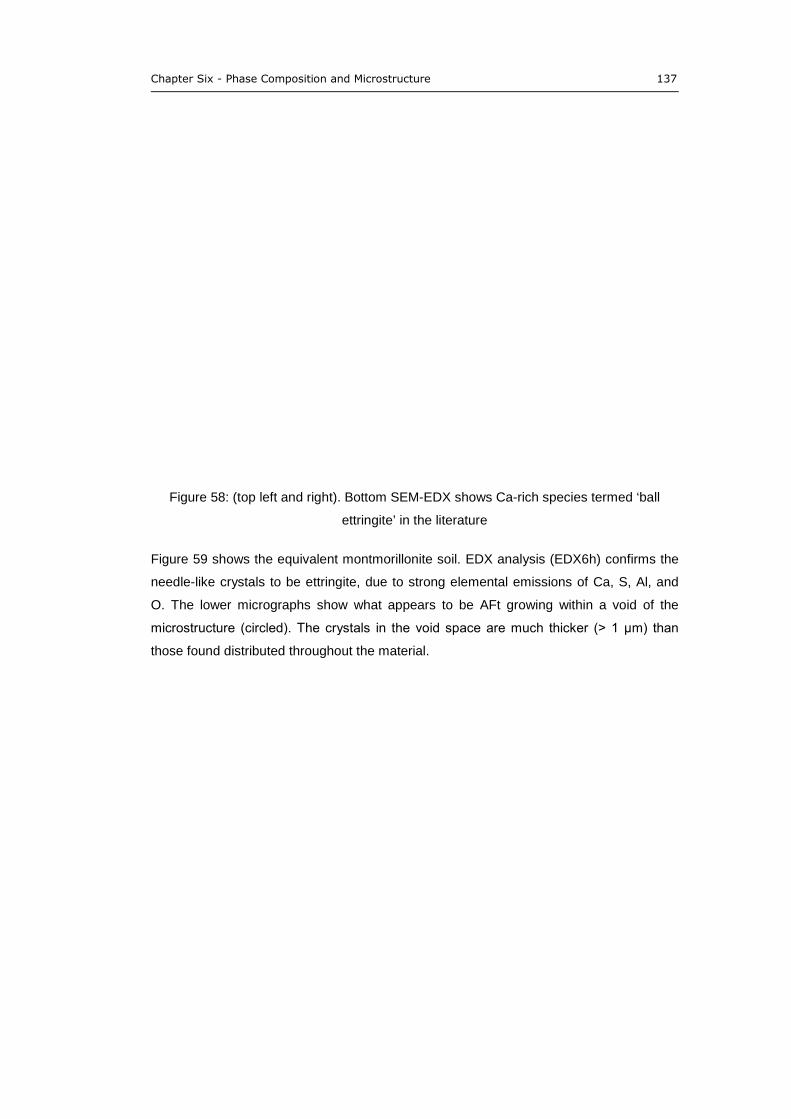
Chapter Six - Phase Composition and Microstructure 137
Figure 58: (top left and right). Bottom SEM-EDX shows Ca-rich species termed ‘ball
ettringite’ in the literature
Figure 59 shows the equivalent montmorillonite soil. EDX analysis (EDX6h) confirms the
needle-like crystals to be ettringite, due to strong elemental emissions of Ca, S, Al, and
O. The lower micrographs show what appears to be AFt growing within a void of the
microstructure (circled). The crystals in the void space are much thicker (> 1 μm) than
those found distributed throughout the material.
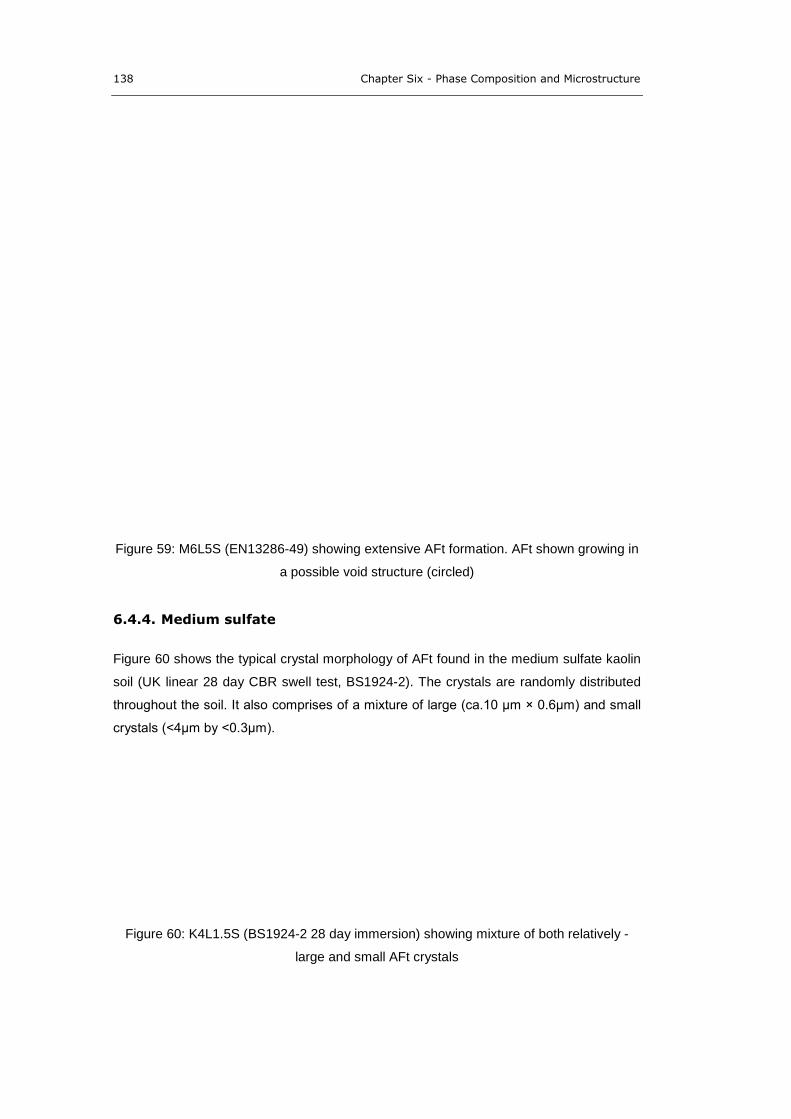
138 Chapter Six - Phase Composition and Microstructure
Figure 59: M6L5S (EN13286-49) showing extensive AFt formation. AFt shown growing in
a possible void structure (circled)
6.4.4. Medium sulfate
Figure 60 shows the typical crystal morphology of AFt found in the medium sulfate kaolin
soil (UK linear 28 day CBR swell test, BS1924-2). The crystals are randomly distributed
throughout the soil. It also comprises of a mixture of large (ca.10 μm × 0.6μm) and small
crystals (<4μm by <0.3μm).
Figure 60: K4L1.5S (BS1924-2 28 day immersion) showing mixture of both relatively -
large and small AFt crystals
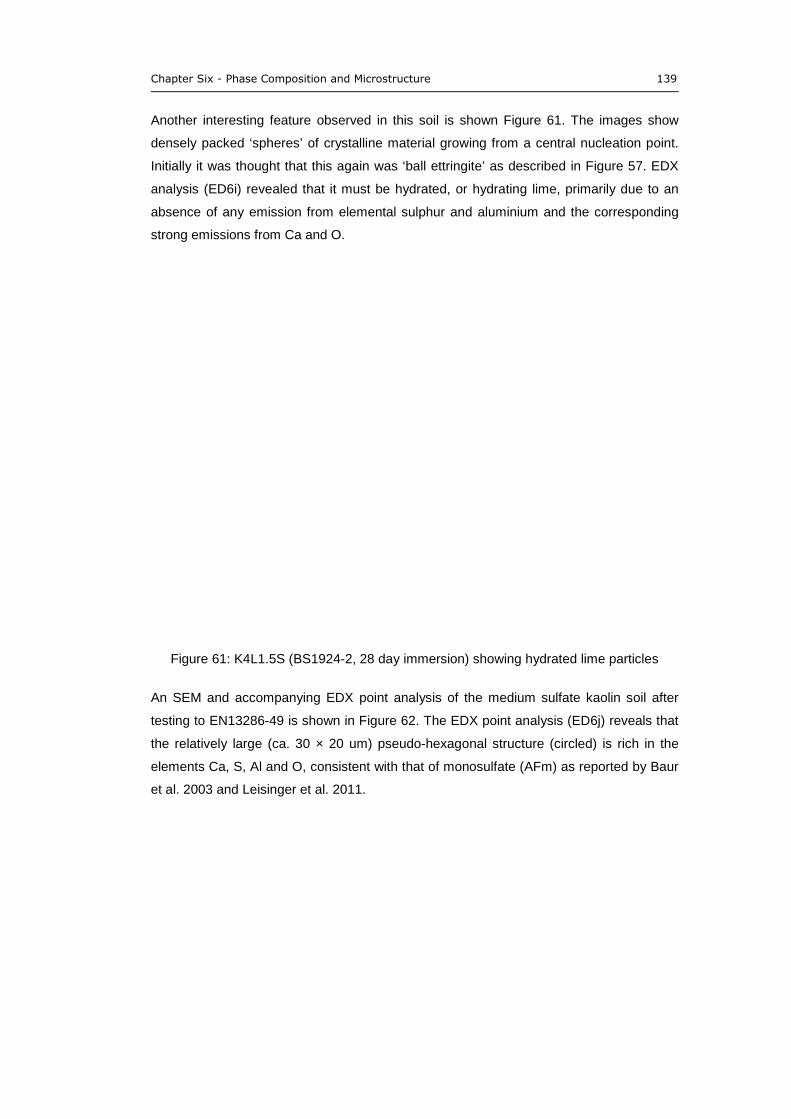
Chapter Six - Phase Composition and Microstructure 139
Another interesting feature observed in this soil is shown Figure 61. The images show
densely packed ‘spheres’ of crystalline material growing from a central nucleation point.
Initially it was thought that this again was ‘ball ettringite’ as described in Figure 57. EDX
analysis (ED6i) revealed that it must be hydrated, or hydrating lime, primarily due to an
absence of any emission from elemental sulphur and aluminium and the corresponding
strong emissions from Ca and O.
Figure 61: K4L1.5S (BS1924-2, 28 day immersion) showing hydrated lime particles
An SEM and accompanying EDX point analysis of the medium sulfate kaolin soil after
testing to EN13286-49 is shown in Figure 62. The EDX point analysis (ED6j) reveals that
the relatively large (ca. 30 × 20 um) pseudo-hexagonal structure (circled) is rich in the
elements Ca, S, Al and O, consistent with that of monosulfate (AFm) as reported by Baur
et al. 2003 and Leisinger et al. 2011.
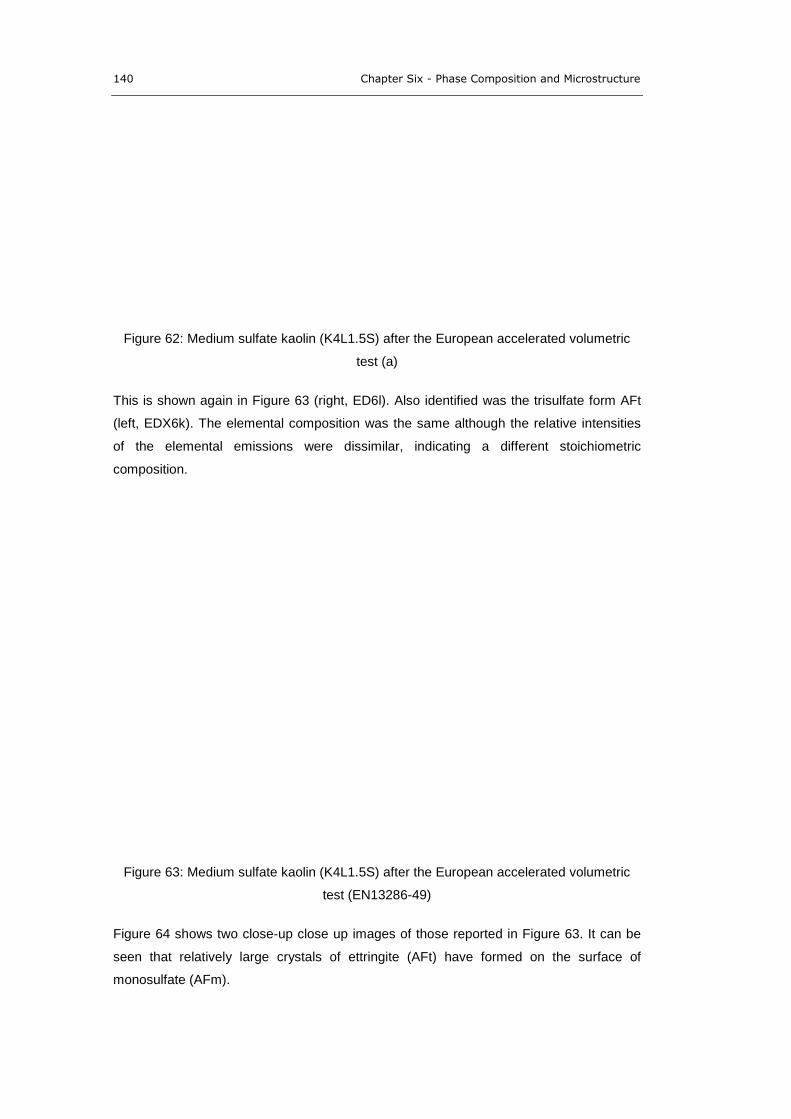
140 Chapter Six - Phase Composition and Microstructure
Figure 62: Medium sulfate kaolin (K4L1.5S) after the European accelerated volumetric
test (a)
This is shown again in Figure 63 (right, ED6l). Also identified was the trisulfate form AFt
(left, EDX6k). The elemental composition was the same although the relative intensities
of the elemental emissions were dissimilar, indicating a different stoichiometric
composition.
Figure 63: Medium sulfate kaolin (K4L1.5S) after the European accelerated volumetric
test (EN13286-49)
Figure 64 shows two close-up close up images of those reported in Figure 63. It can be
seen that relatively large crystals of ettringite (AFt) have formed on the surface of
monosulfate (AFm).
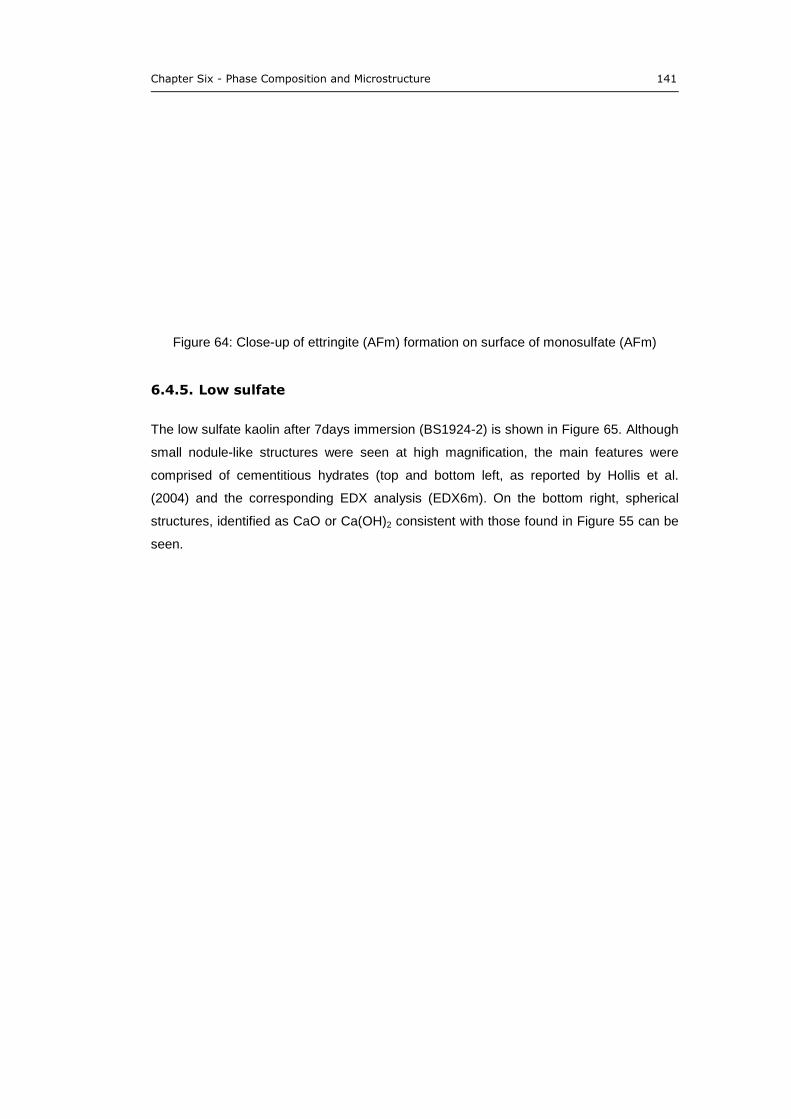
Chapter Six - Phase Composition and Microstructure 141
Figure 64: Close-up of ettringite (AFm) formation on surface of monosulfate (AFm)
6.4.5. Low sulfate
The low sulfate kaolin after 7days immersion (BS1924-2) is shown in Figure 65. Although
small nodule-like structures were seen at high magnification, the main features were
comprised of cementitious hydrates (top and bottom left, as reported by Hollis et al.
(2004) and the corresponding EDX analysis (EDX6m). On the bottom right, spherical
structures, identified as CaO or Ca(OH)2 consistent with those found in Figure 55 can be
seen.
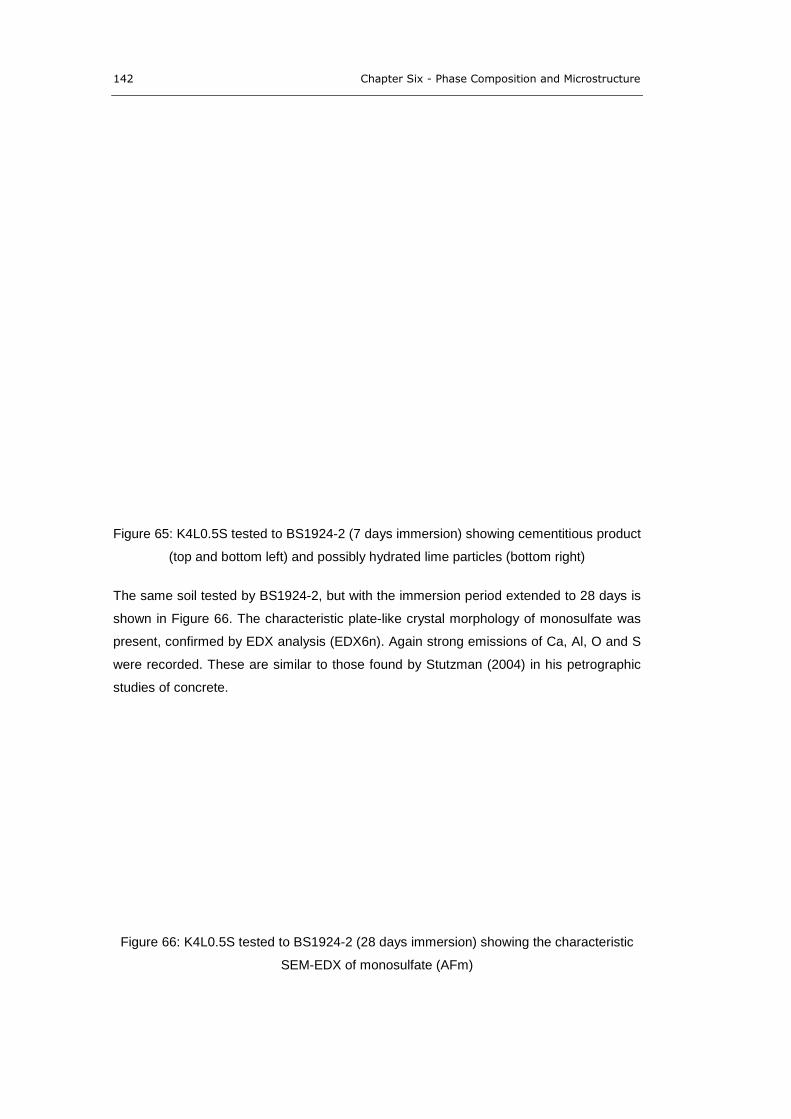
142 Chapter Six - Phase Composition and Microstructure
Figure 65: K4L0.5S tested to BS1924-2 (7 days immersion) showing cementitious product
(top and bottom left) and possibly hydrated lime particles (bottom right)
The same soil tested by BS1924-2, but with the immersion period extended to 28 days is
shown in Figure 66. The characteristic plate-like crystal morphology of monosulfate was
present, confirmed by EDX analysis (EDX6n). Again strong emissions of Ca, Al, O and S
were recorded. These are similar to those found by Stutzman (2004) in his petrographic
studies of concrete.
Figure 66: K4L0.5S tested to BS1924-2 (28 days immersion) showing the characteristic
SEM-EDX of monosulfate (AFm)
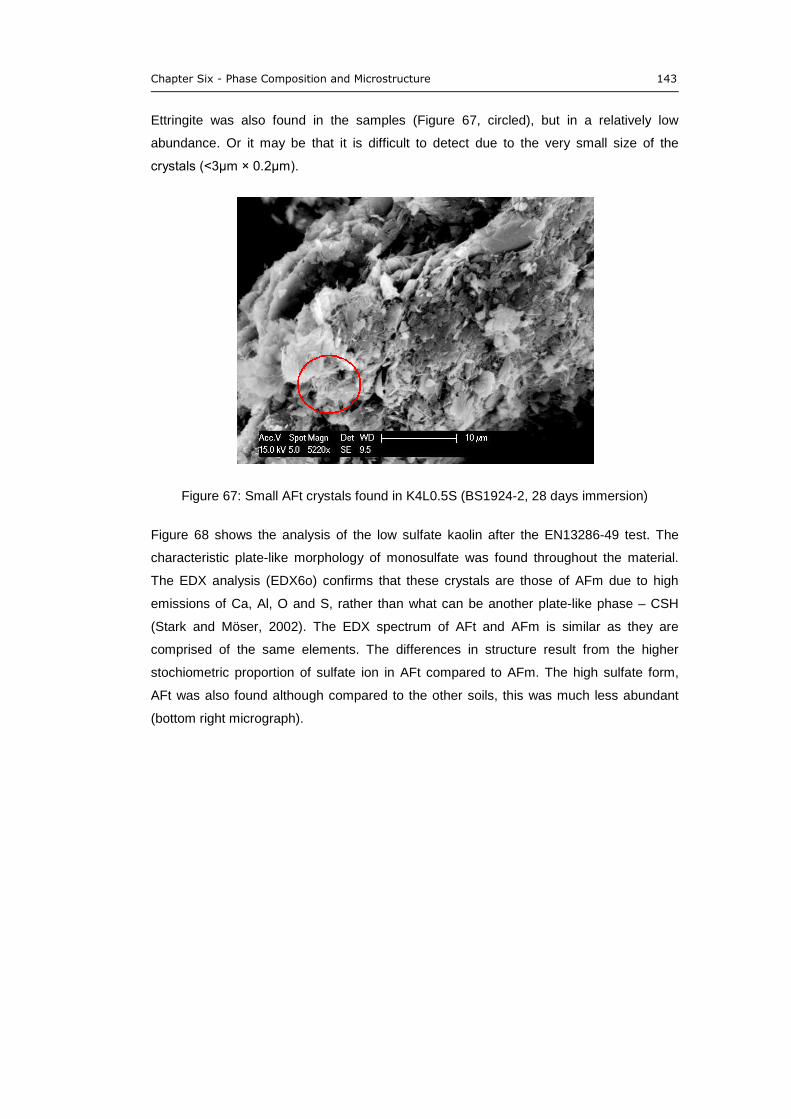
Chapter Six - Phase Composition and Microstructure 143
Ettringite was also found in the samples (Figure 67, circled), but in a relatively low
abundance. Or it may be that it is difficult to detect due to the very small size of the
crystals (<3μm × 0.2μm).
Figure 67: Small AFt crystals found in K4L0.5S (BS1924-2, 28 days immersion)
Figure 68 shows the analysis of the low sulfate kaolin after the EN13286-49 test. The
characteristic plate-like morphology of monosulfate was found throughout the material.
The EDX analysis (EDX6o) confirms that these crystals are those of AFm due to high
emissions of Ca, Al, O and S, rather than what can be another plate-like phase – CSH
(Stark and Möser, 2002). The EDX spectrum of AFt and AFm is similar as they are
comprised of the same elements. The differences in structure result from the higher
stochiometric proportion of sulfate ion in AFt compared to AFm. The high sulfate form,
AFt was also found although compared to the other soils, this was much less abundant
(bottom right micrograph).
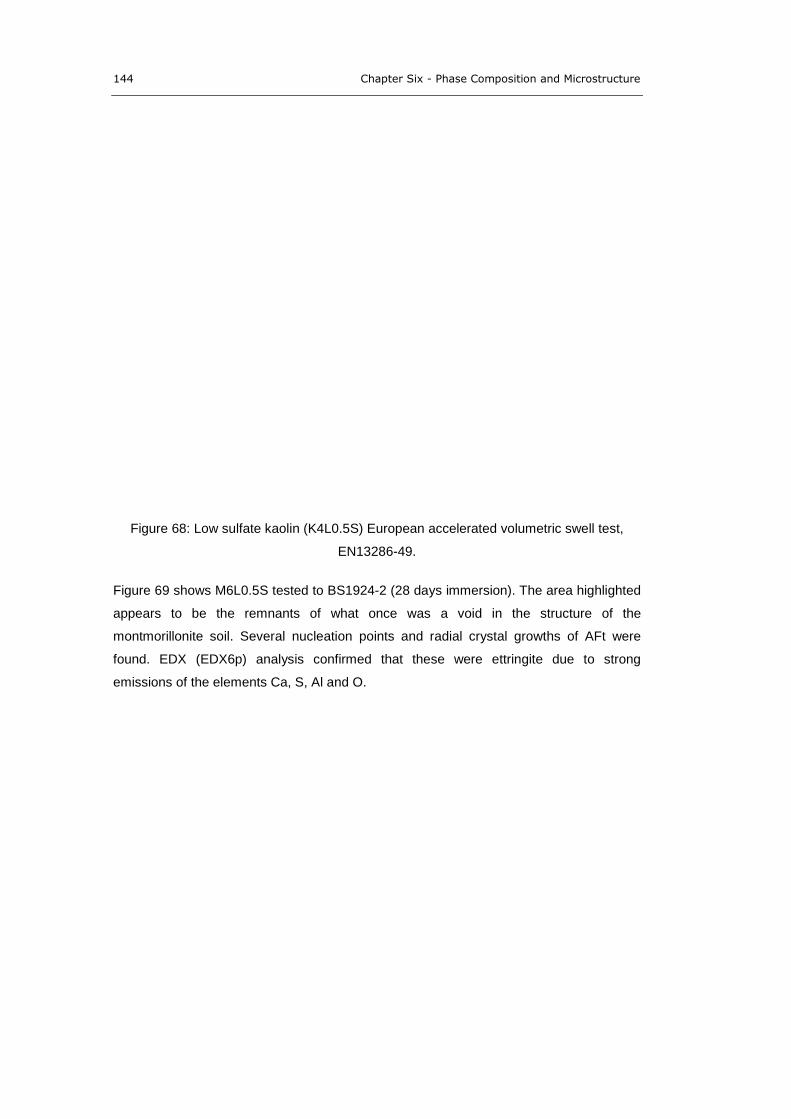
144 Chapter Six - Phase Composition and Microstructure
Figure 68: Low sulfate kaolin (K4L0.5S) European accelerated volumetric swell test,
EN13286-49.
Figure 69 shows M6L0.5S tested to BS1924-2 (28 days immersion). The area highlighted
appears to be the remnants of what once was a void in the structure of the
montmorillonite soil. Several nucleation points and radial crystal growths of AFt were
found. EDX (EDX6p) analysis confirmed that these were ettringite due to strong
emissions of the elements Ca, S, Al and O.
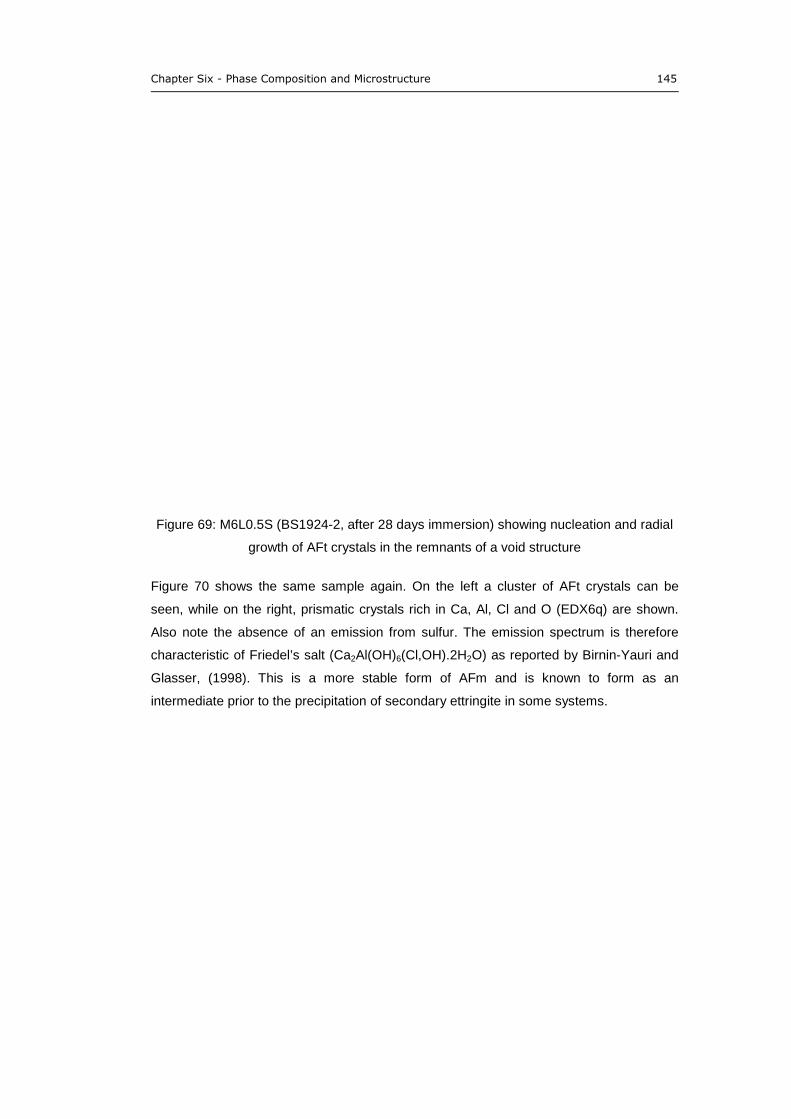
Chapter Six - Phase Composition and Microstructure 145
Figure 69: M6L0.5S (BS1924-2, after 28 days immersion) showing nucleation and radial
growth of AFt crystals in the remnants of a void structure
Figure 70 shows the same sample again. On the left a cluster of AFt crystals can be
seen, while on the right, prismatic crystals rich in Ca, Al, Cl and O (EDX6q) are shown.
Also note the absence of an emission from sulfur. The emission spectrum is therefore
characteristic of Friedel’s salt (Ca2Al(OH)6(Cl,OH).2H2O) as reported by Birnin-Yauri and
Glasser, (1998). This is a more stable form of AFm and is known to form as an
intermediate prior to the precipitation of secondary ettringite in some systems.
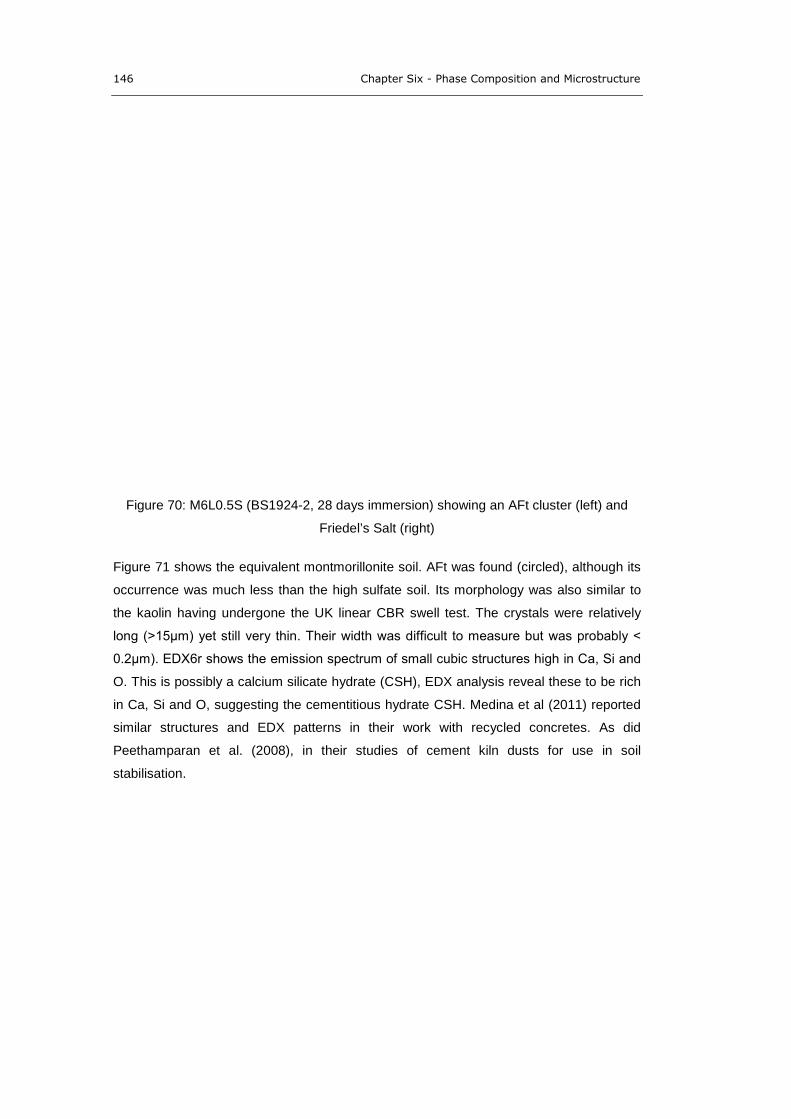
146 Chapter Six - Phase Composition and Microstructure
Figure 70: M6L0.5S (BS1924-2, 28 days immersion) showing an AFt cluster (left) and
Friedel’s Salt (right)
Figure 71 shows the equivalent montmorillonite soil. AFt was found (circled), although its
occurrence was much less than the high sulfate soil. Its morphology was also similar to
the kaolin having undergone the UK linear CBR swell test. The crystals were relatively
long (>15μm) yet still very thin. Their width was difficult to measure but was probably <
0.2μm). EDX6r shows the emission spectrum of small cubic structures high in Ca, Si and
O. This is possibly a calcium silicate hydrate (CSH), EDX analysis reveal these to be rich
in Ca, Si and O, suggesting the cementitious hydrate CSH. Medina et al (2011) reported
similar structures and EDX patterns in their work with recycled concretes. As did
Peethamparan et al. (2008), in their studies of cement kiln dusts for use in soil
stabilisation.
Chapter Six - Phase Composition and Microstructure 147
Figure 71: M6L0.5S (EN13286-49) showing extensive AFt formation (top) and CSH
formation (bottom)
Figure 72 shows the CSH formations under higher magnification. They appear to have a
cubic crystal morphology and are stacked in lamellar clusters. The surrounding material is
foil-like and may be another CSH morphology as found by Richardson (1999).
Figure 72: M6L0.5S (EN13286-49) showing close up of cubic structures as shown in
Figure 71 (EDX6r).
148 Chapter Six - Phase Composition and Microstructure
6.4.6. Long term tests
The SEM-EDX of the soils subject to long term testing (9 months) are presented in the
following section. Only the soil mixtures containing1.5% and 5% sulfate reported here, as
these can be used to evaluate the important microstructural and compositional changes
that have occurred over the extended immersion period compared to those reported in
the 28 day immersion tests.
Figure 73 shows that the predominant sulfate bearing phase in K4L1.5S after 9 months
immersion was the AFm phase, with EDX6s shows that characteristic elemental emission
pattern of monosulfate. Note the Al peak is larger than the S peak. The crystals are very
large, some in excess of 70μm in width. The well resolved micrograph on the right shows
a close-up of the expected lamellar structure of monosulfate. The crystals had a thickness
estimated at ca. 4μm.
Figure 73: Monosulfate (AFm) formation in M6L1.5S (9 months immersion)
In Figure 74 the micrographs of K4L5S show extensive formation of AFt, the predominant
phase in this soil mixture. The AFt shown in the right micrograph is embedded within what
appears to be a cementitious hydrate. During the extended immersion period the
development of a cementitious matrix would also be on-going in addition to the
precipitation of ettringite. The AFt crystals in comparison to those formed during the 28
days immersion test are much larger, both in length and diameter (ca.4μm × 0.2μm).
Chapter Six - Phase Composition and Microstructure 149
Figure 74: Extensive AFt formation in K4L5S (9 months immersion)
Figure 75 shows the montmorillonite soil M6L1.5S. In the left-hand micrograph and
accompanying EDX spectra (EDX6t) a typical foil-like morphology of CSH is shown
forming on the surface of the bulk clay. On the right, a representative area of AFt
formation is shown. Consistent with analysis of the montmorillonite soils subject to the
other immersion tests (both BS1924-2 and EN13286-49), the crystal morphology is much
thicker. In fact, in comparison to the 28 day immersion tests, those shown here are
approximately 0.4μm thick, but of approximately the same length (5μm)
Figure 75: Foil-like CSH and AFt formation in M6L1.5S (9 months immersion)
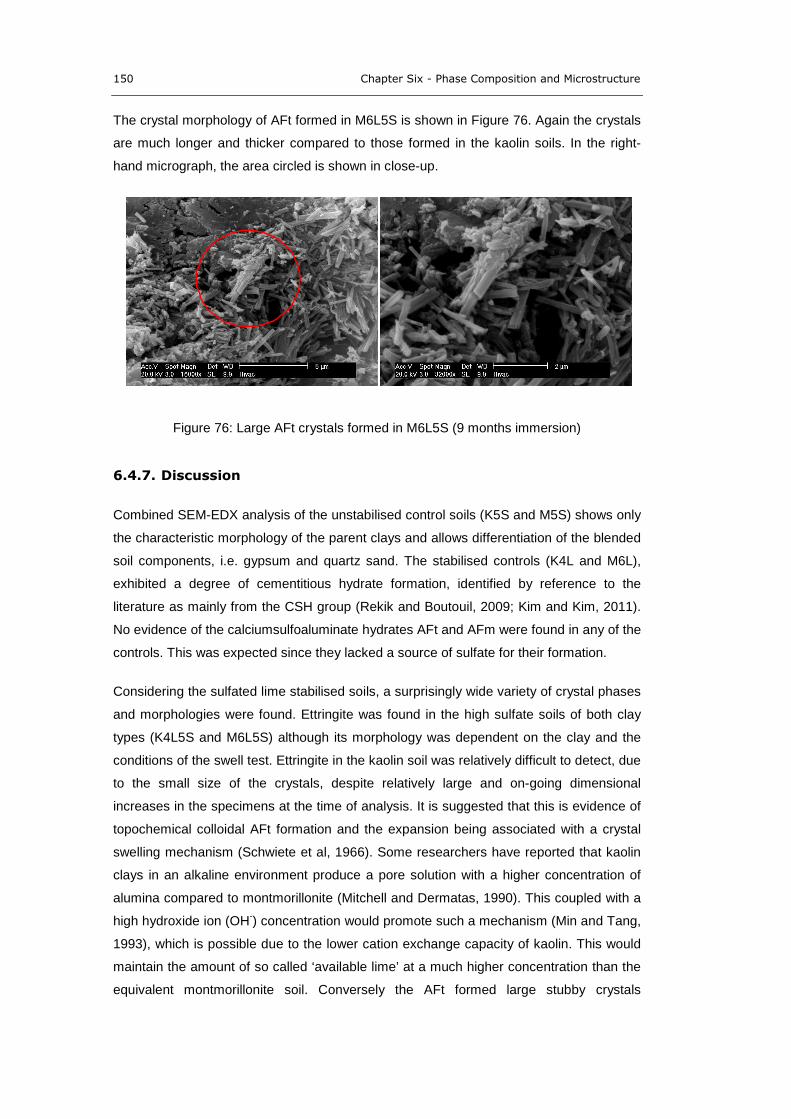
150 Chapter Six - Phase Composition and Microstructure
The crystal morphology of AFt formed in M6L5S is shown in Figure 76. Again the crystals
are much longer and thicker compared to those formed in the kaolin soils. In the right-
hand micrograph, the area circled is shown in close-up.
Figure 76: Large AFt crystals formed in M6L5S (9 months immersion)
6.4.7. Discussion
Combined SEM-EDX analysis of the unstabilised control soils (K5S and M5S) shows only
the characteristic morphology of the parent clays and allows differentiation of the blended
soil components, i.e. gypsum and quartz sand. The stabilised controls (K4L and M6L),
exhibited a degree of cementitious hydrate formation, identified by reference to the
literature as mainly from the CSH group (Rekik and Boutouil, 2009; Kim and Kim, 2011).
No evidence of the calciumsulfoaluminate hydrates AFt and AFm were found in any of the
controls. This was expected since they lacked a source of sulfate for their formation.
Considering the sulfated lime stabilised soils, a surprisingly wide variety of crystal phases
and morphologies were found. Ettringite was found in the high sulfate soils of both clay
types (K4L5S and M6L5S) although its morphology was dependent on the clay and the
conditions of the swell test. Ettringite in the kaolin soil was relatively difficult to detect, due
to the small size of the crystals, despite relatively large and on-going dimensional
increases in the specimens at the time of analysis. It is suggested that this is evidence of
topochemical colloidal AFt formation and the expansion being associated with a crystal
swelling mechanism (Schwiete et al, 1966). Some researchers have reported that kaolin
clays in an alkaline environment produce a pore solution with a higher concentration of
alumina compared to montmorillonite (Mitchell and Dermatas, 1990). This coupled with a
high hydroxide ion (OH-) concentration would promote such a mechanism (Min and Tang,
1993), which is possible due to the lower cation exchange capacity of kaolin. This would
maintain the amount of so called ‘available lime’ at a much higher concentration than the
equivalent montmorillonite soil. Conversely the AFt formed large stubby crystals
Chapter Six - Phase Composition and Microstructure 151
throughout the montmorillonite soils suggestive of a through solution mechanism (Ogawa
and Roy, 1982).
The low sulfate soil of the kaolin formed monosulfate (AFm) and smaller amounts of AFt.
It is suggested that the lower concentration of gypsum, coupled with the high alumina
concentration in the pore solution, resulted in conditions that were more
thermodynamically favourable to the formation of monosulfate, which is known to form in
what is termed a low sulfate environment (Mitchell and Dermatas, 1990). This was
surprising as monosulfate is thought only to be metastable at room temperature and very
susceptible to drying (Mitchell and Dermatas, 1990; Damidot and Glasser, 1992). The
montmorillonite soil at both high and low sulfate concentrations (M6L5S and M6L0.5S,
Figure 59 and Figure 69 respectively) showed evidence of AFt formation in the void
structure of the soil, further supporting a through-solution mechanism of formation. It
would be reasonable to suggest that evidence of a similar mechanism would also be
found in the medium sulfate soil on further investigation.
Considering the effect of extended immersion periods (BS1924-2, 7 days vs 28 days) on
the sulfate soils, the SEM-EDX results show evidence that AFt formation is very much
ongoing at 7 days immersion. Comparing the M6L5S at 7 and 28 days (Figure 54 and
Figure 56) it can be seen that ettringite formation is much more extensive at 28 days. At
the earlier age (7 days), in the micrograph reported the AFt crystals are shorter and look
like they are still forming from their nucleation sites. AFt formation is generally considered
to be rapid in cement systems due to formation from the highly reactive C3A phase
(Black, 2006) and has been detected by XRD within hours of hydration (Taylor, 1990). In
soils, it is slower, due to the relatively slow rate of dissolution of the alumina from the
parent clay. This may explain why the AFt found in the soils at 7 days immersion looks
relatively ‘young’ from a crystal formation point of view.
The difference of the kaolin soils at 7 and 28 days immersion is more difficult to
differentiate because of the very small size of the ettringite crystals formed.
The analysis of the soils subject to the long term immersion tests support the findings of
both the XRD and dTGA analysis. The K4L1.5S favours the formation of the AFm phase,
while in all the other soils, the AFt phase is predominant. Consistent with the analysis of
the soils subject to BS19242 at 7 and 28 days as well as EN13286-49, the crystal
morphology of the kaolin was smaller than that formed in the montmorillonite. But in both
cases the extended immersion period caused the crystals to be larger in both soils in
comparison to the 28 day immersion tests. This is suggestive of a slower rate of AFt
formation over the long-term, possibly by a through-solution mechanism (Lee et al. 2005)
and even an ettringite dissolution and re-precipitation process (Baur et al. 2004).
152 Chapter Six - Phase Composition and Microstructure
In the European accelerated swell test the high sulfate kaolin soil exhibited significant on-
going volumetric swell at the time of analysis (Chapter Five). SEM-EDX analysis again
showed evidence of colloidal AFt formation, but also Ca-rich structures (Figure 13) that
act as seed points for later formation of the more typical needle-like AFt crystals (Tosun
and Baradan, 2010). This ‘early-age’ ettringite is consistent with the recorded on-going
increase in volumetric swell. In the equivalent montmorillonite soil, the long and thin
crystals of AFt associated with a topochemical formation mechanism, as well as short,
thicker crystals in void structures (through-solution) were found. It is possible that the
higher immersion temperature increased the solubility of candidate ions and localised
variations in conditions allowed the co-formation of ettringite by both mechanisms. The
low sulfate kaolin soil (K4L0.5S) formed comparatively more AFm than the same soil
tested under BS1924-2. After some initial expansion on immersion, it remained
dimensionally stable. This supports the accepted theory that monosulfate does not
contribute to expansion (Mitchell and Dermatas, 1990). The low sulfate kaolin (M6L0.5S)
yielded both AFt and AFm (Figure 70). The morphology of the ettringite was similar to that
formed in the UK linear CBR swell test of the same soil (Figure 12). The monosulfate was
found as Friedel’s Salt. This is the product of monosulfate that has undergone anion
exchange (Glasser et al, 1999), where SO42ˉ
has been substituted for Clˉ and it is more
stable than monosulfate (Birnin-Yauri and Glasser, (1998). Its formation in the low sulfate
montmorillonite clays and not the kaolin’s may be explained by the montmorillonite clay
having adsorbed chloride ions in its structure, which may not have occurred with the
kaolin. XRF analysis of the parent clays (Chapter Five) showed that the montmorillonite
soils contained 0.08% chloride ions whereas the kaolin soils only had trace amounts
(<0.01%).
6.5. SUMMARY
The phase composition and microstructure has been investigated for the range of soils
subject to the two immersion tests (BS1924-2 and EN 13286-49).
Analysis by XRD and SEM-EDX clearly shows the formation of ettringite and monosulfate
(including a number of anion substitutions) in lime stabilised soils containing sulfate. The
formation of monosulfate is favoured in low to medium sulfate environments in the kaolin
based soils and is further promoted by an increase in either the duration of immersion or
the temperature of the immersion water. In the montmorillonite based soils, only the
trisulfate phase (AFt) was found by XRD, but SEM-EDX analysis identified the chloride-
substituted AFm phase, again in the low sulfate soil subject to elevated temperature in
the immersion water (EN 13286-49).
Chapter Six - Phase Composition and Microstructure 153
AFt was found in all the soils irrespective of sulfate content or the conditions of the swell
test it was subject to. Significant is the identification of an AFt morphology termed ‘ball
ettringite’ in the literature. This calcium-rich AFt phase has only recently been reported
and this may be the first time it has been identified in stabilised soils.
Importantly the bulk clay dictated the morphology of the ettringite crystals formed. In the
kaolin based soils, AFt was difficult to identify by both XRD and SEM-EDX analysis,
despite these soils exhibiting large dimensional swell responses (Chapter Five).
Conversely, in the montmorillonite soils the ettringite crystals were larger with evidence of
their nucleation and crystal growth occurring within the void structure of the soil. It was
suggested based on findings from earlier workers that the properties of the clay control
the hydroxide ion concentration in the pore solution and hence the thermodynamics of
AFt formation.
By measuring Imax from the low angle XRD studies a general trend of increasing AFt peak
intensity with starting sulfate content was found. But due to the amorphous nature of the
ettringite formed in the kaolin soils, crystallite size and particle orientation it can only be
implied that as the amount of sulfate in the starting material increases, so does the
propensity of the cementitious system to form ettringite.
Derivative Thermal Gravimetric Analysis (dTGA) was found to be less useful than
anticipated, due to thermal events associated with the decomposition of ettringite and
monosulfate occurring at low temperatures, where they are masked by those of other
phases. For example; the dehydration of surface water of clay and decomposition of
CSH. However, it was suggested that close analysis of the soils, allowed the dehydration
of AFt to be differentiated from that of gypsum, based on the temperature at which the
differential of the samples with respect to time reached a maximum (δY/δt = max). dTGA
did however allow the identification of a solid solution between AFm and CAŜH in
K4L0.5S (EN13286-49).
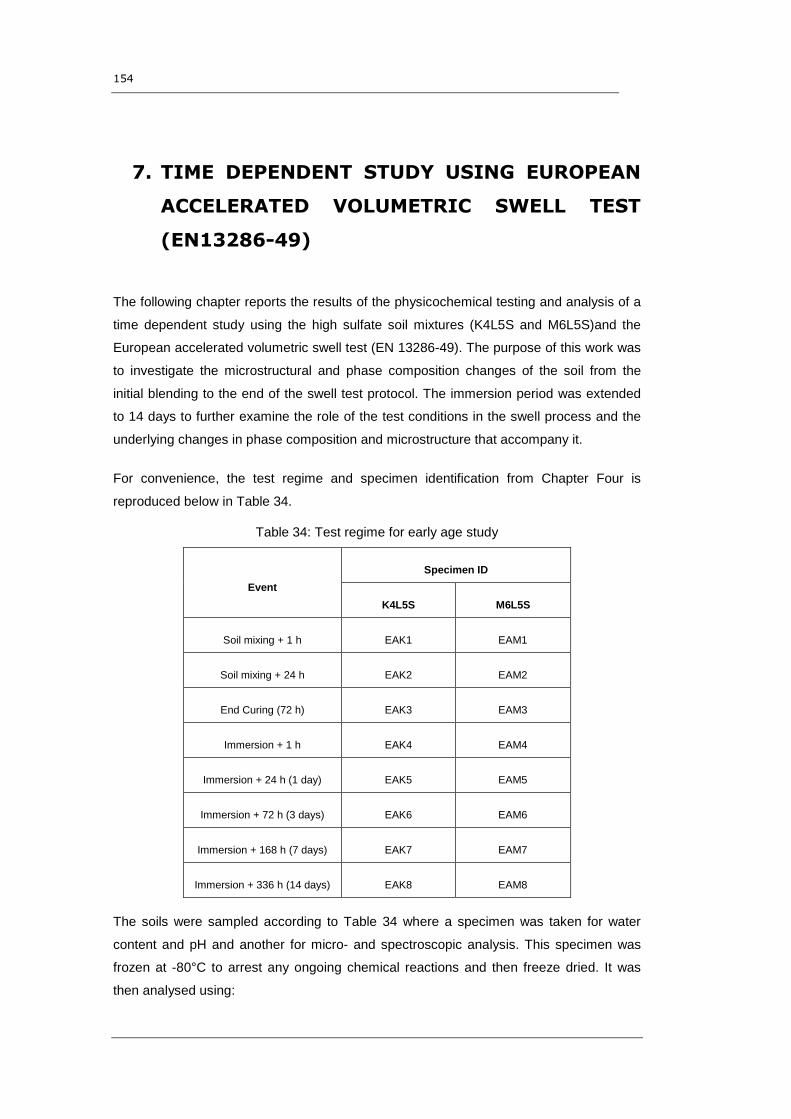
154
7. TIME DEPENDENT STUDY USING EUROPEAN
ACCELERATED VOLUMETRIC SWELL TEST
(EN13286-49)
The following chapter reports the results of the physicochemical testing and analysis of a
time dependent study using the high sulfate soil mixtures (K4L5S and M6L5S)and the
European accelerated volumetric swell test (EN 13286-49). The purpose of this work was
to investigate the microstructural and phase composition changes of the soil from the
initial blending to the end of the swell test protocol. The immersion period was extended
to 14 days to further examine the role of the test conditions in the swell process and the
underlying changes in phase composition and microstructure that accompany it.
For convenience, the test regime and specimen identification from Chapter Four is
reproduced below in Table 34.
Table 34: Test regime for early age study
Event
Specimen ID
K4L5S M6L5S
Soil mixing + 1 h EAK1 EAM1
Soil mixing + 24 h EAK2 EAM2
End Curing (72 h) EAK3 EAM3
Immersion + 1 h EAK4 EAM4
Immersion + 24 h (1 day) EAK5 EAM5
Immersion + 72 h (3 days) EAK6 EAM6
Immersion + 168 h (7 days) EAK7 EAM7
Immersion + 336 h (14 days) EAK8 EAM8
The soils were sampled according to Table 34 where a specimen was taken for water
content and pH and another for micro- and spectroscopic analysis. This specimen was
frozen at 80°C to arrest any ongoing chemical reactions and then freeze dried. It was
then analysed using:
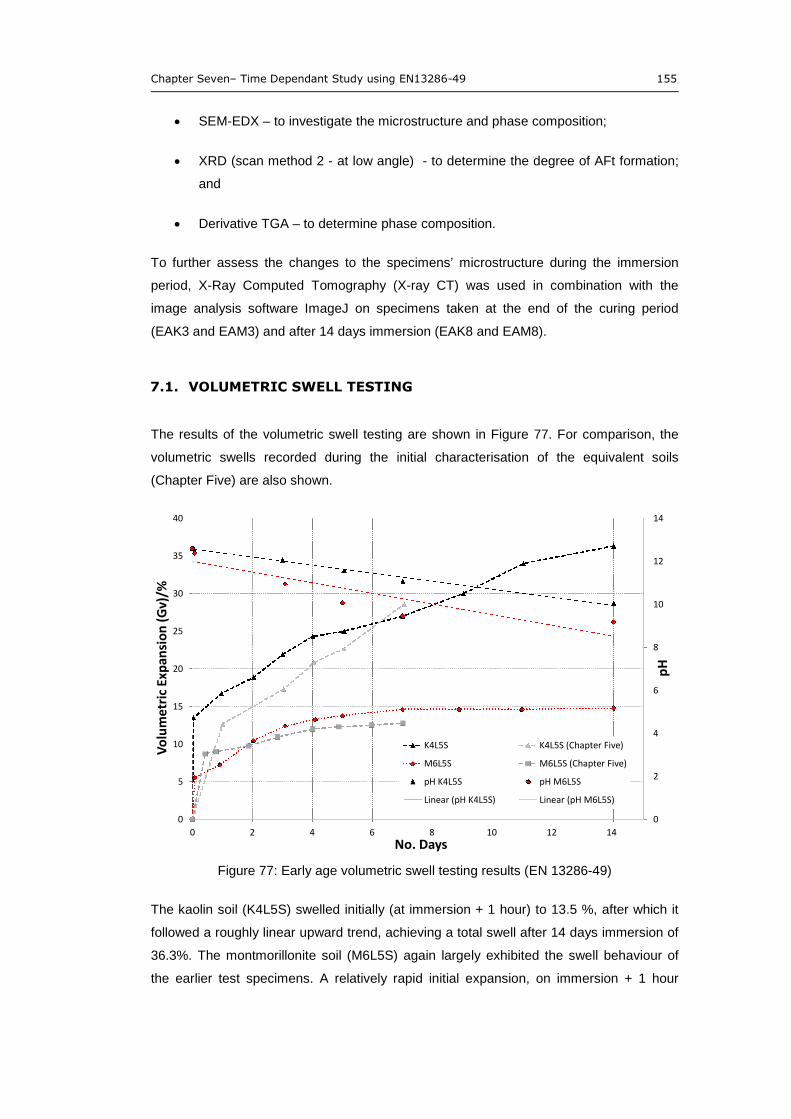
Chapter Seven– Time Dependant Study using EN13286-49 155
SEM-EDX – to investigate the microstructure and phase composition;
XRD (scan method 2 - at low angle) - to determine the degree of AFt formation;
and
Derivative TGA – to determine phase composition.
To further assess the changes to the specimens’ microstructure during the immersion
period, X-Ray Computed Tomography (X-ray CT) was used in combination with the
image analysis software ImageJ on specimens taken at the end of the curing period
(EAK3 and EAM3) and after 14 days immersion (EAK8 and EAM8).
7.1. VOLUMETRIC SWELL TESTING
The results of the volumetric swell testing are shown in Figure 77. For comparison, the
volumetric swells recorded during the initial characterisation of the equivalent soils
(Chapter Five) are also shown.
Figure 77: Early age volumetric swell testing results (EN 13286-49)
The kaolin soil (K4L5S) swelled initially (at immersion + 1 hour) to 13.5 %, after which it
followed a roughly linear upward trend, achieving a total swell after 14 days immersion of
36.3%. The montmorillonite soil (M6L5S) again largely exhibited the swell behaviour of
the earlier test specimens. A relatively rapid initial expansion, on immersion + 1 hour
0
2
4
6
8
10
12
14
0
5
10
15
20
25
30
35
40
0 2 4 6 8 10 12 14
pH
Vo
lum
etri
cEx
pan
sio
n(G
v)/%
No. Days
K4L5S K4L5S (Chapter Five)
M6L5S M6L5S (Chapter Five)
pH K4L5S pH M6L5S
Linear (pH K4L5S) Linear (pH M6L5S)
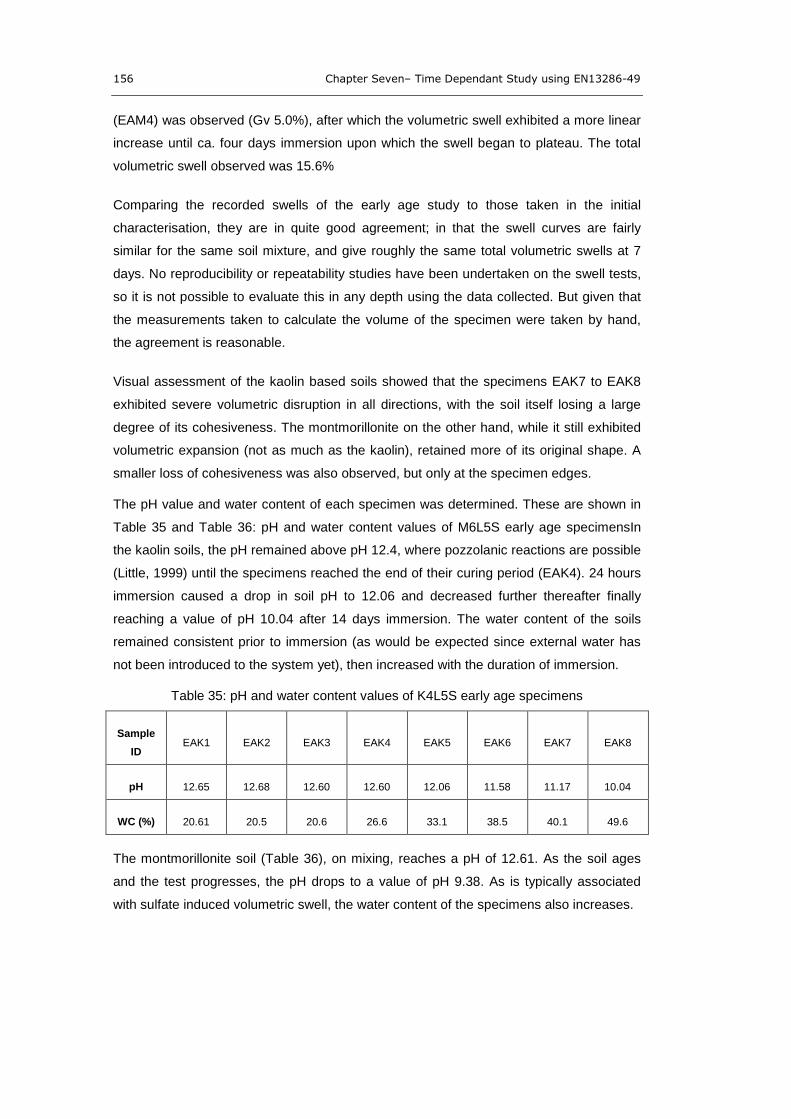
156 Chapter Seven– Time Dependant Study using EN13286-49
(EAM4) was observed (Gv 5.0%), after which the volumetric swell exhibited a more linear
increase until ca. four days immersion upon which the swell began to plateau. The total
volumetric swell observed was 15.6%
Comparing the recorded swells of the early age study to those taken in the initial
characterisation, they are in quite good agreement; in that the swell curves are fairly
similar for the same soil mixture, and give roughly the same total volumetric swells at 7
days. No reproducibility or repeatability studies have been undertaken on the swell tests,
so it is not possible to evaluate this in any depth using the data collected. But given that
the measurements taken to calculate the volume of the specimen were taken by hand,
the agreement is reasonable.
Visual assessment of the kaolin based soils showed that the specimens EAK7 to EAK8
exhibited severe volumetric disruption in all directions, with the soil itself losing a large
degree of its cohesiveness. The montmorillonite on the other hand, while it still exhibited
volumetric expansion (not as much as the kaolin), retained more of its original shape. A
smaller loss of cohesiveness was also observed, but only at the specimen edges.
The pH value and water content of each specimen was determined. These are shown in
Table 35 and Table 36: pH and water content values of M6L5S early age specimensIn
the kaolin soils, the pH remained above pH 12.4, where pozzolanic reactions are possible
(Little, 1999) until the specimens reached the end of their curing period (EAK4). 24 hours
immersion caused a drop in soil pH to 12.06 and decreased further thereafter finally
reaching a value of pH 10.04 after 14 days immersion. The water content of the soils
remained consistent prior to immersion (as would be expected since external water has
not been introduced to the system yet), then increased with the duration of immersion.
Table 35: pH and water content values of K4L5S early age specimens
Sample
IDEAK1 EAK2 EAK3 EAK4 EAK5 EAK6 EAK7 EAK8
pH 12.65 12.68 12.60 12.60 12.06 11.58 11.17 10.04
WC (%) 20.61 20.5 20.6 26.6 33.1 38.5 40.1 49.6
The montmorillonite soil (Table 36), on mixing, reaches a pH of 12.61. As the soil ages
and the test progresses, the pH drops to a value of pH 9.38. As is typically associated
with sulfate induced volumetric swell, the water content of the specimens also increases.
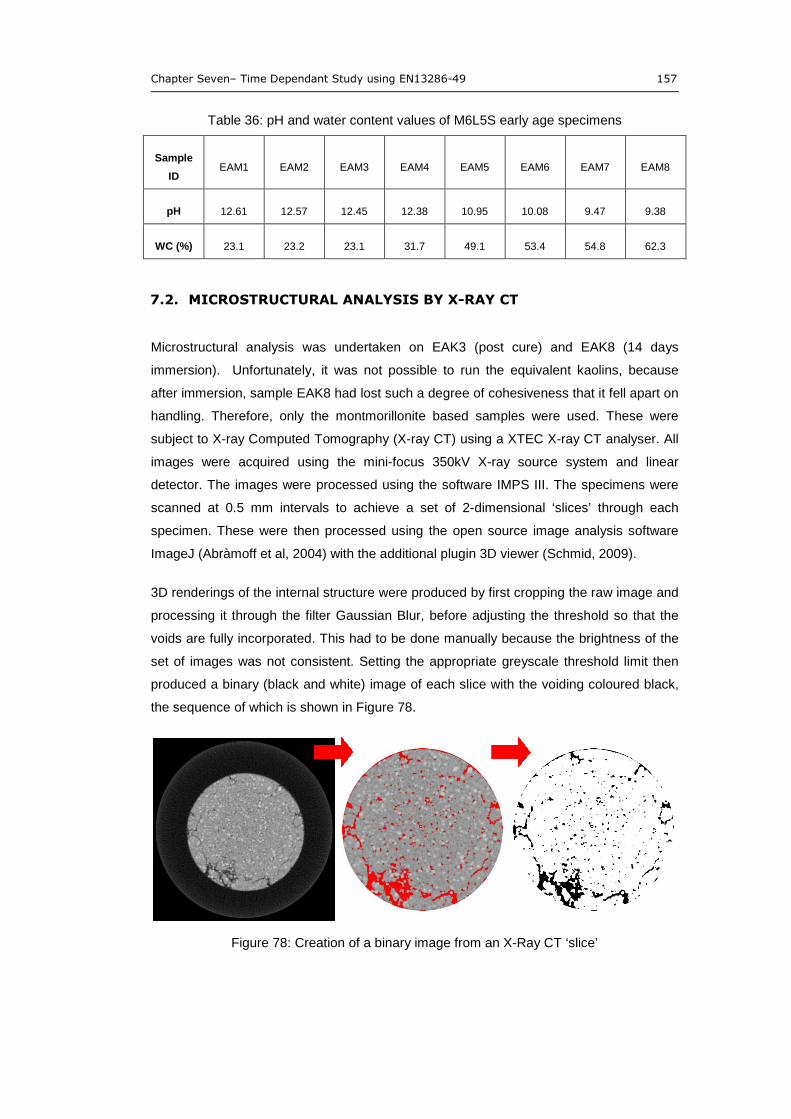
Chapter Seven– Time Dependant Study using EN13286-49 157
Table 36: pH and water content values of M6L5S early age specimens
Sample
IDEAM1 EAM2 EAM3 EAM4 EAM5 EAM6 EAM7 EAM8
pH 12.61 12.57 12.45 12.38 10.95 10.08 9.47 9.38
WC (%) 23.1 23.2 23.1 31.7 49.1 53.4 54.8 62.3
7.2. MICROSTRUCTURAL ANALYSIS BY X-RAY CT
Microstructural analysis was undertaken on EAK3 (post cure) and EAK8 (14 days
immersion). Unfortunately, it was not possible to run the equivalent kaolins, because
after immersion, sample EAK8 had lost such a degree of cohesiveness that it fell apart on
handling. Therefore, only the montmorillonite based samples were used. These were
subject to X-ray Computed Tomography (X-ray CT) using a XTEC X-ray CT analyser. All
images were acquired using the mini-focus 350kV X-ray source system and linear
detector. The images were processed using the software IMPS III. The specimens were
scanned at 0.5 mm intervals to achieve a set of 2-dimensional ‘slices’ through each
specimen. These were then processed using the open source image analysis software
ImageJ (Abràmoff et al, 2004) with the additional plugin 3D viewer (Schmid, 2009).
3D renderings of the internal structure were produced by first cropping the raw image and
processing it through the filter Gaussian Blur, before adjusting the threshold so that the
voids are fully incorporated. This had to be done manually because the brightness of the
set of images was not consistent. Setting the appropriate greyscale threshold limit then
produced a binary (black and white) image of each slice with the voiding coloured black,
the sequence of which is shown in Figure 78.
Figure 78: Creation of a binary image from an X-Ray CT ‘slice’
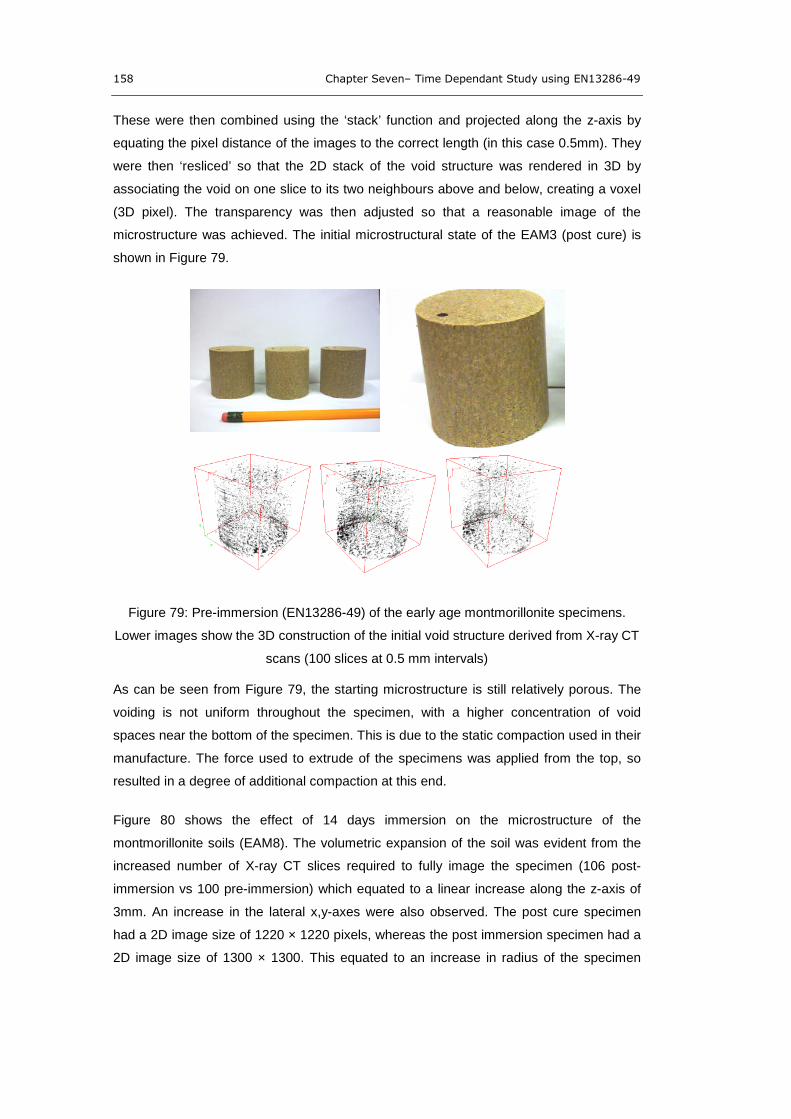
158 Chapter Seven– Time Dependant Study using EN13286-49
These were then combined using the ‘stack’ function and projected along the z-axis by
equating the pixel distance of the images to the correct length (in this case 0.5mm). They
were then ‘resliced’ so that the 2D stack of the void structure was rendered in 3D by
associating the void on one slice to its two neighbours above and below, creating a voxel
(3D pixel). The transparency was then adjusted so that a reasonable image of the
microstructure was achieved. The initial microstructural state of the EAM3 (post cure) is
shown in Figure 79.
Figure 79: Pre-immersion (EN13286-49) of the early age montmorillonite specimens.
Lower images show the 3D construction of the initial void structure derived from X-ray CT
scans (100 slices at 0.5 mm intervals)
As can be seen from Figure 79, the starting microstructure is still relatively porous. The
voiding is not uniform throughout the specimen, with a higher concentration of void
spaces near the bottom of the specimen. This is due to the static compaction used in their
manufacture. The force used to extrude of the specimens was applied from the top, so
resulted in a degree of additional compaction at this end.
Figure 80 shows the effect of 14 days immersion on the microstructure of the
montmorillonite soils (EAM8). The volumetric expansion of the soil was evident from the
increased number of X-ray CT slices required to fully image the specimen (106 post-
immersion vs 100 pre-immersion) which equated to a linear increase along the z-axis of
3mm. An increase in the lateral x,y-axes were also observed. The post cure specimen
had a 2D image size of 1220 × 1220 pixels, whereas the post immersion specimen had a
2D image size of 1300 × 1300. This equated to an increase in radius of the specimen
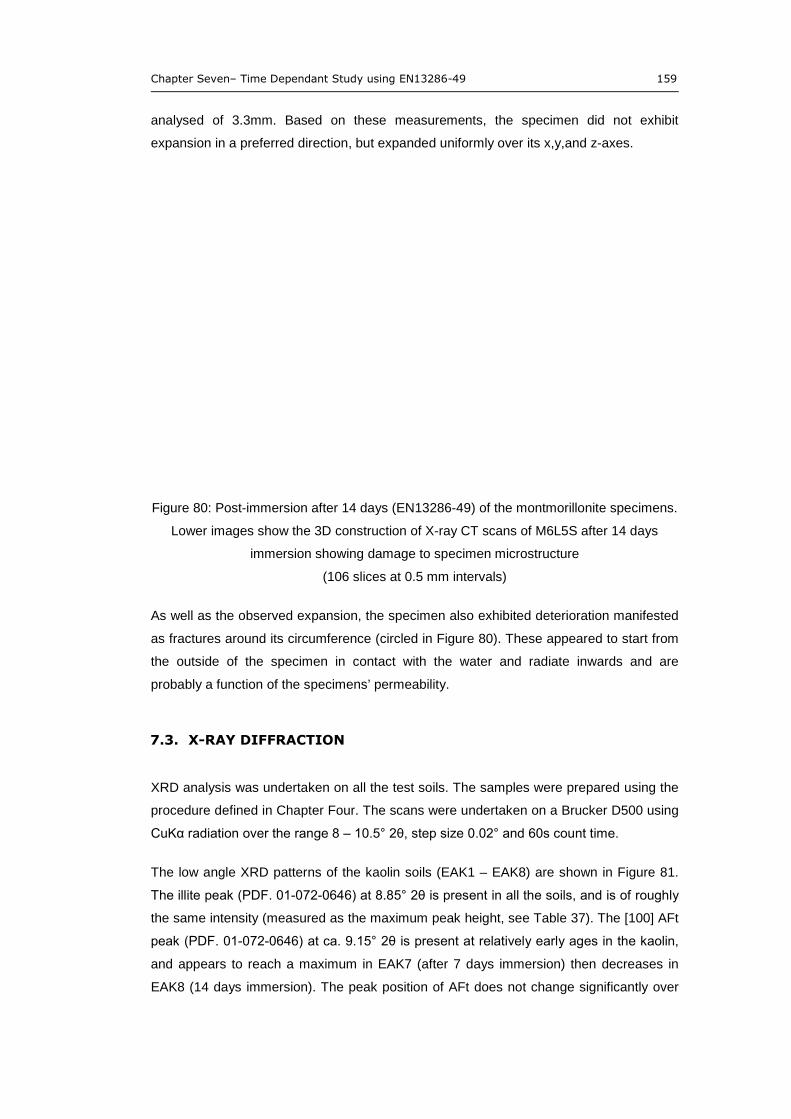
Chapter Seven– Time Dependant Study using EN13286-49 159
analysed of 3.3mm. Based on these measurements, the specimen did not exhibit
expansion in a preferred direction, but expanded uniformly over its x,y,and z-axes.
Figure 80: Post-immersion after 14 days (EN13286-49) of the montmorillonite specimens.
Lower images show the 3D construction of X-ray CT scans of M6L5S after 14 days
immersion showing damage to specimen microstructure
(106 slices at 0.5 mm intervals)
As well as the observed expansion, the specimen also exhibited deterioration manifested
as fractures around its circumference (circled in Figure 80). These appeared to start from
the outside of the specimen in contact with the water and radiate inwards and are
probably a function of the specimens’ permeability.
7.3. X-RAY DIFFRACTION
XRD analysis was undertaken on all the test soils. The samples were prepared using the
procedure defined in Chapter Four. The scans were undertaken on a Brucker D500 using
CuKα radiation over the range 8 – 10.5° 2θ, step size 0.02° and 60s count time.
The low angle XRD patterns of the kaolin soils (EAK1 – EAK8) are shown in Figure 81.
The illite peak (PDF. 010720646) at 8.85° 2θ is present in all the soils, and is of roughly
the same intensity (measured as the maximum peak height, see Table 37). The [100] AFt
peak (PDF. 010720646) at ca. 9.15° 2θ is present at relatively early ages in the kaolin,
and appears to reach a maximum in EAK7 (after 7 days immersion) then decreases in
EAK8 (14 days immersion). The peak position of AFt does not change significantly over
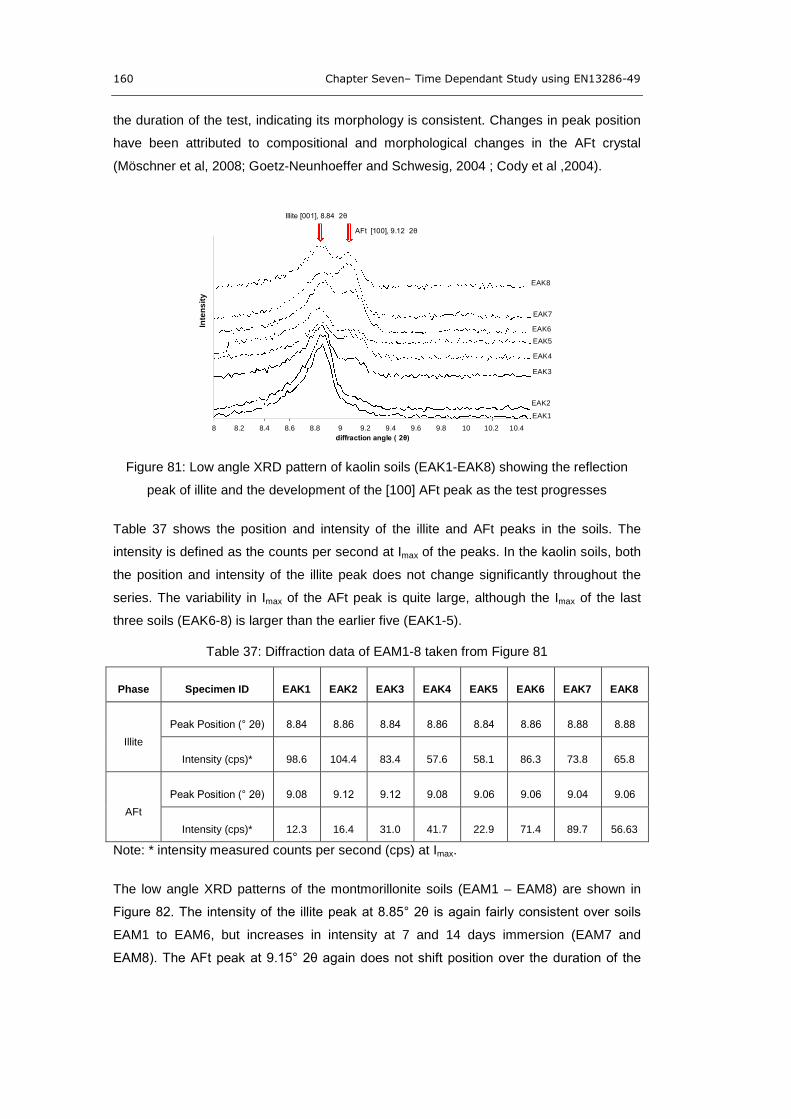
160 Chapter Seven– Time Dependant Study using EN13286-49
the duration of the test, indicating its morphology is consistent. Changes in peak position
have been attributed to compositional and morphological changes in the AFt crystal
(Möschner et al, 2008; Goetz-Neunhoeffer and Schwesig, 2004 ; Cody et al ,2004).
Figure 81: Low angle XRD pattern of kaolin soils (EAK1-EAK8) showing the reflection
peak of illite and the development of the [100] AFt peak as the test progresses
Table 37 shows the position and intensity of the illite and AFt peaks in the soils. The
intensity is defined as the counts per second at Imax of the peaks. In the kaolin soils, both
the position and intensity of the illite peak does not change significantly throughout the
series. The variability in Imax of the AFt peak is quite large, although the Imax of the last
three soils (EAK6-8) is larger than the earlier five (EAK1-5).
Table 37: Diffraction data of EAM1-8 taken from Figure 81
Phase Specimen ID EAK1 EAK2 EAK3 EAK4 EAK5 EAK6 EAK7 EAK8
Illite
Peak Position (° 2θ) 8.84 8.86 8.84 8.86 8.84 8.86 8.88 8.88
Intensity (cps)* 98.6 104.4 83.4 57.6 58.1 86.3 73.8 65.8
AFt
Peak Position (° 2θ) 9.08 9.12 9.12 9.08 9.06 9.06 9.04 9.06
Intensity (cps)* 12.3 16.4 31.0 41.7 22.9 71.4 89.7 56.63
Note: * intensity measured counts per second (cps) at Imax.
The low angle XRD patterns of the montmorillonite soils (EAM1 – EAM8) are shown in
Figure 82. The intensity of the illite peak at 8.85° 2θ is again fairly consistent over soils
EAM1 to EAM6, but increases in intensity at 7 and 14 days immersion (EAM7 and
EAM8). The AFt peak at 9.15° 2θ again does not shift position over the duration of the
8 8.2 8.4 8.6 8.8 9 9.2 9.4 9.6 9.8 10 10.2 10.4
Inte
ns
ity
diffraction angle ( 2θ)
EAK3
EAK8
EAK7
EAK6
EAK5
EAK4
Illite [001], 8.84 2θ
AFt [100], 9.12 2θ
EAK2
EAK1
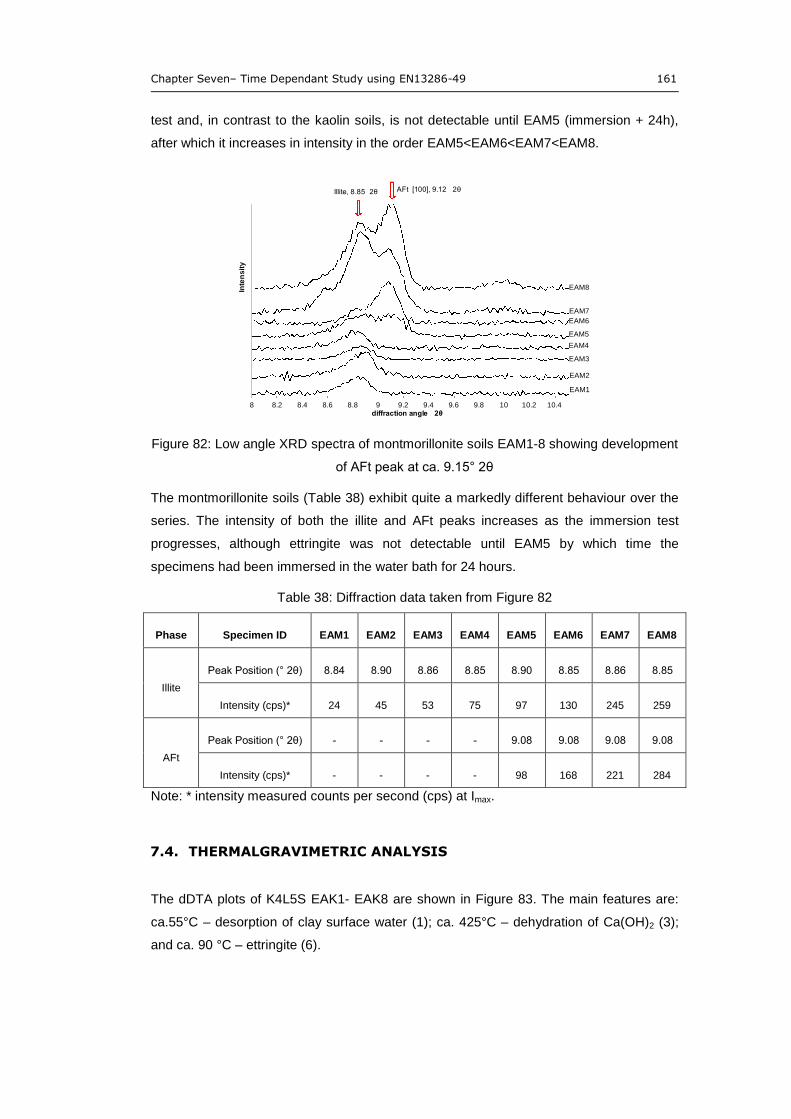
Chapter Seven– Time Dependant Study using EN13286-49 161
test and, in contrast to the kaolin soils, is not detectable until EAM5 (immersion + 24h),
after which it increases in intensity in the order EAM5<EAM6<EAM7<EAM8.
Figure 82: Low angle XRD spectra of montmorillonite soils EAM1-8 showing development
of AFt peak at ca. 9.15° 2θ
The montmorillonite soils (Table 38) exhibit quite a markedly different behaviour over the
series. The intensity of both the illite and AFt peaks increases as the immersion test
progresses, although ettringite was not detectable until EAM5 by which time the
specimens had been immersed in the water bath for 24 hours.
Table 38: Diffraction data taken from Figure 82
Phase Specimen ID EAM1 EAM2 EAM3 EAM4 EAM5 EAM6 EAM7 EAM8
Illite
Peak Position (° 2θ) 8.84 8.90 8.86 8.85 8.90 8.85 8.86 8.85
Intensity (cps)* 24 45 53 75 97 130 245 259
AFt
Peak Position (° 2θ) 9.08 9.08 9.08 9.08
Intensity (cps)* 98 168 221 284
Note: * intensity measured counts per second (cps) at Imax.
7.4. THERMALGRAVIMETRIC ANALYSIS
The dDTA plots of K4L5S EAK1- EAK8 are shown in Figure 83. The main features are:
ca.55°C – desorption of clay surface water (1); ca. 425°C – dehydration of Ca(OH)2 (3);
and ca. 90 °C – ettringite (6).
8 8.2 8.4 8.6 8.8 9 9.2 9.4 9.6 9.8 10 10.2 10.4
Inte
ns
ity
diffraction angle 2θ
EAM1
EAM8
EAM7
EAM6
EAM5
EAM4
EAM3
EAM2
Illite, 8.85 2θ AFt [100], 9.12 2θ
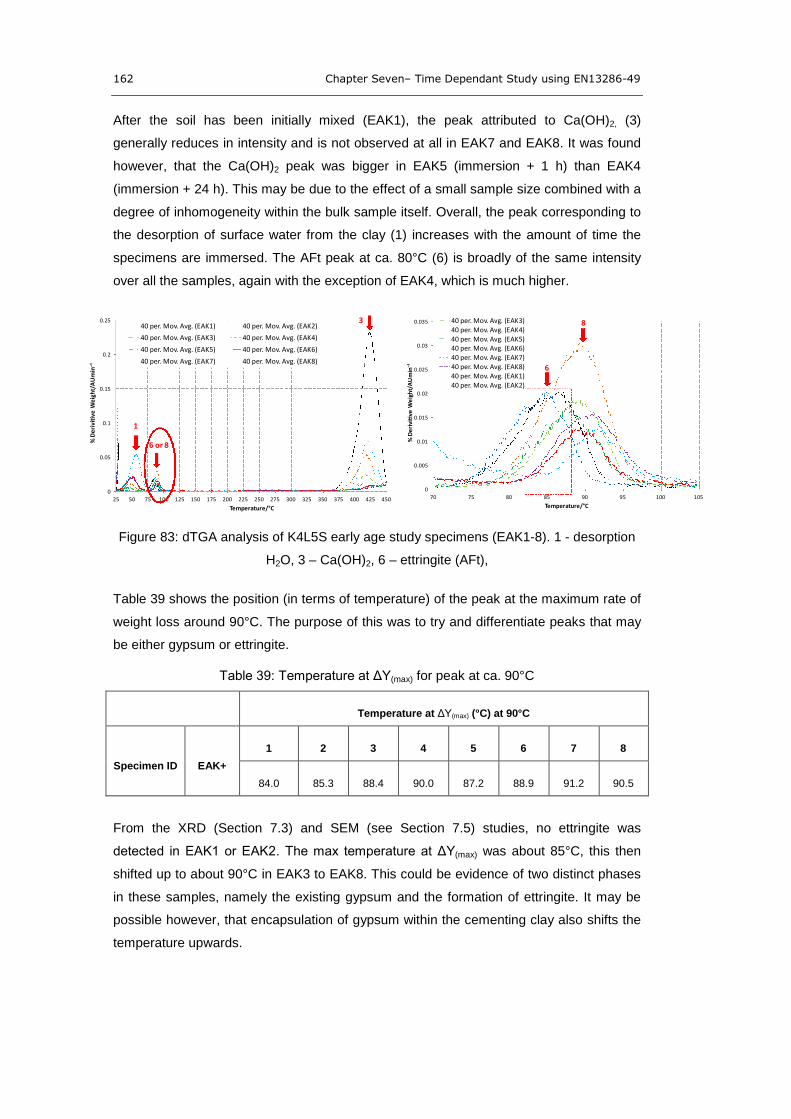
162 Chapter Seven– Time Dependant Study using EN13286-49
After the soil has been initially mixed (EAK1), the peak attributed to Ca(OH)2, (3)
generally reduces in intensity and is not observed at all in EAK7 and EAK8. It was found
however, that the Ca(OH)2 peak was bigger in EAK5 (immersion + 1 h) than EAK4
(immersion + 24 h). This may be due to the effect of a small sample size combined with a
degree of inhomogeneity within the bulk sample itself. Overall, the peak corresponding to
the desorption of surface water from the clay (1) increases with the amount of time the
specimens are immersed. The AFt peak at ca. 80°C (6) is broadly of the same intensity
over all the samples, again with the exception of EAK4, which is much higher.
Figure 83: dTGA analysis of K4L5S early age study specimens (EAK1-8). 1 - desorption
H2O, 3 – Ca(OH)2, 6 – ettringite (AFt),
Table 39 shows the position (in terms of temperature) of the peak at the maximum rate of
weight loss around 90°C. The purpose of this was to try and differentiate peaks that may
be either gypsum or ettringite.
Table 39: Temperature at ΔY(max) for peak at ca. 90°C
Temperature at ΔY(max) (°C) at 90°C
Specimen ID EAK+
1 2 3 4 5 6 7 8
84.0 85.3 88.4 90.0 87.2 88.9 91.2 90.5
From the XRD (Section 7.3) and SEM (see Section 7.5) studies, no ettringite was
detected in EAK1 or EAK2. The max temperature at ΔY(max) was about 85°C, this then
shifted up to about 90°C in EAK3 to EAK8. This could be evidence of two distinct phases
in these samples, namely the existing gypsum and the formation of ettringite. It may be
possible however, that encapsulation of gypsum within the cementing clay also shifts the
temperature upwards.
0
0.05
0.1
0.15
0.2
0.25
25 50 75 100 125 150 175 200 225 250 275 300 325 350 375 400 425 450
й��ĞƌŝǀŝƟǀĞ
�tĞŝŐŚƚͬ�hŵŝŶЁϷ
Temperature/°C
40 per. Mov. Avg. (EAK1) 40 per. Mov. Avg. (EAK2)
40 per. Mov. Avg. (EAK3) 40 per. Mov. Avg. (EAK4)
40 per. Mov. Avg. (EAK5) 40 per. Mov. Avg. (EAK6)
40 per. Mov. Avg. (EAK7) 40 per. Mov. Avg. (EAK8)
1
6 or 8
3
0
0.005
0.01
0.015
0.02
0.025
0.03
0.035
70 75 80 85 90 95 100 105
й��ĞƌŝǀŝƟǀĞ
�tĞŝŐŚƚͬ�hŵŝŶЁϷ
Temperature/°C
40 per. Mov. Avg. (EAK3)40 per. Mov. Avg. (EAK4)40 per. Mov. Avg. (EAK5)40 per. Mov. Avg. (EAK6)40 per. Mov. Avg. (EAK7)40 per. Mov. Avg. (EAK8)40 per. Mov. Avg. (EAK1)40 per. Mov. Avg. (EAK2)
8
6
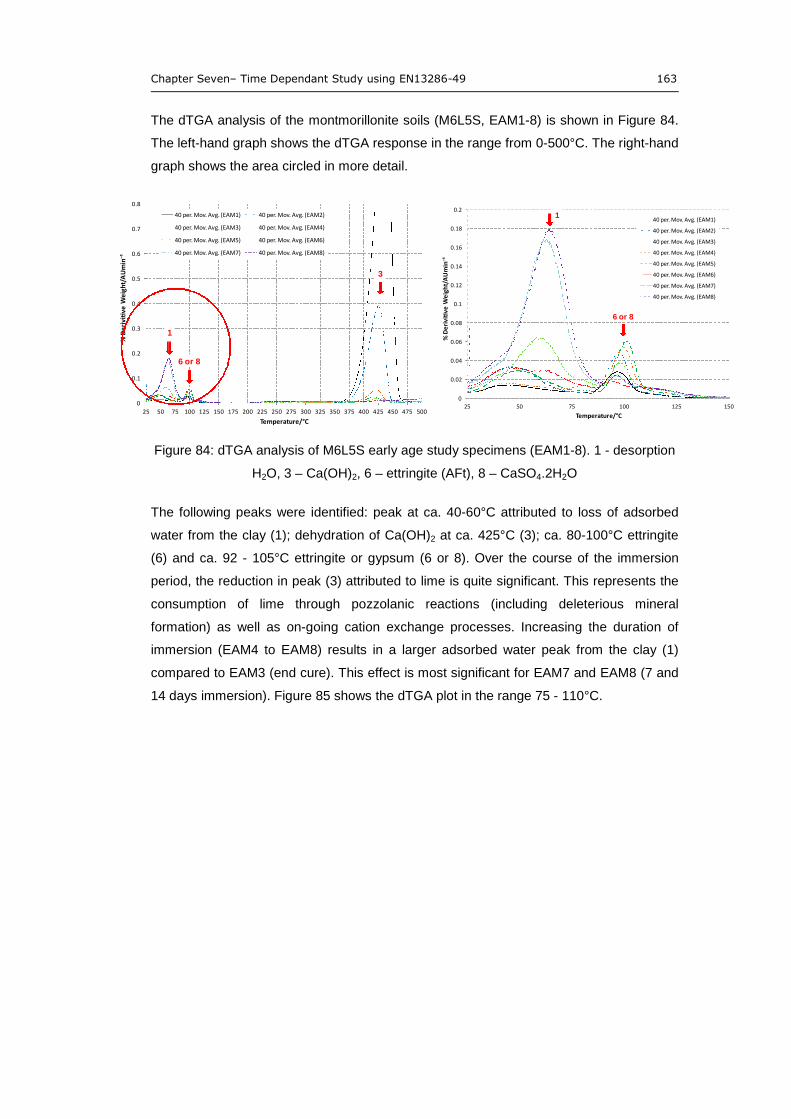
Chapter Seven– Time Dependant Study using EN13286-49 163
The dTGA analysis of the montmorillonite soils (M6L5S, EAM1-8) is shown in Figure 84.
The left-hand graph shows the dTGA response in the range from 0-500°C. The right-hand
graph shows the area circled in more detail.
Figure 84: dTGA analysis of M6L5S early age study specimens (EAM1-8). 1 - desorption
H2O, 3 – Ca(OH)2, 6 – ettringite (AFt), 8 – CaSO4.2H2O
The following peaks were identified: peak at ca. 40-60°C attributed to loss of adsorbed
water from the clay (1); dehydration of Ca(OH)2 at ca. 425°C (3); ca. 80-100°C ettringite
(6) and ca. 92 - 105°C ettringite or gypsum (6 or 8). Over the course of the immersion
period, the reduction in peak (3) attributed to lime is quite significant. This represents the
consumption of lime through pozzolanic reactions (including deleterious mineral
formation) as well as on-going cation exchange processes. Increasing the duration of
immersion (EAM4 to EAM8) results in a larger adsorbed water peak from the clay (1)
compared to EAM3 (end cure). This effect is most significant for EAM7 and EAM8 (7 and
14 days immersion). Figure 85 shows the dTGA plot in the range 75 - 110°C.
0
0.1
0.2
0.3
0.4
0.5
0.6
0.7
0.8
25 50 75 100 125 150 175 200 225 250 275 300 325 350 375 400 425 450 475 500
й��ĞƌŝǀŝƟǀĞ
�tĞŝŐŚƚͬ�hŵŝŶЁϷ
Temperature/°C
40 per. Mov. Avg. (EAM1) 40 per. Mov. Avg. (EAM2)
40 per. Mov. Avg. (EAM3) 40 per. Mov. Avg. (EAM4)
40 per. Mov. Avg. (EAM5) 40 per. Mov. Avg. (EAM6)
40 per. Mov. Avg. (EAM7) 40 per. Mov. Avg. (EAM8)
6 or 8
3
1
0
0.02
0.04
0.06
0.08
0.1
0.12
0.14
0.16
0.18
0.2
25 50 75 100 125 150
й��ĞƌŝǀŝƟǀĞ
�tĞŝŐŚƚͬ�hŵŝŶЁϷ
Temperature/°C
40 per. Mov. Avg. (EAM1)
40 per. Mov. Avg. (EAM2)
40 per. Mov. Avg. (EAM3)
40 per. Mov. Avg. (EAM4)
40 per. Mov. Avg. (EAM5)
40 per. Mov. Avg. (EAM6)
40 per. Mov. Avg. (EAM7)
40 per. Mov. Avg. (EAM8)
6 or 8
1
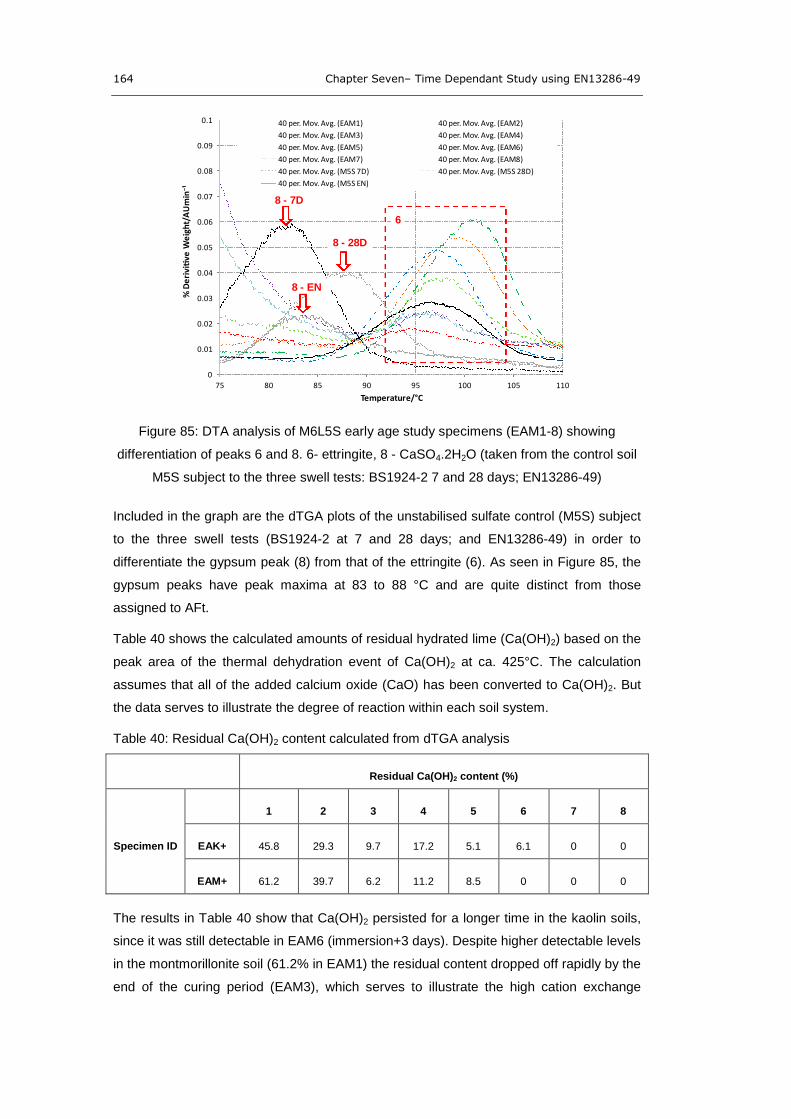
164 Chapter Seven– Time Dependant Study using EN13286-49
Figure 85: DTA analysis of M6L5S early age study specimens (EAM1-8) showing
differentiation of peaks 6 and 8. 6- ettringite, 8 - CaSO4.2H2O (taken from the control soil
M5S subject to the three swell tests: BS1924-2 7 and 28 days; EN13286-49)
Included in the graph are the dTGA plots of the unstabilised sulfate control (M5S) subject
to the three swell tests (BS1924-2 at 7 and 28 days; and EN13286-49) in order to
differentiate the gypsum peak (8) from that of the ettringite (6). As seen in Figure 85, the
gypsum peaks have peak maxima at 83 to 88 °C and are quite distinct from those
assigned to AFt.
Table 40 shows the calculated amounts of residual hydrated lime (Ca(OH)2) based on the
peak area of the thermal dehydration event of Ca(OH)2 at ca. 425°C. The calculation
assumes that all of the added calcium oxide (CaO) has been converted to Ca(OH)2. But
the data serves to illustrate the degree of reaction within each soil system.
Table 40: Residual Ca(OH)2 content calculated from dTGA analysis
Residual Ca(OH)2 content (%)
Specimen ID
1 2 3 4 5 6 7 8
EAK+ 45.8 29.3 9.7 17.2 5.1 6.1 0 0
EAM+ 61.2 39.7 6.2 11.2 8.5 0 0 0
The results in Table 40 show that Ca(OH)2 persisted for a longer time in the kaolin soils,
since it was still detectable in EAM6 (immersion+3 days). Despite higher detectable levels
in the montmorillonite soil (61.2% in EAM1) the residual content dropped off rapidly by the
end of the curing period (EAM3), which serves to illustrate the high cation exchange
0
0.01
0.02
0.03
0.04
0.05
0.06
0.07
0.08
0.09
0.1
75 80 85 90 95 100 105 110
й��ĞƌŝǀŝƟǀĞ
�tĞŝŐŚƚͬ�hŵŝŶЁϷ
Temperature/°C
40 per. Mov. Avg. (EAM1) 40 per. Mov. Avg. (EAM2)
40 per. Mov. Avg. (EAM3) 40 per. Mov. Avg. (EAM4)
40 per. Mov. Avg. (EAM5) 40 per. Mov. Avg. (EAM6)
40 per. Mov. Avg. (EAM7) 40 per. Mov. Avg. (EAM8)
40 per. Mov. Avg. (M5S 7D) 40 per. Mov. Avg. (M5S 28D)
40 per. Mov. Avg. (M5S EN)
8 - 7D
6
8 - 28D
8 - EN
Chapter Seven– Time Dependant Study using EN13286-49 165
capacity (CEC) of 2:1 layer clay. Lime could not be detected at all from EAM6 onwards.
The slight increase in both soils at EAK4 and EAM4 is caused by the immersion of the
specimens in the water, resulting in saturation of the sample (and any unreacted CaO).
7.5. SEM-EDX ANALYSIS
SEM-EDX analysis was undertaken using the equipment and procedure defined in
chapter four.
7.5.1. High Sulfate Kaolin Soil (K4L5S)
Figure 86 shows representative SEM-EDX analysis of EAK1 (mixing + 1h). The soil
remains unchanged with little evidence of either ettringite formation or any cementitious
products. The EDX of the clay (EDX7a) reveals typical elemental emissions of the parent
clay. Note the low emission of Ca. This could be viewed as an indication of a low degree
of cationic substitution (CEC processes) at this stage.
Figure 86: SEM-EDX of EAK1 showing typical plate-like morphology of the kaolin clay
(left) and unreacted gypsum particle (right)
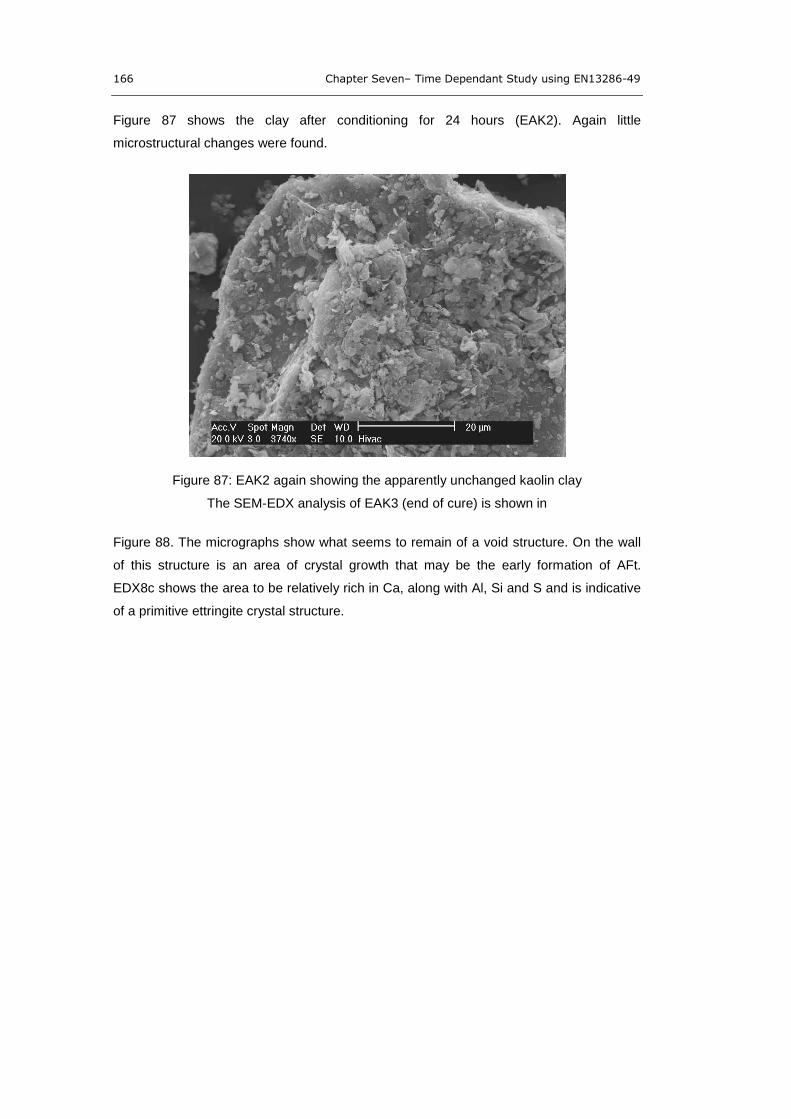
166 Chapter Seven– Time Dependant Study using EN13286-49
Figure 87 shows the clay after conditioning for 24 hours (EAK2). Again little
microstructural changes were found.
Figure 87: EAK2 again showing the apparently unchanged kaolin clay
The SEM-EDX analysis of EAK3 (end of cure) is shown in
Figure 88. The micrographs show what seems to remain of a void structure. On the wall
of this structure is an area of crystal growth that may be the early formation of AFt.
EDX8c shows the area to be relatively rich in Ca, along with Al, Si and S and is indicative
of a primitive ettringite crystal structure.
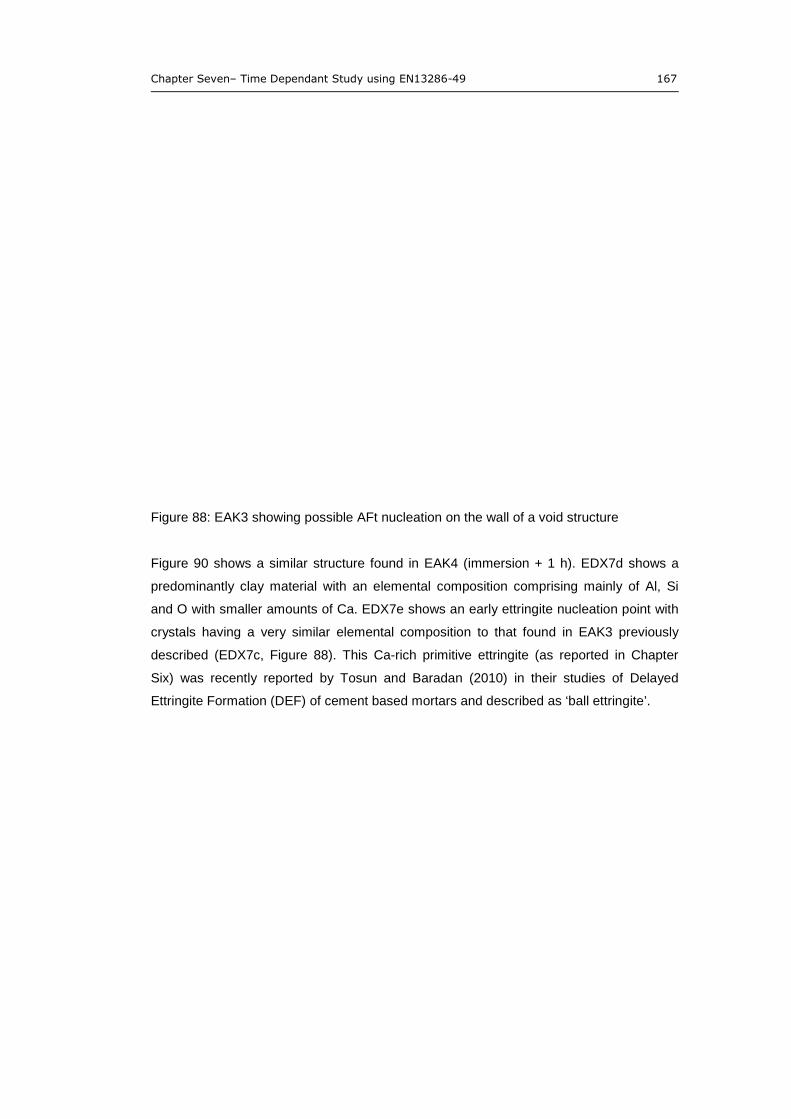
Chapter Seven– Time Dependant Study using EN13286-49 167
Figure 88: EAK3 showing possible AFt nucleation on the wall of a void structure
Figure 90 shows a similar structure found in EAK4 (immersion + 1 h). EDX7d shows a
predominantly clay material with an elemental composition comprising mainly of Al, Si
and O with smaller amounts of Ca. EDX7e shows an early ettringite nucleation point with
crystals having a very similar elemental composition to that found in EAK3 previously
described (EDX7c, Figure 88). This Ca-rich primitive ettringite (as reported in Chapter
Six) was recently reported by Tosun and Baradan (2010) in their studies of Delayed
Ettringite Formation (DEF) of cement based mortars and described as ‘ball ettringite’.
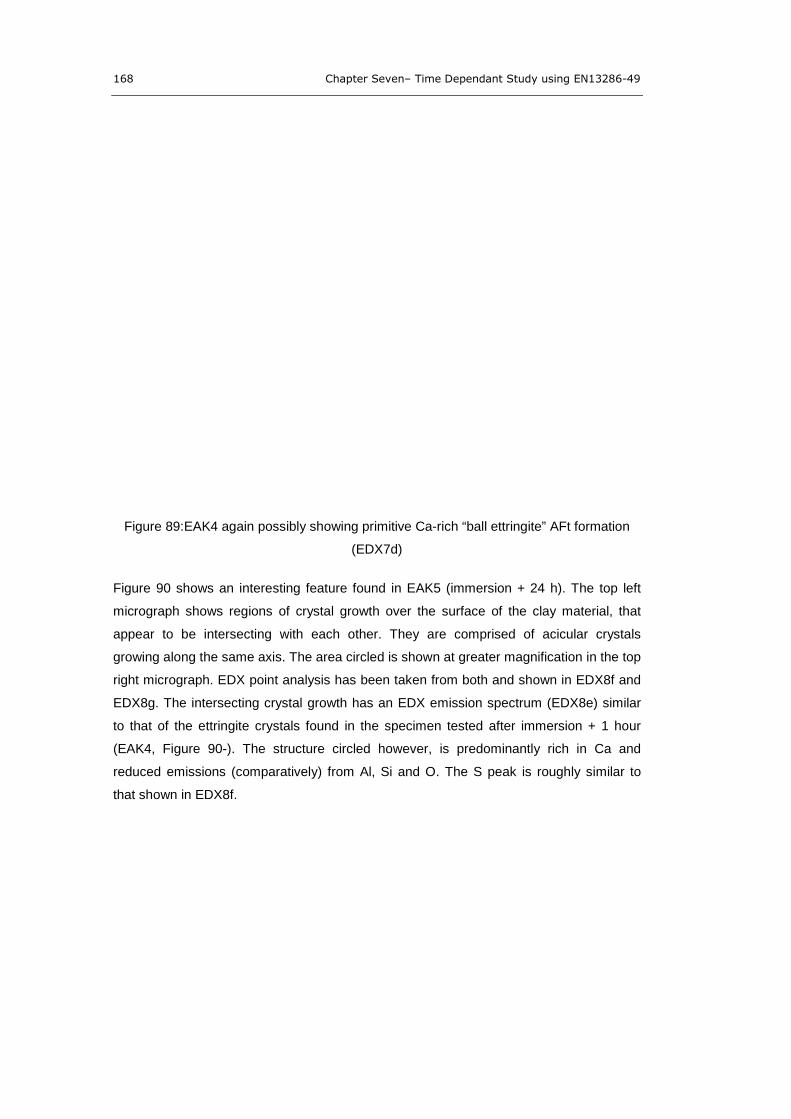
168 Chapter Seven– Time Dependant Study using EN13286-49
Figure 89:EAK4 again possibly showing primitive Ca-rich “ball ettringite” AFt formation
(EDX7d)
Figure 90 shows an interesting feature found in EAK5 (immersion + 24 h). The top left
micrograph shows regions of crystal growth over the surface of the clay material, that
appear to be intersecting with each other. They are comprised of acicular crystals
growing along the same axis. The area circled is shown at greater magnification in the top
right micrograph. EDX point analysis has been taken from both and shown in EDX8f and
EDX8g. The intersecting crystal growth has an EDX emission spectrum (EDX8e) similar
to that of the ettringite crystals found in the specimen tested after immersion + 1 hour
(EAK4, Figure 90-). The structure circled however, is predominantly rich in Ca and
reduced emissions (comparatively) from Al, Si and O. The S peak is roughly similar to
that shown in EDX8f.
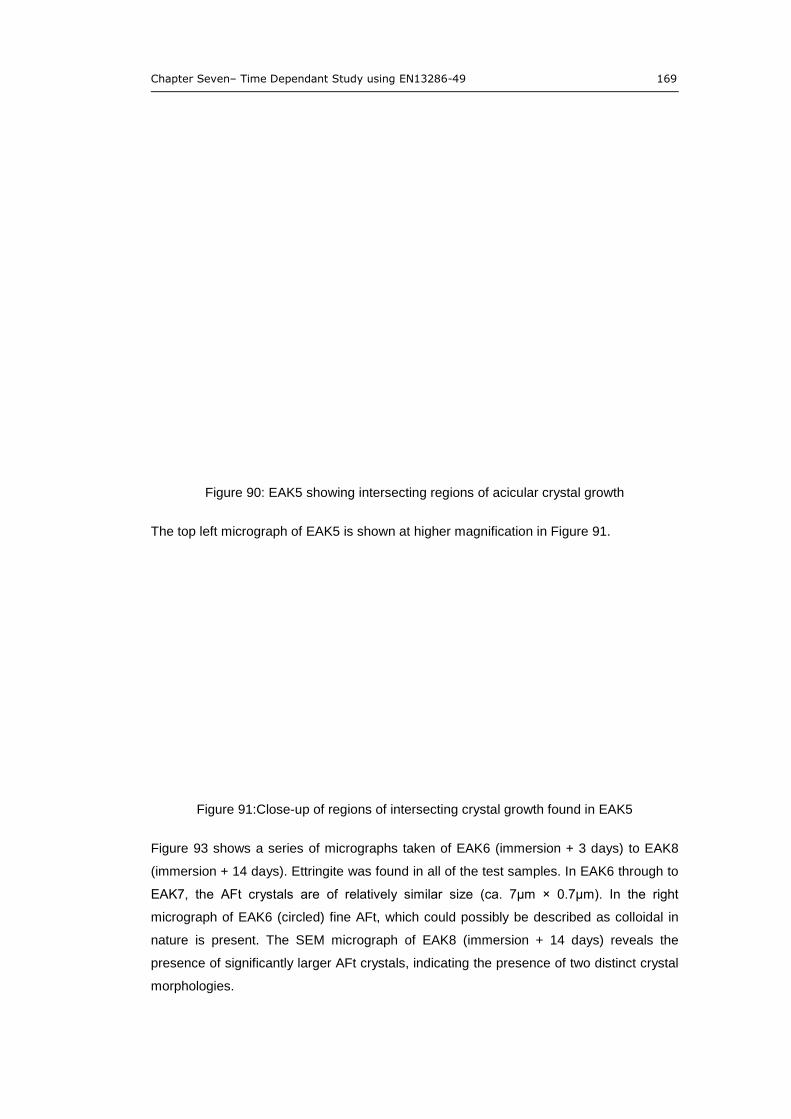
Chapter Seven– Time Dependant Study using EN13286-49 169
Figure 90: EAK5 showing intersecting regions of acicular crystal growth
The top left micrograph of EAK5 is shown at higher magnification in Figure 91.
Figure 91:Close-up of regions of intersecting crystal growth found in EAK5
Figure 93 shows a series of micrographs taken of EAK6 (immersion + 3 days) to EAK8
(immersion + 14 days). Ettringite was found in all of the test samples. In EAK6 through to
EAK7, the AFt crystals are of relatively similar size (ca. 7μm × 0.7μm). In the right
micrograph of EAK6 (circled) fine AFt, which could possibly be described as colloidal in
nature is present. The SEM micrograph of EAK8 (immersion + 14 days) reveals the
presence of significantly larger AFt crystals, indicating the presence of two distinct crystal
morphologies.
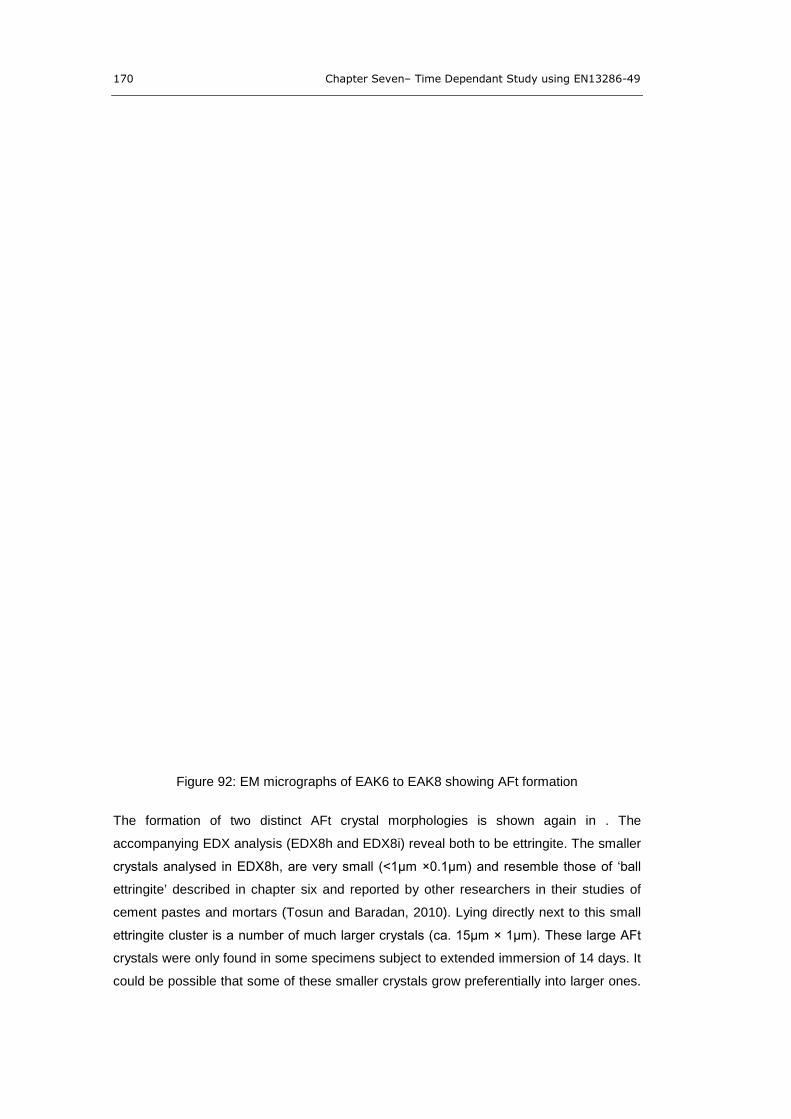
170 Chapter Seven– Time Dependant Study using EN13286-49
Figure 92: EM micrographs of EAK6 to EAK8 showing AFt formation
The formation of two distinct AFt crystal morphologies is shown again in . The
accompanying EDX analysis (EDX8h and EDX8i) reveal both to be ettringite. The smaller
crystals analysed in EDX8h, are very small (<1μm ×0.1μm) and resemble those of ‘ball
ettringite’ described in chapter six and reported by other researchers in their studies of
cement pastes and mortars (Tosun and Baradan, 2010). Lying directly next to this small
ettringite cluster is a number of much larger crystals (ca. 15μm × 1μm). These large AFt
crystals were only found in some specimens subject to extended immersion of 14 days. It
could be possible that some of these smaller crystals grow preferentially into larger ones.
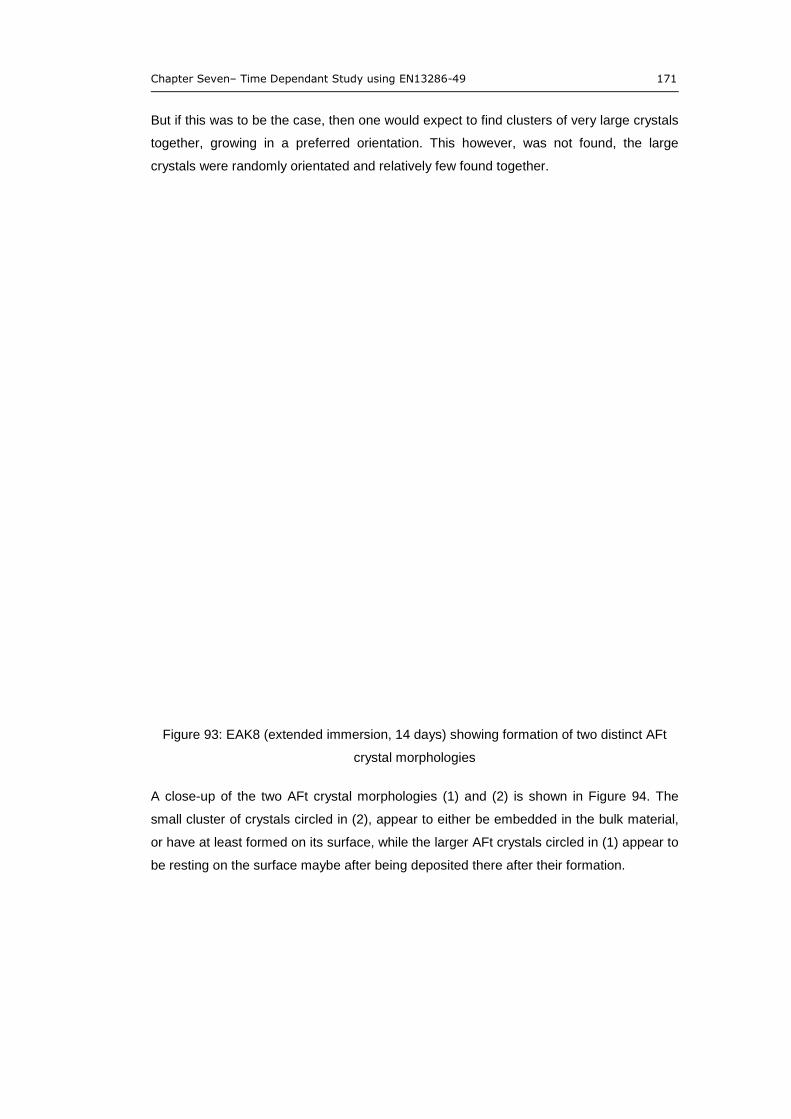
Chapter Seven– Time Dependant Study using EN13286-49 171
But if this was to be the case, then one would expect to find clusters of very large crystals
together, growing in a preferred orientation. This however, was not found, the large
crystals were randomly orientated and relatively few found together.
Figure 93: EAK8 (extended immersion, 14 days) showing formation of two distinct AFt
crystal morphologies
A close-up of the two AFt crystal morphologies (1) and (2) is shown in Figure 94. The
small cluster of crystals circled in (2), appear to either be embedded in the bulk material,
or have at least formed on its surface, while the larger AFt crystals circled in (1) appear to
be resting on the surface maybe after being deposited there after their formation.
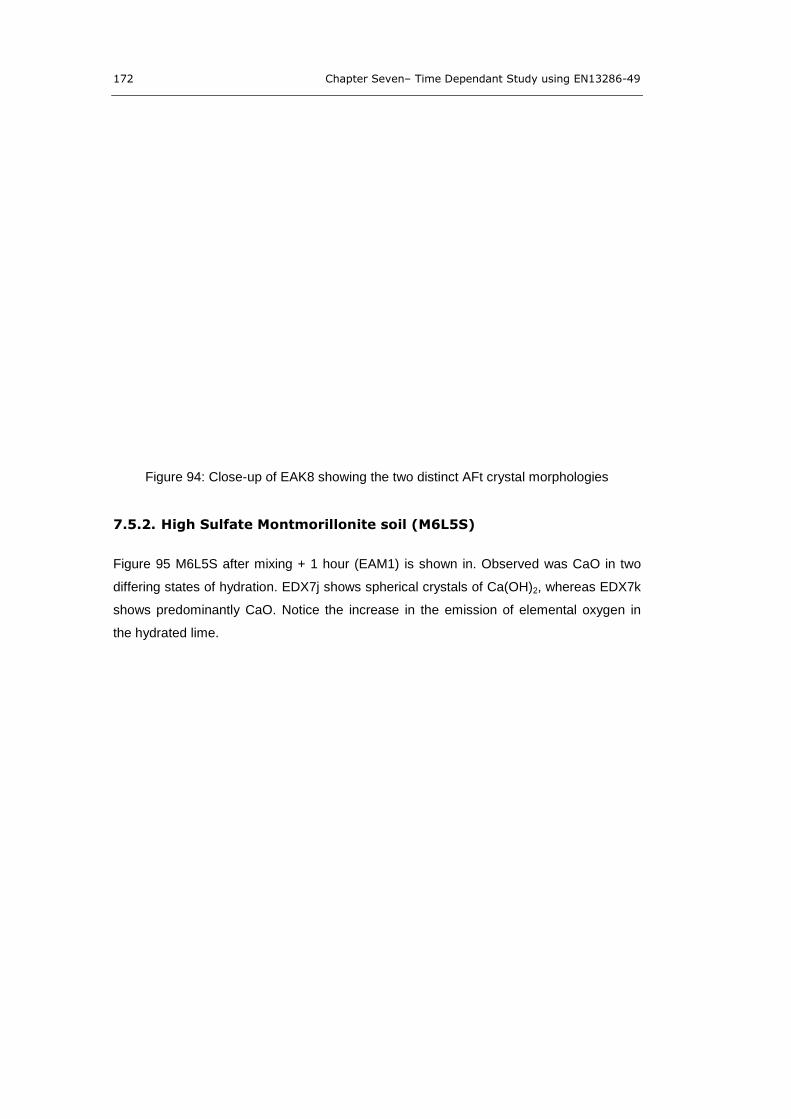
172 Chapter Seven– Time Dependant Study using EN13286-49
Figure 94: Close-up of EAK8 showing the two distinct AFt crystal morphologies
7.5.2. High Sulfate Montmorillonite soil (M6L5S)
Figure 95 M6L5S after mixing + 1 hour (EAM1) is shown in. Observed was CaO in two
differing states of hydration. EDX7j shows spherical crystals of Ca(OH)2, whereas EDX7k
shows predominantly CaO. Notice the increase in the emission of elemental oxygen in
the hydrated lime.
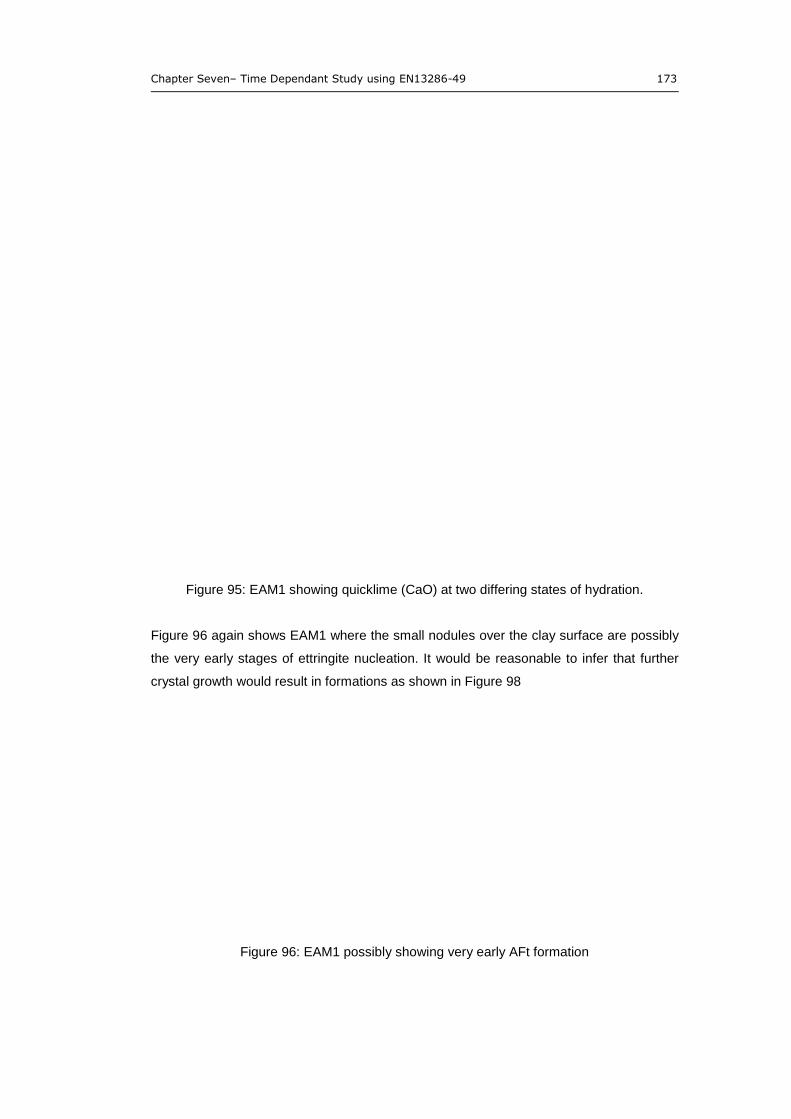
Chapter Seven– Time Dependant Study using EN13286-49 173
Figure 95: EAM1 showing quicklime (CaO) at two differing states of hydration.
Figure 96 again shows EAM1 where the small nodules over the clay surface are possibly
the very early stages of ettringite nucleation. It would be reasonable to infer that further
crystal growth would result in formations as shown in Figure 98
Figure 96: EAM1 possibly showing very early AFt formation

174 Chapter Seven– Time Dependant Study using EN13286-49
Figure 98 shows M6L5S after conditioning for 24 hours after mixing (EAM2) and as can
be seen from the SEM micrographs and EDX point analysis AFt formation is already
extensive. EDX8c also shows the AFt crystals to be rich in Si, possibly indicating
incorporation of silicon into the structure.
Figure 97: EAM2 showing quite extensive ettringite formation
Figure 98 shows EAM3 hydrated lime particles are shown in the top left micrograph
(circled), while a close-up on the top right shows a primitive Si-rich AFt phase. The
crystals are short and stubby but quite thick (ca. 1μm × 0.4μm)
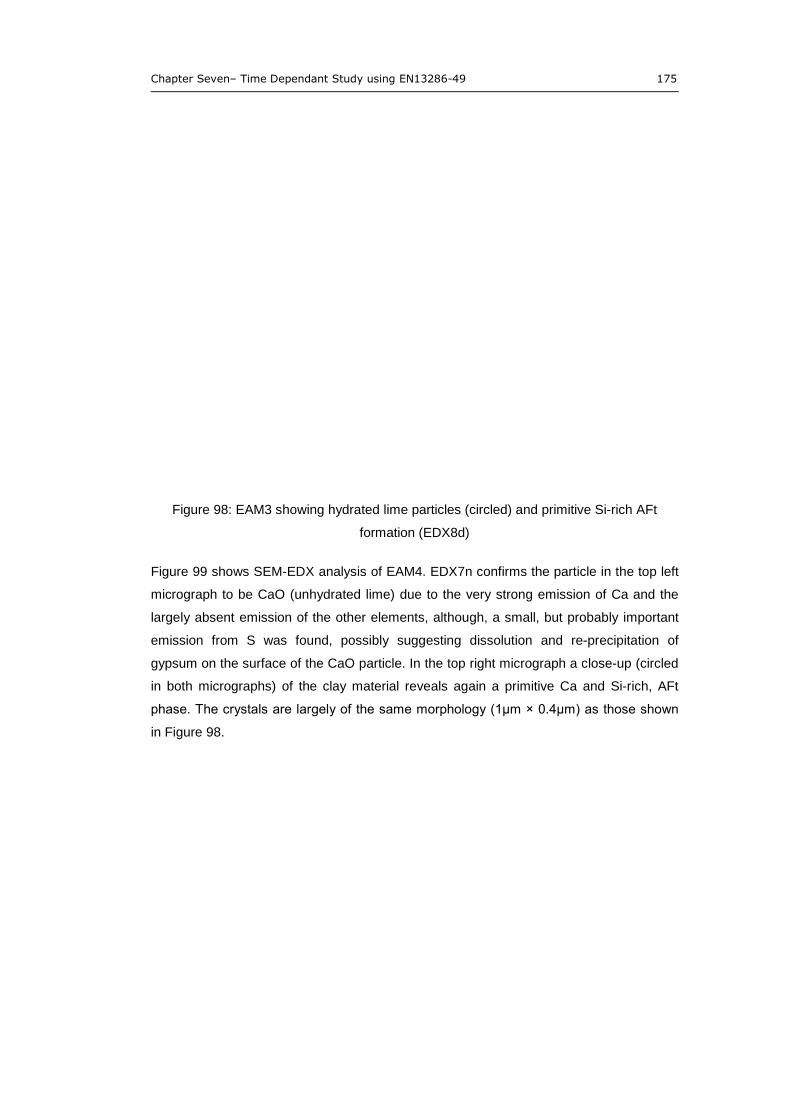
Chapter Seven– Time Dependant Study using EN13286-49 175
Figure 98: EAM3 showing hydrated lime particles (circled) and primitive Si-rich AFt
formation (EDX8d)
Figure 99 shows SEM-EDX analysis of EAM4. EDX7n confirms the particle in the top left
micrograph to be CaO (unhydrated lime) due to the very strong emission of Ca and the
largely absent emission of the other elements, although, a small, but probably important
emission from S was found, possibly suggesting dissolution and re-precipitation of
gypsum on the surface of the CaO particle. In the top right micrograph a close-up (circled
in both micrographs) of the clay material reveals again a primitive Ca and Si-rich, AFt
phase. The crystals are largely of the same morphology (1μm × 0.4μm) as those shown
in Figure 98.

176 Chapter Seven– Time Dependant Study using EN13286-49
Figure 99: EAM4 showing unhydrated lime particle (top left and EDX8e) and close-up
circled of primitive Si-rich AFt phase (top left and EDX8f)
Figure 100 shows the progress of AFt formation in the specimens EAM5 to EAM8
(Immersion + 24h to immersion + 14 days). The standout feature when comparing these
images is the appearance of discrete, relatively large clusters of AFt ettringite nuclei
originating from a central nucleation point (circled). This suggests the material images in
the micrographs may well have been part of the void structure of the original material and
the crystals were nucleated on the void walls and grew into the pore solution. No
discernable differences in the amount of AFt formed could be made out from the SEM-
EDX analysis alone. The development of ettringite crystals seemed to be as advanced at
EAM5 (immersion + 24h) as it was at EAM8 (immersion+14 days).

Chapter Seven– Time Dependant Study using EN13286-49 177
Figure 100: AFt formation in EAM5 to EAM8
178 Chapter Seven– Time Dependant Study using EN13286-49
7.6. DISCUSSION
The differing swell response of the two soils presented in Figure 77 is quite significant.
Not only in the degree of the volumetric increase (Gv(max) K4L5S – 42%; M6L5S – 15%)
but also the rate of expansion, given that the response of the kaolin soils was largely
linear and the montmorillonite curved.
As reported in Chapter Six, the deleterious volumetric swell can be attributed to the
formation of ettringite within the soil matrix and pore solution. The X-ray CT studies
showed that the damage to the specimens, observed as cracking of the soil matrix,
appeared to start at the surface of the specimen exposed to the immersion water and
propagate inwards. This supports the view of Puppala et al. (2005); Ouhadi and Yong
(2008); and Little et al. (2010) that water is a critical factor in AFt formation and its
mechanisms of damage. An extensive hydrogen bonding network, in which water is co-
ordinated within the AFt column structure, is critical in stabilising the column structures of
the ettringite molecule (Hartman and Berliner, 2005). The increase in the drained
specimen water contents over the duration of the test may also indicate an increasing
degree of AFt formation, although the greater proportion of the water would be retained in
the voids and microcracks that resulted from the swelling, as well as absorption by
unreacted clay particles.
Considering the low angle XRD studies, it is surprising that the principal [100] AFt peak at
ca. 9.1° 2θ could be detected in EAK2 (mixing + 24h), but was not found in the
montmorillonite until EAM5 (immersion+24h). The SEM-EDX studies reported in chapter
five showed that in the kaolin soils, the AFt crystals were very small and difficult to detect
by SEM, as they tended towards colloidal size, whereas in the montmorillonite based
soils, they were relatively large and well formed, resulting in a greater XRD reflection
response. It is suggested that the smaller ettringite crystal size, greater volumetric swell
response, coupled with earlier detection by XRD, is evidence of two differing mechanisms
of AFt formation at work, namely:
Topochemical formation and crystal swelling; and
Through-solution formation and anisotropic crystal growth.
The tendency for ettringite to be formed by one mechanism or the other is dictated by the
geochemical thermodynamics of the pore solution, which in turn is controlled by
physicochemical drivers such as the reduction in chemical potential; concentration;
activities; and diffusivity of the candidate ions (Gartner and Macphee, 2011).
Chapter Seven– Time Dependant Study using EN13286-49 179
Previous work has shown that the tendency of AFt in a cementitious system to form and
expand by one mechanism or the other is dictated by the hydroxide ion concentration
(written as [OHˉ] in chemistry notation) in the pore solution and its effect on the solubility
of the other candidate ions (Min and Tang, 1993; Wang et al. 2005).
The high sulfate soil mixtures for each clay were designed so that on mixing, both had an
equivalent available lime content (that is, lime not consumed by cation exchange
processes or trace organic components) of 2% and so an equivalent [OHˉ] on initial
blending of the soil (assuming complete hydration of CaO). The two clays would then
undergo ongoing cation exchange processes, but at differing rates (Drever, 1985) as the
CEC of a montmorilloinite is 8-15 times greater than that of a kaolin soil (see Table 5,
Chapter Three). It is suggested that this maintains a higher hydroxide concentration
within the pore solution of the kaolin which has been shown to promote AFt formation by
a topochemical mechanism in both cements and soils (Nakamura, 1968; Mehta, 1972;
Cohen, 1983; Deng and Tang, 1994; and Wang et al. 2005). Recalling Chapter Three
(Section 3.6.2), a high [OHˉ] reduces the [Ca2+
] and increases [SO42-
] and [Al(OH)4-] in the
pore solution (Deng and Tang, 1994). This results in the pore solution being
supersaturated with respect to AFt, leading to many nucleation sites at the solid-solution
interface. The formation of AFt is therefore rapid and results in numerous, but very small
ettringite crystals seemingly forming on the surface of the solid phase and is indicative of
a topochemical formation mechanism. Significant swelling is associated with small
ettringite crystals. The crystals of this colloidal gel-like ettringite have a high specific
surface area, so will tend to absorb ions and water molecules to decrease their surface
energy, creating an electric double layer (like a swelling clay) around the crystals (Mehta,
1973; Min and Tang, 1993). This is the principal behind the crystal swelling theory of AFt
expansion. It results in a large expansion per mol of ettringite, as shown for the kaolin
soils in Figure 77. SEM-EDX analysis of EAK5 (immersion+24h) in Figure 91 and Figure
92 showed regions of a calcium-rich sulfur bearing acicular crystal phase growing from
the surface of the parent clay which intersected with each other. It is suggested that this
is microscopic evidence of topochemical AFt formation and expansion by the crystal
swelling mechanism. These crystals are relatively abundant, yet the XRD AFt peak
intensity at ca. 9.1° 2θ was Imax = 23cps, was the lowest value measured for the series.
The difficulties in detection of colloidal ettringite are consistent with those encountered by
Wang et al. (2005) in their detection of colloidal AFt in Winn Rock Soils. Small ettringite
crystals were found in the kaolin soils up to seven days immersion (EAM7), but on
extended immersion to 14 days, much larger AFt crystals were found (EAK8, Figure 93).
These were up to 15μm in length and up to 0.7μm wide. The formation of these much
larger crystals corresponded with a drop in the pH (which is a function of [OHˉ]) and a
reduction in the Ca(OH)2 peak to below detectable limits in the dTGA (Figure 83). In fact
180 Chapter Seven– Time Dependant Study using EN13286-49
Ca(OH)2 could not be detected beyond EAK5, although sensitivity of dTGA has been
shown to be less than that of XRD and SEM in compositional analysis (Wang et al, 2005).
The formation of larger crystals is favoured when the [OHˉ] is low (Cohen, 1983; Deng
and Tang, 1994). Within the pore solution this results in lower mobility and hence lower
[SO42-
] and [Ca2+
]. As a result the [Al(OH)4ˉ] increases and can diffuse into the pore
solution before nucleation can occur and is not restricted to the solid-solution interface
zone. Few nuclei resulting from slow nucleation rates, grow into large crystals, in both the
pore solution and the solid-solution interface zone, and is characterised by the through-
solution mechanism of AFt formation (Deng and Tang, 1993; Tosun and Baradan, 2007,
Tosun and Baradan , 2010). The results from the analysis of the montmorillonite soils
support this. Imax of the AFt [100] from EAM5 onwards is much higher than any of the
values measured in the kaolin based soils (Table 37 and Table 38). In addition dTGA of
the soils (Figure 85) showed that the thermal event associated with dehydration event of
AFt occurred at an average temperature of 98°C, compared to 90°C in the kaolin soils. A
greater degree of crystalline order has been shown to increase the temperature that an
equivalent thermal event occurs (Guggenhien and van Groos, 2001) and could be
ascribed to the formation of larger crystals.
It would be expected that larger well formed AFt crystals would give rise to higher
diffraction intensities compared to colloidal sized ettringite. Although why no AFt peak
could be measured in soils of earlier ages (EAM1-EAM4) is not clear. SEM-EDX analysis
of EAM2 (Figure 98) showed abundant and well developed AFt crystals. Clusters of quite
large AFt crystals growing from a central nucleation point that were found in EAM6 –
EAM8 (left micrographs in Figure 98) also suggest a slower rate of crystal growth (due to
their size). Given that these are still intact and not embedded within the bulk clay, may be
evidence that the AFt formed within a pore void from a saturated pore solution, with
points on the void structure walls acting as nucleation sites, again suggestive of a
through-solution mechanism of formation (Soroka, 1979). Despite extensive AFt
formation, which appears to be greater than that found in the kaolin based clays, the
overall volumetric swell of the montmorillonite based soils was more than 50% less. It is
generally accepted that when AFt forms by the through-solution mechanism, the overall
expansion is less (Kalousek and Benton, 1970; Soroka, 1979; Dermatas et al. 1995; Little
et a., 2010). This is because the candidate ions for AFt formation can migrate into and
form ettringite in the void spaces. Also the larger crystals have a greater specific surface
area and thereby small surface energy. Hence, they do not absorb ion and water
molecules to the same degree as colloidal ettringite. As such, expansion by crystal
swelling is not as significant.
Chapter Seven– Time Dependant Study using EN13286-49 181
It has been shown that [OHˉ] affects the dissolution rate of alumina into the pore solution,
and thereby the mechanism of AFt formation and expansion. But the rate of alumina
dissolution and its subsequent concentration in the pore solution is also affected by the
fundamental structure of the clay itself, because Al sites are more reactive than those
occupied by Si. Bauer and Berger (1997) in their studies of Kaolinite and Smectite
dissolution rates in KOH solution, suggested that in the montmorillonite, each aluminous
octahedral layer is bonded to two silica rich tetrahedral layers. So their exposure to the
pore solution is limited to the particle edges, until the tetrahedral layers are dissolved. It
follows that given the negligible effect of the edges, compared to the surfaces of the basal
planes, the hydrolysis of the octahedral and tetrahedral layer would proceed as a serial
reaction, with the overall dissolution rate controlled by the slower step, namely, the
dissolution of the tetrahedral layer, given that the strength of the bonds between Si and O
(Si—O) are higher than those of Al and O (Al—O) (Mantovani et al. 2009). In contrast,
the kaolinite clay has a 1:1 sheet structure of an aluminous octahedral layer bonded to a
silica rich tetrahedral layer. As such, more reactive Al sites are exposed to the pore
solution. Bauer and Berger (1997) found dissolution rates for kaolinite to be one or two
orders of magnitude higher than for smectitie (the clay group to which montmorillonite
belongs).
It follows that when all other conditions are equal, the rate of alumina dissolution and
equilibrium concentration within the pore solution will be higher for the kaolin clays than
the montmorillonites. Super-saturation of the pore solution with respect to ettringite will
occur more rapidly, leading to formation of colloidal size AFt crystals at the solid-solution
interface zone. This further supports the experimental evidence for a topochemical
ettringite formation and crystal swelling mechanism in kaolin based soils, as opposed to a
through-solution and crystal growth mechanism for montmorillonite based soils.
Given the critical role [OH¯] has on the formation, morphology and expansion of ettringite,
in hindsight, it would be been valuable to quantify the hydroxide concentration in each soil
mix. This could have been achieved by liberating the pore solution by pressure filtration,
then titrating this against HCl using phenlyphaline as indicator. Or by pH measurement,
with the pH meter calibrated against a range of KOH solutions as reported by Winnefield
and Lothenbach (2010).
7.7. SUMMARY
The series of high sulfate soils derived from each clay (K4L5S and M6L5S) were used in
a time dependent interval study with the European accelerated volumetric swell test
182 Chapter Seven– Time Dependant Study using EN13286-49
(EN13286-49). Samples (prior to specimen compaction) and specimens were taken at
defined intervals and subject to microscopic and phase composition analysis.
The results show that the kaolin based clays exhibit a greater deleterious swell response
than the montmorillonites for the equivalent sulfate content. XRD, dTGA and SEM-EDX
analysis found that the ettringite crystals in the kaolin soils were very small and difficult to
detect which suggests it preferentially forms and expands by a topochemical and crystal
swelling mechanism, whereas the ettringite crystals formed in the montmorillonite soil
series were comparatively very large suggesting formation by a through-solution and
crystal growth mechanism. Previous work has shown that the propensity of a
cementitious system to form ettringite by one mechanism or the other is dictated by the
hydroxide ion [OHˉ] concentration in the pore solution:
High [OHˉ] – topochemical and crystal swelling; and
Low [OHˉ] – throughsolution and crystal growth.
It is suggested that the much higher cation exchange capacity of the montmorillonite
based clay soils results in lower [OHˉ] in the pore solution compared to the kaolins where
the CEC is lower and results in the maintenance of a much higher [OHˉ]. The appearance
of much larger ettringite morphologies in the kaolin soils on extended immersion
corresponded to a drop in soil pH (and hence [OHˉ]) and further supports the view that
hydroxide ion concentration of the pore solution within the cementitious matrix affects the
mechanistic pathway of AFt formation and expansion. In addition to this, the differing
rates of alumna dissolution (as a function of the fundamental clay structure), also
reinforce the effect of the CEC process.
Chapter Eight– Macrophysical, Microstructural and Chemical Relationships 183
8. MACROPHYSICAL, MICROSTRUCTURAL AND
CHEMICAL RELATIONSHIPS
8.1. INTRODUCTION
This chapter brings together the results of the macro-physical testing reported in Chapter
Five and that of the phase composition and microstructural analysis of Chapter Six and
Seven. An assessment of the repeatability of the measurement of Imax of the principle AFt
peak, as reported in Chapter Six, has been made. This was compared to the same
measurement taken from a synthetic ettringite standard, in an attempt to quantify AFt
formation in the soils, using relative intensity measurements. The relationship between
ettringite formation and sulfate heave is explored by plotting the heave as a function of
sulfate content in comparison to work undertaken by Little et al. (2010).
8.2. ETTRINGITE QUANTIFICATION
The quantification of ettringite is generally regarded as very difficult. Its peculiar crystal
structure means that by XRD, the measured peak intensity highly dependent on particle
orientation effects. Its ability to absorb water also makes any quantification by thermal
analysis unreliable (as previously discussed in Chapter Six). Quoting Scrivener et al.
(2004), “there is no good independent method for quantifying ettringite”. Many workers
have also reported that they were unable to detect AFt at low concentrations with the
analytical techniques used in this work (Berinier et al, 1999). In addition, poorly
crystallised and amorphous type ettringite further contributes to the problem (Matos et al,
2010), particularly for XRD (Taylor et al, 2001).
In spite of this, an attempt was made to quantify the ettringite formed in the stabilised
soils using a synthetic ettringite produced in the laboratory. The details of its preparation
and analysis by XRD, SEM-EDX and dTGA are presented in Appendix B.
This ettringite ‘standard’ was used to provide reference data for comparison with that
taken from the test soils, in particular, for analysis with the results of the low angle XRD
studies. The ettringite sample was carefully ground with a pestle and mortar in an attempt
to achieve small particle size and minimise the effects of preferred particle orientation. It
was then run on the D500-1 XRD using the low angle programme, as per those reported
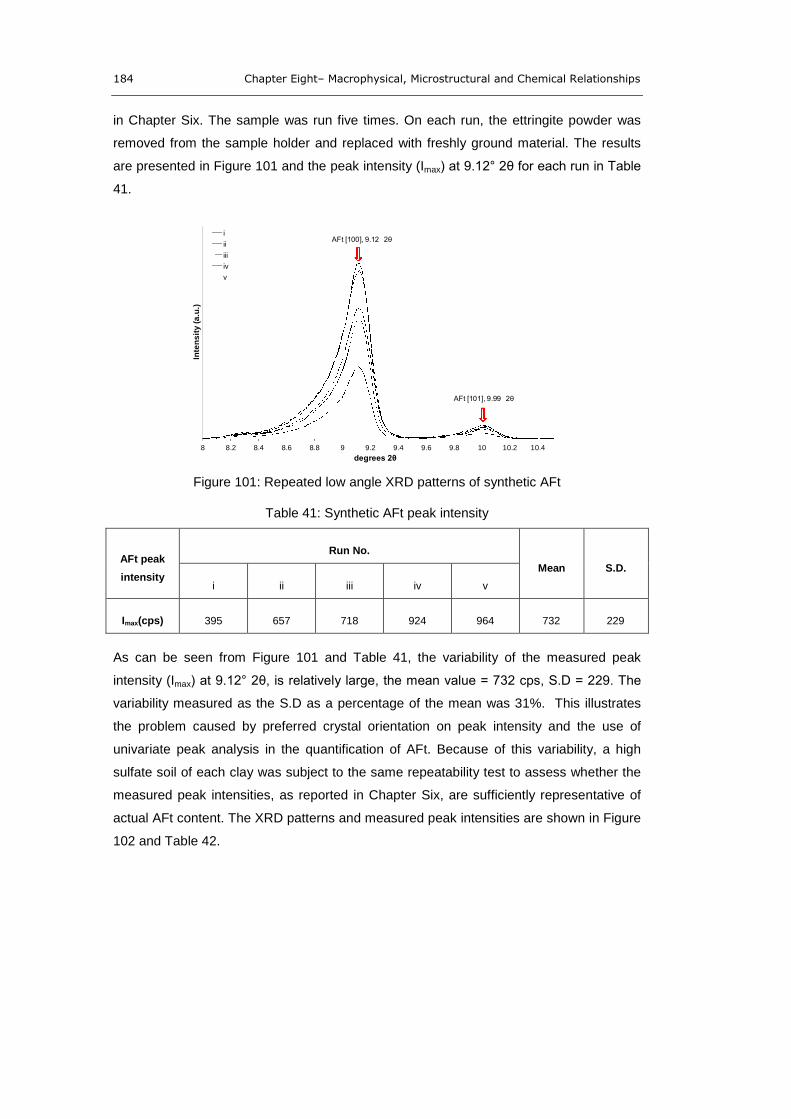
184 Chapter Eight– Macrophysical, Microstructural and Chemical Relationships
in Chapter Six. The sample was run five times. On each run, the ettringite powder was
removed from the sample holder and replaced with freshly ground material. The results
are presented in Figure 101 and the peak intensity (Imax) at 9.12° 2θ for each run in Table
41.
Figure 101: Repeated low angle XRD patterns of synthetic AFt
Table 41: Synthetic AFt peak intensity
AFt peak
intensity
Run No.
Mean S.D.
i ii iii iv v
Imax(cps) 395 657 718 924 964 732 229
As can be seen from Figure 101 and Table 41, the variability of the measured peak
intensity (Imax) at 9.12° 2θ, is relatively large, the mean value = 732 cps, S.D = 229. The
variability measured as the S.D as a percentage of the mean was 31%. This illustrates
the problem caused by preferred crystal orientation on peak intensity and the use of
univariate peak analysis in the quantification of AFt. Because of this variability, a high
sulfate soil of each clay was subject to the same repeatability test to assess whether the
measured peak intensities, as reported in Chapter Six, are sufficiently representative of
actual AFt content. The XRD patterns and measured peak intensities are shown in Figure
102 and Table 42.
8 8.2 8.4 8.6 8.8 9 9.2 9.4 9.6 9.8 10 10.2 10.4
Inte
ns
ity
(a.u
.)
degrees 2θ
i
ii
iii
iv
v
AFt [100], 9.12 2θ
AFt [101], 9.99 2θ
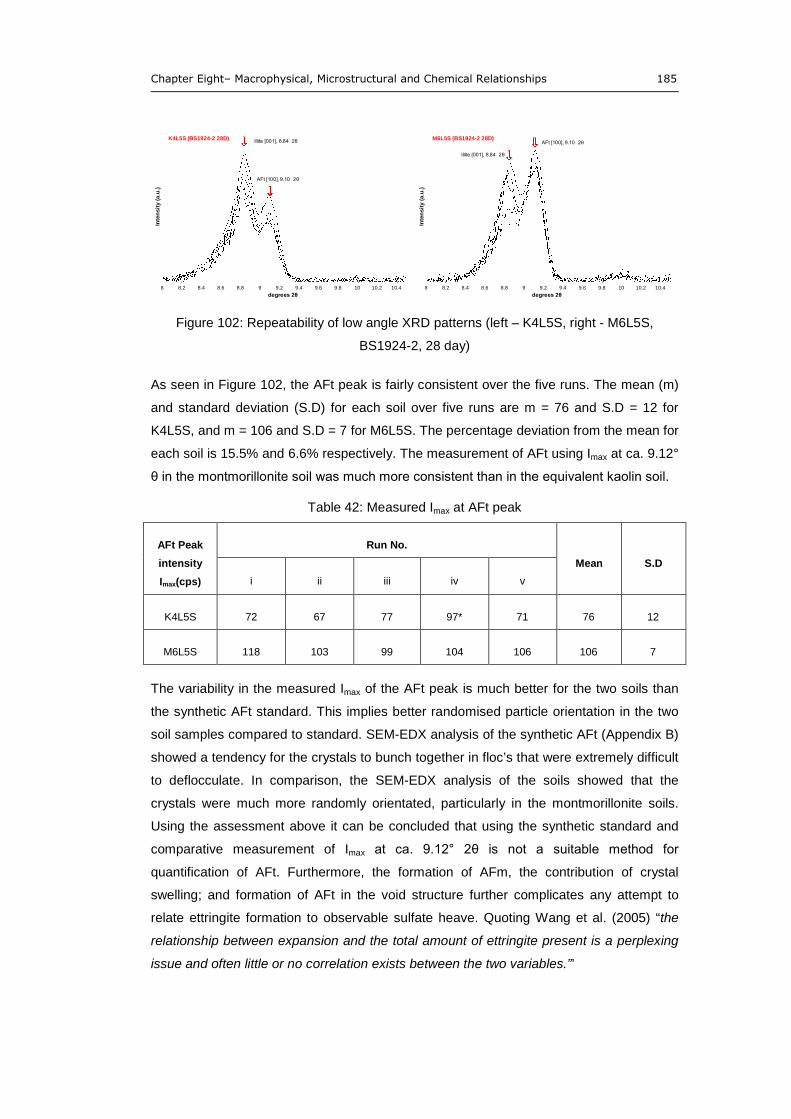
Chapter Eight– Macrophysical, Microstructural and Chemical Relationships 185
Figure 102: Repeatability of low angle XRD patterns (left – K4L5S, right - M6L5S,
BS1924-2, 28 day)
As seen in Figure 102, the AFt peak is fairly consistent over the five runs. The mean (m)
and standard deviation (S.D) for each soil over five runs are m = 76 and S.D = 12 for
K4L5S, and m = 106 and S.D = 7 for M6L5S. The percentage deviation from the mean for
each soil is 15.5% and 6.6% respectively. The measurement of AFt using Imax at ca. 9.12°
θ in the montmorillonite soil was much more consistent than in the equivalent kaolin soil.
Table 42: Measured Imax at AFt peak
AFt Peak
intensity
Imax(cps)
Run No.
Mean S.D
i ii iii iv v
K4L5S 72 67 77 97* 71 76 12
M6L5S 118 103 99 104 106 106 7
The variability in the measured Imax of the AFt peak is much better for the two soils than
the synthetic AFt standard. This implies better randomised particle orientation in the two
soil samples compared to standard. SEM-EDX analysis of the synthetic AFt (Appendix B)
showed a tendency for the crystals to bunch together in floc’s that were extremely difficult
to deflocculate. In comparison, the SEM-EDX analysis of the soils showed that the
crystals were much more randomly orientated, particularly in the montmorillonite soils.
Using the assessment above it can be concluded that using the synthetic standard and
comparative measurement of Imax at ca. 9.12° 2θ is not a suitable method for
quantification of AFt. Furthermore, the formation of AFm, the contribution of crystal
swelling; and formation of AFt in the void structure further complicates any attempt to
relate ettringite formation to observable sulfate heave. Quoting Wang et al. (2005) “the
relationship between expansion and the total amount of ettringite present is a perplexing
issue and often little or no correlation exists between the two variables.”’
8 8.2 8.4 8.6 8.8 9 9.2 9.4 9.6 9.8 10 10.2 10.4
Inte
ns
ity
(a.u
.)
degrees 2θ
AFt [100], 9.10 2θ
Illite [001], 8.84 2θK4L5S (BS1924-2 28D)
8 8.2 8.4 8.6 8.8 9 9.2 9.4 9.6 9.8 10 10.2 10.4
Inte
ns
ity
(a.u
.)
degrees 2θ
AFt [100], 9.10 2θ
Illite [001], 8.84 2θ
M6L5S (BS1924-2 28D)
186 Chapter Eight– Macrophysical, Microstructural and Chemical Relationships
8.3. ETTRINGITE INDUCED HEAVE AND SOIL SULAFTE CONTENT
Given the problem described above, a simpler analysis was attempted by plotting
volumetric increases (associated with sulfate induced heave as reported in Chapter Five),
as a function of absolute sulfate content. This value can be determined accurately, the
purity of the mined gypsum used has been determined by XRF and dTGA, with the
weight added to each blend known.
Little et al (2010) used stochiometric calculations and molar volumes to determine the
maximum amount of ettringite that can be formed from a given amount of sulfate, making
the assumption that the total water required was derived from an external source, i.e. not
from the initial mixing water on compaction. The chemical equation (8a) used was the
reaction of the cement clinker component, tricalcium aluminate, with gypsum to form
ettringite (written here using cement nomenclature):
(8a) C3A + 3CS̄H2 + 26H → C6AS̄3H32
where: C3A is tricalicum aluminate, 3CS̄H2 is gypsum, and H is water
When this calculation is performed for a series of sulfate contents a linear plot of
theoretical ettringite volumetric expansion is derived, based on the sum of the molar
volume of the products (in this case soil ettringite) minus the molar volume of the
reactants. It is based on the assumption that the entire sulfate reacts to completion and
forms ettringite; that all ettringite formed contributes to expansion; and that the water is
from an external source. This is, not taken into account in the molar volume calculations
of the reactants in equation 8a.
8.3.1. UK linear CBR swell test
The results of the UK linear CBR swell tests for the kaolin based soils are plotted as a
function of absolute sulfate content (as SO4) determined by differential TGA and XRF
(see Appendix A) in Figure 103. The results are plotted against the theoretical maximum
expansion calculated by Little et al. (2010) and adjusted so that it could be plotted against
a linear rather than a volumetric swell.
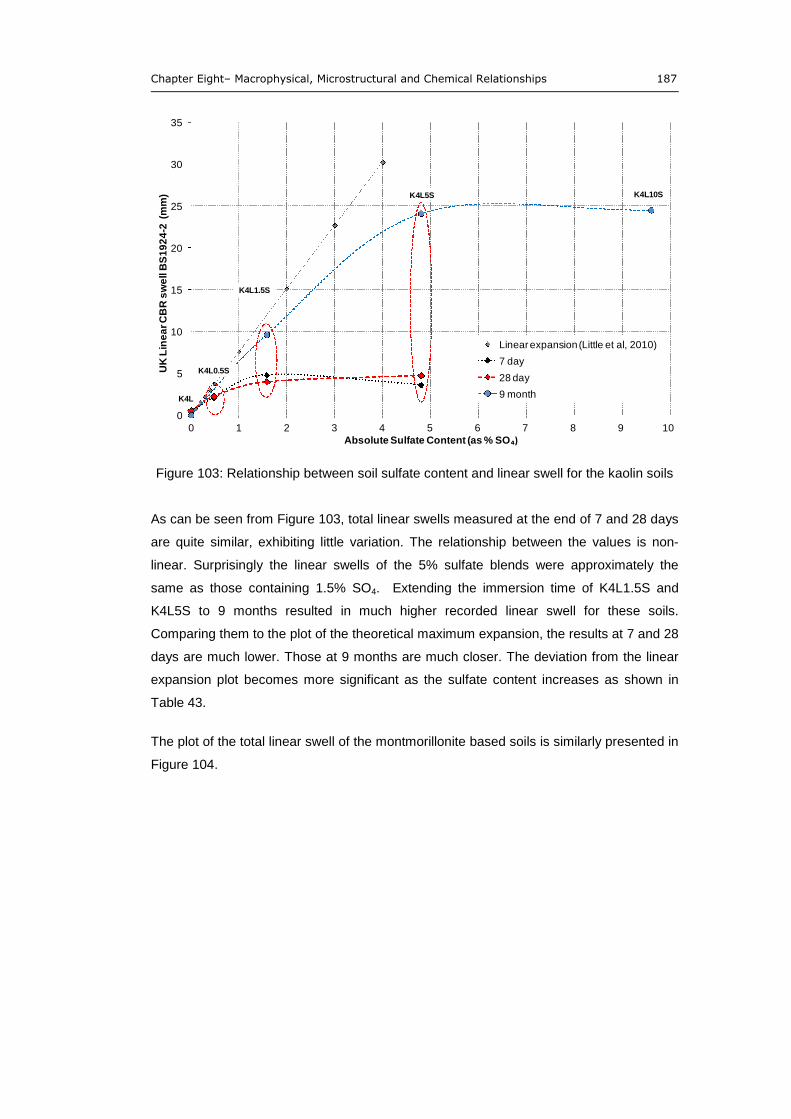
Chapter Eight– Macrophysical, Microstructural and Chemical Relationships 187
Figure 103: Relationship between soil sulfate content and linear swell for the kaolin soils
As can be seen from Figure 103, total linear swells measured at the end of 7 and 28 days
are quite similar, exhibiting little variation. The relationship between the values is non-
linear. Surprisingly the linear swells of the 5% sulfate blends were approximately the
same as those containing 1.5% SO4. Extending the immersion time of K4L1.5S and
K4L5S to 9 months resulted in much higher recorded linear swell for these soils.
Comparing them to the plot of the theoretical maximum expansion, the results at 7 and 28
days are much lower. Those at 9 months are much closer. The deviation from the linear
expansion plot becomes more significant as the sulfate content increases as shown in
Table 43.
The plot of the total linear swell of the montmorillonite based soils is similarly presented in
Figure 104.
0
5
10
15
20
25
30
35
0 1 2 3 4 5 6 7 8 9 10
UK
Lin
ea
rC
BR
sw
ell
BS
19
24
-2(m
m)
Absolute Sulfate Content (as % SO₄)
Linearexpansion (Little et al, 2010)
7 day
28 day
9 monthK4L
K4L10SK4L5S
K4L1.5S
K4L0.5S
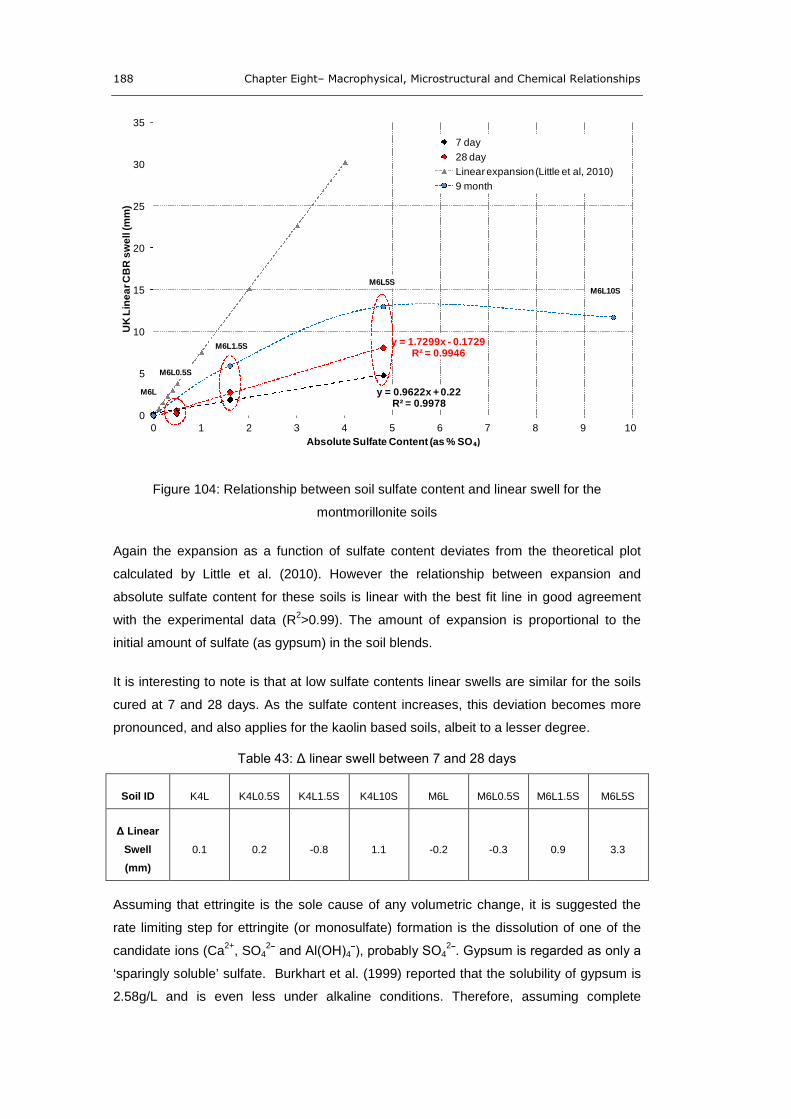
188 Chapter Eight– Macrophysical, Microstructural and Chemical Relationships
Figure 104: Relationship between soil sulfate content and linear swell for the
montmorillonite soils
Again the expansion as a function of sulfate content deviates from the theoretical plot
calculated by Little et al. (2010). However the relationship between expansion and
absolute sulfate content for these soils is linear with the best fit line in good agreement
with the experimental data (R2>0.99). The amount of expansion is proportional to the
initial amount of sulfate (as gypsum) in the soil blends.
It is interesting to note is that at low sulfate contents linear swells are similar for the soils
cured at 7 and 28 days. As the sulfate content increases, this deviation becomes more
pronounced, and also applies for the kaolin based soils, albeit to a lesser degree.
Table 43: Δ linear swell between 7 and 28 days
Soil ID K4L K4L0.5S K4L1.5S K4L10S M6L M6L0.5S M6L1.5S M6L5S
Δ Linear
Swell
(mm)
0.1 0.2 -0.8 1.1 -0.2 -0.3 0.9 3.3
Assuming that ettringite is the sole cause of any volumetric change, it is suggested the
rate limiting step for ettringite (or monosulfate) formation is the dissolution of one of the
candidate ions (Ca2+
, SO42ˉ and Al(OH)4ˉ), probably SO4
2ˉ. Gypsum is regarded as only a
‘sparingly soluble’ sulfate. Burkhart et al. (1999) reported that the solubility of gypsum is
2.58g/L and is even less under alkaline conditions. Therefore, assuming complete
y = 0.9622x + 0.22R² = 0.9978
y = 1.7299x - 0.1729R² = 0.9946
0
5
10
15
20
25
30
35
0 1 2 3 4 5 6 7 8 9 10
UK
Lin
ea
rC
BR
sw
ell
(mm
)
Absolute Sulfate Content (as % SO₄)
7 day
28 day
Linearexpansion (Little et al, 2010)
9 month
M6L
M6L0.5S
M6L1.5S
M6L5SM6L10S
Chapter Eight– Macrophysical, Microstructural and Chemical Relationships 189
saturation of the CBR specimens, less than 2.58g/L of the gypsum can be in solution at
any one time and available to form deleterious phases. It so follows that the rate of
ettringite formation is then limited by the solubility of the sulfate phase. The amount of this
in the soil above 0.26% does not affect the rate of ettringite formation or expansion
(assuming all AFt formation does contribute to expansion), but provides a continuous
source of sulfates. This explains why the deviation between the 7 and 28 day expansions
exists and increases for the soils with higher sulfate content. As the period of immersion
increases, more ettringite can form and the degree of expansion increases. Notice that in
both Figure 103 and Figure 104 extension of the curing to 9 months results in sulfate
heaves that are much closer to the theoretical, indicative of a more complete reaction of
the initial sulfate phase. It was suggested that expansion only subsided when the calcium
hydroxide was consumed, as measured by a drop in soil pH. This would also have
affected the stability of ettringite itself. At pH < 11.5, AFt is unstable and decomposes to
gypsum (Neville, 2004). Other authors detected ettringite at pHs lower than this (Damidot
and Glasser, 1992), but it would be prudent to consider it only metastable in those cases.
Indeed, in this work, ettringite was found in the long-term immersed CBR specimens
(Chapter Six) as well as those subject to extended immersion (14 days) in the interval
study (Chapter Seven), despite measured pHs being in the region of pH 9.5. This also
explains why the very high sulfate containing soils (K4L10S and M6L10S) did not expand
as much as expected. The binder was consumed before the entire sulfate could react to
form ettringite. This consumption would not only be associated with ettringite formation,
but also cation exchange processes and the formation of other pozzolanic hydration
products.
The deviation of the expansion from the theoretical line proposed by Little et al. (2010)
can also be attributed to a number of other factors. The assumption is made by Little et
al., that all ettringite produced contributes to expansion. X-ray CT analysis of the test
specimens taken from the start of the interval study (Chapter Seven) showed that the
specimens are quite porous and contain an extensive void structure. Given that the
densities of the CBR specimens were roughly equivalent, it is fair to assume that they too,
also have a similar void structure. Expansion only occurs when regions of crystal growth
intersect and repel each other, irrespective of the mechanism of formation and expansion.
So in the soils tested here, not all of the ettringite formed would contribute to expansion
assuming a proportion formed in the void structure. This would reduce the overall
expansion dependent on how many regions of crystal growth intersect and repel.
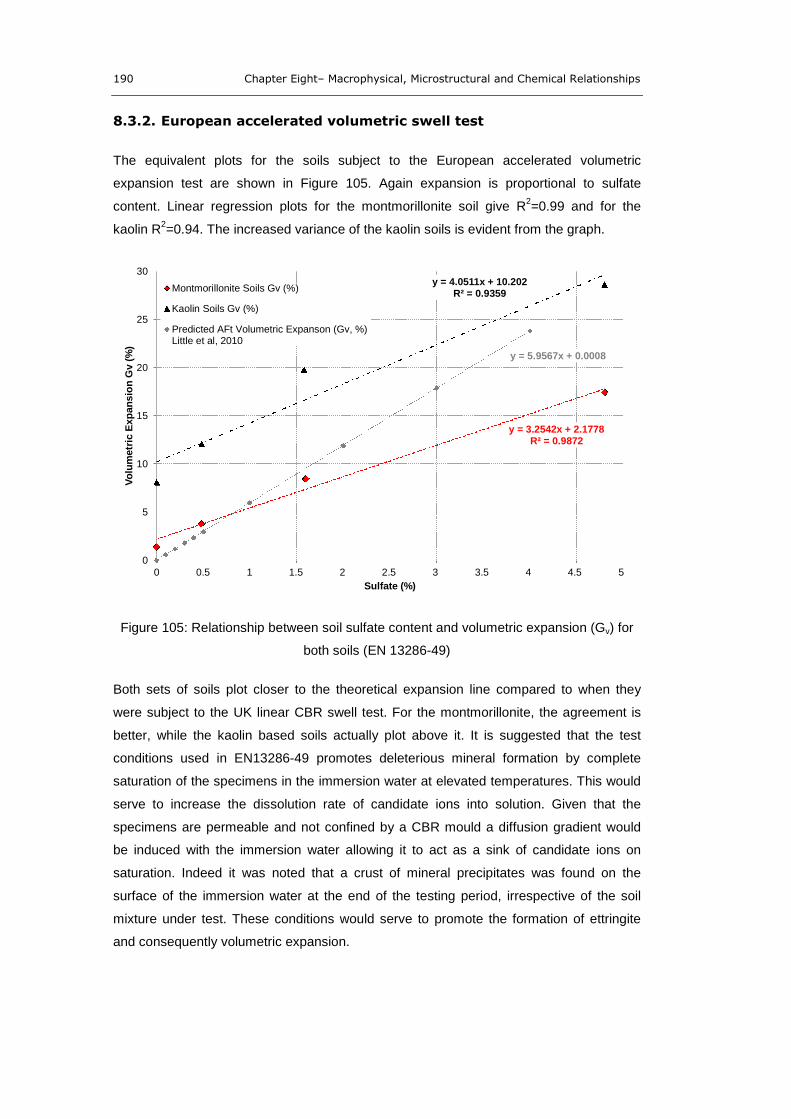
190 Chapter Eight– Macrophysical, Microstructural and Chemical Relationships
8.3.2. European accelerated volumetric swell test
The equivalent plots for the soils subject to the European accelerated volumetric
expansion test are shown in Figure 105. Again expansion is proportional to sulfate
content. Linear regression plots for the montmorillonite soil give R2=0.99 and for the
kaolin R2=0.94. The increased variance of the kaolin soils is evident from the graph.
Figure 105: Relationship between soil sulfate content and volumetric expansion (Gv) for
both soils (EN 13286-49)
Both sets of soils plot closer to the theoretical expansion line compared to when they
were subject to the UK linear CBR swell test. For the montmorillonite, the agreement is
better, while the kaolin based soils actually plot above it. It is suggested that the test
conditions used in EN13286-49 promotes deleterious mineral formation by complete
saturation of the specimens in the immersion water at elevated temperatures. This would
serve to increase the dissolution rate of candidate ions into solution. Given that the
specimens are permeable and not confined by a CBR mould a diffusion gradient would
be induced with the immersion water allowing it to act as a sink of candidate ions on
saturation. Indeed it was noted that a crust of mineral precipitates was found on the
surface of the immersion water at the end of the testing period, irrespective of the soil
mixture under test. These conditions would serve to promote the formation of ettringite
and consequently volumetric expansion.
y = 3.2542x + 2.1778R² = 0.9872
y = 4.0511x + 10.202R² = 0.9359
y = 5.9567x + 0.0008
0
5
10
15
20
25
30
0 0.5 1 1.5 2 2.5 3 3.5 4 4.5 5
Vo
lum
etr
icE
xp
an
sio
nG
v(%
)
Sulfate (%)
Montmorillonite Soils Gv (%)
Kaolin Soils Gv (%)
Predicted AFt Volumetric Expanson (Gv, %)Little et al, 2010
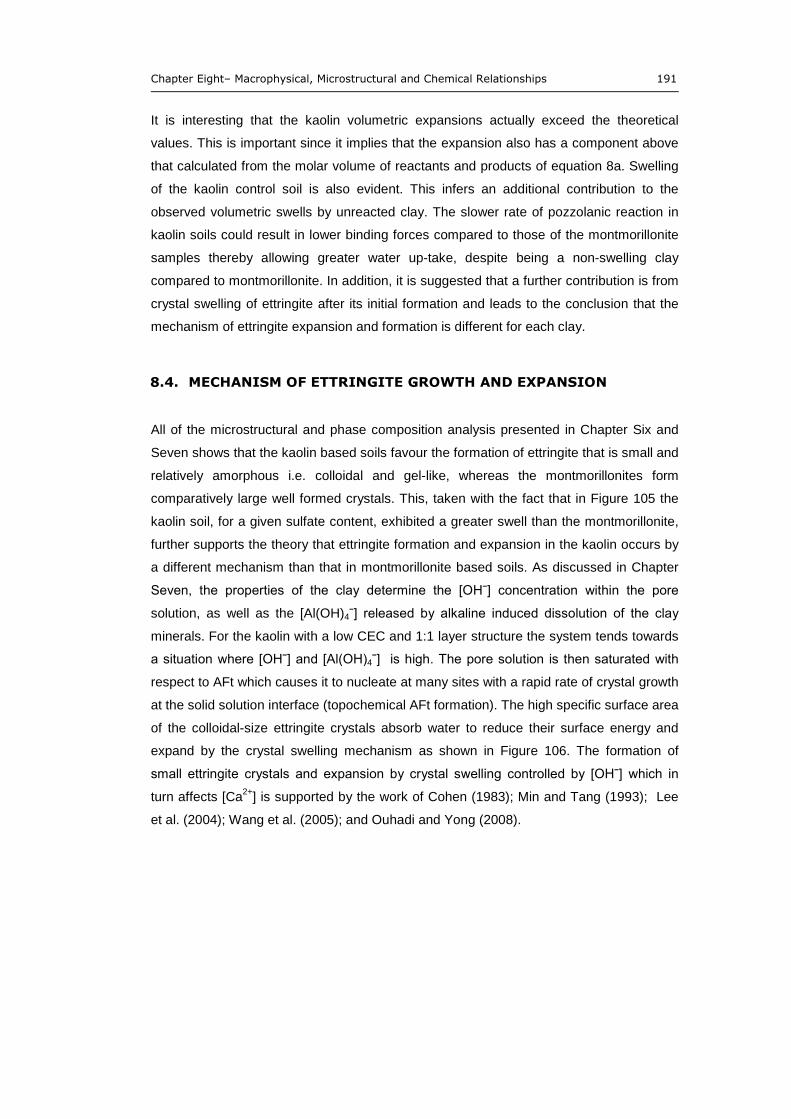
Chapter Eight– Macrophysical, Microstructural and Chemical Relationships 191
It is interesting that the kaolin volumetric expansions actually exceed the theoretical
values. This is important since it implies that the expansion also has a component above
that calculated from the molar volume of reactants and products of equation 8a. Swelling
of the kaolin control soil is also evident. This infers an additional contribution to the
observed volumetric swells by unreacted clay. The slower rate of pozzolanic reaction in
kaolin soils could result in lower binding forces compared to those of the montmorillonite
samples thereby allowing greater water up-take, despite being a non-swelling clay
compared to montmorillonite. In addition, it is suggested that a further contribution is from
crystal swelling of ettringite after its initial formation and leads to the conclusion that the
mechanism of ettringite expansion and formation is different for each clay.
8.4. MECHANISM OF ETTRINGITE GROWTH AND EXPANSION
All of the microstructural and phase composition analysis presented in Chapter Six and
Seven shows that the kaolin based soils favour the formation of ettringite that is small and
relatively amorphous i.e. colloidal and gel-like, whereas the montmorillonites form
comparatively large well formed crystals. This, taken with the fact that in Figure 105 the
kaolin soil, for a given sulfate content, exhibited a greater swell than the montmorillonite,
further supports the theory that ettringite formation and expansion in the kaolin occurs by
a different mechanism than that in montmorillonite based soils. As discussed in Chapter
Seven, the properties of the clay determine the [OHˉ] concentration within the pore
solution, as well as the [Al(OH)4ˉ] released by alkaline induced dissolution of the clay
minerals. For the kaolin with a low CEC and 1:1 layer structure the system tends towards
a situation where [OHˉ] and [Al(OH)4ˉ] is high. The pore solution is then saturated with
respect to AFt which causes it to nucleate at many sites with a rapid rate of crystal growth
at the solid solution interface (topochemical AFt formation). The high specific surface area
of the colloidal-size ettringite crystals absorb water to reduce their surface energy and
expand by the crystal swelling mechanism as shown in Figure 106. The formation of
small ettringite crystals and expansion by crystal swelling controlled by [OHˉ] which in
turn affects [Ca2+
] is supported by the work of Cohen (1983); Min and Tang (1993); Lee
et al. (2004); Wang et al. (2005); and Ouhadi and Yong (2008).
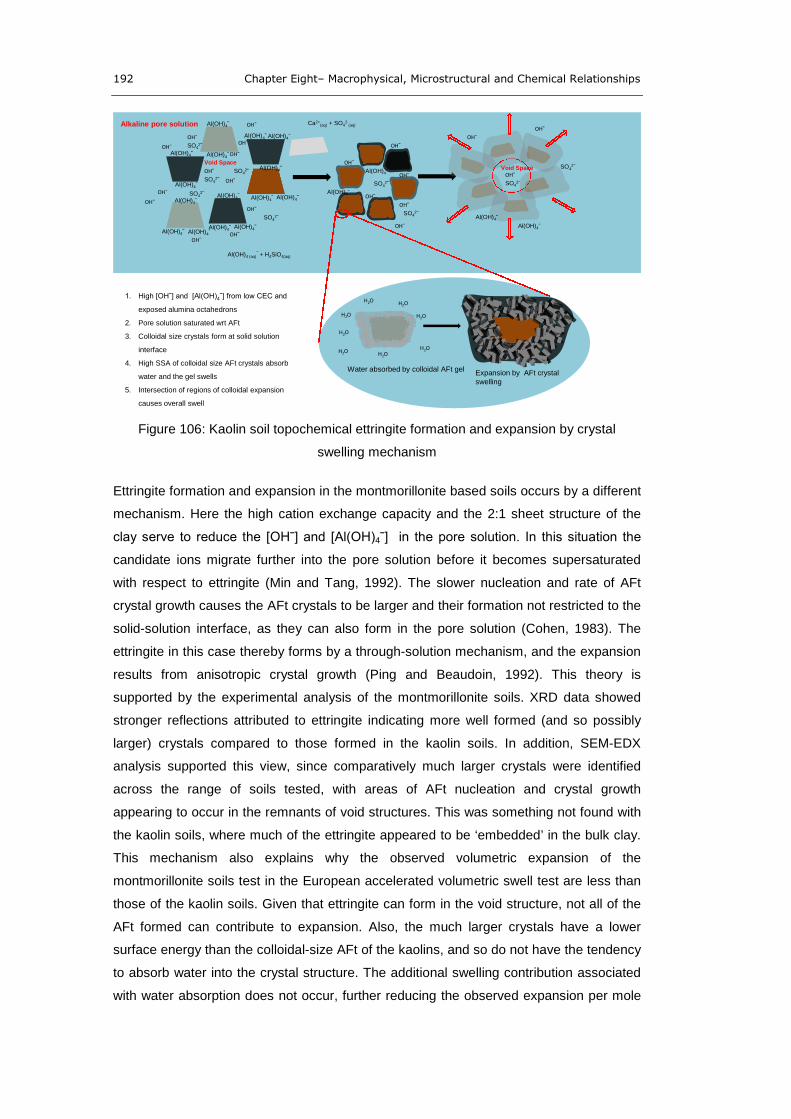
192 Chapter Eight– Macrophysical, Microstructural and Chemical Relationships
Figure 106: Kaolin soil topochemical ettringite formation and expansion by crystal
swelling mechanism
Ettringite formation and expansion in the montmorillonite based soils occurs by a different
mechanism. Here the high cation exchange capacity and the 2:1 sheet structure of the
clay serve to reduce the [OHˉ] and [Al(OH)4ˉ] in the pore solution. In this situation the
candidate ions migrate further into the pore solution before it becomes supersaturated
with respect to ettringite (Min and Tang, 1992). The slower nucleation and rate of AFt
crystal growth causes the AFt crystals to be larger and their formation not restricted to the
solid-solution interface, as they can also form in the pore solution (Cohen, 1983). The
ettringite in this case thereby forms by a through-solution mechanism, and the expansion
results from anisotropic crystal growth (Ping and Beaudoin, 1992). This theory is
supported by the experimental analysis of the montmorillonite soils. XRD data showed
stronger reflections attributed to ettringite indicating more well formed (and so possibly
larger) crystals compared to those formed in the kaolin soils. In addition, SEM-EDX
analysis supported this view, since comparatively much larger crystals were identified
across the range of soils tested, with areas of AFt nucleation and crystal growth
appearing to occur in the remnants of void structures. This was something not found with
the kaolin soils, where much of the ettringite appeared to be ‘embedded’ in the bulk clay.
This mechanism also explains why the observed volumetric expansion of the
montmorillonite soils test in the European accelerated volumetric swell test are less than
those of the kaolin soils. Given that ettringite can form in the void structure, not all of the
AFt formed can contribute to expansion. Also, the much larger crystals have a lower
surface energy than the colloidal-size AFt of the kaolins, and so do not have the tendency
to absorb water into the crystal structure. The additional swelling contribution associated
with water absorption does not occur, further reducing the observed expansion per mole
OHˉ
OHˉ
OHˉ
OHˉ
OHˉOHˉ
OHˉ
Al(OH)4ˉ
Void Space
OHˉ
OHˉ
OHˉOHˉ
OHˉ Ca2+(aq) + SO4
2-(aq)
Al(OH)4 (aq)¯ + H4SiO4(aq)
Al(OH)4ˉ
Al(OH)4ˉ
Al(OH)4ˉ Al(OH)4ˉ
Al(OH)4ˉ
Al(OH)4ˉ
Al(OH)4ˉ
Al(OH)4ˉ
H2O
H2O
H2O
H2O
H2O
Water absorbed by colloidal AFt gel Expansion by AFt crystalswelling
OHˉ
OHˉ
OHˉ
OHˉ
OHˉ
OHˉ
Al(OH)4ˉ
Al(OH)4ˉ
Al(OH)4ˉSO4
2ˉ
Al(OH)4ˉAl(OH)4ˉ
Al(OH)4ˉ
Al(OH)4ˉ
Al(OH)4ˉ
Al(OH)4ˉ
SO42ˉ
SO42ˉ
SO42ˉ
SO42ˉ
SO42ˉ
SO42ˉ
Alkaline pore solution
Al(OH)4ˉ
SO42ˉ
OHˉ
OHˉ
OHˉ
SO42ˉ
1. High [OHˉ] and [Al(OH)4ˉ] from low CEC and
exposed alumina octahedrons
2. Pore solution saturated wrt AFt
3. Colloidal size crystals form at solid solution
interface
4. High SSA of colloidal size AFt crystals absorb
water and the gel swells
5. Intersection of regions of colloidal expansion
causes overall swell
Void Space
H2O
H2OH2O
Chapter Eight– Macrophysical, Microstructural and Chemical Relationships 193
of ettringite formed. The mechanism of through-solution ettringite formation and
expansion by anisotropic crystal growth in the montmorillonite soils is shown in Figure
107.
Figure 107: Montmorillonite based soil ettringite formation and expansion mechanism
8.5. OTHER FACTORS AFFECTING THE PHYSICOCHEMICAL RESPONSE
The following section brings together the finding reported in the earlier chapters to
address how the factors defined in Objective Three affect the physicochemical response
of the soils tested.
8.5.1. Clay mineralogy
The way the fundamental structure of the clay affects the mechanism of ettringite
formation and expansion was discussed in the previous section. But recalling the CBR
strength results of the low sulfate clay reported in Chapter Five, an increase in soil
strength was observed on small additions of sulfate to the lime stabilised kaolin. These
are presented again in Table 44.
OHˉ
OHˉ
OHˉ
Al(OH)4ˉ
Void Space
OHˉ
OHˉ Ca2+(aq) + SO4
2-(aq)
Al(OH)4 (aq)¯ + H4SiO4(aq)
Al(OH)4ˉ
Al(OH)4ˉ
Al(OH)4ˉ
Al(OH)4ˉ
Anisotropic AFt crystal growth Expansion when growthregions intersect
OHˉ
OHˉ
OHˉ
OHˉ
Al(OH)4ˉ
Al(OH)4ˉSO4
2ˉ
Al(OH)4ˉ
Al(OH)4ˉ
Al(OH)4ˉ
Al(OH)4ˉ
Al(OH)4ˉ
Al(OH)4ˉ
SO42ˉ
SO42ˉ
SO42ˉ
SO42ˉ
Alkaline pore solution
Al(OH)4ˉ
SO42ˉ
OHˉ
OHˉ
1. Low [OHˉ] from high CEC processes and low [Al(OH)4ˉ]
from ‘protecting’ silica tetrahedral sheets
2. Migration [Al(OH)4ˉ] into pore solution. Not limited to solid
solution interface zone
3. Nucleation rate less. Large AFt crystals
4. Formation of AFt in void structure does not contribute to
expansion
5. Expansion only occurs when regions of anisotropic crystal
growth intersect.
6. Expansion less per mol AFt formed
Void Space Filled
OHˉ
OHˉ
OHˉ
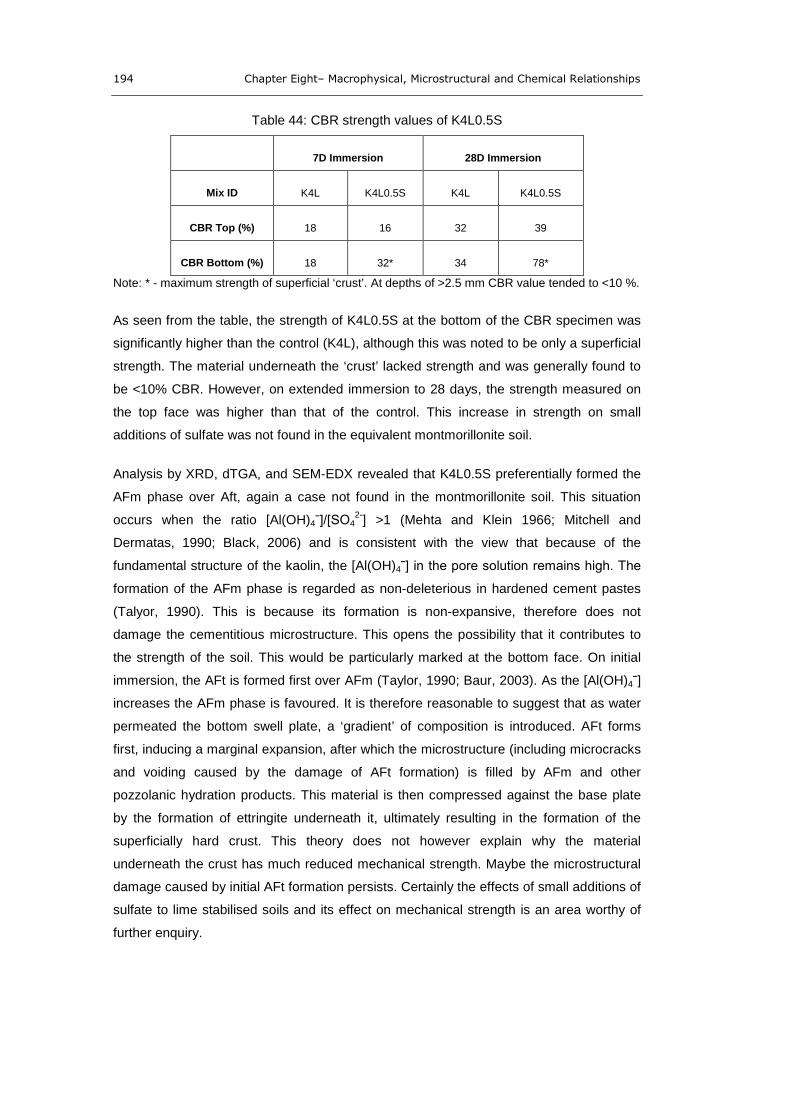
194 Chapter Eight– Macrophysical, Microstructural and Chemical Relationships
Table 44: CBR strength values of K4L0.5S
7D Immersion 28D Immersion
Mix ID K4L K4L0.5S K4L K4L0.5S
CBR Top (%) 18 16 32 39
CBR Bottom (%) 18 32* 34 78*
Note: * - maximum strength of superficial ‘crust’. At depths of >2.5 mm CBR value tended to <10 %.
As seen from the table, the strength of K4L0.5S at the bottom of the CBR specimen was
significantly higher than the control (K4L), although this was noted to be only a superficial
strength. The material underneath the ‘crust’ lacked strength and was generally found to
be <10% CBR. However, on extended immersion to 28 days, the strength measured on
the top face was higher than that of the control. This increase in strength on small
additions of sulfate was not found in the equivalent montmorillonite soil.
Analysis by XRD, dTGA, and SEM-EDX revealed that K4L0.5S preferentially formed the
AFm phase over Aft, again a case not found in the montmorillonite soil. This situation
occurs when the ratio [Al(OH)4ˉ]/[SO42-
] >1 (Mehta and Klein 1966; Mitchell and
Dermatas, 1990; Black, 2006) and is consistent with the view that because of the
fundamental structure of the kaolin, the [Al(OH)4ˉ] in the pore solution remains high. The
formation of the AFm phase is regarded as non-deleterious in hardened cement pastes
(Talyor, 1990). This is because its formation is non-expansive, therefore does not
damage the cementitious microstructure. This opens the possibility that it contributes to
the strength of the soil. This would be particularly marked at the bottom face. On initial
immersion, the AFt is formed first over AFm (Taylor, 1990; Baur, 2003). As the [Al(OH)4ˉ]
increases the AFm phase is favoured. It is therefore reasonable to suggest that as water
permeated the bottom swell plate, a ‘gradient’ of composition is introduced. AFt forms
first, inducing a marginal expansion, after which the microstructure (including microcracks
and voiding caused by the damage of AFt formation) is filled by AFm and other
pozzolanic hydration products. This material is then compressed against the base plate
by the formation of ettringite underneath it, ultimately resulting in the formation of the
superficially hard crust. This theory does not however explain why the material
underneath the crust has much reduced mechanical strength. Maybe the microstructural
damage caused by initial AFt formation persists. Certainly the effects of small additions of
sulfate to lime stabilised soils and its effect on mechanical strength is an area worthy of
further enquiry.

Chapter Eight– Macrophysical, Microstructural and Chemical Relationships 195
8.5.2. Sulfate content
The effect of sulfate content has largely been considered in the preceding chapters.
However, as a summary the following points can be made:
In general, increasing the amount of sulfate in the initial composition of the soils
causes a corresponding increase in dimensional instability and associated
mechanical weakening. This can be attributed to the greater formation of
ettringite. But again as mentioned previously, this is dependent on other variables
such as clay structure and the conditions of the swell tests;
The limited solubility of gypsum (especially in alkaline pore solution) imposes a
rate limiting step on the dissolution of the candidate sulfate ion (SO42ˉ). This
causes the rate of observed linear swell (BS1924-2) to be initially the same for
the medium and high sulfate soils of both clays. The higher sulfate contents of
the soil act as a continuous source of SO42-
for the formation of sulfate bearing
cementitious phases, providing the other candidate ions are available, and
sufficient lime remains for maintenance of the pore solution pH so these are
thermodynamically stable.
Low sulfate contents favour the formation of the AFm phase in the kaolins, but
the AFt phase in montmorillonite soils. Again this has been considered in earlier
chapters.
8.5.3. Swell test conditions
The research has shown that the environmental conditions imposed by the swell tests
affect the soils phase composition, and by inference the microstructure. Most notably, the
elevated temperatures of the European accelerated swell test promote the formation of
monosulfate in the kaolin based clays. Chapter Six reported that the AFm phase was
found in both the low and medium sulfate soils of the kaolin, but when tested to the UK 28
day linear CBR swell test, AFm was only found in K4L0.5S.
The elevated temperature also affects the swell behaviour of the lime stabilised controls
(K4L and M6L). Given these did not contain any sulfate and the soil mixtures were
designed in accordance with current HA specifications - HA74/07, (The Highways
Agency, 2007), it would be expected that the kaolin would be deemed suitable. It was
classed as a ‘marginal’ material under the pass/fail criteria of the test - K4L Gv = 8.1%,
when swells of 5 < Gv < 10% infer the material is not suitable, but could still be used
subject to further evaluation in the place of use. Other hydraulically bound mixtures (the
family of materials under which lime stabilised soil comes), are cured at 40°C in
recognition that lime activated pozzolanic binders develop strength slower than when
196 Chapter Eight– Macrophysical, Microstructural and Chemical Relationships
cement is used as the binder. There may be a case to modify the European test so that
the 72 hour curing prior to immersion is also undertaken at elevated temperatures. More
work would be required before such a recommendation could be made however.
Extending the immersion period of the UK CBR linear swell test for the lime stabilised
controls, results in soils with a higher strength, as would be expected from on-going
pozzolanic reactions and development of the cementitious matrix. Similarly, the progress
of deleterious processes is further advanced, until such a point where one or more
sources of the candidate ions is consumed. In the present research, this was the
consumption of the hydraulic binder, evidenced by the drop in pH of the soils subject to
long-term (9 months) immersion. SEM-EDX analysis revealed that primary gypsum (that
was initially added, not re-precipitated) was still present in the 5.0 and 10% sulfate soils of
either clay. The cessation of swell in the 1.5% sulfate soils was probably caused by
consumption of the primary sulfate source, rather than the binder, since at the age at
which the linear swell reached a plateau the other soils were still expanding. It would be
unlikely therefore that the lime had been consumed at that time in the 1.5% sulfate soil.
The degree to which the specimens are exposed to the immersion water is very different
between the two swell tests. In the BS1924-2 test, the specimen remains in the CBR
mould and as such, the specimen is only exposed to water on the top and bottom face.
The permeability of the soil compacted in the mould would then influence the
physicochemical behaviour of the soil. In the EN13286-49 test, the specimens are
completely immersed in the water and become saturated rapidly, which is evidenced by
the much quicker rate that the unstabilised controls attain their maximum swell
dimensions. The greater access the specimens have to the immersion water means that
in this way the European test causes the soil to realise its maximum potential swell in a
shorter time.
The research also shows the critical importance an external source of water has on the
formation of deleterious minerals. In all cases, no dimensional changes occurred in the
cured specimens of either test prior to immersion. Not until they were immersed did any
volumetric increases occur. This supported the view from other workers (Ouhadi and
Yong, 2008; Little et al. 2010) that a source of sufficient water is critical in the formation of
sulfate containing deleterious mineral phases.
197
9. CONCLUSIONS AND RECOMMENDATIONS FOR
FURTHER WORK
A series of lime stabilised artificial soils based on the two clays kaolin and montmorillonite
and doped with varying levels of sulfate were subject to two swell tests:
BS1924-2 – UK linear CBR swell test
EN13286-49 – European volumetric swell test.
The duration of immersion was undertaken in accordance with the relevant standard. For
BS1924-2, the immersion period was for both 7 and 28 days. Extended immersion testing
was also also extended to 9 months under this test. For EN13286-49, the standard
immersion period was 7 days, but extended to 14 days during the interval study.
The strength and dimensional stability were measured and samples analysised using a
range of analytical techniques to charactierise the microstructure and phase composition
of the soils at the end of the swell tests. In addition to this, a time dependant interval
study based on the European volumetric swell test was also undertaken where samples
were taken from specimens’ at defined intervals from first blending of the soil, to an
extended immersion period over that defined in the test standard.
Relationships between the observed macrophysical properties and the fundamantal
microstructure and phase composition were explored in the context of the conditions
applied by the two swell tests. The formation of hydrous calcium sulfoaluminates as
reaction products of the lime stabilised soils doped with sulfate was extensively
investigated
Based on the work undertaken during the course of this research the following
conclusions can be made.
The unstabilised montmorillonite soils irrespective of sulfate content swelled significantly
more on immersion compared to the equivalent kaolin based soils. This was expected, as
it is well established that clays with a 2:1 aluminosilicate sheet structure, such as
montmorillonite are swelling clays, as water molecules are incorporated within the electric
double layer around the particles causing them to move apart (and swell). Whereas kaolin
is a 1:1 non-swelling clay and does not tend to form an electric double layer to the same
degree. Surprisingly, the variability in both the total observed swell and the rate of
198 Chapter Nine– Conclusions and Recommendations
swelling of individual specimens was large. This was attributed to specimen manufacture
resulting in differing permiablities between test specimens.
Lime stabilisation of the artificial soils of both kaolin and montmorillonite without sulfate
led to significant increases in both mechanical strength and dimensional stability over the
equivalent unstabilised controls. This was associated with the development a
cementitious matrix derived from the reaction of aluminosilicates of the clay fraction with
the hydrated lime. At both 7 and 28 days age, the lime only stabilised montmorillonite
soils exhibited higher strengths than the equivalent kaolin soils in agreement with the
literature.
With respect to the two swell tests used, the swell behaviour of equivalent soil mixtures
were not equal. In the European accelerated swell test, the lime stabilised kaolin control
(K4L) exhibited a degree of swell not observed in the UK CBR linear swell test, such that
it was deemed unsuitable under the pass/fail criteria for the test. This is attributed to
water up-take and swelling of unreacted kaolin clay particles. This was caused by a
slower rate of reaction with the added lime, led to larger expansions of the controls during
the European accelerated swell test, compared to those of the equivalent
montmorillonites. It is suggested that 72 hours curing at 20°C, prior to immersion in water
at 40°C may not be suitable and produces an excessively onerious test. The same soils
subjected to the UK linear CBR swell test did not exhibit any significant swell. Revision of
the test condidions is suggested, but is discussed further in the recommendation for
further work.
The mechanical weakening and dimensional expansion in the lime stabilised soils doped
with varying levels of sulfate was attributed to the formation of ettringite (AFt) and is
fromed by two distinct mechanisms desctibed in the literature as:
Topochemical formation and crystal swelling; and
Through-solution formation and crystal growth.
The propensity for ettringite to form by one mechanisim or the other is controlled by the
fundamental structure of the bulk clay, which in turn controls the hydroxide ion
concentration in the pore solution. Kaolin clays with a 1:1 layer sheet structure have a
comparatively low cation exchange capacity and more alumina exposed to the pore
solution, so available for dissolution. Under the alkaline conditions created by stabilising
the soil with lime, a high hydroxide ion concentration is induced in the pore solution. This
promotes the topochemical formation of ettringite at the solid-solution interface of the clay
particles, as ettringite is super-satuatrated with respect to the pore solution. The very
small crystals formed behave like a colloidal suspension with a very high surface area to
Chapter Nine– Conclusions and Recommendations 199
volume ratio. This colloidal ettringite then absorbs water to lower its suface energy. This
absorbiton of water by gel-like ettringite (crystal swelling) is then responsible for the
swelling observed in the kaolin soils.
Conversely, montmorillonite clays have a high cation exchange capacity and a 2:1 three
layer sheet structure, which results in a lower concentration of hydroxide ions in the pore
solution. In addition, a lower concentration of alumina ions is also created due to the
‘protecting’ effect of the exposed silicate sheets of the clay to the alkaline pore solution.
The dissolution of the clay particles is then a serial reaction in which the silicate sheets
must dissolve before exposing the alumina sheets to the pore solution. The silicate
sheets also dissolve at a slower rate, as the Si-O bond energy in the silicate sheets is
higher compared the Al-O of the alumina bond. The candidate ions for ettringite formation
can then migrate further away from the solid-solution interface. This promotes ettringite
formation by the through-solution mechanism. The crystals formed are much larger by
this mechanism. Expansion occurs when reigons of crystal growth intersect push the
particles apart. A source of sufficient water is crucial for the formation of both AFt and
AFm. In its absence, the candidate ions remain in solution and no dimensional changes
or mechanical weakening can occur.
Because of the higher rate of alumina dissolution in the kaolin soils, in the low sulfate
mixture (0.5%) the formation of monosulfate (AFm) is favoured and suggests the
condition [Al(OH)4ˉ]/[SO42-] >1 is satisfied. Also, the slight increases in soil strength
observed may be attributed AFm formation (again discuss in recommendations for further
work). In the high sulfate (5.0% SO4) kaolin’s, trisulfate (AFt) ettringite is favoured. In the
low sulfate montmorillonite soils the chloride-substituted AFm phase (Friedel’s Salt) was
found and its formation promoted by the chloride content of the bulk clay. In the medium
and high sulfate soils, the formation of AFt was favoured. In the medium and high sulfate
soil mixtures (1.5% and 5.0%), the formation of AFt was favoured. Long-term immersion
testing using the UK linear CBR swell test showed that the limited solubility of gypsum
(especially in alkaline pore solution) imposes a rate limiting step on the dissolution of the
candidate sulfate ion (SO42ˉ
). This causes the rate of observed linear swell (BS1924-2) to
be initially the same for the medium and high sulfate soils of both clays. The formation of
ettringite and associated soil expansion is on-going and is maintained so long as
sufficient lime in the system remains. Swelling ceased when the pH dropped, suggesting
that the consumption of lime occurs before the consumption of the sourse of sulfates.
In addition to the identification of the formation of both AFt and AFm in the soil mixutres, a
primitive Ca-rich AFt phase termed ‘ball ettringite’ was detected in stabilised soils for the
first time.
200 Chapter Nine– Conclusions and Recommendations
Sulfate heave attributed to ettringite formation has been defined using the European
accelerated volumetric swell test (EN13286-49) as a function of sulfate content, with good
agreement.
A number of limitiations of the analytical techniques used in the research were found. It is
not possible to quantify ettringite using relative intensity measurements of univariate XRD
analysis of the principal AFt peak, due to the significant variability in AFt peak intensity,
introduced by the effects of preferred crystal orientation of acicular AFt. In addition dTGA
is only of limited value, due to the overlapping low temperature peaks of clay and
ettringite dehydration. dTGA could be used however, to track the progress of lime
consumption and cation exchange processes. The use of X-Ray CT was valuable in that
it supported the conclusion that deleterious soil expansion is associated with water
ingress into the tests specimens.
Considering the swell tests used in the research, the European accelerated volumetric
swell test (EN13286-49) is more onerous than the UK CBR linear swell test (BS1924-2),
given the elevated immersion temperatures and complete immersion of the specimens.
However, a more comparative analysis would be required before any revision of the
protocol could be suggested.
The conditions of the two swell tests do not affect the composition of the soils in the same
way. The elevated temperatures of the European accelerated volumetric swell test,
promote the formation of the AFm phase in low sulfate soils over the AFt phase, to a
greater degree than in the UK linear CBR swell test.
The following recommendations for further work are suggested:
With respect to the relative severity of the two immersion tests used in the study, a large
range of ‘real’ sulfate bearing cohesive soils should be tested, so that a database of
results can be compiled. This can then be used to inform any revision of the swell test
protocols, in particular, of the European accelerated volumetric swell test.
The great difficulty in the quantification of ettringite persists. The use of Rietveld analysis,
including a correction for preferred crystal orientation, would be a worthwhile undertaking.
The potential use of epoxy impregnation of soil samples, from which petrographic slices
could be produced, should be explored. These could then be analysed using
Transmission Electron Microscopy (TEM) to further study the mechanisms of ettringite
formation and expansion, by characterising the solid-solution interface and the
composition of the void structure.

Chapter Nine– Conclusions and Recommendations 201
Investigation of the composition of the pore solution would be valuable so the
mechanisms of deleterious mineral formation can be explored. Thermodynamic
treatments of the soil systems using this data could yield further insights.
More investigation of the role which small amounts of sulfate platy in actually increasing
soil strength should be undertaken. This could advance the understanding of how
monosulfate (AFm) affects soil strength after immersion in the swell tests.
The use of geochemical modelling software would further support the findings of this
research by predicting the stable phase assemblages in each soil mixture tested under
the conditions of the two swell tests.
202
REFERENCES
Abràmoff, M.D., Magalhães, P.J. and Ram, S.J. Image Processing with ImageJ.
Biophotonics International, Vol. 11, No.7, pp. 36–42, 2004.
Akhter, H., Cartledge, F.K., Roy, A., and Tittlebaum, M.E., “Solidification/stabilization of
arsenic salts: Effects of long cure times”. Journal of Hazardous Materials, Vol. 52, pp.
247-264, 1997.
Bauer, A., and Berger, G., “Kaolinite and smectite dissolution rate in high molar KOH
solutions at 358° and 808°C”. Applied Geochemistry, Vol.13, No.7,pp. 905 – 916, 1997.
Barnett, S.J., Macphee, D.E., Lachowski, E.E., and Crammond, N.J. “XRD, EDX and IR
analysis of solid solutions between thaumasite and ettringite”. Cement and Concrete
Research, Vol. 32, pp. 719–730, 2002.
Basista, M and Weglewski, W. “Chemically assisted damage of concrete: A model of
expansion under external sulfate attack”. International Journal of Damage Mechanics,
Vol.18, pp. 155 – 175, 2009.
Batica, O.R., Milanesia, C.A., Maizab P.J., Marfil, S.A. “Secondary ettringite formation in
concrete subjected to different curing conditions”. Cement and Concrete Research, Vol.
30, Issue 9, pp. 1407 – 1412, 2000.
Baur, I, Keller, P, Mavrocordatos, D, Wehrli, B, Johnson, A. “Dissolution-precipitation
behaviour of ettringite, monosulfate, and calcium silicate hydrate”. Cement and Concrete
Research, Vol.34, pp. 341 – 348, 2003.
Beeghly, J.H., “Recent experiences with lime-fly ash stabilization of pavement subgrade
soils, base, and recycled asphalt”. International Ash Utilization Symposium, Univ. of
Kentucky, Center for Applied Energy Research, Lexington, KY, pp. 1-18, Oct. 20-22,
2003.
Bell F.G. “Lime stabilization of clay minerals and soils”. Engineering Geology, Vol. 42, pp.
223 – 237, 1996.
Berger, E.A, Little, D.N., Marvin, S.R., Atkinson, D.R., Estrada, M., Williams, T., Coover,
R., Nguyen, P.V., and Zaremba, T. “An investigation into stabilizing sulfate laden soils
with lime and lime/flyash”. A South Orange County California Study 2002.
Bernier, L.R., Li, M.G., and Moerman, A., “Effects of tailings and binder geochemistry on
the physical strength of paste backfill. In: Yearwood, Hall (Eds.), Proc. of Sudburry’99,
Mining and the Environment II, Goldsack, Belzile, Vol. 3, pp. 1113–1122.
Birnin-Yauri, U.A., and Glasser, F.P., “Friedel’s salt, Ca2Al(OH)6(Cl,OH).2H2O: its solid
solutions and their role in chloride binding”. Cement and Concrete Research, Vol. 28, No.
12, pp. 1713–1723, 1998.
Black, L, Breen, C, Yarwood, J, Deng, C.-S, Phipps, J and Maitland, G. “Hydration of
tricalcium aluminate (C3A) in the presence and absence of gypsum—studied by Raman
spectroscopy and X-ray diffraction”. Journal of Materials Chemistry, Vol. 16, pp. 1263–
1272, 2006.
Boyd, A.J. and Mindess, S. “The use of tension testing to investigate the effect of W/C
ratio and cement type on the resistance of concrete to sulfate attack”. Cement and
Concrete Research, Vol. 34, pp. 373 – 377, 2004.
Bray, H.T., and Redfern, S.A.T., “Kinetics of dehydration of Ca-montmorillonite”. Physics
and Chemistry of Minerals, Vol. 26 pp. 591 – 600, 1999.
BRE Centre for Concrete Construction and BRE Centre for Ground Engineering.
“Concrete in aggressive ground part 1: assessing the aggressive chemical environment”.
Building Research Establishment, London, 2001
British Standards Institute (BSI). “Stabilized materials for civil engineering purposes —
Part 2: Methods of test for cement-stabilized and lime-stabilized materials”, BS1924-2,
1990.
Britpave Case Study 1 – 10. http://www.britpave.org.uk/SoilStabCaseStudies.ink.
www.britpave.org.uk, 2010 - 2011.
British Standards Institute (BSI), “Stabilized materials for civil engineering purposes —
Part 2: Methods of test for cement-stabilized and lime-stabilized materials”. BS1924-2,
BSI London, 1990.
Brown, P.W., and Hooton R.D., “Ettringite and thaumasite formation in laboratory
concretes”. Cement & Concrete Composites, Vol. 24, pp. 361–370, 2002.
Brown, P., Hooton R.D., Clark, B., “Microstructural changes in concretes with sulfate
exposure”. Cement & Concrete Composites, Vol. 26, pp. 993–999, 2004.
Brown, P.W. and Taylor, H.F.W., “The role of ettringite in external sulphate attack”.
Materials Science of Concrete Special Volume: Sulphate Attack Mechanisms, The
American Ceramic Society, Westerville, OH, pp.73 – 98, 1999.
Brunetaud, X., Linder, R., Divet, L., Duragrin, D., and Damidot, D., “Effect of curing
conditions and concrete mix design on the expansion generated by delayed ettringite
formation”. Materials and Structures, Vol. 40, pp. 567 – 578, 2007.
Bullard, J.W., Jennings, H.M., Livingston, R.A., Nonat, A., Scherer, G.W., “Mechanisms of
cement hydration”. Cement and Concrete Research, Vol. 4, pp. 1208 – 1223, 2011
Burkart, B., Goss, G.C., and Kern, J.P. “The role of gypsum in production of sulfate-
induced deformation of lime-stabilized soils”. Environmental Engineering and
Geoscience, Vol. 5, part 2, pp. 173–187, 1999.
Cerato et al., “Calcium-based stabilizer induced heave in Oklahoma sulfate-bearing soils”.
Oklahoma Department of Transportation, Final Report – FHWA-OK-11-03. ODOT SPR
item number 2210, 2011.
204
Chandler, R.J., “The strength of a stiff clay”. Proceedings of the Geotechnical Conference
Oslo, Vol. 1, pp. 100-108, 1967.
Chapman, D.L., (1913). “A contribution to the theory of electrocapillarity”. Philosophical
Magazine Series 6, Vol.25, Issue 148, pp. 475 – 481, 1913.
Chen, S.S. and Mehta, P.K., “Zeta potential and surface area measurements on
ettringite”. Cement and Concrete Research. Vol.12, No.2, pp. 257 – 259, 1982.
Chromtid, S., “Laboratory evaluation of sulfate heaving mechanisms in artificial illite and
natural soils”. University of Texas at Arlington, T.X. U.S.A, 2000.
Clark, B.A., and Brown, P.W., “The formation of calcium sulfoaluminate hydrate
compounds Part II”. Cement and Concrete Research, Vol. 30, pp. 233-240, 2000.
Cody, A.M., Lee, H., Cody, R.D., Spry P.G., (2004). “The effects of chemical environment
on the nucleation, growth, and stability of ettringite [Ca3Al(OH)6]2(SO4)3.26H2O”. Cement
and Concrete Research, Vol. 34, pp. 869-881, 2004.
Cohen, M.D., “Theories of expansion in sulfoaluminate – type expansive cements:
Schools of thought”, Cement and Concrete Research, Vol. 13, pp. 809 – 818, 1983.
Comité Européen de Normalisation “Unbound and hydraulically bound mixtures. Test
method for the determination of California bearing ratio, immediate bearing index and
linear swelling”, EN 13286-47, BSI London, 2004.
Comité Européen de Normalisation, “Unbound and hydraulically bound mixtures — Part
49: Accelerated swelling test for soil treated by lime and/or hydraulic binder” EN13286-49,
BSI London, 2009.
Comité Européen de Normalisation, “Hydraulically bound mixtures. Specifications. Soil
treated by cement”. EN 14227-10, BSI London, 2006.
Comité Européen de Normalisation, “Unbound and hydraulically bound mixtures.
Specifications. Soil treated by lime”. EN 14227-11, BSI London, 2006.
Comité Européen de Normalisation, “Hydraulically bound mixtures. Specifications. . Soil
treated by slag”. EN 14227-12, BSI London, 2006.
Comité Européen de Normalisation, “Hydraulically bound mixtures. Specifications. Soil
treated by hydraulic road binder”, EN 14227-13, BSI London, 2006.
Comité Européen de Normalisation, “Hydraulically bound mixtures. Specifications. Soil
treated by fly ash”, ”, EN 14227-13, BSI London, 2006.
Cripps, J.C., and Taylor, R.K., “The engineering properties of mudrocks”. Quarterly
Journal of Engineering Geology and Hydrogeology, Vol. 14, pp. 325 – 346, 1981.
Czerewko et al. “Sulfur species in geological materials––sources and quantification”.
Cement and Concrete Composites, Vol. 25, Issue 7, pp. 657 – 671, 2003.
Damidot, D, and Glasser, F.D., “Thermodynamic investigation of the CaO-Al2O3-CaSO4-
H2O system at 25°C and 85°C”. Cement and Concrete Research, Vol. 22, pp. 1179 –
1191, 1992.
Davis, A.G., “The mineralogy and phase equilibrium of Keuper Marl”. Quarterly Journal of
Engineering Geology, Vol. 1, pp. 25-38, 1967.
Deng, M., and Tang, M., “Formation and expansion of ettringite crystals”. Cement and
Concrete Research, Vol.24, Part 1 pp. 119 – 126, 1994.
Dermatas, D., “Ettringite-induced swelling in soils: State-of-the-art”. Applied Mechanics
Reviews, Vol. 48, part 10, pp. 659–673, 1995.
Design Manual for Roads and Bridges (DMRB), Manual of Contract Documents for
Highways Works, Vol.1 (MCHW1), Series 800 - Specification for Highways Works. Road
pavements – unbound, cement and other hydraulically bound materials. The Highways
Agency, UK, 2009.
Design Manual for Roads and Bridges (DMRB), Manual of Contract Documents for
Highways Works, Vol.4 Geotechnics and Drainage, Section 1 - Earthworks, Part 6 -
Treatment of Fill and Capping Materials Using Either Lime or Cement or Both, HA74/06,
The Highways Agency, 2007.
Design Manual for Roads and Bridges (DMRB), Pavement Design and Maintainance, Vol.
7, Pavement Design and Construction, Section 2, Part 2 - Pavement Design, HD26/06,
The Highways Agency, UK, 2006.
Dellisanti, F., Minguzzi, V., and Valdrè, G., “Thermal and structural properties of Ca-rich
Montmorillonite mechanically deformed by compaction and shear”. Applied Clay Science,
Vol. 31, pp. 282–289, 2006.
Diamond, S., “Delayed Ettringite Formation – Processes and Problems”. Cement and
Concrete Composites, Vol.18, pp. 205 – 215, 1996.
Drever, J.I., “The Chemistry of Weathering”. Advanced research workshop. NATO ASI
series. Series C, Mathamatical and Physical Sciences, Vol.149. Reidel, Dordrecht, 1985.
Drits, V.A., Derkowski, A., and McCarty, D.K., “Kinetics of partial dehydroxylation in
dioctahedral 2:1 layer clay minerals”. American Mineralogist, Vol.97 No.5-6 pp. 930-950,
2012.
Dumbleton, M.J., and West, G., “Studies of Keuper Marl: Mineralogy”. Road Research
Laboratory. Ministry of Transport, Report No. 40, pp, 1 – 25, 1966.
Eades, J.L., and Grim, R.E., “A quick test to determine lime requirements for lime
stabilisation”. Transportation Research Board. Highway Research Record, No.139, pp.
61-72. Washington, 1966.
206
Eisazadeh, A., Kassim, K.A., and Nur, H., “Thermal characterization of lime stabilized
soils”. 19th World Congress of Soil Science, Soil Solutions for a Changing World,
Australia, 2010.
European Committee for Standardization (CEN)., “Unbound and hydraulically bound
mixtures - Part 49: Accelerated swelling test for soil treated by lime and/or hydraulic
binder”, EN13286-49, 2004.
Gartner, E.M., and Macphee, D.E., “A physico-chemical basis for novel cementitious
binders”. Cement and Concrete Research, Vol. 41, pp. 736 – 749, 2011.
Gougar, M.L.D., Scheetz, B.E., Roy, D.M., (1996) “Ettringite and C-S-H Portland Cement
Phases for Waste Ion Immobilization: A Review”. Waste Management, Vol. 16, No.4, pp.
295-303, 1996.
Gouy, C., (1910). Journal of Physics. Vol.9, No. 4, pp. 457, 1910.
Guggenhiem, S., and Koster van Groos, A.F., “Baseline studies of the Clay Minerals
Society source clays: thermal analysis”. Clays and Clay Minerals, Vol. 49, No. 5, pp. 433-
443, 2001.
Hampson, C.J., and Bailey, J.E., “The microstructure of the hydration products of tri-
calcium aluminate in the presence of gypsum”. Journal of Materials Science, Vol. 18, pp.
402-410, 1983.
Hardikar, V.V., and Matijević, E., “Influence of ionic and nonionic dextrans on the
formation of calcium hydroxide and calcium carbonate particles”. Colloids and Surfaces:
Physicochemical and Engineering Aspects, Vol. 186, Issues 1-2, pp. 23 – 31, 2001
Hartman, M.R., Berliner, R., “Investigation of the structure of ettringite by time-of-flight
neutron powder diffraction techniques”. Cement and Concrete Research, Vol.36, pp. 364-
370, 2006.
Hartshorn, S.A., Sharp, J.H., and Swamy, R.N., “Thaumasite formation in Portland-
limestone cement pastes”. Cement and Concrete Research, Vol. 29, pp. 1331–1340,
1999.
Hawkins, A.B and Pinches, G.M., “Understanding sulfate generated heave resulting from
pyrite degradation”. Ground Chemistry: Implications for Ground Construction. ISBN 90
5410 866 5, 1997.
Higgins, D.D., “Soil Stabilisation with Ground Granulated Blastfurnace Slag”. UK
Cementitious Slag Makes Association (CMSA). September, 2005.
Highways Agency. Design Manual for Roads and Bridges: Volume 4. Geotechnics and
Drainage. HA74/07, Treatment of Fill and Capping Materials Using Either Lime or Cement
or Both, 2007.
Highways Agency. Manual of Contract Documents for Highway Works. Volume 1 -
Specification for Highway Works.
Hobbs, P.R.N., Hallam, J.R., Forster, A., Entwisle, D.C., Jones, L.D., Cripps, A.C.,
Northmore, K.J., Self S.J., and Meakin, J.L., “Engineering geology of British rocks and
soils – Mudstones of the Mercia Mudstone Group”. British Geological Survey, Research
Report RR/01/02. pp. 106. ISBN 085272 403 9, 2002.
Hollis N., Walker, D., Lane, S., and Paul E. Stutzman, P.E., “Petrographic Methods of
Examining Hardened Concrete:A Petrographic Manual”. Report No. FHWA-HRT-04-150,
Virginia Transportation Research Council, Virginia, U.S.A, 2004.
Hunter, D., “Lime-Induced heave in sulfate bearing clay soils”. Journal of Geotechnical
Engineering, Volume 114, Issue 2, pp. 150 – 167, 1988.
Ish-Shalom, M., and Bentur, A., “Properties of Type-K cement of pure components I:
yydration of unrestrained pastes of pure components: results”, Cement and Concrete
Research, Vol.4, pp.519-532, 1974.
Jung, S., and Santagata, M.C., “Mitigating expansive behaviour of chemically treated
soils.” Publication FHWA/IN/JTRP-2009/02. Joint Transportation Research Program,
Indiana Department of Transportation and Purdue University, West Lafayette, Indiana,
2009. doi: 10.5703/1288284314303.
Kalousek, G.L. and Benton, E.J., “Mechanism of Seawater Attack on Cement Pastes”,
ACI Journal, Vol. 67, No. 9, pp.187-192, 1970.
Kirchheim A.P., Ferna`ndez-Altable, V., Monteiro, P. J. M., Dal Molin, D. C. C. and
Casanova, I., “Analysis of cubic and orthorhombic C3A hydration in presence of gypsum
and lime”. Journal of Materials Science, Vol.44, pp.2038–2045, 2009.
Kim, T. and Kim, Y., Unconfined compressive strength and micro-structural properties of
cemented sand and gravel materials. Scientific Research and Essays, Vol. 6, No.4, pp.
933 – 948, 2011.
Kolias, S., Kasselouri-Rigopoulou, V., Karahalios, A., “Stabilisation of clayey soils with
high calcium fly ash and cement”. Cement & Concrete Composites, Vol. 27, pp. 301–313,
2005.
Kontori, E., Perraki, T., Tsivilis, S., and Kakali, G., “Zeolite blended cements: evaluation
of their hydration rate by means of thermal analysis”. Journal of Thermal Analytical
Calorimetry, Vol.96, pp. 993 – 998, 2009.
Kota et al., “Sulfate-bearing soils: Problems with calcium based stabilizers. Journal of the
Transportation Research Board, Vol. 1546, pp. 62 – 69, 1996.
Kosmataka, S.H., Kerkhoff, B., Panarese, W.C., “Design and Control of Concrete
Mixtures”, EB001, 14th Edn, Portland Cement Association. Skokie, Illinois, USA, 2003.
Lawrence, C.D., “Physicochemical and Mechanical Properties of Portland Cements”.
Lea’s Chemistry of Cement and Concrete, 4th Edn, pp. 343 – 419, 1998.
Little, D.N., “Evaluation of Structural Propeties of Lime Stabilised Soils and Aggregates.
Volume 1: Summary of Findings”. National Lime Association, 1999.
208
Little, D.N., and Nair, S., “Recommended practice for stabilization of sulfate rich subgrade
soils”. Report for NCHRP Project 20-07, Texas Transportation Institute, Texas A&M
University, College Station, Texas, 2009.
Little D.N., Nair, S., and Herbert, B., “Addressing Sulfate-Induced Heave in Lime Treated
Soils”. Journal of Geotechnical and Geoenvironmental Engineering, Vol.136, No. 1, pp.
110 – 118, 2010.
Locat et al., “Laboratory investigations on the lime stabilization of sensitive clays: shear
strength development.” Journal of Canadian Geotechnics. Vol.27, pp. 294-304, 1990.
McCarthy, M.J., Csetenyi, L.J., Sachdeva, A., Dhir, R.K “Identifying the role of fly ash
properties for minimizing sulfate-heave in lime-stabilized soils”. Fuel, Vol.92, pp. 27 – 36,
2011.
Matos, L., Silva, A.S., Soares, D., Salta, M., Mirão, J., and Candeias, A., “The application
of fluorescence microscopy and scanning electron microscopy in the detection of delayed
ettringite formation in concrete”. Materials Science Forum, Vol. 636 – 637, pp. 1266 –
1271, 2010.
Mantovani, M., Escudero, E., Alba, M.D., Becerro, A.I., “Stability of phyllosilicates in
Ca(OH)2 solution: Influence of layer nature, octahedral occupation, presence of
tetrahedral Al and degree of crystallinity” Applied Geochemistry, Vol.24, pp. 1251 – 1260,
2009.
Medina, C., Fríasb, C,. And Sánchez de Rojas, M.I., “Microstructure and properties of
recycled concretes using ceramic sanitary ware industry waste as coarse aggregate”.
Construction and Building Materials. Vol. 31, pp. 112 – 118, 2011.
McNally, G.H., Soil and Rock Construction Materials. Spon Press, ISBN: 978-0-419-
21420-5.
Mehta, P.K., “Mechanism of expansion associated with ettringite formation”. Cement and
Concrete Research, Vol.3, pp1-6, 1973.
Mehta, P.K., “Scanning electron microscope studies of ettringite formation”. Cement and
Concrete Research, Vol. 6, Part 2, pp169 – 192, 1976.
Mehta, P.K., Klein, A., “Investigation on the hydration products in the system
4CaO.3Al2O3.SO3CaSO4CaOH2O”. Highway Research Board, Special Report, No.90,
pp.328-352, 1966.
Mehta, P.K and Hu, F.J., “Further Evidence for Expansion of Ettringite by Water
Adsorption”. Journal of the American Ceramic Society, Vol.61, Issue 3-4, pp179 – 181,
1978.
Mehta, P.K. and Wang, S., “Expansion of ettringite by water absorption”, Cement and
Concrete Research, Vol.12, pp.121-122, 1982.
Min, D. and Tang, M., “Formation and expansion of ettringite crystals”. Cement and
Concrete Research, Vol. 24, Part 1, pp119 – 126, 1994.
Mitchell, J.K, Dermatas, D., “Clay soil heave caused by lime-sulfate reactions”.
Innovations and Uses for Lime. ASTM STP 1135. ASTM, Philadelphia, pp. 41- 64, 1990.
Mohamed, A.M.O., “The role of clay minerals in marly soils on its stability”. Engineering
Geology, Vol. 57, pp. 193 – 203, 2000.
Moore, A.E and Taylor, H.F.W., “Crystal structure of Ettringite”. Act. Cryst. B26, pp. 386 –
393, 1970.
Möschner, G., Lothenbach, B., Rose, J., Ulrich, A., Figi, R., Kretzschmar, R., “Solubility of
Fe–ettringite (Ca6[Fe(OH)6]2(SO4)3.26H2O)” Geochimica et Cosmochimica Acta, Vol.72,
pp. 1–18, 2008.
Murray, H.H., “Applied Clay Mineralogy. Occurrences, Processing and Application of
Kaolins, Bentonites, Palygorskite-Sepiolite, and Common Clays”. Elsevier, Amsterdam.
ISBN-10: 0-444-51701-4, 2007.
Nakamura, T., Sudoh, G., Akaiwa, S., “Mineralogical composition of expansive cement
clinker rich in SiO2 and its expansibility”. Proc., 5th
International Symp. On Chem. Of
Cem. Tokyo, Vol.4, pp. 351, 1960.
Neville, A., “The confused world of sulfate attack on concrete”. Cement and Concrete
Research, Vol.34, pp. 1275 – 1296, 1999.
Notman, C.F., “Durability Testing of Fine Grained Stabilised Soils”. MPhil eThesis,
Nottingham Transportation Engineering Centre (NTEC), The University of Nottingham,
UK.
Odler, I., “Lea’s Chemistry of Cement and Concrete”. 4th Edn, Butterworth-Heinemann,
ISBN-10: 0750662565 pp. 241 – 289, 1998.
Odler, I., and Abdrl-Maula, S., “Possibilities of quantitative determination of the Aft-.
(ettringite) and Afm-(monosulphate) phases in hydrated cement pastes”. Cement and
Concrete Research, Vol. 14, pp. 133 – 141, 1984.
Odler, I. and Gasser, M., “Mechanism of sulphate expansion in hydrated Portland
cement”, Journal of the American Ceramic Society, Vol. 71, pp. 1015-1020, 1988.
Ogawa, K. and Roy, D.M., “C4A3Ŝ hydration, ettringite formation, and its expansion
mechanism: I. Microstructural observation of expansion”. Cement and Concrete
Research, Vol.12, Part 1, pp. 101 – 109, 1981.
Ogawa, K. and Roy, D.M., “C4A3Ŝ hydration, ettringite formation, and its expansion
mechanism: II. Microstructural observation of expansion”. Cement and Concrete
Research, Vol.12, Part 1, pp. 101 – 109, 1982.
Ouhadi V.R., and Yong R.N., “The role of clay fractions of marly soils on their post
stabilization failure”. Engineering Geology, Vol.70, pp. 365 – 375, 2003.
Ouhadi, V.R., Yong, R.N., “Ettringite formation and behaviour in clayey soils”. Applied
Clay Science, Vol.42, pp. 258-265, 2008.
210
Pavoine, A., Divet, L., Fenouillet, S., “Concrete performance test for delayed ettringite
formation: Part I optimisation”. Cement and Concrete Research, Vol.36, pp. 2138 – 2143,
2006.
Ping, X., and Beaudoin, J.J., “Mechanism of sulphate expansion I. Thermodynamic
principle of crystallization pressure”. Cement and Concrete Research, Vol. 22, Issue 4,
pp. 631 – 640.
Peethamparan et al., “Influence of chemical and physical characteristics of cement kiln
dusts (CKDs) on their hydration behaviour and potential suitability for soil stabilization.”
Cement and Concrete Research, Vol.38, pp. 803–815, 2008.
Perkins, R.B., and Palmer, C.D., “Solubility of ettringite (Ca6[Al(OH)6]2(SO4)3.26H2O) at 5–
75°C”. Geochimica et Cosmochimica Acta, Vol. 63, No. 13/14, pp. 1969–1980, 1999.
Perrin, L., “Expansion of lime-treated clays containing sulphates”. Proceedings of the
Seventh International Conference on Expansive Soils, ASCE Expansive Soils Research
Council, New York, Vol.1, pp. 409–414, 1992.
Petry, T. M., “Studies of factors causing and influencing localised heave of lime treated
clay soils (sulfate induced heave).” Contract Rep., U.S. Army Engineers, Waterways
Experiment Station, Vicksburg, Mississippi, 1994.
Petry, T.M., and Little, D.N., “Review of Stabilization of Clays and Expansive Soils in
Pavements and Lightly Loaded Structures—History, Practice, and Future”. Journal of
Materials in Civil Engineering. Vol.14, No. 6, pp. 447- 460, 2002
Ping, X. and Beaudoin, J.J., “Mechanism of sulfate expansion I. Thermodynamic principal
of crystallisation pressure.” Cement and Concrete Research, Vol.22, pp. 631 – 640, 1992.
Puppala, A.J., Griffin, J.A., Hoyos, L.R., and Chomtid, S., “Studies on Sulfate-Resistant
Cement Stabilization Methods to Address Sulfate-Induced Soil Heave”. Journal of
Geotechnical and Geoenvironmental Engineering, Vol.130, No.4, pp. 391 – 401, 2004.
Puppala, A.J., Suppakit, C., Viyanant, C., and Perrin, L., “Sulfate Heaving Problems in
Stabilized Soils: Observations From a Few Case Studies”. Second International
Conference on Engineering Materials, California, 2001.
Puppala, A.J., Intharasombat, N., and Vempati, R.K., “Experimental Studies on Ettringite-
Induced Heaving in Soils”. Journal of Geotechnical and Geoenvironmental Engineering,
Vol. 131, No. 3, pp. 325 – 337, 2005.
Qiao, X.C., Tyrer, M., Poon, C.S., and Cheeseman, C.R., “Characterization of alkali-
activated thermally treated incinerator bottom ash”. Waste Management, Vol.28, No.10,
pp. 1955 – 1962, 2008.
Rajendran, D., and Lytton, R.L., “Reduction of sulfate swell in expansive clay subgrades
in the Dallas district”. Report No. TX-98/3929-1. Texas Transportation Institute, USA,
1997.
Rajasekaran, G., “Sulphate attack and ettringite formation in the lime and cement
stabilized marine clays”. Ocean Engineering, Vol.32, pp. 1133-1159, 2005.
Ramachandran, V.S., Feldman, R.F., and Sereda, P.J., “Application of Differential
Thermal Analysis in Cement Research”. Highway Research Record, No.62, pp. 40 - 61
Highway Research Board, Washington, D. C., U. S. A, 1964.
Reeves, G.M., Sims, I., and Cripps, J.C., (2006). “Clay Materials used in Construction”.
Engineering Geology Special Publication No. 21. The Geological Society. ISBN 10: 1-
86239-184-X. London.
Rekik, B., and Boutouil, M., “Geotechnical properties of dredged marine sediments
treated at high water/cement ratio”. Geo-Marine Letters, Vol.29, Issue 3, pp171 – 179,
2009.
Richardson, I.G., “The nature of C-S-H in hardened cements”. Cement and Concrete
Research Vol.29, pp.1131–1147, 1999.
Reid, J.M., Czerewko, M.A., and Cripps, J.C., Sulfate specification for structural backfills.
TRL Report TRL447, Transport Research Laboratory, 2005. ISBN 1-84608-436-9.
Ritsema, C.J., and Groenenberg, J.E., “Pyrite Oxidation, Carbonate Weathering, and
Gypsum Formation in a Drained Potential Acid Sulfate Soil”. Soil Science Society of
America Journal, Vol. 57, No. 4, pp. 968 – 976, 1993.
Rojas, M, F., and Cabrera, J., “The effect of temperature on the hydration rate and
stability of the hydration phases of metakaolin–lime–water systems”. Cement and
Concrete Research, Vol. 32, pp. 133–138, 2002.
Rollings, R. and Burkes, J.P., “Sulfate attack on cement-stabilized sand”. Journal of
Geotechnical Engineering and Geoenvironmental Engineering, Vol. 125, No.5, pp. 364 –
372, 1999.
Rollings, M.P., and Rollings, R.S., (1996). “Geotechnical Materials in Construction”.
McGraw- Hill. ISBN 0-07-053665-1. New York, 1996.
Schmid, B,. “ImageJ 3D Viewer”. Virtual insect Brain Project, Theodor-Boveri-Institut für
Biowissenschaften, Lehrstuhl für Genetik und Neurobiologie, Würzburg, 2009.
http://3dviewer.neurofly.de/.
Schwiete, H. E., Ludwig, U., and Jager, P., “Investigations in the System 3CaO.Al2O3–
CaSO4–CaO–H2O”. Symposium on Structure of Portland Cement Paste and Concrete.
Special Report 90, Highway Research Board, National Research Council, pp. 353 – 367,
1966.
Scrivener, K.L., Füllmann, T,. Gallucci, E., Walenta, G., and Bermejo, E. “Quantitative
study of Portland cement hydration by X-ray diffraction/Rietveld analysis and independent
methods”. Cement and Concrete Research, Vol. 34, pp. 1541–1547, 2004.
Sherwood, P.T., “Effect of sulfate on cement and sulphate treated soils”. Highways
Research Board Bulletin. Vol. 353, pp. 98 – 107, 1962.
212
Sherwood, P.T., “Stabilised capping layers using either lime or cement or lime and
cement”. TRL Contractor Report 151. Transport Research Laboratory. ISSN 0266-7045,
1992.
Smolczyk, H.G., “The Ettringite Phases in Blast Furnace Cement”. Zement-Kalk-Gips,
Vol.14, pp. 277 284, 1961.
Snedker, E.A and Temporal, J., “M40 Motorway Banbury IV Contract – Lime
Stabilisation”. Highways and Transportation, December, pp. 142 – 158, 1990
Soroka, I., “Portland cement paste and concrete”. Chemical Publishing Company, New
York, 1979.
Sridhran, A, Sivapullaiah, P.V, Ramesh, H.N., “Consolidation behaviour of lime treated
sulphatic soils”. Proceedings of the. International Symposium. Compression
Consolidation Clayey Soils. Hiroshima, Japan I, pp. 183–188, 1995.
Stark, J., and Bollmann, K., “Delayed Ettringite Formation in Concrete”. Nordic Concrete
Federation. Weimar, Germany, 1998.
Stark, J. and Möser, B., “Nano and microstructure of Portland cement paste”. Frost
Resistance of Concrete. Proc. Of the Int. RILEM Workshop, RILEM, France, 2002.
Stutzman, P.E., “Petrographic methods of examining hardened concrete: a petrographic
manual” Virginia Transportation Research Council (VTRC), Report VTRC-92-R14,
Chapter 14, 2006.
Stutzman, P.E., “Scanning electron microscopy imaging of hydraulic cement
microstructure”. Cement & Concrete Composites, Vol. 26, pp. 957-966, 2004.
Taylor H.F.W., “Crystal structures of double hydroxide minerals”. Minerals Magazine,
Issue 39, pp 377 – 389, 1973.
Taylor, H.F.W., “Cement Chemistry”. 2nd Edition, Thomas Telford, London. ISBN 0-12-
683900-X, 1990.
Taylor, H.F.W., Famy, C., and Scrivener K.L., “Delayed Ettringite Formation”. Cement
and Concrete Research. Vol. 31, Issue 5, pp. 683-693, 2001.
Terai, T., Mikuni, A., Nakamura, Y., Ikeda, K.,. “Synthesis of Ettringite from Portlandite
Suspensions at Various Ca/Al Ratios”. Inorganic Materials, Vol.43, No. 7, pp. 786 – 792,
2007.
Thom, N., Principals of pavement engineering. Thomas Telford Publishing Ltd. ISBN 978-
0-7277-3480-0. London, 2008.
Tosun, K., and Baradan, B., “Effect of ettringite morphology on DEF-related expansion”.
Cement & Concrete Composites, Vol. 32, pp. 271–280, 2010.
Tx-DOT, “Standard Specifications for Construction and Maintenance of Highways, Streets
and Bridges”. Texas Department of Transportation, USA, 2004.
Ukrainczyk, N., Ukrainczyk, M., Šipušić, J., Matusinović, T., “ XRD and TGA investigation
of hardened cement paste degredation” Conference on Materials, Processes, Friction and
Wear, MATRIB’06, Vela Luka, 22-24.06.2006.
Viyanant, C., “Laboratory evaluation of sulfate heaving mechanisms in artificial kaolinite
soil. MS Thesis. The university of Texas at Arlington, Arlington, TX, U.S.A, 2000.
Wang, L., “Cementitous Stabilization of Soils in the Presence of Sulfate”. PhD Thesis,
Louisiana State University, 2002.
Wang L., Roy, A., Seals, R.K., and Byerley, Z., “Suppression of sulfate attack on a
stabilized soil”. Journal of the American Ceramic Society, Vol.88, Part 6, pp. 1600 – 1606,
2005.
Wild, S., Kinuthia, J.M., Jones, G.I., and Higgins, D.D., “Effects of partial substitution of
lime with ground granulated blast furnace slag (GGBS) on the strength properties of lime-
stabilised sulphate-bearing clay soils”. Engineering Geology, Vol.51, pp. 37 – 53, 1998.
Wild, S., Kinuthia, J.M., Jones, G.I., and Higgins, D.D., “Suppression of swelling
associated with ettringite formation in lime stabilized sulphate bearing clay soils by partial
substitution of lime with ground granulated blastfurnace slag”. Engineering Geology,
Vol.51, pp. 257 – 277, 1999.
Winnifield, FR., and Lothenbach, B., “Hydration of calcium sulfoaluminate cements —
Experimental findings and thermodynamic modelling”. Cement and Concrete Research
Vol. 40, pp.1239–1247, 2010.
Winslow, D.N and Lovell, C.W. “Measurements of pore size distributions in cements,
aggregates and soils”. Powder Technology, Vol.29, Issue 1, pp. 151 – 165, 1981.
Xue, J.G.,. Xu, W.X., Ye, M.X., “A study of the liquid phase separated from the pores of
hardened cement paste”, Kuei Suan Yen Hsueh Pao, Vol.11, pp. 276–289, 1983.
Yan, P., Zheng, F., Peng, J., and Qin, X., “Relationship between delayed ettringite
formation and delayed expansion in massive shrinkage-compensating concrete”. Cement
& Concrete Composites, Vol. 26, pp. 687–693, 2004.
Yan, Q., Yun, L., and Yuan, J., “Preparation of titanium dioxide compound pigments
based on kaolin substrates.” Journal of Coatings Technology and Research, Vol. 7,
Issue 2, pp. 229 – 237, 2010.
Yang, R., “Crystallinity determination of pure phases used as standards for QXRD in
cement chemistry”. Cement and Concrete Research, Vol. 26, No. 9, pp. 1451 – 1461,
1996.
Yilmaz, I. and Civelekoglu, B., “Gypsum: an additive for stabilization of swelling clay
soils.” Applied Clay Science. Vol. 44, pp. 166 – 172, 2009.

214
Yongtang, Y., and Deng, A., “Mechanism and prevention of highway distress in seasonal
frost area”. Geotechnical Engineering for Disaster Mitigation and Rehabilitation.
Proceedings of the 2nd International Conference GEDMAR08, Nanjing, China 30 May – 2
June, 2008. ISBN 978-3-540-79845-3. Beijing Science Press.
215
LIST OF FIGURES
Figure 1: General pavement structure .............................................................................. 19
Figure 2: Typical soil profile (Rollings and Rollings, 1996) ............................................... 21
Figure 3: Tetrahedrally co-ordinated Si and Al (reprinted from Grim, 1968) .................... 25
Figure 4: Octahedrally co-ordinated cations (reprinted from Grim, 1968), ....................... 25
Figure 5: General structures of clay minerals (Reeves et al, 2006).................................. 26
Figure 6: Gouy-Chapman diffuse double layer ................................................................. 27
Figure 7: The development of a cementitious matrix in lime stabilised clay soil (adapted
from Locat el al, 1990) ...................................................................................................... 33
Figure 8: crystal structure of ettringite. (A) Structure of ettringite column, one-half unit cell.
Structure is parallel to the c crystallographic axis. (B) View of a–b plane. Circles represent
ettringite columns; regions between columns are channels containing water and sulfate
molecules (after Cody et al, 2004) .................................................................................... 40
Figure 9: lamellar structure of monosulfate (AFm) after Cody et al, 2004........................ 40
Figure 10: Inhibition of C3A hydration by l formation of AFt on C3A surface (adapted from
Rajasekaran, 2005)........................................................................................................... 44
Figure 11: ettringite formation in lime stabilised cohesive soils ........................................ 48
Figure 12: Blending of artificial laboratory soil samples prior to compaction.................... 71
Figure 13: apparatus for measuring the linear swell of a specimen in the UK soaked CBR
swell test............................................................................................................................ 73
Figure 14: Specimens undergoing the UK soaked CBR swell testing procedure (BS1924-
2) ....................................................................................................................................... 74
Figure 15: A 7 day swell test sample undergoing CBR testing......................................... 75
Figure 16: Specimen moulds and soil specimens produced to EN 13286-49 .................. 76
Figure 17: Climatic air curing chamber and wrapped specimens prior to immersion (EN
13286-49) .......................................................................................................................... 76
Figure 18: Method for determining the volume of a specimen.......................................... 76
Figure 19: Swell behaviour of Kaolin soils subject to the UK 7 day CBR Linear Swell test
(BS1924-2) ........................................................................................................................ 85
Figure 20: Swell behaviour of Montmorillonite soils subject to the UK 7 day CBR linear
swell test (BS1924-2) ........................................................................................................ 86
Figure 21: water content of soils after 7 days immersion (BS1924-2) .............................. 87
Figure 22: Swell behaviour of Kaolin soils subject to the UK 28 day CBR Linear swell test
(BS1924-2) ........................................................................................................................ 89
Figure 23: water content of soils after 28 days immersion (BS1924-2) ............................ 91
Figure 24: Long term swell tests (BS1924-2) of the kaolin soils....................................... 94
Figure 25: Long term swell tests (BS1924-2) of the montmorillonite soils........................ 94
216
Figure 26: Swell behaviour of Kaolin soils subject to the volumetric expansion (Gv) test at
7 days (BS EN 13286-49) .................................................................................................95
Figure 27: The effect of immersion in the European accelerated swell test on the high
sulfate Kaolin soil (K4L5S) ................................................................................................96
Figure 28: Swell behaviour of montmorillonite soils subject to the volumetric expansion
(Gv) test at 7 days (BS EN 13286-49) ...............................................................................97
Figure 29: The effect of immersion in the European accelerated volumetric swell test
(EN13286-49) on the high sulfate montmorillonite soil (M6L5S) ......................................98
Figure 30: CBR strengths of kaolin and montmorillonite soils at 7 and 28 days (BS1924-2)
.........................................................................................................................................101
Figure 31: XRD pattern of kaolin soils after UK 7 day CBR linear swell test (BS1924-2). I
– illite, E – ettringite, G – gypsum, K – kaolinite, F – Feldspar, L – portlandite (hydrated
lime), C – calcite, Q - quartz............................................................................................107
Figure 32: XRD pattern of kaolin soils after UK 28 day CBR linear swell test (BS1924-2). I
– illite, E – ettringite, G – gypsum, K – kaolinite, L – portlandite (hydrated lime), C –
calcite, Q - quartz ............................................................................................................108
Figure 33: XRD pattern of montmorillonite soils subject to UK linear 7 day CBR swell test
showing the phases present (Scan Method 1). I – illite, F – feldspar, E – ettringite, M –
monosulfate, G – gypsum, M – Montmorillonite, L – portlandite (hydrated lime), C –
calcite, Q – quartz ...........................................................................................................109
Figure 34:XRD pattern of montmorillonite soils subject to UK linear 28 day CBR swell test
showing the phases present. I – illite, F – feldspar, E – ettringite, AFmc – carbosubstituted
AFm, G – gypsum, M – Montmorillonite, L – portlandite (hydrated lime), C – calcite, Q –
quartz...............................................................................................................................110
Figure 35: XRD pattern of kaolin soils subject to the European accelerated volumetric
swell test (EN13286-49) the phases present. I – illite, F - feldspar, Mn – monosulfate, G –
gypsum, L – portlandite (hydrated lime), C – calcite, Q – quartz ....................................111
Figure 36: XRD pattern of montmorillonite soils subject to the European accelerated
volumetric swell test (EN13286-49). I – illite, F - feldspar, Mn – monosulfate, G – gypsum,
L – portlandite (hydrated lime), C – calcite, Q – quartz...................................................112
Figure 37: Low angle XRD pattern of kaolin soils subject to UK linear CBR swell test at 7
days (left) and 28 days (right) showing development of [100] AFt peak at ca. 9.08° 2θ.
Also note the reflection of AFm12 at 9.96° 2θ in K4L0.5S (28 days). ........................... 113
Figure 38: Low angle XRD pattern of montmorillonite soils subject to UK linear CBR swell
test at 7 days (left) and 28 days (right) showing development of [100] AFt peak at ca. 9.1°
2θ ..................................................................................................................................... 113
Figure 39: Low angle XRD pattern of kaolin soils (left) and montmorillonite soils (right)
subject to European accelerated swell test showing the development of both the [100]
AFt peak at 9.08° 2θ, AFm peak at 9.96° 2θ and illite peak at 8.84° 2θ ......................... 114
Figure 40: XRD pattern of kaolin soils subject to extended immersion (9months). K –
kaolin, I – illite, , E – ettringite (AFt), Mn – monosulfate (AFm), G – gypsum, C – calcite, Q
– quartz ........................................................................................................................... 116
Figure 41: XRD pattern of montmorillonite soils subject to extended immersion (9months).
M – montmorillonite, I – illite, , E – ettringite (AFt), G – gypsum, C – calcite, Q – quartz117
Figure 42: Low angle XRD patterns of the long term immersion soils, kaolins (left)
montmorillonites (right). Note order is reversed in the kaolin stack. ............................... 117
Figure 43: dTGA plot of kaolin (left) and montmorillonite (right) control soils UK Linear
CBR Swell Test (BS1924-2) at 7 days. 1 - desorption H2O, 2 – interlayer H2O, 2a –
CaSO4.2H2O, 3 – Ca(OH)2, 4 – clay dehydroxlyation..................................................... 122
Figure 44: dTGA plot of Kaolin(left) and montmorillonite (right) control soils (UK Linear 28
day CBR Swell Test) 1 - desorption H2O, 2 – interlayer H2O, 2a – CaSO4.2H2O, 3 –
Ca(OH)2, 4 – clay dehydroxlyation, 5 – encapsulated H2O and CASH .......................... 122
Figure 45: dTGA plot of kaolin and montmorillonite control soils (European accelerated
swell test (EN13286-49) 1 - desorbtion H2O, 2 – interlayer H2O, 3 – Ca(OH)2, 4 – clay
dehydroxylation, 5 – encapsulated H2O and CASH........................................................ 123
Figure 46: dTGA plot of sulfate soils at 7 days (UK linear CBR swell test) 1 - desorbtion
H2O, 2 – interlayer H2O, 2a – CaSO4.2H2O, 3 – Ca(OH)2, 6 – ettringite (AFt) ............... 124
Figure 47: dTGA plot of sulfate soils at 28 days (UK linear CBR swell test) 1 - desorption
H2O, 6 and 6a – ettringite (AFt), 7 – Freidel’s Salt, CAH (C4AH13), 8 – hydrogarnet
(generic CSH) ................................................................................................................. 125
Figure 48: dTGA plot of sulfate soils at 28 days (UK linear CBR swell test) 1 - desorption
H2O, 2a -- CaSO4.2H2O, 3 – Ca(OH)2, 6 and 6a – ettringite (AFt), 7 – Fridel’s Salt, 7a –
AFm, 8 – hydrogarnet (generic CSH), 9 – CAŜH: solid solution between CAŜH and
monosulfate (AFm).......................................................................................................... 126
Figure 49: dTGA plot of sulfate soils at 9 months (UK linear CBR swell test). 1 -
desorption H2O, 2a - CaSO4.2H2O, 6 and 6a– ettringite (AFt), 7a – AFm..................... 126
Figure 50: Sulfated kaolin control soil mixture (K3S, EN13286-49)................................ 131
Figure 51: K4L (BS1924-2, 28 day immersion) showing formation of cementitious
hydrates........................................................................................................................... 132
Figure 52: K4L (BS1924-2, 28 days immersion) showing evidence of cementitious
hydrate formation ............................................................................................................ 132
Figure 53: Control soils after European accelerated volumetric test, EN13286-49 (K) top,
(M) bottom....................................................................................................................... 133
Figure 54: M6L5S (BS1924-2, 7 days immersion) AFt formation ................................... 134
Figure 55: K4L5S (BS1924-2, 28 day immersion) showing presence of precipitated
carbonate (top) and AFt formation (bottom).................................................................... 134
Figure 56: M6L5S (BS1924-2, 28 day immersion). Extensive AFt formation throughout
material............................................................................................................................ 135
218
Figure 57: K4L5S (EN13286-49) showing extensive AFt formation. Bottom-right
micrograph shows AFt crystal apparently embedded in the bulk clay. ...........................136
Figure 58: (top left and right). Bottom SEM-EDX shows Ca-rich species termed ‘ball
ettringite’ in the literature .................................................................................................137
Figure 59: M6L5S (EN13286-49) showing extensive AFt formation. AFt shown growing in
a possible void structure (circled)....................................................................................138
Figure 60: K4L1.5S (BS1924-2 28 day immersion) showing mixture of both relatively -
large and small AFt crystals ............................................................................................138
Figure 61: K4L1.5S (BS1924-2, 28 day immersion) showing hydrated lime particles....139
Figure 62: Medium sulfate kaolin (K4L1.5S) after the European accelerated volumetric
test (a) .............................................................................................................................140
Figure 63: Medium sulfate kaolin (K4L1.5S) after the European accelerated volumetric
test (EN13286-49) ...........................................................................................................140
Figure 64: Close-up of ettringite (AFm) formation on surface of monosulfate (AFm).....141
Figure 65: K4L0.5S tested to BS1924-2 (7 days immersion) showing cementitious product
(top and bottom left) and possibly hydrated lime particles (bottom right) .......................142
Figure 66: K4L0.5S tested to BS1924-2 (28 days immersion) showing the characteristic
SEM-EDX of monosulfate (AFm) ....................................................................................142
Figure 67: Small AFt crystals found in K4L0.5S (BS1924-2, 28 days immersion)..........143
Figure 68: Low sulfate kaolin (K4L0.5S) European accelerated volumetric swell test,
EN13286-49. ...................................................................................................................144
Figure 69: M6L0.5S (BS1924-2, after 28 days immersion) showing nucleation and radial
growth of AFt crystals in the remnants of a void structure ..............................................145
Figure 70: M6L0.5S (BS1924-2, 28 days immersion) showing an AFt cluster (left) and
Friedel’s Salt (right) .........................................................................................................146
Figure 71: M6L0.5S (EN13286-49) showing extensive AFt formation (top) and CSH
formation (bottom) ...........................................................................................................147
Figure 72: M6L0.5S (EN13286-49) showing close up of cubic structures as shown in
Figure 71 (EDX6r). ..........................................................................................................147
Figure 73: Monosulfate (AFm) formation in M6L1.5S (9 months immersion) .................148
Figure 74: Extensive AFt formation in K4L5S (9 months immersion) .............................149
Figure 75: Foil-like CSH and AFt formation in M6L1.5S (9 months immersion) .............149
Figure 76: Large AFt crystals formed in M6L5S (9 months immersion)..........................150
Figure 77: Early age volumetric swell testing results (EN 13286-49) .............................155
Figure 78: Creation of a binary image from an X-Ray CT ‘slice’.....................................157
Figure 79: Pre-immersion (EN13286-49) of the early age montmorillonite specimens.
Lower images show the 3D construction of the initial void structure derived from X-ray CT
scans (100 slices at 0.5 mm intervals) ............................................................................158
Figure 80: Post-immersion after 14 days (EN13286-49) of the montmorillonite specimens.
Lower images show the 3D construction of X-ray CT scans of M6L5S after 14 days
immersion showing damage to specimen microstructure............................................... 159
Figure 81: Low angle XRD pattern of kaolin soils (EAK1-EAK8) showing the reflection
peak of illite and the development of the [100] AFt peak as the test progresses ........... 160
Figure 82: Low angle XRD spectra of montmorillonite soils EAM1-8 showing development
of AFt peak at ca. 9.15° 2θ ............................................................................................. 161
Figure 83: dTGA analysis of K4L5S early age study specimens (EAK1-8). 1 - desorption
H2O, 3 – Ca(OH)2, 6 – ettringite (AFt), ............................................................................ 162
Figure 84: dTGA analysis of M6L5S early age study specimens (EAM1-8). 1 - desorption
H2O, 3 – Ca(OH)2, 6 – ettringite (AFt), 8 – CaSO4.2H2O................................................ 163
Figure 85: DTA analysis of M6L5S early age study specimens (EAM1-8) showing
differentiation of peaks 6 and 8. 6- ettringite, 8 - CaSO4.2H2O (taken from the control soil
M5S subject to the three swell tests: BS1924-2 7 and 28 days; EN13286-49) .............. 164
Figure 86: SEM-EDX of EAK1 showing typical plate-like morphology of the kaolin clay
(left) and unreacted gypsum particle (right) .................................................................... 165
Figure 87: EAK2 again showing the apparently unchanged kaolin clay......................... 166
Figure 88: EAK3 showing possible AFt nucleation on the wall of a void structure ......... 167
Figure 89:EAK4 again possibly showing primitive Ca-rich “ball ettringite” AFt formation
(EDX7d)........................................................................................................................... 168
Figure 90: EAK5 showing intersecting regions of acicular crystal growth ...................... 169
Figure 91:Close-up of regions of intersecting crystal growth found in EAK5.................. 169
Figure 92: EM micrographs of EAK6 to EAK8 showing AFt formation ........................... 170
Figure 93: EAK8 (extended immersion, 14 days) showing formation of two distinct AFt
crystal morphologies ....................................................................................................... 171
Figure 94: Close-up of EAK8 showing the two distinct AFt crystal morphologies .......... 172
Figure 95: EAM1 showing quicklime (CaO) at two differing states of hydration............. 173
Figure 96: EAM1 possibly showing very early AFt formation ......................................... 173
Figure 97: EAM2 showing quite extensive ettringite formation....................................... 174
Figure 98: EAM3 showing hydrated lime particles (circled) and primitive Si-rich AFt
formation (EDX8d) .......................................................................................................... 175
Figure 99: EAM4 showing unhydrated lime particle (top left and EDX8e) and close-up
circled of primitive Si-rich AFt phase (top left and EDX8f).............................................. 176
Figure 100: AFt formation in EAM5 to EAM8.................................................................. 177
Figure 101: Repeated low angle XRD patterns of synthetic AFt .................................... 184
Figure 102: Repeatability of low angle XRD patterns (left – K4L5S, right - M6L5S,
BS1924-2, 28 day) .......................................................................................................... 185
Figure 103: Relationship between soil sulfate content and linear swell for the kaolin soils
........................................................................................................................................ 187
220
Figure 104: Relationship between soil sulfate content and linear swell for the
montmorillonite soils ........................................................................................................188
Figure 105: Relationship between soil sulfate content and volumetric expansion (Gv) for
both soils (EN 13286-49).................................................................................................190
Figure 106: Kaolin soil topochemical ettringite formation and expansion by crystal
swelling mechanism ........................................................................................................192
Figure 107: Montmorillonite based soil ettringite formation and expansion mechanism 193
Figure 108: XRD pattern of synthetic ettringite ...............................................................229
Figure 109: dTGA plot of synthetic ettringite...................................................................230
Figure 110: SEM-EDX analysis of synthetic ettringite showing AFt (EDX1) and predicated
calcium sulfate (EDX2)....................................................................................................230
Figure 111: SEM showing AFt agglomerations...............................................................231
LIST OF TABLES
Table 1: Design requirements of a pavement ...................................................................20
Table 2: Stratigraphy of major British clay formations (reproduced from Reeves et al,
2006) .................................................................................................................................23
Table 3: Engineering properties of UK mudrocks (adapted from Cripp and Taylor, 1981)
...........................................................................................................................................24
Table 4: Classification of clay minerals .............................................................................27
Table 5: Cation exchange capacities of some clay minerals (Drever, 1985) ....................29
Table 6: Applications of soil stabilisation (adapted from McNally, 1998) ..........................31
Table 7: Effect of lime addition to cohesive soils ..............................................................35
Table 8: Compositions of pore solutions ...........................................................................51
Table 9: Solubility of commonly found sulfate salts ..........................................................55
Table 10 soil sulfate threshold trigger levels ....................................................................56
Table 11: Design Sulfate Class for aggressive ground (BRE SD-1, 2001).......................57
Table 12: risk level associated with lime stabilisation of sulfate-bearing clays (Little and
Nair, 2009).........................................................................................................................57
Table 13: pH stability range of AFt and AFm (Damidot and Glasser, 1992).....................58
Table 14: results of digestion tests on different clay minerals (Ouhadi and Yong, 2003).59
Table 15: worldwide test procedures for stabilised soils ...................................................61
Table 16: Chemical analysis determined by XRF .............................................................67
Table 17: Results of Initial Consumption of Lime testing (BS1924-2)...............................70
Table 18: Composition data for artificial soils....................................................................72
Table 19: Summary of conditions used in the UK CBR Linear Swell test and the European
Accelerated Volumetric Swell test .....................................................................................78
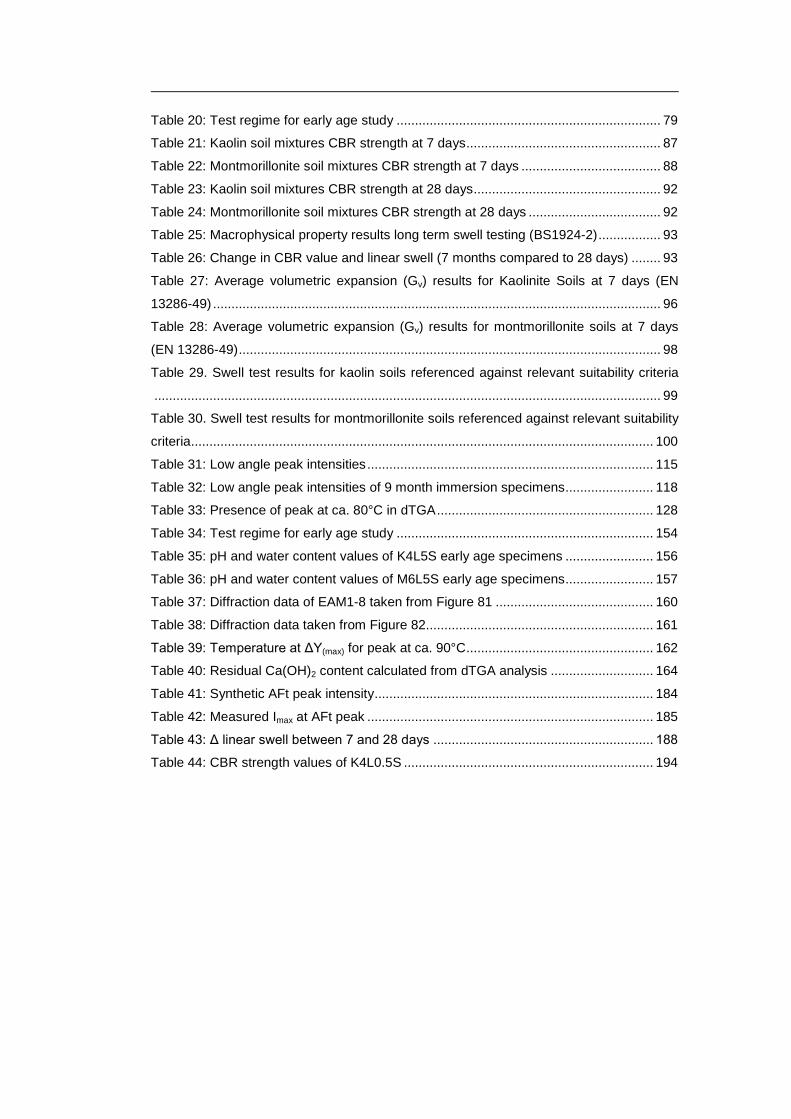
Table 20: Test regime for early age study ........................................................................ 79
Table 21: Kaolin soil mixtures CBR strength at 7 days..................................................... 87
Table 22: Montmorillonite soil mixtures CBR strength at 7 days ...................................... 88
Table 23: Kaolin soil mixtures CBR strength at 28 days................................................... 92
Table 24: Montmorillonite soil mixtures CBR strength at 28 days .................................... 92
Table 25: Macrophysical property results long term swell testing (BS1924-2)................. 93
Table 26: Change in CBR value and linear swell (7 months compared to 28 days) ........ 93
Table 27: Average volumetric expansion (Gv) results for Kaolinite Soils at 7 days (EN
13286-49) .......................................................................................................................... 96
Table 28: Average volumetric expansion (Gv) results for montmorillonite soils at 7 days
(EN 13286-49)................................................................................................................... 98
Table 29. Swell test results for kaolin soils referenced against relevant suitability criteria
.......................................................................................................................................... 99
Table 30. Swell test results for montmorillonite soils referenced against relevant suitability
criteria.............................................................................................................................. 100
Table 31: Low angle peak intensities.............................................................................. 115
Table 32: Low angle peak intensities of 9 month immersion specimens........................ 118
Table 33: Presence of peak at ca. 80°C in dTGA........................................................... 128
Table 34: Test regime for early age study ...................................................................... 154
Table 35: pH and water content values of K4L5S early age specimens ........................ 156
Table 36: pH and water content values of M6L5S early age specimens........................ 157
Table 37: Diffraction data of EAM1-8 taken from Figure 81 ........................................... 160
Table 38: Diffraction data taken from Figure 82.............................................................. 161
Table 39: Temperature at ΔY(max) for peak at ca. 90°C................................................... 162
Table 40: Residual Ca(OH)2 content calculated from dTGA analysis ............................ 164
Table 41: Synthetic AFt peak intensity............................................................................ 184
Table 42: Measured Imax at AFt peak .............................................................................. 185
Table 43: Δ linear swell between 7 and 28 days ............................................................ 188
Table 44: CBR strength values of K4L0.5S .................................................................... 194
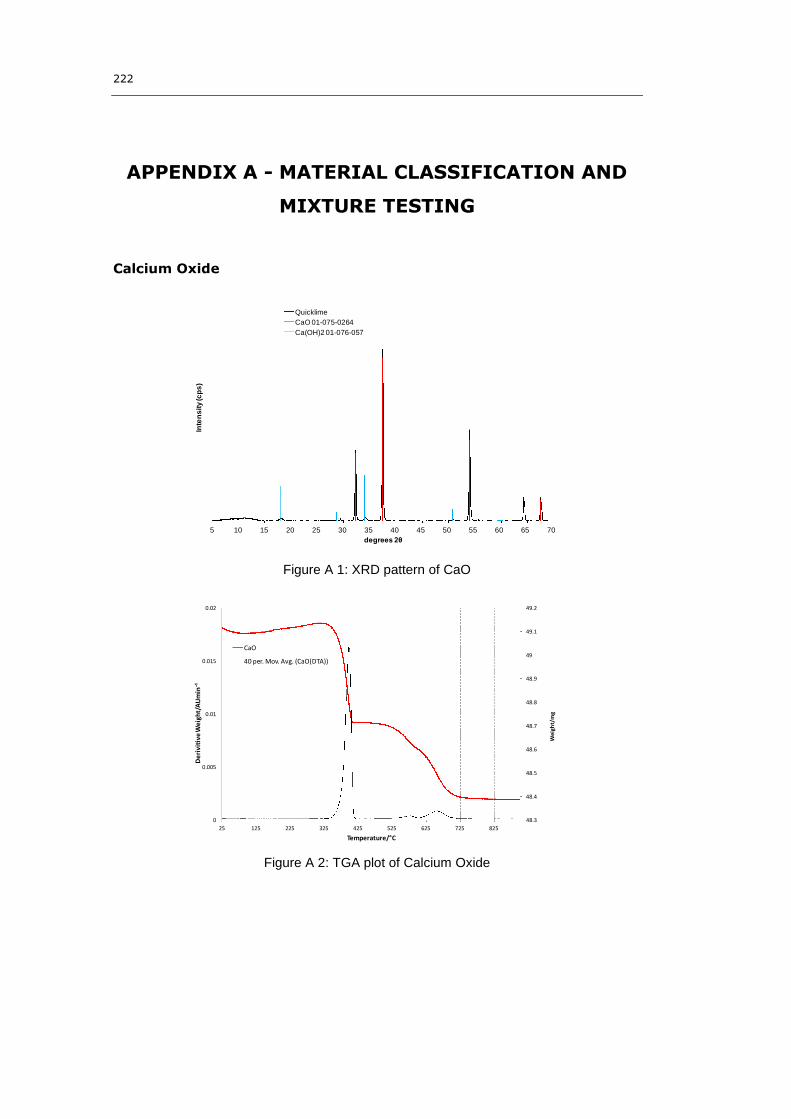
222
APPENDIX A - MATERIAL CLASSIFICATION AND
MIXTURE TESTING
Calcium Oxide
Figure A 1: XRD pattern of CaO
Figure A 2: TGA plot of Calcium Oxide
5 10 15 20 25 30 35 40 45 50 55 60 65 70
Inte
ns
ity
(cp
s)
degrees 2θ
Quicklime
CaO 01-075-0264
Ca(OH)2 01-076-057
48.3
48.4
48.5
48.6
48.7
48.8
48.9
49
49.1
49.2
0
0.005
0.01
0.015
0.02
25 125 225 325 425 525 625 725 825
Wei
ght/
mg
�ĞƌŝǀŝƟǀĞ�t
ĞŝŐŚƚͬ�hŵŝŶЁϷ
Temperature/°C
CaO
40 per. Mov. Avg. (CaO(DTA))
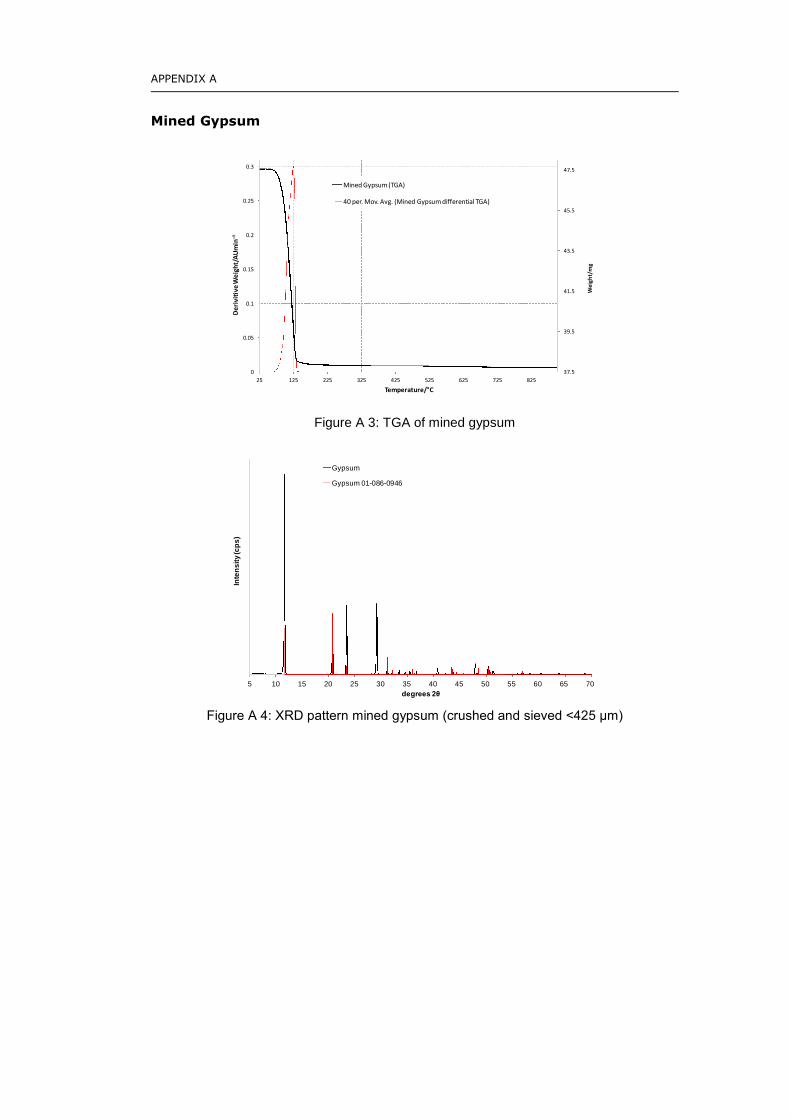
APPENDIX A
Mined Gypsum
Figure A 3: TGA of mined gypsum
Figure A 4: XRD pattern mined gypsum (crushed and sieved <425 μm)
37.5
39.5
41.5
43.5
45.5
47.5
0
0.05
0.1
0.15
0.2
0.25
0.3
25 125 225 325 425 525 625 725 825
Wei
ght/
mg
�ĞƌŝǀŝƟǀĞ�t
ĞŝŐŚƚͬ�hŵŝŶЁϷ
Temperature/°C
Mined Gypsum (TGA)
40 per. Mov. Avg. (Mined Gypsum differential TGA)
5 10 15 20 25 30 35 40 45 50 55 60 65 70
Inte
ns
ity
(cp
s)
degrees 2θ
Gypsum
Gypsum 01-086-0946
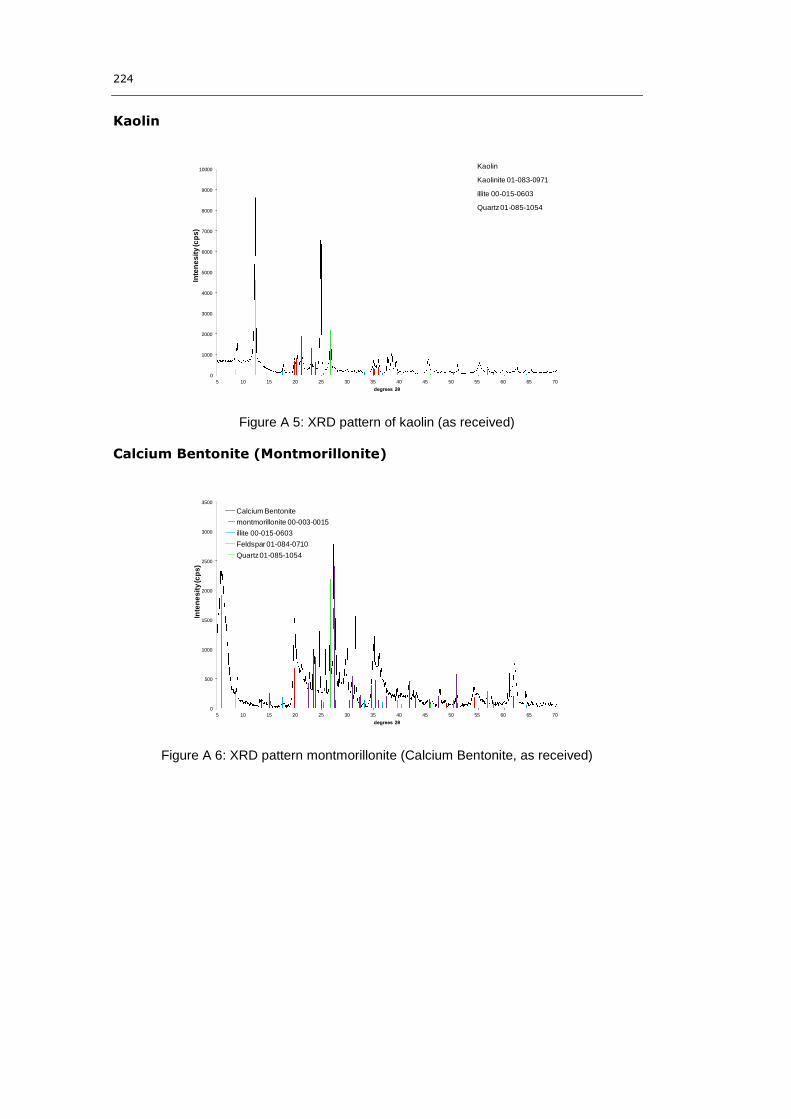
224
Kaolin
Figure A 5: XRD pattern of kaolin (as received)
Calcium Bentonite (Montmorillonite)
Figure A 6: XRD pattern montmorillonite (Calcium Bentonite, as received)
0
1000
2000
3000
4000
5000
6000
7000
8000
9000
10000
5 10 15 20 25 30 35 40 45 50 55 60 65 70
Inte
ne
sit
y(c
ps
)
degrees 2θ
Kaolin
Kaolinite 01-083-0971
illite 00-015-0603
Quartz01-085-1054
0
500
1000
1500
2000
2500
3000
3500
5 10 15 20 25 30 35 40 45 50 55 60 65 70
Inte
ne
sit
y(c
ps
)
degrees 2θ
Calcium Bentonite
montmorillonite 00-003-0015
illite 00-015-0603
Feldspar 01-084-0710
Quartz01-085-1054
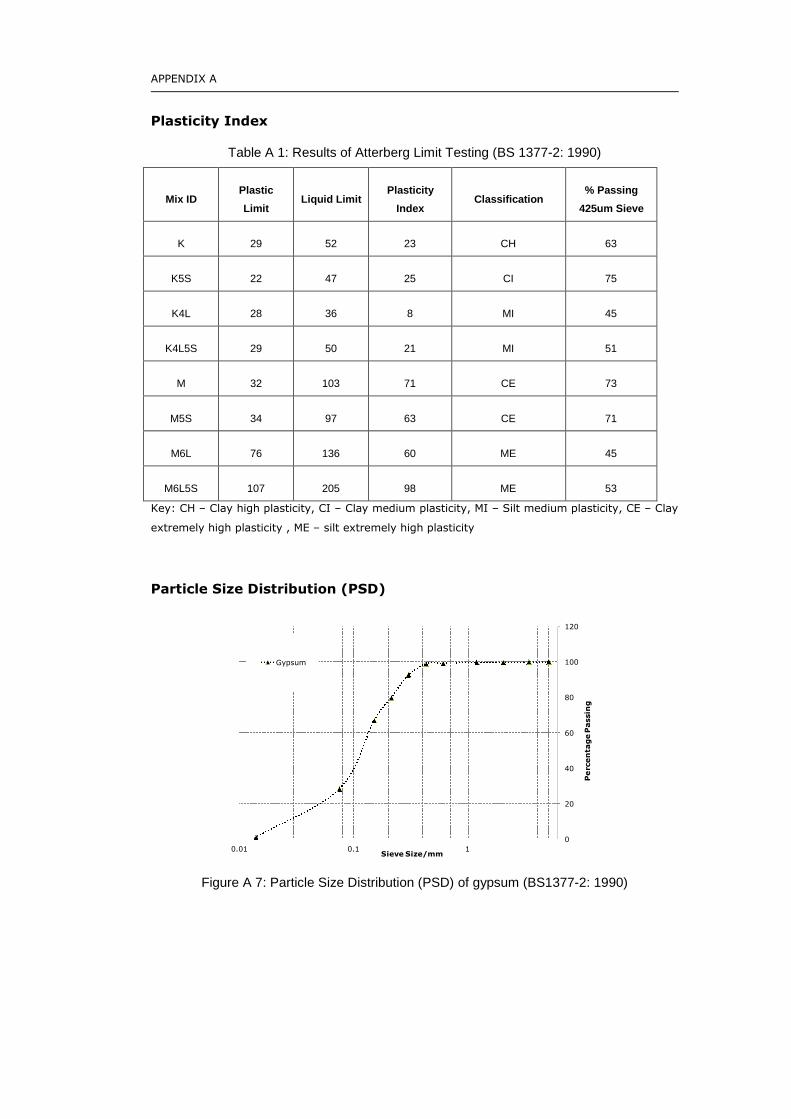
APPENDIX A
Plasticity Index
Table A 1: Results of Atterberg Limit Testing (BS 1377-2: 1990)
Mix IDPlastic
LimitLiquid Limit
Plasticity
IndexClassification
% Passing
425um Sieve
K 29 52 23 CH 63
K5S 22 47 25 CI 75
K4L 28 36 8 MI 45
K4L5S 29 50 21 MI 51
M 32 103 71 CE 73
M5S 34 97 63 CE 71
M6L 76 136 60 ME 45
M6L5S 107 205 98 ME 53
Key: CH – Clay high plasticity, CI – Clay medium plasticity, MI – Silt medium plasticity, CE – Clay
extremely high plasticity , ME – silt extremely high plasticity
Particle Size Distribution (PSD)
Figure A 7: Particle Size Distribution (PSD) of gypsum (BS1377-2: 1990)
0
20
40
60
80
100
120
0.01 0.1 1
Pe
rcen
tag
eP
assin
g
Sieve Size/mm
Gypsum
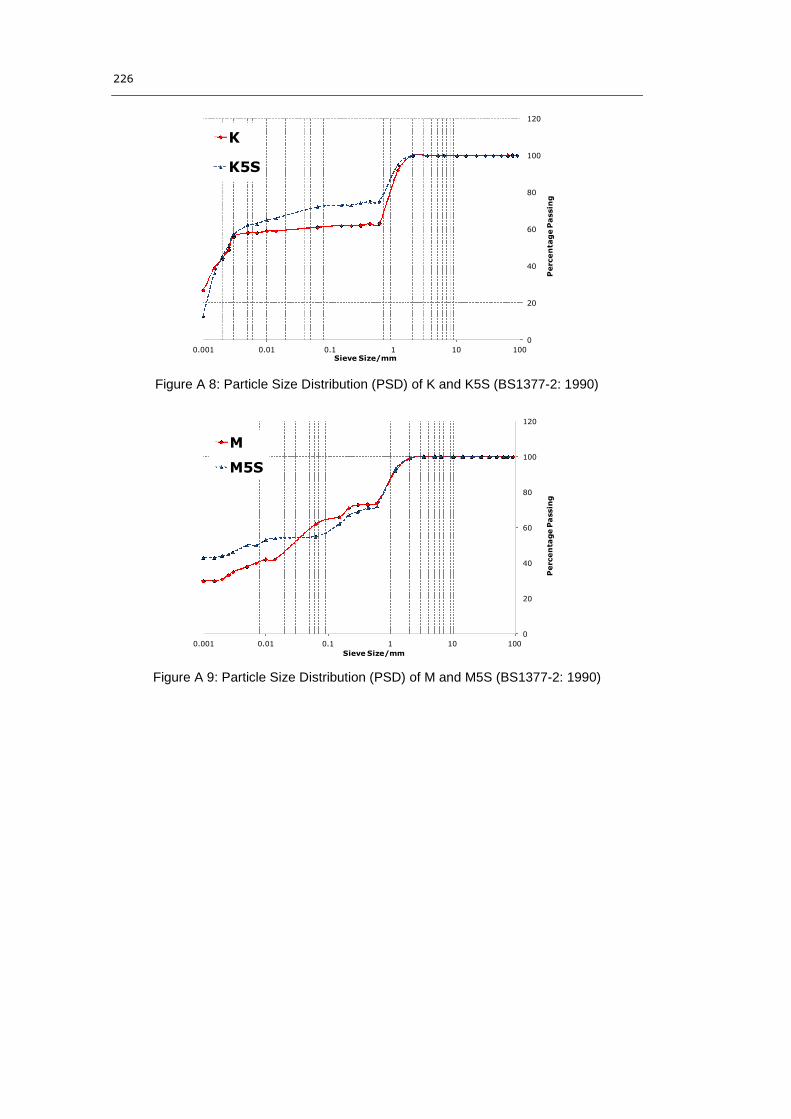
226
Figure A 8: Particle Size Distribution (PSD) of K and K5S (BS1377-2: 1990)
Figure A 9: Particle Size Distribution (PSD) of M and M5S (BS1377-2: 1990)
0
20
40
60
80
100
120
0.001 0.01 0.1 1 10 100
Perc
en
tag
eP
assin
g
Sieve Size/mm
K
K5S
0
20
40
60
80
100
120
0.001 0.01 0.1 1 10 100
Perc
en
tage
Pa
ssin
g
Sieve Size/mm
M
M5S
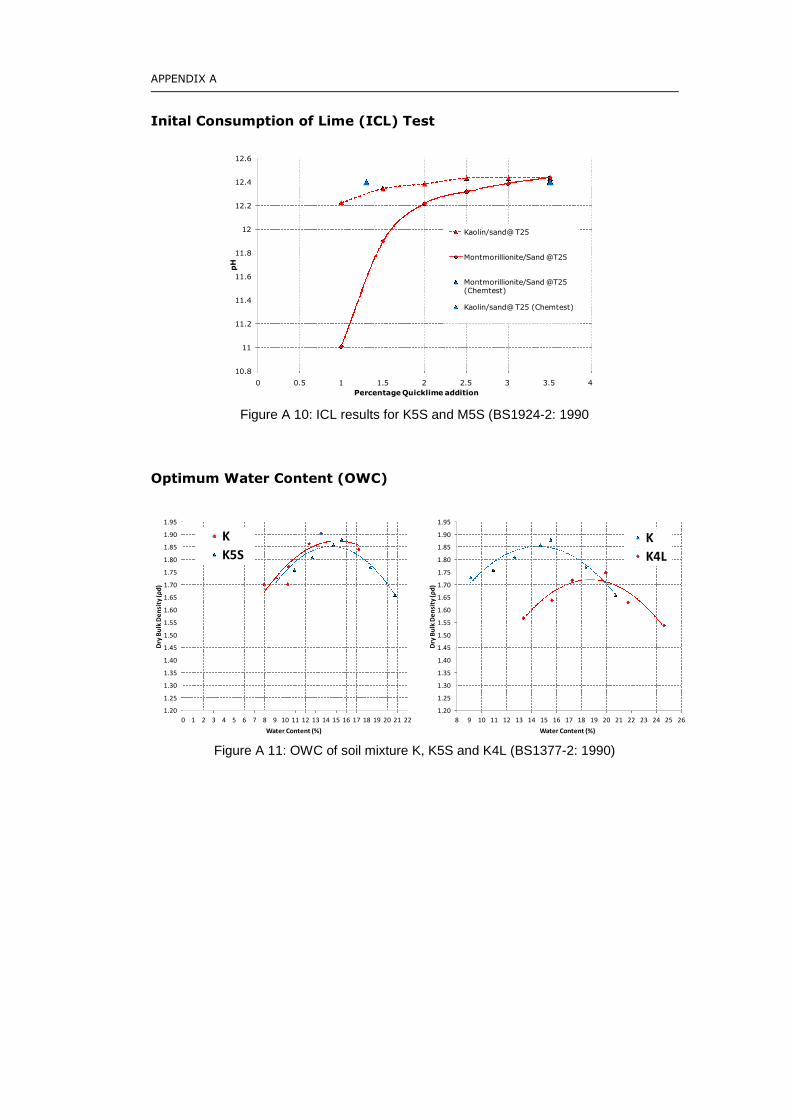
APPENDIX A
Inital Consumption of Lime (ICL) Test
Figure A 10: ICL results for K5S and M5S (BS1924-2: 1990
Optimum Water Content (OWC)
Figure A 11: OWC of soil mixture K, K5S and K4L (BS1377-2: 1990)
10.8
11
11.2
11.4
11.6
11.8
12
12.2
12.4
12.6
0 0.5 1 1.5 2 2.5 3 3.5 4
pH
Percentage Quicklime addition
Kaolin/sand@ T25
Montmorillionite/Sand @T25
Montmorillionite/Sand @T25(Chemtest)
Kaolin/sand@ T25 (Chemtest)
1.20
1.25
1.30
1.35
1.40
1.45
1.50
1.55
1.60
1.65
1.70
1.75
1.80
1.85
1.90
1.95
0 1 2 3 4 5 6 7 8 9 10 11 12 13 14 15 16 17 18 19 20 21 22
Dry
Bu
lkD
en
sity
(ρd
)
Water Content (%)
K
K5S
1.20
1.25
1.30
1.35
1.40
1.45
1.50
1.55
1.60
1.65
1.70
1.75
1.80
1.85
1.90
1.95
8 9 10 11 12 13 14 15 16 17 18 19 20 21 22 23 24 25 26
Dry
Bu
lkD
en
sity
(ρd
)
Water Content (%)
K
K4L
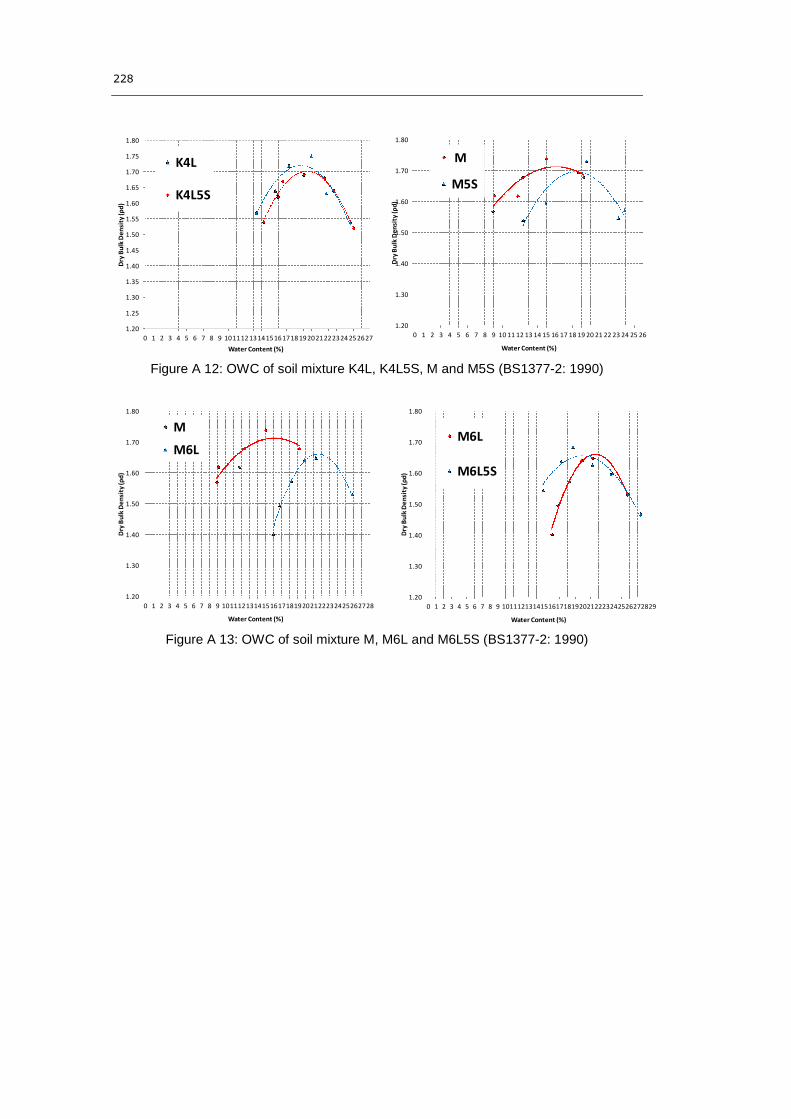
228
Figure A 12: OWC of soil mixture K4L, K4L5S, M and M5S (BS1377-2: 1990)
Figure A 13: OWC of soil mixture M, M6L and M6L5S (BS1377-2: 1990)
1.20
1.25
1.30
1.35
1.40
1.45
1.50
1.55
1.60
1.65
1.70
1.75
1.80
0 1 2 3 4 5 6 7 8 9 101112 131415161718 192021222324 252627
Dry
Bu
lkD
en
sity
(ρd
)
Water Content (%)
K4L
K4L5S
1.20
1.30
1.40
1.50
1.60
1.70
1.80
0 1 2 3 4 5 6 7 8 9 10 11 12 13 14 15 16 17 18 19 20 21 22 23 24 25 26
Dry
Bu
lkD
en
sity
(ρd
)
Water Content (%)
M
M5S
1.20
1.30
1.40
1.50
1.60
1.70
1.80
0 1 2 3 4 5 6 7 8 9 10111213141516171819202122232425262728
Dry
Bu
lkD
en
sity
(ρd
)
Water Content (%)
M
M6L
1.20
1.30
1.40
1.50
1.60
1.70
1.80
0 1 2 3 4 5 6 7 8 9 1011121314151617181920212223242526272829
Dry
Bu
lkD
en
sity
(ρd
)
Water Content (%)
M6L
M6L5S
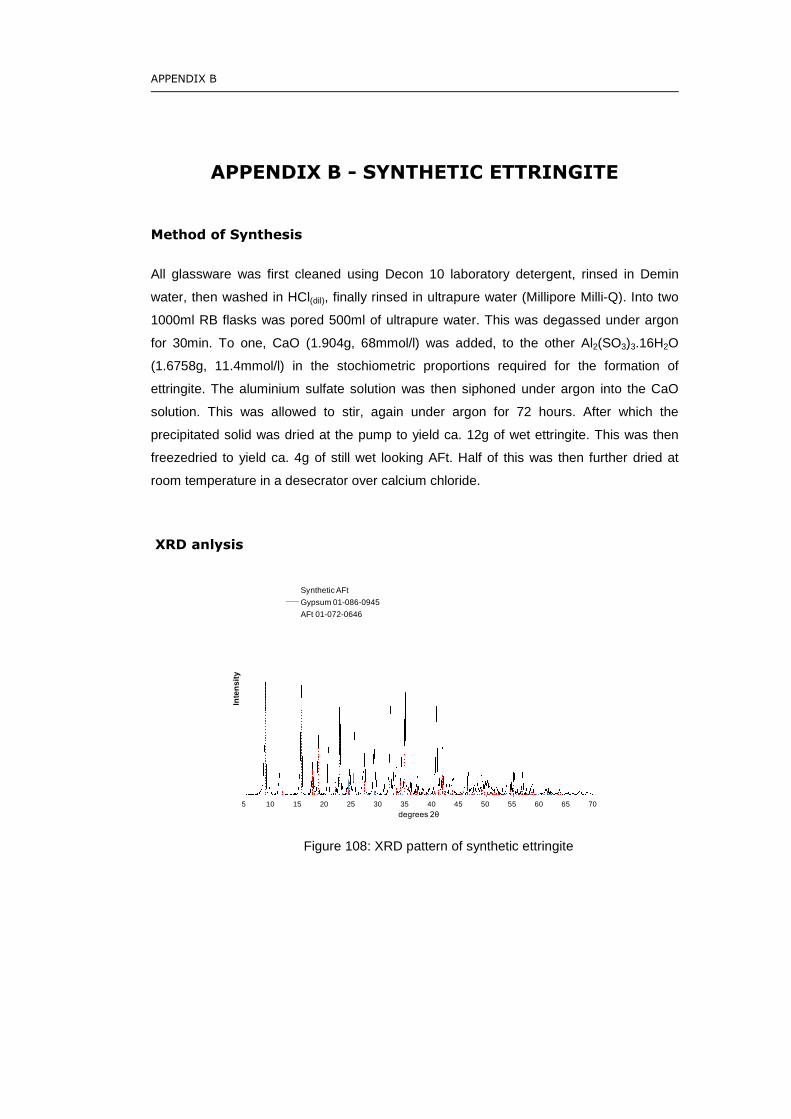
APPENDIX B
APPENDIX B - SYNTHETIC ETTRINGITE
Method of Synthesis
All glassware was first cleaned using Decon 10 laboratory detergent, rinsed in Demin
water, then washed in HCl(dil), finally rinsed in ultrapure water (Millipore Milli-Q). Into two
1000ml RB flasks was pored 500ml of ultrapure water. This was degassed under argon
for 30min. To one, CaO (1.904g, 68mmol/l) was added, to the other Al2(SO3)3.16H2O
(1.6758g, 11.4mmol/l) in the stochiometric proportions required for the formation of
ettringite. The aluminium sulfate solution was then siphoned under argon into the CaO
solution. This was allowed to stir, again under argon for 72 hours. After which the
precipitated solid was dried at the pump to yield ca. 12g of wet ettringite. This was then
freezedried to yield ca. 4g of still wet looking AFt. Half of this was then further dried at
room temperature in a desecrator over calcium chloride.
XRD anlysis
Figure 108: XRD pattern of synthetic ettringite
5 10 15 20 25 30 35 40 45 50 55 60 65 70
Inte
ns
ity
degrees 2θ
Synthetic AFt
Gypsum 01-086-0945
AFt 01-072-0646

230
dTGA of Synthetic Ettringite
Figure 109: dTGA plot of synthetic ettringite
SEM-EDX
Figure 110: SEM-EDX analysis of synthetic ettringite showing AFt (EDX1) and predicated
calcium sulfate (EDX2)
10.5
11.5
12.5
13.5
14.5
15.5
16.5
17.5
0
0.02
0.04
0.06
0.08
0.1
0.12
0.14
0.16
0.18
25 125 225 325 425 525 625 725 825
We
igh
t/m
g
�ĞƌŝǀŝƟǀĞ�t
ĞŝŐŚƚͬ�hŵŝŶЁϷ
Temperature/°C
AFt (DTA)

APPENDIX B
Figure 111: SEM showing AFt agglomerations
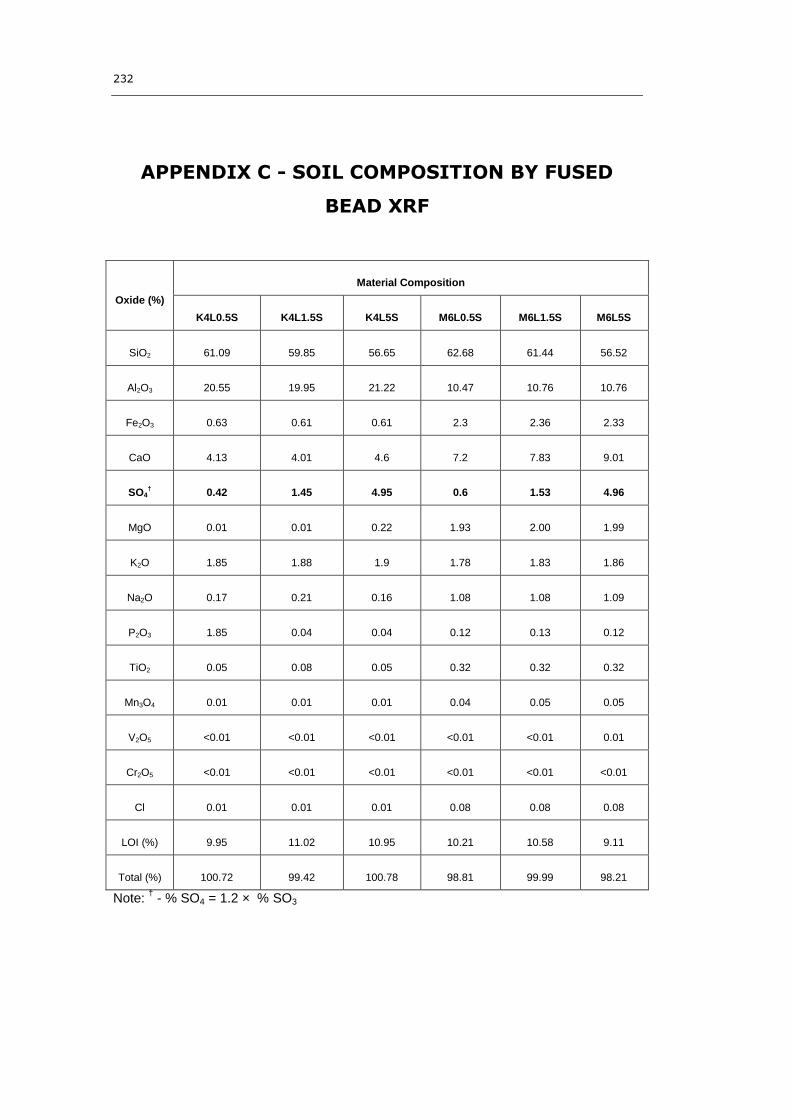
232
APPENDIX C - SOIL COMPOSITION BY FUSED
BEAD XRF
Oxide (%)
Material Composition
K4L0.5S K4L1.5S K4L5S M6L0.5S M6L1.5S M6L5S
SiO2 61.09 59.85 56.65 62.68 61.44 56.52
Al2O3 20.55 19.95 21.22 10.47 10.76 10.76
Fe2O3 0.63 0.61 0.61 2.3 2.36 2.33
CaO 4.13 4.01 4.6 7.2 7.83 9.01
SO4† 0.42 1.45 4.95 0.6 1.53 4.96
MgO 0.01 0.01 0.22 1.93 2.00 1.99
K2O 1.85 1.88 1.9 1.78 1.83 1.86
Na2O 0.17 0.21 0.16 1.08 1.08 1.09
P2O3 1.85 0.04 0.04 0.12 0.13 0.12
TiO2 0.05 0.08 0.05 0.32 0.32 0.32
Mn3O4 0.01 0.01 0.01 0.04 0.05 0.05
V2O5 <0.01 <0.01 <0.01 <0.01 <0.01 0.01
Cr2O5 <0.01 <0.01 <0.01 <0.01 <0.01 <0.01
Cl 0.01 0.01 0.01 0.08 0.08 0.08
LOI (%) 9.95 11.02 10.95 10.21 10.58 9.11
Total (%) 100.72 99.42 100.78 98.81 99.99 98.21
Note:†
- % SO4 = 1.2 × % SO3