PHYSICOCHEMICAL ANALYSIS AND DETERMINATION OF …
77
DSpace Institution DSpace Repository http://dspace.org Chemistry Thesis and Dissertations 2020-11-12 PHYSICOCHEMICAL ANALYSIS AND DETERMINATION OF SELECTED METALS IN DIFFERENT BRAND OF BOTTLED MANGO JUICE IN BAHIDAR CITY, ETHIOPIA TSEHAY, EBESTIE http://hdl.handle.net/123456789/11603 Downloaded from DSpace Repository, DSpace Institution's institutional repository
Transcript of PHYSICOCHEMICAL ANALYSIS AND DETERMINATION OF …

DSpace Institution
DSpace Repository http://dspace.org
Chemistry Thesis and Dissertations
2020-11-12
PHYSICOCHEMICAL ANALYSIS AND
DETERMINATION OF SELECTED
METALS IN DIFFERENT BRAND OF
BOTTLED MANGO JUICE IN BAHIDAR
CITY, ETHIOPIA
TSEHAY, EBESTIE
http://hdl.handle.net/123456789/11603
Downloaded from DSpace Repository, DSpace Institution's institutional repository

BAHIR DAR UNIVERSITY
COLLEGE OF SCIENCE
DEPARTMENT OF CHEMISTRY `
MASTER THESIS ON
PHYSICOCHEMICAL ANALYSIS AND DETERMINATION OF SELECTED METAL S
IN DIFFERENT BRAND OF BOTTLED MANGO JUICE IN BAHIDAR CITY,
ETHIOPIA
BY
EBESTIE TSEHAY
ADVISOR
TIHITINNA ASMELLASH (PhD)
August, 2020
Bahir Dar, Ethiopia

PHYSICOCHEMICAL ANALYSIS AND DETERMINATION OF SELECTED METALSIN
DIFFERENT BRAND OF BOTTLED MANGO JUICE IN BAHIDAR CITY, ETHIOPIA
A THESIS SUBMITTED TO COLLEGE OF SCIENCE POST GRADUATE PROGRAMIN
PARTIAL FULFILLMENT OF THE DEGREE OF MASTER OF SCIENCE IN ANALYTICAL
CHEMISTRY
BY
EBESTIE TSEHAY
ADVISOR
TIHITINNA ASMELLASH (PhD)
August,, 2020
Bahir Dar, Ethiopia

APPROVAL SHEET
This thesis titled on €Physicochemical analysis and Determination of selected metals in
different brand of bottled mango juice in Bahirdar city, Ethiopia• by Ebestie Tsehay
approved for degree ofmasters ofScience inAnalytical Chemistry to the Graduate Program in
Department ofChemistry,College ofScience, Bahir DarUniversity.
Board of Examiners
Atinafu Guadie (PhD)
Name of External Examiner Signature Date
MearegeAmare(PhD)
Name of Internal Examiner Signature Date
Minaleshewa Atlabachew(PhD)
Name ofChairperson Signature Date

DECLARATION
This is to certify that the thesisentitled• Physicochemical analysis and Determination of
selected metals in different brand of bottled mango juice in Bahirdar city , Ethiopia•
submitted in fulfillment of the requirements for the award of the degree of master of sciences in
analyticalto the graduate program ofCollege ofSciences, Bahir Dar university is an authentic
work conducted by Ebestie Tsehayunder the supervision of Tihitinna Asmellash (PhD).
EbestieTsehay ______________ ______________
Student Signature Date
Tihitinna Asmellash (PhD) ______________ ______________
Advisor Signature Date

�i
ACKNOWLEDGEMENT
First and foremost, I want to thank God for helping me during all difficult times of my life and
giving methe strength to dothethesiswork.
My second deepest acknowledgement goes to my advisor Dr. Tihitinna Asmellash for effective
and intellectual guidance, support in fruitful ideas, consistent follow-up, provision of necessary
materials for the research, encouragement and supportthroughout the work devoting her
valuable time and effort, and in general interest on mythesis.
I am also grateful to the Collage of Science and department of chemistry forgive me thechance.
Finally, I would also like to thank my families whoencouraged and prayed for me throughout
the time of my life.

�i�i
TABLES OF CONTENT page
ACKNOWLEDGEMENT...............................................................................................................i
LIST OF TABLES..........................................................................................................................v
LIST OF FIGURES.......................................................................................................................vi
LIST OF ABBREVIATION AND ACRONYM..........................................................................vii
ABSTRACT.................................................................................................................................viii
1. INTRODUCTION...................................................................................................................1
1.1 Background of the Study.................................................................................................. 1
1.2 Statement of the Problem................................................................................................. 2
1.3 Objectives of the Study....................................................................................................2
1.3.1 General Objective........................................................................................................2
1.3.2 Specific Objective.......................................................................................................2
1.4 Significance of the study.................................................................................................. 2
2. LITRATURE REVIEW ..........................................................................................................3
2.1 Fruit.................................................................................................................................. 3
2.2 Mango fruits.....................................................................................................................3
2.3 Mango production in Ethiopia..........................................................................................4
2.4 Nutritional and health benefits.........................................................................................4
2.5 Quality of Fruit Juice........................................................................................................6
2.5.1 Physico-chemical Parameters......................................................................................6
2.5.1.1 pH..........................................................................................................................6
2.5.1.2 Electricalconductivity...........................................................................................6
2.5.1.3 Total Dissolved solids (TDS)................................................................................7
2.5.1.4 Acidity ...................................................................................................................7

�i�i�i
2.5.2 Metals..........................................................................................................................8
2.5.2.1 Macronutrients......................................................................................................8
2.5.2.2 Heavy metal...........................................................................................................9
2.5.2.3 Levels of Heavy Metals in Fruit Juices...............................................................15
3. MATERIALS AND METHODS..........................................................................................16
3.1 Juice sampling................................................................................................................16
3.2 Instruments and Equipment............................................................................................16
3.3 Chemicals and Reagents................................................................................................. 16
3.4 Sample Preparation and Analysis...................................................................................17
3.4.1 Determination of metals............................................................................................17
3.4.1.1 Digestion of Juice sample...................................................................................17
3.4.1.2 Instrument working conditions............................................................................17
3.4.1.3 Instrument calibrations........................................................................................18
3.4.1.4 Method performance and validation................................................................... 18
3.4.2 Physicochemical determination.................................................................................20
3.4.2.1 pH determination................................................................................................. 20
3.4.2.2 Determination of Total Dissolved Solids (TDS) and Electrical Conductivity....20
3.4.2.3 Determining Acidity............................................................................................21
3.5 Statistical Analysis.........................................................................................................21
4. RESULTS AND DISCUSSION............................................................................................22
4.1 Optimizations for Metal Content Determination...........................................................22
4.2 Instrument calibration....................................................................................................23
4.3 Levels of Metals in the four brands of mango juice.......................................................27

�i�v
4.4 Physicochemical Analysis..............................................................................................34
4.4.1 pH..............................................................................................................................35
4.4.2 Total dissolves solids of juice samples......................................................................35
4.4.3 Electric Conductivity (EC) of the samples................................................................36
4.4.4 Acidity value.............................................................................................................36
4.4.5 Correlation matrix among pH, EC, TDS, and TA physicochemical parameters......37
5. CONCLUSION AND RECOMMENDATION....................................................................39
5.1 Conclusion......................................................................................................................39
5.2 Recommendation............................................................................................................40
REFERENCES.............................................................................................................................41
APPENDIX................................................................................................................................... 51

�v
LIST OF TABLES
Table 1: Nutritive value of mango per 100g...................................................................................5
Table 2: Dietary intake of trace elements in the human body and acceptable limit in fruit juice15
Table 3: Operating conditions of ICP-OES..................................................................................18
Table 4: Optimization of Parameters for Wet Digestion of Juice Sample................................... 22
Table 5:Working standards and correlation coefficients of the calibration curves for
determinations of metals in mango juice sample...........................................................24
Table 6: RSD result of metalanalysisfor mango juice samples................................................25
Table 7: Method detection and quantification limits (mg/L) for Mango Juice............................26
Table 8: The Mean ± SD concentrations (mg/L) and significance value of metals were found in
mango juice sample........................................................................................................27
Table 9: Comparison of study metals concentration (mg/L) in mango juice with the reported
values.............................................................................................................................32
Table 10: pH, EC, TDS and Acidity results in juice samples from four brands...........................34
Table 11: Comparison of some physicochemical parameter in mango juice with Literature
Values............................................................................................................................37
Table 12: Correlation matrix among the physicochemical parameters of mango juices samples38
Table 13: Optimization of Parameters for Wet Digestion of Juice Sample by using HNO3 ........51
Table 14: Optimization of Parameters for Wet Digestion of Juice Sample by using HNO3 and
HCl................................................................................................................................. 52
Table 15: One way ANOVA test value for Physical parameter of four mango juice brand........53
Table 16: Post Hoc Tests for multiple comparison of mango juice..............................................54
Table 17: One way ANOVA test value for metal analysis of Ca, Cr, Cu, Fe, Mg, Mn, and Zn.. 57
Table 18: Tukey HSD multiple comparisons test for metal analysis of Ca, Cr, Cu, Fe, Mg, Mn,
and Zn............................................................................................................................59

�v�i
LIST OF FIGURES
Figure 1:Physiological roles of Mn (Li and Yang, 2018).............................................................11
Figure 2: Health effect of cadmium in humans (Sharma et al., 2015)..........................................14
Figure 3: Calibration curve of intensity verses concentration for Mn, Zn, Cd, and Pb................23

�v�i�i
LIST OF ABBREVIATION AND ACRONYM
ANOVA‚‚‚‚‚‚‚‚... Analysis of Variances
FAO ‚‚‚‚‚‚‚‚‚‚ Food and agricultural organization
ICP-OES‚‚‚‚‚‚‚‚ Inductively Coupled Plasma OpticalEmission Spectroscopy
SD ‚‚‚‚‚‚‚‚‚‚...
TA‚‚‚‚‚‚‚‚‚‚...
Standard deviation
Titrated acid
TDS ‚‚‚‚‚‚‚‚‚‚ Total dissolved solid
WHO ‚‚‚‚‚‚‚‚‚.. World Health Organization

�v�i�i�i
ABSTRACT
Mango juice has health and nutritional benefits-issue of uniformity. However, it may also
contain highlevel ofmetals or additives, causinga health problem and affect the quality of the
juice. Therefore, the mainpurpose of this studywas to assess the physicochemical
characteristicsand determine the metal contentof mango juicein Bahir Dar City. Four brands
of mango juice samples(3D, Prigat, Rani, and Texas)were collected and analyzed for
physicochemical( pH, TDS , EC and acidity value), essential metal(Mg, Ca, Cr, Ni, Mn, Zn, Fe
, andCu) and non-essential metal(Cd and Pb). Metalswereanalyzed by ICP-OES, andacidity
valuewas estimated bytitration. Statistical analysis(ANOVA) was alsodone for physicochemical
parameterand metal analysisof among four brandsof juices.Theobserved results ofquality
parameters of studiedmango juices werefound to have a pH range of 3.24€ 3.93, TDS of 571.6
€ 2088 mg/L, Electrical conductivity of 867.3€ 1374 µs/cm and acidity of 0.24€ 0.33 %, and
Metal content of calcium (0.40€ 69.50 mg/L), magnesium (6.1€ 36.4mg/L), chromium( 0.14
€ 0.16mg/L), manganese( 0.22€ 0.86mg/L), nickel (0.28mg/L) in texas brand but not detect
in other brand, iron ( 0.92€ 9.00 mg /L), copper (0.34€ 0.62mg/L), zinc ( 0.41€ 9.80 mg/L),
cadmium (0.01 € 0.02 mg/L ) in the three brand3D, Prigat and Rani respectively, and lead
doesnot detected inall samples. This study indicates the valuesof physicalparameters and
acidity were closeto literature valuewhereas, the obtained resultsof mostmetal (Mn, Cr, Ni,
Cu, Fe and Zn were aboveliterature value. The results of this studycan be taken as an
indication for the need of control in packing juice.
Keywords: mangojuice; physicochemical;essential metal; toxic metal

�1
1. INTRODUCTION
1.1 Background of the Study
The manufacture of juices from fruits and vegetables is older than agriculture(Bateset al.,
2001). Fruit drinks are popularly used in most urban households.Historically, the utilizationof
fruit juices began with consumption of orange juice, as a source of vitamin C to prevent scurvy.
However, today markets are flooded with a large variety of juicessuch as:mango, apple, guava,
litchi, grape, pineapple(Gupta and Gupta, 2008). The main reason for increased consumption is
changing lifestyles and rising level of health consciousness among consumers. Theyhave
health benefit and are well consumed for their nutritivevalue, mineral and vitamin contents
(Bikila Wedajo, 2019). These functional components are protective against degenerative and
chronic diseases such as cancer and cardiovascular diseases(Dragstedet al., 1993). for these
reasonrecent dietary guidelines have recommended high fruitconsumption(Ackahet al., 2014).
Mango juice is considered as the most preferred non-alcoholic beverage worldwide to all age
groups(Amin et al., 2018). They have high nutritive value,vitamins, carotenoids, minerals, and
metals(Islamet al., 2015, Tantratianet al., 2018). Phytochemical & antioxidantcomponents of
Mango Juice are so beneficial to prevent many diseases along with cancerand heart disease
(Khanam et al., 2018). They have been considered as a delicious, nutritious popular drink.
However, apart from their advantage, they should have acceptable physicochemical
characteristics andfree fromchemical contaminateor toxic metals. Therefore, the main aim of
this work was to assess the physicochemical qualityand the metal contentof mango juices
collected from super market.

�2
1.2 Statementof the Problem
Mango juice is considered as the most preferred non-alcoholic beverage worldwide to allor any
age groups. It is an important source of macronutrientssuch as vitamins and minerals.Due to
that the consumption of mango juice continues to increase. The quality of juice depends on the
growing conditions,the processing and storageprocedures.Therefore, it is quite important to
know the physicochemical qualityand metal contentof the increasingly popularfruit juices
available in the market.Hence, determination of these parameters of some commercially packed
mango juices will help consumers to know the present scenarioor the condition ofprocessed
juice.
1.3 Objectivesof the Study
1.3.1 General Objective
The general objective of this study was to determine thephysicochemicalcharacteristicsand
Metal contentsof bottledmangojuice in fourbrands.
1.3.2 Specific Objective
ðØ To determinepH, EC,TDS, and Acidity values in four brandsof mango juice
ðØ To establish/develop a working procedure for the digestion of mango juice sample
ðØ To determine the levels of some essentialmetal (Mg, Ca, Cr, Ni, Mn, Zn, Fe, andCu) and
non-essential metal (Cd and Pb) in mangojuice sample collected from bahir dar super
market.
ðØ To compare the variation of data betweenbrands
1.4 Significance of the study
This study helps to have better understanding and awareness aboutquality of mango juice in the
market, andmoreover the studywill be used as baseline informationfor future researches on
safety of fruit juice. It helps to aware people about the health risks that possibly associated with
consuming ofpackedfruit juice.

�3
2. LITRATURE REVIEW
2.1 Fruit
The term ƒfruit„ is applied to acritical stagewith in the reproduction of botanical species
throughout the plant kingdom. Botanically, fruit is a plant organ, the principal biological purpose
which is to protect and eventually nourish the seed(s) as part of the natural plant propagation
(Bateset al., 2001).They are made up of chiefly cellulose, hemi-cellulose and pectin substances
that give them their texture and firmness.It is a greatimportance in the diet because of the
presence of vitamins and mineral salts. In addition, they contain water, calcium, iron, sulphur
and potash(Ihesinachi and Eresiya, 2014).The constituents of biological active substances in
fruit give beneficial effects on human health such as antioxidants, anticarcinogens, antimutagens
and antibacterial(Elmaet al., 2019).
2.2 Mango fruits
Mango (Mangifera indica L) is one of the 73 genera of the family Anacardiaceae and order
Sapindales(Mhamed and Ahmed, 2015).There are several species of genusMangiferathat bear
edible fruit. The majority of trees that are commonly known as mango belong to the specie,
Mangifera indica. Mangiferaoriginates from tropical Asia, with larger number of species found
in Borneo, Java, Sumatra, and the Malay Peninsula. The most cultivatedMangifera species, M.
indica (mango), originatesfrom India and Myanmar(Bally, 2006).
Mango is also known as the ƒking of fruit„ due to itsconsumptionin most parts of the world and
its numerous health benefits(Chataet al., 2018).Theycontainsome important nutrients for good
health such as fibre and vitamin C, and alsoaid the digestion of food inhuman body system
(Olaniyan and Obajemihi, 2014).They arean excellent source of fibre and bioactive compounds
such as provitamina carotenoids, vitamin C and phenolic that can easily be degraded during
processing and storage. Fruits and vegetables, being rich sources of nutrients, have been of
interest due to their potential health benefits in preventing several chronic diseases(Slavin and
Lloyd, 2012).

�4
2.3 Mango production in Ethiopia
Ethiopia is agro-ecologically diverse and has a total area of 1.13 million km2. Many parts
of the countryare suitable for growing temperate, sub-tropical or tropical fruits. For example,
substantial areas in thesouthern and south-westernparts of the country receive sufficient
rainfall to support fruits adapted to therespective climatic conditions.In addition, there are
also many rivers and streams which could be used to grow various fruits(Faris, 2016). The
climatic and soil conditions of Ethiopia allow cultivation of a wide range of horticultural crops.
The country has a vast potential for production of fresh fruit and vegetable varieties for domestic
and export markets for Negibourere countrieslike Djibouti, Somalia and the Middle East(Abebe
and Bizayehu, 2019). The major fruits produced and exported are banana, citrus fruits, mango,
avocado, papaya and grape fruits(Zeberga, 2010).
Ethiopia has a potential irrigable area of 3.5 million ha with net irrigation area of about 1.61
million ha, of which currently only 4.6 % is utilized(Honja, 2014). Mango is produced mainly in
Harari region, west and east Oromia, Southern Nations, Nationalities, and People's Region
(SNNPR) and Amhara(Bezu et al., 2015). More than 47 thousand hectares of land is under fruit
crops in Ethiopia. Mangoes contributed about 12.61% of the area allocated for fruit production
and tookup 12.78% of fruit production with comparedto other fruits growing in the country and
the annualconsumption of mango by the processing plant at full production capacity is 8.6 tones
which is only 1.8% of the current production of mango(Girmaet al., 2016). However, less than
2% of the produce is exported(Joosten, 2007). But, according to CSA (2013) cropping season
mangoes contributed about 14.21% of the area of land allocated for fruit production and holds
14.55% of quintals of fruits produced in the country(Honja, 2014).
2.4 Nutritional and health benefits
Mangos are an extremely nutritious and contain carbohydrates, proteins, fats,minerals,vitamins
(table 1).It has been well documented that mango fruits are an important source of
micronutrients, vitamins and other phytochemicals. Moreover, provide energy,dietary fibre,
carbohydrates, proteins, fats and phenolic compounds(Parvez, 2016).which area vital to normal
human growth, development andhealth. Thisnutrient plays a crucial role in human nutritionand
health. For instance, deficiency in vitamin A can lead to reversible night blindness and

�5
keratinization of normal mucous tissue of the eye, lungs skin and other ectodermic tissues. Lack
of vitamin B1 can cause beriberi (edema and heart hypertrophy). Again deficient in vitamin C
which is a vitamin for humans and primates results in scurvy(Ampomah-Nkansah, 2015).
Studies have attributed regular consumption of mango prevent certain type of cancer, better iron
assimilation, and high immune response. In addition, it containchemical componentsincluding
carotenoid, anthocyanin,chlorophyll and phenols that contribute to theoverall nutritional
properties of the fruit(Jolayemi, 2019).
Table1: Nutritive value of mango per 100g
Nutrients Ripe mango Unripe mango
Protein (g) 0.6 0.7
Fat(g) 0.4 0.1
Minerals (g) 0.4 0.4
Fiber (g) 0.7 1.2
Carbohydrates (g) 16.9 10.1
Energy (kcal) 74 44
Vitamin C (mg) 16 3
Total carotene (mcg) 2,210 90
Beta carotene (mcg) 1,990 -
Potassium (mg) 205 83
Sodium (mg) 26 43
Calcium (mg) 14 10
Iron (mg) 1.3 0.33
Phosphorous (mg) 16 19
Source:(Ravani and Joshi, 2013)

�6
2.5 Quality of Fruit Juice
Food quality is one of the most importantfactors fordifferentiatetheconsumer„s perception and
acceptance, attraction to, and purchase of the product. Fruitjuices are a highly attracted, tasty
food, and usually have exceptional nutritional qualities. However, they can be a potential source
of toxic elements, some of themhaving an accumulative effect or leading to nutritional problems
due to the low concentrations of essential elements, justifying the control of mineral composition
in juice(Deheleanet al., 2016). Several factors need to beconsidered forassessingthequality of
fruit juice. The composition of a fruit juice depends on the variety, origin and growing conditions
of the fruit, its quality and the processing and storage procedures(Ndife et al., 2013).Apart from
nutritive value of the juice, it should have acceptable organoleptic and physicochemical
characteristics aswell as free fromchemicalcontaminants.
2.5.1 Physico-chemical Parameters
2.5.1.1 pH
pH is a measure of the active acidity which is defined as the logarithm of the reciprocal of
hydrogen ion concentration in gram per liter (Ganapathyet al., 2019). They give also
information about food stability and preservation, and it can be used to retard microbial spoilage
that could happen in the presence of some pathogens such as bacteria, molds, and yeasts.This is
usually best growing rate in the pH range of 6.5-7.5. In consideration of the fact that almost all of
the pathogenic agents and most of deterioration bacteria cannot grow at pH < 4.5 (Karastogianni
et al., 2016).
2.5.1.2 Electrical conductivity
Electrical conductivity or specific conductance is a property of (food)material that measures
ability to conduct an electric current. Ohmic heating process is influenced, in a number of ways,
by electrical conductivity of the food material(Lamsal and Jindal, 2014).

�7
2.5.1.3 Total Dissolved solids(TDS)
Total Dissolve Solid (TDS) is one of the more important quality factors for most fruit juices.
Dissolved solids refer to any minerals, salts, metals, cations or anions dissolved in water, and
they are related to both sugar and fruit acid. They are main contributors of pectin, glycosidic
material, salt of metals and electrolytes sodium, potassium, calcium etc. TDS content is
significantly influenced by the combined effect of storage of maturity and ripening conditioned
are more important quality factors formost fruit juices (Tasnimet al., 2010).
2.5.1.4 Acidity
Acids are added to beverages and compose a…avor pro†le giving the beverage a distinctive taste
and provide a tartness and tangy taste that helps to balance the sweetness of sugar present in the
beverage; they are key factors in the taste of the beverage. Such as: Phosphoric acid is added to
cola drinks to impart tartness, reduce growth of bacteria and fungi, and improve shelf-life. Citric
acid, a substance naturally occurring in citrus drinks and added to many others, imparts a tangy
…avor and functions as a preservative(Reddyet al., 2016). Fruit juice is composed mainly of
organic acids and sugars, which are used as the main index of maturity and one of the major
analytical measures of flavor quality (Karadeniz, 2004). Organic acids are naturally found in
vegetables and fruits and maybe formed during processes like fermentation or may be added into
food during the manufacturing process. The organic acid composition of fruits is also of interest
due to its impact on the sensory properties. Citrus fruits, one of the important fruit crop groups,
are consumed mostly as fresh or as juice because of their nutritional value and special flavor.
Consumption of citrus juice is found to be beneficial in preventing coronary diseases and chronic
asthma (Abd-Ghafaret al., 2010).

�8
2.5.2 Metals
2.5.2.1 Macronutrients
Plant nutrients are classified as macronutrients and micronutrients. €Macronutrient• refers to
elements needed in large amounts, and €micronutrient• signifies nutrients that are essential to
plants but are needed only in small amounts. The micronutrients are Fe, Zn, Mn, B, Cu, Mo, Cl,
and Ni (Zekri and Obreza, 2003). Macronutrients basically perform a counter role in various
metabolic processes of plants and human beings, and are therefore required in large quantities for
their survival .On the basis of their functions; macronutrients have been classified into two
groups: primary macronutrients, i.e., N,P, and K, and secondary macronutrients, i.e., Ca, Mg,
and S(Tripathi et al., 2014).
Calcium is an essential macro elementof the human body. It is majordeposited in the bones and
teeth, where it provides structure and mechanical strength(Krupa-Kozak and Drabi‡ska,2016).
Inadequate intakes of calcium have been associated with increased risks of osteoporosis,
nephrolithiasis (kidney stones), colorectal cancer; hypertension disorders have treatments but no
cures (WHO, 2009). Owing to a lack of compelling evidence for the role of calcium as a single
contributory element in relation to these diseases, estimates of calcium requirement have been
made on the basis of bone health outcomes, with the goal of optimizing bone mineral density.
Calcium is unique among nutrients, in that the body„s reserve is also functional: increasing bone
mass is linearly related to reduction in fracture risk (WHO, 2009).
The major source of calcium in the diet is milk and milk products, providing over 40% of
calcium intake in adults, followedby cereals and cereal products providing 30% Main dietary
sources(Theobald, 2005) . Vegetables and fruits, cereals, dairy products, cereals are the rich
sourcesof calcium (Hanet al., 2003). Calcium was found to be higher in Mango juice, Multiunit
juice and pulpy orange juice and it is of important because of its role in teeth, bone, muscular
system and heart function (Brody, 1994).
Magnesium is the fourth most common mineral in thehuman body after calcium, sodium, and
potassium and is the second most common intracellular cation after potassium. It is involved in
more than 300 enzymatic reactions in the body, participating in the metabolism of glucids, lipids,
proteins, and nucleicacids, in the synthesis of H2 transporters(Laireset al., 2004) .Within the

�9
frame of a 70 kg individual, there is an average of 25grams of Mg in reserve with 53%in bone,
27 %in muscle, 19% in soft tissues, and less than 1% in the serum. Although serum Mg
concentration (SMC) is tightly controlled with a normal serum value of 75ˆ 95 mmol/L, some
research indicated that serum levels less than 85 mmol/L should be considered deficient
(Schwalfenberg and Genuis, 2017).
Primary magnesium deficit originates from two etiological mechanisms: deficiency and
depletion. Deficiency is due to insufficient intake, and depletion is due to deregulation of factors
controlling magnesium status such as intestinal magnesium hypo absorption, urinary leakage,
reduced magnesium bone uptake and mobilization, hyperglucocorticism, insulin-resistance and
adrenergic hypo receptivity. Secondary magnesium deficit results from various pathologies and
treatments: non-insulin dependent Diabetes mellitus, alcoholism, or ingestion of
hypermagnesuric diuretics, etc.(Laires et al., 2004). Mg plays an important role in protein
synthesis.Green leafy vegetables, fruits, cereals, legumes, sea foods arethe richest sources
of Mg (Welshet al., 1992).
2.5.2.2 Heavy metal
Heavy metals have density at least five times heavier than that of water and they are stable
elements that cannot be metabolized by the body(Bedassaet al., 2017).And are not
biodegradable and have the potential for accumulation in the different body organs leading to
unwanted side effects(Verma et al., 2016). They are found naturally in the earth and become
concentrated as a result of human activities. Common sources are mining and industrial wastes;
vehicle emissions; lead-acid batteries; fertilizers, paints and treated woods(Rajeswari and
Sailaja, 2014).
Heavy metalsareclassified as essentialand non-essential. Essential heavy metals and their roles
have been recently documented(Izahet al., 2016). They are beneficial to human health and other
living things. However, essential heavy metals can be toxic to living things when the
concentration exceeds the tolerable limit for the organisms. Non-essential heavy metals could be
toxic to cells of thebody even at low concentrations(Pb, Cd and As) (Anastácio et al.,
2018).Whereascopper, iron, chromium and nickel are essential metals sincethey play an
important role inbiological systems(Abd-Allah and Ismail, 2017).

�1�0
Copper is one of the essential elements that has been found to be important in our biological
systems that acts as a cofactor in more than 30 types of enzymes(Yahyaet al., 2016).Theyactas
a prosthetic group in several key enzymes and is thus essential for the structure and function of
thebone marrow and nervous system(Jaiser and Winston, 2010). Cu deficiencyhas been linked
to a variety to clinical signs, including pale coat, poor sheep fleece quality, anemia, spontaneous
fractures, poor capillary integrity, myocardial degeneration, hypomyelinization of the spinal
cord, impaired reproductive performance, decreased resistanceto infectious disease, diarrhoea
and generalized ill-health(Hefnawy and El-Khaiat, 2015).
Although copper homeostasis plays an important role in the prevention of copper toxicity,
exposure to excessive levels of copper can result in a number of adverse health effects including
liver and kidney damage, anaemia, immune toxicity, and developmental toxicity. Many of these
effects are consistent with oxidative damage to membranes or macromolecules. Copper can bind
to the sulfhydryl groups of several enzymes, such as glucose-6 phosphatase and glutathione
reductase, thus interferingwith their protection of cells from free radical damage(AKAKI et al.,
2018).
Manganese is an essential nutrient necessary for a variety of metabolic functions including
those involved in normal human development, activation of certain metalloenzymes, energy
metabolism,immunological system function, nervous system function, reproductive hormone
function, and in antioxidant enzymes that protect cells from damage due to free radicalsspecies
(Avila et al., 2013). It is a component of arginase, pyruvate carboxylase and superoxide
dismutase and plays a role as co-factor of certain enzyme systems.

�1�1
Figure1:Physiological roles of Mn(Li and Yang, 2018)
Dietary consumption is the primary route of Mn intake for majority of people. Drinking water
contains Mn levels ranging from 1mg/L up to 2 mg/L depending on the locations and
contamination. Inhuman daily diets, rice, nuts (hazelnuts, almonds, andpecans), whole grains
(wheat germ, oats, and bran)and legumes contain the highest levels of Mn, leafygreen
vegetables, tea, chocolate and seafood (clamsand mussels) are also abundant in Mn(Chenet al.,
2019). Manganese deficiency resulting from poor diet alcoholism and malabsorption causes
dwarfism, hypogonadism anddermatitis. Its presence in environment and consequent uptake by
humans causes pulmonary manifestation, fever, chills and gastroenteritis(Chataet al., 2018).
Zinc is an essential traceelementfor all forms of life(Bhowmik et al., 2010), it is essential for
growth and development, testicular maturation, neurological function, wound healing and
immune competence(Christianson, 1991). Zn is known to serve as the active center of
about 300 enzymes(Yanagisawa, 2004). The best food sources of zinc include meat based
products, especially the most abundant meat, such as chicken, lamb, beef, rabbit meat, oysters,
scallops, blackfish, animal liver, and so on. Othersources of Zinc include, mushrooms, day

�1�2
lily flowers, edible fungus, cabbage, black sesame, black rice, dates, hazelnut, ebony and other
vegetables, food crops and fruit(Devi et al., 2014).
Zinc is such a critical element in human health that evena small de†ciency is adisaster. Lack of
zinc leads toanorexia,loss of appetite, smell and taste failure, andother symptoms in humans
and may affect the immunesystem, triggering arteriosclerosis and anemia(Chasapiset al.,
2012).
Iron is an essential nutrient for humans and has a considerable impact on several physiological
processes such as production of oxidative energy, transport and storage of oxygen(Pynaert et al.,
2005). As a micronutrientit is a component of many enzymes which are involved in diverse
biochemical processes including respiration, photosynthesis and N2 fixation (Abbaset al., 2015).
Additionally Fe is an indispensable mineral needed for the production of hemoglobin, asa
cofactor for several enzymes necessary for proper functioning of brain, and for the immune
system and muscle(Beard, 2001). Furthermore, iron is used to help produce the connective
tissues in our body, some of the neurotransmitters in our brain, and to maintain the immune
system(Casiday and Frey, 1998).
Chromium is anubiquitous metal, occurring inwater, soiland biological systems.(Lewicki et
al., 2014). It occurs in almost all oxidation states ranging from-2 to +6. But in environment Cr is
mostly stable in trivalent and hexavalent form(Shekhawatet al., 2015). Hexavalent chromium
(Cr6+) is the second most stable form and a strong oxidising agent, especially in acidic media. It
is bound to oxygen as chromate (CrO42ˆ ) or dichromate (Cr2O7
2ˆ ) with a strong oxidative
capacity. This form of Cr crosses biological membranes easily, reacting with protein components
and nucleic acids inside the cell while being deoxygenated to Cr3+. The reaction with genetic
matter provides for thecarcinogenic properties of Cr6+ (Pechovaand Pavlata, 2007). Human
exposure to sufficiently high chromium concentrations would result in potential harm through its
toxic, genotoxic and carcinogeniceffects.Chromium is one of eight metals in the top 50 toxic
substances in the world in the data issued by the Agency for Toxic Substances and Disease
Registry (ATSDR), and WHO has classified chromium as carcinogenic to human beings
(Achmad and Auerkari, 2017) . Release of Crcompounds to the environmentis mainly due to
electroplating, leather tanning, metal finishing, corrosion control and pigment manufacturing
industries (Liuet al., 2011).

�1�3
Nickel is one of the essential elements found in abundance in the earth„s crust occurring at an
average concentration of about 75‰g/g(Poonkothai and Vijayavathi, 2012),however, excessive
amounts of Ni can be toxic(Nishidaet al., 2015). Higher concentration of nickel in human body
maycause respiratory diseases, birth defects, heart diseases and lung failure(Khan et al., 2016).
And may cause gastrointestinal and cardiovascular disorder, liver damage, and carcinogenic
effect (Tan et al., 2018).Although Ni is a recognized essential mineral nutrient element for
higher plants, its agricultural and biological significance is poorly understood. This is largely
because of the low levels thought to be needed by plants (about 1ˆ 100 ng g-1 dry weight) in
relation to the relative abundance of Ni in essentially all soils (.5 kg ha-1) (Bai et al., 2006). Ni
is usually accumulated in vegetative part of the plant body and it is mobile through the
plant structure, translocate and concentrated in the leaves but after ageningness of the
leaves it is moved to the seeds for accumulation (Cataldoet al., 1978).According to
ATSDR (1999),Lower content of Ni in vegetables and fruits sourcescan leadto increased
blood sugarlevel, hypertension and deficient growth in human but on the other hand the
increaseduptake of Ni in fruitsand vegetables can reduced the blood glucose level, difficulty
in breathing, nausea etc.
Cadmium is typically a metal of the 20th century, even though large amounts of this by-product
of zinc production have been emitted by non-ferrous smelters during the 19th century. Currently,
Cd is mainly used in rechargeable batteries and for the production of special alloys. Although
emissions in the environment have markedly declinedIn most industrializedcountries,They
remains a source of concern for industrial workers andfor populations living in polluted areas,
especially in less developed countries(Bernard, 2008). Cadmium is widely used in industrial
processes, e.g.: as an anticorrosive agent, as a stabilizer in PVC products, as a colour pigment, a
neutron-absorber in nuclear power plants, and in the fabrication of nickel-cadmium batteries
(Godtet al., 2006). It has toxic effects on many organs and tissues especially on kidneys, bones,
and lungs(Yanget al., 2018).
Cadmiumaccumulates in the human body affecting negatively several organs: liver,kidney,
lung, bones, placenta, brain and the central nervous system andother damages that have been
observed include reproductive, and development toxicity, hepatic, haematological and
immunological effects(Slezakova et al., 2014) . Cadmium is present at low levels in most foods,
�1�4
with commodities such as cereals, fruits, vegetables, meat and fish. These foodstuffs are minor
contributors to overall intake of cadmium, as they are eaten in relatively small amounts, and it is
unlikely to exceed the allowed dailyintake (ADI) forcadmium (Hassanet al., 2014).
Figure2: Health effect of cadmium in humans(Sharmaet al., 2015)
Lead is considered as one of the most hazards and cumulative environmental pollutants that
affect all biological systems through exposure to air, water, and food sources(Assi et al.,
2016).Such poisoning occurs from different kinds of human �related activities such as painting of
home, smoking �related activities,leaded petrol, contaminated food, and drinking water;
smelting; and especially from the industries, which have been carrying out manufacturing
processes(Al Muktadir et al., 2019). It is primarily the causative agent of disorders of the central
and peripheral nervous systems in humans(MurtiŠ et al., 2014).Lead toxicity is a particularly
insidious hazard with the potential of causing irreversible health effects. It is known to interfere
with a number of body functions and it is primarily affecting the central nervous, hematopoietic,
hepatic and renal systemproducing serious disorders(Flora et al., 2012). Acute toxicity is
related to occupational exposure and is quite uncommon. Chronic toxicity on the other hand is
much more common and occurs at blood lead levels of about 40ˆ 60 ug/dL. It can be much more
severe if not treated in time and is characterized by persistent vomiting, encephalopathy,
lethargy, delirium, convulsions and coma(Flora et al., 2012, Flora et al., 2006). Leadwas not

�1�5
dominant in all juice and nectar samples.Levels of lead in fruits and vegetables generally are
stringently regulated in the European Union (EU) by Fruit Juice Directive 2001/112/EC&
2009/106/EC. Additional source of lead in the diet is from food containers containing lead, e.g.
storage in lead-soldered cans, ceramic vessels with lead glazes and leaded crystal glass. Finally,
the past use of lead as a material for water pipes(Hassanet al., 2014).
2.5.2.3 Levels of Heavy Metals in Fruit Juices
Dietary exposure to heavy metals, namely Cd, Pb, Zn and Cu has been identified as a risk to
human health through the consumption of vegetable crops. At higher concentrations, they may
be toxic to the biota and could disturb the biochemical process and cause hazards(Ihesinachi and
Eresiya, 2014). Many metals such as arsenic (As), cadmium (Cd), chromium (Cr), nickel (Ni)
and their compounds may be mutagenic at levels above the maximum permissible limits.
Mutagens are capable of causing mutations in the DNA of an organism above the natural
background level. These mutations cause cancer. Some metals such as As, Cd and Pb can
volatilize during high temperature processing. These metals will convert to oxides and condense
as fine particulates(Smith, 1995).
Table2: Dietaryintake of trace elements in the humanbodyand acceptable limit in fruit juice
No. Essential trace elements Diet mg/day WHO/FAO (2010)
Acceptable Limit
(mg/kg)in fruit juice
1 Chromium 0.05ˆ 0.1 -
2 Iron 15.0 0.80
3 Zinc 8.0- 15.0 99.40
4 Nickel 0.4 0.14
5 Manganese 2.2- 8.8 0.30
6 Cobalt 0.3 2.00
7 Copper 3.2 0.05ˆ 0.5
8 Cd - 0.10
Source:(Anwaret al., 2014).

�1�6
3. MATERIALS AND METHODS
3.1 Juice sampling
Four types ofbottled mango juicesamples (Prigat, 3D, Raniand Texas) were collected from
supermarket found in Bahir dar city, Amhara region, Ethiopia. A total of 12 samples were
collected. For each type of juice three samples were collected and placed in analytical laboratory
for further treatment and analysis.
3.2 Instruments and Equipment
ICP-OES (Perkin Elmer Optima 8000),pH meter(25 CW MICROPROCESSOR), conductivity
meter (YSI PRO 30), Fumehood (Envair England), hot plate, beaker (50 and 100 ml), Funnel,
Whatman filter paper, volumetric flask (25 mL), measuring cylinder (10, 25 and 50 mL),
Burette,conical flaskand Erlenmeyerflask were used.
3.3 Chemicals and Reagents
All the reagents and chemicals used in this study wereof analytical grade. Hydrochloricacid
(36%-UNI CHEM), Nitric acid (69%-OXFORD LAB CHEM), NaOH (Alphax chemical
industry, India), phenolphthaleinIndicator,Standardsolutions of each metal (Mg, Ca, Fe, Cu,
Mn, Zn, Cr,Ni, Cd, andPb) wereused.Distilled waterand deionized waterwas used throughout
the experimentfor sample preparationand rinsing of the apparatus.

�1�7
3.4 SamplePreparation and Analysis
3.4.1 Determination of metals
3.4.1.1 Digestion of Juice sample
Digestion procedure was carried out according to Musa and Parmeshwal, (2018) with slight
modification. In order to analyze metals present in juice samples efficiently, different
procedures for sample digestion were carriedout and the one that consumed smaller reagent
volume, temperature with smaller digestion time and producedcolor less andclear solutions with
no residue and suspended matter was selected for the routine digestion of the samples. Based on
the selection optimizing procedure a 5 mL of Mango juice sample was accurately measured and
transferred in to 50 mL conical flask and added with 3 mL of (HNO3 ˆ HCl) acid mixture in a
volume ratio of 1:1. The mixture was heated to 90 ºC on hot plate, and the digestion continued
until no brown fumes evolved and solution becomes clear and colourless. The sample solution
was then cooled, diluted andfiltered with filter paper in toa 25 mL ofvolumetric flask with
distilled water.
Blank sample was prepared by taking 5mLdistilled water and adding 3mL of (HNO3 ˆ HCl)
mixture in it. Placed it on the hot plate and heated to 90ºC in it which will give a clearand
colorlesssolution. Then the solution was cooled filtered and diluted it up to a mark of 25 mL
volumetric flask.
3.4.1.2 Instrument working conditions
All metal analysis were carried out on an ICP-OES (Perkin Elmer Optima 8000).The instrument
was operated underthe conditions shown in Table 3.

�1�8
Table3: Operating conditions of ICP-OES
No Parameters Value
1 Plasma flow 8 min-1
2 Auxiliary flow 0.2 min-1
3 Nebulizer flow 0.7 min-1
4 RF power 1500 W
5 Pump flow rate 1 mL min-1
3.4.1.3 Instrument calibrations
The instrument used for analysis, ICP-OES, was calibrated using working standards for each
metal of interest. Triplicate readings were taken for each working standard solutions. The
correlationcoefficientsrangeobtained for the calibration curves for Mg,Ca, Cr,Mn, Fe, Ni, Cu,
Zn, Cd, and Pb were0.985-0.999, it confirming avery good positive correlation. Finally, the
procedure was used for the determination of elements in the sample solutions and digested blank.
3.4.1.4 Method performance and validation
ICP-OES is method of choice for analysis of heavy metals in food and pharmaceutical products
because of its low detection limits and its high degree of selectivity (Tanet al., 2018). Before
being used for quantitative analysis of metals ( Mg , Ca, Cr, Mn, Fe ,Cu, Zn ,Ni, Cd , and Pb)
in juice sample, ICP-OES was validated by determining some analytical parameters, namely
linearity , sensitivity ,precision, and accuracy.
�1�9
Determination of Detection and Quantification Limits
Method of detection limitis defined as the minimum concentration of analyte that can be
measured. In other words, it is the lowest analyte concentration that can be distinguished from
statistical variations in a blank, which usually correspond to the signal of blank three times the
standard deviation of the blank(Gerenfeset al., 2019). In this study, the detection limit of each
element was calculated as three times the standard deviation of the blank which is summarized in
(Table 6).Mathematically given by:
MDL=3‹ (1)
Where, ‹ standard deviation; MDL is method detection limit
Limit of quantification is the lowest concentration of the analyte that can be measured in the
sample. The limit of quantification is the same as the concentration that gives a signal 10 times
the standard deviation of the blank (Tanet al., 2018). The quantification limit of each element
was calculated as ten times the standard deviation of the blank mathematically given by:
�= �1�0 (2)
Where, ‹ standard deviation; MQL is method of quantification limit
Recovery Test
Recovery is one of the most commonly used techniques utilized for validation of the analytical
results and evaluating how far the method is acceptable for itsintended purpose. To determine
the efficiency of the method, a recovery study was carried out. This was done by spikinga
known concentrationof the metalsof interest(Mg, Ca, Cu, Cr, Mn, Zn, Fe, Ni, Cd and Pb)in to
juice samples prior to digestion and analyzed using after pretreatment and digestion(Ajai et al.,
2014). Spike recoveries were calculatedAccordingto the following formula:
�% �="�
�× �1�0�0�% �(�3�)

�2�0
Relative standard deviation (RSD)
Relative standard deviation is the parameter of choice for expressing precision of methods.
Precision is typically evaluated by measuring the values of relative standard deviation (RSD) of a
set of data. It is an analytical procedure expresses the closeness of agreement (degree of scatter)
between a series of measurements obtained from multiple sampling of the same homogenous
sample under the prescribed conditions(Tanet al., 2018). Relative standard deviation (RSD) can
be expressed as a percentage:
�= ��1�0�0�% �(�4�)
Where, is standard deviation; is mean
3.4.2 Physicochemicaldetermination
3.4.2.1 pH determination
pH meter (25 CW MICROPROCESSOR) was used for analysis the pH of mango juice sample.
Prior to using, it was calibrated using buffer solutionsacidic (4) and neutral (7).After calibration,
100ml of sample was taken in the beaker andfinally, the electrode ofthe pH meter was
immersed in a glass beaker containing the samples and reading were obtained from photo
detector of the pH meter. Where the reading was taken and recorded immediately for each
sample. The meter was rinsed with distilled water after and before each measurement. Each
sample was analyzed in triplicate reading in order to be sure that the recorded readings are
reliable.
3.4.2.2 Determination of Total Dissolved Solids (TDS) and ElectricalConductivity
Electrical conductivity and total dissolved solids (TDS) was analyzed using portable digital
conductivity meter (YSI PRO 30). Before measurement, the multi meter was calibrated using
Distilled water. 500mL of juice sample was taken in a glass tube and the meter was immersed in
a glass tube containing the sample and read directly on scale of sector. Then the meter gives the
accurate result of electric conductivity and TDS of every juice samples in unit µs/cm and mg/L
respectively. Between every sample reading the electrodes were continuously rinsed with
distilled water.

�2�1
3.4.2.3 Determining Acidity
Acidity wasestimated by titration with 0.1 M NaOH using phenolphthalein as indicator.10ml of
juice sample was taken in a 250 ml beaker and added 50 ml water into the beaker. It was mixed
properly. Then 3 drops ofphenolphthalein indicator was added to the juice water solution. The
solution was titrated by the standard 0.1 M NaOH(Islam et al., 2015). The burette reading was
recorded.The results were calculated as anhydrous citric acid (%).
�% �=�×
!��× �1�0�0�% �(�5�)
Where,acidity factor = 0.0064
3.5 Statistical Analysis
Data analysis was performed by usingthe statistical software packages SPSS 21(IBM Corp,
USA). Each dataset consisted of a matrix, in which the columns represented the individual
concentration of Mango juicesamples, and the rows consist of the concentration in mg/L of all
the detected metals determined. One-way analysis of variance (ANOVA) was used to test for the
presence of significant differences in the mean concentrations of metals, pH value, TDS value,
E.C value and acidityamong the four Brands.Differences were considered significant when p<
0.05. Samples were digested intriplicate and also analyzed in triplicate.Karl Pearson„s
correlation coefficients were determined for analysis of correlation among thesomeparameters
and origin software was usedto drawingthe calibration curve of standard solution.

�2�2
4. RESULTSAND DISCUSSION
4.1 Optimizations for Metal Content Determination
In optimizing the digestion procedure, different procedures for the samples were tried and as can
be seen in (Table 4) alternative, consumed smaller reagent (acid) volume, smaller digestion time
and a colorless solution with no residue was obtained. On this basis total reagent volume 6 mL
(3mL HNO3 and 3mL HCl), at a temperature of 90oC for 45 min were chosen as the working
conditions. The blank solutions were prepared by digesting the mixture of reagents following the
same digestion procedure as the samples and diluted with distilled water.
Table4: Optimization of Parameters for Wet Digestion ofJuice Sample
HNO3 (mL) HCl (mL) Total Temp.(oC) Time (min) Observation(Result)
1 0 1 105 45 Yellow
2 0 2 105 45 Yellow
4 0 4 105 45 Yellow
4 0 4 105 60 Yellow
1 1 2 105 60 Yellow
1 2 3 105 60 Yellow
2 1 3 105 60 Yellow
3 2 5 105 60 Light Yellow
3 3 6 105 60 Colorless and
clear
3 3 6 90 60 Colorless and
Clear
3 3 6 90 45 Colorless and
clear
3 3 6 90 30 Lightly yellow
3 3 6 80 45 light yellow
3 3 6 80 60 Light yellow
Bold = Optimized Conditions

�2�3
Therefore, the procedure with total of 6mL reagents volume (3 mL HNO3 and 3mL of HCl),
heating at 90oC and 45 min digestion time was selected for this study.
4.2 Instrument calibration
Calibration curve for Standard Solutions
Calibration curves were used to understand the instrumental response to the metal analyzed and
predict the concentration in an unknown sample. Accordingly, a set of standard solutions were
prepared at various concentrations with a range that includes the unknown of the metal
concentration. In this regard, Calibration curves were prepared for each metal to determine their
concentration in the mango juice sample .A series of standards were prepared from the stock
standard solutions of 1000 mg/L by diluting with distilled water for each metal and a calibration
curve was plotted for each metal to determine their concentrations in juice samples. The
calibration curves forsomestudied metals are shown in Figure.
�-�2 �0 �2 �4 �6 �8 �1�0 �1�2 �1 �4 �1�6
�0�.�0
�2�.�0�x�1�0�7
�4�.�0�x�1�0�7
�6�.�0�x�1�0�7
�8�.�0�x�1�0�7 �M �n
�y� �=�(�3�.�1� �x� �1�0�5 �)� �+�(�5�.�9� �x� �1�0�6 �)�x
�R�2 �=� �0�.�9�9�9�5�3
�I�n�t�e
�n�s�
i�t�y
�C �o�n �c�e�n �t�r�a�t�i�o �n � �(�m �g�/�L �)
�-�2 �0 �2 �4 �6 �8 �1 �0 �1 �2 �1 �4 �1 �6
�0�.�0
�5�.�0�x�1�0�5
�1�.�0�x�1�0�6
�1�.�5�x�1�0�6
�2�.�0�x�1�0�6
�Z �n
�y� �=�(�1�.�8� �x� �1�0�4�)� �+�(�1�.�3� �x� �1�0�5�)�x
�R�2 �=� �0�.�9�9�8�0�7
�I�n�t�e
�n�s�
i�t�y
�C �o�n �c�e�n �t�r�a�t�i�o �n � �(�m �g�/�L �)
�-�2 �0 �2 �4 �6 �8 �1 �0 �1 �2 �1 �4 �1 �6
�0
�1 �x�1�0�6
�2 �x�1�0�6
�3 �x�1�0�6
�4 �x�1�0�6
�5 �x�1�0�6
�C �d
�y� �=�(�8�.�7� �x� �1�0�4�)� �+�(�3�.�7� �x� �1�0�5 �)�x
�R�2 �=� �0�.�9�9�1�4�5
�I�n�t�e
�n�s�
i�t�y
�C �o�n �c�e�n �t�r�a�t�i�o �n� �(�m �g�/�L �)�-�2 �0 �2 �4 �6 �8 �1 �0 �1 �2 �1 �4 �1 �6
�0 �.�0
�5�.�0 �x�1�0�4
�1�.�0 �x�1�0�5
�1�.�5 �x�1�0�5
�2�.�0 �x�1�0�5
�2�.�5 �x�1�0�5
�3�.�0 �x�1�0�5
�P�b
�y� �=�(�7�.�9� �x� �1�0�3�)� �+�(�2� �x� �1�0�4 �)�x
�R�2 �=� �0�.�9�8�5�5�5
�I�n�t�e
�n�s�
i�t�y
�C �o�n �c�e�n �t�r�a�t�i�o �n� �(�m �g�/�L �)
Figure3: Calibrationcurve of intensity verses concentration for Mn, Zn, Cd, and Pb
�2�4
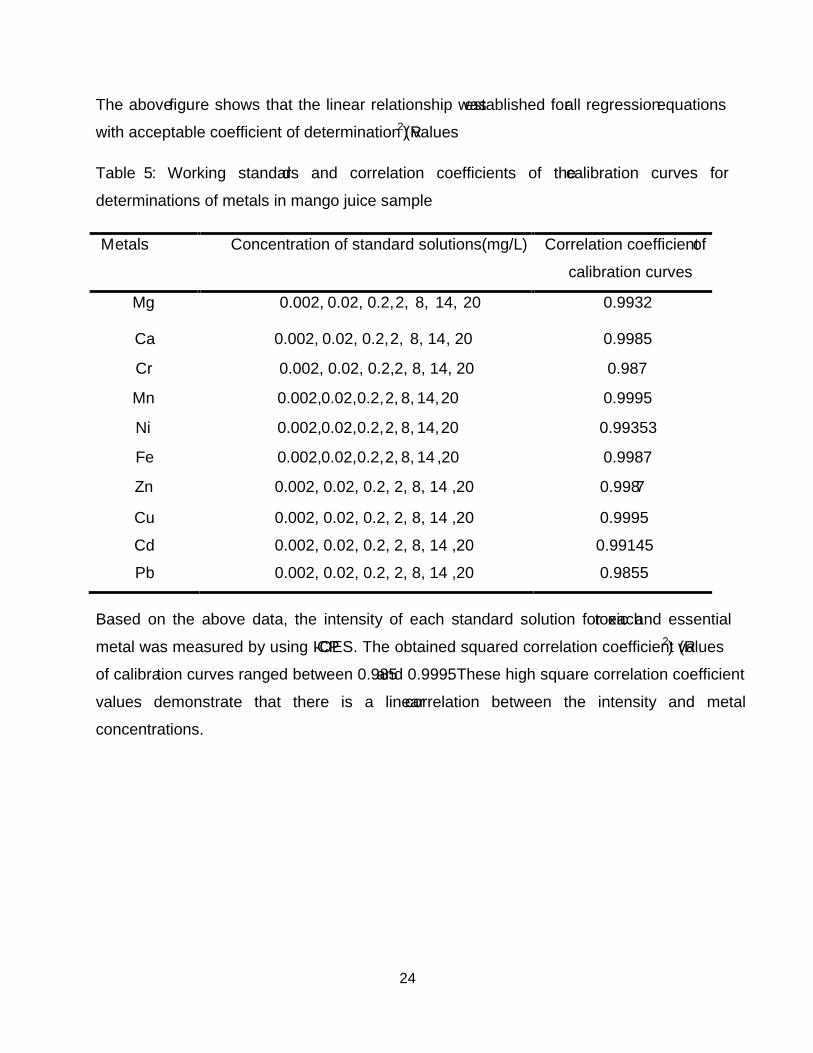
The abovefigure shows that the linear relationship wasestablished forall regressionequations
with acceptable coefficient of determination (R2) values
Table 5: Working standards and correlation coefficients of thecalibration curves for
determinations of metals in mango juice sample
Metals Concentration of standard solutions(mg/L) Correlation coefficientof
calibration curves
Mg 0.002, 0.02, 0.2,2, 8, 14, 20 0.9932
Ca 0.002, 0.02, 0.2,2, 8, 14, 20 0.9985
Cr 0.002, 0.02, 0.2,2, 8, 14, 20 0.987
Mn 0.002,0.02,0.2,2, 8, 14,20 0.9995
Ni 0.002,0.02,0.2,2, 8, 14,20 0.99353
Fe 0.002,0.02,0.2,2, 8, 14 ,20 0.9987
Zn 0.002, 0.02, 0.2, 2, 8, 14 ,20 0.9987
Cu 0.002, 0.02, 0.2, 2, 8, 14 ,20 0.9995
Cd 0.002, 0.02, 0.2, 2, 8, 14 ,20 0.99145
Pb 0.002, 0.02, 0.2, 2, 8, 14 ,20 0.9855
Based on the above data, the intensity of each standard solution for eachtoxic and essential
metal was measured by using ICP-OES. The obtained squared correlation coefficient (R2) values
of calibration curves ranged between 0.985and 0.9995. These high square correlation coefficient
values demonstrate that there is a linearcorrelation between the intensity and metal
concentrations.

�2�5
RSD value
The RSD values for precision were shown in Table 6. The resulted %RSD values were below
10%. It indicates that the measured data for metal determination in juice samples was highly
precise, and itcan be stated that the ICP-OES method was shows good precision for
determination metal in juice.
Table6: RSD resultof metalanalysisfor mango juice samples
Metal RSD
(%)
Mg 0.3
Ca 0.37
Cr 0.71
Mn 0.87
Fe 0.62
Ni 0.36
Cu 0.18
Zn 0.13
Cd 4.08
Pb 2.92

�2�6
Detection and Quantification Limits
As observed from the table 6, theMDL and MQL values for each metal (Mg, Ca, Cu, Cr, Mn,
Ni, Zn, Fe, Cd, and Pb) were greater than the IDL values. Theseindicated that the selected
analytical method was good or ICP-OES Instrument able to detect the minimum concentration of
analyte.
Table7: Method detection and quantification limits (mg/L) for Mango Juice
Metal MDL MQL IDL(mg/L)
Mg 0.014 0.046 0.0016
Ca 0.03 0.1 0.01
Cr 0.009 0.03 0.0071
Mn 0.003 0.01 0.0014
Fe 0.009 0.03 0.0046
Ni 0.06 0.2 0.015
Cu 0.03 0.1 0.0097
Zn 0.006 0.02 0.0059
Cd 0.006 0.02 0.0027
Pb 0.063 0.21 0.042
Generally,Evaluation ofanalytical method parameters including linearity, sensitivity, precision,
and accuracy showed acceptable results. Therefore,the method can be successfully used for
determination of Mg, Ca ,Cr, Mn , Ni , Fe , Cu, Zn, Cd ,and Pb in mango juice sample.
�2�7
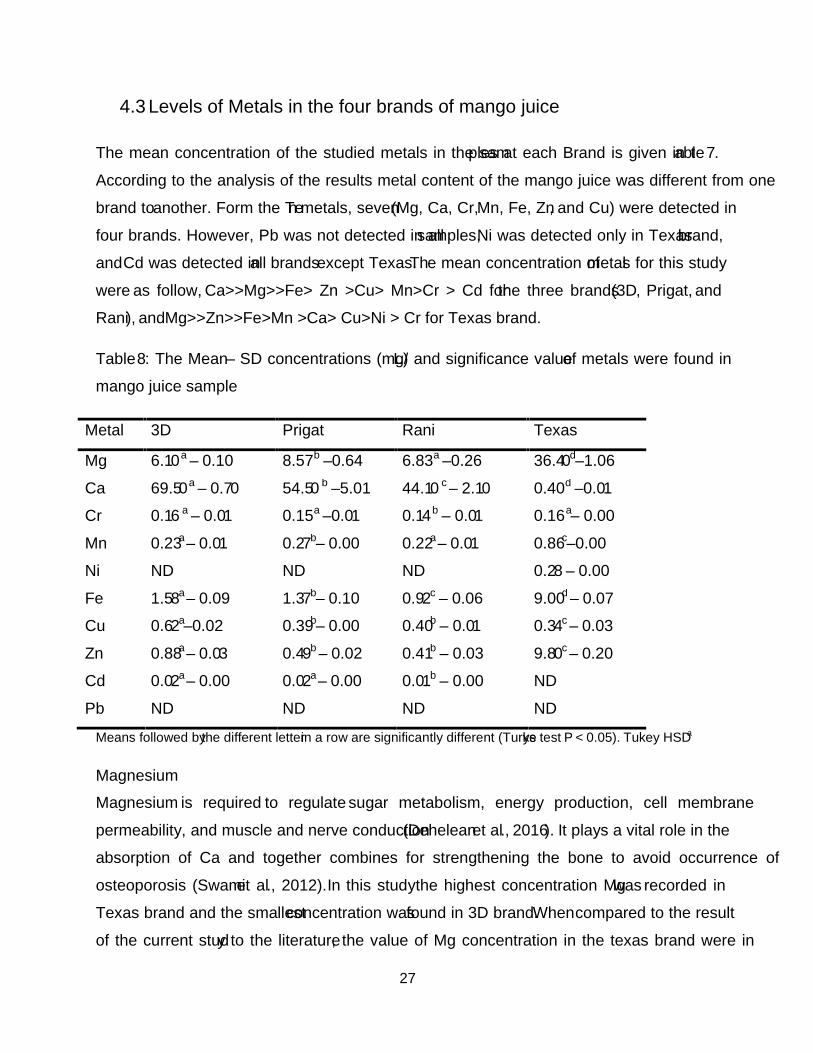
4.3 Levels of Metals in the four brands of mango juice
The mean concentration of the studied metals in the samples at each Brand is given in table7.
According to the analysis of the results metal content of the mango juice was different from one
brand toanother. Form the Ten metals, seven(Mg, Ca, Cr,Mn, Fe, Zn, and Cu) were detected in
four brands. However, Pb was not detected in allsamples,Ni was detected only in Texasbrand,
andCd was detected inall brandsexcept Texas.The mean concentration ofmetals for this study
were as follow, Ca>>Mg>>Fe> Zn >Cu> Mn>Cr > Cd forthe three brands(3D, Prigat, and
Rani), andMg>>Zn>>Fe>Mn >Ca> Cu>Ni > Cr for Texas brand.
Table8: The Mean± SD concentrations (mg/L) and significance valueof metals were found in
mango juice sample
Metal 3D Prigat Rani Texas
Mg 6.10a ± 0.10 8.57b ±0.64 6.83a ±0.26 36.40d±1.06
Ca 69.50a ± 0.70 54.50 b ±5.01 44.10 c ± 2.10 0.40d ±0.01
Cr 0.16 a ± 0.01 0.15a ±0.01 0.14b ± 0.01 0.16a± 0.00
Mn 0.23a± 0.01 0.27b± 0.00 0.22a± 0.01 0.86c±0.00
Ni ND ND ND 0.28 ± 0.00
Fe 1.58a± 0.09 1.37b± 0.10 0.92c ± 0.06 9.00d ± 0.07
Cu 0.62a±0.02 0.39b± 0.00 0.40b ± 0.01 0.34c ± 0.03
Zn 0.88a± 0.03 0.49b ± 0.02 0.41b ± 0.03 9.80c ± 0.20
Cd 0.02a± 0.00 0.02a± 0.00 0.01b ± 0.00 ND
Pb ND ND ND ND
Means followed bythe different letterin a row are significantly different (Turkey„s testP < 0.05). Tukey HSDa
Magnesium
Magnesium is required to regulate sugar metabolism, energy production, cell membrane
permeability, and muscle and nerve conduction(Deheleanet al., 2016). It plays a vital role in the
absorption of Ca and together combines for strengthening the bone to avoid occurrence of
osteoporosis (Swamiet al., 2012).In this studythe highest concentration Mgwas recorded in
Texas brand and the smallestconcentration wasfound in 3D brand.Whencompared to the result
of the current study to the literature, the value of Mg concentration in the texas brand were in

�2�8
agreement with those reported in Fruit juice 13.07ˆ 140.42 mg/LDehelean and Magdas,(2013).
The Permissible Levels of Mg in Fruit Juice Samples were < 8mg/L that could be reportedby
FAO/WHO (1992).However, themagnesium concentration in Prigat (8.57 mg/L) and Texas
(36.40mg/L) were abovethose limits. Magnesium sulphate is usually added to juiceas a
preservative(Deheleanet al., 2016). This could be a reason for high concentration of Mg in the
two type of juice.One-way ANOVA test showed that the meanconcentrations of Magnesium
weresignificant difference (P < 0.05) among four brands.
Calcium
Calcium ismajor found in our bones and teeth.It also regulates cell membrane permeability to
control nerve impulse transmission and muscle contraction, and it is important for blood clotting,
and it regulates hormonal secretion and cell division (Deheleanet al., 2016). The calcium
contents of the analyzed juices ranged from 0.40to 69.5 mg/L. Mean comparison of calcium
contents in juices sample characterized in increasing order of the metal level (mg/L)
0.40<44.10<54.50< 69.50 for Texas <Rani < Prigat< 3D juicerespectively. Suleiman and
Gaila, (2013) reportedthat, 0.44mg/L concentration of Ca in mango juice sample taken from
Nigeria were comparablewith texas (0.40mg/L) juice in this study. The observed values of Ca in
three juices (Prigat, Rani and 3D) are mostly in good agreement with the reported average
concentration range of 21.54- 338.35 mg/Lby Deheleanand Magdas,(2013).
Deheleanet al., (2016)also reportedthat, Ca concentrationwas0.42 mg/L to 107.40 mg/L in
commercial juices sampletaken from Romanian,this result agreed withpresentstudy.Calcium
ascorbate or calciumchloride isaddedin the production processof juice to prevent enzymatic
browningor to enrich the products in vitamin C, prevent changes in the smell and as antioxidants
and acidity regulators(Deheleanet al., 2016). Thesemay be a reason forpresenceof higher
calcium in three juices sample (3D, Prigatand Rani).
One-way ANOVA test showed that, the mean concentrations of calcium was significant
difference (P < 0.05) among four brands.

�2�9
Chromium
Chromium is commonly found in foodstuffs, as it enhances the action of insulin and functions in
mammalian glucose metabolism which is very vital to humans(Eneji et al., 2015). Previously, it
was thought that toxic effects of chromium are seldom seen; recently however, the safetyof the
dosage forms ofchromium hasbeen questioned. It is important to be aware that individual
patients with type2 diabetes mellitus might have increased risk of hypoglycaemic episodes with
accumulation of chromium, and also it can cause damage to the liver, kidney, nose, lungs; and
possible asthma attack(Kleefstraet al., 2004). The concentration of Cr in all sampleswas3D
(0.16 mg/L), Prigat (0.15 mg/L), Rani (0.14mg/L) and Texas (0.16mg/L). The chromium levels
observed inthis studywere higherthan thechromium levels reportedby Ajai et al., (2014), and
Abdel-Rahmanet al., (2019). Franciscoet al., (2015) reportedthat, Packing materials used for
juice contain 0.2% of Crtherefore;it could be one reason for the high concentration of Cr
detection in this study.One-way ANOVA test showed, there was significant difference (P <
0.05) among the mean concentrations of Cr in the Juice samples. However, the difference was
not significancebetween threesamples (3D,Prigat, andTexas)from the turkey analysis.
Manganese
Manganese is an essential trace element that plays a role in bone mineralization, protein and
energy metabolism, metabolic regulation, cellular protection from damaging free radical species
and the formation of glycosaminoglycans(Coleset al., 2012). Insufficient of Mn in the body can
result in anaemia while its accumulation in humans results to gastrointestinal disorder, cancer,
respiratory problem (Blaurock, 2009). It was detected in four brands with a concentrationof 3D
(0.23), Prigat (0.27), Rani (0.22) and Texas (0.86mg/L).except Texas brand, theresult of this
study agreed with previous study reported by Enejiet al., (2015),andwerecomparable to those
reported byAbdel-Rahmanet al., (2019), with in mangojuiceMn concentrationwas0.24to 0.32
mg/L. The result from oneway ANOVA revealed that, except the values between 3D and Rani,
the Mn valued observed has significance difference between the brands.

�3�0
Iron
The average concentrationof Femetal in the samples ranged from 0.92ˆ 9.00 mg/L. Fe being 4th
abundantly elementfound on the earth crust,and it is an importancein the entire human
biochemistry.For instance, process of hemoglobin (blood pigment) generation entirely depends
upon iron contentsof the body (Akhtaret al., 2015), and it was a core component of the red
blood cells which is present in most foods and beverages. Its deficiency can cause anemia (Eneji
et al., 2015b). Its concentration was observed lowest in RaniJuiceand highest in Texas sample.
Based on the average of samples, their concentration shows Rani< Prigat < 3D< Texas with
respective concentration of 0.92, 1.37,1.58, and 9.00mg/L. Except the result obtained for Texas
sample, all result obtained in the present study are significantly lower than the result obtained by
Ajai et al.,(2014).The Permissible Levels of Fe in Fruit Juice samplesset byFAO/WHO (1992)
were 15mg/L. However, theconcentration of Fe in all sampleswas below those limits.The
ANOVA testshowed, Fe concentration aresignificantly differences among the samples.
Nickel
Nickel is an element that occurs in the environment only at very low levels and is essential in
small doses, but it can be dangerous when the maximum tolerable amounts are exceeded
(Adepoju-Bello et al., 2012). This can cause various kinds of cancer on different sites of the
body. It is found in small quantities in many foodstuffs (0.001ˆ 0.01 mg/kg) and in higher
concentrations in foodstuffs such as grains, nuts, cocoa products and seeds (up to 0.8 mg/kg)
(Eneji et al., 2015b). In this studyNi was detected only in the Texas brand with a concentration
of 0.28mg/L. The result was abovethoseprevious studiesby Ackahet al, (2014), Deheleanet
al., (2016)with reportednickel level in mango juice 0.055, 0.155mg/L respectively. According
to the Companhia Siderúrgica Nacional (National Steel Company of Brazil, CSN), which
is responsible for the production of steel sheets used in the manufacture of cans, theproportion
of Ni in the steel is 0.15%(Franciscoet al., 2015). Therefore, the highest Ni content observed
for these samples could arise from contamination either from the water used in fruit juices
processing or from packing materials.

�3�1
Copper
The mean comparison of copper contents in different juicesobserved0.34< 0.39 < 0.40 < 0.62
(mg/L) for Texas, Prigat,Rani and3D juice respectively. The results agreed with previous study
by Ajai et al., (2014) with reported copper level in mango juice 0.4 mg/L.However,it is lower
than the concentration reported by Hassan et al., (2014) ranging 5.2 to 13.64 mg/kg in
commercial mango juice inEgypt.And theseresults are in parallel with those recorded byFarid
and Enani,(2010)with 0.317.8-0.500 ppmof Cu in fruit juice. Cu is an essential micronutrient
involved in a number of biological processes needed to sustain life. However, it can be toxic
when present in excess(Bedassaet al., 2017).Presence of copper in food products might be
correlated with its migration Cu ion from food contact material. However thereare chances of
copper contamination from copper pipelines of potable water supplies used for food preparation
and dilution in case of fresh fruit juices(Akhtaret al., 2015).
The ANOVA test showed,themean concentrationof Cu wassignificantly differences among the
samples.
Zinc
Zinc is a crucial component of the manyvital enzymes. The highest concentration of zinc was
found in Texas Brand (9.80 mg/L), while the lowest, was found in Rani Brand (0.41mg/L). Its
concentration in Prigat brand was 0.49 mg/L and 0.88 mg/L in 3D.The highestconcentrations of
zinc were observed in texas samples which may reflect contamination due tofood processing or
agricultural contamination (Enejiet al., 2015). Except the result obtained from Texas juice ,the
concentrations of Zn from this study were found to be below the maximum permissible limit of 5
mg/L set byFAO/WHO (1992). Zinc deficiency affects about two billion people in the
developing countries and it is associated with growth retardation, delayed sexual maturation,
infection susceptibility, and diarrhea in children (Ackahet al, 2014).
The ANOVA test showed,the mean concentration of Zn wassignificantly differences among the
samples. However, no significance difference between Prigat and Rani Samples from turkey
analysis.
�3�2
Cadmium
Cadmium is highly toxic and responsible for several cases of poisoning through food. Small
quantities of Cd cause adverse changes in the arteries of human kidney. It replaces Zn
biochemicallyand causes high blood pressures andkidney damage(Rajappaet al., 2010). Due
to the high toxicity of Cd, it is of public health interest that these metalsis quantified in
beverages and foodstuffs(Bingöl et al., 2010). For instance, cadmium intake in relatively high
amounts can be detrimental to human health. Over a long period of intake, cadmium may
accumulate in the kidney and liver because of its long biological half-life and may lead to kidney
damage(Adepoju-Bello et al., 2012).
Generally, In the present studythe level of Cd was detected in the three samples with a
concentration of 0.02mg/L, 0.02mg/L, and 0.01mg/L in 3D , Prigat, and Rani respectively.The
concentration Cd obtained is lower than the result reported by Suleman & Gaile, (2013) in
mango juice .but higher than the result reported byAbdel-Rahmanet al., (2019). Eventhough,
the result can be taken as an indication forthe need of control in packing juice.
Lead
In this study Pb were not detected in all samples. These results are comparable to those reported
by Hassanet al., (2014),Ajai et al., (2014), and Musa and Parmeshwal, (2018). Lead (Pb)
accumulates in the brain leading to plumbism. In children it leads to lower IQ, short attention
span, hyperactivity and mental deterioration. Loss of memory and weakness of joints have been
reported in adults(Ihesinachi and Eresiya, 2014).

�3�3
Table 9: Comparison of study metals concentration (mg/L) in mango juice with the reported
values
Metal Present study (Suleiman
and Gaila,
2013)
(Ajai et
al., 2014)
(Akhtar et
al., 2015)
(Dehelean
et al.,
2016)
(Musa and
Parmeshwal,
2018)
Mg 6.1- 36.4 0.42 - - 29.02 -
Ca 0.40- 69.5 0.44 - - 20.98 63.87
Cr 0.14- 0.16 <0.002 ND - 0.01 -
Mn 0.22- 0.86 0.66 0.00 0.095 0.246 -
Ni 0.28 <0.05 - 0.055 0.155 -
Fe 0.92- 9.00 8.40 9.00 0.885 0.8 ND
Cu 0.34- 0.62 <0.001 0.40 0.341 0.151 ND
Zn 0.41- 9.8 <0.08 0.90 0.372 0.245 ND
Cd 0.01- 0.02 0.14 ND 0.025 0.0005 ND
Pb ND < 0.004 ND 0.166 0.003 ND
ND: none detectedand-: not reported
The concentrations of Cr, Mn, Ni, Cu, and Znanalyzed inthis study,were found above the
values reported in literature for the mango juices (Table 8).the variation between the obtained
result, andreported in literature might be the variability of used rawmaterials in the fruit juices
production, packingquality, andby different manufacturing processes applied. Becausefruit
juices are coming from different countries, the metals content variesin soil composition where
the fruits were grown. In addition, packing quality represents another factor that influences metal
content in fruit juices(Dehelean and Magdas, 2013).

�3�4
Statistically, the differences in the mean values among the eight metals for each brands of the
mango juice sample aregreater than would be expected by chance; and therefore, here is a
statistically significant difference (P = <0.05).Variations in the mean levels of metals between
the samples were tested using one-way ANOVA. The results of metal concentration indicated
that significant differences were obtained (p < 0.05) at 95% confidence levelsfor Ca, Mg, Cr, Fe,
Mn, Zn, Cu, and Cd in mango juice samples. This significance difference and increase in
elemental concentrations may be resulted from the raw materials and water used in the juices
production, the conditions of plant growing such as levels of toxic metals in soil and irrigation
water, the environmental contamination (fertilizers and pesticides), the industrial processing, and
contamination from containers(Abdel-Rahmanet al., 2019, Hassanet al., 2014).
4.4 Physicochemical Analysis
Table 10 shows results for pH,EC, TDS, andTA in the four brands and their comparison, the
results are expressed as means ± SD for four Samples and P-value was calculated using One-
Way ANOVA Tukey HSDa among juices.
Table10: pH, EC, TDS and Acidity resultsin juice samples from four brands
Parameters 3D Prigat Rani Texas
pH 3.55b±0.08 3.93a±0.15 3.24d±0.01 3.67c±0.01
EC (µs/cm) 2088.30a±35.50 867.3b±2.08 929.00c±7.81 1118.60d± 18.87
TDS (mg/L) 1374.00a±20.29 571.60b±1.53 600.00b±2.08 741.00c±11.78
TA (%)
(as citric acid)
0.33a±0.001 0.26a±0.01 0.24a±0.03 0.30a±0.04
Values followed by different letters within each row and each brand indicate significance difference for eachparameter atP < 0.05.

�3�5
4.4.1 pH
Fruit juices have a low pH because they arecomparatively rich in organic acid. In this study the
pH varied from 3.24 to 3.93(Fig 13). The highest pH (3.93) was found in Prigat Brands and
followed by Texas, 3D, and Rani. According to Standard Organization of Nigeria (1997) and
FAO/WHO (1992) Permissible Levels of pH in Fruit Juice Samples was 1.4ˆ 4.0. Therefore, the
pH values from the present study (3.24-3.93) werewithin the permissible range. The results also
agreed with the previously reported results byBateset al., (2001), and Khanamet al., (2018)
with pH value ranged from 3.3.-4.1 in different brands of mangojuices. The pH value of 3 to 4
may give juice a good potential to inhibit the growth of pathogenic bacteria(Onyekwelu, 2017).
The ANOVA (p<0.05, n=3) test showed pH value are significantlydifferences among the
samples. This might be due to raw material, recipe or the ingredients used in the juice(Tasnimet
al., 2010).
4.4.2 Total dissolves solidsof juice samples
The TDS content is significantly influenced by solid materials dissolved in water in the juice.
The TDS values of the juices observed during the present study ranging from 571-1374 mg/L
were the highest value was observed in 3D (1374 mg/L)followed by Texas (741 mg/L).The TDS
Values are in good agreement with reportedvalue (Maryam.et al. 2012) in the average value of
523-2084 mg/L. however, this study was higher than the reported TDS value of Anwaret al.,
(2013).A high concentration of dissolved solids is usually not a health hazard. However, a very
low concentration of TDS has been found in juice, which is undesirable to many people
(Jahagirdaret al., 2015).
The result from oneway ANOVA revealed that, except the values between Prigat and Rani, the
TDS valued observed has significance difference between the brands.This could be because of
the variety, origin, growing conditions of the fruit, chemical (additives) and manufacturing
process(Amin et al., 2018).

�3�6
4.4.3 Electric Conductivity (EC) of the samples
Electrical Conductivity indicates theionic speciesfound in foodssuchassalts and acids act as
electrolytes that allow current to pass through thefoods. The EC and ionicconcentrationare
found closely related(Ganapathyet al., 2019), means the juice that has thehighest ECis with
high ionic species.In these studiesthe lowest count of electric conductivity was found inPrigat
mango juice (867.3‰s/cm) and the highest was found in 3D mango juice (2088‰s/cm).
Therefore, 3Dcontains highest ionic species than other brands. Anwar et al., (2013) reported
that the electrical conductivity of different brands of mango juicevaried from 1.017-1.917
ms/cm, the resultsfrom the current studywas close tothis literature.
The result showed any significant difference in the values of electrical conductivity (P <
0.05).These variations may be attributed to the variety, origin, growing conditions of the fruit
and chemical (additives) added by different companies(Maryamet al.,2012).
4.4.4 Acidity value
The total acidity of fruit juices was due to the presence of a mixture of organic acids, whose
composition varies depending on the fruit„s nature and Chemicalused that were added during
processing(Amin et al., 2018). Organic acids isimportance for the characteristics and nutritive
value of fruit juices and deliberated individual originality among beverages(Tasnim et al.,
2010). The results indicated that, the highestacidity value (0.33%) was found in 3D Brands
followed by Texas,PrigatandRani. Islamet al., (2015)reportedacidity valueof mango juices
ranged from 0.192% to 0.384%and FAO (2005), Bates et al., (2001) reported that, the
recommended values of acidity formango juices were0.25ˆ 0.5%. The acidity value depend on
the type of fruits, their ripening stage and the season of the year, inappropriate storage of fruit
and packing materials of fruit juices (Nongaet al., 2014,Aminet al., 2018). Therefore, the
results ofthis studywerewithin recommended value. This may indicate that the fruits used in the
preparation of the juices in this study were at the stateof fully maturity and ripening(Nongaet
al., 2014).TheTA values reported in this study were in agreement with those reportedby Ndife
et al., (2013). In the present study, there was no significant variation in the totalTA between
brandsas shown in Table10.

�3�7
Table 11: Comparisonof some physicochemical parameterin mango juice with LiteratureValues
Parameter Present study Maryamet
al. , 2012
(Nongaet
al., 2014)
(Amin et al., 2018) (Khanamet al., 2018)
pH 3.24-3.93 2.62-4.75 3.3ˆ 4.9 3.55-3.80 3.3-4.1
EC (‰s/cm) 867.3-2088 218-2451 - - -
TDS(mg/L) 571.6- 1374 523-2088 - - -
TA % 0.24- 0.33 0.1ˆ 0.4 0.21-0.24 0.16-0.39
- Not studied
4.4.5 Correlation matrix among pH, EC, TDS, and TA physicochemical
parameters
Correlation matrix among the parameters wasdetermined by Karl Pearson„s correlation
coefficient (Table12) with their significant level (P > 0.05). Based on theliteraturesdata, if
correlation coefficient is 1.0, there is complete dependency, if it is negative, both are said to be
correlated inopposite directionHowever, if it is positive, it correlated the samedirection
(Khanamet al., 2018).
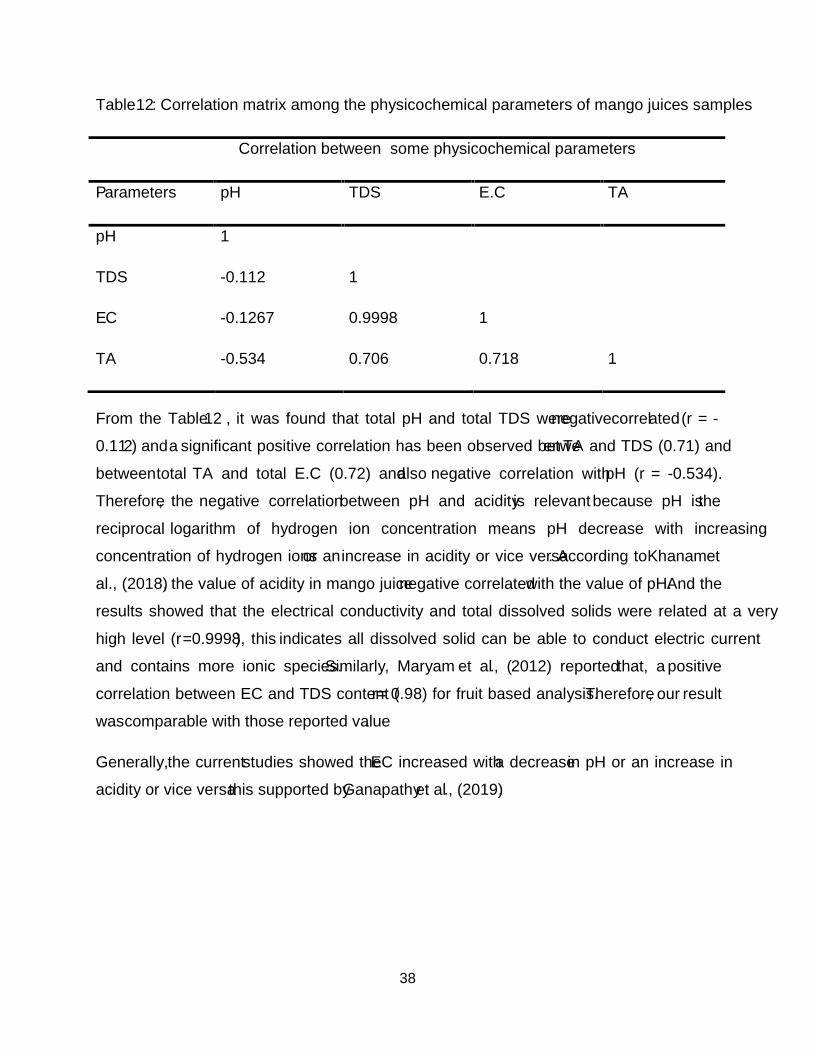
�3�8
Table12: Correlation matrix among the physicochemical parameters of mango juices samples
Correlation between some physicochemical parameters
Parameter„s pH TDS E.C TA
pH 1
TDS -0.112 1
EC -0.1267 0.9998 1
TA -0.534 0.706 0.718 1
From the Table12 , it was found that total pH and total TDS werenegativecorrelated(r = -
0.112) anda significant positive correlation has been observed betweenTA and TDS (0.71) and
betweentotal TA and total E.C (0.72) andalso negative correlation withpH (r = -0.534).
Therefore, the negative correlationbetween pH and acidityis relevantbecause pH isthe
reciprocal logarithm of hydrogen ion concentration means pH decrease with increasing
concentration of hydrogen ionsor anincrease in acidity or vice versa. According toKhanamet
al., (2018), the value of acidity in mango juicenegative correlatedwith the value of pH.And the
results showed that the electrical conductivity and total dissolved solids were related at a very
high level (r=0.9998), this indicates all dissolved solid can be able to conduct electric current
and contains more ionic species.Similarly, Maryam et al., (2012) reportedthat, a positive
correlation between EC and TDS content (r= 0.98) for fruit based analysis.Therefore, our result
wascomparable with those reported value.
Generally,the currentstudies showed theEC increased witha decreasein pH or an increase in
acidity or vice versathis supported byGanapathyet al., (2019).

�3�9
5. CONCLUSION AND RECOMMENDATION
5.1 Conclusion
From the data presented inthis study, it can be concluded that the nutritional quality has a
varianceamong brands. The basic physicochemicalparameters such as pH,TDS, Electrical
conductivity, acid value, and metal content(Mg, Ca, Cr, Mn, Ni, Fe, Cu, Zn, Cd, and Pb)were
analyzedin mango juice sample. The optimized wet digestion method for mango juiceanalysis
was found effective for all of the metals. This was revealed by theexcellent RSD value(below
ten)obtained which were foundin the acceptable range for theanalyzed metals.
From the results of metal analysis, it can be stated that the studied mango juices are free fromPb,
However, the level of copper,manganese, Iron, chromium, zinc, magnesium and calcium
presented in all Mango juice samples. In this study, most metal presented in Mango juice
samples wasabove the report data value.Therefore, there is need to monitor further the levelsof
toxic metals in the fruit juices as a result of the toxic and bio accumulative potential of these
heavy metalsin human organs. Fromsome basicquality of physicochemical parameter likepH,
TDS, ElectricConductivity (EC),and acidity value was maintained within limit.Except the
acidity value, the results of physicochemical parameterand metal contentsindicated that
significant differences were obtained (p <0.05) at 95% confidence levels.

�4�0
5.2 Recommendation
The following suggestions are recommended in order to monitor and protect the Quality juice
due to the environmentalpollution increasesthrough the time.
ðØ This study focused on only four brands of mango juice. Hence, it is recommended to
perform research works on other juice that have the ability to understand the physico
chemical characteristics of juices.
ðØ Due to the wide consumption of fruit juice drinks,it contributesa large Quantity of heavy
metals intake and therefore all people„sstrict control of these elements is advisable.
ðØ Government authorized department should take initiatives for providing training to
manufacturersto awarenesson maintaining the rules and regulation of Quality
assessmentfor juices production.
�4�1
REFERENCES
ABBAS, G., SAQIB, M., AKHTAR, J. & HAQ, M. A. U. 2015. Interactive effects of salinity
and iron deficiency on different rice genotypes.Journal of Plant Nutrition and Soil
Science,178, 306-311.
ABD-ALLAH, S. M. S. & ISMAIL, H. A.-M. A. 2017. Potential Hazard Levels of Lead and
Cadmium in Muscles of the River Nile Catfish (Clarias gariepinus) Available in Markets
in Assiut City, Egypt.International Journal For Research In Agricultural And Food
Science,3, 01-13.
ABD-GHAFAR MF, PRASAD KN, WENG KK AND ISMAIL A. 2010. Flavonoid,
hesperidine, total phenolic contents and antioxidant activities from Citrus species.
African JournalOf Biotechnology,9(3):326-330
ABDEL-RAHMAN, G. N., AHMED, M. B., SABRY, B. A. & ALI, S. S. 2019. Heavy metals
content in some non-alcoholic beverages (carbonated drinks, flavored yogurt drinks, and
juice drinks) of the Egyptian markets.Toxicology reports,6, 210-214.
ABEBE, A. & BIZAYEHU, T. 2019. Review on assessment of horticultural crops production,
constraints and opportunities in Ethiopia.International Journal of Agriculture and
Biosciences,8, 89-98.
ACHMAD, R. T. & AUERKARI, E. I. 2017. Effects of chromium on human body.Annual
Research & Review in Biology, 1-8.
ACKAH, M., ANIM, A. K., ZAKARIA, N., OSEI, J., SAAH-NYARKO, E., GYAMFI, E. T.,
TULASI, D., ENTI-BROWN, S., HANSON, J. & BENTIL, N. O. 2014. Determination
of some heavy metal levels in soft drinks on the Ghanaian market using atomic
absorption spectrometry method.Environmental monitoring and assessment,186, 8499-
8507.
ADEPOJU-BELLO, A., OGUNTIBEJU, O. O., ONUEGBU, M., AYOOLA, G. & COKER, H.
2012. Analysis of selected metallic impurities in soft drinks marketed in Lagos, Nigeria.
African Journal of Biotechnology,11, 4676-4680.
AJAI, A., OCHIGBO, S., ABDULLAHI, Z. & ANIGBORO, P. 2014. Determination of trace
metals and essential minerals in selected fruit juices in Minna, Nigeria.International
Journal of food science, 2014.

�4�2
AKAKI, O., AWASH, A. M. A. & FITA, B. L. 2018. ASSESSMENT OF HEAVY METAL
STATUS IN FRESH AND CANNED FRUITS, VEGETABLE COLLECTED FROM
SUPERMARKET AND IRRIGATION FARMS.
AKHTAR, S., ISMAIL, T. & RIAZ, M. 2015. Safety assessment of street vended juicesin
Multan-Pakistan: A study on prevalence levels of trace elements.International Journal of
Food and Allied Sciences,1, 1-10.
AL MUKTADIR, M. H., ISLAM, M. A., AMIN, M. N., GHOSH, S., SIDDIQUI, S. A.,
DEBNATH, D., ISLAM, M. M., AHMED, T. & SULTANA, F. 2019. Nutrition
transition Pattern IV: Leads Bangladeshi youth to the increasing prevalence of
overweight and obesity.Diabetes & Metabolic Syndrome: Clinical Research & Reviews,
13, 1943-1947.
AMIN, R., RAHMAN, S. S., HOSSAIN, M. & CHOUDHURY, N. 2018. Physicochemical and
Microbiological Qualities„ Assessment of Popular Bangladeshi Mango Fruit Juice.The
open microbiologyJournal,12, 135.
AMPOMAH-NKANSAH, E. 2015.Postharvest quality issues in the local marketing of semi-
processed mangoes: a case study ofthree sub-metros in Greater Accra.
ANASTÁCIO, M., DOS SANTOS, A. M., ASCHNER, M. & MATEUS, L. 2018.
Determination of trace metals in fruit juices in the Portuguese market.Toxicology
reports,5, 434-439.
ANWAR, A., MAHMOOD, T. & HAQUE, Q. U. 2014. Heavy metals in fruit juices in different
packing material.FUUAST Journal of Biology,4, 191-194.
ANWAR, A., PERWEEN, R., NAZIM, K., SHAUKAT, S. S. & MEHMOOD, T.2013.
Assessment of physico-chemical properties and fungal contaminationin plastic bottles
and tetra packed mango juices marketed in karachi city.International Journal of
Biologyand Biotechnology, 10 (3), 411-416.
ASSI, M. A., HEZMEE, M. N. M., HARON, A. W., SABRI, M. Y. M. &RAJION, M. A. 2016.
The detrimental effects of lead on human and animal health.Veterinary world,9, 660.
AVILA, D. S., PUNTEL, R. L. & ASCHNER, M. 2013. Manganese in health and disease.
Interrelations between essential metal ions and human diseases.Springer.

�4�3
BAI, C., REILLY, C. C. & WOOD, B. W. 2006. Nickel deficiency disrupts metabolism of
ureides, amino acids, and organic acids of young pecan foliage.Plant physiology,140,
433-443.
BALLY, I. S. 2006. Mangifera indica (mango).Species profiles for pacific island agroforestry,
1-25.
BATES, R. P., MORRIS, J. R. & CRANDALL, P. G. 2001.Principles and practices of small-
and medium-scale fruit juice processing, Food & Agriculture Organization.
BEARD, J. L. 2001. Iron biology in immune function, muscle metabolism and neuronal
functioning.The Journal of nutrition,131, 568S-580S.
BEDASSA, M., ABEBAW, A. & DESALEGN, T. 2017. Assessment of Selected Heavy Metals
in Onion Bulb and Onion Leaf (Allium cepa L.).Selected Areas of Central Rift Valley of
Oromia RegionEthiopia. Journal ofHorticulture, 4, 2376-0354.1000217.
BERNARD, A. 2008. Cadmium & its adverse effects on human health.Indian Journal of
Medical Research,128, 557.
BEZU, T., WOLDETSADIK, K. & TANA, T. 2015. Production scenarios of mango (Mangifera
indica L.) in Harari Regional State, eastern Ethiopia.Science, Technology and Arts
Research Journal,3, 59-63.
BHOWMIK, D., CHIRANJIB, K. & KUMAR, S. 2010. A potential medicinal importance of
zinc in human health and chronic.InternationalJournal ofPharmactical, 1, 05-11.
BIKILA WEDAJO, A. K. 2019. assessment-of-bacterial-load-of-some-fresh-and-packed-fruit-
juices-in-arba-minch-town-ethiopia.pdf.
BINGÖL, M., YENTÜR, G., ER, B. & ÖKTEM, A. B. 2010.Determination of some heavy
metal levels in soft drinks from Turkey using ICP/OES method.CzechJournal of food
sciences,28, 213-216.
CASIDAY, R. & FREY, R. 1998. Iron use and storage in the body: ferritin and molecular
representations.Department ofChemistry, Washington University, St. Louis. USA.
CHASAPIS, C. T., LOUTSIDOU, A. C., SPILIOPOULOU, C. A. & STEFANIDOU, M. E.
2012. Zinc and human health: an update.Archives of toxicology,86, 521-534.
CHATA, D. M., ILIYA, A. Y., CHIDAWA, M. S., EMMANUEL, M. B., JULIANA, O. O. &
CHIBUZOR, E. K. 2018. Determination of heavy metals in four mango fruit varieties

�4�4
sold in Minna modern market, Niger State, Nigeria.International Journal of Biological
and Environmental Engineering,1, 24-29.
CHEN, P., BORNHORST, J. & ASCHNER, M. 2019. Manganese metabolism in humans.
CHRISTIANSON, D. W. 1991. Structural biology of zinc.Advances in protein chemistry.
Elsevier.
COLES, C., CRAWFORD, J., MCCLURE, P. R., RONEY, N. & TODD, G. D. 2012.
Toxicological profile for manganese.
DEHELEAN, A., MAGDAS, D., PUSCAS, R., LUNG, I. & STAN, M. 2016. Quality
assessment of some commercial Romanian juices.Romanian Reports in Physics,68, 746-
759.
DEVI, C. B., NANDAKISHORE, T., SANGEETA, N., BASAR, G., DEVI, N. O., JAMIR, S. &
SINGH, M. A. 2014. Zinc in human health.Journal of Dental and Medical Sciences,13,
18-23.
DRAGSTED, L. O., STRUBE, M. & LARSEN, J. 1993. Cancer �Protective Factors in Fruits and
Vegetables: Biochemical and Biological Background.Pharmacology & toxicology,72,
116-135.
ELMA, S. N., ROSLI, D., BADARUSHAM, K., SALVAMANI, S. & HASSAN, M. S. 2019.
Effect of Phytochemicals in Phoenix Dactylifera L. on Human Body Using LC-QTOF-
MS. Indian Journal of Public Health Research & Development,10, 759-764.
ENEJI, I. S., NURAIN, A. A.& SALAWU, O. W. 2015. Trace metal Levels in Some Packaged
Fruit Juices Sold in Makurdi Metropolis Markets, Nigeria.ChemSearch Journal,6, 42-
49.
FAO (2005) General standard for fruit juices and nectars; Codex Alimentarius Commission.
[www.codexalimentarius.org/.../standards/.../CXS_247].
FAO (Food and Agricultural Organization) of theUnited Nations W.H.O. Rome (1992). Joint
FAO/WHO Foods Standard Programme forJuice Juices and Related Products. Codex
AlimentariusCommission. Vol.6.pp 1-5
FARIS, A. 2016. Review on Avocado Value Chain in Ethiopia.Industrial Engineering Letters,
6, 33-40.
FLORA, G., GUPTA, D. & TIWARI, A. 2012. Toxicity of lead: a review with recent updates.
Interdisciplinary toxicology,5, 47-58.
�4�5
FLORA, S. J., FLORA, G. & SAXENA, G. 2006. Environmental occurrence, health effects and
management of lead poisoning.Lead.Elsevier.
FRANCISCO, B. B. A., BRUM, D. M. & CASSELLA, R. J. 2015. Determination of metals in
soft drinks packed in different materials by ETAAS.Food chemistry,185, 488-494.
GANAPATHY, S., RAJA, P., VIJAYAKUMARY, P. & VENKATASAMI, M. 2019. Effect of
physical properties of mango juice on the effectiveness of pulsed electric field treatment.
Journal of Pharmacognosy and Phytochemistry,8, 691-696.
GERENFES, D., TEJU, E. & KEBEDE, T. 2019. Selected Metal (Fe, Cu and Zn) Levels in Fish
and Water at Abaya and Chamo Rift Valley Lakes.Biochemistry and Molecular Biology,
4, 17.
GIRMA, G., GARO, G. & FETENA, S. 2016. Chemical composition of mango (Mangifera
indica L) fruit as influence by postharvest treatments in Arba Minch, southern Ethiopia.
Toxicology and Food Technology,10, 70-77.
GODT, J., SCHEIDIG, F., GROSSE-SIESTRUP, C., ESCHE, V., BRANDENBURG, P.,
REICH, A. & GRONEBERG, D. A. 2006. The toxicity of cadmium and resulting hazards
for human health.Journal of occupational medicine and toxicology,1, 22.
GUPTA, H. & GUPTA, P. 2008. Fruit drinks how healthy and safe?Indian pediatrics,45, 215-
217.
HASSAN, A. S., EL-RAHMAN, T. A. A. & MARZOUK, A. 2014. Estimation of some trace
metals in commercial fruit juices in Egypt.International Journal of Food Science and
Nutritional Engineering, 4, 66-72.
HEFNAWY, A. E. & EL-KHAIAT, H. M. 2015. The importance of copper and the effects of its
deficiency and toxicity in animal health.International Journal of Livestock Research,5,
1-20.
HONJA, T. 2014. Review of mango value chain in Ethiopia.Journal ofBiology andAgriculural
Healthc,4, 230-239.
IHESINACHI, K. & ERESIYA, D. 2014. Evaluation of heavy metals in orange, pineapple,
avocado pear and pawpaw from a farm in Kaani, Bori, Rivers State Nigeria.Journal
Issues ISSN,2360, 8803.

�4�6
ISLAM, M., MORSHED, S., SAHA, S., QUADER, F. & ALAM, M. 2015. Evaluation of
Nutritive Value of Mango Juices Found in Bangladeshi Markets.Journal of
Environmental Science and Natural Resources,8, 95-98.
IZAH, S. C., CHAKRABARTY, N. & SRIVASTAV, A. L. 2016. A review on heavy metal
concentrationin potable water sources in Nigeria: Human health effects and mitigating
measures.Exposure and Health,8, 285-304.
JAHAGIRDAR, S., PATKI, V., THAVARE, M., PATIL, M. S. & RANGRE, S. 2015.
Comparative study of water quality parameters of different brands ofsoft drinks.IOSR
Journal of Mechanical and Civil Engineering (IOSRJMCE).
JAISER, S. R. & WINSTON, G. P. 2010. Copper deficiency myelopathy.Journal of neurology,
257, 869-881.
JOLAYEMI, O. S. 2019. Variation in Nutritional Properties of Mango (Mangiferaindica) Juice
Based on Varietal Difference and Thermal Holding Time.Acta Universitatis Cibiniensis.
Series E: Food Technology,23, 43-54.
JOOSTEN, F. 2007. Development strategy for the export-oriented horticulture in Ethiopia.
Wageningen Ur.
KARADENIZ F. (2004). Main organic acid distribution of authentic citrus juices in Turkey.
Turk Journal of Agricultural and Forestry. 28:267-271
KHAN, I., MEHMOOD, Z., KHAN, M. & FATIMA, T. 2016. Analysis and detection of heavy
metals present in fruit juices of Lahore.InternationalJournal ofEngineering Science, 6,
3536-3539.
KHANAM, N., MIA, M. Y., ZUBAIR, A. & REAL, M. K. H. 2018. Microbial and chemical
quality analysis of industrially processed mango juice available in Tangail Sadar Uazila,
Bangladesh.Annals. Food Science andTechnology, 19, 333-340.
KLEEFSTRA, N., BILO, H., BAKKER, S. & HOUWELING, S. 2004. Chromium and insulin
resistance.Nederlands tijdschrift voor geneeskunde,148, 217-220.
KRUPA-KOZAK, U. & DRABIŒSKA, N. 2016. Calcium in gluten-free life: health-related and
nutritional implications.Foods,5, 51.
LAIRES, M. J., MONTEIRO, C. P. & BICHO, M. 2004. Role of cellular magnesium in health
and human disease.Front Bioscience, 9, 76.

�4�7
LAMSAL, B. P. & JINDAL, V. K. 2014. Variation in electrical conductivity of selected fruit
juices during continuous Ohmic heating.KMUTNB International Journal of Applied
Science and Technology,7, 47.
LEWICKI, S., ZDANOWSKI, R., KRZYZOWSKA, M., LEWICKA, A., DEBSKI, B.,
NIEMCEWICZ, M. & GONIEWICZ, M. 2014. The role of Chromium III in the
organism and its possible use in diabetes and obesity treatment.Annals of Agricultural
and Environmental Medicine,21.
LI, L. & YANG, X. 2018. The essential element manganese, oxidative stress, and metabolic
diseases: links and interactions.Oxidative medicine and cellular longevity,2018.
MARYAM,B.T.,RAFIQUE,R.,QURATULAIN.,MASHITULLAH,A.&SULTANA.2012.Ascorb
ic acids contents in commercial juices and beverages.Journal ofBiotechnology, 10, 411-
416,
MHAMED, Z. M. A. & AHMED, T. H. M. 2015. Diversity of Mango (Mangifera indica L.)
cultivars in Shendi area: morphological leaf characterization.International Journal of
Research in Agricultural Sciences,2, 167-172.
MURTI•, S., BRKOVI•, D., ŽURI •, M. & VUJINOVI•, I. 2014. Heavy metal dynamics in
the soil-leaf-fruit system under intensive apple cultivation.Acta Agriculturae Serbica,19,
123-132.
MUSA, A. I. & PARMESHWAL, L. 2018. Analysis of Heavy Metals and Minerals in Fruit
Juices by Inductively Coupled Plasma Mass Spectrometry Coupled with Atomic
Absorption Spectroscopy.International Journal of Recent Scientific Research,9, 25509-
25511.
NDIFE, J., AWOGBENJA, D. & ZAKARI, U. 2013. Comparative evaluation of the nutritional
and sensory quality of different brands of orange-juice in Nigerian market.African
Journal of Food Science,7, 479-484.
NISHIDA, S., KATO, A., TSUZUKI, C., YOSHIDA, J. & MIZUNO, T. 2015. Induction of
nickel accumulation in response to zinc deficiency in Arabidopsis thaliana.International
Journal of molecular sciences,16, 9420-9430.
NONGA, H. E., SIMFORIAN, E. A. & NDABIKUNZE, B. K. 2014. Assessment of
physicochemical characteristics and hygienic practices along the value chain of raw fruit
juice vended in Dar es Salaam City, Tanzania.TanzaniaJournal of health research,16.

�4�8
OLANIYAN, A. M. & OBAJEMIHI, O. I. 2014. Design, development and test of a small scale
mango juice extractor.Journal of Agricultural Science and Technology. B,4, 1.
ONYEKWELU, C. 2017. Physicochemical properties and sensory evaluation of mixed fruit juice
(orange, water melon, and tangerine) using date syrup as a sweetener.Innovare Journal
of Food Science,5.
PARVEZ, G. M. 2016. Pharmacological activities of mango (Mangifera Indica): A review.
Journal of Pharmacognosy and Phytochemistry,5, 1.
PECHOVA, A. & PAVLATA, L. 2007. Chromium as an essential nutrient: a review.Veterinarni
medicina-praha-, 52, 1.
POONKOTHAI, M. & VIJAYAVATHI, B. S. 2012. Nickel as an essential element and a
toxicant.InternationalJournal of EnviromentalScience, 1, 285-288.
PYNAERT, I., MATTHYS, C., BELLEMANS, M., DE MAEYER, M., DE HENAUW, S. & DE
BACKER, G. 2005. Iron intake and dietary sources of iron in Flemish adolescents.
EuropeanJournal of clinical nutrition,59, 826-834.
RAJAPPA, B., MANJAPPA, S. & PUTTAIAH, E. 2010.Monitoring of heavy metal
concentration in groundwater of Hakinaka Taluk, India.Contemporary Engineering
Sciences,3, 183-190.
RAJESWARI, T. R. & SAILAJA, N. 2014. Impact of heavy metals on environmental pollution.
Journal of Chemical and Pharmaceutical Sciences,3, 175-181.
RAVANI, A. & JOSHI, D. 2013. Mango and it„s by product utilizationˆ a review.Energy (kcal),
74, 2013.
REDDY, A., NORRIS, D. F., MOMENI, S. S., WALDO, B. & RUBY, J. D. 2016. The pH of
beverages available to the American consumer.Journal of the American Dental
Association (1939),147, 255.
SCHWALFENBERG, G. K. & GENUIS, S. J. 2017. The importance of magnesium in clinical
healthcare.Scientifica,2017.
SHARMA, H., RAWAL, N. & MATHEW, B. B. 2015. The characteristics, toxicity and effects
of cadmium.InternationalJournal of nanotechnology and nanoscience,3, 1-9.
SHEKHAWAT, K., CHATTERJEE, S. & JOSHI, B. 2015. Chromium toxicity and its health
hazards.International Journal of Advanced Research,3, 167-172.

�4�9
SLAVIN, J. L. & LLOYD, B. 2012. Health benefits of fruits and vegetables.Advances in
nutrition, 3, 506-516.
SLEZAKOVA, K., MORAIS, S. & DO CARMO PEREIRA, M. 2014. Trace metals in size-
fractionated particulate matter in a Portuguese hospital: exposure risks assessment and
comparisons with other countries.Environmental Science and Pollution Research,21,
3604-3620.
SMITH, L. A. 1995.Remedial options for metals-contaminated sites, Lewis Publ.
SULEIMAN, S. & GAILA, N. 2013. Determination of Sugar and Some Trace Metals Content in
Selected Brand of Fruit Juices.ChemSearch Journal,4, 21-52.
TAN, M., SUDJADI, A. & ROHMAN, V. 2018. quantitative analysis of cadmium, chromium,
copper, nickel, and lead in snake fruit by Inductively Coupled Plasma-Atomic Emission
Spectroscopy.JAPS,8, 44-48.
TANTRATIAN, S., SIRIPATTANAKUL, W. & CHANRITTISEN, T. 2018. Effect of Light and
Temperature on the Quality of Sam-Pee Mango (Mangifera Indica) Juice.Advances in
Food Science and Engineering, 2,
TASNIM, F., HOSSAIN, M. A., NUSRATH, S., HOSSAIN, M. K., LOPA, D. & HAQUE, K.
2010. Quality assessment of industrially processed fruit juices available in dhaka city,
bangladesh.MalaysianJournal of nutrition,16.
THEOBALD, H. E. 2005. Dietary calcium andhealth.Nutrition Bulletin,30, 237-277.
TRIPATHI, D. K., SINGH, V. P., CHAUHAN, D. K., PRASAD, S. M. & DUBEY, N. K. 2014.
Role of macronutrients in plant growth and acclimation: recent advances and future
prospective.Improvement of crops in the era of climatic changes.Springer.
VERMA, A., SHARMA, P., DHUSIA, N. & MORE, N. 2016. Determination of heavy metal
content in fruits and fruits juices consume in urban areas of Lucknow, India.
International Journal of Food Science and Nutrition,1, 44-50.
WHO/FAO (2010). Summary and Conclusion, jointFAO/WHO expert committee of food
additives.(JECFA/73/Sc) 73rd meeting, Geneva.
YAHYA, M. A., AMIN, K. -K. M., AL-QODAH, Z. & NGAH, C. Z. C. 2016. Optimization of
Digestion Method for Determination of Copper in Shrimp Paste Sample Using Flame
Atomic Absorption Spectrometry.Asian Journal of Chemistry,28, 1164.

�5�0
YANAGISAWA, H. 2004. Zinc deficiency and clinical practice.Japan Medical Association
Journal,47, 359-364.
YANG, L. P., ZHU, J., WANG, P., ZENG, J., TAN, R., YANG, Y. Z. & LIU, Z. M. 2018.
Effect of Cd on growth, physiological response, Cd subcellular distribution and chemical
forms of Koelreuteria paniculata.Ecotoxicology and environmental safety,160, 10-18.
ZEBERGA, S. 2010.Production and Quality Evaluation of Spray Dried Fruit Products.Addis
Ababa University.
ZEKRI, M. & OBREZA, T. A. 2003. Plant nutrients for citrus trees.

�5�1
APPENDIX
Table13: Optimizationof Parameters for Wet Digestion of Juice Sample by using HNO3
HNO3 (mL) Temp.(oC) Time (min) Observation(Result)
1 105 45 Yellow
2 105 45 Yellow
4 105 45 Yellow
6 105 45 Yellow
8 105 45 Yellow
10 105 45 Yellow

�5�2
Table 14: Optimization of Parameters for Wet Digestion of Juice Sampleby using HNO3 and
HCl
Reagent volumes (mL) Temp.(oC) Time
(min)
Observation(Result)
HNO3 HCl Total
0.5 0.5 1 105 60 Yellow
1 1 2 105 60 Yellow
1 2 3 105 60 Yellow
2 1 3 105 60 Yellow
1.5 1.5 3 105 60 Light Yellow
2 2 4 105 60 Very light Yellow
1 3 4 105 60 Light yellow
3 1 4 105 60 Yellow
2.5 1.5 5 105 60 Light yellow
1.5 2 5 105 60 Light yellow
2 3 5 105 60 Yellow
3 2 5 105 60 Light Yellow
4 1 5 105 60 Yellow
1 4 5 105 60 Very light Yellow
2.5 2.5 5 105 60 Almost color less

�5�3
Statically for one way ANOVA test value.
Table15: One way ANOVA test value forPhysical parameterof four mangojuice brand
ANOVApH value
Sum of
Squares
Df Mean
Square
F Sig.
Between
Groups
.738 3 .246 140.603 .000
Within Groups .014 8 .002
Total .752 11
Electrical conductivity
Sum of
Squares
Df Mean SquareF Sig.
Between Groups2908569.667 3 969523.222 2302.906 .000
Within Groups 3368.000 8 421.000
Total 2911937.667 11
TDS value
Sum of
Squares
Df Mean SquareF Sig.
Between Groups1268760.333 3 422920.111 3033.498 .000
Within Groups 1115.333 8 139.417
Total 1269875.667 11

�5�4
Table16: Post Hoc Tests for multiple comparison of mango juice
Dependent Variable: pH value
Tukey HSD
(I)
brand
(J) brand Mean
Difference
(I-J)
Std.
Error
Sig. 95% Confidence Interval
Lower
Bound
Upper
Bound
3D
Prigat .69000* .03416 .000 .5806 .7994
Rani .38667* .03416 .000 .2773 .4960
Texas .26333* .03416 .000 .1540 .3727
Prigat
3D -.69000* .03416 .000 -.7994 -.5806
Rani -.30333* .03416 .000 -.4127 -.1940
Texas -.42667* .03416 .000 -.5360 -.3173
Rani
3D -.38667* .03416 .000 -.4960 -.2773
Prigat .30333* .03416 .000 .1940 .4127
Texas -.12333* .03416 .028 -.2327 -.0140
Texas
3D -.26333* .03416 .000 -.3727 -.1540
Prigat .42667* .03416 .000 .3173 .5360
Rani .12333* .03416 .028 .0140 .2327
*. Themean difference is significant at the 0.05 level.

�5�5
Dependent Variable:TDS value
Tukey HSD
(I) brand (J) brand Mean
Difference (I-
J)
Std. ErrorSig. 95% Confidence Interval
Lower BoundUpper Bound
3D
Prigat 802.33333* 9.64077 .000 771.4602 833.2065
Rani 773.33333* 9.64077 .000 742.4602 804.2065
Texas 633.00000* 9.64077 .000 602.1269 663.8731
Prigat
3D -802.33333* 9.64077 .000 -833.2065 -771.4602
Rani -29.00000 9.64077 .066 -59.8731 1.8731
Texas -169.33333* 9.64077 .000 -200.2065 -138.4602
Rani
3D -773.33333* 9.64077 .000 -804.2065 -742.4602
Prigat 29.00000 9.64077 .066 -1.8731 59.8731
Texas -140.33333* 9.64077 .000 -171.2065 -109.4602
Texas
3D -633.00000* 9.64077 .000 -663.8731 -602.1269
Prigat 169.33333* 9.64077 .000 138.4602 200.2065
Rani 140.33333* 9.64077 .000 109.4602 171.2065
*. The mean difference is significant at the 0.05 level.
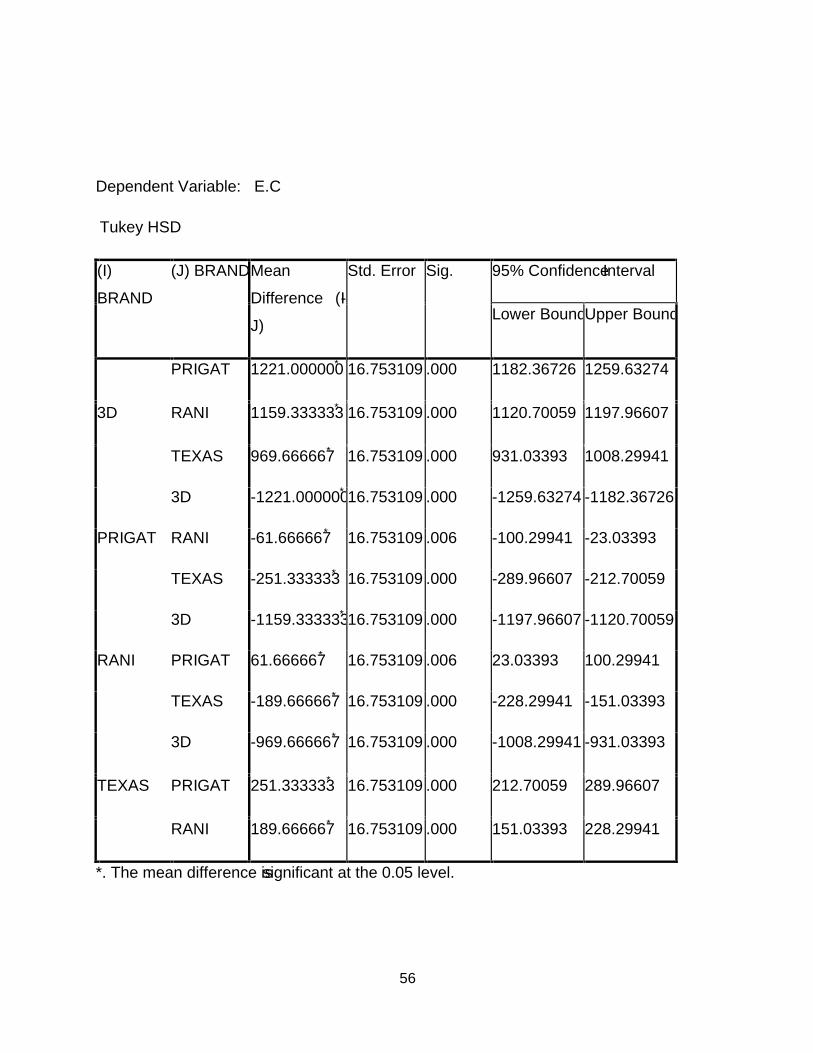
�5�6
Dependent Variable: E.C
Tukey HSD
(I)
BRAND
(J) BRANDMean
Difference (I-
J)
Std. Error Sig. 95% ConfidenceInterval
Lower BoundUpper Bound
3D
PRIGAT 1221.000000* 16.753109 .000 1182.36726 1259.63274
RANI 1159.333333* 16.753109 .000 1120.70059 1197.96607
TEXAS 969.666667* 16.753109 .000 931.03393 1008.29941
PRIGAT
3D -1221.000000* 16.753109 .000 -1259.63274 -1182.36726
RANI -61.666667* 16.753109 .006 -100.29941 -23.03393
TEXAS -251.333333* 16.753109 .000 -289.96607 -212.70059
RANI
3D -1159.333333* 16.753109 .000 -1197.96607 -1120.70059
PRIGAT 61.666667* 16.753109 .006 23.03393 100.29941
TEXAS -189.666667* 16.753109 .000 -228.29941 -151.03393
TEXAS
3D -969.666667* 16.753109 .000 -1008.29941 -931.03393
PRIGAT 251.333333* 16.753109 .000 212.70059 289.96607
RANI 189.666667* 16.753109 .000 151.03393 228.29941
*. The mean difference issignificant at the 0.05 level.

�5�7
Table 17: One way ANOVA test value for metal analysis of Ca, Cr, Cu, Fe, Mg, Mn, and Zn
calciumSum of
Squares
df Mean
Square
F Sig.
Between Groups643.377 3 214.459 627.914 .000
Within Groups 6.831 20 .342
Total 650.208 23
Chromium
Sum ofSquares
df MeanSquare
F Sig.
BetweenGroups
.000 3 .000 9.496 .000
Within Groups .000 20 .000Total .000 23
Copper
Sum ofSquares
df MeanSquare
F Sig.
BetweenGroups
.011 3 .004 166.208 .000
Within Groups .000 20 .000Total .011 23

�5�8
Iron
Sum ofSquares
df MeanSquare
F Sig.
BetweenGroups
10.762 3 3.587 12209.851 .000
Within Groups .006 20 .000Total 10.768 23
Magnesium
Sum ofSquares
df MeanSquare
F Sig.
BetweenGroups
154.594 3 51.531 3191.982 .000
Within Groups .323 20 .016Total 154.916 23Manganese
Sum ofSquares
Df MeanSquare
F Sig.
BetweenGroups
.070 3 .023 6201.674 .000
Within Groups .000 20 .000Total .070 23Zinc
Sum ofSquares
Df MeanSquare
F Sig.
BetweenGroups
15.307 3 5.102 5884.975 .000
Within Groups .017 20 .001Total 15.325 23

�5�9
Table18: Tukey HSDmultiple comparisons test formetal analysis of Ca, Cr, Cu, Fe, Mg, Mn,and Zn.
Calcium
Tukey HSD
(I)
brand
(J) brand Mean
Difference
(I-J)
Std.
Error
Sig. 95% Confidence Interval
Lower
Bound
Upper
Bound
3D
Prigat 3.047167* .367617 .000 2.01823 4.07610
Rani 5.081000* .367617 .000 4.05206 6.10994
Texas 13.885250* .367617 .000 12.85631 14.91419
Prigat
3D -3.047167* .367617 .000 -4.07610 -2.01823
Rani 2.033833* .367617 .000 1.00490 3.06277
Texas 10.838083* .367617 .000 9.80915 11.86702
Rani
3D -5.081000* .367617 .000 -6.10994 -4.05206
Prigat -2.033833* .367617 .000 -3.06277 -1.00490
Texas 8.804250* .367617 .000 7.77531 9.83319
Texas
3D -13.885250* .367617 .000 -14.91419 -12.85631
Prigat -10.838083* .367617 .000 -11.86702 -9.80915
Rani -8.804250* .367617 .000 -9.83319 -7.77531
*. The mean difference issignificant at the 0.05 level.

�6�0
Chromium
Tukey HSD
(I)
brand
(J) brand Mean
Difference
(I-J)
Std.
Error
Sig. 95% Confidence Interval
Lower
Bound
Upper
Bound
3D
Prigat .000333 .000808 .976 -.00193 .00259
Rani .003000* .000808 .007 .00074 .00526
Texas -.001167 .000808 .488 -.00343 .00109
Prigat
3D -.000333 .000808 .976 -.00259 .00193
Rani .002667* .000808 .017 .00041 .00493
Texas -.001500 .000808 .278 -.00376 .00076
Rani
3D -.003000* .000808 .007 -.00526 -.00074
Prigat -.002667* .000808 .017 -.00493 -.00041
Texas -.004167* .000808 .000 -.00643 -.00191
Texas
3D .001167 .000808 .488 -.00109 .00343
Prigat .001500 .000808 .278 -.00076 .00376
Rani .004167* .000808 .000 .00191 .00643
*. The mean difference is significant at the0.05 level.
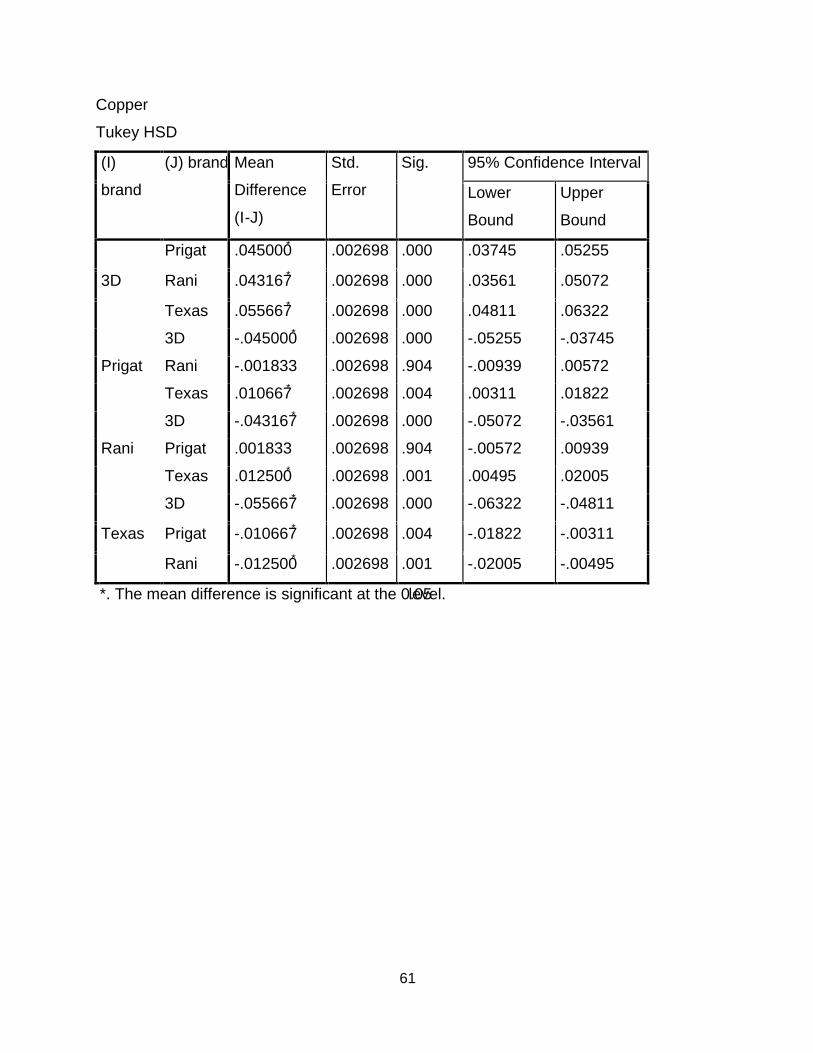
�6�1
Copper
Tukey HSD
(I)
brand
(J) brand Mean
Difference
(I-J)
Std.
Error
Sig. 95% Confidence Interval
Lower
Bound
Upper
Bound
3D
Prigat .045000* .002698 .000 .03745 .05255
Rani .043167* .002698 .000 .03561 .05072
Texas .055667* .002698 .000 .04811 .06322
Prigat
3D -.045000* .002698 .000 -.05255 -.03745
Rani -.001833 .002698 .904 -.00939 .00572
Texas .010667* .002698 .004 .00311 .01822
Rani
3D -.043167* .002698 .000 -.05072 -.03561
Prigat .001833 .002698 .904 -.00572 .00939
Texas .012500* .002698 .001 .00495 .02005
Texas
3D -.055667* .002698 .000 -.06322 -.04811
Prigat -.010667* .002698 .004 -.01822 -.00311
Rani -.012500* .002698 .001 -.02005 -.00495
*. The mean difference is significant at the 0.05level.

�6�2
Iron
Tukey HSD
(I) brand (J) brand Mean
Difference
(I-J)
Std.
Error
Sig. 95% Confidence Interval
Lower
Bound
Upper
Bound
3D
Prigat .042000* .009896 .002 .01430 .06970
Rani .132167* .009896 .000 .10447 .15987
Texas -1.484500* .009896 .000 -1.51220 -1.45680
Prigat
3D -.042000* .009896 .002 -.06970 -.01430
Rani .090167* .009896 .000 .06247 .11787
Texas -1.526500* .009896 .000 -1.55420 -1.49880
Rani
3D -.132167* .009896 .000 -.15987 -.10447
Prigat -.090167* .009896 .000 -.11787 -.06247
Texas -1.616667* .009896 .000 -1.64437 -1.58897
Texas
3D 1.484500* .009896 .000 1.45680 1.51220
Prigat 1.526500* .009896 .000 1.49880 1.55420
Rani 1.616667* .009896 .000 1.58897 1.64437
*. The mean difference is significant at the0.05 level.

�6�3
Manganese
Tukey HSD
(I) brand (J) brand Mean
Difference (I-
J)
Std. ErrorSig. 95% Confidence Interval
Lower BoundUpper Bound
3D
Prigat -.006167* .001118 .000 -.00930 -.00304
Rani .001667 .001118 .461 -.00146 .00480
Texas -.125833* .001118 .000 -.12896 -.12270
Prigat
3D .006167* .001118 .000 .00304 .00930
Rani .007833* .001118 .000 .00470 .01096
Texas -.119667* .001118 .000 -.12280 -.11654
Rani
3D -.001667 .001118 .461 -.00480 .00146
Prigat -.007833* .001118 .000 -.01096 -.00470
Texas -.127500* .001118 .000 -.13063 -.12437
Texas
3D .125833* .001118 .000 .12270 .12896
Prigat .119667* .001118 .000 .11654 .12280
Rani .127500* .001118 .000 .12437 .13063
*. The mean difference is significant at the 0.05 level.

�6�4
Zinc
Tukey HSD
(I)
brand
(J) brand Mean
Difference
(I-J)
Std.
Error
Sig. 95% Confidence Interval
Lower
Bound
Upper
Bound
3D
Prigat .078833* .017000 .001 .03125 .12642
Rani .094167* .017000 .000 .04658 .14175
Texas -1.784833* .017000 .000 -1.83242 -1.73725
Prigat
3D -.078833* .017000 .001 -.12642 -.03125
Rani .015333 .017000 .804 -.03225 .06292
Texas -1.863667* .017000 .000 -1.91125 -1.81608
Rani
3D -.094167* .017000 .000 -.14175 -.04658
Prigat -.015333 .017000 .804 -.06292 .03225
Texas -1.879000* .017000 .000 -1.92658 -1.83142
Texas
3D 1.784833* .017000 .000 1.73725 1.83242
Prigat 1.863667* .017000 .000 1.81608 1.91125
Rani 1.879000* .017000 .000 1.83142 1.92658
*. The mean difference is significant at the 0.05 level.