PHYSICAL SETTING EARTH SCIENCE - OSA - · PDF file1 Earth’s approximate rate of...
24
The University of the State of New York REGENTS HIGH SCHOOL EXAMINATION PHYSICAL SETTING EARTH SCIENCE Friday, June 17, 2016 — 9:15 a.m. to 12:15 p.m., only Use your knowledge of Earth science to answer all questions in this examination. Before you begin this examination, you must be provided with the 2011 Edition Reference Tables for Physical Setting/Earth Science. You will need these reference tables to answer some of the questions. You are to answer all questions in all parts of this examination. You may use scrap paper to work out the answers to the questions, but be sure to record your answers on your answer sheet and in your answer booklet. A separate answer sheet for Part A and Part B–1 has been provided to you. Follow the instructions from the proctor for completing the student information on your answer sheet. Record your answers to the Part A and Part B–1 multiple-choice questions on this separate answer sheet. Record your answers for the questions in Part B–2 and Part C in your separate answer booklet. Be sure to fill in the heading on the front of your answer booklet. All answers in your answer booklet should be written in pen, except for graphs and drawings, which should be done in pencil. When you have completed the examination, you must sign the declaration printed on your separate answer sheet, indicating that you had no unlawful knowledge of the questions or answers prior to the examination and that you have neither given nor received assistance in answering any of the questions during the examination. Your answer sheet and answer booklet cannot be accepted if you fail to sign this declaration. DO NOT OPEN THIS EXAMINATION BOOKLET UNTIL THE SIGNAL IS GIVEN. Notice . . . A four-function or scientific calculator and a copy of the 2011 Edition Reference Tables for Physical Setting/Earth Science must be available for you to use while taking this examination. The possession or use of any communications device is strictly prohibited when taking this examination. If you have or use any communications device, no matter how briefly, your examination will be invalidated and no score will be calculated for you. P.S./EARTH SCIENCE P.S./EARTH SCIENCE
Transcript of PHYSICAL SETTING EARTH SCIENCE - OSA - · PDF file1 Earth’s approximate rate of...
The University of the State of New York
REGENTS HIGH SCHOOL EXAMINATION
PHYSICAL SETTING
EARTH SCIENCEFriday, June 17, 2016 — 9:15 a.m. to 12:15 p.m., only
Use your knowledge of Earth science to answer all questions in this examination.Before you begin this examination, you must be provided with the 2011 Edition Reference Tables for Physical Setting/Earth Science. You will need thesereference tables to answer some of the questions.
You are to answer all questions in all parts of this examination. You may use scrappaper to work out the answers to the questions, but be sure to record your answerson your answer sheet and in your answer booklet. A separate answer sheet for Part Aand Part B–1 has been provided to you. Follow the instructions from the proctor forcompleting the student information on your answer sheet. Record your answers to thePart A and Part B–1 multiple-choice questions on this separate answer sheet. Recordyour answers for the questions in Part B–2 and Part C in your separate answerbooklet. Be sure to fill in the heading on the front of your answer booklet.
All answers in your answer booklet should be written in pen, except for graphs anddrawings, which should be done in pencil.
When you have completed the examination, you must sign the declaration printedon your separate answer sheet, indicating that you had no unlawful knowledge of thequestions or answers prior to the examination and that you have neither given norreceived assistance in answering any of the questions during the examination. Youranswer sheet and answer booklet cannot be accepted if you fail to sign thisdeclaration.
DO NOT OPEN THIS EXAMINATION BOOKLET UNTIL THE SIGNAL IS GIVEN.
Notice . . .
A four-function or scientific calculator and a copy of the 2011 Edition Reference Tables forPhysical Setting/Earth Science must be available for you to use while taking this examination.
The possession or use of any communications device is strictly prohibited when taking this examination. If you have or use any communications device, no matter how briefly, your examination will be invalidated and no score will be calculated for you.
P.S./EARTH SCIENCEP.S./EARTH SCIENCE
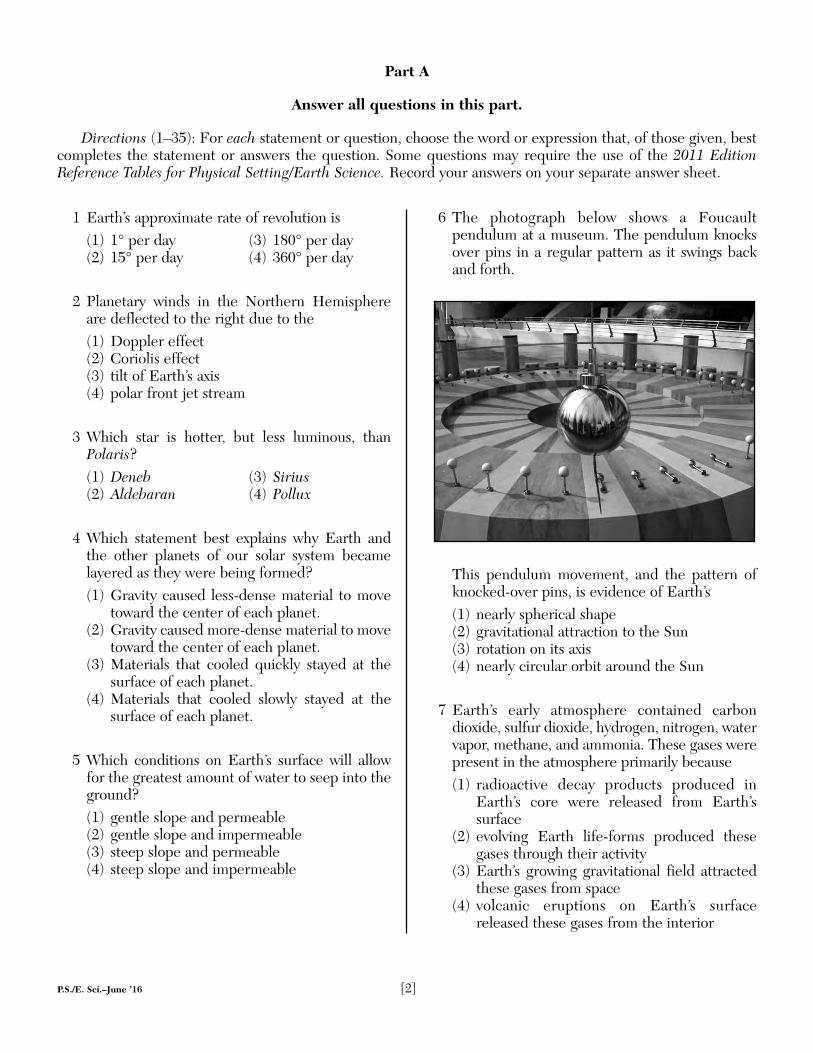
1 Earth’s approximate rate of revolution is(1) 1° per day (3) 180° per day(2) 15° per day (4) 360° per day
2 Planetary winds in the Northern Hemisphereare deflected to the right due to the(1) Doppler effect(2) Coriolis effect(3) tilt of Earth’s axis(4) polar front jet stream
3 Which star is hotter, but less luminous, thanPolaris?(1) Deneb (3) Sirius(2) Aldebaran (4) Pollux
4 Which statement best explains why Earth andthe other planets of our solar system becamelayered as they were being formed?(1) Gravity caused less-dense material to move
toward the center of each planet.(2) Gravity caused more-dense material to move
toward the center of each planet.(3) Materials that cooled quickly stayed at the
surface of each planet.(4) Materials that cooled slowly stayed at the
surface of each planet.
5 Which conditions on Earth’s surface will allowfor the greatest amount of water to seep into theground?(1) gentle slope and permeable(2) gentle slope and impermeable(3) steep slope and permeable(4) steep slope and impermeable
6 The photograph below shows a Foucaultpendulum at a museum. The pendulum knocksover pins in a regular pattern as it swings backand forth.
This pendulum movement, and the pattern ofknocked-over pins, is evidence of Earth’s(1) nearly spherical shape(2) gravitational attraction to the Sun(3) rotation on its axis(4) nearly circular orbit around the Sun
7 Earth’s early atmosphere contained carbondioxide, sulfur dioxide, hydrogen, nitrogen, watervapor, methane, and ammonia. These gases werepresent in the atmosphere primarily because(1) radioactive decay products produced in
Earth’s core were released from Earth’ssurface
(2) evolving Earth life-forms produced thesegases through their activity
(3) Earth’s growing gravitational field attractedthese gases from space
(4) volcanic eruptions on Earth’s surfacereleased these gases from the interior
P.S./E. Sci.–June ’16 [2]
Part A
Answer all questions in this part.
Directions (1–35): For each statement or question, choose the word or expression that, of those given, bestcompletes the statement or answers the question. Some questions may require the use of the 2011 EditionReference Tables for Physical Setting/Earth Science. Record your answers on your separate answer sheet.
P.S./E. Sci.–June ’16 [3] [OVER]
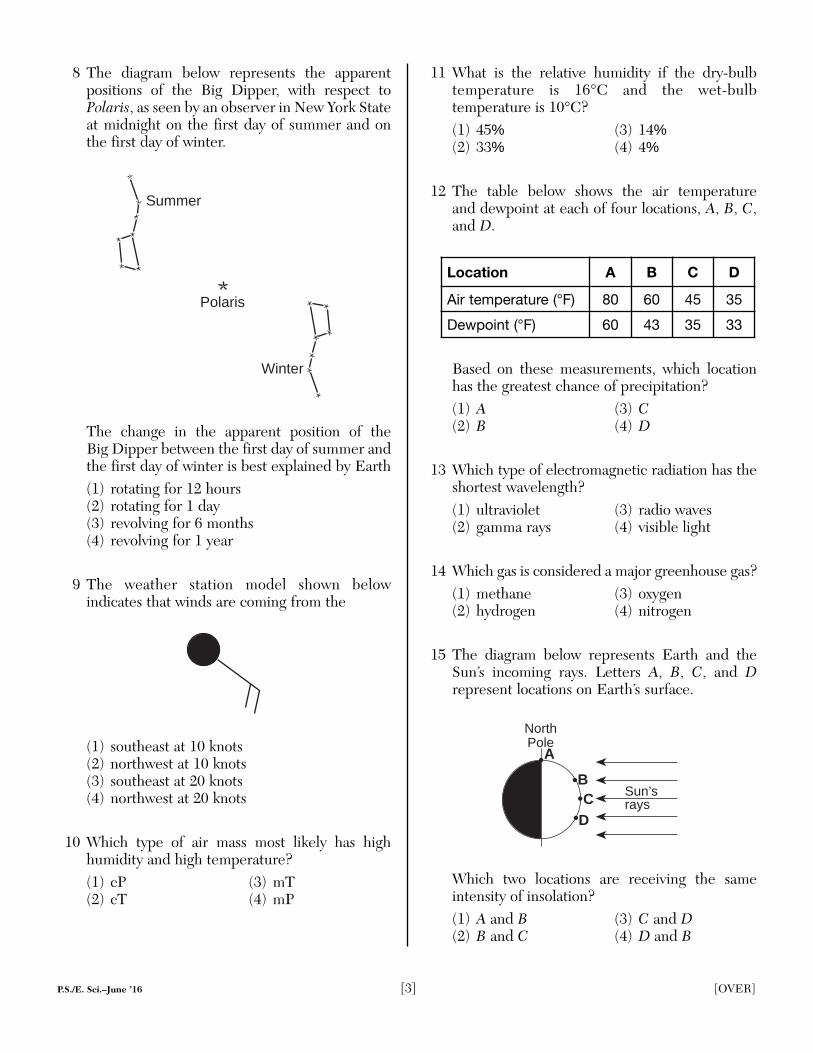
8 The diagram below represents the apparentpositions of the Big Dipper, with respect toPolaris, as seen by an observer in New York Stateat midnight on the first day of summer and onthe first day of winter.
The change in the apparent position of the Big Dipper between the first day of summer andthe first day of winter is best explained by Earth(1) rotating for 12 hours(2) rotating for 1 day(3) revolving for 6 months(4) revolving for 1 year
9 The weather station model shown belowindicates that winds are coming from the
(1) southeast at 10 knots(2) northwest at 10 knots(3) southeast at 20 knots(4) northwest at 20 knots
10 Which type of air mass most likely has highhumidity and high temperature?(1) cP (3) mT(2) cT (4) mP
11 What is the relative humidity if the dry-bulbtemperature is 16°C and the wet-bulbtemperature is 10°C?(1) 45% (3) 14%(2) 33% (4) 4%
12 The table below shows the air temperature and dewpoint at each of four locations, A, B, C,and D.
Based on these measurements, which locationhas the greatest chance of precipitation?(1) A (3) C(2) B (4) D
13 Which type of electromagnetic radiation has theshortest wavelength?(1) ultraviolet (3) radio waves(2) gamma rays (4) visible light
14 Which gas is considered a major greenhouse gas?(1) methane (3) oxygen(2) hydrogen (4) nitrogen
15 The diagram below represents Earth and theSun’s incoming rays. Letters A, B, C, and Drepresent locations on Earth’s surface.
Which two locations are receiving the sameintensity of insolation?(1) A and B (3) C and D(2) B and C (4) D and B
Sun’srays
A
B
DC
North Pole
Location A B C D
Air temperature (°F) 80 60 45 35
Dewpoint (°F) 60 43 35 33
Polaris
Summer
Winter

16 Most of the sand that makes up the sandstonefound in New York State was originallydeposited in which type of layers?(1) tilted (3) faulted(2) horizontal (4) folded
17 The map below shows the current location ofNew York State in North America.
Approximately how many million years ago(mya) was this New York State region located atthe equator?(1) 59 mya (3) 359 mya(2) 119 mya (4) 458 mya
18 Many scientists infer that one cause of the massextinction of dinosaurs and ammonoids thatoccurred approximately 65.5 million years agowas(1) tectonic plate subduction of most of the
continents(2) an asteroid impact that resulted in climate
change(3) a disease spreading among many groups of
organisms(4) severe damage produced by worldwide
earthquakes
19 During which geologic epoch do scientists inferthat the earliest grasses first appeared on Earth?(1) Holocene (3) Oligocene(2) Pleistocene (4) Eocene
20 What are the inferred pressure and temperatureat the boundary of Earth’s stiffer mantle andouter core?(1) 1.5 million atmospheres pressure and an
interior temperature of 4950°C(2) 1.5 million atmospheres pressure and an
interior temperature of 6200°C(3) 3.1 million atmospheres pressure and an
interior temperature of 4950°C(4) 3.1 million atmospheres pressure and an
interior temperature of 6200°C
21 A seismic P-wave is recorded at 2:25 p.m. at aseismic station located 7600 kilometers from theepicenter of an earthquake. At what time did theearthquake occur?(1) 2:05 p.m. (3) 2:14 p.m.(2) 2:11 p.m. (4) 2:36 p.m.
22 A seismic station recorded the P-waves, but noS-waves, from an earthquake because S-waveswere(1) absorbed by Earth’s outer core(2) transmitted only through liquids(3) weak and detected only at nearby locations(4) not produced by this earthquake
23 The Catskills of New York State are bestdescribed as a plateau, while the Adirondacksare best described as mountains. Which factor ismost responsible for the difference in landscapeclassification of these two regions?(1) climate variations (3) vegetation type(2) bedrock structure (4) bedrock age
24 An elongated hill that is composed of unsortedsediments deposited by a glacier is called(1) a delta (3) a sand dune(2) a drumlin (4) an outwash plain
25 Which rock was subjected to intense heat andpressure but did not solidify from magma?(1) sandstone (3) gabbro(2) schist (4) rhyolite
New York State
P.S./E. Sci.–June ’16 [4]
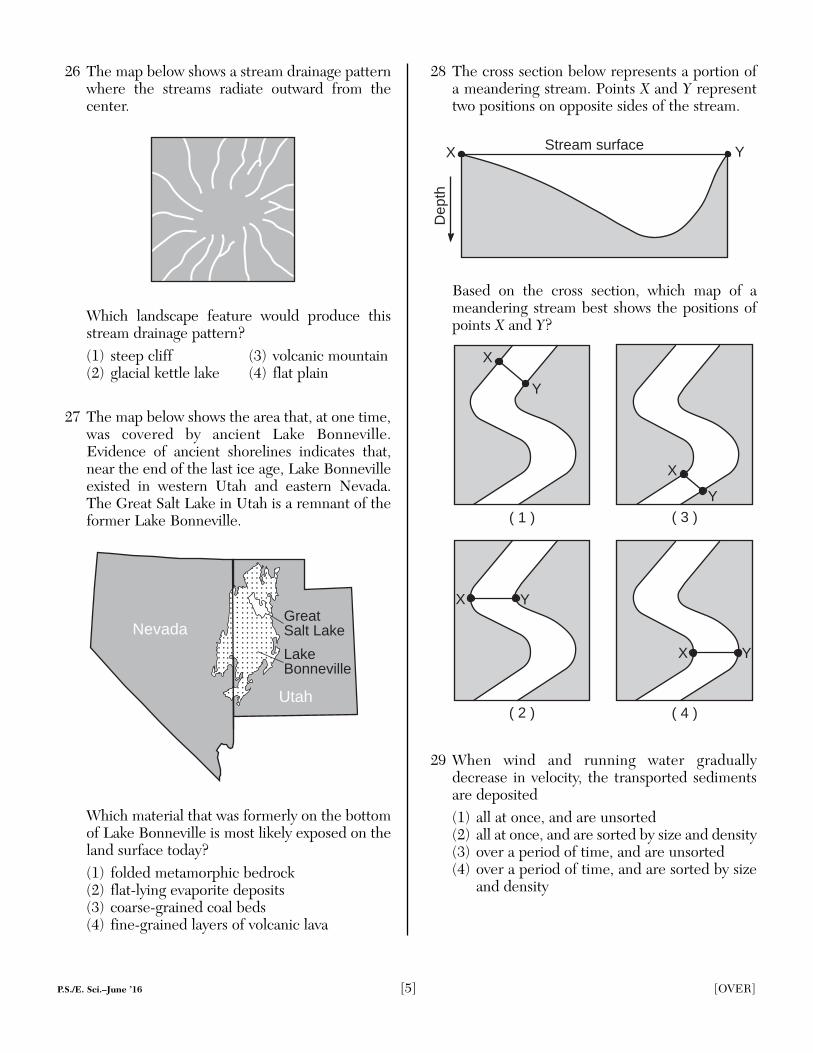
26 The map below shows a stream drainage patternwhere the streams radiate outward from thecenter.
Which landscape feature would produce thisstream drainage pattern?(1) steep cliff (3) volcanic mountain(2) glacial kettle lake (4) flat plain
27 The map below shows the area that, at one time,was covered by ancient Lake Bonneville.Evidence of ancient shorelines indicates that,near the end of the last ice age, Lake Bonnevilleexisted in western Utah and eastern Nevada.The Great Salt Lake in Utah is a remnant of theformer Lake Bonneville.
Which material that was formerly on the bottomof Lake Bonneville is most likely exposed on theland surface today?(1) folded metamorphic bedrock(2) flat-lying evaporite deposits(3) coarse-grained coal beds(4) fine-grained layers of volcanic lava
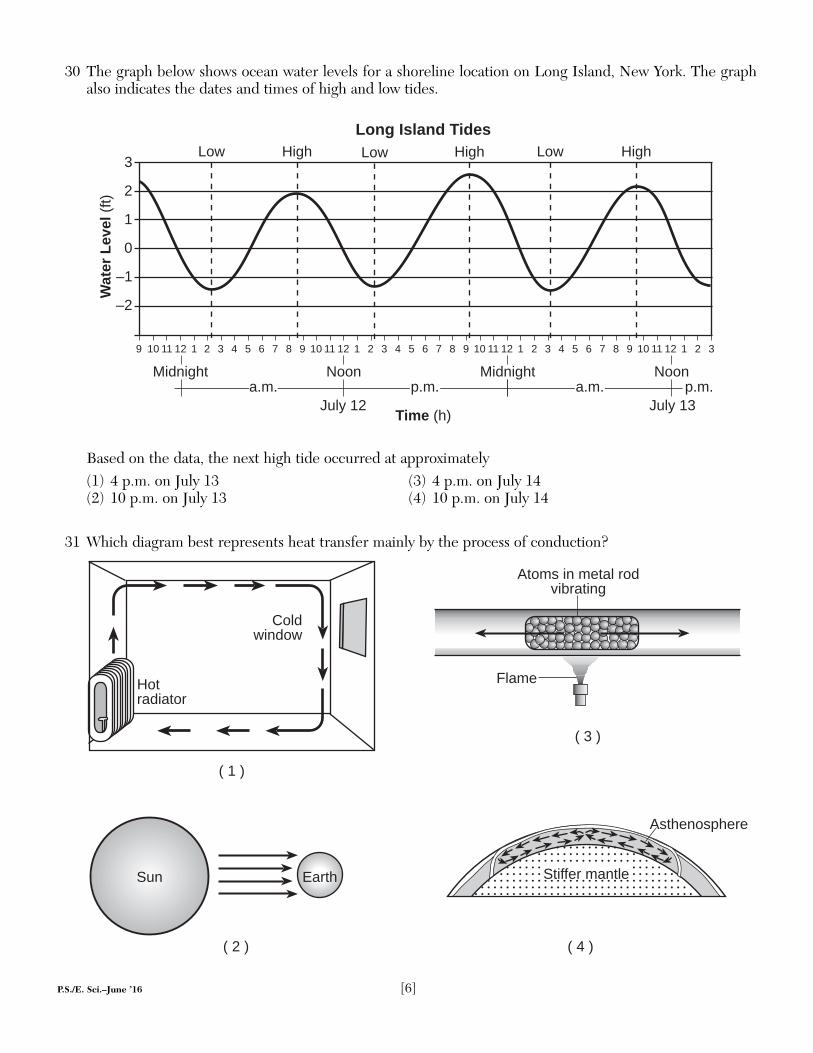
28 The cross section below represents a portion ofa meandering stream. Points X and Y representtwo positions on opposite sides of the stream.
Based on the cross section, which map of ameandering stream best shows the positions ofpoints X and Y?
29 When wind and running water graduallydecrease in velocity, the transported sedimentsare deposited(1) all at once, and are unsorted(2) all at once, and are sorted by size and density(3) over a period of time, and are unsorted(4) over a period of time, and are sorted by size
and density
( 1 )
( 2 )
X Y
( 3 )
X
Y
X
Y
( 4 )
X Y
X YStream surface
Dep
th
GreatSalt Lake
LakeBonneville
Nevada
Utah
P.S./E. Sci.–June ’16 [5] [OVER]
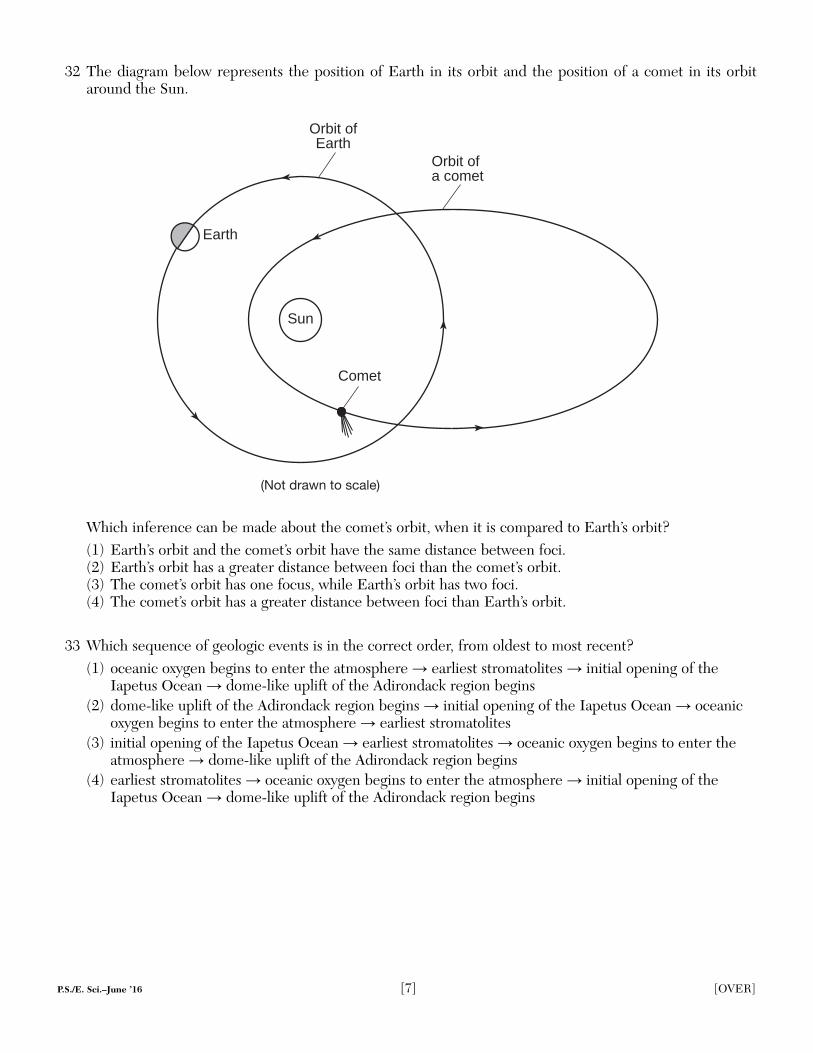
30 The graph below shows ocean water levels for a shoreline location on Long Island, New York. The graphalso indicates the dates and times of high and low tides.
Based on the data, the next high tide occurred at approximately(1) 4 p.m. on July 13 (3) 4 p.m. on July 14(2) 10 p.m. on July 13 (4) 10 p.m. on July 14
31 Which diagram best represents heat transfer mainly by the process of conduction?
Coldwindow
Hotradiator
EarthSun
( 1 )
( 2 )
( 3 )
( 4 )
Asthenosphere
Atoms in metal rodvibrating
Flame
Stiffer mantle
3
–2
–1
0
1
2
Low
Long Island Tides
Wat
er L
evel
(ft)
Midnight
9 10 11 12 1 2 3 4 5 6 7 8 9 10 11 12 1 2 3 4 5 6 7 8 9 10 11 12 1 2 3 4 5 6 7 8 9 10 11 12 1 2 3
Noon Midnight Noon
July 12 July 13Time (h)
High Low High Low High
a.m. a.m.p.m. p.m.
P.S./E. Sci.–June ’16 [6]
32 The diagram below represents the position of Earth in its orbit and the position of a comet in its orbitaround the Sun.
Which inference can be made about the comet’s orbit, when it is compared to Earth’s orbit?(1) Earth’s orbit and the comet’s orbit have the same distance between foci.(2) Earth’s orbit has a greater distance between foci than the comet’s orbit.(3) The comet’s orbit has one focus, while Earth’s orbit has two foci.(4) The comet’s orbit has a greater distance between foci than Earth’s orbit.
33 Which sequence of geologic events is in the correct order, from oldest to most recent?(1) oceanic oxygen begins to enter the atmosphere → earliest stromatolites → initial opening of the
Iapetus Ocean → dome-like uplift of the Adirondack region begins(2) dome-like uplift of the Adirondack region begins → initial opening of the Iapetus Ocean → oceanic
oxygen begins to enter the atmosphere → earliest stromatolites(3) initial opening of the Iapetus Ocean → earliest stromatolites → oceanic oxygen begins to enter the
atmosphere → dome-like uplift of the Adirondack region begins(4) earliest stromatolites → oceanic oxygen begins to enter the atmosphere → initial opening of the
Iapetus Ocean → dome-like uplift of the Adirondack region begins
Sun
Comet
Orbit ofEarth
Orbit ofa comet
(Not drawn to scale)
Earth
P.S./E. Sci.–June ’16 [7] [OVER]
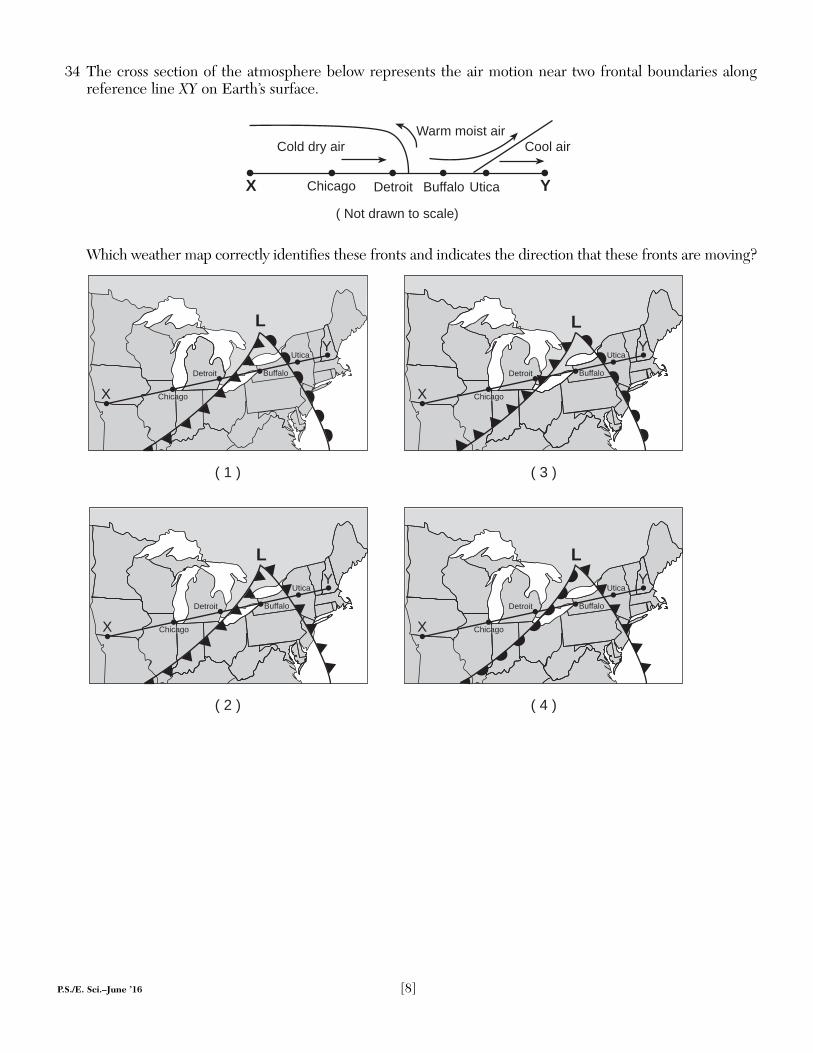
34 The cross section of the atmosphere below represents the air motion near two frontal boundaries alongreference line XY on Earth’s surface.
Which weather map correctly identifies these fronts and indicates the direction that these fronts are moving?
( 1 )
( 2 )
( 3 )
L
L
( 4 )
L
Utica
Detroit Buffalo
Chicago
Utica
Detroit Buffalo
Chicago
Utica
Detroit Buffalo
ChicagoX
Y
X
Y
X
Y
L
Utica
Detroit Buffalo
ChicagoX
Y
X Chicago Detroit Buffalo Utica Y
( Not drawn to scale)
Cold dry air Cool airWarm moist air
P.S./E. Sci.–June ’16 [8]
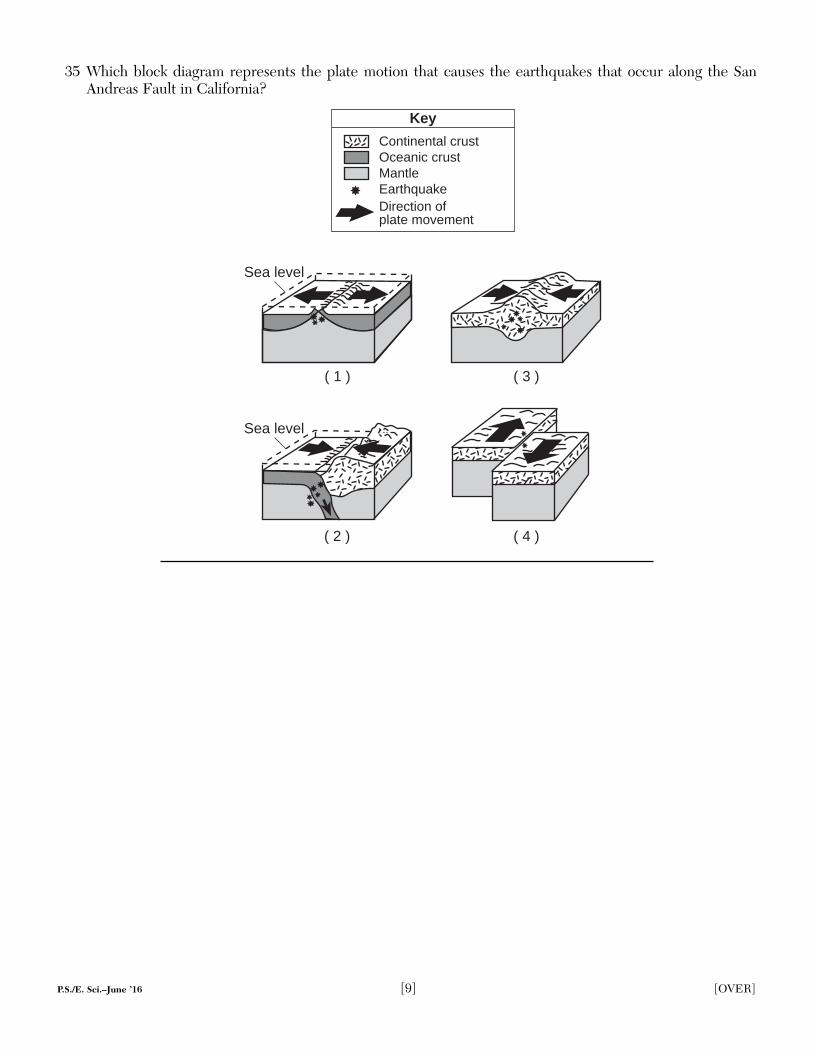
35 Which block diagram represents the plate motion that causes the earthquakes that occur along the SanAndreas Fault in California?
Sea level
( 1 )
( 2 )
Sea level
Key
Continental crustOceanic crustMantleEarthquakeDirection ofplate movement
( 3 )
( 4 )
P.S./E. Sci.–June ’16 [9] [OVER]
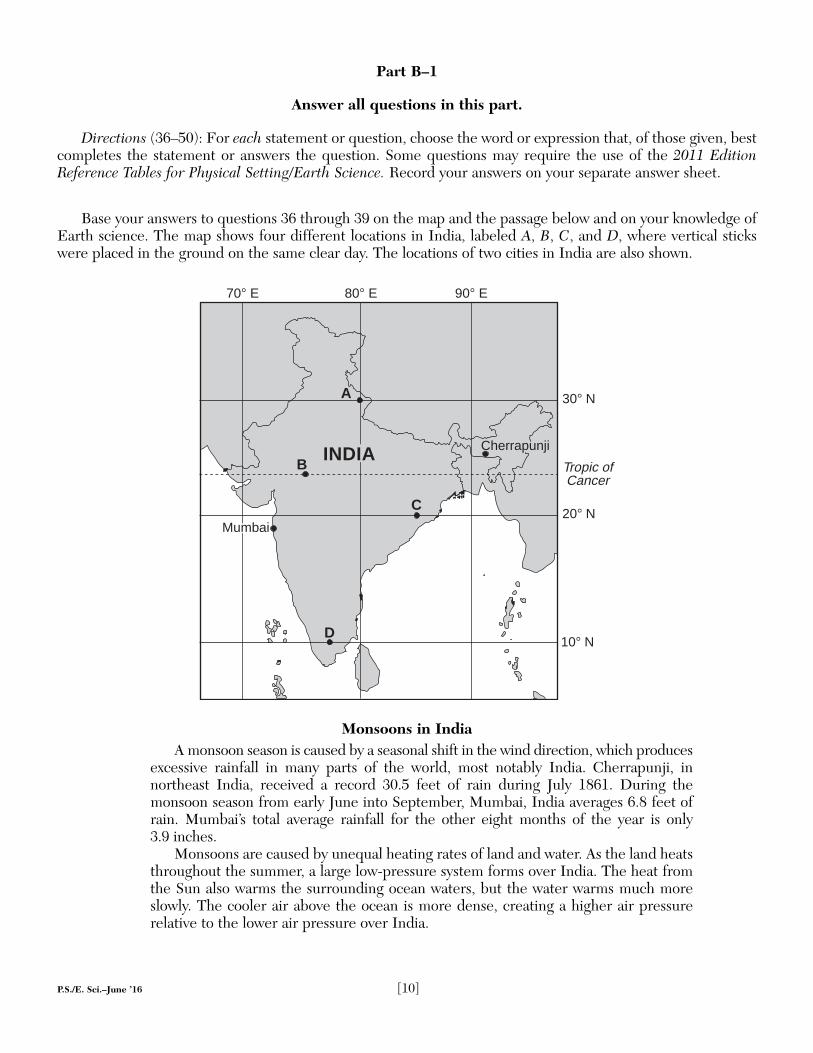
Base your answers to questions 36 through 39 on the map and the passage below and on your knowledge ofEarth science. The map shows four different locations in India, labeled A, B, C, and D, where vertical stickswere placed in the ground on the same clear day. The locations of two cities in India are also shown.
Monsoons in IndiaA monsoon season is caused by a seasonal shift in the wind direction, which produces
excessive rainfall in many parts of the world, most notably India. Cherrapunji, in northeast India, received a record 30.5 feet of rain during July 1861. During the monsoon season from early June into September, Mumbai, India averages 6.8 feet ofrain. Mumbai’s total average rainfall for the other eight months of the year is only 3.9 inches.
Monsoons are caused by unequal heating rates of land and water. As the land heatsthroughout the summer, a large low-pressure system forms over India. The heat fromthe Sun also warms the surrounding ocean waters, but the water warms much moreslowly. The cooler air above the ocean is more dense, creating a higher air pressure relative to the lower air pressure over India.
D
B
C
A
70� E 80� E 90� E
30� N
20� N
Tropic ofCancer
10� N
Mumbai
INDIA Cherrapunji
P.S./E. Sci.–June ’16 [10]
Part B–1
Answer all questions in this part.
Directions (36–50): For each statement or question, choose the word or expression that, of those given, bestcompletes the statement or answers the question. Some questions may require the use of the 2011 EditionReference Tables for Physical Setting/Earth Science. Record your answers on your separate answer sheet.
36 At which map location would no shadow be cast by the vertical stick at solar noon on the first day ofsummer?(1) A (3) C(2) B (4) D
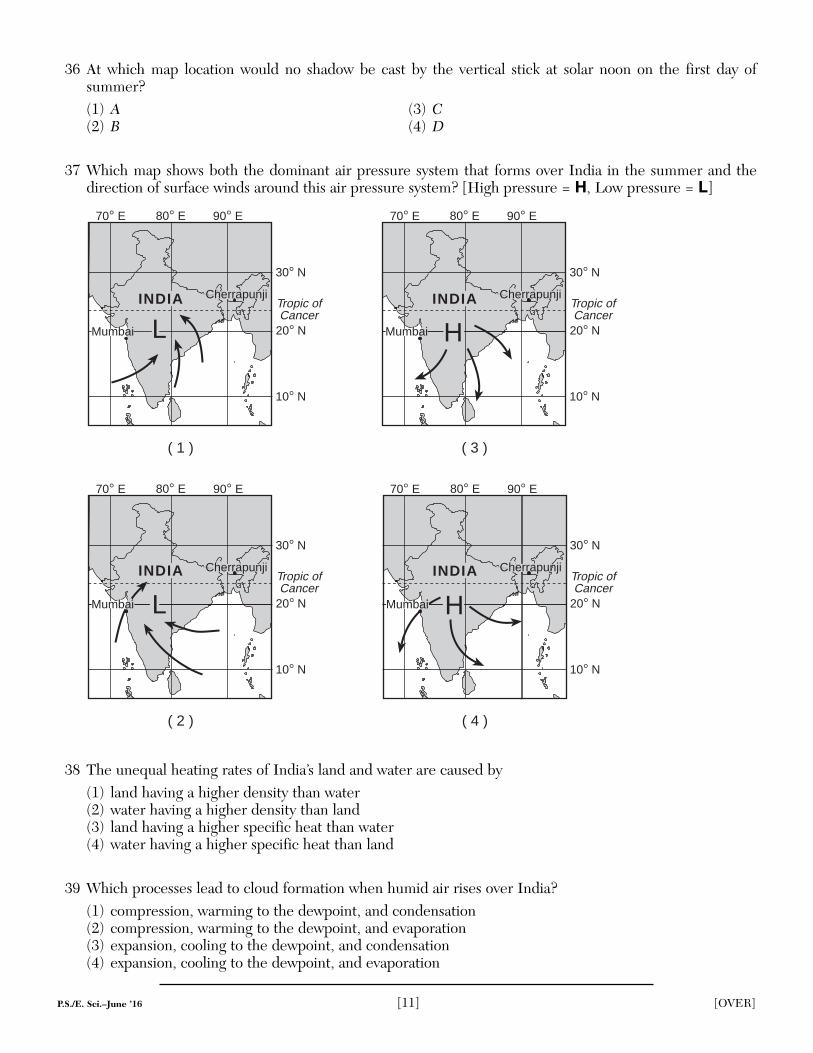
37 Which map shows both the dominant air pressure system that forms over India in the summer and thedirection of surface winds around this air pressure system? [High pressure = H, Low pressure = L]
38 The unequal heating rates of India’s land and water are caused by(1) land having a higher density than water(2) water having a higher density than land(3) land having a higher specific heat than water(4) water having a higher specific heat than land
39 Which processes lead to cloud formation when humid air rises over India?(1) compression, warming to the dewpoint, and condensation(2) compression, warming to the dewpoint, and evaporation(3) expansion, cooling to the dewpoint, and condensation(4) expansion, cooling to the dewpoint, and evaporation
70� E 80� E 90� E
30� N
20� N
Tropic ofCancer
10� N
( 1 )
70� E 80� E 90� E
30� N
20� N
Tropic ofCancer
10� N
( 3 )
70� E 80� E 90� E
30� N
20� N
Tropic ofCancer
10� N
( 4 )
70� E 80� E 90� E
30� N
20� N
Tropic ofCancer
10� N
( 2 )
INDIA
INDIA
LMumbai
Cherrapunji
Cherrapunji
Mumbai
Cherrapunji
Cherrapunji
Mumbai
H
MumbaiMumbai L H
INDIA
INDIA
P.S./E. Sci.–June ’16 [11] [OVER]

Base your answers to questions 40 through 42 on the diagram below and on your knowledge of Earth science. The diagram represents the apparent path of the Sun across the sky at a New York State location onJune 21. Point A represents the position of the noon Sun. Points A and B on the path are 45 degrees apart.
40 How many hours (h) will it take for the apparent position of the Sun to change from point A to point B?(1) 1 h (3) 3 h(2) 2 h (4) 4 h
41 Compared to the Sun’s apparent path on June 21, the Sun’s apparent path on December 21 at this locationwill(1) be shorter, and the noon Sun will be lower in the sky(2) be longer, and the noon Sun will be higher in the sky(3) remain the same length, and the noon Sun will be lower in the sky(4) remain the same length, and the noon Sun will be higher in the sky
42 Which diagram represents the correct position of Polaris as viewed from this New York State location on aclear night?
NorthSouth
( 1 ) ( 3 )
( 2 )
Polaris
( 4 )
Polaris
Sun’s apparentpath
PolarisNorthSouth
A
B
Sun’s apparentpath A
B
NorthSouth
Sun’s apparentpath A
BPolaris
Sun’s apparentpath
NorthSouth
A
B
NorthSouth
Sun’s apparentpath
A
B
P.S./E. Sci.–June ’16 [12]
P.S./E. Sci.–June ’16 [13] [OVER]
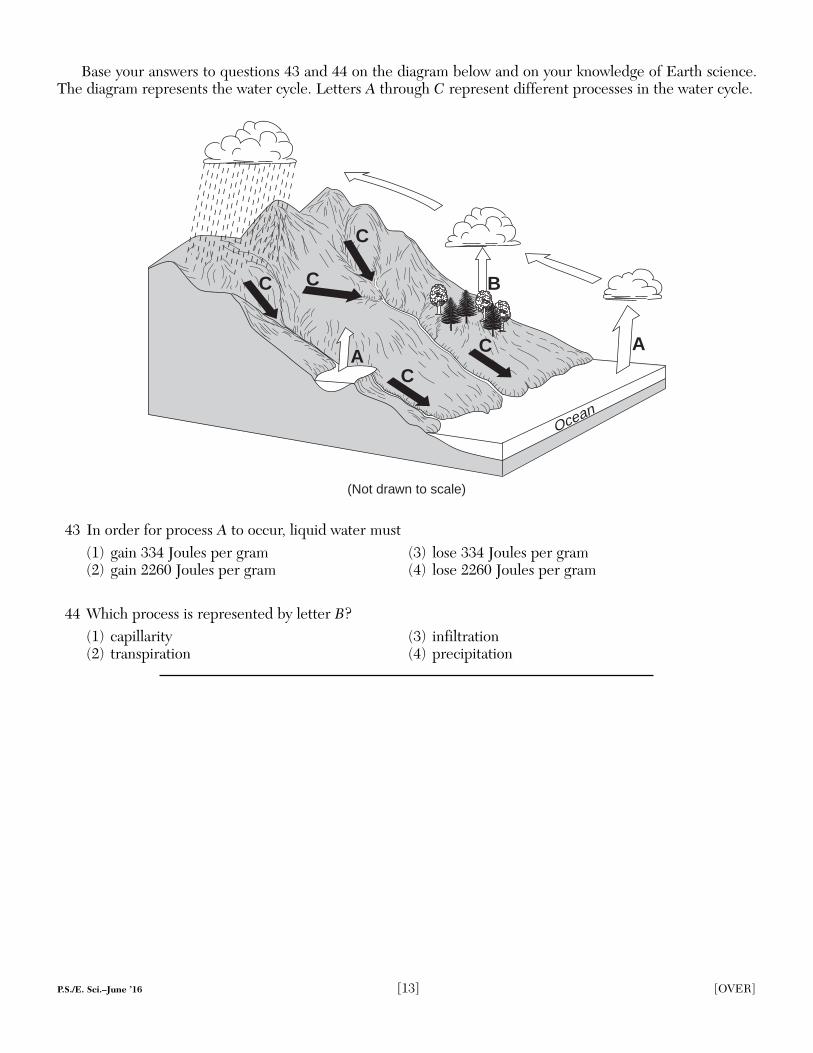
Base your answers to questions 43 and 44 on the diagram below and on your knowledge of Earth science.The diagram represents the water cycle. Letters A through C represent different processes in the water cycle.
43 In order for process A to occur, liquid water must(1) gain 334 Joules per gram (3) lose 334 Joules per gram(2) gain 2260 Joules per gram (4) lose 2260 Joules per gram
44 Which process is represented by letter B?(1) capillarity (3) infiltration(2) transpiration (4) precipitation
Ocean
C
C
BC
C
CA
(Not drawn to scale)
A

P.S./E. Sci.–June ’16 [14]
Base your answers to questions 45 through 47 on the photograph below and on your knowledge of Earthscience. The photograph shows a small waterfall located on the Tug Hill Plateau.
45 During which geologic time period was the surface bedrock at this location formed?(1) Cretaceous (3) Devonian(2) Triassic (4) Ordovician
46 Compared to the bedrock layers above and below the rock ledge shown at the waterfall, the characteristicthat is primarily responsible for the existence of the rock ledge is its greater(1) resistance to weathering (3) thickness(2) abundance of fossils (4) age
47 Rock fragments that are tumbled and carried over long distances by this stream are most likely becoming(1) less dense, harder, and smaller (3) more dense, angular, and smaller(2) less rounded, jagged, and larger (4) more rounded, smoother, and smaller
Rockledge
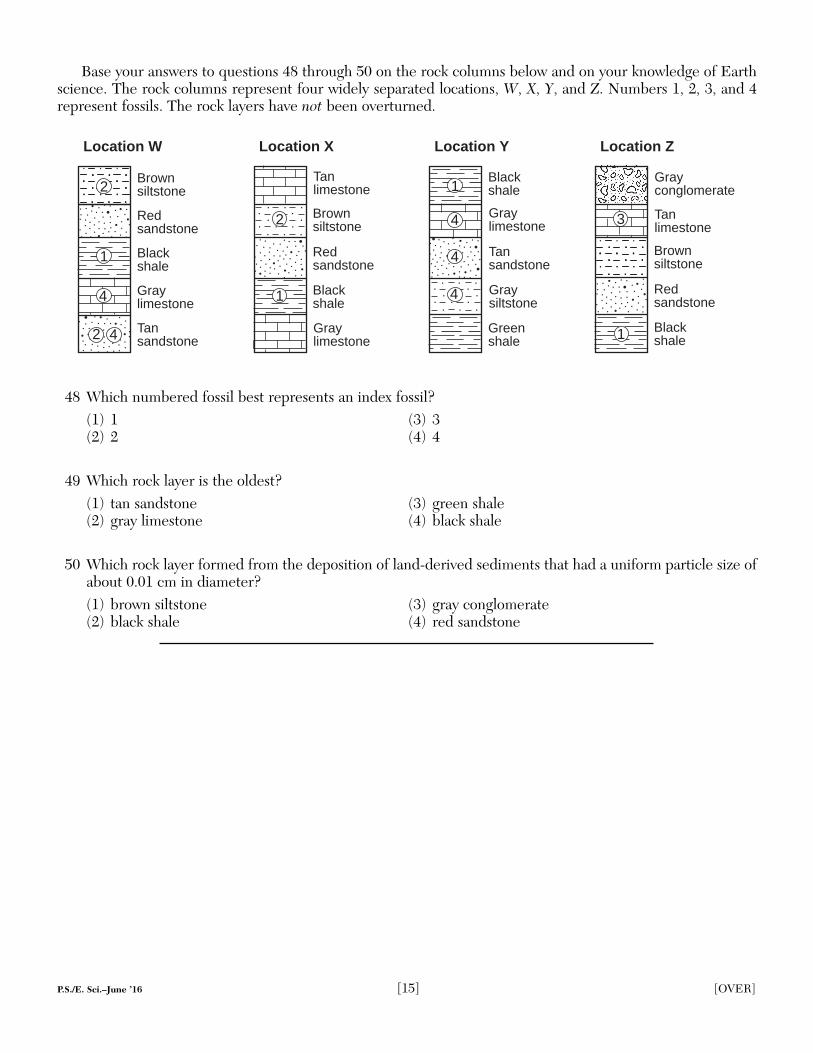
Base your answers to questions 48 through 50 on the rock columns below and on your knowledge of Earthscience. The rock columns represent four widely separated locations, W, X, Y, and Z. Numbers 1, 2, 3, and 4represent fossils. The rock layers have not been overturned.
48 Which numbered fossil best represents an index fossil?(1) 1 (3) 3(2) 2 (4) 4
49 Which rock layer is the oldest?(1) tan sandstone (3) green shale(2) gray limestone (4) black shale
50 Which rock layer formed from the deposition of land-derived sediments that had a uniform particle size ofabout 0.01 cm in diameter?(1) brown siltstone (3) gray conglomerate(2) black shale (4) red sandstone
Brownsiltstone
Redsandstone
Blackshale
Tanlimestone
Location Z
Grayconglomerate
Graysiltstone
Blackshale
Tansandstone
Location Y
Graylimestone
Greenshale
Brownsiltstone
Redsandstone
Blackshale
Tanlimestone
Location X
Graylimestone
Brownsiltstone
Redsandstone
Blackshale
Graylimestone
Tansandstone
Location W
. . .
. . .
. . .. . .. . .. . .. . .
. . .
. . .
. . .
. . .
. . .. . .. . .
. . .
. . .. . .. . .
. . .
. . .. . .. . .
. . .
. . .. . .. . .. . .. . .
. . .
. . .. . .. . .
. . .
. . .. . .. . .
. . .
. . .. . .. . .
. . .. . .. . .
. . .
. . .
. . .
2
1
2 4
2
1
4
4
1
4
4
1
3
P.S./E. Sci.–June ’16 [15] [OVER]
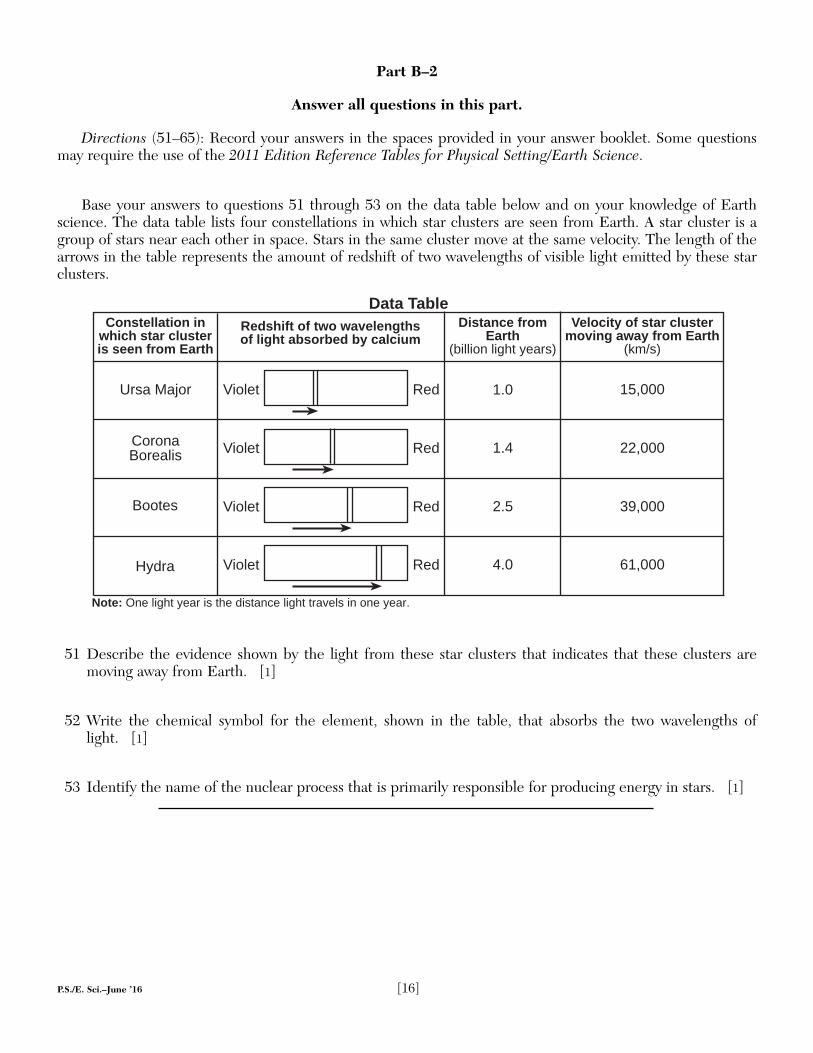
Base your answers to questions 51 through 53 on the data table below and on your knowledge of Earth science. The data table lists four constellations in which star clusters are seen from Earth. A star cluster is agroup of stars near each other in space. Stars in the same cluster move at the same velocity. The length of thearrows in the table represents the amount of redshift of two wavelengths of visible light emitted by these starclusters.
51 Describe the evidence shown by the light from these star clusters that indicates that these clusters aremoving away from Earth. [1]
52 Write the chemical symbol for the element, shown in the table, that absorbs the two wavelengths of light. [1]
53 Identify the name of the nuclear process that is primarily responsible for producing energy in stars. [1]
Data TableConstellation in
which star clusteris seen from Earth
Redshift of two wavelengthsof light absorbed by calcium
Distance fromEarth
(billion light years)
Velocity of star clustermoving away from Earth
(km/s)
Violet Red
CoronaBorealis
Bootes
Hydra
15,000
Violet Red
RedViolet
RedViolet
Ursa Major
2.5
4.0
1.4
1.0
22,000
39,000
61,000
Note: One light year is the distance light travels in one year.
P.S./E. Sci.–June ’16 [16]
Part B–2
Answer all questions in this part.
Directions (51–65): Record your answers in the spaces provided in your answer booklet. Some questionsmay require the use of the 2011 Edition Reference Tables for Physical Setting/Earth Science.
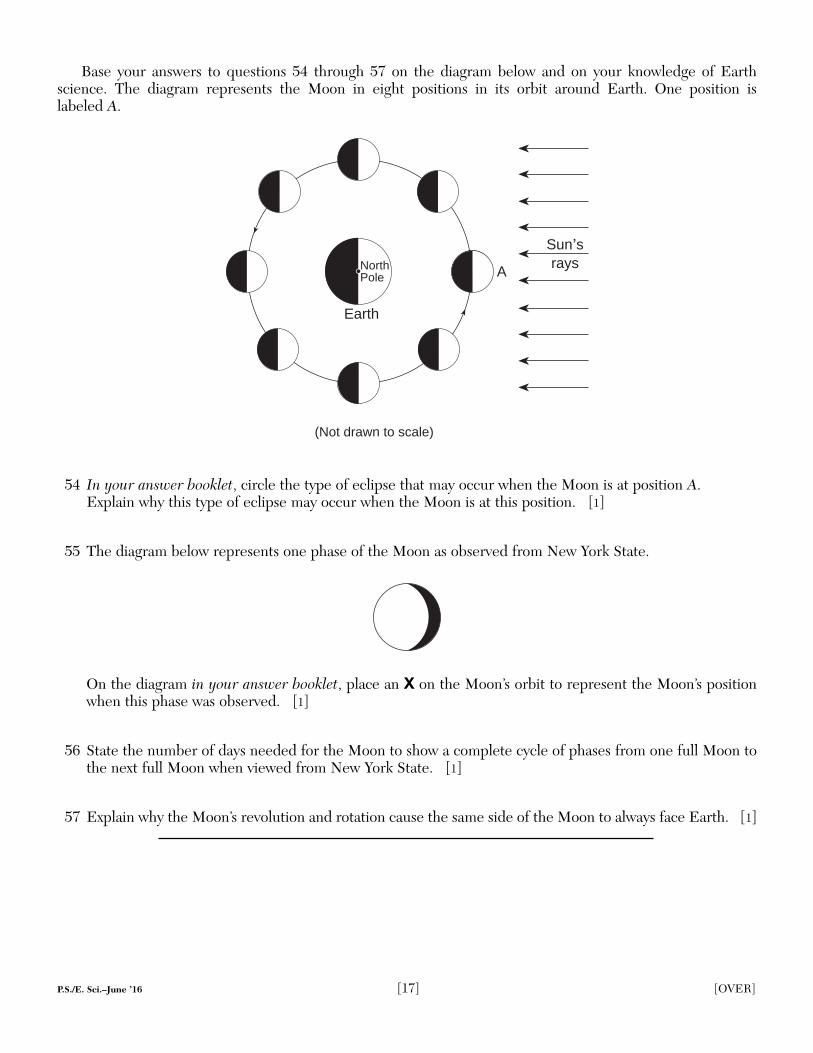
Base your answers to questions 54 through 57 on the diagram below and on your knowledge of Earth science. The diagram represents the Moon in eight positions in its orbit around Earth. One position is labeled A.
54 In your answer booklet, circle the type of eclipse that may occur when the Moon is at position A. Explain why this type of eclipse may occur when the Moon is at this position. [1]
55 The diagram below represents one phase of the Moon as observed from New York State.
On the diagram in your answer booklet, place an X on the Moon’s orbit to represent the Moon’s positionwhen this phase was observed. [1]
56 State the number of days needed for the Moon to show a complete cycle of phases from one full Moon tothe next full Moon when viewed from New York State. [1]
57 Explain why the Moon’s revolution and rotation cause the same side of the Moon to always face Earth. [1]
Earth
Sun’srays
A
(Not drawn to scale)
NorthPole
P.S./E. Sci.–June ’16 [17] [OVER]

Base your answers to questions 58 through 61 on the weather map in your answer booklet and on your knowledge of Earth science. The weather map shows atmospheric pressures, recorded in millibars (mb),at locations around a low-pressure center (L) in the eastern United States. Isobars indicate air pressures in thewestern portion of the mapped area. Point A represents a location on Earth’s surface.
58 On the weather map in your answer booklet, draw the 1012 millibar and the 1008 millibar isobars. Extend the isobars to the east coast of the United States. [1]
59 Identify the weather instrument that was used to measure the air pressures recorded on the map. [1]
60 Identify the compass direction toward which the center of the low-pressure system will move if it follows a typical storm track. [1]
61 Convert the air pressure at location A from millibars to inches of mercury. [1]
Base your answers to questions 62 through 65 on the graph below and on your knowledge of Earth science.The graph shows the rate of decay of the radioactive isotope carbon-14 (14C).
62 Complete the flow chart in your answer booklet by filling in the boxes to indicate the percentage of carbon-14 remaining and the time that has passed at the end of each half-life. [1]
63 Identify the decay product formed by the disintegration of carbon-14. [1]
64 Explain why carbon-14 cannot be used to accurately determine the age of organic remains that are1,000,000 years old. [1]
65 State the name of the radioactive isotope that has a half-life that is approximately the same as the estimatedtime of the origin of Earth. [1]
00 28.522.817.111.45.7
Time (x 103 yr)
25
50
75
100
Rad
ioac
tive
Car
bo
n-1
4 (%
)
Decay of Carbon-14
P.S./E. Sci.–June ’16 [18]
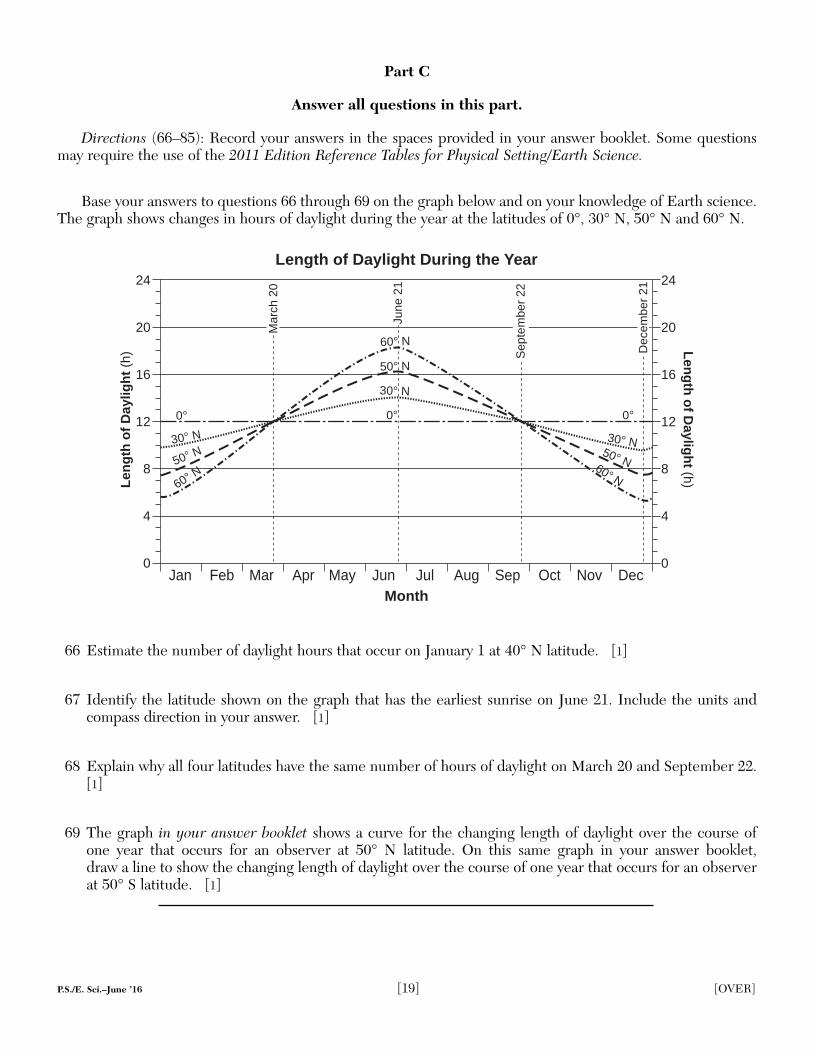
Base your answers to questions 66 through 69 on the graph below and on your knowledge of Earth science.The graph shows changes in hours of daylight during the year at the latitudes of 0°, 30° N, 50° N and 60° N.
66 Estimate the number of daylight hours that occur on January 1 at 40° N latitude. [1]
67 Identify the latitude shown on the graph that has the earliest sunrise on June 21. Include the units andcompass direction in your answer. [1]
68 Explain why all four latitudes have the same number of hours of daylight on March 20 and September 22.[1]
69 The graph in your answer booklet shows a curve for the changing length of daylight over the course of one year that occurs for an observer at 50° N latitude. On this same graph in your answer booklet, draw a line to show the changing length of daylight over the course of one year that occurs for an observerat 50° S latitude. [1]
Jan Feb Mar Apr May Jun Jul Aug Sep Oct Nov DecMonth
24
20
16
12
8
4
0
24
20
16
12
8
4
0
Len
gth
of
Day
ligh
t (h
) Len
gth
of D
ayligh
t (h)
Length of Daylight During the Year
60° N50° N30° N
0°
30° N
30° N
50° N
50° N
60° N
60° N
0° 0°
Mar
ch 2
0
June
21
Sep
tem
ber
22
Dec
embe
r 21
P.S./E. Sci.–June ’16 [19] [OVER]
Part C
Answer all questions in this part.
Directions (66–85): Record your answers in the spaces provided in your answer booklet. Some questionsmay require the use of the 2011 Edition Reference Tables for Physical Setting/Earth Science.
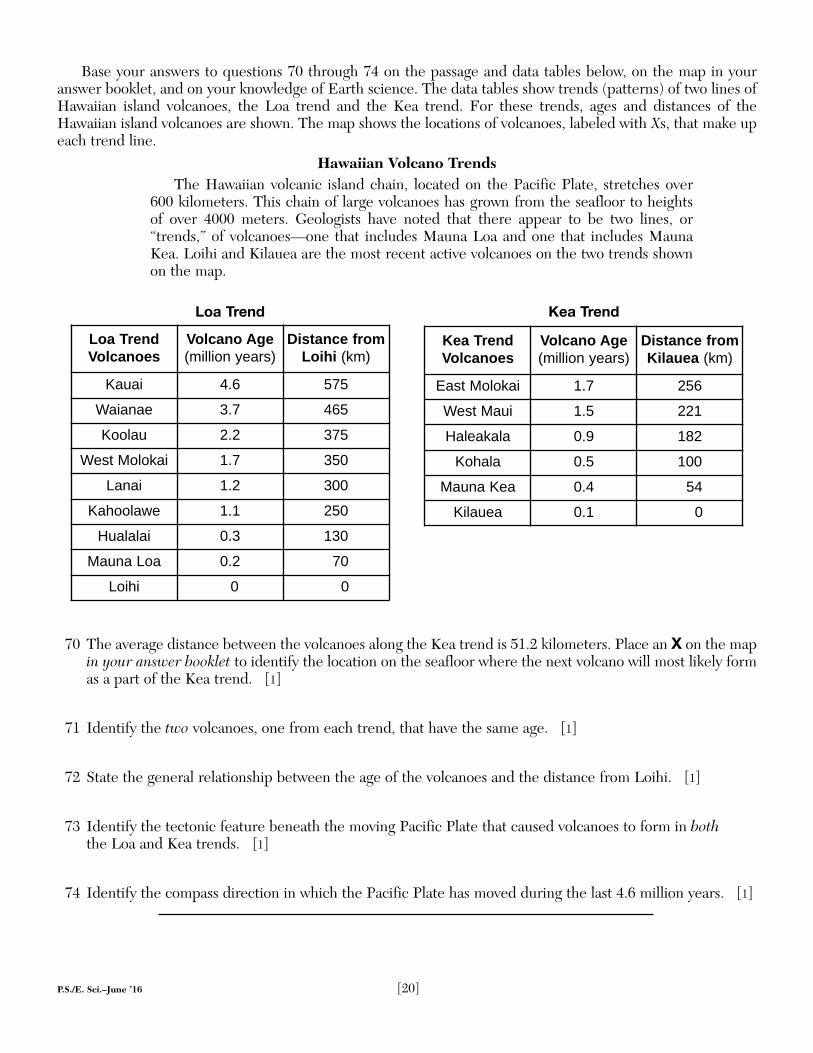
Base your answers to questions 70 through 74 on the passage and data tables below, on the map in youranswer booklet, and on your knowledge of Earth science. The data tables show trends (patterns) of two lines ofHawaiian island volcanoes, the Loa trend and the Kea trend. For these trends, ages and distances of theHawaiian island volcanoes are shown. The map shows the locations of volcanoes, labeled with Xs, that make upeach trend line.
Hawaiian Volcano TrendsThe Hawaiian volcanic island chain, located on the Pacific Plate, stretches over
600 kilometers. This chain of large volcanoes has grown from the seafloor to heights of over 4000 meters. Geologists have noted that there appear to be two lines, or“trends,” of volcanoes—one that includes Mauna Loa and one that includes MaunaKea. Loihi and Kilauea are the most recent active volcanoes on the two trends shownon the map.
P.S./E. Sci.–June ’16 [20]
Loa Trend Kea Trend
Kea TrendVolcanoes
Volcano Age(million years)
Distance fromKilauea (km)
East Molokai 1.7 256
West Maui 1.5 221
Haleakala 0.9 182
Kohala 0.5 100
Mauna Kea 0.4 54
Kilauea 0.1 0
Loa TrendVolcanoes
Volcano Age(million years)
Distance fromLoihi (km)
Kauai 4.6 575
Waianae 3.7 465
Koolau 2.2 375
West Molokai 1.7 350
Lanai 1.2 300
Kahoolawe 1.1 250
Hualalai 0.3 130
Mauna Loa 0.2 70
Loihi 0 0
70 The average distance between the volcanoes along the Kea trend is 51.2 kilometers. Place an X on the mapin your answer booklet to identify the location on the seafloor where the next volcano will most likely formas a part of the Kea trend. [1]
71 Identify the two volcanoes, one from each trend, that have the same age. [1]
72 State the general relationship between the age of the volcanoes and the distance from Loihi. [1]
73 Identify the tectonic feature beneath the moving Pacific Plate that caused volcanoes to form in boththe Loa and Kea trends. [1]
74 Identify the compass direction in which the Pacific Plate has moved during the last 4.6 million years. [1]

P.S./E. Sci.–June ’16 [21] [OVER]
Base your answers to questions 75 through 79 on the topographic map in your answer booklet and on yourknowledge of Earth science. Lines AB and CD are reference lines on the map. Letter E indicates a location ina stream.
75 On the map in your answer booklet, draw an X on the location with the highest elevation. [1]
76 Using the grid in your answer booklet, construct a topographic profile along line AB by plotting theelevation of each contour line that crosses line AB. Points A and B have already been plotted on the grid.Connect all plots with a line from A to B to complete the profile. [1]
77 Calculate the gradient along line CD. [1]
78 Describe how the contour lines indicate the direction in which Buck River flows. [1]
79 Determine the velocity of the stream at location E where the largest particle being carried at location E hasa diameter of 10.0 centimeters. [1]
Base your answers to questions 80 through 83 on the passage below and on your knowledge of Earth science.
Dimension Stone: GraniteDimension stone is any rock mined and cut for specific purposes, such as kitchen
countertops, monuments, and the curbing along city streets. Examples of rock minedfor use as dimension stone include limestone, marble, sandstone, and slate. The mostimportant dimension stone is granite; however, not all dimension stone sold as graniteis actually granite. Two examples of such rock sold as “granite” are syenite andanorthosite. Syenite is a crystalline, light-colored rock composed primarily of potassiumfeldspar, plagioclase feldspar, biotite, and amphibole, while anorthosite is composedalmost entirely of plagioclase feldspar. Like actual granite, both syenite and anorthositehave large, interlocking crystals.
80 Explain why syenite is classified as a plutonic igneous rock. [1]
81 State one reason why anorthosite is likely to be white to gray in color. [1]
82 The igneous rock gabbro is sometimes sold as “black granite.” Compared to the density and composition ofgranite, describe how the density and composition of gabbro are different. [1]
83 Identify one dimension stone mentioned in the passage that is composed primarily of calcite. [1]
P.S./E. Sci.–June ’16 [22]
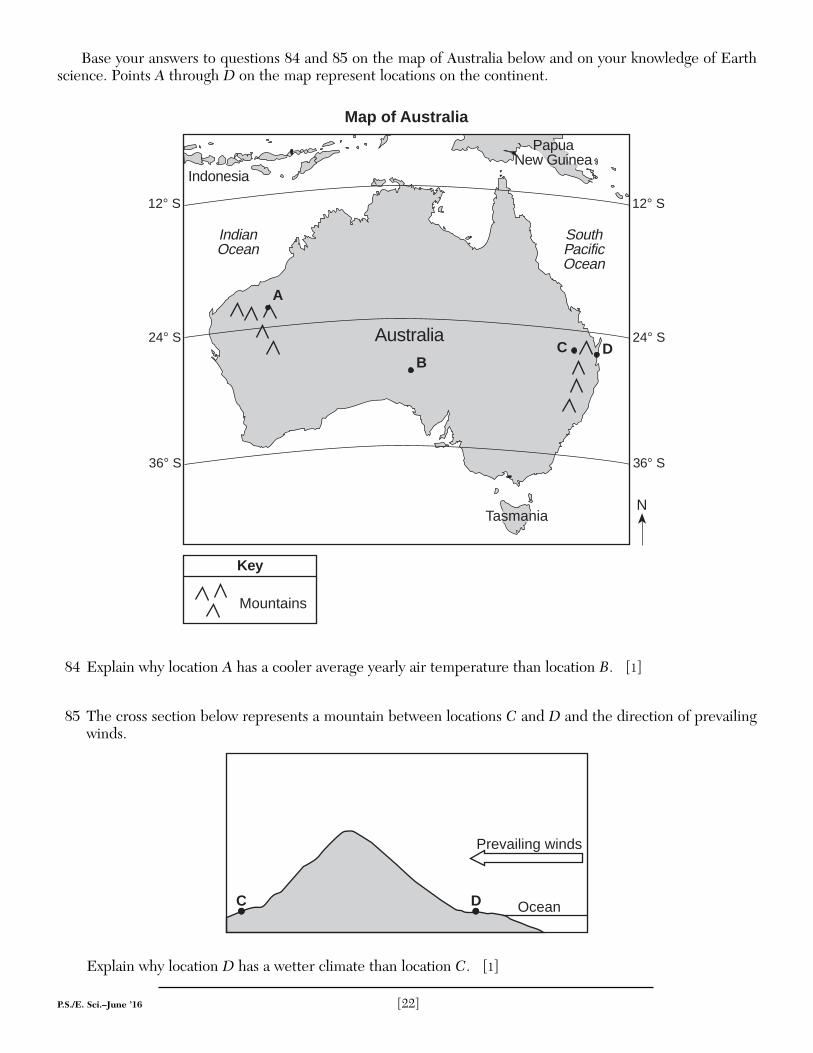
Base your answers to questions 84 and 85 on the map of Australia below and on your knowledge of Earthscience. Points A through D on the map represent locations on the continent.
84 Explain why location A has a cooler average yearly air temperature than location B. [1]
85 The cross section below represents a mountain between locations C and D and the direction of prevailingwinds.
Explain why location D has a wetter climate than location C. [1]
C D Ocean
Prevailing winds
N
12° S
24° S
36° S
12° S
24° S
36° S
Australia
IndianOcean
SouthPacificOcean
D
A
B
Tasmania
Indonesia
PapuaNew Guinea
Mountains
Key
Map of Australia
C


P.S./EARTH SCIENCEP.S./EARTH SCIENCE
Printed on Recycled Paper