Physical Properties and Mineralogy of Selected … · Physical Properties and Mineralogy of...
32
Physical Properties and Mineralogy of Selected Samples of the Sediments From the Vicinity of the Brookhaven National Laboratory, Long Island, New York GEOLOGICAL SURVEY BULLETIN 1156-B This report concerns work done on behalf of the U. S. Atomic Energy Commission
Transcript of Physical Properties and Mineralogy of Selected … · Physical Properties and Mineralogy of...

Physical Properties and Mineralogy of
Selected Samples of the Sediments From
the Vicinity of the Brookhaven National
Laboratory, Long Island, New York
GEOLOGICAL SURVEY BULLETIN 1156-B
This report concerns work done on behalf of the U. S. Atomic Energy Commission

Physical Properties and Mineralogy of
Selected Samples of the Sediments From
the Vicinity of the Brookhaven National
Laboratory, Long Island, New York
By GEORGE T. FAUST
STUDIES OF SITES FOR NUCLEAR ENERGY FACILITIES- BROOKHAVEN NATIONAL LABORATORY
GEOLOGICAL SURVEY BULLETIN 1156-B
This report concerns work done on behalf of the U. S. Atomic Energy Commission
Correlation of the physical properties and mineralogy of some unconsolidated sediments and use of the data in interpretative petrology
UNITED STATES GOVERNMENT PRINTING OFFICE, WASHINGTON : 1963

UNITED STATES DEPARTMENT OF THE INTERIOR
STEWART L. UDALL, Secretary
GEOLOGICAL SURVEY
Thomas B. Nolan, Director
For sale by the Superintendent of Documents, U.S. Government Printing Office Washington, D.C., 20402

CONTENTS
Page
Abstract________________________________________________________ BlIntroduction._____________________________________________________ 1Description and location of samples.._____.______-_____-_-___-___--__ 2Mechanical analysis._____________________________________________ 3Mineralogic composition.._-__-_____________-_______-_______-..__-_-- 7
Optical studies_-___-___-_______---___..____-____-_______--_---- 7X-ray diffraction studies._______________________________________ 15Differential thermal analysis-___________-___-____---___----.---- 15Electron microscopy.--______________________-__-_____---__--_- 19Radioactive minerals in the environment------------------------- 21
Cation-exchange capacities of the sediments_.______-______-__-____---_ 26Sedimentary petrographic significance of the data ______________________ 29
Heavy minerals_---____________-_____-_________-_____-__-_---_ 29Clay mineralogy.______________________________________________ 30The micaceous minerals________________________________________ 32
Literature cited- __________________________________________________ 33
ILLUSTRATIONS
Page FIGURE 1. Graphical representation of the size analyses of the twelve
samples from Long Island, N.Y____-_-___________________ B42-5. Cumulative curves of the particle-size distribution in:
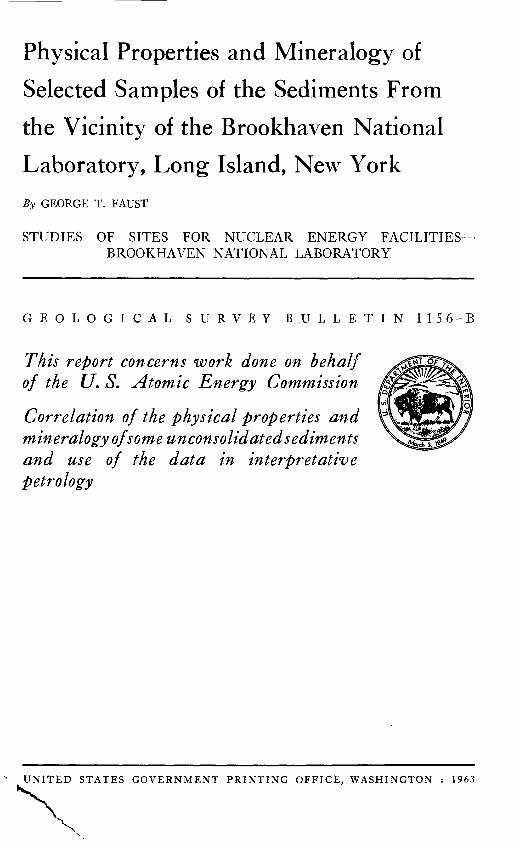
2. Five Pleistocene sediments.______-_-___'---_----_-_--- 53. Two samples from the Gardiners Clay_ ________________ 64. Two samples from the Magothy(?) Formation.______--_ 85. Two samples from the Lloyd Sand Member of Raritan
Formation. _______________________________________ 96. Differential thermal analyses curves of samples of Pleistocene
age __________________________________________________ 187. Differential thermal analyses curves of samples from the
vicinity of the Brookhaven National Laboratory.------- 208-10. Electron micrographs of selected fields observed under the
electron microscope__________________-________----_---- 22-2411. Cation-exchange capacity of various minerals found in sedimen
tary deposits.__ -___--___-___--_____--___--_----------- 28in

IV CONTENTS
TABLES
Page TABLE 1. Size analyses of 12 unconsolidated sediments.________________ B3
2. Minerals identified in the sediments_______________________ 103. Mineralogic data for selected minerals in sample 1 a sediment
from glacial outwash..__________________________________ 144. Mineralogy of the silt and clay fractions as determined by X-ray
powder diffraction studies.-_________-_-__-_--_--_---.__-_ 165. Mineralogy of some of the silt and clay size fractions as shown
by differential-thermal analysis.--.----------------------- 176. Observations on the thermal analysis curves of the silt and clay
fractions of some sediments from the vicinity of the Brook- haven National Laboratory-------.---------------------- 17
7. Electron microscope studies of the clay-size fractions____-___ 218. Relative radioactivity of some sands and concentrates from
beaches on Long Island ______-_______-____--__-_____--- 269. Cation-exchange capacity of the natural sample and the calcu
lated value for a 100-gram sample._______________________ 2710. Cation-exchange capacity of minerals and organic matter found
in sediments___________________________________________ 2911. Clay-mineral associations of the sediments from the vicinity
of the Brookhaven National Laboratory------------------ 31

STUDIES OF SITES FOR NUCLEAR ENERGY FACILITIES BROOKHAVEN NATIONAL LABORATORY
PHYSICAL PROPERTIES AND MINERALOGY OF SELECTED SAMPLES OF THE SEDIMENTS FROM THE VICINITY OF THE BROOKHAVEN NATIONAL LABORATORY, LONG ISLAND, NEW YORK
By GEORGE T. FAUST
ABSTRACT
Twelve samples of unconsolidated sediments were collected from portions of cores obtained from seven wells near Brookhaven National Laboratory, Long Island, New York These samples were analyzed by mechanical, mineralogical, and cation-exchange methods. The results of the mechanical analyses are inter preted by means of eamparison with the standard compilations in the literature and by using the methods of D. J. Doeglas. The mineralogic methods used in the identification and semiquantitative estimation of the phases include optical, X-ray diffraction, differential thermal analysis, electron microscopy, and radio active measurements. The cation-exchange capacities are explained in terms of the mineralogic compositions of the specimens.
The results of the various techniques used in this investigation were critically evaluated to determine the petrographic significance of the data on the heavy, micaceous, and clay minerals. These and other pertinent data from the litera ture are interpreted in terms of work done in the Atlantic Coastal plain by Lincoln and Clarissa Dryden, by J. J. Groot and H. D. Glass, and by J. P. Owens.
INTRODUCTION
In 1951 the U.S. Geological Survey examined 12 samples of uncon solidated sediments collected from seven wells near the Brookhaven National Laboratory, Long Island, N.Y., to assess their properties when in contact with ground water. These samples were examined using mineralogic, petrologic, and chemical methods. The investi gation was undertaken on behalf of the Division of Keactor Develop ment, U.S. Atomic Energy Commission. The author supervised the investigations, except for the part dealing with the radioactive measurements, and correlated the various analytical data. The de tailed studies are now available to scientists interested in the sedimen tary petrography of the Atlantic Coastal Plain.
Bl

B2 STUDIES OF SITES FOR NUCLEAR ENERGY FACILITIES
The study of the sediments described in this report was suggested by Wallace de Laguna, formerly with the U.S. Geological Survey, and now with Oak Ridge National Laboratory, who collected the samples and described their occurrence. His studies on the geology of an area in the vicinity of the Brookhaven National Laboratory f de Laguna, 1963) should be consulted for further details.
The mechanical analyses and optical mineralogic studies were made by Theodore Woodward and Joseph E. Houston; the X-ray-diffraction identifications were made by Marie L. Lindberg; the cation exchange capacities were determined by Margaret D. Foster; and the electron microscope photographs were prepared and interpreted by Edward J. Dwornik and Malcolm Ross, all of the U.S. Geological Survey. James P. Owens, U.S. Geological Survey, determined the monazite content of some beach sands collected by Wallace de Laguna near the area where the wells were drilled; and the radioactive constituents in the samples were studied by the Instrumentation and Health Physics Department of the Brookhaven National Laboratory.
DESCRIPTION AND LOCATION OF SAMPLES
The samples were all obtained from cores taken from test wells. The following descriptions of the samples were made by Wallace de Laguna, U.S. Geological Survey.
Typical samples of the upper, relatively clean, glacial outwash, upper Pleistocene, and probably from the Ronkonkoma Moraine. Sample 1, well S6457, from a depth of 83-86 ft. Sand, fine to coarse, tan,
containing some gravel, fine to medium. Sample 2, well S6460, from depth of 71-74 ft. Sand, fine to coarse, tan,
containing fine to coarse gravel scattered throughout. Sample 3, well S6458, from depth of 73-76 ft. Sand, fine to coarse, light
yellowish, tan, with some fine to coarse gravel.Typical sample of the finer glacial outwash, upper Pleistocene.
Sample 4, well S6458, from depth of 109-112 ft. Sand, light-brown, chieflyfine grained, micaceous. Some medium and coarse grains, few medium gravelpebbles.Typical sample of the unit in the lower part of the glacial outwash, unidentified
unit at the base of the upper Pleistocene. Sample 5, well S6456, from depth of 183-186 ft. Sand, fine to medium, clayey,
dark greenish-gray, micaceous.Samples from the Gardiners Clay. Sample 6 is typical of the silty clay zone
and sample 7 is typical of the sandy parts. Sample 6, well S6456, from depth of 202-205 ft. Clay, silty and fine sandy,
greenish, gray when wet, dries to gray. Sample 7, well S6460, from depth of 184-186 ft. Clay, greenish-gray, contains
much coarse, angular sand and "grits", also some coarse, well rounded gravel.Typical samples of the Magothy(?) Formation.
Sample 8, well S6459, from depth of 155-158 ft. Sand, medium to coarse,clayey (muddy), dark gray, few coarse, well rounded gravel pebbles.

SEDIMENTS, BROOKHAVEN NATIONAL LABORATORY, N.Y. B3
Sample 9, well S6409, from depth of 607-616 ft. Sand, fine, clayey, light gray,with very thin streaks of lignite.Typical sample of the clay member of the Raritan Formation.
Sample 10, well S6434, from depth of 1,141-1,151 ft. Clay, tough, gray, thindark gray, solid clay bands alternating with slightly thicker, light gray,silty clay bands.Typical samples of the relatively clean Lloyds Sand Member of the Raritan
Formation. Sample 11, well S6434, from depth of 1,467-1,476 ft. Sand, coarse, and fine
to medium gravel, slightly clayey, purplish-pink color. Sample 12, well S6409, from depth of 1,390-1,402 ft. Sand, coarse, white, clayey,
with fine to coarse gravel.
Weiss (1954) gives a map of the area where these wells are located and describes the stratigraphy of the parts of the wells that he studied; de Laguna (1963) describes the geology in detail and gives more information on the location of the cores reported here.
MECHANICAL ANALYSIS
The mechanical analyses were made on quartered samples obtained after a careful mixing of the original samples. The samples were wet sieved by hand through Tyler sieves; grain diameters are shown in table 1. The material passing the 250-mesh sieve (0.0625 mm) was separated into silt (0.0625-0.00391 mm) and clay (<0.00391 mm) by sedimentation in water. For samples 11 and 12, a dispersing agent was used to separate the silt from the clay fractions, and 50 cc of a mixture consisting of 37.70 g of sodium hexametaphosphate and 7.94 g of Na2CO3 dissolved in 1000 ml of water was used to disperse them. The clay fractions were then centrifuged to remove the sodium hexametaphosphate.
The samples were selected from cores of several test wells and are believed to be typical of the formations from which they were taken. Such small sampling, however, is not necessarily representative.
TABLE 1. Size analyses of 12 unconsolidated sediments[For description of the samples see Introduction. All samples from Long Island, N.Y. Mechanical anal
yses on the basis of the Wentworth scale by Theodore Woodward, U.S. Geol. Survey]
Sample
I----....2.3......4........5.........6 ......7..8... ______9 . ..10.......11..12..
Pebble (4-64 mm)
1.59
Granule (2-4 mm)
0.48 6.95 1.97 .94
1.40
8.26 9.94
Very coarse sand
(1-2 mm)
6.21 12.98 4.40 2.42 .07
10.92 5.56
.04
.02 20.45 35.85
Coarse sand
(0.5-1 mm)
33.53 23.80 20.23 5.91 .74 .64
15.79 18.38 1.62 .01
14.06 9.36
Medium sand
(0.25- 0.5mm)
50.28 53.28 59.18 53.84 51.65 13.10 11.37 47.08 71.98
.27 17.31 10.64
Fine sand
(0.125- 0.25mm)
7.03 2.70 7.10
30.11 31.72 7.44 4.24 9.04 6.49 1.44 7.43 5.02
Very fine sand (0.0625-
0.125 mm)
0.46 .23
2.98 4.50 4.52 4.62 1.46 2.75 3.81 4,08 3.83 2.65
Silt (0. 00391- 0.0625)
2.
4! 2.
8.76 36.88 13.99 9.50 9.06
51.41 26.96 16.56
Clay «0.00391)
01 06 14 28
2.54 37.32 42.23 6.29 7.00
42.77 .11
9.98
Total
100.00 100. 00 100. 00 100. 00 100. 00 100. 00 100.00 100. 00 100. 00 100. 00 100. 00 100. 00

B4 STUDIES OF SITES FOR NUCLEAR ENERGY FACILITIES
The results of the mechanical analyses are given in table 1 and are plotted oh a triangular sand-silt-clay diagram in figure 1 by using the nomenclature of Shepard (1954). In plotting, the small amounts of granules were added to the sand fraction. The Pleistocene sedi ments samples 1, 2, 3, 4, and 5 are all sands which contain some granules; samples 6 and 7 from the Gardiners Clay are a silt-clay sand and a clayey sand, respectively; samples 8 and 9 from the Magothy (?) Formation are sands; the clay member of the Raritan Formation (sample 10) is a clayey silt; and the two samples (Nos. 11 and 12) of the Lloyd Sand Member of the Raritan Formation are silty sands.
The size compositions of these sediments are also plotted as cumu lative curves in figures 2 to 5. The cumulative curves for the sands of Pleistocene age, chiefly medium sands, are shown in figure 2.
The Gardiners Clay of Pleistocene age is represented by samples 6 and 7 (fig. 3). Sample 6 is an almost uniform mixture of sand,
SAND (INCLUDING GRANULE)
FIGDRE 1. Graphical representation of the size analyses of the twelve samples from Long Island, N.Y. The small amounts of granule-size fraction are added to the sand fraction. The nomenclature is after Shepard (1954).

100 90 80 70 60
p,
50
40
30 20 10
100.
01
0.00
50.
002
0.00
11
0.5
0.2
0.10
0.
05
0.02
GR
AIN
D
IAM
ETER
, IN
M
ILLI
MET
ERS
FIG
URE
2. C
um
ula
tive
curv
es o
f th
e pa
rtic
le-s
ize
dist
ribu
tion
in
five
Ple
isto
cene
se
dim
ents
(s
ampl
es 1
-5)
from
Lon
g Is
land
, N
.Y.
W

B6 STUDIES OF SITES FOR NUCLEAR ENERGY FACILITIES

SEDIMENTS, BROOKHAVEN NATIONAL LABORATORY, N.Y. B7
silt, and clay particles, whereas sample 7 shows distinctly more of the sand and less of the silt particles.
The cumulative curves of the particle sizes of two medium sands from the Magothy (?) Formation of Late Cretaceous age are shown in figure 4.
Mechanical analyses of samples 11 and 12 of the Lloyd Sand Member of the Raritan Formation, and of sample 10, a clay of the same for mation, are shown as cumulative plots in figure 5. The Lloyd Sand contains a significant amount of the very coarse sand and a small amount of granule-sized particles. The clay member of the Raritan Formation, sample 10, shows an unusual curve similar in shape (being concave downward) to that of the glacial clay from Hasketon, Suffolk, England, included in the collection of mechanical analyses of sedi ments by Boswell (1918) and to two river terrace soils in the Middle River of Virginia described by Carroll (1959). Doeglas (1946) shows that such curves result from the selective removal of the coarser fractions of a more heterogeneous sediment. Examination of the extensive collections of data and curves of mechanical analyses of sediments of Udden (1914), Lugn (1927), Wentworth (1932), and- Doeglas (1946, 1950) sho\vs that similar curves are characteristic of material that has been separated from the coarser fractions of the parent sediment, carried in suspension, and later deposited by settling.
MINERAI.OGIC COMPOSITION
For such complex assemblages of minerals as make up these sedi ments, a variety of mineralogic techniques optical, X-ray diffraction, differential thermal analysis, and electron microscopy are needed to determine their identity and relative abundance. The sized fractions from the mechanical analyses provided an effective concentration of some of the minerals and made a more accurate analysis possible.
OPTICAL STUDIES
After determining the identity of the various minerals present in the samples, quantitative measurements were made. The usual count ing methods were used and the number of grains counted ranged from 400 to 1,240 in each size fraction, except for a few grains of coarser size. In the size fractions designated pebble, granule, very coarse sand, coarse sand, medium sand and fine sand, the grains were counted under a binocular microscope. Grains of the very fine sand, silt, and clay sizes were counted with a mechanical stage on a petrographic microscope. For samples 5 to 12, grain counts were not determined by optical methods for the silt and clay fractions. The results of these microscopic studies are given in table 2.
J. R. Houston measured the optical constants for nine minerals occurring in the sediment from a glacial out wash plain (sample 1) and his data are given in table 3. They illustrate the variable chemical character of some of the mineral species.
B8 STUDIES OF SITES FOR NUCLEAR ENERGY FACILITIES
I 1 I I I 1 I
3AllViniAinO

SEDIMENTS, BROOKHAVEN NATIONAL LABORATORY, N.Y. B9
II
M 1>*=i bo S *
sa oa «Ha o
o o <in si- J
3AiivnniAino

BIO STUDIES OF SITES FOR NUCLEAR ENERGY FACILITIES
TABLE 2. Minerals identified in the
[Determinations for samples 1-6 and 8 made by Joseph R. Houston and for samples 7 and 9-12 by Theodore
Size fraction
Light minerals
§
£
Alkali feldsp
raa
Rock fragme
C3ft
Altered felds Plagioclase
I3
Nonmagneti opaque »
"3
9.2
Total light n in size frac (percent)
Micaceous minerals
?a
Chlorite (ma s^een biotiMuscovite
Biotite
.»jr.-Hydromica (
Glauconite
Ag3t5K a1*
Total micace erals in size (percent
Sample
778990(-)9K-)75(-)80(-)74(-)
47R
1210
7
?373344
TT
TT
11?
100100100(-)100(-)
09 f ")
95(-)83(-)
T317
TTTT
TTT7 ?
00
TT1C4-1!
K+)16(+)
Sample
96QIC 1
92(-)92(-)79(-)75(-)75(-)
?4R8
1315
45?1?2
TT453
100(-)OS(-)nnt _ 'i
93(-)95(-)93(-)
1
T1
TTT
T1
TTT
TT
3
0T2
TK+)
T3
Sample
Silt and clay 1 ...........
94Q7C ")QQC '\98(-)93(-)89(-)83(-)
?1?,589
R1TTTTT
T TT?
100100(-)100 (-)100 (-)98(~)97(-)94(-)
TTTT
TTTT
T
T
TT
?
0TTTTT2(+)
Sample
9194(-)9190(-)s^f \71(-)R6(-)
33781012
93??
T
T
100100 (-)9R100(-)95(-)B9C "170 / ^
T
T3T
T1TTT(e)
T4TTT5
Sample
Medium sand _ .
cnf \
30(+)89(-)Qt) f \
77(-)
T4
fi
35143
5
OAf _ 1
44C4-196(-)93(-)QQf \
1
1
T1
622TTT
T27C-)
6(+)50(-)K+)
TK+)
Sample
Coarse sand_. _ ...Medium sand. _ . _ .. Fine sand __ .. ...
86(-)61(-) 1825
11 .... 38
fin7?
.... .... ....86(-)
100 (-)QQQfi
- 14 14_...-__-
2
Footnotes at end of table.

SEDIMENTS, BROOKHAVEN NATIONAL LABORATORY, N.Y. Bll
sediments, in percent by grain count
Woodward. Explanation of symbols: T, trace; or <0.5 percent; T?, uncertainty as to abundance]
Heavy minerals arranged in the order of the "full suite" of Dryden and Dryden (1956) 1
Zircon
:§Tourma
SStaurolil
Garnet o"2 'S w
io
.£3'cjJ^
Zoisite o Kyanite
<x> J^
a
33
#d
Hornble
33£>
3Amphio
39 tf
®+%
Andalus
8S
£1Hyperst
1
PM
3
ft
^^ tn
C3
fit
<D
1PM
3fto
3i 1
sid fl s® "(H "13
S M &
fill
o
be
frt ^
O<u '2b£ o
P
T1
T
T
TT11
T
TT
11
TT? T
T
T
1T
TT? T?
5T
TTT? T
TT
11
00
TT
4(4-)K+)
0.486.21
33.5350.287.03.46
2.01
T1
T
T?
T
111
T11
T
T
T?
T
TT
T?f:
?, 1
T?
1
TTf:
T
0TTK+)6(+)5(+)4(+)
6.9512.9823.8053.282.70.23.06
TTT
TT?
TTT
T11
T111
T 1T?
T?TT
T?T T
TT
1
000
T2(+)3(+)4(+)
1.974.40
20.2359.187.102.984.14
T
1
5
T11
6
T
TT
TT?T
TTT
TT
11
T1
T131
T
T
TK?) K?)
T
8
269
TT
T'T?T T
1T
T?11
T144
T61
T
T5 ("I")
18(+)17(+)
T6
7(+)1K+)
TT00
0.942.425.91
53.8430.114.502.28
0.07.74
51.6531.724.52
0.6413.107.444.62

B12 STUDIES OF SITES FOR NUCLEAR ENERGY FACILITIES
TABLE 2. Minerals identified in the sediments,
[Determinations for samples 1-6 and 8 made by Joseph R. Houston and for samples 7 and 9-12 by Theodore
Size fraction
Light minerals
3&
nIkali felds
<o«
S
Itered feld
<
agioclase
dH
S>
I^
.2onmagnet opaque 3
z
'a
fl o0«
otal light in size fra (percent)
EH
Micaceous minerals
§"3"""a?at*
ilorite (m green bio
O
[uscovite
2
o 'o
«
^^ydromica
M
lauconite
O
qSS'S
3io> S
otal micac erals in si (percent)
EH
Sample
93(-)98(-)49 { }
19
4
1TT
3T5
15
TT
1
1
100 (-)100 (-)49(-)46(+)48
TT
TT
TTT0
TT
Sample
100(-)cnf 1%(-)oaf ">93(-)96(-)
TT
?,
T
T?,64
TTTT
T
100(-)100(-)Q8( 1
100(-)99(-)
100 (-)
T
T
TTTT
T
00
TTTT
Very fine sand ...... . .
On/ \82(-)
9
113
T8
1 3
OO
5
TT
T
83(-)25(+)oof i .^
34(+)%(-L.*\
TT
6in
1773(-)74(-)
50(-)7Qf _S
T
Sample
17(+)73(-)75(-)
Sample
56(-)89(-)
Sample
Pebble..................Granule _. _ ....Very coarse sand. _ ....
Very fine sand.... ______
1009899(-)Q0f "ltoAf _ \
100 (-)96(-)
....
....
?,T T
....
....
1
....
....
....
....
--f
T
10010099(-) oof ^Q4f S
100(-)97(-)
....
T
1 T
T3
....
....
....
.... ......
001
T6
T3
Sample
Granule
Coarse sand _.Medium sand ..
100(-)100
97(-)QQf' \
_---
T
T
100(-)100100( )
Q7C "lQQf 1Q7C 1
T
T3T T
T0
T3
T2
1 Monazite has been omitted from the listing because none was observed. See pages 25 and 26.2 Rock fragments are mostly greenschists with chlorite.3 Opaques nonmagnetic chiefly organic matter, in part lignite.4 Yellowish-brown micaceous mineral cementing quartz.8 Exhibits schiller phenomenon.6 The quartz grains are dirty. Most of the quartz is in small grains cemented by hydromica(?).

SEDIMENTS, BROOKHAVEN NATIONAL LABORATORY, N.Y. B13
in percent tyy gram count ContinuedWoodward. Explanation of symbols: T. trace; or <0.5 percent; T?, uncertainty as to abundance]
Heavy minerals arranged in the order of the "full suite" of Dryden and Dryden (1956) '
.taN
Tourmalii Staurolite
1ft
.a go
Zoisite or Kyanite
CO
Sillimanit Hornblen
1
!Amphiboi
Rutile
toAndalusit
aHypersth Pyroxene
!g
&'EPH
opaque
Magnetic
a!S^ 3-SS
+» 3 a a .2 .2
s^ll
"S
|
1
8
T?
9
T?
10
11
T
12
1
TTT
T
T1
T?
TT
T
T
T?
T?
TT
TT
2
TT
TTT
T
1
T?
T
T?
T
T?
T?
T? T?T
1
T
T
T
T?
TT
T50KAf *\
CO/ "\
1
T
T?
TT?
T
T?
T
T
T
T
T
T?
T
?,3
in3
TT
T
TTT
T
T
T
TT51(+)54(-)52(-)
TT2(+)
TK+)
T
T2(+)8<+)
10WO3(+)
00
T£WTTT
00TTw1 +
10.9215.7911.374.241.46
1.405.56
18.3847.089.042.75
71.986.493.81
1.444.08
1.598.26
20.4614.0617.317.433.83
9.9435.859.36
10.645.022.65
' In the silt and clay fraction there is a trace of an unidentified mineral." Sample 4 contains 5 percent (by grain count) of red-brown platy micaceous minerals in silt and clay
fraction.»The value of 27(-) for glauconite refers to nodules of quartz, chlorite, and mica grains all cemented
together with grayish-green glauconite. There is a trace of cordierite In the fine-sand fraction of this sample.
686496 O 63 3

B14 STUDIES OF SITES FOR NUCLEAR ENERGY FACILITIES
O ®e w

SEDIMENTS, BROOKHAVEN NATIONAL LABORATORY, N.Y. B15
X-RAY DIFFRACTION STUDIES
X-ray powder-diffraction patterns were made by using nickel- filtered copper radiation. Unoriented samples in spindles, both un treated and treated with ethylene glycol, were examined. No expansion was detected.
The use of the terms major and minor constituents depends upon the relative intensity of the X-ray powder-diffraction patterns of the various minerals present. For example, a well-crystallized mineral, such as quartz, may yield a better powder-diffraction pattern than other constituents which are poorly crystallized and present in equal proportions. These terms are, therefore, only semiquantitative.
The results of the X-ray studies are summarized in table 4.
DIFFERENTIAL THERMAL ANALYSIS
The differential thermal analyses (DTA) were made in the Hendricks-Nelson-Alexander (1939) form of apparatus, which records the data as a continuous curve on photographic paper. The resist ance in series with the galvanometer for all the curves was 600 ohms. The samples were heated at the rate of 12° C per minute. Faust (1948, 1950) describes the techniques used in this study.
The association of lignite and pyrite, especially in some of the Cretaceous clays of New Jersey, has long been known (Kies and Kiimmel, 1904) and their presence in the clays studied here makes it desirable to comment on their behavior when heated in differential thermal analyses.
Pyrolysis of carbonaceous matter admixed with clays takes place over a span of temperatures from 300° to 600°C, with a maximum near 400°C. In the temperature range of about 450° to 500°C, pyrite decomposes with the appearance of either a single or a double peak. The double peak is an expression of the inequilibrium accompanying the decomposition.
The results of the DTA study of the samples from Long Island, N.Y., are given in tables 5 and 6. In comparing the data in table 5 with the optical data in table 2 and the X-ray data in table 4, correlations must be made with caution, because these three methods use greatly different amounts of sample and therefore have different sensitivities. The DTA is designed especially for phases that undergo a reaction, such as a change of phase, inversion, dissociation, recrystal- lization, and the like, when they are heated. For such phases the method is specific, may be unique, and is generally at least semi- quantitative. Thermally inert phases behave as diluents and they produce no recognizable effect in the temperature range of the experi ments and therefore are not recognized.

ta
TABL
E 4
. M
iner
alog
y of
the
sil
t an
d cl
ay s
ize
frac
tion
s as
det
erm
ined
~by
X-r
ay p
owde
r di
ffra
ctio
n st
udie
s
[Det
erm
inat
ions
by
Mar
ie L
. L
indb
erg,
U.S
. G
eol.
Surv
ey]
Sam
ple
1
2..
. _ . _
_
3._ .........
5
. .
6 ..
....
. .
7...... ..
8.... .
9...........
10..........
12..........
Size
fra
ctio
n
..
do
....... ..
.
..... d
o... .
..... .
...
..-.d
o .
... . .
.
Sil
t...............
Cla
y..... .
....
.. ..
Sil
t...
.-..
.. .
.C
lay
.... .
.. ..
. .S
ilt.
...
........
Cla
y. ..
........
SU
t.. ...
....
....
..
Cla
y..
............
Silt...
Cla
y..-_
... ..
SU
t... ....
....
....
Cla
y....... .
......
Sil
t...... .
....
....
Cla
y..--
...-
.S
ilt.
..
_
Cla
y..
.....
Kao
linite
?
pres
ent
at a
ll.
d
o ... .
. .... -
pres
ent a
t al
l. - d
o.
.... ..
... .
. ..d
o .
.. ..
..... .
pres
ent a
t aU
.
- do
Mus
covi
te
pres
ent
at a
ll.
-d
o .
d
o.»
_
_ d
o.
.
... .
.do ..
....
. ...
d
o ..
. -
-d
o.
....
.. .
... .
.do
... .
.. ..
..
_
do.»
..
. ..
. ..d
o.'.
d
o
... .
.. ..
. .d
o ..
...
... -
do.
d
o.. ..
. ...
...
d
o ..
. ....
... .
.do.
....
...
..d
o..
...
....
..
Chl
orite
pres
ent
at a
U.
d
o ........ ..
...... d
o.... ..
....
....
.
Mix
ed la
yer
min
eral
..
do.*
..
Qua
rtz
d
o
. d
o
.....
do .
..d
o ..
. d
o ..
. ...
-do ..
...
. -d
o .
.. .
do .
.do .
... -
do ..... .
... -
do... .
.... .do ..
. ...
.... .d
o... .
....
.....
..... d
o... .
....
. ....
.d
o ..
.
Pyr
ite
_
do .
... .
... .
.
... -
do
..
....
d
o .
... .
.. ..
.
Alk
ali
feld
spar
Do.
»
Do.
»D
o.*
Do.
Do.
Do.
1 The
mus
covi
te h
as a
bro
ad b
asal
refl
ectio
n su
gges
ting
som
e al
tera
tion
to h
ydro
mic
a.'
Min
or c
onst
itue
nt; p
ictu
re to
o w
eak
to m
easu
re th
e li
ne a
t 6.4
4 A
, whi
ch w
as u
sual
ly
used
to d
istin
guis
h fe
ldsp
ar fr
om a
mix
ture
con
tain
ing
quar
tz, m
usco
vite
, and
kao
linite
.3
Eit
her
kaol
inite
or
chlo
rite
mus
t be
pre
sent
to
acco
unt
for
the
line
at 7
.08
A;
eith
er
mus
covi
te o
r ka
olin
ite m
ust
be p
rese
nt t
o ac
coun
t fo
r th
e lin
e at
4.4
4 A
; the
7.0
8 A
lin
e is
too
wea
k to
exp
ect
to f
ind
the
4.73
-line
of c
hlor
ite.
* Thi
s m
ater
ial
is e
ither
mic
a or
hyd
rom
ica
with
a m
ixed
-lay
er
rela
tions
hip
sug
ge
stin
g m
ica-
verm
icul
ite.
The
mix
ed-l
ayer
rel
atio
nshi
p is
mor
e pr
onou
nced
in
the
clay
fra
ctio
n.
Eth
ylen
e gl
ycol
tre
atm
ent
of t
hese
siz
e fr
actio
ns d
id n
ot m
easu
rabl
y ch
ange
the
pos
ition
s of
the
bas
al r
efle
ctio
ns i
ndic
atin
g th
e ab
senc
e or
non
dete
ctab
le
pres
ence
of m
ontm
oril
loni
te.
A b
road
inn
er b
and
sugg
ests
the
pos
sibi
lity
of h
ydro
mic
a or
mon
tmor
illo
nite
.6 T
his
sam
ple
gave
the
best
X-r
ay p
owde
r pat
tern
for
kao
linite
in th
e_ g
roup
, and
the
id
entif
icat
ion
of k
aolin
ite,
whe
re t
he p
atte
rn w
as w
eake
r, w
as p
artl
y ju
stif
ied
by t
he
good
pat
tern
obt
aine
d he
re.

SEDIMENTS, BROOKHAVEN NATIONAL LABORATORY, N.Y. B17
TABLE 5. Mineralogy of some of the silt and clay size fractions as shown by differential thermal analysis
[Determinations by George T. Faust, U.S. Qeol. Survey]
Sample
8.. 4__ .5_.__ 6.... 7-- .8.-.. .9.. .10.. .11..
Record
C-664663657659662660656658661
Size fraction
Silt and clay. .
Cl&y_. ........
..do '
.....do. ..... ..do .- do
Kaolinite (percent)
64(0
132537674783
Lignite
..do ..... . do ..do do do
Glauconite
Present .do ..
Mixed- layer
mineralQuartz
do..
Pyrite
Do.Do.Do.Do.Do.
1 Not measured.
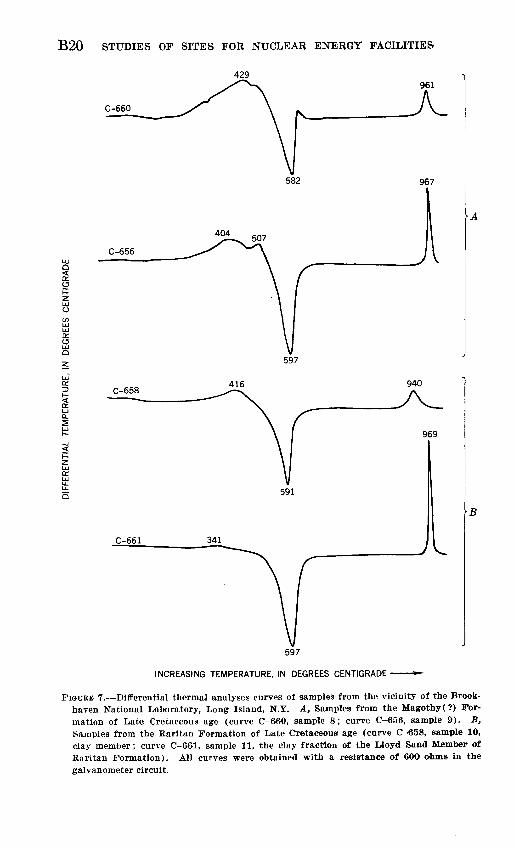
TABLE 6. Observations on the thermal analysis curves of the silt and, clay fractions of some sediments from the vicinity of the Brookhaven National Laboratory, Long Island, N.Y.
{These curves were all made with a resistance of 600 ohms in the galvanometer circuit. M=major peak ortrough]
Sample
3 4 5 .........
8 ..«... . 10 11.. ......
Record
C-664 663 657 659 662 660 656 658 661
Size fraction
Silt and clay-.
Clay .
-do do..... .... do do..... . ..do. .
Temperature (° O) ol endotherms and exotherms
Low tempera ture
Endo- therm
123 130135(M)
Exo- therm
289 (M)
Intermediate tempera ture
Exotherm
395 (M) 376
404 (M) 416 341
483(M) 425(M)
429 (M) 507
Endo- therm
573 594(M) 573 561 564(M) 582(M) 597(M) 591 (M) 597(M)
High tempera ture
Endo- therm
930 929748
Exo therm
959(M)
96l"(M) 967(M) 940 (M) 969(M)
Weight of sam ple used (grams)
0.4800 .3011 .3499 .2750 .3548 .2732 .2572 .3257 .2799
To facilitate their interpretation, these DTA curves are grouped together on the basis of their geologic age. Three clays from glacial outwash plains of Pleistocene age samples 3, 4, and 5 yielded DTA curves C-664, C-663, and C-657, respectively (fig. 6). The silt-clay fraction of sample 3 shows the DTA curve of quartz; the silt-clay fraction of sample 4 (curve C-663) shows an excellent kaolinite pat tern, but no sign of the quartz inversion appears as an inflexion on the endotherm of kaolinite. The clay fraction of sample 5 is more com plex and shows, in addition to the quartz inversion, exothermic peaks caused by the pyrolysis of organic matter and by the decomposition of pyrite and two endothermic troughs one at a low temperature and the other at a high temperature caused by glauconite.
Samples 6 and 7 from the Gardiners Clay yielded curves C-659 and C-662 (fig. 6). These rather complex patterns are made up of the

B18 STUDIES OF SITES FOR NUCLEAR ENERGY FACILITIES
C-664
573
959
C-663
594
395483
C-657
123573
930
289425
376
C-659
130 929
C-662
564
B
INCREASING TEMPERATURE, IN DEGREES CENTIGRADE »~
FIGURE 6. Differential thermal analyses curves of samples of Pleistocene age from the vicinity of the Brookhaven National Laboratory, Long Island, N.Y. A, Three clays from glacial outwash plains (curve C-664, samples 3 ; curve C-663, sample 4 ; curve C-657, sample 5). B, Samples from the Gardiners Clay (curve C-659, sample 6; curve C-662, sample 7). All curves were obtained with a resistance of 600 ohms in the galvanometer circuit.

SEDIMENTS, BROOKHAVEN NATIONAL LABORATORY, N.Y. B19
combined curves of kaolinite, pyrite, organic matter, and a small amount of constituents yielding a low- and a high-temperature endo- therm; for sample 6, the endothermic trough is due to the presence of glauconite and for sample 7, to the presence of a mixed-layer mineral.
Samples 8 and 9 from the Magothy(?) Formation yielded curves C-660 and C-656, respectively (fig. 7), which show excellent patterns typical of kaolinite and exothermic peaks due to the pyrolysis of organic matter and the decomposition of pyrite.
Sample 10 of the clay member of the Raritan Formation (curve C-658, fig. 7) shows a well-developed kaolinite pattern together with a small endotherm that is characteristic of organic matter. The clay fraction of the Lloyd Sand Member of the Karitan Formation (sample 1 1, curve 0-661) shows an excellent kaolinite pattern.
DTA studies on related clay samples from New Jersey have been made by Cuthbert (1951) and, although there is no direct stratigraphic correlation between these samples, some of the results of his study are of interest here. Cuthbert studied a sample from a clay lens in the Magothy Formation from Cheesequake State Park in eastern Mid dlesex County and found the clay mineral to be "largely kaolinite." He also observed a large effect on the DTA patterns arising from the pyrolysis of organic matter. This observation agrees with our find ings. Cuthbert studied twelve clays from the Raritan Formation. He found eleven of these clays to be typical kaolinites; some were pure but others contained a little organic matter and in some of the clays also pyrite. Only one clay showed in addition to the DTA pattern from the major constituent, kaolinite a high-temperature endothermic trough at about 900° C, which Cuthbert believed might be due to the presence of "illite" (hydromica). The samples studied in this investigation agree in their thermal behavior with his eleven typical samples.
ELECTRON MICROSCOPY
The electron microscope studies were made using an RCA model EM 2b instrument. The technique used in the studies is described by Dwornik and Ross (1955). Briefly, their procedure is as follows: The material is disaggregated in distilled water in a Waring blender for 2-3 minutes. A droplet of the cloudy suspension is then placed on a 200-mesh stainless-steel grid, previously covered with a thin collodion substrate film, and the water is allowed to evaporate. The sample is then examined. In addition, mounts of each sample are placed in a metal evaporation unit and shadowed with chromium at an angle of approximately 23°. This technique permits a rough determination of the thickness of particles and enhances contrast in the image.
galvanon
Raritan2.
s= vj B §
Samples
mation
oer
p £ p 3
DIF
FER
EN
TIA
L TE
MP
ER
ATU
RE
, IN
D
EG
RE
ES
C
EN
TIG
RA
DE
s- i?
>1 B p J2;
o c
^v ^1 rt c i-S » n
o rt- cr » »
& *i
to 9 O "I » rt-
tf
O
3
& £ P> ? 3
ct =
o
td
8 CD 5P

SEDIMENTS, BROOKHAVEN NATIONAL LABORATORY, N.Y. B21
The micrographs selected for illustration are typical of the fields observed in the microscope, but they may not be representative of the entire sample. Because of the preparation of the sample as a suspen sion in water, a settling out of heavier and larger mineral particles was difficult to avoid. Accordingly, the clay content may appear to be greater and the quartz content and the content of other minerals of higher specific gravity may appear to be less than the concentrations that are actually present. The results of these studies are summarized in table 7, and selected electron micrographs of the clay fractions are given in figures 8 to 10.
TABLE 7. Electron microscope studies of the clay-size fractions
[Letter symbols used in figs. 8-10. Determinations by Edward J. Dwornik and Malcom Ross, U.S. Geol.Survey]
Sample
5........
6___ -_-7 -
8........e____.___
10_ 11. ...
12.......
Kaolinite (K)
is present.
Present--- ____.. do.............
- do.... .... - do... ..... .... .
do........ .....Predominant ___
are present.
Opaque material,
irregularly shaped particles (X) (in cludes lignite)
Present. - -
_ do.i. ..
Present. .....do......
... do.......
Platy mineral (S) or mica(?)
A fragment of (S)is perched on (K).
Present.. ____ .do...... .
present.
Diatoms (D)
Present. ..
Quartz (Q)
Present...
Randomgrains.
Montmorillo- nite(M)+ hydromica
Large fluffyparticles.2
1 A "feathery" substance (F) which radiates from (X) suggests recrystallization of a water-soluble com pound.
2 The "fluffs" of (M) and a finely divided background suggest a mixed aggregate of montmorillonite and hydromica.
RADIOACTIVE MINERALS IN THE ENVIRONMENT
Monitoring equipment for recording the radioactivity of airborne dust was operated by the staff of the Instrumentation and Health Physics Department of the Brookhaven National Laboratory in the area from which the samples studied here were taken. They detected daughter products of thoron and, to a lesser extent, of radon. This detection was particularly noticed after periods of atmospheric tem perature inversion. These inversions tend to trap near the ground any gases released to the atmosphere by the soil. These scientists estimated that the amount of thorium in the soil at the Brookhaven National Laboratory was of the order of 1 part thorium in 2X10⁸ parts of soil. At such low concentrations of thorium it is therefore not surprising that Houston and Woodward did not report the presence of any thorium-bearing mineral in their study of these samples. (See table 2.)
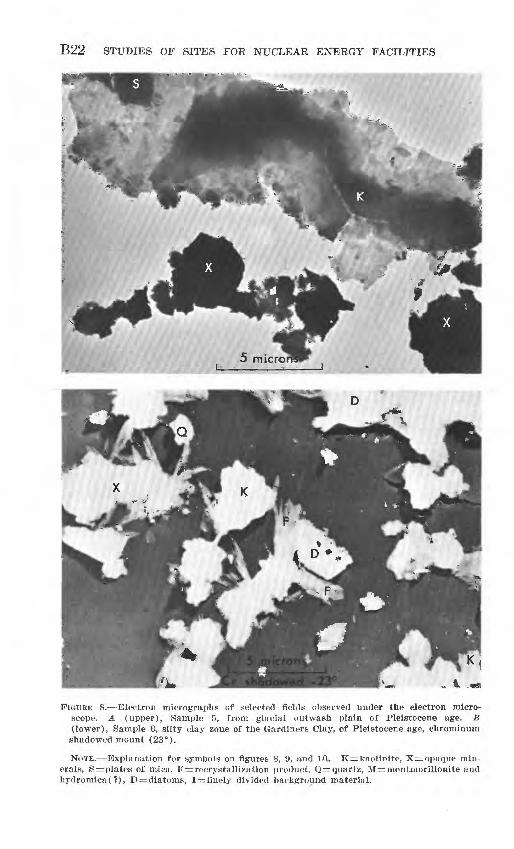
FIGURE 8. Electron micrographs of selected fields observed under the electron micro scope. A (upper), Sample 5, from glacial outwash plain of Pleistocene age. B (lower), Sample 6, silty clay zone of the Gartliners Clay, of Pleistocene age, chrominum shadowed mount (23°).
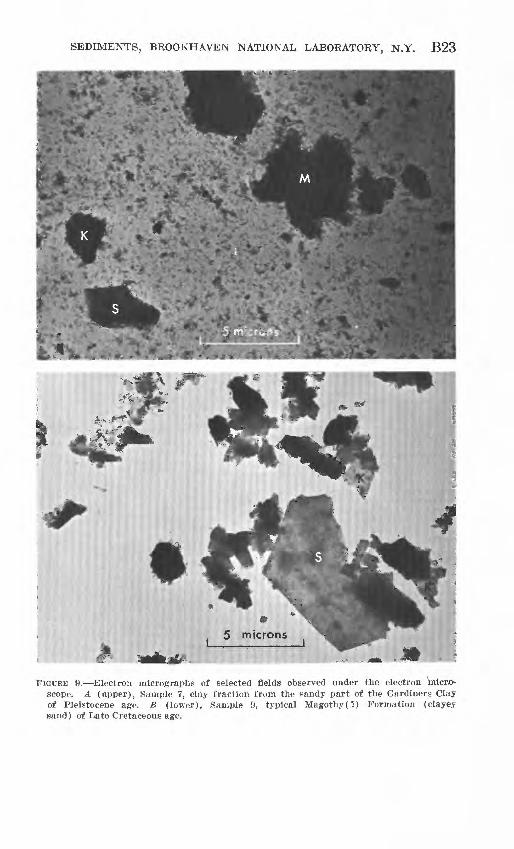
NOTE. Explanation for symbols on figures 8, 9, and 10,. K = kaolinite, X= opaque min erals, S = plates of mica, F = recrystalli?ation product. Q = quartz, M = montmorillonite and hydromica( ?), D = diatoms, I = finely divided background material.
SEDIMENTS, BROOKHAVEN NATIONAL LABORATORY, N.Y. B23
FIGURE 9. Electron micrographs of selected fields observed under the electron micro scope. A (upper), Sample 7, clay fraction from the sandy part of the Gardiners Clay of Pleistocene age. B (lower), Sample 9, typical Magothy(?) Formation (clayey sand) of Late Cretaceous age.

B24 STUDIES OF SITES FOR NUCLEAR ENERGY FACILITIES^
FIGURE 10. Electron micrographs of selected fields observed under the electron micro scope. A (upper), Sample 10, clay member of the Raritan Formation, of Late Cre taceous age. B (lower), Sample 11, clay fraction of typical Lloyd Sand Member of the Raritan Formation of Late Cretaceous age.

SEDIMENTS, BROOKHAVEN NATIONAL LABORATORY, N.Y. B25
To investigate the occurrence of small amounts of thorium-bearing minerals in the beach sands along the shores of Long Island Sound and the Atlantic Ocean, Wallace de Laguna searched for natural concentrates of heavy minerals in places where the abundance of heavy minerals was greatly exaggerated by wave action. Samples were collected from a locality just west of Baiting Hollow, about 9 miles northeast of the center of the Brookhaven National Labora tory. These samples were mixed to give a composite sample. This sample was analyzed by James P. Owens, U.S. Geological Survey, who found 77 percent of ilmenite, 8 percent of gamet, 5 percent of magnetite, 4 percent zircon, 3 percent of monazite, 2 percent of quartz, and 1 percent of a mixture of staurolite, rutile, and hornblende.
The equivalent uranium content of the composite "black sand" sample was determined to be 0.032 percent from the beta-gamma count, which represents the total radioactivity of the sample (under the experimental conditions) based on the assumption that all the radioactivity is caused by the 0.032 percent uranium in equilibrium. If this amount of radioactivity represents thorium, the thorium con tent would be about 0.12 percent.
A Geiger-Miiller survey meter gave a reading of 200 to 250 counts per minute (cpm) for the beach sands in place. The background count of this meter is 30 cpm. A brief survey of some of the more accessible beaches along Long Island Sound and the Atlantic Ocean showed that the dark streaks in the sand, representing natural con centrates of heavy minerals, commonly yielded counts of 50 to 100 cpm. No other natural concentrates as active as the sand at Baiting Hollow were found.
Small aliquots of several sand and mineral samples were counted by the staff of the Instrumentation and Health Physics Department of the Brookhaven National Laboratory to determine their relative radioactivities; no attempt at absolute measurement was made. These data are given in table 8. These data indicate that by far the greater part of the natural activity in the sand samples is in the monazite and that the zircon probably contains small amounts of uranium.
The fact that 3 percent of monazite occurs in a natural heavy- mineral concentrate of a beach sand along {Ms part of the Atlantic Coast in association with 77 percent ilmenite is a matter of interest. Dr. R. W. Stoenner of the Brookhaven National Laboratory found that the ilmenite fraction contains only 8.12 percent titanium, 13.54 percent TiO2 (average of four determinations ranging from 8.20 to 8.05 percent titanium, 13.68 to 13.43 percent TiO2 ) ; these concentra tions suggest possible intergrowths with other minerals. Owens, Minard, Wiesnet, and Markewicz (1960) showed through' X-ray analysis that Ilmenite from the Miocene and Post-Miocene forma,-

B26 STUDIES OF SITES FOR NUCLEAR ENERGY FACILITIES
tions near Trenton, N.J., is a mixture of ilmenite and ferric and tita nium oxides.
This natural concentrate from Baiting Hollow is not necessarily representative of the heavy minerals in the beach sand of Long Island. The heavy-mineral content of the sands that lie in the area between low and high tide along the Atlantic Coast beach of Long Island was determined by Taney (1961). He found that the heavy- mineral content for the area between East Hampton and West Hamp ton ranges from 8 down to 2 percent; no data were obtained between West Hampton and Fire Island, where the Brookhaven National Laboratory is located, but at Fire Island the heavy-mineral content of the sands is about 15 percent. At Montauk Point and Point Lookout, exceptionally large percentages were observed. Magnetite appears in the heavy-mineral fraction at Southampton and increases eastward to a maximum of about 25 percent of the entire sample at Montauk Point.
The monazite concentrate from the Baiting Hollow beach sand was chemically analyzed by Maryse Delevaux, Harry Levine, and Benjamin A. McCall, all of the U.S. Geological Survey, who reported as follows: 0.16 percent uranium, 2.0 percent equivalent uranium, and 8.48 percent thorium oxide (ThO2 ). The zircon concentrate from Baiting Hollow was analyzed by R. W. Stoenner and M. Slavin, both of the Brookhaven National Laboratory, who found that it contained 0.031 percent uranium but no thorium. This confirmed the tentative conclusion reached from the counting measurements that the greater part of the local activity is due to the monazite.
TABLE 8. Relative radioactivity of some sands and concentrates from beacheson Long Island, N.Y.
[Measurements by the staff of the Instrumentation and Health Physics Department, Brookhavpn NationalLaboratory]
Sample
Sand. _ ______ ___-_-_
Locality
Baiting Hollow, Suffolk County (Beach on Long Island Sound).
Wpsthampton beach, Suffolk County (Beach on the Atlantic Ocean) .
Relative radioactivity (curies per gram)
Alpha
1.2-2.2X10-"-.. .__
2.7X10⁻¹¹-------7.1X10-n>----------
Beta
1.5-2.9X10- W .
3.2-6Xin-".
2.6X10-U. 1.3X10-'.
CATION-EXCHANGE CAPACITIES OF THE SEDIMENTS
The cation-exchange capacity of 5-g samples of the original unsized sediments was determined by a standard method using ammonium