Physical Oceanography - Deep-C...
28
Deep-C’s Gulf of Mexico Multi-disciplinary Curriculum for High School Science: Physical Oceanography Module 89 What is Physical Oceanography? The study of waves, tides, and currents; the ocean-atmosphere relationship that influences weather and climate; and the transmission of light and sound in the oceans. Circulation in the Gulf Circulation in the Gulf of Mexico is dominated by the highly variable Loop Current, which is a warm ocean current that flows northward between Cuba and the Yucatan Peninsula, moves north into the Gulf, and then loops east and south before exiting through the Florida Straits where it joins the Gulf Stream. The Loop Current takes various tracks, sometimes moving fairly directly from the Yucatan Peninsula to the Florida Straits and sometimes forming a large loop that extends into the northern Gulf. Soon after the 2010 Deepwater Horizon oil spill, there was concern that the Loop Current would carry oil up the East Coast. Fortunately, the top part of the current pinched off, forming an eddy (vortex), and stayed on a persistent southerly track, which prevented the transport of oil into the Atlantic Ocean. Tracking the currents to discover where the Deepwater Horizon oil went Deep-C’s physical oceanographers were tasked with researching where the oil went. To do this, they focused on factors that control the movement of oil and other contaminants in the Gulf of Mexico. They looked at both surface currents and deep ocean currents, using a variety of instruments including moorings and subsurface floats deployed near the head and within the De Soto Canyon. They also conducted a two- month experiment using self-powered and wind-propelled SailBuoy. In conjunction with NOAA flight missions, ocean profilers were dropped into the Gulf waters. Also, a new float technology is being developed to measure currents near the seafloor with “bottom drifters,” profiling the water column regularly for temperature, salinity, oxygen, and other parameters. Deep-C Physical Transport Research Stokes Drift Stokes drift is the lateral motion of a particle via wave action. The inter-annual variability of the Stokes drift in the Gulf of Mexico was quantified using NOAA’s National Oceanographic Data Center (NODC) buoy data with wave measurements, such as the ones found at The National Data Buoy Center http://www.ndbc.noaa.gov/. Physical Oceanography In the Gulf of Mexico
Transcript of Physical Oceanography - Deep-C...

Deep-C’s Gulf of Mexico Multi-disciplinary Curriculum for High School Science: Physical Oceanography Module 89
What is Physical Oceanography? The study of waves, tides, and currents; the ocean-atmosphere relationship that influences weather and climate; and the transmission of light and sound in the oceans.
Circulation in the Gulf Circulation in the Gulf of Mexico is dominated by the highly variable Loop Current, which is a warm ocean current that flows northward between Cuba and the Yucatan Peninsula, moves north into the Gulf, and then loops east and south before exiting through the Florida Straits where it joins the Gulf Stream. The Loop Current takes various tracks, sometimes moving fairly directly from the Yucatan Peninsula to the Florida Straits and sometimes forming a large loop that extends into the northern Gulf. Soon after the 2010 Deepwater Horizon oil spill, there was concern that the Loop Current would carry oil up the East Coast. Fortunately, the top part of the current pinched off, forming an eddy (vortex), and stayed on a persistent southerly track, which prevented the transport of oil into the Atlantic Ocean.
Tracking the currents to discover where the Deepwater Horizon oil went Deep-C’s physical oceanographers were tasked with researching where the oil went. To do this, they focused on factors that control the movement of oil and other contaminants in the Gulf of Mexico. They looked at both surface currents and deep ocean currents, using a variety of instruments including moorings and subsurface floats deployed near the head and within the De Soto Canyon. They also conducted a two-month experiment using self-powered and wind-propelled SailBuoy. In conjunction with NOAA flight missions, ocean profilers were dropped into the Gulf waters. Also, a new float technology is being developed to measure currents near the seafloor with “bottom drifters,” profiling the
water column regularly for temperature, salinity, oxygen, and other parameters.
Deep-C Physical Transport Research Stokes Drift Stokes drift is the lateral motion of a particle via wave action. The inter-annual variability of the Stokes drift in the Gulf of Mexico was quantified using NOAA’s National Oceanographic Data Center (NODC) buoy data with wave measurements, such as the ones found at The National Data Buoy Center http://www.ndbc.noaa.gov/.
Physical Oceanography In the Gulf of Mexico

90 Deep-C’s Gulf of Mexico Multi-disciplinary Curriculum for High School Science: Physical Oceanography Module
Moorings: Anchored buoys with observational sensors Moorings are anchored buoys with a number of observational sensors collecting data at different ocean depths. In 2012, six moorings were deployed by a Deep-C research team near the head and within the De Soto Canyon, and then retrieved in 2013. The data collected by these moorings can be used to draw conclusions about the physical transport of materials (such as oil and sediments) from the deep ocean to the coast. Subsurface floats: Drift with the currents and gyres to track the motion of the water RAFOS is SOFAR (SOund Fixing and Ranging) spelled backwards, which refers to the way these floats track the motion of the water. A drifting RAFOS float listens and records sound signals from stationary acoustic beacons. At the end of their pre-programmed mission, the floats drop their ballast weights, rise to the surface, and beam their data to orbiting satellites. Deep-C scientists analyzed data from the floats’ one-year mission and found that they moved laterally along the slope, reversing direction from time-to-time, suggesting a mixing effect. Eventually many escaped the slope region and entered the interior in a couple of key locations. The most prominent of these locations is the along the Sigsbee Escarpment, which guided the drifters southward into the interior of the Gulf of Mexico. Deep-C bottom drifter for shelf and canyon research Scientists at FSU’s Geophysical Fluid Dynamics Institute designed a new multi-sensor, subsurface coastal drifter that provides effective ways to acquire oceanographic data at depths that remote sensing cannot penetrate. It is equipped with a Seabird sensor which can record conductivity, temperature, and pressure at a given sampling rate. The drifter is also outfitted with a Doppler Velocity Log that provides high quality positioning data with bottom tracking, acoustic doppler current profiling, float positioning, and earth/ship referenced velocity information. The prototype of a new coastal drifter is currently being tested by FSU in a pool environment. An unmanned, wind-propelled SailBuoy
In March of 2013, the self-powered, wind-propelled Christian Michelsen Research (CMR) SailBuoy was deployed by Deep-C scientists in the northeastern Gulf of Mexico. During its two-month mission, it sailed approximately 840nm on a cruise track across the Gulf coast, from the Florida Panhandle to West Louisiana. Sensors were mounted on the SailBuoy that allowed scientists to monitor seawater parameters, such as temperature, salinity and dissolved oxygen. Equipped with two-way satellite communication for real-time data streaming and GPS updates, it transmitted data to the Operations Center (located at the Norwegian Meteorological Institute) at regular intervals along a planned course.
A team prepares to deploy a series of anchored moorings. The connecting lines secure the instruments that record data such as temperature, pressure, and velocity.
The green dot is the location of the Deepwater Horizon oil rig. The white lines represent subsurface (RAFOS) tracks near 400m depth as observed using floats deployed in the De Soto Canyon (red dots).

Deep-C’s Gulf of Mexico Multi-disciplinary Curriculum for High School Science: Physical Oceanography Module 91
Flight missions with ocean profilers During Hurricane Isaac (2012), scientists at the University of Miami Rosentiel School of Marine and Atmospheric Science were aboard a NOAA aircraft that flew into the storm to drop Aircraft Expendable Current Probes (AXCPs) at optimum locations around the De Soto Canyon. These
AXCPs collect measurements of ocean heat content, salinity, and currents during the hurricane. The data, when coupled with numerical models, demonstrated that it is plausible for upwelling events associated with hurricanes to lead to the re-suspension of weathered oil in the water column and onto the shelf. Several follow-up flight missions over the Gulf of Mexico were also conducted to test new and improved AXCPs.
Deep-C’s Physical Oceanography Team
Allan Clarke Florida State University
Kevin Speer Florida State University
Lynn “Nick” Shay University of Miami-RSMAS
Nico Wienders
Florida State University
Peter Hamilton
Leidos (prev. SAIC)
Bob Weisberg
University of South Florida
What Did We Learn? • The magnitude of the Macondo well leak became increasingly apparent as the surface area covered with
oil expanded. • The spread of the oil towards the Loop Current raised concern that it may become entrained and affect
more coastal areas. • Environmental conditions that affected where the oil went: regional open sea dynamics, the Loop Current
and associated eddies, shelf processes, Mississippi-induced buoyancy-driven and wind-driven flows. • Current velocity, temperature, and salinity fields are critical to the fluid particle evolution. • The velocity of an oil droplet depends on density and size. • Oil particles at the surface and at depth are subject to biodegradation. • The wind and waves strongly influenced the displacement of oil.

92 Deep-C’s Gulf of Mexico Multi-disciplinary Curriculum for High School Science: Physical Oceanography Module
LESSON PLAN: Oceanography Demonstrations Exploring Density, Temperature, Salinity, Pressure & Currents Objective: To demonstrate density in a variety of ways, understanding how layers of water with different properties interact. Use as a physical oceanography lesson primer.
Standards: OLP 1; SC.8.P.8.4, SC.912.E.7.2 Time Required: 30 minutes for each demonstration
Keywords: density, mass, volume, temperature, salinity, pressure, currents, wind, waves
Materials: Refer to individual demonstrations for specific lesson materials
Background Density is a physical property of matter, as each element and compound has a unique density associated with it. Density is defined as the measure of the relative “heaviness” of objects with a constant volume or how closely “packed” or “crowded” the material appears to be. For example: a Styrofoam cup is less dense than a ceramic coffee mug.
Density = mass volume
This equation defines density as the mass of water per unit volume. The units are grams per cubic centimeter (g/cm3) or kilograms per cubic meter (kg/m3). The density of freshwater at 4°C is 1.0000 g/cm3 or 1000 kg/m3. In the oceans, the density ranges from 1.020 to 1.070 g/cm3.
Three seawater properties control density: Temperature: As water cools, its density increases. The water molecules pack more closely together and take up less volume, resulting in a higher density. Globally, there is an average of approximately 20°C temperature decrease from the surface to the bottom of the ocean. Deeper water is more dense than surface water. The majority of the ocean is warm at the surface and colder at increasing depths. The region where temperature decrease is greatest with depth is called the thermocline.
Salinity: The salt in seawater makes it denser than freshwater. Typically, seawater contains between 33 to 37 grams of salt per liter of seawater (g/L) or parts per thousand (ppt). In general, the salinity decreases from the surface ocean to the deep water is very small, from about 36 ppt at the surface to 35 ppt in the deep water.
Pressure: As pressure increase, density increases. The water molecules pack tighter together as pressure increases. The pressure increases with depth in the ocean due to the weight of the water above. This is where the greatest density changes are seen in seawater with depth.
Decreasing temperature, increasing salinity, and increasing pressure causes the water to become more dense. Understanding density is important in understanding how layers of water with different properties interact, such as when freshwater flows from the Mississippi River and meets the salty water of the Gulf of Mexico. Density also plays a role in how organisms move in the water column, how different chemicals (such as the crude oil) behave, and how sediment is transported.
Slight density differences can be seen in the Gulf of Mexico. The Gulf’s surface water has a density of approximately 1022 kg/m3, whereas the water 4000m below at the bottom has a density of approximately 1028 kg/m3—an increase of less than 0.5%. Even though the density difference may seem small, it is important to the mixing, circulation, biological productivity.

Deep-C’s Gulf of Mexico Multi-disciplinary Curriculum for High School Science: Physical Oceanography Module 93
Demonstration #1: Calculating the Densities of Freshwater and Saltwater Students will measure salinity, temperature, mass, and volume of the water in order to calculate the density.
Materials for Demonstration #1: • 2.5 mL glass vials • Laminated index cards • Triple beam or electronic
scale • Graduated cylinder
• Food coloring • Seawater or salt mixed with
tap water • Refractometer • Thermometer
• 1-gallon milk jugs (2) • Beakers • Pipettes • Calculator
Procedure 1. Prepare the gallon jugs of saltwater and freshwater. If seawater is unavailable, then mix salt into
tap water. 2. Add yellow food coloring to the saltwater and blue food coloring to the freshwater.
Taking Measurements 3. Pour 200 mL into the beaker. 4. Measure salinity with a refractometer, temperature with a thermometer, and mass with the scale. 5. Calculate the density of the two water samples. Record all observations.
Density Observations 5. Pipette saltwater and freshwater into two 2.5 mL glass vials, filling
each vial completely. 6. Place a laminated index card on top of the saltwater vial, then
invert the freshwater sample and place upon the same card in the same position as the saltwater vial. Slowly remove the card and record observations.
7. Grasp both vials and turn them upside down, so that the freshwater vial is on the bottom; record the observations.
Questions 1. Is saltwater or freshwater more dense? Explain why. 2. Which is denser, cold or warm water? Explain why. 3. Draw a diagram of how water might layer when a river enters the ocean. 4. How might oil from the earth’s crust move into the ocean? Explain. 5. If a large amount of oil is spilled into the ocean, will the oil float or sink?
Parameters Yellow Solution (Saltwater) Blue Solution (Freshwater)
Temperature (°C)
Salinity (psu)
Volume (mL)
Mass (g)

94 Deep-C’s Gulf of Mexico Multi-disciplinary Curriculum for High School Science: Physical Oceanography Module
Demonstrations #2 and #3: Surface Current and Deep Current Adapted from COSEE - “Loop Current in the Gulf of Mexico” Source: http://ocean.si.edu/for-educators/lessons/loop-current-gulf-mexico
Students will create demonstrations of a surface current and a deep ocean current. Materials for Demonstrations #2 and #3:
• Aluminum foil • Plastic shoebox • Food coloring • Masking tape
• Sharpened pencil • Pepper • Aluminum pie plates • Salt
• Water (warm and cold) • 600 ml beakers • Soda straws
Demonstration #2: Surface Current 1. Fill a pie plate with cold water to the inner rim. 2. Sprinkle pepper on the surface of water. What
happens to the pepper? What kind of current is being shown here?
3. Using the straw, gently blow across the top of the water from one edge.
4. Discuss what happened to the pepper. What caused the movement of the pepper?
Demonstration #3: Deep Ocean Current 1. Create a wall separating the two ends of the plastic
shoebox using aluminum foil and masking tape. Use tape along all three edges of the aluminum foil wall to prevent any leakage.
2. Once the walls have been created, add 6 drops of red food coloring and warm water to one beaker. Stir. Add and stir in 6 drops of blue food coloring, 10 grams of salt, and cold water to the other beaker.
3. Carefully, pour the beaker of each color water on opposite sides of the plastic shoebox (pour equal amounts at the same rate or the aluminum foil wall will fall).
4. Use the sharp pencil to make a hole in the aluminum foil wall 5 mm above the bottom of the shoebox. 5. Then make a second hole in the aluminum foil wall 5 mm below the water surface. 6. Observe from the side of the plastic shoebox. Discuss student observations.
Questions 1. What type of ocean currents do these demonstrations simulate? 2. What happens when cold water enters warm water? 3. What happens when salt water meets fresh water? 4. Discuss deep ocean currents and their cause. Density-driven currents caused by changes in temperature
and salinity.
1
Source: http://oceanexplorer.noaa.gov/
Source: http://worldoceanreview.com/en/wor-1/climate-system/great-ocean-currents/
2

Deep-C’s Gulf of Mexico Multi-disciplinary Curriculum for High School Science: Physical Oceanography Module 95
Demonstration #4: Wind Waves Adapted from SECOORA, Source: http://secoora.org/classroom/virtual_wave/wind_waves
Students will investigate the factors affecting wind waves. Materials for Demonstration #4: • Hair dryer • A small glass or plastic rectangular container
(such as an aquarium) • Ring stand (to hold and position hair dryer) • Erasable markers
• Ruler • Water • Tape • Clock or watch
Background See the SECOORA Waves Fact Sheet http://secoora.org/classroom/virtual_wave/waves_fact_sheet
Procedure 1. Fill the container until it is approximately three-
fourths full with water. 2. Tape a ruler on the outside of the container such that
the zero mark is at the level of the water's surface. 3. Place the ring stand opposite the side of the
container with the ruler. Set up the hair dryer on the stand such that it is a few inches above the water.
4. Comparing waves. Mark the position of the still water's surface using erasable marker along the side of the container and label it accordingly.
5. For each of the different speed settings of the hair dryer:
• Start the hair dryer. Record observations about the initial set of waves. • After 3 minutes, mark and label the maximum height of the waves using erasable marker on the side
of the container. Calculate the difference between this maximum height and the still water's height. Describe the shape of these waves.
• Repeat Step 2 after two more minutes (after dryer has run for a total of five minutes). • Describe what happens to the waves as the hit the sides of the container.
Questions 1. What is the relationship between the height of a wave (distance from crest to trough) and the position of the
crest above the still water level? 2. How is the wave height affected by the length of time the wind blows? 3. Describe how the force or strength of the wind affects the height of the waves.
4. What happens to the waves when they hit the end and sides of the container? 5. Does the strength of the wave have any effect on this movement of the waves?

96 Deep-C’s Gulf of Mexico Multi-disciplinary Curriculum for High School Science: Physical Oceanography Module
Source:http://secoora.org/classroom/flowing_ocean/skidaway_river
Demonstration #5: Wave Size and Depth Adapted from Margaret Olsen, SouthEast COSEE Education Specialist. Source: http://secoora.org/webfm_send/313
Students will investigate how deep the energy of a wave goes and investigate the relationship between the size of a wave and depth of wave energy. Materials (per group) for Demonstration #5:
• Aquarium • String • Five corks (of equal size and weight) • Water • Permanent and erasable markers
• Two rulers (one must fit inside the aquarium) • Modeling clay (to secure the ruler to the
bottom of the aquarium) • Straight pins
Background Most waves are generated by wind. Such a wave's size depends on how long the wind blows, the strength of the wind, and the fetch (the distance over which the wind blows). The water in a wave moves in a circular orbital pattern downward to a depth of one-half the wavelength.
Procedure 1. Label each cork using the permanent marker. 2. Cut five lengths of string (at least seven inches in length). 3. Tie one end of each string to one of the rulers. Secure this ruler to the
bottom of the aquarium using the modeling clay. 4. Attach corks to the strings with straight pins. The first should one inch
from the bottom, the second two inches from the bottom, and so on. 5. Add water to aquarium until it is about one inch above the cork with the
longest string. 6. Record the depth of each cork as measured from the surface. 7. Make small waves by moving your hand or a block of wood back and
forth in the water. Record your observations of the motion of each cork. 8. Increase the size of the waves by moving your hand or block of wood
faster. Observe and record how the increased wave size affects the motion of each cork.
9. Let the water settle. With an erasable marker, mark the water level on the outside of the aquarium. This line represents “sea level.”
10. Hold a ruler vertically beside the aquarium and make small waves with your hand again. Measure the heights of the crests and troughs of these small waves and determine the wave height.
Cork 1 Cork 2 Cork 3 Cork 4 Cork 5
Depth (inches) Effect of smaller waves
Effect of larger waves
Questions 1. When waves were small, which corks moved? 2. When waves were larger, which corks moved? 3. How deep did the effect of the small waves go? The larger waves? 4. Is there a relationship between wave height and the depth to which the effects of the waves' energy can be
observed? Explain.
Deep-C’s Gulf of Mexico Multi-disciplinary Curriculum for High School Science: Physical Oceanography Module 97
LESSON PLAN: Gravity Currents in the Gulf of Mexico How the mighty Mississippi River influences density and ocean circulation Objective: To demonstrate how the relationship between the density of a fluid, weight of an object, and buoyancy is critical in understanding the ocean.
Standards: OLP 1; SC.912.L.17.3, SC.8.P.8.4
Time Required: One or two 50-minute class periods
Keywords: buoyancy, density, mass, salinity, practical salinity unit (PSU), volume
Materials: For Gravity Currents • Stack of books/block • 3 500ml beakers • Stir stick • Turkey baster • Cold, hot, and room temperature water • Red and blue food coloring • Tank
For Potato Float Demonstration • Beaker labeled “A” that contains saturated
salt water • Beaker labeled “B” that contains fresh water • Cubed potato • Beaker labeled “C” that contains saturated
salt water on the bottom and layered fresh water on top. To minimize mixing, pour the water down the side of the glass or use a spoon to direct the stream against the side of the glass
Background Gravity currents are everywhere, from the kitchen, to the air, and to the ocean. Currents can be either finite in volume, such as the release from a dam break, or continuously supplied from a source, such as in doorway or lava flows. They are fluid flows driven by density differences between fluids, hence gravity currents also sometimes are referred to as "density currents". These currents are characterized by a sharp front often followed by a bulbous head and longer thinner tail. Dust storms, oil spills, and river outflows are all gravity currents. For example, when the Mississippi River enters the Gulf of Mexico, the lighter, fresher river water spreads out over the denser, saline Gulf water as a gravity current. As the current spreads, the river water mixes with the ambient Gulf water, changing the properties of the river water including its density and salinity. In this lesson, we will be investigating how density influences the currents and the effect that the Mississippi River has on the circulation of the Gulf of Mexico.
These photos illustrate different types of gravity currents. (l-r) the ocean floor, a simulation in the lab, avalanches, and a dust storm.
98 Deep-C’s Gulf of Mexico Multi-disciplinary Curriculum for High School Science: Physical Oceanography Module
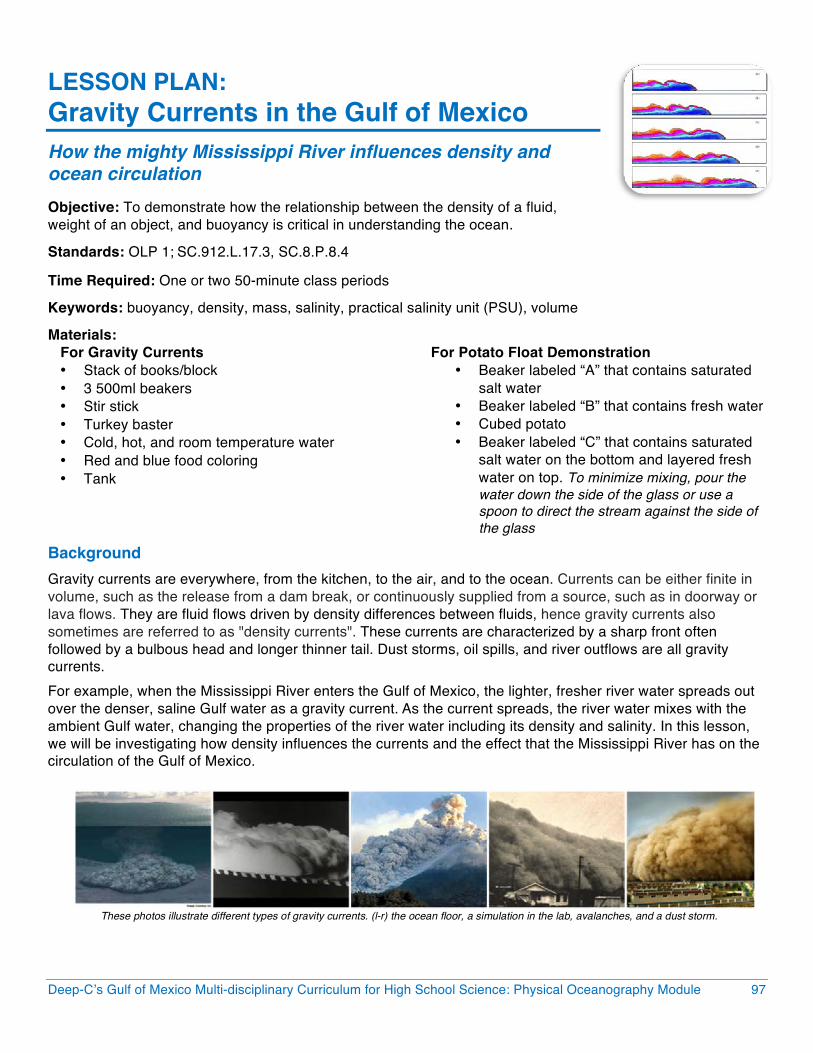
Activity #1 - Potato Float Demonstration To show students the relationship between density of different fluids, the weight of an object, and buoyancy.
Procedure 1. Carefully place a cube of potato in Beaker A and discuss
the results. What type of liquid is in the beaker?
2. Carefully place a cube of potato in Beaker B and discuss the results. Why is there a difference in the location of the potato in the water?
3. Carefully place a cube of potato in Beaker C and discuss the results. Why did the potato only sink half way?
4. Ask students to hypothesize about what made the density (or mass) of each solution different.
5. Based on their experiences with placing potatoes in water before boiling, can they guess which of the two liquids is water?
Assessment Ask students to write a brief paragraph describing their observations and results during the experiment.
Activity #2 - Sea Water Mixing and Sinking To see how temperature affects salinity.
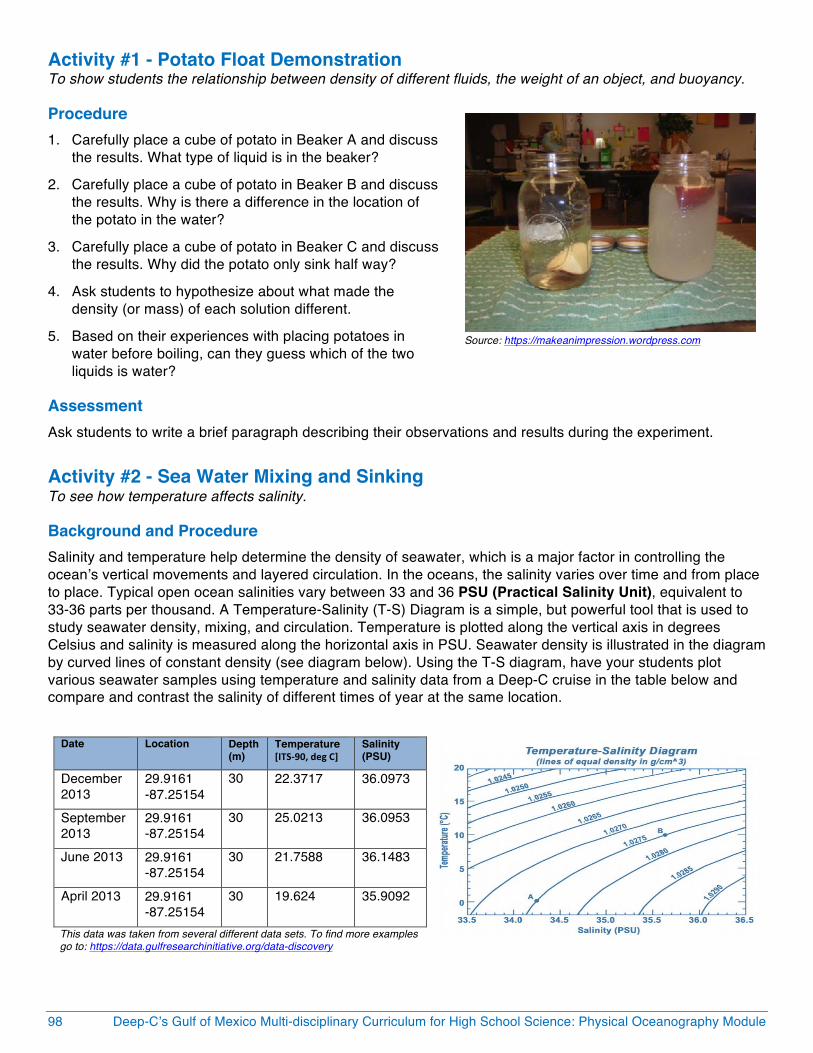
Background and Procedure Salinity and temperature help determine the density of seawater, which is a major factor in controlling the ocean’s vertical movements and layered circulation. In the oceans, the salinity varies over time and from place to place. Typical open ocean salinities vary between 33 and 36 PSU (Practical Salinity Unit), equivalent to 33-36 parts per thousand. A Temperature-Salinity (T-S) Diagram is a simple, but powerful tool that is used to study seawater density, mixing, and circulation. Temperature is plotted along the vertical axis in degrees Celsius and salinity is measured along the horizontal axis in PSU. Seawater density is illustrated in the diagram by curved lines of constant density (see diagram below). Using the T-S diagram, have your students plot various seawater samples using temperature and salinity data from a Deep-C cruise in the table below and compare and contrast the salinity of different times of year at the same location.
Date Location Depth (m)
Temperature [ITS-‐90, deg C]
Salinity (PSU)
December 2013
29.9161 -87.25154
30 22.3717
36.0973
September 2013
29.9161 -87.25154
30 25.0213 36.0953
June 2013 29.9161 -87.25154
30 21.7588 36.1483
April 2013 29.9161 -87.25154
30 19.624 35.9092
This data was taken from several different data sets. To find more examples go to: https://data.gulfresearchinitiative.org/data-discovery
Source: https://makeanimpression.wordpress.com
Deep-C’s Gulf of Mexico Multi-disciplinary Curriculum for High School Science: Physical Oceanography Module 99
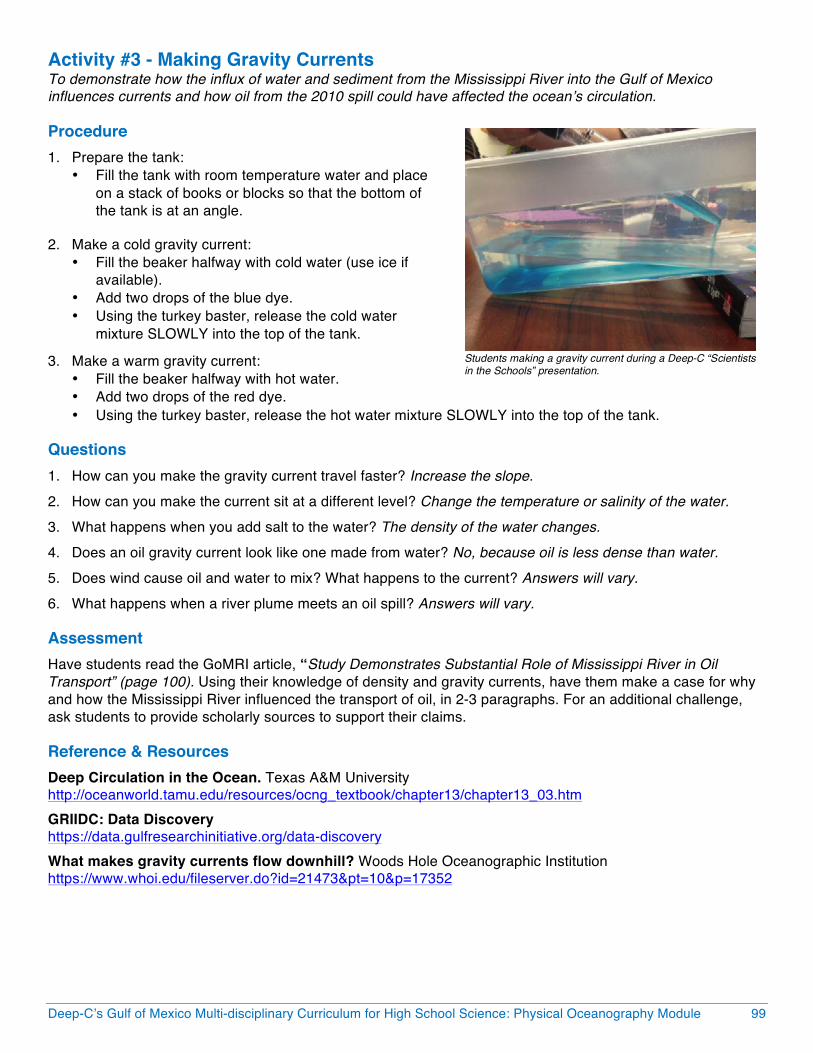
Activity #3 - Making Gravity Currents To demonstrate how the influx of water and sediment from the Mississippi River into the Gulf of Mexico influences currents and how oil from the 2010 spill could have affected the ocean’s circulation.
Procedure 1. Prepare the tank:
• Fill the tank with room temperature water and place on a stack of books or blocks so that the bottom of the tank is at an angle.
2. Make a cold gravity current: • Fill the beaker halfway with cold water (use ice if
available). • Add two drops of the blue dye. • Using the turkey baster, release the cold water
mixture SLOWLY into the top of the tank.
3. Make a warm gravity current: • Fill the beaker halfway with hot water. • Add two drops of the red dye. • Using the turkey baster, release the hot water mixture SLOWLY into the top of the tank.
Questions 1. How can you make the gravity current travel faster? Increase the slope. 2. How can you make the current sit at a different level? Change the temperature or salinity of the water. 3. What happens when you add salt to the water? The density of the water changes. 4. Does an oil gravity current look like one made from water? No, because oil is less dense than water. 5. Does wind cause oil and water to mix? What happens to the current? Answers will vary. 6. What happens when a river plume meets an oil spill? Answers will vary.
Assessment Have students read the GoMRI article, “Study Demonstrates Substantial Role of Mississippi River in Oil Transport” (page 100). Using their knowledge of density and gravity currents, have them make a case for why and how the Mississippi River influenced the transport of oil, in 2-3 paragraphs. For an additional challenge, ask students to provide scholarly sources to support their claims.
Reference & Resources Deep Circulation in the Ocean. Texas A&M University http://oceanworld.tamu.edu/resources/ocng_textbook/chapter13/chapter13_03.htm GRIIDC: Data Discovery https://data.gulfresearchinitiative.org/data-discovery What makes gravity currents flow downhill? Woods Hole Oceanographic Institution https://www.whoi.edu/fileserver.do?id=21473&pt=10&p=17352
Students making a gravity current during a Deep-C “Scientists in the Schools” presentation.

100 Deep-C’s Gulf of Mexico Multi-disciplinary Curriculum for High School Science: Physical Oceanography Module
Study Demonstrates Substantial Role of Mississippi River in Oil Transport Posted online November 11, 2013 Source: GoMRI http://gulfresearchinitiative.org/study-demonstrates-substantial-role-mississippi-river-oil-transport/
Scientists from the University of Miami used a high-resolution prediction model to study the relationship between the Mississippi River and the Deepwater Horizon oil spill. Simulations showed that the Mississippi River plume created rapidly changing circulation patterns and fronts that influenced the direction of surface oil, guiding some towards the Louisiana-Texas shelf and shielding some from the Mississippi-Alabama-Florida shelf. The researchers published their findings in the October 2013 Journal of Geophysical Research: Oceans: Influence of Mississippi River induced circulation on the Deepwater Horizon oil spill transport. The study marks the first time scientists tracked a large river plume in relation to the surface spreading of a deep water oil spill and provides new information on contaminant behavior in the Gulf. The location of the incident site led disaster responders to consider the possibility that flooding the Mississippi River might help initially divert the oil from coastal marshes. However, no operational computer models with detailed river plume dynamics existed to predict the environment’s reaction to flooding. To understand the influence of Mississippi River waters and quantify connecting patterns of river and oiled waters, researchers developed a high-resolution northern Gulf of Mexico model with daily freshwater inputs from all major rivers and detailed representation of the river plume development under the influence of winds, the complicated northern Gulf topography, and also the Loop Current system. Dr. Kourafalou, lead author of this study, explained, “Since the Gulf of Mexico is a complex ocean system and the oil spill was near the Mississippi Delta, we had to carefully account for both the offshore and coastal currents, which are largely dominated by the Mississippi River plume.” For this study, they added observational data on marine and atmospheric conditions from that region and daily satellite images of the surface slick.
The model showed that periods of increased Mississippi output during May and June of 2010 resulted in “enhanced buoyancy-driven currents and created frontal zones that contributed to the overall evolution of the near-surface oil patch.” Oil movement “showed a remarkable relationship with the Mississippi River discharge which was maintained throughout the entire oil spill period” (well leakage to capping). Patterns of the river plume and surface oil had a “close synergy that followed the variability in Mississippi River discharge and wind patterns,” indicating a “strong relation” between the outflow rates and oil transport. Researchers noted that while wind was a “main forcing agent” of the drifting oil, their study “established characteristic pathways that governed the parallel evolution between the Mississippi River plume and oil laden waters,” identifying “different aspects east and west of the Mississippi Delta.” The researchers’ data-validated model is now part of an Earth System modeling framework to help inform future response decisions. The study authors are Vassiliki H. Kourafalou and Yannis S. Androulidakis (Journal of Geophysical Research: Oceans 2013, 118, 3823–3842).
Oil from the Deepwater Horizon spill laps around the mouth of the Mississippi River delta in this May 24, 2010, image from the Advanced Spaceborne Thermal Emission and Reflection Radiometer (ASTER) instrument on NASA’s Terra spacecraft. The oil appears silver, while vegetation is red. (Image credit: Jesse Allen/NASA/GSFC/METI/ERSDAC/JAROS, and U.S./Japan ASTER Science Team)
ARTICLE REPRINT
Deep-C’s Gulf of Mexico Multi-disciplinary Curriculum for High School Science: Physical Oceanography Module 101
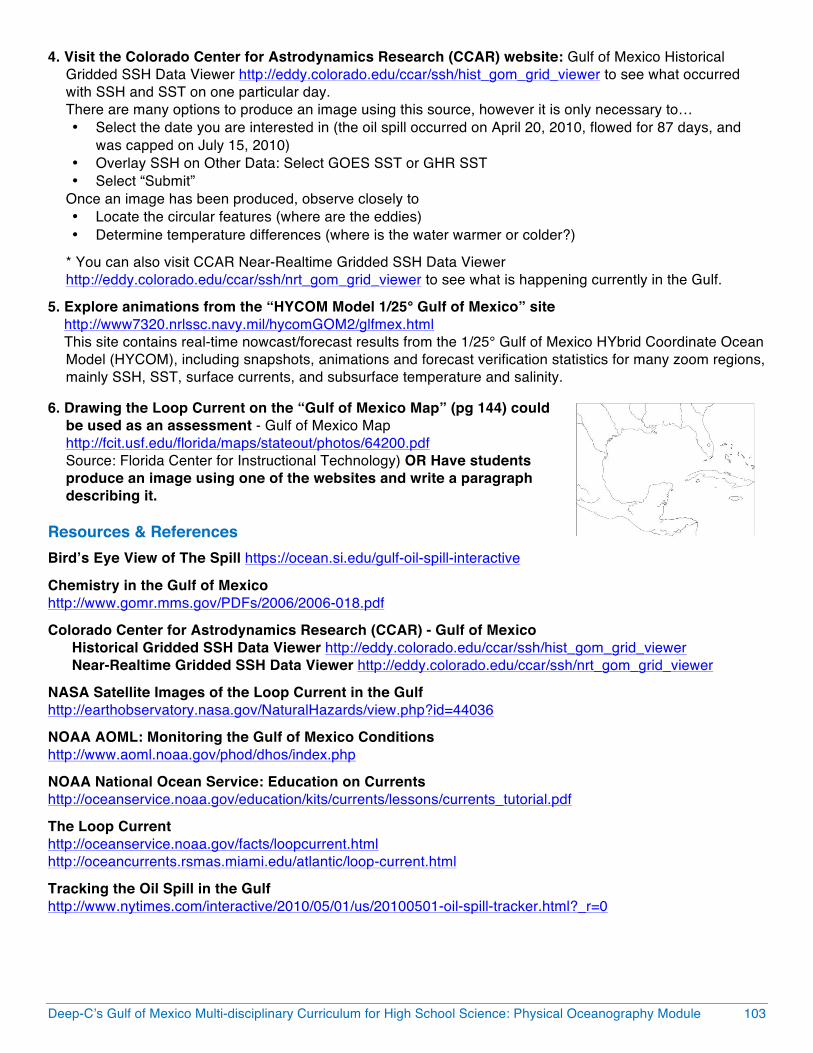
Source: http://usatoday30.usatoday.com/news/nation/2010-09-28-loopcurrent28_ST_N.htm
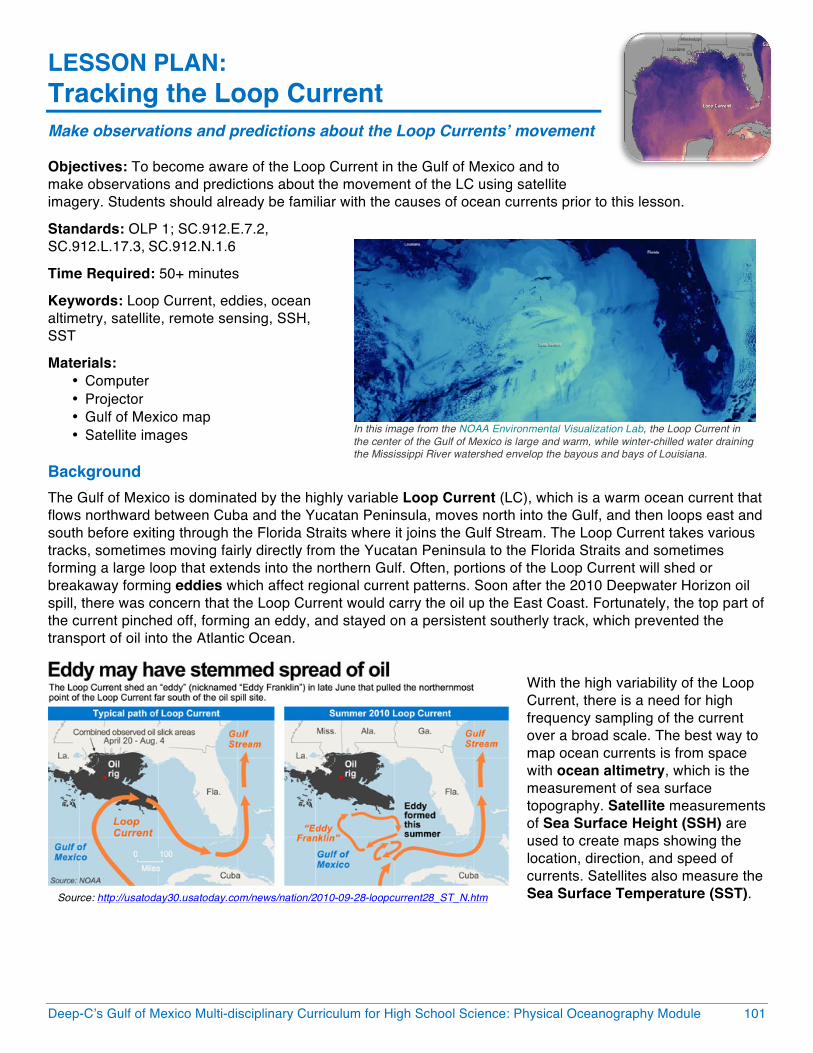
LESSON PLAN: Tracking the Loop Current Make observations and predictions about the Loop Currents’ movement
Objectives: To become aware of the Loop Current in the Gulf of Mexico and to make observations and predictions about the movement of the LC using satellite imagery. Students should already be familiar with the causes of ocean currents prior to this lesson.
Standards: OLP 1; SC.912.E.7.2, SC.912.L.17.3, SC.912.N.1.6
Time Required: 50+ minutes
Keywords: Loop Current, eddies, ocean altimetry, satellite, remote sensing, SSH, SST
Materials: • Computer • Projector • Gulf of Mexico map • Satellite images
Background The Gulf of Mexico is dominated by the highly variable Loop Current (LC), which is a warm ocean current that flows northward between Cuba and the Yucatan Peninsula, moves north into the Gulf, and then loops east and south before exiting through the Florida Straits where it joins the Gulf Stream. The Loop Current takes various tracks, sometimes moving fairly directly from the Yucatan Peninsula to the Florida Straits and sometimes forming a large loop that extends into the northern Gulf. Often, portions of the Loop Current will shed or breakaway forming eddies which affect regional current patterns. Soon after the 2010 Deepwater Horizon oil spill, there was concern that the Loop Current would carry the oil up the East Coast. Fortunately, the top part of the current pinched off, forming an eddy, and stayed on a persistent southerly track, which prevented the transport of oil into the Atlantic Ocean.
With the high variability of the Loop Current, there is a need for high frequency sampling of the current over a broad scale. The best way to map ocean currents is from space with ocean altimetry, which is the measurement of sea surface topography. Satellite measurements of Sea Surface Height (SSH) are used to create maps showing the location, direction, and speed of currents. Satellites also measure the Sea Surface Temperature (SST).
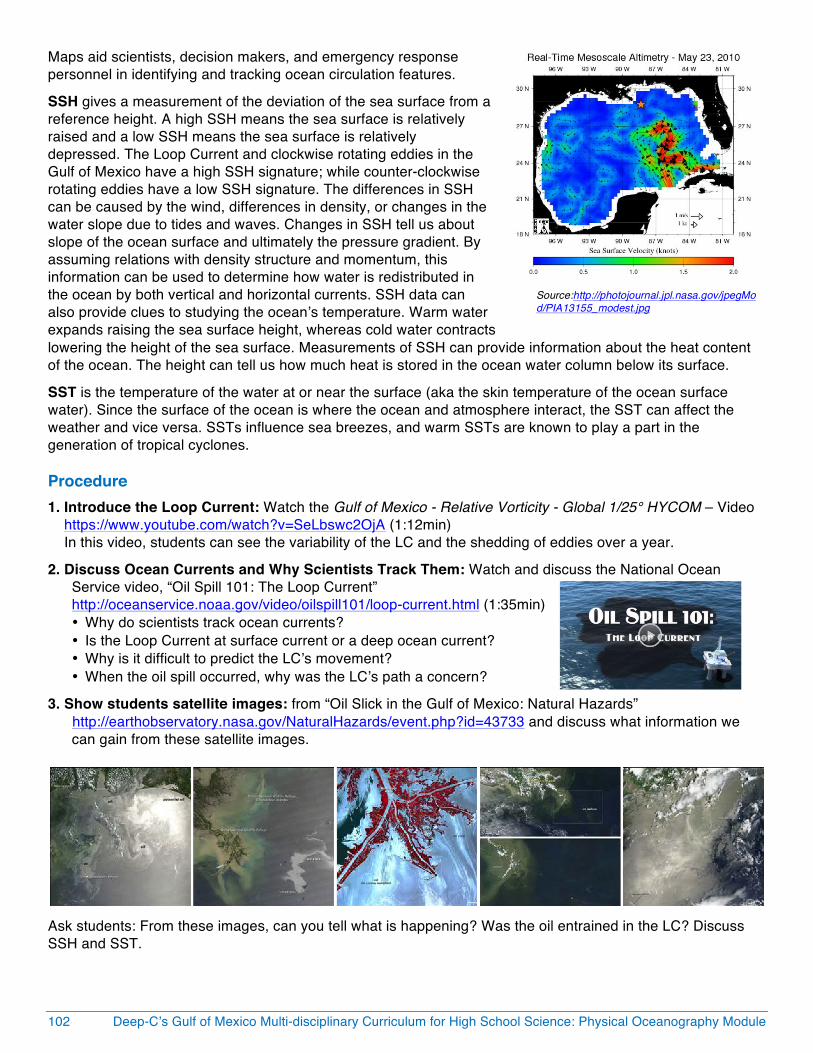
In this image from the NOAA Environmental Visualization Lab, the Loop Current in the center of the Gulf of Mexico is large and warm, while winter-chilled water draining the Mississippi River watershed envelop the bayous and bays of Louisiana.
102 Deep-C’s Gulf of Mexico Multi-disciplinary Curriculum for High School Science: Physical Oceanography Module
Maps aid scientists, decision makers, and emergency response personnel in identifying and tracking ocean circulation features.
SSH gives a measurement of the deviation of the sea surface from a reference height. A high SSH means the sea surface is relatively raised and a low SSH means the sea surface is relatively depressed. The Loop Current and clockwise rotating eddies in the Gulf of Mexico have a high SSH signature; while counter-clockwise rotating eddies have a low SSH signature. The differences in SSH can be caused by the wind, differences in density, or changes in the water slope due to tides and waves. Changes in SSH tell us about slope of the ocean surface and ultimately the pressure gradient. By assuming relations with density structure and momentum, this information can be used to determine how water is redistributed in the ocean by both vertical and horizontal currents. SSH data can also provide clues to studying the ocean’s temperature. Warm water expands raising the sea surface height, whereas cold water contracts lowering the height of the sea surface. Measurements of SSH can provide information about the heat content of the ocean. The height can tell us how much heat is stored in the ocean water column below its surface.
SST is the temperature of the water at or near the surface (aka the skin temperature of the ocean surface water). Since the surface of the ocean is where the ocean and atmosphere interact, the SST can affect the weather and vice versa. SSTs influence sea breezes, and warm SSTs are known to play a part in the generation of tropical cyclones.
Procedure 1. Introduce the Loop Current: Watch the Gulf of Mexico - Relative Vorticity - Global 1/25° HYCOM – Video https://www.youtube.com/watch?v=SeLbswc2OjA (1:12min) In this video, students can see the variability of the LC and the shedding of eddies over a year.
2. Discuss Ocean Currents and Why Scientists Track Them: Watch and discuss the National Ocean Service video, “Oil Spill 101: The Loop Current” http://oceanservice.noaa.gov/video/oilspill101/loop-current.html (1:35min) • Why do scientists track ocean currents? • Is the Loop Current at surface current or a deep ocean current? • Why is it difficult to predict the LC’s movement? • When the oil spill occurred, why was the LC’s path a concern?
3. Show students satellite images: from “Oil Slick in the Gulf of Mexico: Natural Hazards” http://earthobservatory.nasa.gov/NaturalHazards/event.php?id=43733 and discuss what information we
can gain from these satellite images.
Ask students: From these images, can you tell what is happening? Was the oil entrained in the LC? Discuss SSH and SST.
Source:http://photojournal.jpl.nasa.gov/jpegMod/PIA13155_modest.jpg
Deep-C’s Gulf of Mexico Multi-disciplinary Curriculum for High School Science: Physical Oceanography Module 103
4. Visit the Colorado Center for Astrodynamics Research (CCAR) website: Gulf of Mexico Historical Gridded SSH Data Viewer http://eddy.colorado.edu/ccar/ssh/hist_gom_grid_viewer to see what occurred with SSH and SST on one particular day.
There are many options to produce an image using this source, however it is only necessary to… • Select the date you are interested in (the oil spill occurred on April 20, 2010, flowed for 87 days, and
was capped on July 15, 2010) • Overlay SSH on Other Data: Select GOES SST or GHR SST • Select “Submit”
Once an image has been produced, observe closely to • Locate the circular features (where are the eddies) • Determine temperature differences (where is the water warmer or colder?)
* You can also visit CCAR Near-Realtime Gridded SSH Data Viewer http://eddy.colorado.edu/ccar/ssh/nrt_gom_grid_viewer to see what is happening currently in the Gulf.
5. Explore animations from the “HYCOM Model 1/25° Gulf of Mexico” site http://www7320.nrlssc.navy.mil/hycomGOM2/glfmex.html This site contains real-time nowcast/forecast results from the 1/25° Gulf of Mexico HYbrid Coordinate Ocean
Model (HYCOM), including snapshots, animations and forecast verification statistics for many zoom regions, mainly SSH, SST, surface currents, and subsurface temperature and salinity.
6. Drawing the Loop Current on the “Gulf of Mexico Map” (pg 144) could be used as an assessment - Gulf of Mexico Map http://fcit.usf.edu/florida/maps/stateout/photos/64200.pdf
Source: Florida Center for Instructional Technology) OR Have students produce an image using one of the websites and write a paragraph describing it.
Resources & References Bird’s Eye View of The Spill https://ocean.si.edu/gulf-oil-spill-interactive
Chemistry in the Gulf of Mexico http://www.gomr.mms.gov/PDFs/2006/2006-018.pdf
Colorado Center for Astrodynamics Research (CCAR) - Gulf of Mexico Historical Gridded SSH Data Viewer http://eddy.colorado.edu/ccar/ssh/hist_gom_grid_viewer Near-Realtime Gridded SSH Data Viewer http://eddy.colorado.edu/ccar/ssh/nrt_gom_grid_viewer
NASA Satellite Images of the Loop Current in the Gulf http://earthobservatory.nasa.gov/NaturalHazards/view.php?id=44036
NOAA AOML: Monitoring the Gulf of Mexico Conditions http://www.aoml.noaa.gov/phod/dhos/index.php
NOAA National Ocean Service: Education on Currents http://oceanservice.noaa.gov/education/kits/currents/lessons/currents_tutorial.pdf
The Loop Current http://oceanservice.noaa.gov/facts/loopcurrent.html http://oceancurrents.rsmas.miami.edu/atlantic/loop-current.html
Tracking the Oil Spill in the Gulf http://www.nytimes.com/interactive/2010/05/01/us/20100501-oil-spill-tracker.html?_r=0
104 Deep-C’s Gulf of Mexico Multi-disciplinary Curriculum for High School Science: Physical Oceanography Module
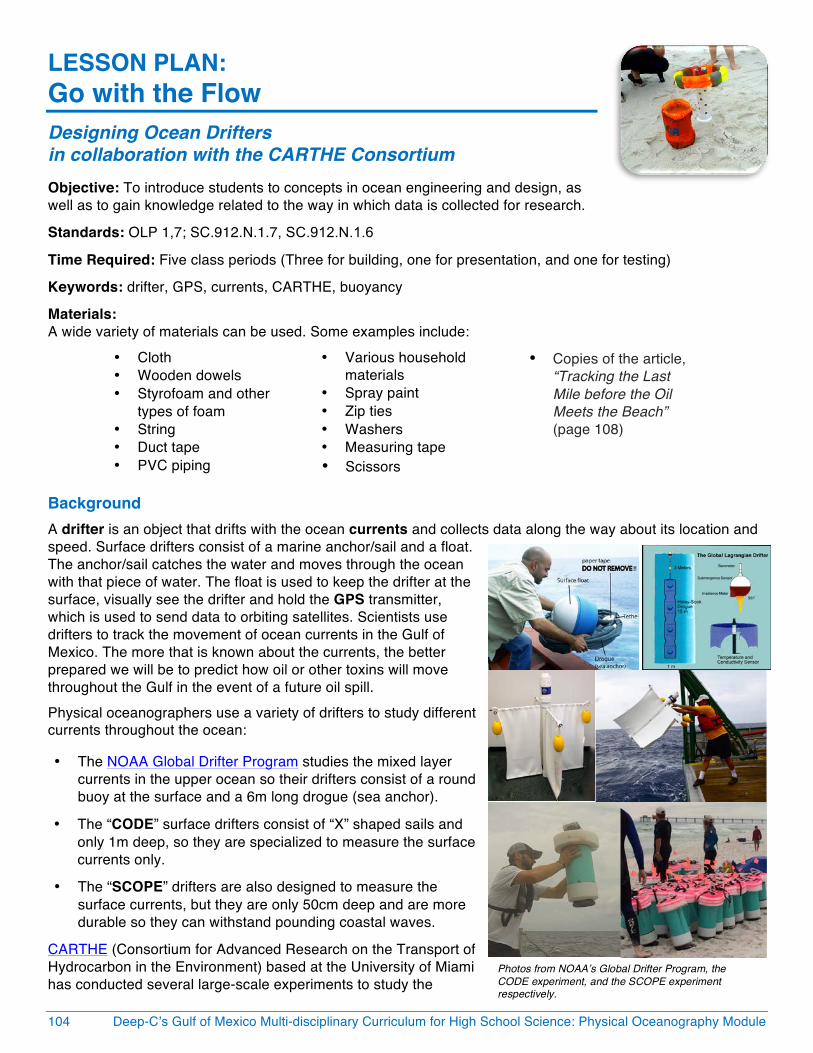
LESSON PLAN: Go with the Flow Designing Ocean Drifters in collaboration with the CARTHE Consortium Objective: To introduce students to concepts in ocean engineering and design, as well as to gain knowledge related to the way in which data is collected for research.
Standards: OLP 1,7; SC.912.N.1.7, SC.912.N.1.6
Time Required: Five class periods (Three for building, one for presentation, and one for testing)
Keywords: drifter, GPS, currents, CARTHE, buoyancy
Materials: A wide variety of materials can be used. Some examples include:
• Cloth • Wooden dowels • Styrofoam and other
types of foam • String • Duct tape • PVC piping
• Various household materials
• Spray paint • Zip ties • Washers • Measuring tape • Scissors
• Copies of the article, “Tracking the Last Mile before the Oil Meets the Beach” (page 108)
Background A drifter is an object that drifts with the ocean currents and collects data along the way about its location and speed. Surface drifters consist of a marine anchor/sail and a float. The anchor/sail catches the water and moves through the ocean with that piece of water. The float is used to keep the drifter at the surface, visually see the drifter and hold the GPS transmitter, which is used to send data to orbiting satellites. Scientists use drifters to track the movement of ocean currents in the Gulf of Mexico. The more that is known about the currents, the better prepared we will be to predict how oil or other toxins will move throughout the Gulf in the event of a future oil spill. Physical oceanographers use a variety of drifters to study different currents throughout the ocean:
• The NOAA Global Drifter Program studies the mixed layer currents in the upper ocean so their drifters consist of a round buoy at the surface and a 6m long drogue (sea anchor).
• The “CODE” surface drifters consist of “X” shaped sails and only 1m deep, so they are specialized to measure the surface currents only.
• The “SCOPE” drifters are also designed to measure the surface currents, but they are only 50cm deep and are more durable so they can withstand pounding coastal waves.
CARTHE (Consortium for Advanced Research on the Transport of Hydrocarbon in the Environment) based at the University of Miami has conducted several large-scale experiments to study the
Photos from NOAA’s Global Drifter Program, the CODE experiment, and the SCOPE experiment respectively.
Deep-C’s Gulf of Mexico Multi-disciplinary Curriculum for High School Science: Physical Oceanography Module 105
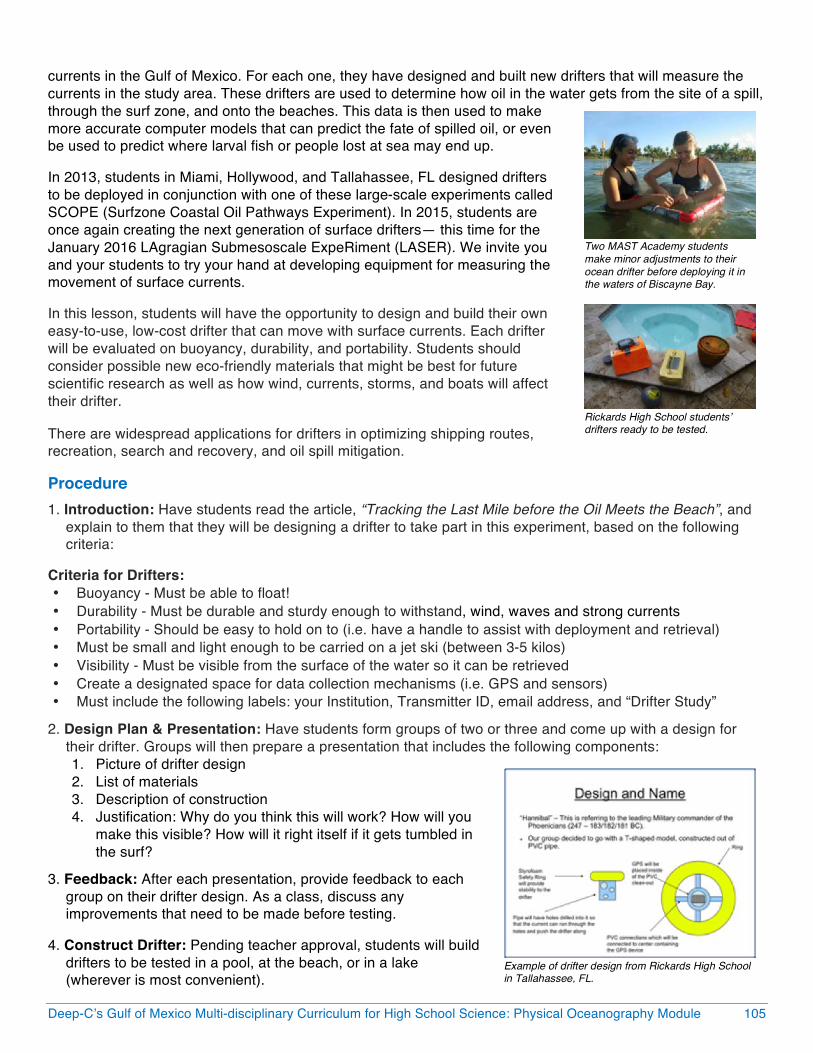
currents in the Gulf of Mexico. For each one, they have designed and built new drifters that will measure the currents in the study area. These drifters are used to determine how oil in the water gets from the site of a spill, through the surf zone, and onto the beaches. This data is then used to make more accurate computer models that can predict the fate of spilled oil, or even be used to predict where larval fish or people lost at sea may end up.
In 2013, students in Miami, Hollywood, and Tallahassee, FL designed drifters to be deployed in conjunction with one of these large-scale experiments called SCOPE (Surfzone Coastal Oil Pathways Experiment). In 2015, students are once again creating the next generation of surface drifters— this time for the January 2016 LAgragian Submesoscale ExpeRiment (LASER). We invite you and your students to try your hand at developing equipment for measuring the movement of surface currents.
In this lesson, students will have the opportunity to design and build their own easy-to-use, low-cost drifter that can move with surface currents. Each drifter will be evaluated on buoyancy, durability, and portability. Students should consider possible new eco-friendly materials that might be best for future scientific research as well as how wind, currents, storms, and boats will affect their drifter.
There are widespread applications for drifters in optimizing shipping routes, recreation, search and recovery, and oil spill mitigation.
Procedure 1. Introduction: Have students read the article, “Tracking the Last Mile before the Oil Meets the Beach”, and
explain to them that they will be designing a drifter to take part in this experiment, based on the following criteria:
Criteria for Drifters: • Buoyancy - Must be able to float! • Durability - Must be durable and sturdy enough to withstand, wind, waves and strong currents • Portability - Should be easy to hold on to (i.e. have a handle to assist with deployment and retrieval) • Must be small and light enough to be carried on a jet ski (between 3-5 kilos) • Visibility - Must be visible from the surface of the water so it can be retrieved • Create a designated space for data collection mechanisms (i.e. GPS and sensors) • Must include the following labels: your Institution, Transmitter ID, email address, and “Drifter Study”
2. Design Plan & Presentation: Have students form groups of two or three and come up with a design for their drifter. Groups will then prepare a presentation that includes the following components: 1. Picture of drifter design 2. List of materials 3. Description of construction 4. Justification: Why do you think this will work? How will you
make this visible? How will it right itself if it gets tumbled in the surf?
3. Feedback: After each presentation, provide feedback to each group on their drifter design. As a class, discuss any improvements that need to be made before testing.
4. Construct Drifter: Pending teacher approval, students will build drifters to be tested in a pool, at the beach, or in a lake (wherever is most convenient).
Two MAST Academy students make minor adjustments to their ocean drifter before deploying it in the waters of Biscayne Bay.
Rickards High School students’ drifters ready to be tested.
Example of drifter design from Rickards High School in Tallahassee, FL.

106 Deep-C’s Gulf of Mexico Multi-disciplinary Curriculum for High School Science: Physical Oceanography Module
5. How to Test Your Drifter:
1. Have each group place their drifter in the body of water. 2. Using the judging rubric, evaluate the drifters on how well they meet each of the criteria. 3. If using a pool or lake, create a disturbance in the water to make sure that the drifter is self-righting and
can withstand wind and waves.
Extensions Build mini-drifters and test in a small tank. Could be used as an afterschool science club project. Plot the drifter’s trajectories.
SCOPE drifter tracks (including students’)
Resources & References Global Drifter Program http://www.aoml.noaa.gov/phod/dac/gdp_drifter.php - design Monitoring the Gulf of Mexico Conditions, Surface Drifter Observations http://www.aoml.noaa.gov/phod/dhos/drifters.php Student Drifters http://studentdrifters.org/ Surfzone Coastal Oil Pathways Experiment (SCOPE) http://carthe.org/scope/
Contributing Expert Laura Bracken, Outreach Manager for the CARTHE Consortium led by the University of Miami
Single SCOPE drifter track
GLAD drifter tracks
Deep-C’s Gulf of Mexico Multi-disciplinary Curriculum for High School Science: Physical Oceanography Module 107
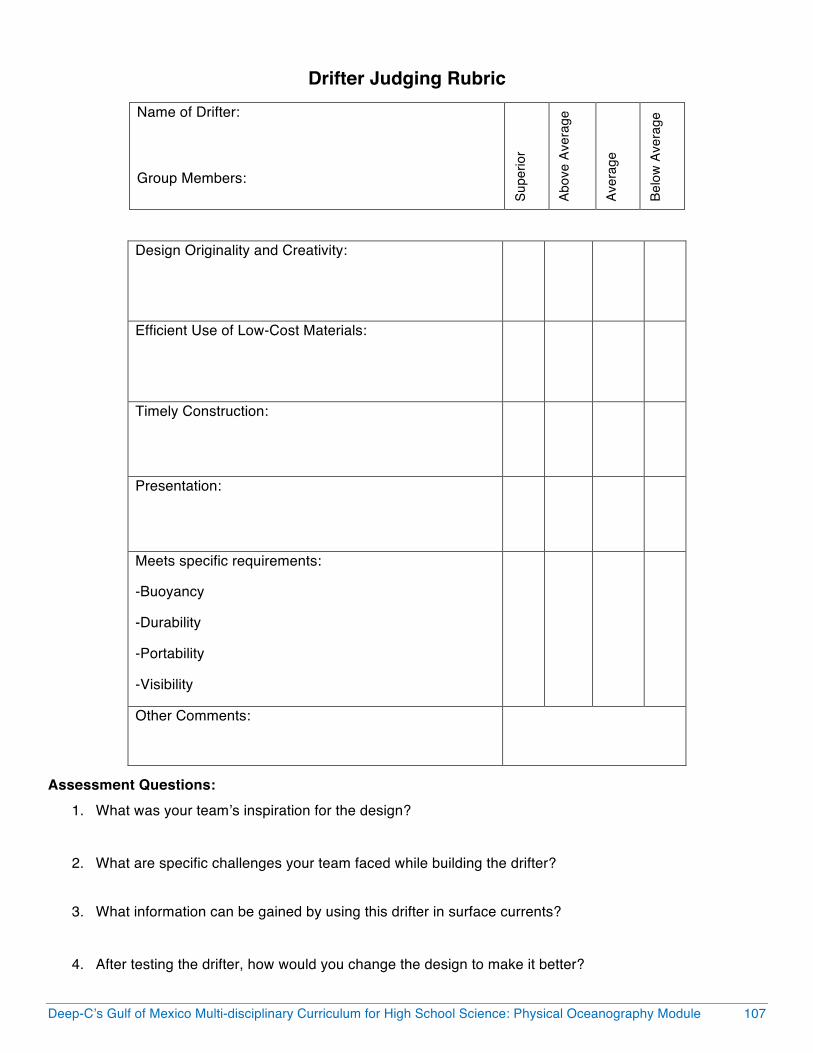
Drifter Judging Rubric Name of Drifter:
Group Members:
Supe
rior
Abov
e Av
erag
e
Aver
age
Belo
w A
vera
ge
Design Originality and Creativity:
Efficient Use of Low-Cost Materials:
Timely Construction:
Presentation:
Meets specific requirements:
-Buoyancy
-Durability
-Portability
-Visibility
Other Comments:
Assessment Questions: 1. What was your team’s inspiration for the design?
2. What are specific challenges your team faced while building the drifter?
3. What information can be gained by using this drifter in surface currents? 4. After testing the drifter, how would you change the design to make it better?

108 Deep-C’s Gulf of Mexico Multi-disciplinary Curriculum for High School Science: Physical Oceanography Module
Tracking the Last Mile Before Oil Meets the Beach Posted online January 17, 2014 Source: GoMRI http://gulfresearchinitiative.org/tracking-last-mile-oil-meets-beach/ Rolling waves, swirling currents, converging fronts, shifting sediments – all are connected as anyone who has chased a ball in beach waters knows. But how?
To understand the mechanisms that move water-borne objects or contaminants onshore, over 30 researchers from 16 universities gathered in Ft. Walton Beach, Florida in December 2013 – armed with drifters, dye, and drones – and conducted a three-week Surfzone Coastal Oil Pathways Experiment (SCOPE).
“We’re studying the region most hit by the Deepwater Horizon oil spill, which includes the coasts surrounding the Gulf,” explained Tamay Özgökmen, the team’s principal investigator, “to learn more about how things in the water get outside of the surf zone and onto the beaches.”
Scientists are tracking elusive ocean processes to visualize the movement of Gulf waters in 3D. For this experiment, they deployed 250 GPS-equipped drifters (30 were biodegradable) to track surface waters, using a “release and catch” method for repeated use of these specially-outfitted devices. Researchers injected an EPA-approved dye both along and outside the surf zone to trace its movement through the water column. Various in-situ instruments recorded water and atmospheric conditions.
“This study will collect important data necessary to understand the currents in the near-shore marine environment,” said Ad Reniers, co-lead scientist for SCOPE. “The information collected will be used to develop computer models of the coastal zone, to improve our scientific understanding of this region in the event of future oil spills, and to better understand how larvae or pollutants travel close to shore.”
These researchers are members of the Consortium for Advanced Research on Transport of Hydrocarbon in the Environment (CARTHE), a science team funded by the Gulf of Mexico Research Initiative (GoMRI). The University of Miami’s Rosenstiel School of Marine and Atmospheric Science (UM-RSMAS) administers CARTHE under Özgökmen’s direction. Joining Reiners as co-lead scientist for SCOPE is Jamie MacMahan with the Naval Postgraduate School.
“Computer models will be able to give us better estimates of where the oil spill will go and how fast and in which patterns it will spread,” said Özgökmen. “This can help emergency responders to better direct their limited resources and help us understand ecological damage that may have occurred.” He is confident that “a lot of beneficial information will come out of this study, not just about the oil spill.”
For example, the spreading pattern of dye revealed dangerous rip currents. “That’s the best visual image of a rip tide I’ve ever seen,” said Chuck Wilson, GoMRI Chief Scientist. “If people could see that, they might understand a little better how they work.”
To construct data on the multiple factors that influence the behavior of ocean currents, the scientists have to collect data at one time. “We combine a lot of different instruments at once to capture the complete picture of all the drivers of surface currents,” explained SCOPE team member Guillaume Novelli, a UM-RSMAS postdoctoral fellow. “It took a village to pull off SCOPE successfully,” said Özgökmen referring to the many dedicated staff who coordinated logistics, people, equipment, and, of course, the science. Prior to the SCOPE execution in Ft. Walton Beach, about 15 modelers from three distinct groups – University
Kate Woodall, Naval Postgraduate School, injects EPA-approved in the surf zone in Ft. Walton Beach, FL. (Photo provided by CARTHE)
Kimberly Arnott (Texas A&M University, Corpus Christi) prepares microstructure instruments for deployment to record measurements of water turbulence such as dissipation and diffusivity. (Photo provided by CARTHE)
ARTICLE REPRINT

Deep-C’s Gulf of Mexico Multi-disciplinary Curriculum for High School Science: Physical Oceanography Module 109
of Miami Coupled Model (UMCM), Naval Research Laboratory (NRL), and ADvanced CIRCulation model (ADCIRC) – began running real-time, predictive simulations. Together these models provided SCOPE scientists with important, high-resolution transport information.
The first week of SCOPE was a flurry of preparations: teams finalized local permits, assembled drifters and identified specific locations for launching (freshwater inlets, surf zones, and along the inner shelf and fronts) and then staged them for deployment; others prepared dye injection equipment and assembled camera-equipped drones and kites; and divers positioned observing instruments in the water at various distances from the beach and depths in the water column. The Florida International University team erected a meteorological data-gather tower on site. The next week, the team ran test trials of the experiments to make final adjustments for local conditions, aerial observations and imagery, and to inform their remote modeling teams. Scientists also hosted on-site interactive demonstrations with local middle and high school students.
In the final week, everyone, in a synchronized manner, executed their tasks of well-informed, targeted releases of dye and deployment of drifters with the coordinated use of Synthetic-aperture radar (SAR) images, microstructure and air-sea interaction measurements, observations of frontal features, and detailed modeling adjusted to observations.
Once models are supplemented by real-time data from experiments, climate scientists can combine these data with wind and tides and use them to predict oil transport in scenarios under a variety of conditions. In the long-term, improved transport predictions can inform environmental policy and support the development of crisis response plans. The U.S. Coast Guard can use improved transport predictions to pinpoint vessels in distress and with search and rescue operations, and fisheries can better understand larval movement of important commercial species.
SCOPE is the second large CARTHE experiment that brings together a wide range of scientific experts to experiment with measurement methods and study oil transport. CARTHE conducted their first experiment, GLAD (Grand LAgrangian Deployment), near the Deepwater Horizon site in the summer of 2012. Scientists will use data from both experiments to more accurately model the transport and fate of oil in the Gulf.
Novelli eloquently explained the importance of understanding ocean processes in both deep and near-shore waters: “What happens in the last 100 meters of coastal transport is determined by what happened in the first 100 meters of the spill.”
The CARTHE I program (2012-2014) includes 26 principal investigators from 12 research institutions in eight states. The CARTHE II program (2015-2017) includes 40 principal investigators from 27 research institutions. Together these scientists are engaged in novel research through the development of a suite of integrated models and state-of-the-art computations that bridge the scale gap between existing models and natural processes.
For more information about CARTHE, please visit www.carthe.org.
This aerial photo, taken from the camera-equipped drone, shows a mile-long dye strip injected outside the surf zone.
CARTHE scientists releasing SCOPE drifters just outside the surfzone. (Photo provided by CARTHE)
110 Deep-C’s Gulf of Mexico Multi-disciplinary Curriculum for High School Science: Physical Oceanography Module
LESSON PLAN: The SailBuoy’s Journey in the Gulf of Mexico Analyzing data from the CMR SailBuoy Objectives: To introduce students to marine observations and data collection with new technologies (CMR SailBuoy and Deep-C Map Viewer). To use Deep-C’s Map Viewer, create graphs using the SailBuoy data, analyze the data, and draw conclusions.
Standards: OLP 7; SC.912.N.1.7
Time Required: One or two 50-minute periods
Key Words: marine observations, CMR SailBuoy, satellite, seawater parameters
Materials: A computer and copies of the article “Deep-C Launches the Gulf’s First SailBuoy for Scientific Observations” (see page 113)
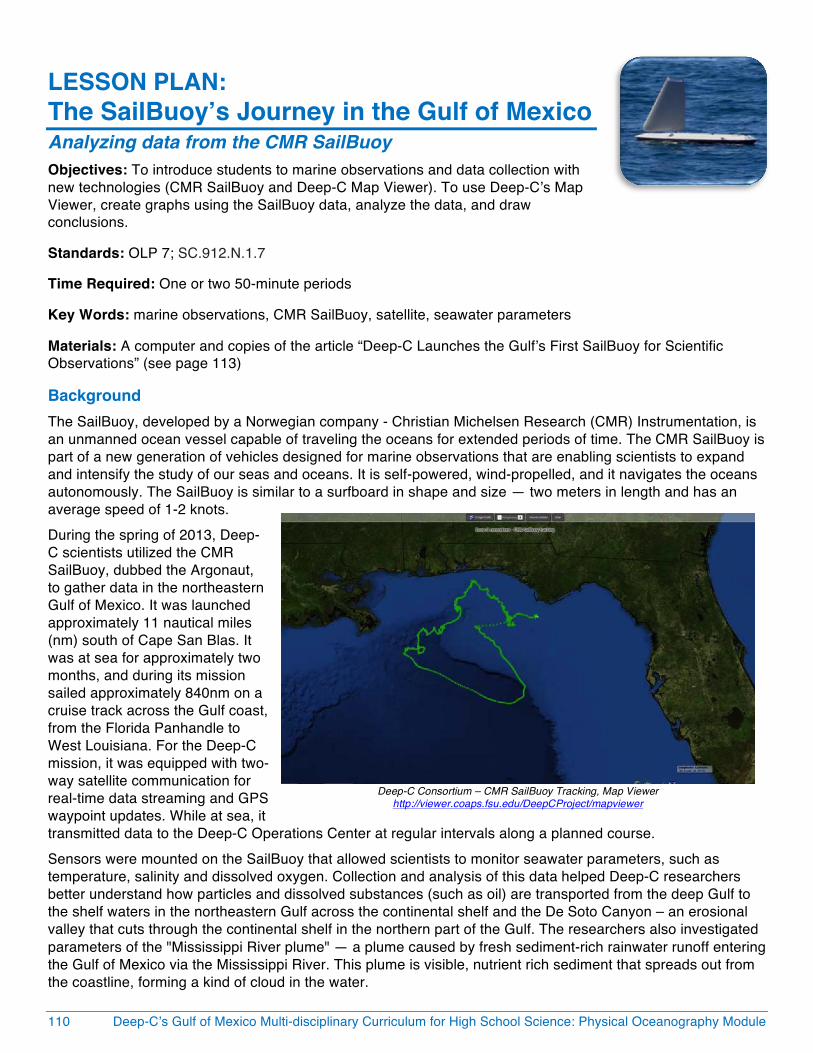
Background The SailBuoy, developed by a Norwegian company - Christian Michelsen Research (CMR) Instrumentation, is an unmanned ocean vessel capable of traveling the oceans for extended periods of time. The CMR SailBuoy is part of a new generation of vehicles designed for marine observations that are enabling scientists to expand and intensify the study of our seas and oceans. It is self-powered, wind-propelled, and it navigates the oceans autonomously. The SailBuoy is similar to a surfboard in shape and size — two meters in length and has an average speed of 1-2 knots. During the spring of 2013, Deep-C scientists utilized the CMR SailBuoy, dubbed the Argonaut, to gather data in the northeastern Gulf of Mexico. It was launched approximately 11 nautical miles (nm) south of Cape San Blas. It was at sea for approximately two months, and during its mission sailed approximately 840nm on a cruise track across the Gulf coast, from the Florida Panhandle to West Louisiana. For the Deep-C mission, it was equipped with two-way satellite communication for real-time data streaming and GPS waypoint updates. While at sea, it transmitted data to the Deep-C Operations Center at regular intervals along a planned course. Sensors were mounted on the SailBuoy that allowed scientists to monitor seawater parameters, such as temperature, salinity and dissolved oxygen. Collection and analysis of this data helped Deep-C researchers better understand how particles and dissolved substances (such as oil) are transported from the deep Gulf to the shelf waters in the northeastern Gulf across the continental shelf and the De Soto Canyon – an erosional valley that cuts through the continental shelf in the northern part of the Gulf. The researchers also investigated parameters of the "Mississippi River plume" — a plume caused by fresh sediment-rich rainwater runoff entering the Gulf of Mexico via the Mississippi River. This plume is visible, nutrient rich sediment that spreads out from the coastline, forming a kind of cloud in the water.
Deep-C Consortium – CMR SailBuoy Tracking, Map Viewer
http://viewer.coaps.fsu.edu/DeepCProject/mapviewer
Deep-C’s Gulf of Mexico Multi-disciplinary Curriculum for High School Science: Physical Oceanography Module 111
The SailBuoy Sensors • Conductivity-Temperature (CT) sensor - low-drag, fast-response CT sensor manufactured by Neil Brown
Ocean Sensors, Inc. (NBOSI); The CT sensor is a fast response unit composed of a 4-electrode conductivity cell and a stable thermistor.
• Oxygen optode - AS4835, manufactured by Aanderaa Data Instruments (AADI); the optode samples the dissolved O2 concentration and air saturation at a resolution of 1microM and 0.4%, respectively.
Procedure 1. Have the students read the GoMRI Article, “Deep-C Launches the Gulf’s First SailBuoy for Scientific
Observations”: http://gulfresearchinitiative.org/deep-c-launches-the-gulfs-first-sailbuoy-for-scientific-observations/
2. Access the Deep-C Map Viewer at: http://viewer.coaps.fsu.edu/DeepCProject/mapviewer
• To the left, under “Main Layers”: Click on the first tab and change to CMR SailBuoy
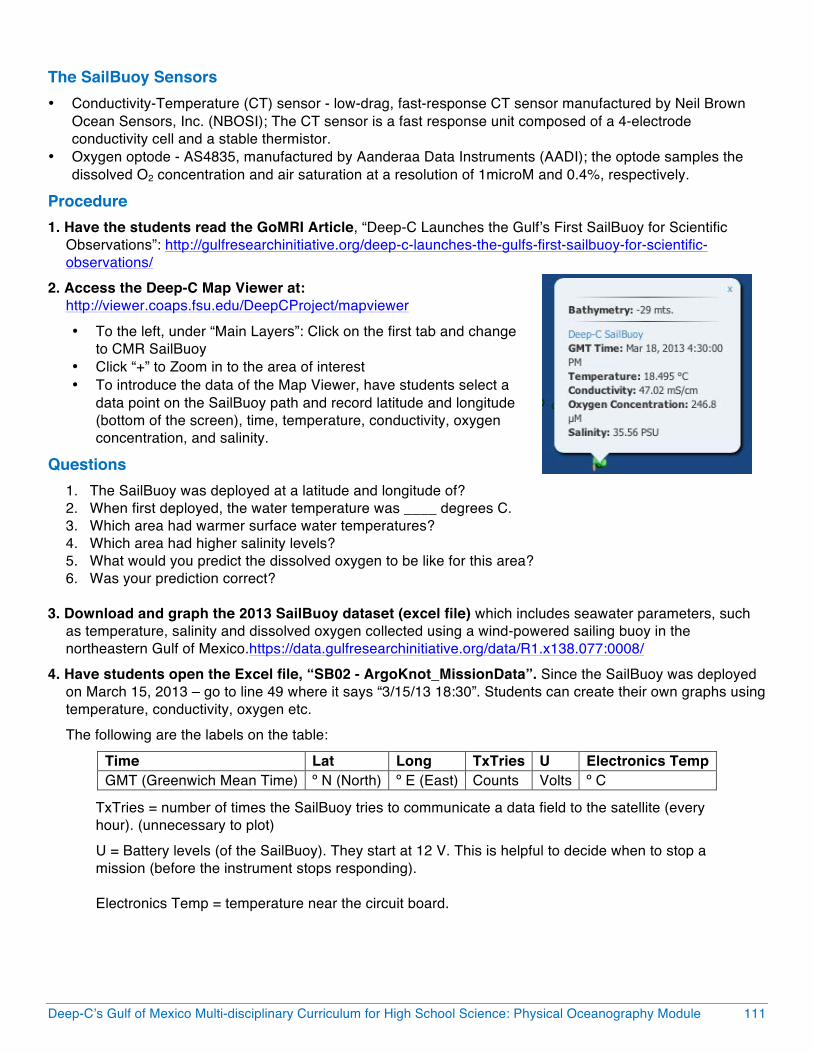
• Click “+” to Zoom in to the area of interest • To introduce the data of the Map Viewer, have students select a
data point on the SailBuoy path and record latitude and longitude (bottom of the screen), time, temperature, conductivity, oxygen concentration, and salinity.
Questions 1. The SailBuoy was deployed at a latitude and longitude of? 2. When first deployed, the water temperature was ____ degrees C. 3. Which area had warmer surface water temperatures? 4. Which area had higher salinity levels? 5. What would you predict the dissolved oxygen to be like for this area? 6. Was your prediction correct?
3. Download and graph the 2013 SailBuoy dataset (excel file) which includes seawater parameters, such
as temperature, salinity and dissolved oxygen collected using a wind-powered sailing buoy in the northeastern Gulf of Mexico.https://data.gulfresearchinitiative.org/data/R1.x138.077:0008/
4. Have students open the Excel file, “SB02 - ArgoKnot_MissionData”. Since the SailBuoy was deployed on March 15, 2013 – go to line 49 where it says “3/15/13 18:30”. Students can create their own graphs using temperature, conductivity, oxygen etc. The following are the labels on the table:
Time Lat Long TxTries U Electronics Temp GMT (Greenwich Mean Time) º N (North) º E (East) Counts Volts º C
TxTries = number of times the SailBuoy tries to communicate a data field to the satellite (every hour). (unnecessary to plot) U = Battery levels (of the SailBuoy). They start at 12 V. This is helpful to decide when to stop a mission (before the instrument stops responding). Electronics Temp = temperature near the circuit board.

112 Deep-C’s Gulf of Mexico Multi-disciplinary Curriculum for High School Science: Physical Oceanography Module
Conductivity-temperature (CT) sensor CTTemperature CTConductivity º C (degrees Celsius) mmhos/cm (millimhos per centimeter)
The conductivity-temperature sensor is measuring salinity (via conductivity) and temperature. This is a very accurate and expensive, although very reduced in size instrument. Description: http://www.neilbrownoceansensors.com/prod01_gctd.htm
Oxygen optode sensor
Oxy_Oxygen Oxy_Saturation (Oxygen Air Saturation) Oxy_Temperature μM (micrometer; 10-6 meters) % (percentage) º C (degrees Celsius)
Oxy_Temperature = This is the temperature from a different sensor (not from the CTD) near the oxygen optode. (Not necessary to plot)
5. Have students analyze the data and draw conclusions in a written paragraph.
6. Discuss as a class and compare student results with the report summary below. SailBuoy Report Summary: “Results are reported from a two-month long deployment of the SailBuoy SB02 between 15 March and 15 May 2013 in the Gulf of Mexico. The instrument sampled across fronts between the shelf and basin waters in the Gulf of Mexico in the early part of the record, and then drifted with a large cyclonic gyre in the basin. The shelf is characterized by cold, low salinity and oxygen rich waters. Off shelf surface waters with relatively higher temperature and salinity, but lower oxygen concentration show variability of typically 0.2 in salinity and less than 1°C in temperature.” (Ref. no.: CMR-13-A10265-RA-1 Date:14.10.2013 Page 12)
Resources & References More information about this project can be found at www.deepc.org/sailbuoy and www.sailbuoy.no. Deep-C’s Voices from the Field blog for an account of its journey from the Deep-C scientists: http://deepcconsortium.blogspot.com/search?q=sailbuoy Datasheet from Offshore Sensing AS: http://sailbuoy.no/files/Sailbuoy_datasheet.pdf Gulf of Mexico Report: http://www.sailbuoy.no/files/CMR-13-A10265-RA-1%20GulfOfMexicoReport.pdf
Contributing Experts Dr. Nico Wienders, Physical Oceanographer at the Florida State University, Department of Earth, Ocean, and Atmospheric Science (EOAS) Dr. Lars Hole, Senior Research Scientist at the Norwegian Meteorological Institute
Deep-C’s Gulf of Mexico Multi-disciplinary Curriculum for High School Science: Physical Oceanography Module 113
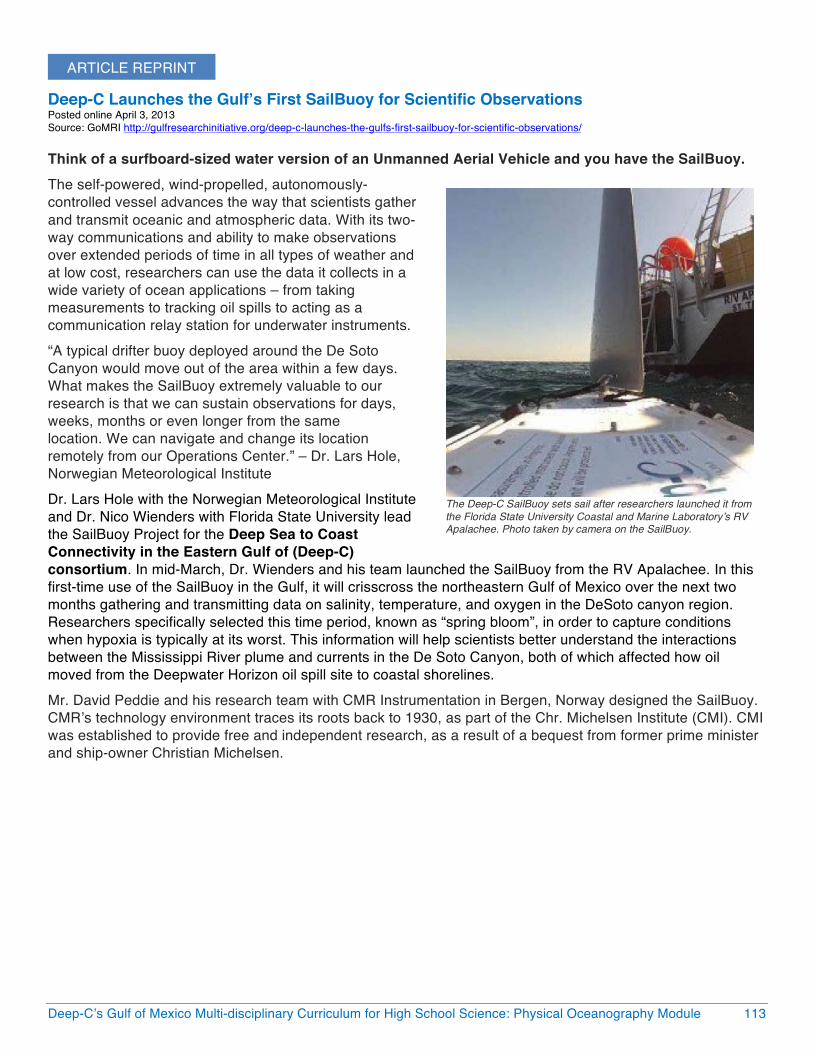
Deep-C Launches the Gulf’s First SailBuoy for Scientific Observations Posted online April 3, 2013 Source: GoMRI http://gulfresearchinitiative.org/deep-c-launches-the-gulfs-first-sailbuoy-for-scientific-observations/ Think of a surfboard-sized water version of an Unmanned Aerial Vehicle and you have the SailBuoy. The self-powered, wind-propelled, autonomously-controlled vessel advances the way that scientists gather and transmit oceanic and atmospheric data. With its two-way communications and ability to make observations over extended periods of time in all types of weather and at low cost, researchers can use the data it collects in a wide variety of ocean applications – from taking measurements to tracking oil spills to acting as a communication relay station for underwater instruments. “A typical drifter buoy deployed around the De Soto Canyon would move out of the area within a few days. What makes the SailBuoy extremely valuable to our research is that we can sustain observations for days, weeks, months or even longer from the same location. We can navigate and change its location remotely from our Operations Center.” – Dr. Lars Hole, Norwegian Meteorological Institute Dr. Lars Hole with the Norwegian Meteorological Institute and Dr. Nico Wienders with Florida State University lead the SailBuoy Project for the Deep Sea to Coast Connectivity in the Eastern Gulf of (Deep-C) consortium. In mid-March, Dr. Wienders and his team launched the SailBuoy from the RV Apalachee. In this first-time use of the SailBuoy in the Gulf, it will crisscross the northeastern Gulf of Mexico over the next two months gathering and transmitting data on salinity, temperature, and oxygen in the DeSoto canyon region. Researchers specifically selected this time period, known as “spring bloom”, in order to capture conditions when hypoxia is typically at its worst. This information will help scientists better understand the interactions between the Mississippi River plume and currents in the De Soto Canyon, both of which affected how oil moved from the Deepwater Horizon oil spill site to coastal shorelines. Mr. David Peddie and his research team with CMR Instrumentation in Bergen, Norway designed the SailBuoy. CMR’s technology environment traces its roots back to 1930, as part of the Chr. Michelsen Institute (CMI). CMI was established to provide free and independent research, as a result of a bequest from former prime minister and ship-owner Christian Michelsen.
The Deep-C SailBuoy sets sail after researchers launched it from the Florida State University Coastal and Marine Laboratory’s RV Apalachee. Photo taken by camera on the SailBuoy.
ARTICLE REPRINT
114 Deep-C’s Gulf of Mexico Multi-disciplinary Curriculum for High School Science: Physical Oceanography Module
Physical Oceanography Quiz 1. Name the three physical properties that control density in the ocean.
2. The ocean is composed of several layers of water with different densities. How does this layering occur and what are some things that could disrupt ocean layers?
3. What is the Loop Current? What role does it play in the circulation of the Gulf of Mexico?
4. How is satellite imagery used to track ocean currents in the Gulf of Mexico?
5. How does the Mississippi River influence density and ocean circulation?
6. What is a drifter and how does it collect data about the ocean? What kind properties can be measured using drifters?
7. How does data collected by drifters help scientists to predict the fate of spilled oil?
8. Name three tools that scientists can use to make marine observations. Describe the types of data that can be collected and provide specific examples.
9. What is a gravity current? What are some examples of gravity currents on land? In the ocean?
10. The 2010 Deepwater Horizon oil spill released nearly 5 million barrels of oil into the Gulf of Mexico over a three-month period. How might the release of oil change the density of the ocean? Do you think the change of density could greatly impact circulation in the Gulf of Mexico? Why or why not?
Deep-C’s Gulf of Mexico Multi-disciplinary Curriculum for High School Science: Physical Oceanography Module 115
Physical Oceanography Glossary Buoyancy: the ability or tendency to float in water or air or other fluids
CMR SailBuoy: an unmanned wind-propelled ocean vessel capable of traveling the oceans for extended periods of time, designed for marine observations. Developed by a Norwegian company, CMR Instrumentation
Corriolis effect: the apparent (when viewed from Earth) deflection of objects (including air) above the surface of the Earth as a result of the Earth’s rotation; objects in the Northern Hemisphere appear to curve to the right whereas objects in the Southern Hemisphere appear to curve to the left
Current: the steady flow of water in a prevailing direction
Deep Ocean Current: water movement patterns more than 300 feet below the surface of the ocean
Density: the mass per unit of volume of a substance
Drifter: an object that drifts with the ocean currents and collects data about its location and speed
Eddy: a circular current of water; vortex
Global Conveyor Belt: a large-scale ocean circulation pattern driven by wind and density differences in the ocean. Cool, high salinity water sinks in the North Atlantic, travels in deep ocean currents south to Antarctica, east across the globe, and north to the North Pacific, where it rises to the surface due to upwelling. Water then moves in surface ocean currents south and west toward the tip of Africa and north via the Gulf Stream, returning finally to the North Atlantic
GPS: Global Positioning System, a satellite-based navigation system
Gravity Current: driven by density differences between fluids, hence also referred to as “density currents”; characterized by a sharp front often followed by a bulbous head and longer thinner tail
Gulf Stream: a warm ocean current that flows from the Gulf of Mexico northward through the Atlantic Ocean
Longshore Current: a current created by the energy released when waves break on the beach; these currents travel parallel to the beach
Loop Current: a warm ocean current that flows northward between Cuba and the Yucatan Peninsula, moves north into the Gulf, and then loops east and south before exiting through the Florida Straits where it joins the Gulf Stream
Mass: a unit of measurement, a measure of how many atoms are in an object
Ocean Altimetry: satellite measurement of sea surface topography
Pressure: the continuous physical force exerted on or against an object by something in contact with it
RAFOS Floats: floats that track the motion of the water; the float listens and records sound signals from stationary acoustic beacons; at the end of their pre-programmed mission, the floats drop their ballast weights, rise to the surface, and beam their data to orbiting satellites
Remote Sensing: the science of obtaining information about objects or areas from a distance, typically from aircraft or satellites
Rip Current: a current that is the result of water funneling out of a narrow opening; water flows away from land
Salinity: the saltiness or dissolved salt content of a body of water

116 Deep-C’s Gulf of Mexico Multi-disciplinary Curriculum for High School Science: Physical Oceanography Module
SSH: Sea Surface Height, a measurement of the deviation of the sea surface from a reference height
SST: Sea Surface Temperature, the temperature of the water at or near the surface, aka the skin temperature of the ocean surface water
Stokes Drift: the lateral motion of a particle via wave action
Surface Current: ocean currents that occur at less than 300 feet below the surface of the ocean; most ocean currents are usually wind-driven
Thermocline: a steep temperature gradient in a body of water such as a lake, marked by a layer above and below which the water is at different temperatures
Tidal Current: currents generated by tides Tide: the rise and fall in sea level caused by the gravitational forces of the moon and sun in combination with the rotation of the Earth Volume: the amount of space that a substance or object occupies, or that is enclosed within a container