PHYSICAL LIMNOLOGY OF SAGINAW BAY, LAKE … LIMNOLOGY OF SAGINAW BAY, LAKE HURON ALFRED M. BEETON U....
61
Transcript of PHYSICAL LIMNOLOGY OF SAGINAW BAY, LAKE … LIMNOLOGY OF SAGINAW BAY, LAKE HURON ALFRED M. BEETON U....


PHYSICAL LIMNOLOGY OF SAGINAW BAY, LAKE HURON
ALFRED M. BEETONU. S. Bureau of Commercial Fisheries
Biological LaboratoryAnn Arbor, Michigan
STANFORD H. SMITHU. S. Bureau of Commercial Fisheries
Biological LaboratoryAnn Arbor, Michigan
and
FRANK H. HOOPERInsti tute for Fisheries Research
Michigan Department of ConservationAnn Arbor, Michigan
GREAT LAKES FISHERY COMMISSION1451 GREEN ROAD
ANN ARBOR, MICHIGAN
SEPTEMBER, 1967

PHYSICAL LIMNOLOGY OF SAGINAW BAY, LAKE HURON1
Alfred M. Beeton, 2 Stanford H. Smith,and Frank F. Hooper3
ABSTRACT
Water temperature and the distribution of various chemicals measuredduring surveys from June 7 to October 30, 1956, reflect a highly variableand rapidly changing circulation in Saginaw Bay, Lake Huron. The circula-tion is influenced strongly by local winds and by the stronger circulationof Lake Huron which frequently causes injections of lake water to the innerextremity of the bay. The circulation patterns determined at six timesduring 1956 reflect the general characteristics of a marine estuary of thenorthern hemisphere. The prevailing circulation was counterclockwise; thehigher concentrations of solutes from the Saginaw River tended to flow andenter Lake Huron along the south shore; water from Lake Huron entered thenortheast section of the bay and had a dominant influence on the water alongthe north shore of the bay.
The concentrations of major ions varied little with depth, but a decreasefrom the inner bay toward Lake Huron reflected the dilution of Saginaw Riverwater as it moved out of the bay. Concentrations in the outer bay were notmuch greater than in Lake Huronproper. The proportions of various cationsand anions were similar to the average proportions for the freshwaters ofthe world.
The average flushing time was 186 days, but was 113 days during theperiod of peak river discharge. The lakeward transport of Saginaw Riverwater ranged from 619 to 2,294 feet per day in the inner bay to 1,410 to3,000 feet per day in the outer bay on June 7 and October 30, respectively.
1 Contribution No. 358, Ann Arbor Biological Laboratory, U.S. Bureauof Commercial Fisheries.
2 Present address: Center for Great Lakes Studies, University of Wis-consin-Milwaukee, Milwaukee, Wisconsin.
3 Present address: Department of Wildlife and Fisheries, University ofMichigan, Ann Arbor, Michigan.
1

Introduction
Bays a re among the mos t p roduc t ive environments of theGrea t Lakes . They were the first areas of the Great Lakes af-fected by human activities that altered their productivity and use-fulness as a natural resource (Smith and Snell, 1891). The seriousdecline in abundance of the more desirable commercial species offish in Saginaw Bay (Hile and Buettner, 1959) appears to be largelythe result of man’s activit ies.
Less i s known about the bays than about the Grea t Lakesproper, and techniques for studying them are poorly developed.This study of Saginaw Bay provided an opportunity to test techni-ques previously used to evaluate the circulation of marine estuariesby applying them to the study of water exchange of a freshwaterbay with the main body of the lake.
Growing concern over the decline of the more valuable fishspecies led to a cooperative l imnological survey of Saginaw Bayby the Michigan Department of Conservation and the U.S. Bureauof Commercial Fisheries in 1956. The bay supported a prosperousrecreational fishery and produced about 40% of the U.S. commercialcatch of Lake Huron although it constituted only 5% of its area.The catch of lake herring (Coregonus artedi), yellow perch (Percaflavescens), walleye (Stizostedion vitreum vitreum), and whitefish(Coregonus clupeaformis) in Saginaw Bay has fluctuated consider-ably (El-Zarka, 1959; Hile, 1954; Hile and Buettner , 1959) butclearly has declined in recent years.
Most of the early limnological studies of Saginaw Bay con-cerned the d i s t r ibu t ion of b r ine en te r ing the bay f rom the o i lfields and the chemical industry in the Saginaw Valley. The DowChemical Company, Midland, Michigan, has conducted some 30surveys of chloride concentrations in the bay since 1933. An in-tens ive s tudy of the d i s t r ibu t ion of ch lor ide was made by theMichigan Stream Control Commission from May 1, 1935, to July2, 1936 (Michigan Stream Control Commission, 1937). Recentstudies of water movements in the bay (Ayers, Anderson, Chandler,and Lauff, 1956; Beeton, 1958; Johnson, 1958) suggested that thecirculation was similar to that of a marine estuary.
Data collected in the cooperative study by the Bureau and theDepartment, and independently by the Dow Chemical Company in1956 , a re ana lyzed in th i s r epor t to (1 ) ex tend in fo rmat ion onphysical and chemical conditions in Saginaw Bay, (2) investigatethe relat ionship between air and water temperatures, and (3) de-te rmine the app l icab i l i ty in f resh wate r o f t echn iques used toevaluate circulation in marine estuaries.
2

Morphometry
Saginaw Bay is a large identation on the west shore of LakeHuron 26 mi les (42 km) wide a t the mouth be tween Po in t AuxBarques and Au Sable Point, and 51 miles (82 km) long from themidpoint of a line between these points to the mouth of the SaginawRiver (Fig. 1). The bay narrows to a width of 13 miles (21 km)between Point Lookout on the west shore and Sand Point on thee a s t s h o r e . A broad shoal at this constrict ion (between CharityIsland and Sand Point) effectively divides the bay into outer andinner zones. The total area of 1,143 square miles (2,960 km2)is divided about equally between the two zones, but the outer zoneis considerably deeper (mean depth 48 feet [ 15.6 m], maximum133 feet [ 40.5 m] ) than the inner zone (mean depth 15 feet [ 4.6 m],maximum 46 feet [ 14.0 m 1) and contains about 70% of the totalvolume of the bay. The volume of water above the 18-foot (5.5 m)contour is only 32% for the outer bay, but 80% for the inner zone.
The east shore of the outer bay is rocky; the west shore hasextensive sandy areas, although some rock and clay occur nearPoint Lookout. The shoal around Charity Island and most of thepo in t s in the ou te r bay a re rocky . Tawas Po in t and Sand Poin tare sand spits .
The inner bay has ex tens ive sha l lows . A broad sandy f la textends southward from Wildfowl Bay. Another i r r egu la r sandyflat extends from the Saginaw River along the west shore to Pointau Gres . Severa l sha l low sp i t s o f f the mouths o f smal l r ive rsextend over this f lat perpendicular to the shore. The two largeflats have extensive marshes near shore. Coryeon Reef is a sandand gravel bar between the shore southeast of the Saginaw Riverand the Charity Islands. Its ridge is about 6 feet (1.8 m) belowthe surface and it is separated over most of i ts length from thesandy flat near shore by water deeper than 12 feet (3.7 m).
The bay has severa l i s l ands , the most prominent of whichis Char i ty I s land . A group of marshy low- ly ing i s lands (Nor th ,Stony, and Katechay) lies southwest of Sand Point. These islandsare surrounded by marshy shallows from which there is no clearline of demarcation.
Collection of Data
Three synopt ic su rveys were made by the research vesse l sCisco, Musky I (Bureau of Commercial Fisheries), and the patrolboat PB3 (Michigan Department of Conservation) on June 7, Au-gust 10, and October 30, 1956. Each vessel made two transectsacross the bay during each survey. The Musky I made the inner-most transects, the PB3 the middle transects, and the Cisco the
3
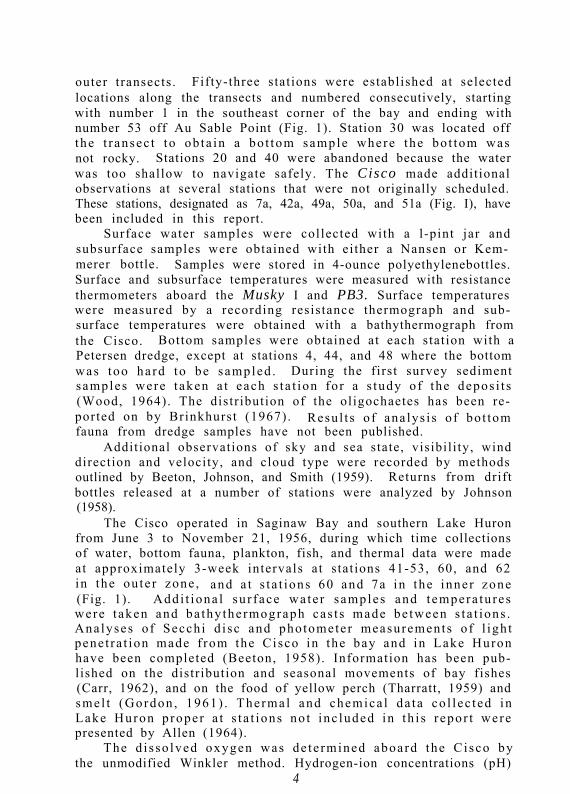
outer transects. Fifty-three stations were established at selectedlocations along the transects and numbered consecutively, startingwith number 1 in the southeast corner of the bay and ending withnumber 53 off Au Sable Point (Fig. 1). Station 30 was located offthe t r ansec t to ob ta in a bo t tom sample where the bo t tom wasnot rocky. Stations 20 and 40 were abandoned because the waterwas too shallow to navigate safely. The Cisco made additionalobservations at several stations that were not originally scheduled.These stations, designated as 7a, 42a, 49a, 50a, and 51a (Fig. I), havebeen included in this report.
Surface water samples were collected with a l-pint jar andsubsurface samples were obtained with either a Nansen or Kem-merer bottle. Samples were stored in 4-ounce polyethylenebottles.Surface and subsurface temperatures were measured with resistancethermometers aboard the Musky I and PB3. Surface temperatureswere measured by a recording resistance thermograph and sub-surface temperatures were obtained with a bathythermograph fromthe Cisco. Bottom samples were obtained at each station with aPetersen dredge, except at stations 4, 44, and 48 where the bottomwas too ha rd to be sampled . During the first survey sedimentsamples were t aken a t each s ta t ion fo r a s tudy of the depos i t s(Wood, 1964). The distr ibution of the oligochaetes has been re-ported on by Brinkhurst (1967). Resul t s of ana lys is of bo t tomfauna from dredge samples have not been published.
Additional observations of sky and sea state, visibili ty, winddirection and velocity, and cloud type were recorded by methodsoutlined by Beeton, Johnson, and Smith (1959). Returns from driftbottles released at a number of stations were analyzed by Johnson(1958).
The Cisco operated in Saginaw Bay and southern Lake Huronfrom June 3 to November 21, 1956, during which time collectionsof water, bottom fauna, plankton, fish, and thermal data were madeat approximately 3-week intervals at s tat ions 41-53, 60, and 62in the ou te r zone , and a t s t a t ions 60 and 7a in the inner zone(Fig. 1). Addi t iona l su r face wa te r samples and t empera tu reswere t aken and ba thy thermograph cas t s made be tween s ta t ions .Analyses o f Secchi d i sc and photometer measurements o f l igh tpene t ra t ion made f rom the Cisco in the bay and in Lake Huronhave been completed (Beeton, 1958). Information has been pub-lished on the distribution and seasonal movements of bay fishes(Carr, 1962), and on the food of yellow perch (Tharratt, 1959) andsmel t (Gordon , 1961) . Thermal and chemica l da ta co l l ec ted inLake Huron p roper a t s t a t ions no t inc luded in th i s r epor t werepresented by Allen (1964).
The d i s so lved oxygen was de te rmined aboard the Cisco bythe unmodified Winkler method. Hydrogen-ion concentrations (pH)
4

Figure 1. Map of Saginaw Bay showing depth contours and station loca-tions. [Lines A-B, C-D, and E-F indicate transects used forcalculations of flushing rates and lakeward transport. Line
C-D divides the bay into inner and outer zones, as used in thispaper .]
5
were de te rmined wi th a He l l ige co lo r compara to r . A l l o t h e rchemica l ana lyses were made in the Ann Arbor l abora to r ies o fthe Michigan Department of Conservation and the Bureau of Com-merc ia l F i sher ies
The Dow Chemical Company used one vessel for three surveysin 1956 (June 21-22, July 20-21, August 24-25). Approximately200 measurements o f spec i f i c conduc tance were made on eachsurvey with a conductivity cell towed behind the vessel. Watersamples were co l l ec ted a t 12-14 loca t ions fo r ana lys i s in the i rlaboratory.
Laboratory Analyses
Data of the Bureau of Commercial Fisheries and Michigan Depart-ment of Conservation
Calcium, magnesium, and potassium determinations were madewith a model DU Beckman spectrophotometer with flame photometerattachment. Sulfate was determined turbidimetrically after preci-pitat ion with barium (American Public Health Association, 1946)and total phosphorus was measured colorimetrically by the am-monium molybdate method (Ellis, Westfall, and Ellis, 1948). Totalalkalinity was determined as methyl orange alkalinity expressed asparts per mill ion (ppm) of calcium carbonate (American PublicHealth Association, 1946). Alkalinity is used as a general term inthis report, since it cannot be assumed that bicarbonate, carbonate,and hydroxide are the only ions involved in the alkalinity titration.It can be assumed, however, that most of the alkalinity was due tobicarbonate ions, since the pH of the bay ranged from 7.8 to 8.4and the presence of sufficient hydroxide ions in natural waters toaffect alkalinity is considered rare (Hem, 1959). Specific conduct-ance was measured in the laboratory with an Industrial InstrumentsModel RC-16b-1 conductivity bridge and is given in mhos/cm x 106
at 18° C (~18 x 106).
Data of the Dow Chemical CompanyVersena te t i t r a t ion was used to de te rmine to ta l ha rdness .
Chloride was measured by Volhard t i tration. The barium turbi-dometric method was used for sulfate determinations.
The relation between chloride content and specific conductanceof water samples analyzed in the laboratory was used to estimatechloride content from conductivity measurements made on the vessel.
6

Physical-Chemical Characterist ics
Thermal conditions in the inner bayWater of the inner bay had warmed considerably before the
first survey on June 7. Surface temperatures ranged from 15 to20° C (Fig. 2). The shallow littoral water along the west and eastshores was warmer than the res t o f the bay . A tongue of th i swarm wate r (20° C) ex tended ou t f rom the eas t shore in to theopen water of the lower bay. This water probably had been warmedin the extensive shallows along the east shore.
Subsurface temperatures at station 60 show that waters in thedeepest part of the inner bay warmed rapidly during June (Fig. 3).By June 20 the difference was only 0.1° C between the surface and4 meters, and 3.9° C between the surface and 9 meters (AppendixTable A- 1). Warming of the deeper water continued and the inner baywas homothermous by July 22.
The water of the inner bay continued to warm into August (sta-t ions 7a and 60) and surface temperatures ranged from 22 to 24°C during the August 10 survey (Fig. 2). The warmest water wasin the shallow littoral areas. The progression of warming in sur-face water was closely similar at stations 7a and 60 (Fig. 3), al-though these s t a t ions a re 15 mi les (24 km) apar t . The su r facetemperatures at stat ion 7a were 1 to 1.5° C higher than those ats ta t ion 60 in June and Ju ly . This difference could be due to afaster warming of the shallow waters at station 7a or because ofthe penetration of cooler outer bay water into the inner bay tostat ion 60. Di f fe rences in t empera tu res a t these s t a t ions wereminor after August 1; highest temperatures were on August 12-22.5° C at station 7a and 22° C at station 60.
The inner bay started to cool in late August and cooled rapidlyduring September. The ra te o f t empera tu re dec l ine dec reasedthrough October, but increased sharply in November. Except duringthe first week of September at station 60, homothermous conditionsprevailed throughout the inner bay during most of this period ofcooling. Evidently cooling progressed uniformly throughout theinner bay and by the October 30 survey temperature differenceswere less than 1 o C (Fig. 2) .
Thermal conditions in the outer baySur face t empera tu res ranged f rom 9 to 17° C a t the t ime
of the June 7 survey (Fig. 2). The 9 and 10o C isotherms at themouth of the bay indicate intrusions of open-lake water. The outerbay warmed rapidly during June except for the deeper water atstation 62 (Fig. 3). Temperature of the deeper waters at the baymouth were probably influenced by Lake Huron. Station 61 appeared
7


Figure 2. Surface temperatures (°C) of Saginaw Bay during synoptic cruises on June 7, August 10, and October30, 1956.

Figure 3. Air, surface, and subsurface temperatures for four locationsin Saginaw Bay. Stations 7a and 60 are in the inner bay, andstations 61 and 62 in the outer bay. See Figure 1 for locationof stations. [ Moving averages of air temperatures for stations7a and 60 are from Bay City, those for stations 61 and 62are from East Tawas. Occasionally measurements were madeat depths not shown-see Appendix Table A-l.]

to be in a zone where inner and ou te r bay wate rs mixed . Thewide fluctuations in temperature at 14 meters at this station un-doubtedly reflect intrusions of water masses from the open lake.
Warming to a dep th o f 5 mete r s p rogressed rap id ly in theou te r bay as i t d id in the inner bay , bu t su r face t empera tu resremained about 3° C lower at station 61 and 4° C lower at station62 than in the inner bay. Some warming at 30 meters occurredat stat ion 62 by early August, but open-lake water at 30 metersdid not warm until the 1st week of October (Allen, 1964).
Sur face t empera tu res r anged f rom 18 to 23° C dur ing theAugust 10 survey (Fig. 2). The warmest surface water was alongthe east shore and a tongue of cooler lake water penetrated theouter bay near Tawas Point.
The cooling trend that started in mid-August in the inner baydid not begin until September in the outer bay. Thermal stratifi-cation had disappeared at stat ion 61 by August 22 and the waterwas homothermous throughout the fall (Fig. 3). Cooling progressedsomewhat more slowly at station 62. The water was homothermousby early October and water at 30 meters attained its highest tem-perature (13.20 C, Appendix Table A-l) on October 5.
Surface temperatures varied little from 11° C throughout Sagi-naw Bay during the October 30 survey (Fig. 2). A small mass of12° C water occurred near shore north of Tawas Point, and 10o Cwater occupied most of the eastern half of the outer bay.
Relation between air and water temperaturesVarious attempts have been made to establish the relation be-
tween air and water temperatures because of the importance ofthermal conditions to biological phenomena, and the general avail-abili ty of records of air temperature where those of water tem-peratures are not available. Attempts to establish a relationshipfor day-to-day changes have not been successful. One such studywas made on Saginaw Bay in 1904 (Cooper, 1905). Methods basedon monthly mean temperatures have been used successfully on SouthBay, Lake Huron (McCombie, 1959), and for Lake Erie (Doan, 1942).
Sufficient water temperatures were collected during this studyto determine their relat ionship to air temperatures. The 10-daymoving averages of the mean daily air temperature from Bay Cityshowed the closest agreement with trends in water temperaturesin the inner bay (Fig. 3, stations 7a and 60). Extreme fluctuationsin air temperatures were not smoothed out sufficiently by 5-daymoving averages to be representative of water temperatures, and14-day moving averages did not differ appreciably from the 10-dayvalues. Tempera tu res f rom Fl in t and Sag inaw (no t i l lus t ra ted)were usually lower than the surface water temperatures in July
11

and August , but water temperatures at stat ions 7a and 60 closelyagreed with the 10-day moving averages of Bay City air tempera-tures for Ju ly and Augus t . Ai r t empera tu res were abou t lo Clower than wa te r t empera tu res in Sep tember . More un i fo rm a i rtemperatures in October coincided with the reduced rate of coolingof the wate r . The g rea tes t d i sc repancy be tween a i r and wate rtemperatures occurred during the first 2 weeks of June when airtemperatures increased rapidly.
Moving averages for 21 days of daily mean air temperaturesfrom East Tawas agreed well with trends in surface water temp-eratures in the outer bay (Fig. 3, s tat ions 61 and 62). The 10-day moving averages of air temperatures fluctuated too widely tobe representative of the water temperature. Water temperaturesto a depth of 5 meters coincided closely with air temperature fromthe 2nd week of July until mid-September at station 61; the dis-crepancies were greatest in late June and between mid-Septemberand early October. The trend in surface water temperatures atstation 62 was closely similar to that of the 21-day moving averagesof air temperatures, al though air and water temperatures usuallydiffered by 1° C.
Dissolved oxygenDisso lved oxygen was measured a t f ive s ta t ions (Appendix
Table A-l). Station 60 in the inner bay and 61 in the outer bay are usedto illustrate changes in the amount of dissolved oxygen in theseareasduring June-November, since these stations were visited more fre-quently than the others.
Changes in dissolved oxygen at station 60 were apparently re-lated to wind and temperature (Fig. 4). Dissolved oxygen contento f su r face wa te r dec reased 1 .3 ppm dur ing the pe r iod o f sub-stantial warming in June (Fig. 3). The greatest difference (1.8 ppm)between the surface and 10 meters occurred in the calm period whenthe samples were taken, on June 10 (Fig. 4). The lowest percentageof saturation (66%) occurred on June 20 at 9 meters, after thisper iod of ca lm. The marked increase in d i sso lved oxygen onJuly 1 followed a period of higher wind velocities. Differencesbetween surface and subsurface dissolved oxygen were slight overthe remainder o f the summer when the wate rs were near ly ho-mothermous. A per iod of re la t ive ly ca lm weather in the la t t e rpart of August preceded the low dissolved oxygen concentrationin the deeper water on September 1. Dissolved oxygen increasedslightly at all depths as the water cooled and winds became strongerin September, October, and November. Despite this increase, thepercentage saturation decreased in the fall as temperature declined.
12

Figure 4. Dissolved oxygen concentrations at two stations in SaginawBay and average daily wind velocity for 3-day intervals atEast Tawas. 1956.
Changes in dissolved oxygen at the surface in the outer bayat stat ion 61 were similar to those described for stat ion 60, al-though concentrations were usually 1 ppm greater (Fig. 4). Thedisso lved oxygen in the bo t tom wate r (14 mete rs ) was usua l lygreater than at the surface and greater than in the bottom watera t s t a t ion 60 . This situation undoubtedly resulted from invasionof colder bottom water that originated farther out in the bay orfrom the lake proper, since the dissolved oxygen values and temp-eratures frequently corresponded to those observed at stat ions 62(Appendix Table A-l) or 63 (Allen 1964, 28 miles [45 km] east ofs t a t ion 62) a t comparab le dep ths . In t rus ions o f l ake wa te r in tothis area also would contribute to the fluctuations in temperature(Fig. 3) and dissolved oxygen concentrations (Fig.4).
Hydrogen-ion concentrationChanges in pH of the surface waters followed the same trend
in all areas of the bay. The pH increased from ‘7.9-8.1 in earlyJune to a high of 8.4 in July, then decreased more gradually tolower values in late October and early November (Appendix TableA-l). A similar increase in July and decrease in October and Nov-ember occurred in the bottom waters at the shallow stations 42, 45,60, and 61, but the pH showed no trends in the deeper water atstation 62 during June-October.
Fluctuations of pH were pronounced at station 62 at the mouthof the bay. The pH of surface water increased to 8.3 in July,dropped to 7.9 in early August, and increased again to 8.2 in lateAugust. The pH of bottom water ranged from 7.6 to 8.0. Changesat this station probably reflected movement of Lake Huron waterinto and out of the area, since the lower pH values were similarto those of Lake Huron water (Allen, 1964).
Distribution of major constituents of Saginaw Bay and RiverThe chemical characterist ics of Saginaw River water varied
cons iderab ly due to h igh bu t vary ing concent ra t ions of sa l t s inbr ine was te d i scharged to the r ive r (Mich igan S t ream Cont ro lCommission, 1937). DOW Chemical Company’s analyses of SaginawRiver water during May, June, and July, 1956, show that concen-trat ions of chloride (as NaCl) ranged from 64 to 614 ppm, totalalkalinity (as CaC03) from 123 to 187 ppm, sulfate from 70 to115 ppm, and total hardness (as CaC03) from 168 to 434 ppm.These values followed no seasonal trend since discharge of wastebrine into the river from storage ponds for chemical wastes wasi r r egu la r . For example, the chloride content of river water was:614 ppm on June 13, 1956; 421 ppm on June 20; 199 ppm on June27; 374 ppm on July 11; 608 ppm on Ju ly 18; and 404 on July 25.
14
Changes in concentrations of the major ions with depth in thebay were much less than differences in surface concentration atvarious locations (Appendix Tables A-2, A-3, and A-4). Differencesin ion content between surface and subsurface waters were ordinarily1 ppm or less and were within the range of the reliability of themethods of ana lys is . Concentrations of some ions were higherat the surface than near the bottom, and others were lower at thesurface. It appears, however, that in the outer bay the ion contentwas slightly lower near the bottom than near the surface,
Of the cations in the inner bay water, calcium was highest,magnes ium ranked second , sod ium th i rd , and po tass ium four th(Table 1). Total cation concentrations were very high in June (4.44epm), were somewhat less in August , and decreased to 3.27 epmin October. Changes in the total cation concentrations were pri-marily due to changes in amounts of calcium. These values weremuch greater than for the average freshwater of the world (Table1).
Concentrations of all ions were considerably lower in the outerbay (Table 2 ) , where they were no t much h igher than in LakeHuron proper (Allen, 1964). The proportions of the various cationsand anions were similar to the average proportions for freshwatersof the world, except for chloride (Gorham, 1957). Chlor ide , a l -though not high, differed from the world average in that it exceededsulfate.
The dilution of Saginaw River water as it moved through thebay is shown by a decrease of average concentrations of the majorions and specific conductance from the inner bay to the outer bay(Tables 1 and 2). Near the river mouth the specific conductancewas 800pmhos and the total cation concentration was 6.03 epm onJune 7, when conductivity was 206 pmhos and cation concentrationwas 2.01 epm at the mouth of the bay. The small change in theratio between total cations and specific conductance throughout thebay il lustrates the uniform dilution of river water (Fig. 5). Thedilution of the Saginaw River water from the river mouth to thebay mouth must have been due to inflow from Lake Huron, sincethe discharge from other tr ibutaries was minor (Appendix TableA-5). Lake Huron water had an average conductivity of 174 pmhosand an average cation content of 1.98 epm.
Distribution of chemical constituentsCloses t agreement in the d i s t r ibu t ion o f va r ious chemica l s
measured during the synoptic surveys was among sodium, calcium,sulfate, and conductivity, and least agreement was between theseand distributions of potassium, magnesium, phosphorus, and totalalkalinity. Some of the d i f fe rences in d i s t r ibu t ions may re f lec t
15

Table 1. Average chemical characterist ics of water samples taken in the inner area(inside line A-B, Fig. 1), of Saginaw Bay in 1956
Date
Cations AnionsTotal Specific
Calcium Magnesium Potassium Sodium cations Bicarbonate ’ Chloride Phosphorus Sulfateconductance
( p p m ) ( p p m ) kwd (Ppm) (epm) bpm) bm-4 bid (p p m) bmhos 18°C)
June 7 55 11.2 3.6 15.8 4.44 155 - 0.045 29 553
June 22 - 57.5
Aug. 10 45 10.6 3.0 16.2 3.90 139 - 0.037 22 463
Aug. 25 - 61.4
G Oct. 30 39 9.4 2.0 11.6 3.27 135 - 0.042 16 391
A v e r a g e 4 6 10.4 2.9 14.5 3.87 143 59.5 0.041 22 469
Average 2 .31 0.86 0.07 0.63 3.87 2.34 1.68 0.46 -expressedas epm
W o r l d 1 . 4 9 0.42 0.08 0.36 2.35 1.71 0.23 0.37 -averagefreshwatera s epm2
1 Determined from total alkalinity measurements.2 Gorham, 1957.

Table 2. Average chemical characterist ics of water samples taken in the outer area(between lines A-B and E-F, Fig. 1), of Saginaw Bay in 1956
Date
Cations AnionsTotal
Specific
Calcium Magnesium Potassium Sodium cations Bicarbonate1 Chloride Phosphorus Sulfateconductance
(w-4 b-4 (m-4 bpm) ( e p m ) bw-4 (ppm) hwm)(ppm) @mhos 18°C)
June 7 31
June 22 -
Aug. 10 29
Aug. 25 -
2 Oct. 30 27
Average 29
Average 1.45expressedas epm
World 1.49averagefreshwatera s epma
8.1 1.5 4.3
7.5 1.2 3.6
7.9 1.0 2.9
7.8 1.2 3.6
0.64 0.03 0.16
0.42 0.08 0.36 2.35 1.71 0.23 - 0.37 -
2.44 117 0.013 12 270
13.6 -
2.25 123 0.024 12 253
8.4 -
2.15 113 0.016 10 237
2.28 118 11.0 0.018 11 253
2.28 1.93 0.31 - 0.23 -
1 Determined from total alkalinity measurements.2 Gorham, 1957.
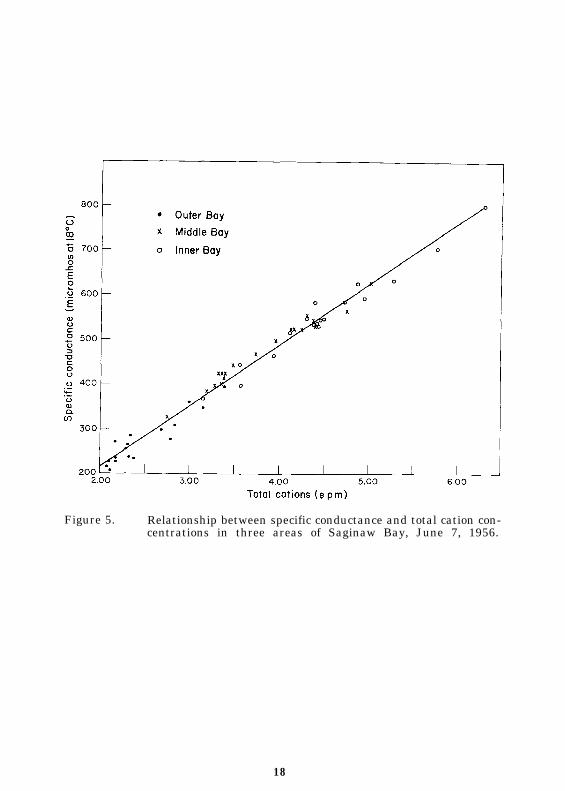
Figure 5. Relationship between specific conductance and total cation con-centrations in three areas of Saginaw Bay, June 7, 1956.
18
the accuracy of chemical analyses or subjective contouring. Con-sequently, emphasis has been placed on major patterns in the dis-tributions and not on minor details.
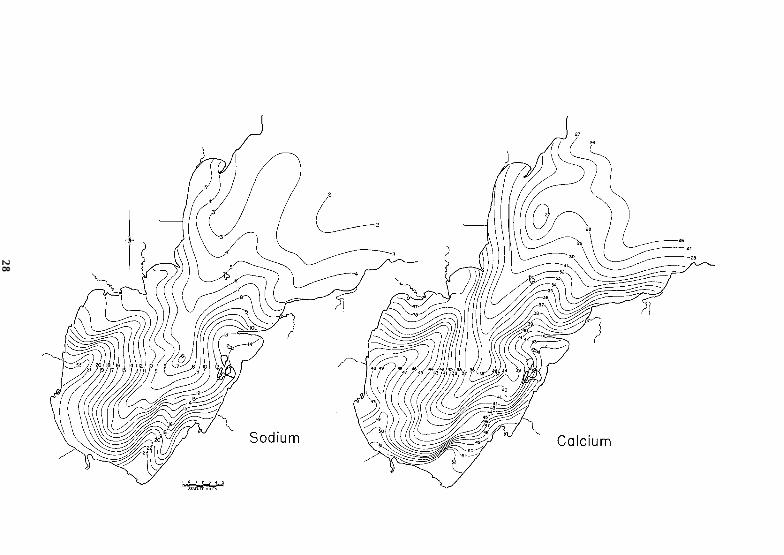
Synoptic survey I, June 7. - Water with a high sodium contentextended along Coryeon Reef from the Saginaw River mouth (26ppm) to the vicinity of Sand Point (15 ppm, Fig. 6). Part of thiswater mass extended well beyond Sand Point to Flat Rock Point, butdilution was considerable in the outer bay and the sodium contenthad decreased to 6 ppm at Flat Rock Point. Some of the waterwith high sodium content extended north to Point Lookout and intothe outer bay . Water low in sodium occupied much of the outerbay and extended into the inner bay near Charity Island. Sodiumconcentrations were relatively low in the inner bay along the north-west shore (9 ppm) and the southeast shore (12 ppm). This conditionmay have resulted from isolation of Lake Huron water that enteredthe bay earlier, or from dilution by the inflow from tributaries orsurface runoff. The survey was made shortly after the period ofmaximum d ischarge f rom t r ibu ta r ies tha t have a lower sod iumcontent than the inner bay (Appendix Table A-5).
The distributions of calcium, sulfate, conductivity, potassium,and magnesium were similar to that of sodium (Figs. 6 and 7).Values for all were relatively low along the northwest and south-eas t shore of the inner bay . The low concentrations of calciumand sulfate in the northwest area strengthen the assumption thatthese areas of dilution resulted from entrapment of Lake Huronwater . Although the Rifle River, which flows into the northwestarea, is low in calcium, its sulfate content is high (Appendix TableA-5). The dilutions in these areas reflect more closely the char-acterist ics of lake water.
The d i s t r ibu t ion of a lka l in i ty (F ig . 7 ) agreed g e n e r a l l y withthat of sodium. The highest alkalinity values were in areas af-fected by Saginaw River outflow and extended toward Sand Point.A pronounced deflection of this high alkalinity water toward thenorth shore was a major feature of the distribution. The mass o fwater of low alkalinity extending into the inner bay near CharityIsland, appeared to penetrate farther toward the southeast shorethan shown by other measures.
The d i s t r ibu t ion o f phosphorus showed the l eas t agreementwith the distribution of sodium, except for high concentrations inareas influenced by Saginaw River outflow (Fig. 7). Phosphorusconcentrat ions in this area were 70 parts per bi l l ion (ppb), buttwo-thirds of the bay had concentrations of 20 ppb or less. Thedecrease in phosphorus content of the water between the SaginawRiver mouth and Sand Po in t (72%) was g rea te r than fo r o the rmeasures . All of the other ions and conductivity decreased 35to 40%.
19

20

21


23

The distribution of the various constituents Suggests a deflec-tion of the Saginaw River outflow to the southeast as it entered thebay, and a flow of river water along the Coryeon Reef. The p re -dominant circulation was probably counterclockwise in the innerbay and some of the diluted river water was deflected toward PointLookout where it was influenced by a general counterclockwisec i rcu la t ion in the ou te r bay . The main out f low of r iver waterfrom the inner bay was probably around Sand Point where it wasdiluted as i t mixed with outer bay water. Lake Huron water wasdominant in the outer bay and was obviously flowing into the bayin the northern half of its mouth. The outflow from the bay throughthe southern half of the mouth would have consisted of a mixtureof l ake and bay wate r . These p roposed cu r ren t s ag ree c lose lywith current trajectories based on returns from drift bott les re-leased on June 7 and 10, 1956 (Johnson, 1958).
Distribution of chloride June 21-22. -The distribution of chlorideduring the survey by Dow Chemical Company on June 21-22 (Fig.8) was similar in several aspects to the distribution of other con-stituents on June 7 (Fig. 6 and 7). The high chloride concentrationnear shore in the southeast corner of the bay suggests a south-east deflection of Saginaw River water similar to that on June 7.A partly isolated mass of water high in chloride northeast of ther ive r mouth ind ica ted , however , tha t the r ive r wa te r mus t havebeen deflected northwestward sometime between June 7 and June21-22. A diluted mass of water high in chloride extended north-ward across the inner bay and into the outer bay, and low chloridewate r ex tended sou theas te r ly f rom the nor thwes t shore in to theinner bay. The difference in distribution of chloride on June 21-22 from the other ions on June 7 indicates a greater influx of lakewate r in to the inner bay had occur red , s ince d i lu t ion g rad ien t swere not great, except near the Saginaw River mouth. In the outerbay the greatest difference from the June 7 survey was the nor-therly extension (almost to Tawas Point) of water of high concen-t ra t ion f rom the inner bay; concen t ra t ions were h igher in thenorthern half of the bay mouth than in the southern half.
The distribution of chloride on June 21-22 indicates that cir-culation had changed since the June 7 survey. Circulation in theinner bay may have shifted from counterclockwise on June 7 toclockwise and back to counterclockwise in response to winds thatwere from the southwest shortly after June 7 but shifted abruptlyto the northeast during June 15-18 (Johnson, 1958). The protru-sion of inner bay water between Point Lookout and Charity Islandinto the outer bay and the occurrence of water with a low chlorideContent in the southern part of the bay mouth suggest a clockwisec i rcu la t ion in the ou te r bay . Lake Huron wa te r was p robab ly
24

entering the mouth of the bay along the southern shore and innerbay water was probably flowing into the lake along the northwestshore of the outer bay.
Recoveries of drift bott les released on June 20 and 21 offeradditional evidence for a clockwise circulation in the outer bay(Johnson, 1958). Mos t o f the bo t t l e s re leased 5 mi les (8 km)southwest of Tawas Point moved northeasterly and were recoveredalong Tawas Point; recoveries of bott les released elsewhere alsosuggest a clockwise circulation.
Distribution of chloride July 20-21. --High chloride concentra-tion on July 20-21 extended from the mouth of the Saginaw Riveralong the southeast shore of the bay to Sand Point as on June 21-22,but the high chloride water from the inner bay protruded into theouter bay around Charity Island instead of between Point Lookoutand the i s l and (F ig . 8 ) . An i so la ted mass of wate r wi th h ighchloride content north of the river was similar to that of June 21-22. The low chloride water from the lake entered the bay betweenPoint Lookout and Charity Island and extended almost 20 miles(32 km) southward into the southern corner of the bay. Chlorideconcentrations were not low enough to draw the 7 ppm isopleth inthe outer bay . Water with the lowest chloride content occurredalong the north and south shores of the outer bay.
The high chloride water along the west shore as well as thesoutheas t shore o f the inner bay and the i so la ted a rea of h ighchloride northwest of the Saginaw River provide additional evidenceof frequently shifting circulation in the bay. The direction of cir-culation in the inner bay must have changed at least twice sincethe June 21-22 survey. The intrusion of low chloride water intothe inner bay between Point Lookout and Charity Island suggestsa counterclockwise circulation in the outer bay that brought LakeHuron water into the bay shortly before the July 20-21 survey.Recoveries of drift bottles released on July 12, indicated a counter-clockwise circulation in the outer bay (Johnson, 1958); winds werepredominantly from the southwest during July 7-14.
Synoptic survey II, August 10.- Water of high sodium contentextended from the Saginaw River mouth along both the southeastand northwest shores of the inner bay on August 10 (Fig. 9). Thedistribution of this water along the southeast shore was similar tothat in June (Fig. 6), although the sodium content was less andthe wate r mass d id no t ex tend as fa r beyond Sand Poin t . Thepresence of a large mass of high sodium water to the north of theriver mouth on August 10 was a major difference between the dis-tribution of sodium in June and August. This water mass occupiedmuch of the a rea where the sod ium conten t was low a long the
25

26

27
28


northwest shore in June. Low sodium water which extended intothe inner bay east of Charity Island in June was west of the islandin August and had penetrated much farther into the inner bay; the7 ppm isopleth extended about 12 miles (19.3 km) farther into theinner bay. Only one small area of the outer bay, between SandPoint and Charity Island, had sodium concentrations greater than5 ppm. Sodium concentrations were lower on August 10 than onJune 7 throughout the outer bay. Concentrations of sodium werelowest in the southern half of the bay mouth.
Distributions of calcium, sulfate, and conductivity were similarto that of sodium (Fig. 9). Slight differences in the distributionof sodium compared to calcium and sulfate appeared in the vicinityof the Au Gres and Rifle Rivers. The slightly lower calcium con-tent near the mouth of the Rifle River may represent dilution byriver water of a lower calcium content. Sulfate concentrations wereslightly higher near the mouth of the Au Gres River which has ahigher sulfate content than adjacent streams (Appendix Table A-5).Sulfate content of bay water west of the Rifle River mouth was lowerthan in any of the rivers analyzed. Other r ivers entering the bayhave such low discharges, especially during August, that they prob-ably have little influence on the ion content of bay water.
The distribution of alkalinity, magnesium, phosphorus, and po-tassium (Fig. 10) agreed less well with sodium. Highest concen-t ra t ions were nor th and eas t o f the Sag inaw River mouth . Thehigher magnesium values of the inner bay and the low magnesiumconcentrations at the bay mouth corresponded with sodium. Otherfeatures of the magnesium distribution were not like those of sodium.Penetration of low magnesium water into the bay was not clearlyindicated as with sodium, Alkalinity was high at the mouth of theSaginaw River and in the southern corner of the bay, but high valuesdid not extend to the north and northeast as did those of sodium.Water of low alkalinity occurred throughout the outer bay and atongue of low alkalinity water penetrated the inner bay west ofCharity Island; but unlike sodium, this intrusion extended southwardto Katechay and Stony Islands.
Concentrations of phosphorus were high on both sides of theriver mouth and along the southeast shore to Sand Point; phos-phorus content was low in the outer bay. Low phosphorus waterextended through the middle of the outer bay and into the centerof the inner bay ins tead of pene t ra t ing the inner bay wes t o fChar i ty I s land as for mos t ions inc lud ing sodium. Water a longboth shores of the outer bay had high phosphorus concentrations.The highest concentration (70 ppb) was in Tawas Bay near TawasCity. An isolated mass of water high in phosphorus appeared offPoint Au Gres.
30

Dis t r ibu t ion of po tass ium d i f fe red mos t f rom tha t o f o therions. Highes t concen t ra t ions were a t th ree i so la ted loca t ionswithin the inner bay: near the southeast shore, near the north-west shore, and near the middle of the bay between Sand Point andPoint Lookout (Fig. 10). Except for a small area near Sand Pointinfluenced by outflow from the inner bay, potassium concentrationsin the outer bay did not exceed 1.5 ppm.
The two masses of water of high ion content along the northand southeast shore on both sides of the Saginaw River mouth sug-gest that the August 10 survey was made during a period whenthe current pattern of the bay was changing. A counterclockwisecirculation of the inner and outer zones, similar to the one des-cribed for the June 7 survey, appears to have been developing aftera period of clockwise circulation. The earlier clockwise move-ment is indicated by the high ion content of the water north of theriver mouth and by the low ion content of the water in the southhalf of the bay mouth. Clockwise movement within the inner bayseems to have moved river water along the northwest shore andaround Point Lookout into the outer bay. Winds from the north-eas t , eas t , and sou theas t f rom Ju ly 15 to Augus t 6 would havecreated such a circulation. The h igher ion concen t ra t ions andhigher conductivity of water in the southern corner and along thesoutheast shore, as well as the penetration of low ion water intothe inner bay on the west side of Charity Island, suggest a morerecent counterclockwise circulation. This movement was probablyestablished between August 6 and 10 by winds from the southwestand west. This current pattern agrees with the trajectories plottedfrom returns of drift bottles (Johnson, 1958).
Distribution of chloride August 24-25. - Water of high chloridecontent extended from the mouth of the Saginaw River to the south-eastern corner of the bay and northeastward toward Sand Pointalong the south side of Coryeon Reef (Fig. 8). Chloride contentwas high around Sand Point and along the southeast shore of theouter bay. An isolated mass of water of high chloride content oc-curred along the west shore of the inner bay. Low chloride con-centrations (40-50 ppm) near the mouth of the Kawkawlin River mayrepresent the outflow of this river (Appendix Table A-4), Most ofthe outer bay had low chloride concentrations-7 ppm or less. Atongue of low chloride water extended almost 20 miles (32 km) intothe inner bay between Point Lookout and Charity Island.
The deflection of Saginaw River water to the right as it enteredthe bay, the presence of water of high chloride content along thesoutheast shore, and the penetration of outer bay water into theinner bay be tween Poin t Lookout and Char i ty I s land ind ica te acounterclockwise circulation. Lake Huron water apparently was
31

32

33

moving into the bay along the northwest shore and occupied mostof the bay mouth.
Recoveries of drift bottles released on August 22 also suggesta counterclockwise circulation (Johnson, 1958). Between August 6and 26 winds were from the northwest, west, and southwest.
Synoptic Survey III, October 30. - The distribution of sodiumduring the October 30 survey (Fig. 11) was similar to the sodiumdistribution on August 10 (Fig. 9). Water with a high sodium con-tent extended from the Saginaw River mouth along the southeastand northwest shores of the inner bay. Low sodium water occupiedthe cen te r o f the bay be tween these masses . The h igh sod iumwater along the southeast shore continued around Sand Point intothe outer bay . Sodium concentrations were low off the mouth ofthe Ri f le River . The southern half of the outer bay had sodiumconcentrat ions less than 3 ppm and the lowest (2 ppm) were atthe southernmost corner of the bay mouth. Sodium concentrationswere generally lower throughout the bay in October than in August.
The distributions of calcium, sulfate, and conductivity agreedmore c lose ly wi th tha t o f sod ium than dur ing the two prev ioussurveys (Figs. 6, 9, and 11). Conductivity showed a movement ofou te r bay wate r in to the inner bay be tween Char i ty I s land andPoint Lookout.
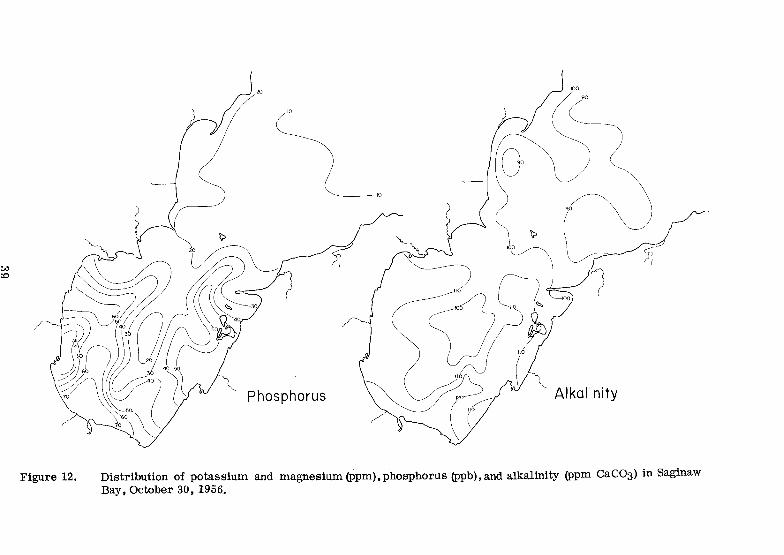
The distributions of alkalinity, magnesium, phosphorus, andpotass ium (F ig . 12) were s imi la r to tha t o f sod ium. Po tass iumand magnesium values in water near the Saginaw River were onlyslightly higher than concentrations at other points within the innerbay. Consequently, these ions did not show clearly the distributionof river water. An isolated mass of water with a high potassiumcontent occurred halfway between Sand Point and Point Lookout.Th is a rea had h igh concen t ra t ions o f po tass ium on June 7 andAugust 10. The d i s t r ibu t ion of a lka l in i ty in the inner bay wasv e r y s i m i l a r t o t h a t o f s o d i u m . Most o f the ou te r bay wate rshad alkalinity concentrations of less than 100 ppm; distributiondiffered somewhat from that of sodium.
The distribution of phosphorus differed strongly from that ofother propert ies . The Saginaw River outflow extended northwardas a tongue of high phosphorus water (Fig. 12). Water with highphosphorus con ten t a l so occur red a long the wes t and sou theas tshores of the inner bay, but this water appeared to be separatedfrom the river outflow by water with a lower phosphorus content.A distinct mass of water with low phosphorus lay along the westshore north of the mouth of the Saginaw River. Low phosphoruswater also occupied the center of the inner bay and continued tothe outer bay between Charity Island and Point Lookout-similarto the distribution of sodium, sulfate, and conductivity in that area.
34
The existence of two masses of water with high ion contentalong the west and southeast shores suggests that at the t ime ofthe October 30 survey the distribution of various properties in theinner bay was de te rmined by a s t rong in jec t ion of Lake Huronwater down the center of the inner bay from a point near CharityIsland. This intrusion effectively divided the inner bay water intomasses along the two shorelines. Clockwise and counterclockwisemovements resulting from wind stresses may have been superim-posed on this basic pattern.
Summary of the physical and chemical characteristics. -Com-parisons of the distribution charts indicate that from June throughOctober concentrations of all chemicals except phosphorus decreasedprogressively. Also, the sizes of areas of high concentration de-creased. Phosphorus concentrations were higher in June and Oc-tober than in August but water with high phosphorus content oc-cupied a greater area of the bay in August than in June or October.The distribution of phosphorus probably was determined in part bylocal conditions, especially biological activity.
The large mass of water of high ion content in June may re-flect the accumulation of Saginaw River water under the ice duringthe winter, when wind-induced circulation is minimal. This ac-cumulation of river water is well i l lustrated by the distributionof chlorides in early surveys of the Michigan Stream Control Com-mission (1937) which indicated a flow of river water under the icealong the bottom into the deeper part of the inner bay. The di-rection of this flow was northeasterly, along the west side of CoryeonReef. On the surveys of March 2-4 and 6-7, 1936, river water ap-peared as a mass of high chloride water (100-300 ppm), about 2to 3 miles (3.2 to 4.8 km) wide, which extended at least 20 miles(32 km) from the river mouth. Much higher chloride concentra-tions were detected throughout the inner bay in the spring of 1936after the ice had disappeared than in October of 1935.
Currents in the bay were strongly affected by winds. Johnson(1958) concluded from his analysis of drift bottle data: “I t appearstha t the dynamics of the bay a re c lose ly re la ted to the h ighlyvariable meteorological conditions of this area and that the surfacecurrents are in a continuous state of change. For this reason, wemust state specifically under what conditions any particular surface-current pattern was found.” Evidence from the present study andfrom earlier studies by the Michigan Stream Control Commission(1937) suggests that northeast, east, and southeast winds producea clockwise circulation, and west and southwest winds a counter-clockwise circulation.
Surveys by the Michigan Stream Control Commission in 1935and 1936 provide good examples of the circulation established by
35

36

Figure 11. Distribution of sodium, calcium and sulfate (ppm), and conductivity (Nmhos at 18° C) in Saginaw Bay,October 30, 1956.

38

different winds. W i n d s p r e d o m i n a n t l y f r o m t h e n o r t h e a s t o nMay 12-24, 1935, were followed by a pronounced clockwise circu-lation indicated by the results of the surveys on May 13-18 andMay 20-24, 1935. Saginaw River water extended from the rivermouth along the west and northwest shore of the inner bay andentered the outer bay between Point Lookout and Charity Island.Low chloride water of the outer bay protruded into the inner bayaround Sand Point and extended along the southeast shore. Windsfrom the north, northeast , and southeast during June 7-21, 1936,also produced a clockwise circulation as shown by the survey onJune 22-25. A counte rc lockwise c i rcu la t ion tha t resu l ted f romsouthwest and northwest winds during June 19-28, 1935, was evidentfrom the distribution of chlorides in the surveys of June 24-28and July l-4. Saginaw River water extended from the river mouthalong the southeast shore of the inner bay. Outer bay water pene-trated the inner bay between Point Lookout and Charity Island.Winds from the northwest October 18-31, 1935, and from the south-west May 17-27, 1936, also produced a counterclockwise circulationas shown by surveys of October 28-30, 1935, and May 25-27, 1936.
It appears that circulation of bay water can be changed fromclockwise to counterclockwise by a shift in wind direction in asshort a time as 4 days. The survey of August 10, 1956, suggeststhat a clockwise circulation existed earlier although counterclock-wise circulation was being established by August 10. Winds hadbeen f rom the nor theas t , eas t , and sou theas t Ju ly 15-Augus t 5 ,but had shifted to southwest and west August 6-10. Similar ex-amples can be found in data of the Michigan Stream Control Com-mission (1937); the chloride distribution during the survey of June10-14, 1935, suggests establishment of a counterclockwise circula-tion after an earlier period of clockwise circulation. Moderate tostrong winds were from the southwest and west June 2-8, 1935.
Although it seems clear that the local winds over Saginaw Bayhave a strong influence, the relationship of the circulation of thebay to the larger circulation of Lake Huron has not been explored.I t cannot be assumed tha t the l a rger and p resumably s t rongerinertial current system of Lake Huron does not at t imes upset OX-modi fy the loca l water movement of Saginaw Bay, par t icu la r lywhen bay currents are weak compared with currents of Lake Huron.This situation is suggested by occasional injections of lake waterinto the deeper portion of the inner bay through the deep channelbetween Point Lookout and Charity Island.
The evidence of deflection of the Saginaw River to the rightafter i t enters the bay in every period of this study reflects theeffect of the Cor io l i s in f luence on a r iver en te r ing an es tuary .The more usual occurrence of higher concentrations of the various
40
ions along the Coryeon Reef or the southeast shore of the innerbay and the south shore of the outer bay indicate clearly that theCoriolis force has a strong influence on the general circulation ofthe bay. The frequent modification of this influence by wind or in-jection of Lake Huron water which cause deflection and isolation ofriver water in various directions are major factors of mixing withinthe bay. The surveys show that the degree of mixing of SaginawRiver water is highly variable particularly in the outer bay whereit usually moves into Lake Huron along the south shore aroundPoint Aux Barques under the Coriolis influence of the open lake.
Litt le similarity existed between the distribution of tempera-tures (Fig. 2) and other water propert ies (Figs. 6-12) within theinner bay. The distribution of temperature was similar to otherproperties on June 7 and August 10 in the outer bay, when theouter bay water with i ts low ion content also had low tempera-tures and the warm water of the inner bay had a high ion content.By October 30, however, temperatures were too uniform throughoutthe bay for any similarity with the distribution of other propertiesto persist .
Exchange of Saginaw River and Lake Huron Watersin Saginaw Bay
Ci rcu la t ion in mar ine es tuar ies has been s tud ied f rom da taon the rate of inflow of freshwater and its distribution in the es-tuary. From these data estimates can be made of the net seawardtransport of river water, the time required for river water to movethrough the es tuary , and the magni tude of the counte r cur ren tmoving into the estuary (Ketchum, 1950, 1953). Low salinity orsome other characteristic of river water serves as a tracer. Con-sequently, i t is necessary to have reasonably accurate estimatesof the average concentration of the tracer to differentiate riverwater from sea water. This method assumes that without the riverinflow the embayment would have the same salinity as the open seaand that any decrease in salinity can be attributed to river water.
Synoptic surveys of the Saginaw Bay in 1956 provided informa-tion on the distribution of river water for estimates of flushingra te , l akeward t r anspor t o f r ive r wa te r , and exchange be tweenlake and river water. As in marine estuaries, the river water canbe used as a tracer, but the salinity relation is reversed; the waterof high salinity from the Saginaw River flows out of the bay andthe low salinity water from Lake Huron enters the bay. The situa-t i o n i n S a g i n a w B a y i s s o m e w h a t m o r e c o m p l e x t h a n t h a t i n t h emarine estuary because the salt content of the diluting water (LakeHuron), as well as that of the Saginaw Bay and River, must beconsidered. Furthermore the salt content and the volume of river
41

discharge varied seasonally. Desp i t e these compl ica t ions themethods used by Tully (1949), Ketchum (1950), and Ketchum, Red-field, and Ayers (1951) can be used to evaluate the circulation ofthis freshwater bay.
The average salt content of Saginaw Bay was much lower thanthe river, and was closer to that of Lake Huron. This conditionindicated that an appreciable exchange of Saginaw River and LakeHuron water must take place.
The volume of Saginaw River flow and its chemical contentvar ied th roughout the year . Although the discharge of the riverand its ion content appeared to vary inversely, this relationshipwas unpredictable. Chloride varied more than 200 ppm in a week.Consequently, records of salt content, as well as river flow, wererequired.
A gaging s ta t ion was no t main ta ined on the Saginaw Riverproper, but discharge records were available for al l of the maintr ibutaries. The flow of the Saginaw River, as used in this study,i s the combined f low of the Sh iawassee , Bad , F l in t , Cass , andTittabawassee Rivers. Data used were those recorded at Fergus,Brant, Fosters, Frankenmuth, and Midland, Michigan (U.S. Geolo-gical Survey, 1958, 1959). From these data the average daily dis-charge of the Saginaw River was calculated for the 30-day periodpreceding the 2nd day of each synoptic survey (Appendix Table A-6).The average daily flow before the first survey in June (993 millioncubic feet or 28 mill ion cubic meters) was 5 to 11 t imes higherthan in August or October. This greater discharge was due to thespring thaw and May rains. Stream flow declined from the end ofMay to October; the average daily flow before the third survey onOctober 30 was 86 million cubic feet (2.4 million m3). The annualaverage discharge was 292 million cubic feet (8.3 million m3) perday.
Fourteen small rivers and a number of creeks flow into Sagi-naw Bay, but most of the larger rivers, except for the Rifle andAu Gres, have a mean discharge of less than 60 cubic feet (1.7cubic meters) per second during most of the year. The combinedaverage daily flow of the Rifle, Au Gres, and Kawkawlin Riversfor the 30 days preceding the first survey, which included theirflood periods, was about 8% of the flow of the Saginaw River.These r ive rs have a lower ion con ten t than the Sag inaw River(Appendix Table A-5) and therefore have a diluting influence.
Sodium was selected as the best tracer for study of the dis-tribution of Saginaw River water in the bay, because i t is leastl ikely to be removed by chemical precipitation or by biologicaluptake. The concentration of sodium in the Saginaw River wasnot de te rmined dur ing our surveys and ev iden t ly had no t been
42

measured in the past. The chloride content of the river, however,had been determined routinely for many years by the Dow ChemicalCompany and data were available for a period preceding each sur-vey.
To determine the relationship between sodium and chloridefor the Saginaw River, the sodium content was measured for weeklywater samples from the Saginaw River from November 1959 toMarch 1960. These values were plotted against weekly chloridedeterminations made by the Dow Chemical Company over the sameperiod. The relationship was described by Na = 17.7 f 0.187 Cl.Subsequently the sodium concentrations of river water were cal-culated from the average chloride concentration measured by theDow Chemical Company for the 30-day period before each surveyof 1956. The average chloride ranged from 152 ppm before thefirst survey to 346 ppm before the third survey. Correspondingsodium values were 46 ppm and 82 ppm (Appendix Table A-6).
The average sod ium conten t o f the bay dur ing each surveywas es t ima ted by super impos ing a t r ansparen t p las t i c g r id oncharts4 on which isopleths of sodium were drawn. The grid con-sisted of l-inch squares (6.45 cm2); hence, each square representeda surface area unit of 100 x 106 square feet (9.29 x 10⁶ m2). Thevolume of each unit was determined by placing the grid on a chartof depth contours. Calculations were made of the quantity of sodiumwithin the volume of each unit for each of the three surveys. F r o mthese data water volumes, total sodium, and the average sodiumcontent (ppm) were calculated for each of three zones delineatedby the transects A-B, C-D, and E-F (Fig. 1). Zone 1 is closestto the Saginaw River mouth, zone 2 is the area that lies betweenl ines A-B and C-D, and zone 3 i s the ou te r bay . The a rea o fbay cross-sections at each transect and the corresponding averagesodium content of water across the transect were calculated alsofrom the values of grid units or fractions thereof bisected by thetransects (Table 3).
The proportion of Saginaw River water in any sample, watercolumn, or in the entire bay can be calculated from the averagesodium content. It can be assumed that Saginaw River and LakeHuron water were mixing in the bay during the surveys. Verticaldifferences in the distribution of the major ions were slight. Con-sequent ly , the sur face concent ra t ion of sod ium was cons ideredrepresentative of the sodium content of an entire water column.The volumes of river water (VT) and lake water (Vh) were derivedfrom the relationship:
4 These charts were drawn from Corps of Engineers, U.S. Army, LakeSurvey Chart No. 52, revised 1955; scale 1 inch = 10,000 feet.
43

where So is the observed sodium content, Sk the sodium contentof Lake Huron water, and S r the average concentration of sodiumin the Saginaw River. The sodium values selected as representa-tive of the lake and the river obviously were critical in the com-putations. A sodium concentration of 2.0 ppm was taken as repre-sentative of Lake Huron water, although the lowest sodium valuereported by Allen (1964) was 2.21 ppm.
Table 3. Volume of zones and areas of cross-sections
[See Fig. 1 for boundaries of zones and locationsof cross-sections1
Zone and sectionVolume of zone Area of cross-section(billion cu. ft.) (million sq. ft.)
Zone 1, A-B 122.8 2.051
Zone 2, C-D 136.1 1.155
Zone 3, E - F 694.7 12.259
Total 953.6
The time required for the daily discharge of a river to movethrough an es tuary i s the f lush ing t ime . I t i s the ra t io of thevolume of accumulated river water in the estuary to the volumeintroduced daily. The f lush ing t imes fo r zones 1 , 2 , and 3 o fSaginaw Bay were calculated from data of each survey (Table 4).During the period of peak river discharge, the 30 days precedingthe June 7 survey, 114 days would be required for a l-day accu-mulation of river water to move through the bay. Flushing timeinc reased as r ive r d i scha rge dec reased in Augus t and Oc tober .The average river discharge in October was about one-tenth thatof May 9 - June 7 (Appendix Table A-6) but the October flushing timewas only about three times longer than that for June.
Two factors influence calculations of the flushing rates-themorphology of the bay and the varying sodium content of the river.Point Lookout, Sand Point, and the shoal area extending from thesoutheast shore to Charity Island (Fig. 1) evidently limit exchangebetween the inner and outer bay. The effect of decrease in riverflow on flushing time is more pronounced in the inner bay (zones1 and 2) than in the outer bay (Table 4). The flushing time inthe inner bay increased by a factor of 3.8 between June and October
44
but it increasedonly 2.4 times in the outer bay. The sodium con-centration of the river increased as the discharge decreased. Th i srelationship causes the fraction of river water in the bay to de-c rease as the sod ium con ten t o f the r ive r inc reases and resu l t sin underestimation of the flushing time as river flow decreases.
Table 4. Average sodium content, percentage ofriver water in zones, and flushing t imes for the three zones
of Saginaw Bay, 1956
Average sod ium Percen tage of F lush ing t imeDate and zone km-d r ive r wa te r h-w)
June 71 15.0 29.5 372 13.8 26.8 373 4.5 5.7 40
Total 114August 10
1 15.6 19.9 1312 9.3 10.7 783 3.3 1.9 71
Total 280October 30
1 11.2 11.4 1622 8.0 7.5 1183 3.0 1.2 96
Total 376Annual average 1
entire bay 5.9 5.7 186
1 Based on the average sodium concentration in the entire bay duringthe three surveys and the average annual discharge of the Saginaw River.
The ra te o f l akeward t ranspor t o f Sag inaw River wa te r a ttransects A-B, C-D, and E-F of Saginaw Bay (Fig. 1) was calcu-lated for each survey (Table 5). Calculations were based on theaverage daily river flow; consequently transport rates are expressedin feet per day.
Although lakeward transport decreased with decreasing riverdischarge, change in lakeward transport was not of the same mag-nitude as the change in river flow. Transport ranged from 619to 2,294 feet (188.7 to 699.2 m) per day for section A-B, and from1,410 to 3 ,000 feet (429.8 to 914.4 m) per day for section E-F.T h e c o r r e s p o n d i n g r i v e r d i s c h a r g e ranged f rom 86 to 993 mi l l ioncubic feet (2.4 to 28 million m3) per day. The discrepancy is dueto the greater percentages of river water in the areas of the cross
45
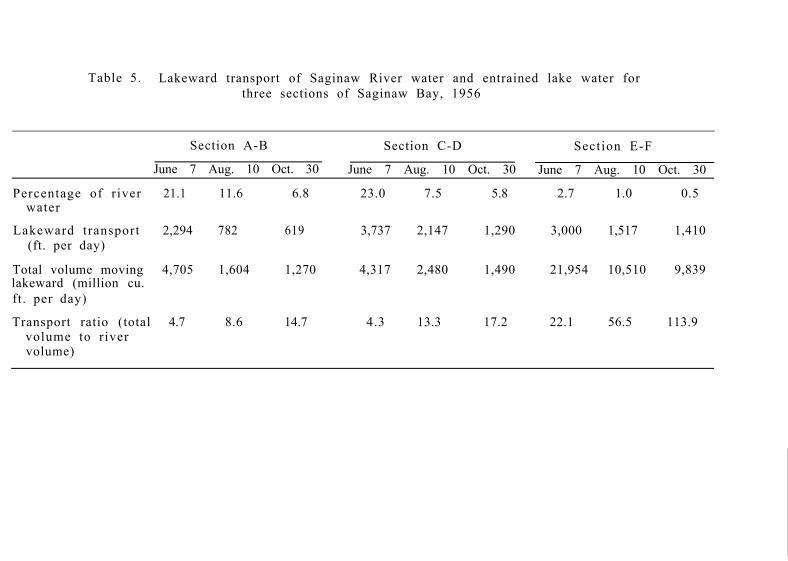
Table 5. Lakeward transport of Saginaw River water and entrained lake water forthree sections of Saginaw Bay, 1956
Section A-B Section C-D Section E-F
June 7 Aug. 10 Oct. 30 June 7 Aug. 10 Oct. 30 June 7 Aug. 10 Oct. 30
Percentage of river 21.1 11.6 6.8 23.0 7.5 5.8 2.7 1.0 0.5water
Lakeward transport 2,294 782 619 3,737 2,147 1,290 3,000 1,517 1,410(ft. per day)
Total volume moving 4,705 1,604 1,270 4,317 2,480 1,490 21,954 10,510 9,839 lakeward (million cu.
ft. per day)
Transport ratio (total 4.7 8.6 14.7 4.3 13.3 17.2 22.1 56.5 113.9volume to rivervolume)

sections during the first survey (Table 5). Change in r iver dis-charge had the greatest influence on the rate of lakeward transportin the innermost part of the bay. This situation has been observedin marine estuaries (Ketchum, 1953).
The lakeward transport through section C-D was greater thantha t fo r t r ansec t s A-B in a l l su rveys and g rea te r than t ransec tE-F excep t on Oc tobe r 30 (Tab le 5 ) . Th i s t r anspor t th roughsection C-D was to be expected since the area of this transect ison ly 56 .3% of sec t ion A-B and on ly 9 .4% of sec t ion E-F . Thetransport through section E-F in October was greater than duringearlier surveys because the river water made up a smaller frac-tion of the area of the cross section.
The decrease in the ion concentrations from the river to thebay mouth was caused by mixing of river water with progressivelygrea te r amounts o f water f rom Lake Huron . Consequent ly , theriver flow entrained an increasing amount of lake water as it movedthrough the bay. The exchange of lake and bay water must be ex-tensive since the average sodium content of the bay was low anddecreased from 7.2 ppm in June to 4.7 ppm in October (Table 4)even though the ion content of river water remained high.
Acknowledgments
The assistance of many employees of the Michigan Departmentof Conservation and the U.S. Bureau of Commercial Fisheries isgratefully acknowledged. Dr. Glenn Fli t tner drew the contoureddistributions of temperature, conductivity, and chemical constituents.Mr. Will iam Cristanell i prepared most of the figures.
Literature Cited
ALLEN, HERBERT E.1964. Chemical characteristics of south-central Lake Huron. Great
Lakes Res. Div., Univ. Mich., Publ. No. 11: 45-53.
AMERICAN PUBLIC HEALTH ASSOCIATION.1946. Standard methods for the examination of water and sewage.
9th ed., 286 p.
AYERS, J.C., D. V. ANDERSON, D. C. CHANDLER, and G. H. LAUFF.1956. Currents and water masses of Lake Huron. Great Lakes Res.
Inst., Univ. Mich., Tech. Pap. No. 1, 217 p.
BEETON, ALFRED M.1958. Relationship between Secchi disc readings and light penetration
in Lake Huron. Trans. Amer. Fish. Soc., 87: 73-79.
BEETON, ALFRED M., JAMES H. JOHNSON, and STANFORD H. SMITH.1959. Lake Superior limnological data 1951-1957. U.S. Fish and Wildl.
Serv., Spec. Sci. Rep. Fish. 297, 177 p.47

BRINKHURST, RALPH 0.1967. The distribution of aquatic oligochaetes in Saginaw Bay, Lake
Huron. Limnol. Oceanog. 12(1): 137-143.
CARR, IRA A.1962. Distribution and seasonal movements of Saginaw Bay fishes.
U.S. Fish and Wildl. Serv., Spec. Sci. Rep. Fish. 417, 13 p.
COOPER, W. F.1905. The var ia t ion of land and water temperatures . Rep. Mich.
Acad. Sci., No. 7: 40-43.
DOAN, KENNETH H.1942. Some meteorological and limnological conditions as factors in
the abundance of certain species of fish in Lake Erie. Ecol.Monogr. 12 (3): 293-314.
ELLIS, M. M., B. A. WESTFALL, and MARION D. ELLIS.1948. Determination of water quality. U.S. Fish and Wildl. Serv.,
Res. Rep. No. 9, 122 p.
EL-ZARKA, SALAH EL-DIN.1959. Fluctuations in the population of yellow perch, Perca flavescens
(Mitchill), in Saginaw Bay, Lake Huron. Fish. Bull., U.S. Fishand Wildl. Serv., 59: 365-415.
GORDON, WILLIAM G.1961. Food of the American smelt in Saginaw Bay, Lake Huron.
Trans. Amer. Fish. Soc. 90(4): 439-443.
GORHAM, EVILLE.1957. The ionic composi t ion of some lowland lake waters from
Cheshire, England. Limnol. Oceanogr. 2(1): 22-27.
HEM, JOHN D.1959. Study and interpretat ion of the chemical character is t ics of
natural water. Geol. Surv., Water Supply Paper 1473, 269 p.
HILE, RALPH,1954. Fluctuations in growth and year-class strength of the walleye in
Saginaw Bay. Fish. Bull., U.S. Fish and Wildl. Serv. 56: 7-59.
RILE, RALPH. and HOWARD J. BUETTNER.1959. Fluctuations in the commercial fisheries of Saginaw Bay 1885-
1956. U.S. Fish and Wildl. Serv., Res. Rep. 51, 38 p.
JOHNSON, JAMES H.1958. Surface-current studies of Saginaw Bay and Lake Huron, 1956.
U.S. Fish and Wildl . Serv. , Spec. Sci. Rep. Fish. 267, 84 p.
KETCHUM, BOSTWICK H.1950. Hydrographic factors involved in the dispersion of pollutants
introduced into t idal waters . J. Boston Soc. Civil Eng. 37:296-314.
48

KETCHUM, BOSTWICK H.1953. Circulation in estuaries. Proc. 3rd Conf. Coastal Engineering:
65-76.
KETCHUM, BOSTWICK H., ALFRED C. REDFIELD, and JOHN C. AYERS.1951. The oceanography of the New York Bight. Pap. Phys. Oceanogr.
Meteorol. 12(1), 46 p.
McCOMBIE, A.M.1959. Some relations between air temperatures and the surface water
temperatures of lakes. Limnol. Oceanogr. 4(3): 252-258.
MICHIGAN STREAM CONTROL COMMISSION.1937. Saginaw Valley report. Mich. Stream Control Comm. 156 p.
SMITH, HUGH H., and MERWIN-MARIE SNELL.1891. Review of the fisheries of the Great Lakes in 1885, with intro-
duction and description of fishing vessels and boats by J. W.Collins. App. Rep. U.S. Comm. Fish. for 1887, 333 p.
THARRATT, ROBERT C.1959. Food of yellow perch, Perca flavescens (Mitchill) in Saginaw
Bay, Lake Huron. Trans. Amer. Fish. Soc. 88(4): 330-331.
TULLY, JOHN P.1949. Oceanography and prediction of pulp mill pollution in Alberni
Inlet. Bull, Fish. Res. Bd. Canada, No. 83, 169 p.
U.S. GEOLOGICAL SURVEY.1958. Surface water supply of the United States, 1956. Geol. Surv.,
Water Supply Paper 1437, 407 p.
1959. Surface water supply of the United States 1957. Geol. Surv.,Water Supply Paper 1507, 379 p.
WOOD, LEONARD E.1964. Bottom sediments of Saginaw Bay, Michigan, J. Sedimentary
Petrology 34(1): 173-184.
49

A P P E N D I X
Tab le A- l . The rma l and chemica l da t a fo r va r ious s t a t i ons i n Sag inaw Bay , 1956
Station and dateT i m e D e p t h T e m p e r a t u r e(EST) ( m e t e r s ) PC)
Dissolved oxygenp e r c e n t a g e
p p m s a t u r a t i o n p H
Station 42J u n e 2 9
Ju ly 18 11:00
Augus t 10 11:00
Augus t 30 11:00
Sep tember 21 10:30
O c t o b e r 1 2 12:20
O c t o b e r 3 0 11:30
Station 45J u n e 2 9
Ju ly 18
Augus t 10
Augus t 30
Sep tember 21
O c t o b e r 1 2
O c t o b e r 3 0
Station 60J u n e
J u n e 2 0
J u l y 1
Ju ly 12
Ju ly 22
14:00
11:50
9:00
9:00
9:00
8:35
10:15
9:40
11:00
13:30
10:45
15:15
11:00
05805905905905905905
10
07
1505
1509
1405
1405
1405
1705
15
05
1004905905905
10
19.1 10.119.1 8.416.9 6.420.1 9.120.1 9.118.3 8 .921.0 8 .521.0 8.620.9 8 .520.1 8.720.0 8.819.8 8.513.9 9.313.9 9.013.9 8 .612.0 10.211.9 10.011.8 10.110.5 9.510.5 9.7
9.5 9.7
15.6 9.712.4 10.4
9.3 11.217.0 9.217.0 9.213.4 10.118.8 9.018.8 8 .914.6 10.119.1 8 .919.1 9.015.2 9.614.2 9.214.2 9.214.2 9.211.5 9.911.6 10.011.6 10.110.7 8.410.7 7 .910.4 8 .5
18.3 9.116.2 8.813.3 1 .319.9 7.819.8 7.116.0 6.319.5 9 .518.8 8.615.8 9.519.2 9.118.6 8 .911.8 8.420.6 8 .620 .6 8 .519.1 8.2
1129493
103103
9798999898
1009693 8.190 8.086 8.097 8.095 8.096 8.088s o88
100101101
9898
100100
99103
99100
989393939495967 87378
7 .81.88.0
?“:i
99 8.192 8.172868666
1069598
1029892999792
8.38.38.38.48.48.38.38.38.38 .38.38.2
7 .98.07 .9
8.38.38.18.38 .38.38.18.08.08.38 .38.18.08.0
Ei
7 .98.18.17 .98 .38.36.38.48.48.36.28.28.0
Continued
50

Tab le 1 . (Con t inued )
Station and dateT i m e Depth T e m p e r a t u r e(EST) ( m e t e r s ) PC)
Disso lved oxygenp e r c e n t a g e
p p m s a t u r a t i o n pH
A u g u s t 1 10:20
August 12 11:30
August 22 12:10
Sep tember 1 11:20
Sep tember 12 12:00
Sep tember 23 11:30
O c t o b e r 3 12:35
O c t o b e r 1 3 12:30
November 3 13:50
November 14 12:15
Station 61J u n e 1 0 9:00
J u n e 2 0 16:15
Ju ly 1 9:00
Ju ly 12 17:20
Ju ly 22 9:00
A u g u s t 1 12:30
August 12 9:00
August 22 14:10
Sep tember 1 9:30
Sep tember 12 14:00
05
1005
1005905905
100490590
1005
10059
05
1005
1405
1405
1409
1405
1405
1405
1405
1005
21.1 8.0 92 8.220.9 8.0 92 8.220.8 7.8 89 8.222.0 8 .3 98 8.321.4 8.6 100 8.321.3 8.3 97 8.220.3 8.5 97 8.320.3 8.3 95 8.320.2 8 .3 95 8.320.3 8.7 100 8.320.3 8.7 100 8.318.1 1.2 80 8.119.0 8.6 96 8.118.7 8 .6 95 8.118.5 8.3 92 8.115.0 8.9 92 8.115.0 8.5 87 8.115.0 8 .9 92 8.115.0 9.2 94 8.214.7 9.6 98 8.114.6 9.3 94 8.112.5 9.4 91 8.012.4 9.4 91 8.012.0 8 .8 84 8 .012.2 8.6 83 8.012.1 8.5 82 7.912.0 8.6 82 7 .9
8.3 10.4 92 8.08.2 10.6 93 8.07 .9 10.3 89 8.0
15.210.4
8.217.417.313.816.015.6
8.216.916.8
1.719.218.816.219.319.318.819.919.111.119.419.416.619.819.616.417.717.2
10.4 106 8.111.3 104 8.111.7 103 8.0
9.2 98 8.39.2 98 8.39.3 93 8.39.7 102 8.39.8 102 8.3
11.4 100 8.19.4 99 8.39.5 100 8.3
11.0 96 8.18.8 98 8.39.1 100 8.39.3 97 8.09.1 101 8.29.1 101 8.19.0 100 8.18 .9 101 8.28.9 99 8.1
10.9 102 8.09.0 101 8.39.0 101 8.39.4 100 8.38 .9 100 8.18.7 98 8.19.1 97 8.19.1 98 8.29.3 99 8.29.8 98 8.115 14.3
Continued
51

Tab le 1 . (Con t inued )
Station and dateT i m e Depth T e m p e r a t u r e
(EST) ( m e t e r s ) PC)
Disso lved Oxygenp e r c e n t a g e
p p m s a t u r a t i o n p H
Sep tember 23
O c t o b e r 3
O c t o b e r 1 3
November 3
November 14
Station 62J u n e
J u n e 2 1
Ju ly 13
A u g u s t 2
August 24
Sep tember 13
O c t o b e r 5
O c t o b e r 2 7
15:10
17:00
9:30
9:40
9:40
10:40
9:20
9:30
05
14 14.40 14.25
1405
1605
1405
15
01530
01530
01530
01530
01530
01530
01530
015
14.414.4
14.014.211.811.811.711.511.411.4
7.87.17.6
9.27.16.9
17.78.25.8
16.210.3
5.417.516.310.818.218.1
9.617.115.6
7 .813.213.213.211.411.4
8.6 878.7 889.0 929.8 98
10.2 1019.9
10.310.3 9810.3 98
9.8 939.7 929.4 89
10.0 8710.0 8710.3 88
11.511.911.9
9.112.111.7
103102102
98107
97100102
93102
9.511.011.3
9.49.7
11.69.19.1
11.09.19.4
11.0 9610.0 9810.0 98
9.8 969.6 919.6 91
10098
102108
9999
1009891
30 11.4 9.7 91
8.18.18.18.08.18.07.97.87.88.08.08.08.08.08.0
7 .97 .97 .98.18.11.98.38.37 .97.97 .97.88.28.21 .98.18.17 .68.18.18.08.08.0
8.0
52

Tab le A-2 . Chemica l cha rac t e r i s t i c s o f Sag inaw Bay , June 1 , 1956
T o t a l Spec i f icDepth Ca lc ium Magnes ium Po tass ium Sod ium alka l in i ty P h o s p h o r u s S u l f a t e c o n d u c t a n c e
S t a t i o n ( m e t e r s ) ( p p m ) (ppm) kwd @pm) bpm CaCOg) bm) (ppm) (pmhos 18°C)
123456189
101112131415161718192122232425262728293031323334353637383941424 2 a434445
46
4748494 9 a50
50a51
51a5253
0 56 11.1 3.5 14.0 142 o.oi40 59 12.5 4 .3 18.6 142 0.0500 71 13.0 5.1 23.8 144 0.0660 80 13.3 5.5 25.0 144 0.0680 54 11.1 3.6 11.0 120 0.0490 55 10.1 3.1 11.0 118 0.0450 55 11.1 3.8 16.7 118 0.0450 4 9 9.9 2.9 13.8 116 0.0470 54 11.3 3.8 13.5 131 0.0390 63 12.0 4.2 16.2 140 0.0410 68 12.4 4.4 18.2 135 0.0460 52 11.8 4.2 16.8 137 0.0440 59 12.3 3.7 15.9 130 0.0520 56 11.2 3.1 16.4 130 0.0430 52 9.1 3.1 16.1 129 0.0420 43 9.9 2.6 12.6 110 0.0380 42 11.1 2.5 11.5 106 0.0280 38 9.7 1.9 9.7 106 0.0210 39 9.2 1.8 8.1 106 0.0240 52 10.1 3.4 14.5 113 0.0430 58 11.4 4 .0 19.0 109 0.0190 61 11.6 4 .3 21.3 112 0.0160 53 10.3 3.8 18.0 98 0.0140 51 10.6 3.5 11.2 109 0.0220 48 10.1 3.1 15.0 112 0.0190 43 9.5 2.6 12.0 91 0.0180 41 9.4 2.2 11.2 111 0.0190 41 9.2 2 .0 10.7 106 0.0330 52 10.3 3.1 18.0 113 0.0190 58 10.3 3.2 14.3 122 0.0200 50 11.0 3.1 15.1 115 0.0210 38 9.8 2.1 10.1 99 0.0180 34 8 .5 1.6 7 .6 94 0.0160 41 8.6 4.2 11.2 100 0.0160 41 10.6 2.4 11.2 104 0.0150 45 9.9 2.8 14.6 108 0.0180 40 9.6 2.4 11.6 101 0.0180 40 9.7 2.1 10.4 99 0.0190 43 9.0 2.3 10.1 103 0.0180 36 8 .9 1.8 9.1 102 0.0090 25 1.4 1.1 4 .6 98 0.0100 29 8.2 1.3 5.1 100 0.0110 35 1.1 1.4 5.8 100 0.0090 30 1 .3 1.0 3.8 93 0.014
16 21 7.3 1.8 3.3 91 0.0180 29 1.3 0.9 2.4 93 0.011
14 27 7.1 0.8 2.7 95 0.0160 31 6.9 1.8 3.8 100 0.0120 35 9.2 1.1 6.4 100 0.0160 40 9.2 2.4 8.1 100 0.0120 34 10.6 1.1 4 .8 94 0.0160 28 10.2 1.3 3.0 s o 0.013
28 32 1.2 2 .5 2.1 96 0.0190 27 7 .3 0 .9 2 .6 94 0.0140 21 7 .0 2.1 2 .3 92 0.015
26 26 6.8 0.8 2.4 91 0.0100 21 7 .0 1.5 2.4 100 0.0100 28 8.0 0.9 2.4 94 0.0120 29 9.6 1.1 2.7 92 0.009
41414342272323213738373631282319171417332829212124171818243621151315111918161611
:i13111110
81314151311
811
99999
530629702800536537546462550591632585587549517443396367
520561629542523491442413400553532520383328426422464421396394358211288299255226231237265308347218234224206221227217233238
53

Tab le A-3 . Chemica l cha rac t e r i s t i c s o f Sag inaw Bay , Augus t 10 ,1956
T o t a l SpecificD e p t h Calc ium Magnes ium Po tass ium Sodium a lka l in i ty P h o s p o h r u s S u l f a t e c o n d u c t a n c e
S t a t i o n ( m e t e r s ) ( p p m ) (ppm) ( p p m ) ( p p m ) ( p p m C a Con) ( p p m ) (ppm) (pmhos 18°C)
12356189
10111213141516111819212223242526
21
282930313233343536
37
38394142
42a43444 5
4641484 949a50
50a51
51a5253
0 51 11.1 3.5 18.80 51 16.1 3.6 21.80 52 10.9 3.6 21.80 42 9.0 2.4 11.10 46 9.8 3.2 14.60 49 10.0 3.0 18.80 41 10.4 3.0 19.90 48 10.6 3.4 19.00 44 10.0 4 .5 15.20 44 10.4 3.5 16.00 43 10.5 2.6 15.20 38 9.3 1.8 10.40 38 9.6 2.1 10.60 38 9.8 1.9 10.00 43 10.5 2.4 14.20 47 10.1 4.4 18.40 48 11.4 3.0 20.30 44 10.0 2.5 14.30 39 9.9 2.1 10.90 40 8.6 2.1 9.50 37 8 .5 2.0 1 .80 35 8.2 2.0 6.00 36 8 .5 1.9 8.30 31 8 .8 2.3 8 .3
10 36 9.2 1.6 8.00 44 10.4 2 .9 13.17 41 9.6 2.8 12.00 40 9 . 1 4 .5 11.10 38 9.3 3.1 11.20 42 10.0 2.5 13.10 44 10.4 3.0 13.90 41 9.1 2 .5 12.20 37 8 .5 2.1 10.00 35 9.1 4 .0 1 . 1
0 32 8 .5 1.5 6.40 31 9.0 1.6 5.48 32 1 .5 1.6 5.60 34 9.0 1.5 6 .59 30 8 .8 1.4 5.40 38 9.1 2.0 8.60 39 8 .8 2.9 8.20 35 1 .8 1.5 5.00 31 1 . 6 1.5 4 .95 31 8.3 1.5 4 .89 31 8 .5 1.4 5.50 32 8 .3 1.6 5.30 31 1 .5 1.2 4 .50 28 6.9 1.5 3.90 28 1 .0 0.9 2 .89 27 7 .3 0.8 2 .8
14 26 1 . 0 1.0 2 .60 30 7 .8 1.1 4 .20 32 7 .3 1.2 4 .80 32 8.1 1.2 4.70 29 1 .6 1.5 3.60 27 7 .6 1.1 2.60 27 7.1 1.2 2 .3
24 21 7.1 0.9 2.20 21 1 .4 1.0 3.00 21 1 .6 1.0 3.1
23 26 7 .4 1.0 2 .10 29 1 .8 1.2 3.30 21 1 .0 1.6 2.10 21 1 .0 1.3 2.7
1201191131191101111121001181 1 7
113110115115124123113108109112110110101108
991181091141091081211151121101 0 1
10499
11097
111111102
9999
100101
969696
10095
108113100100
9898
106109111100
9899
0.060 21 5100.049 28 5570.038 27 5590.030 18 4110.032 21 4560.048 23 4820.040 24 5120.045 21 5250.046 23 4480.039 22 4560.044 24 4400.029 17 3690.028 1 1 3130.024 17 3730.029 19 4330.029 23 4860.032 23 5100.025 20 4330.050 19 3940.034 20 3830.040 16 3330.034 14 3150.025 1 7 3390.084 16 3480.022 15 3490.023 21 4500.035 21 4330.037 19 4160.027 18 4210.050 21 4410.014 23 4830.038 22 4200.037 17 3110.015 16 3520.031 16 3100.039 13 2920.015 14 2980.026 15 3100.017 13 2900.025 11 3610.023 21 3110.032 14 2800.019 13 2 8 0
0.017 13 2820.014 13 2800.016 13 2930.012 12 2720.009 12 2530.014 11 2320.015 10 2330.051 10 2200.031 13 2140.069 14 2800.041 13 2800.028 11 2560.009 10 2280.008 11 2230.012 10 2170.010 11 2460.009 10 2430.012 9 2220.011 11 2520.051 10 2390.053 11 232
54

Table A-4. Chemical characteristics of Saginaw Bay, October 30, 1956
Total SpecificDepth Calcium Magnesium Potassium Sodium alkalinity Phosphorus Sulfate conductance
Station (meters) (ppm) (Ppm) @pm) (Ppm) (Ppm Ca COX) (Ppm) (ppm) (flmhos 18°C)12
345
67
89
1 011121 3141 5
1 6
17
1 81 9212 2232425262 728293 031323 3343 536
37
3 83 94142
42a434445
4647484949a50
50a51
51a525 3
0030004006000000007070600000000000000000090
1 000005
1 000005
1 50000
i26
00
25000
3 9434146453 634373942444 1403 8313 3323 33 338383 93 94 4454 140343 43232383 534443941393233
ii3131313129262 626262628252625263 22 726
2262627262627
10.110.5
9.710.110.1
8.89.09.59.7
10.010.4
9.29.59.28.78.17.68.58.78.79.19.49.89.99.59.8
10.07.88.18.38.38.98.68.8
10.29.8
::i8.68.8
i:!8.88.18.38.69.58.17.9
10.57.77.97.89.07.77.97.79.31.17.76.87.46.97.61.27.67.41.7
2.32.72.42.71.51.51.42.12.32.22.22.33.01.91.61.51.31.41.41.81.71.92.62.22.32.42.52.01.51.41.31.71.61.22.82.02.12.01.83.62.21.51.21.51.21.81.21.30.80.80.90.80.91.30.90.90.91.81.00.90.90.90.80.80.91.20.80.8
13.116.116.115.716.77.27.5
11.614.515.016.812.312.210.4
9.16.35.15.76.38.68.49.7
10.017.019.013.114.27.36.96.06.09.58.16.5
14.510.912.610.86.36.56.51.16.35.36.27.15.22.52.62.52.32.53.42.42.62.73.26.12.92.32.02.22.32.63.22.62.63.4
10711511511212210210410811311111311611611512310210310310110811210911010911211211211199
100100113114110112103114107108103106103104
97106108
928492888 4929 59 39 39 992
1028692
290929 892929 3
0.0310.0370.0450.0430.0440.0310.0250.0680.0520.0570.0290.0510.0350.0390.0400.0280.0240.0230.0290.0540.0540.0530.0510.0490.0640.0370.0360.0340.0310.0270.0250.0430.0270.0260.0390.0290.0260.0490.0260.0170.0260.0210.0160.0220.0210.0250.0190.0150.0120.0130.0130.0150.0180.0150.0140.0160.0250.0280.0130.0130.0140.0120.0130.0130.0150.0120.011
1519192 01912111 61 6171 91817171 51 312121 31 51 51 51 5181 917181314121216141 32 11 51 91 51 31 3
:2”121 0111 51110
98
1 09
1 010
99
111 310
810
999998
1 0
402440
452475320
393410
429421400369355305284304
360
375
451475421401315315295295369327395438378401383368294295
285
285305249216
216218239317
221296227215217216
216260
2222270.018
28 7.6 1.7 3.7 101 0.020 10 248
5 5

Table A-5. Mean discharge and chemical composition of three ofthe larger secondary tributaries to Saginaw Bay
[Discharge is for the water year Oct. 1955 through Sept. 19561
Speci f ic MeanCalcium Sodium Chloride Sulfate Silica conductance flow
River ( p p m ) ( p p m ) Cm4 ( p p m ) km) (chos l&T) ( c f s )
Au Gres 51 3.6 7.3 100 5.8 315 146
Kawkawlin 53 8.7 22.2 73 3.8 332 53
Rifle 34 4.5 10.0 36 7.0 230 230
Table A-6. Saginaw River flow and average sodium content, 1956
Date
Average discharge Average(million cu. ft. sodium 1
Per day) km)
Averagechloride 9
bpm)
May O-June 7 993 46 152
July 12-August 10 186 70 280
October 1-31 86 82 346
Annual average 292 70 280
1 Calculated from chloride values.2Average chloride, Dow Chemical Co. data, 1956.
56

GREAT LAKES FISHERY COMMISSION
TECHNICAL REPORT SERIES
No. 1. Use of 3-tr if luormethyl-4-nitrophenol as a selectivesea lamprey larvicide, by Vemzon C. Applegate, JohnH. Howell, James W. Moffett, B. G. H. Johnson, andManning A. Smith.
No. 2. Fishery statist ical districts of the Great Lakes, byStanford H. Smith, Howard J. Buettner, and Ralph Hile.
No. 3. Commercial fish production in the Great Lakes 1867-1960, by Norman S. Baldwin and Robert W. Saalfeld.
No. 4. Estimation of the brook and sea lamprey ammocetepopulations of three streams, by Bewzard R. Smith andAlberton L. McLain.
A photoelectric amplifier as a dye detector, by WesleyJ. Ebel.
No. 5. Collection and analysis of commercial fishery statis-tics in the Great Lakes, by Ralph Hile.
No. 6. Limnological survey of Lake Erie 1959 and 1960, byAlfred M. Beeton.
No. 7. The use of alkalinity and conductivity measurements toestimate concentrations of 3-trifluormethyl-4-nitro-pheno l requ i red fo r t r ea t ing l amprey s t reams , byRichard K. Kanayama.
No. 8. Synergism of 5, 2’-dichloro-4’-nitro-salicylanilide and3-trifluormethyl-4-nitrophenol in a selective lampreylarvicide, by John H. Howell, Everett L. King Jr.,Allen J. Smith, and Lee H. Hanson.
No. 9 . De tec t ion and measurement o f o rgan ic l ampr ic ideresidues, by Stacy L. Daniels, Lloyd L. Kempe,Thomas J. Billy, and Alfred M. Beeton.
No. 10. Experimental control of sea lampreys with electricityon the south shore of Lake Superior, 1953-60, byAlberton L. McLain, Bernard R. Smith, and Harry H.Moore.
No. 11. The relation between molecular structure and biologi-cal activity among mononitrophenols containing halo-gens, by Vemzon C. Applegate, B. G. n. 3oIzn-son, andManning A. Smith.
Substituted nitrosalicylanilides: A new class of selec-tively toxic sea lamprey larvicides, by Roland J.