Physical Inactivity: The Biggest Public Health Problem of...
84
Physical Inactivity: The Biggest Public Health Problem of the 21 st Century Physical activity and health in work life International PhD course 2012 Mai 21-25 University of Southern Denmark, Odense, Denmark Steven N. Blair Departments of Exercise Science & Epidemiology/Biostatistics University of South Carolina
Transcript of Physical Inactivity: The Biggest Public Health Problem of...

Physical Inactivity: The Biggest Public Health Problem of the 21st
Century
Physical activity and health in work lifeInternational PhD course
2012 Mai 21-25University of Southern Denmark, Odense,
DenmarkSteven N. Blair
Departments of Exercise Science & Epidemiology/BiostatisticsUniversity of South Carolina

Professor Jerry Morris—Pioneer in studying physical activity and cardiovascular health


Physical Activity at Work and Coronary Artery Disease, 31,000
London Transport Workers
0
0,2
0,4
0,6
0,8
1
1,2
1,4
1,6
Coronary Occlusion Early Mortality*
DriversConductors
Morris JN et al. Lancet 1953
Rate/1000
*Within 3 days of MI

Professor Jerry Morris-2009“We in the West are the firstgeneration in human history inwhich the mass of the population has to deliberately exercise to be healthy. How can society’s collective adaptations match?”

Blair SN, Smith GD, Lee IM, Fox K, Hillsdon M, McKeown RE,
Haskell WL, Marmot M. A Tribute to Professor Jeremiah Morris:
The Man Who Invented the Field of Physical Activity
Epidemiology. Ann Epidemiol, 2010; Sep 20(9):651-660.

Walking Pace, LTPA, and Resting HR in Relation to Mortality:
40 Years Follow-up of Original Whitehall Study Original study: 19,019 male, nonindustrial,
London-based government employees, aged 40-69 years when first examined between 1967-70.• Completed a questionnaire about employment
grade, smoking, marital status, and LTPA, and self-rated walking pace
• Medical exam included resting HR, BP, height, weight, pulmonary function (FEV1), and an overnight fast, plasma cholesterol and post-challenge blood glucose concentration.
Records of 6928 men traced through National Health Service Central Registry, representing ~40 years follow-up through October 2008.
Batty GD et al Ann Epidemiol. 2010; 20:661-9

Relation of LTPA with Mortality Outcomes: 40 years follow-up of Whitehall Study
p=0.09p=0.57p<0.001
* Adjusted for age, employment grade, SBP, cholesterol, smoking, BMI, glucose intolerance, diabetes, FEV1 Batty GD et al Ann Epidemiol. 2010; 20:661-9
*HR
Active: engaged in vigorous sports (e.g. swimming, athletics)Moderate: participated in active hobbies (e.g. gardening, woodwork)Inactive: no such physical exertion
(Referent)
LTPA:n=5279
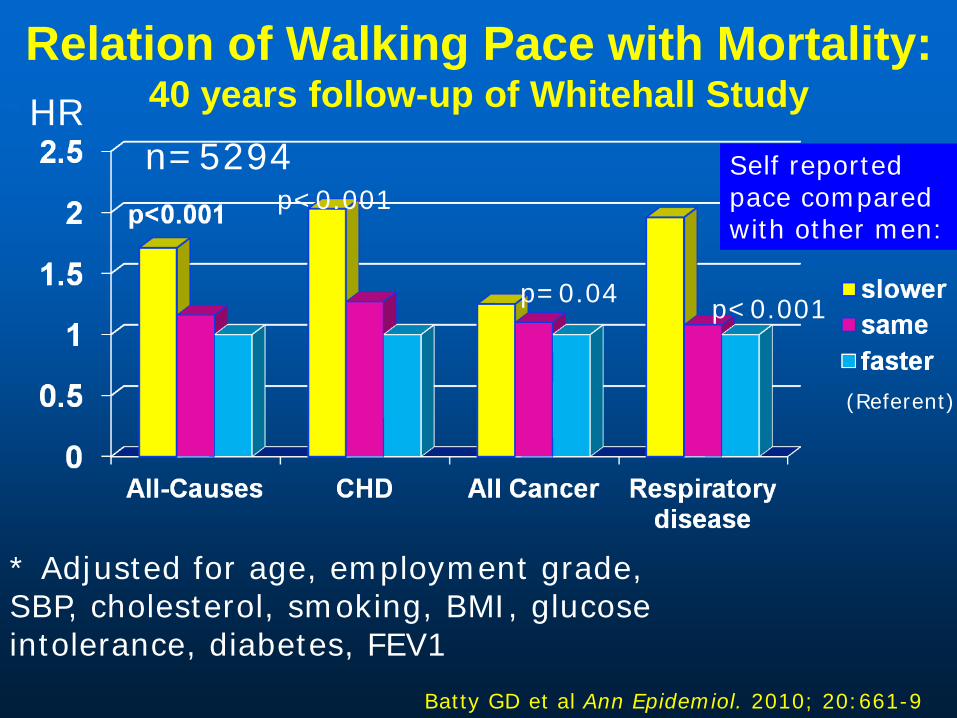
Relation of Walking Pace with Mortality: 40 years follow-up of Whitehall Study
p<0.001
p<0.001p=0.04
* Adjusted for age, employment grade, SBP, cholesterol, smoking, BMI, glucose intolerance, diabetes, FEV1
Batty GD et al Ann Epidemiol. 2010; 20:661-9
Self reported pace compared with other men:
*HR
(Referent)
n=5294

Articles/Period—Web of SciencePhysical Activity or Physical Fitness and
Cardiovascular Disease
01000020000300004000050000600007000080000
1950-9 1960-9 1970-9 1980-9 1990-9 2000-9
# of Articles
Years

Non-Communicable Diseases (NCDs) Changing patterns in leisure and
work have led to a health crisis NCDs cause 65% of all deaths
worldwide 36.1 million deaths from CVD,
Stroke, Diabetes, Cancer & Respiratory diseases.
Physical inactivity causes 3.2 million deaths/year
WHO. Mortality and burden of disease estimates for WHO Member States in 2008. Geneva: World Health Organization, 2010.

Economic Burden Failure to reduce chronic diseases
will result in heavy losses in terms of human life and economic production.
Current losses:• US: $750 billion annually from CVD &
diabetes alone. • China: $558 billion• India: $237 Billion• Britain: $33 Billion
Trends suggest that risk factors and costs are on the rise.

Question Rank the following exposures by
the number of deaths caused worldwide.• Tobacco use• Obesity• High blood pressure• Physical inactivity• High blood glucose

0 1 2 3 4 5 6 7 8
High cholesterol
Overweight & obesity
Physical Inactivity
High blood glucose
Tobacco use
High blood pressure
High Income
Middle Income
Low Income
Mortality in millions (total 58.8 million)
Leading risk factors for mortality by income group (estimates from 2004)
© World Health Organization 2009(http://www.who.int/healthinfo/global_burden_disease/global_health_risks/en/index.html)
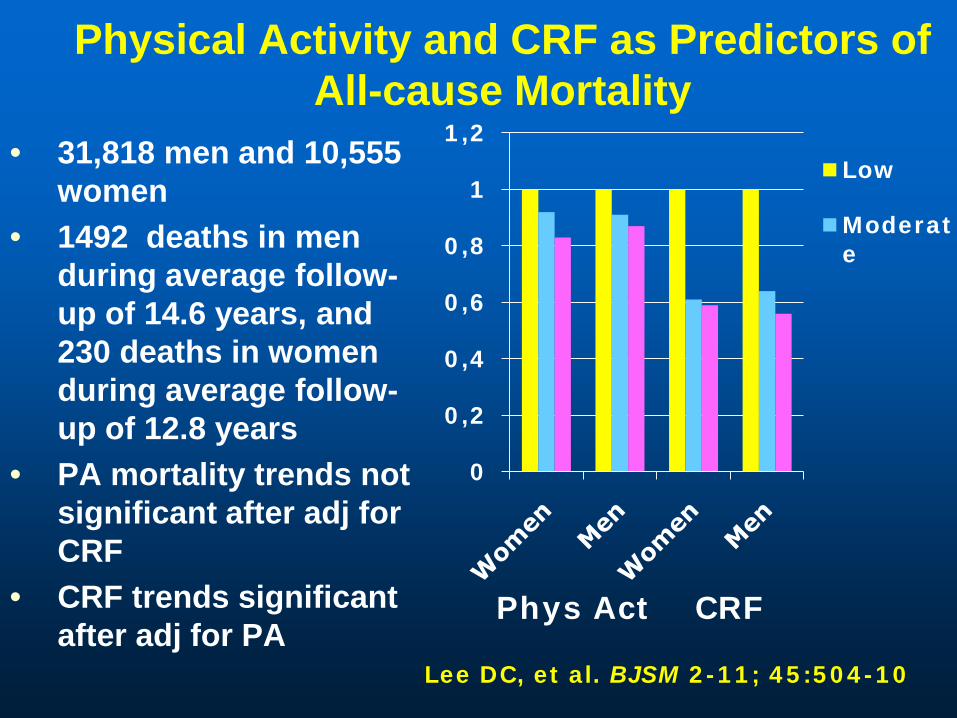
Physical Activity and CRF as Predictors of All-cause Mortality
0
0,2
0,4
0,6
0,8
1
1,2
Low
Moderate
• 31,818 men and 10,555 women
• 1492 deaths in men during average follow-up of 14.6 years, and 230 deaths in women during average follow-up of 12.8 years
• PA mortality trends not significant after adj for CRF
• CRF trends significant after adj for PA
Phys Act CRF
Lee DC, et al. BJSM 2-11; 45:504-10
0 20 40 60 80 100
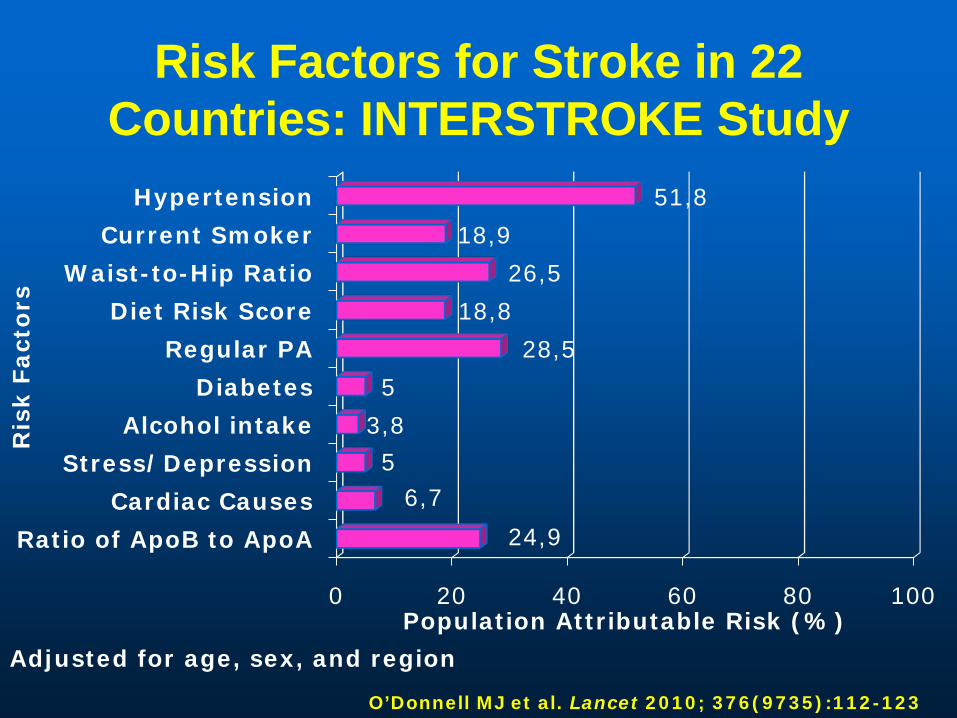
Ratio of ApoB to ApoA
Cardiac Causes
Stress/Depression
Alcohol intake
Diabetes
Regular PA
Diet Risk Score
Waist-to-Hip Ratio
Current Smoker
Hypertension
24,9
6,75
3,8
5
28,5
18,8
26,5
18,9
51,8
Population Attributable Risk (%)
Ris
k F
act
ors
Risk Factors for Stroke in 22 Countries: INTERSTROKE Study
O’Donnell MJ et al. Lancet 2010; 376(9735):112-123
Adjusted for age, sex, and region

Harvard Alumni Health Study
Professor Ralph S. Paffenbarger, Jr

Great Leaders of Physical Activity Epidemiology

Harvard Alumni Health Study (HAHS)
• Begun in 1962 by Prof. Paffenbarger• Subjects are male alumni who
matriculated as undergrads at Harvard University, 1916-1950
• Thus, this is a FIXED COHORT (no new enrollees)
• Main exposure of interest: physical activity
• Main outcomes of interest: chronic diseases, especially coronary heart disease, when HAHS was initiated

Subject Selection
Why Harvard alumni?• Good follow-up (potential bias if
loss to follow-up is high)• Able to provide good quality of
info on health habits (including PA) and medical history via mail questionnaires
• Retrospective info available on health habits (including PA) in college

Harvard Alumni Health StudyPA Questionnaire
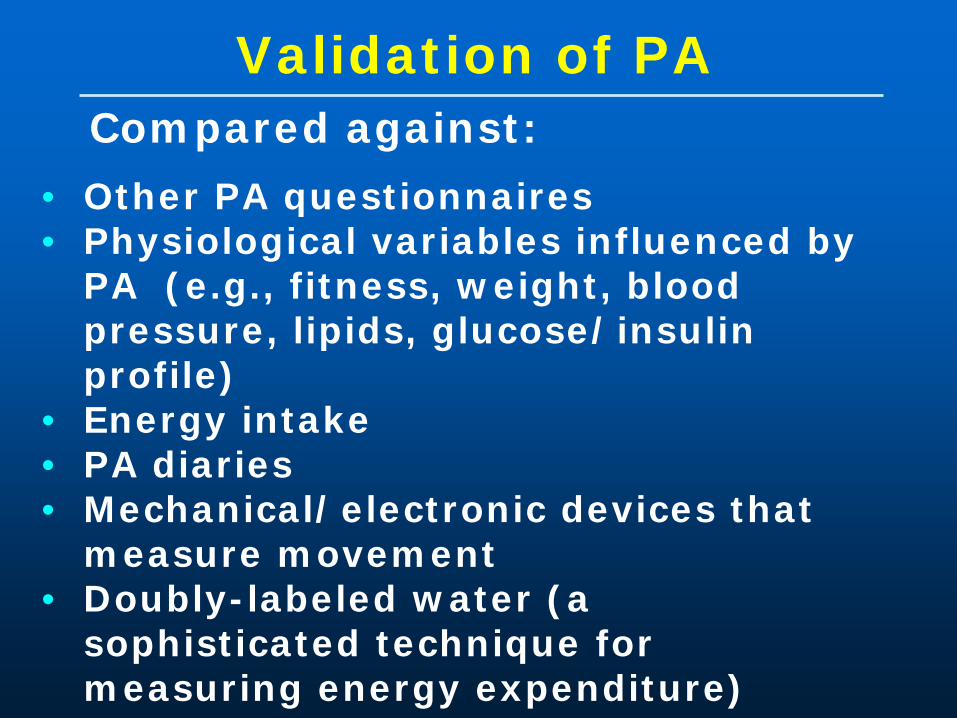
Validation of PA
• Other PA questionnaires• Physiological variables influenced by
PA (e.g., fitness, weight, blood pressure, lipids, glucose/insulin profile)
• Energy intake • PA diaries• Mechanical/electronic devices that
measure movement• Doubly-labeled water (a
sophisticated technique for measuring energy expenditure)
Compared against:

Assessment of Outcomes
• Alumni report the occurrence of chronic diseases on periodically mailed questionnaires
• Self-reports have been validated against medical records, with high validity
• Fatal outcomes assessed by obtaining death certificates
• Mortality follow-up >99% complete

Physical Activity in Middle-Age and MI
0.0
0.2
0.4
0.6
0.8
1.0
1.2
<2000 2000+
P <0.001
Physical Activity (Kcal/Wk)
Paffenbarger et al, Am J Epidemiol 1978;108:161-75
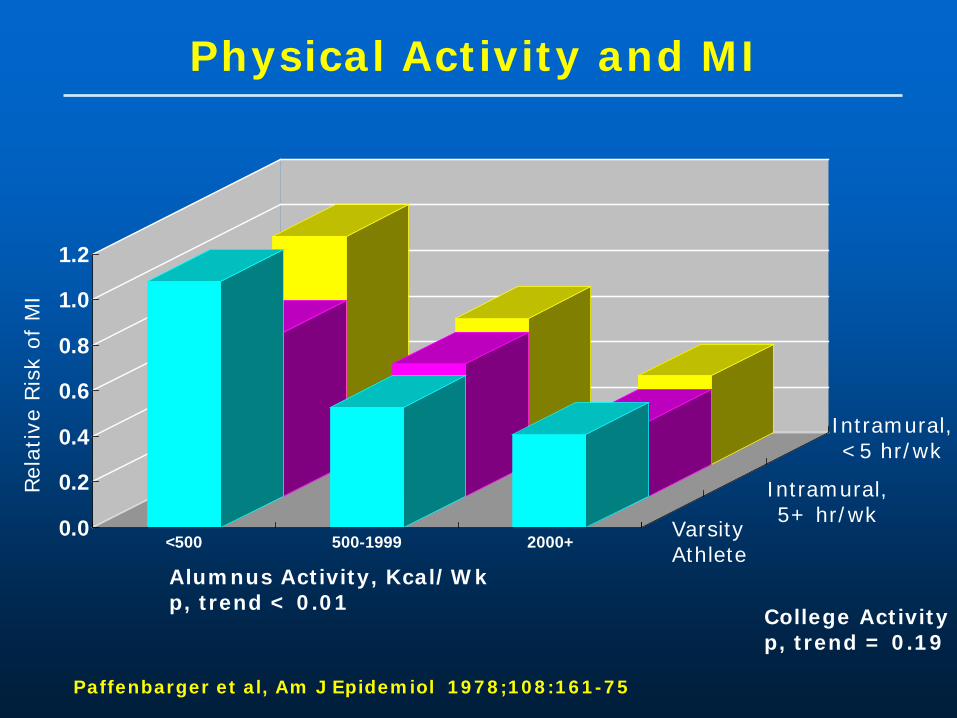
Physical Activity and MI
0.0
0.2
0.4
0.6
0.8
1.0
1.2
<500 500-1999 2000+ Varsity Athlete
Intramural,5+ hr/wk
Intramural, <5 hr/wk
Alumnus Activity, Kcal/Wkp, trend < 0.01
College Activityp, trend = 0.19
Paffenbarger et al, Am J Epidemiol 1978;108:161-75
Rel
ativ
e Ris
k of
MI
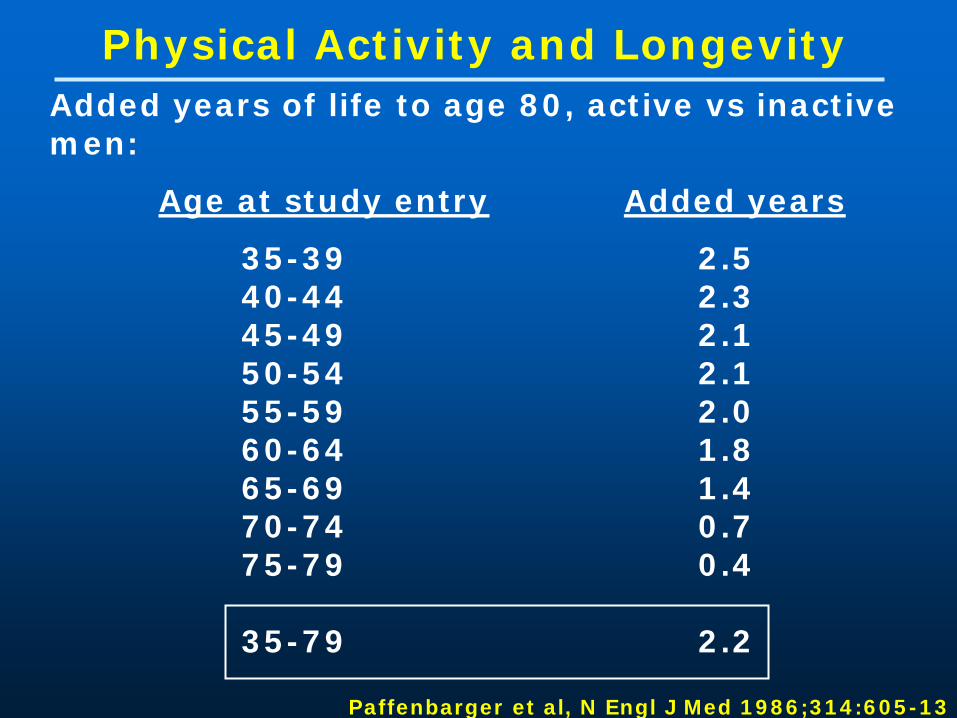
Physical Activity and LongevityAdded years of life to age 80, active vs inactive men:
Age at study entry Added years
35-39 2.540-44 2.345-49 2.150-54 2.155-59 2.060-64 1.865-69 1.470-74 0.775-79 0.4
35-79 2.2
Paffenbarger et al, N Engl J Med 1986;314:605-13
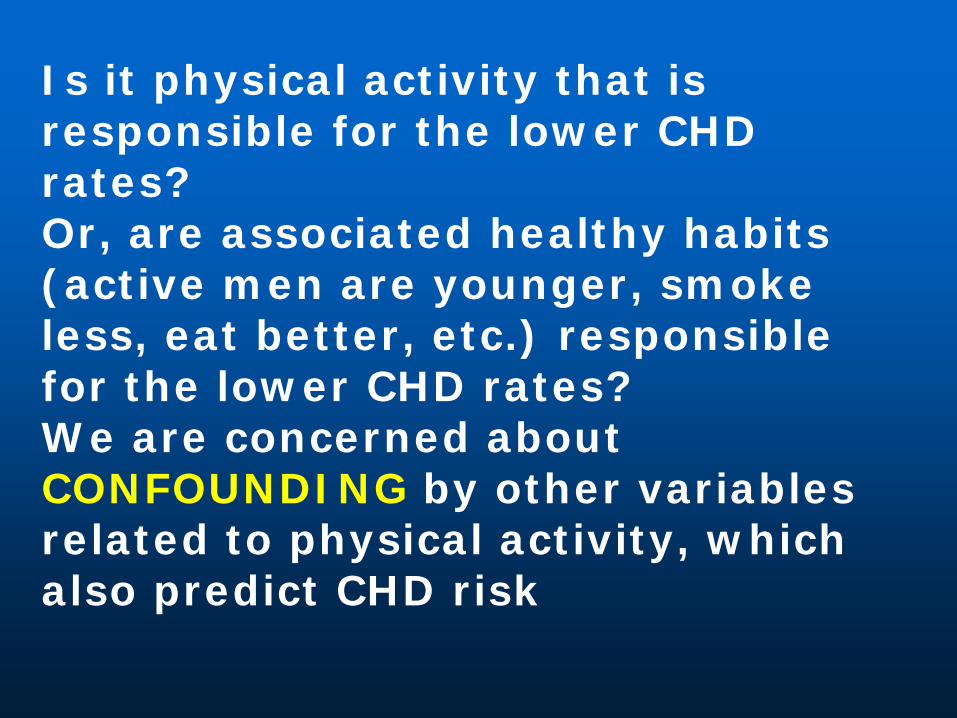
Is it physical activity that is responsible for the lower CHD rates?Or, are associated healthy habits (active men are younger, smoke less, eat better, etc.) responsible for the lower CHD rates?We are concerned about CONFOUNDING by other variables related to physical activity, which also predict CHD risk

Harvard Alumni Health Study
Inactive Active
Mean age, yr* 68.6 66.2
Mean BMI 24.6 24.8
Smoker 9.5% 8.1%
No alcohol* 32.8% 25.9%
Red meat * >3 servings/wk 30.8% 31.1%
Vegetables * <1 serving/dy 31.6% 25.0%
* p <0.05
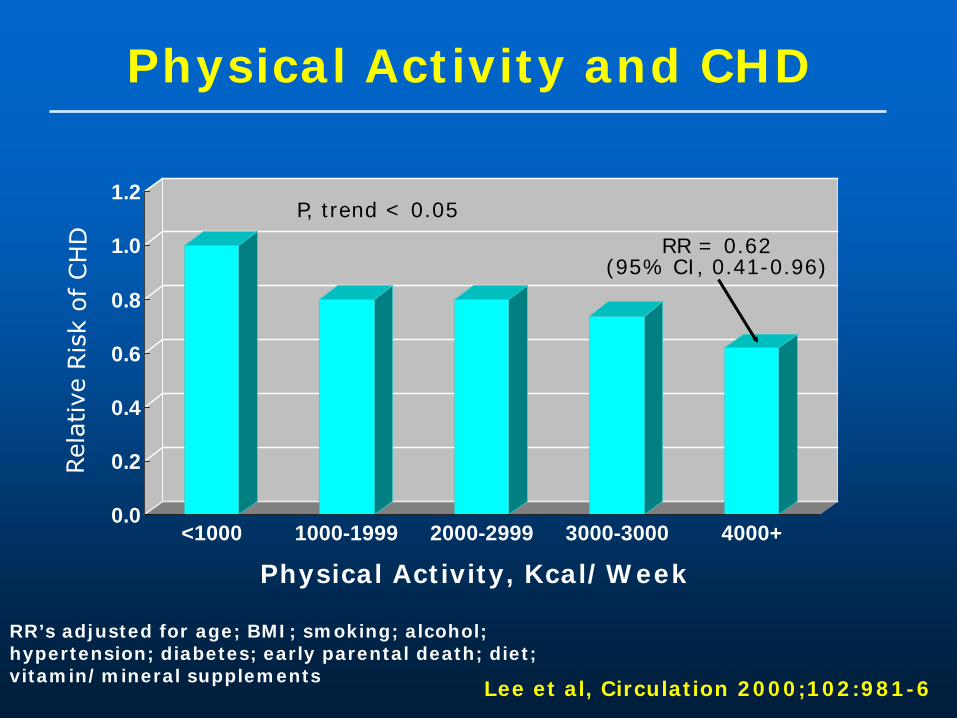
Physical Activity and CHD
0.0
0.2
0.4
0.6
0.8
1.0
1.2
<1000 1000-1999 2000-2999 3000-3000 4000+
Physical Activity, Kcal/Week
RR’s adjusted for age; BMI; smoking; alcohol; hypertension; diabetes; early parental death; diet; vitamin/mineral supplements
Lee et al, Circulation 2000;102:981-6
P, trend < 0.05
RR = 0.62(95% CI, 0.41-0.96)

PA Intensity and CHD
0.0
0.2
0.4
0.6
0.8
1.0
1.2
Nothing-Weak Mod SomewhatStrong
Strong-Maximal
P, trend = 0.003
Relative Intensity
Lee et al; Circulation 2003;107:1110-6
* adjusted for age, smoking, alcohol, diet, early parental death

The Women’s Health Initiative (WHI)
Observational Study (OS)

Women’s Health Initiative (WHI) observational Study (OS)
•Subjects are postmenopausal women, 50-79 years at entry
•93,676 women, 40 clinical centers, 1993-2010
•Examined the relationship between lifestyle, health and risk factors and specific disease outcomes.

Recreational Physical Activity

Walking Compared with Vigorous Exercise for the Prevention of Cardiovascular Events
in Women
JoAnn E. Manson, M.D., Dr.P.H., Philip Greenland, M.D., Andrea Z. LaCroix, Ph.D., Marcia L. Stefanick, Ph.D., Charles P. Mouton, M.D., Albert Oberman, M.D., M.P.H., Michael G. Perri, Ph.D., David S. Sheps, M.D., Mary B. Pettinger, M.S.
and David S. Siscovick, M.D., M.P.H.
N Engl J MedVolume 347;10:716-725
September 5, 2002

Age-Adjusted Relative Risks of Cardiovascular
Disease According to Quintile of Total
MET Score in Subgroups Defined by Race, Age, and Body-Mass Index
(BMI)Manson, J. et al. N Engl J Med 2002;347:716-725

Age-Adjusted Relative Risks of Cardiovascular
Disease According to Energy
Expenditure from Walking (MET-
Hr/Wk) in Subgroups Defined by Race, Age, and Body-Mass Index
(BMI)
Manson, J. et al. N Engl J Med 2002;347:716-725

Conclusions These prospective data indicate that
both walking and vigorous exercise are associated with substantial reductions in the incidence of cardiovascular events among postmenopausal women, irrespective of race or ethnic group, age, and body-mass index
Prolonged sitting predicts increased cardiovascular risk

Aerobics Center Longitudinal Study
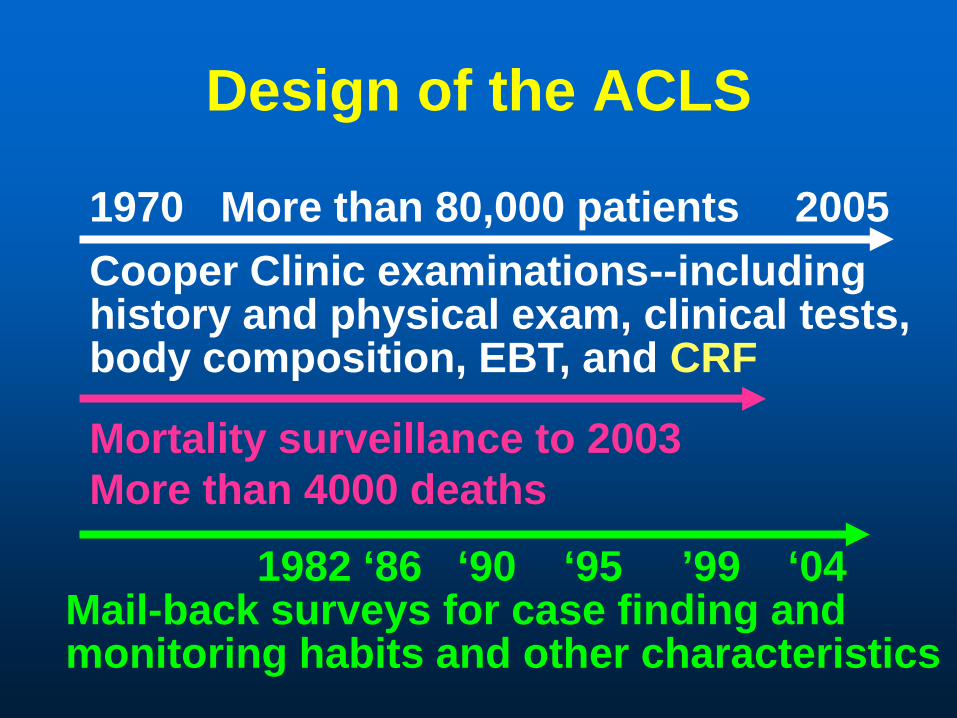
Design of the ACLS
1970 More than 80,000 patients 2005
Mortality surveillance to 2003More than 4000 deaths
Cooper Clinic examinations--includinghistory and physical exam, clinical tests,body composition, EBT, and CRF
1982 ‘86 ‘90 ‘95 ’99 ‘04Mail-back surveys for case finding and monitoring habits and other characteristics

All-Cause Death Rates by CRF Categories—3120 Women and
10 224 Men—ACLS
0
10
20
30
40
50
60
70
Age
adj
dea
th ra
te/1
0,00
0 PY
Low Moderate High
WomenMen
Blair SN. JAMA 1989

Amount of Specific Physical Activities for Moderately Fit Women and Men
Detailed physical activity assessments in women and men who also completed a maximal exercise test
Average min/week for the moderately fit who only reported each specific activity
020406080
100120140160
Women Men
WalkAerobicsRun
Mean Min/week
N=3,972 13,444Stofan JR et al. AJPH 1998; 88:1807

Define CRF in the ACLS Quantified as the total duration of a
treadmill test (Modified Balke protocol) Highly correlated with measured maximal oxygen
uptake (r>0.92) Age-, sex-specific quintiles for treadmill time in
the overall ACLS population
Low: Quintile 1 (Q1, the lowest 20%)Moderate: Quintile 2 and 3 (Q2-3, the middle 40%) High: Quintile 4 and 5 (Q4-5, the upper 40%)
Published cutpoints see: Sui X et al. Am J Epidemiol 2007; 165:1413-23; Sui X et al. Am J Hypertens 2007; 20:608-15

Fitness and Mortality in Men, ACLS, Fitness Categories
Fitness Age Groups (years)group 20-39 40-49 50-59 60+Low ≤10.5 ≤9.9 ≤8.8 ≤7.5
Mod 10.6-12.7 10.0-12.1 8.9-10.9 7.6-9.7
High >12.7 >12.1 >10.9 >9.7
Table values are maximal METs attained during the exercise test

Fitness and Mortality in Women, ACLS, Fitness Categories
Fitness Age Groups (years) group 20-39 40-49 50-59 60+ Low ≤8.1 ≤7.5 ≤6.5 ≤5.7
Mod 8.2-10.5 7.6-9.5 6.6-8.3 5.7-7.5
High >10.5 >9.5 >8.3 >7.5
Table values are maximal METs attainedduring the exercise test

Does Changing Cardiorespiratory Fitness
Reduce Mortality Risk?

Fitness Change Categories Unfit was defined as the least fit 20% of men
in each age group Men were classified as fit or unfit at both
examinations Change categories
• unfit at both examinations = never fit• unfit at first, fit at second = improvers• fit at both examinations = always fit
Blair SN et al. JAMA 1995; 273:1093-8
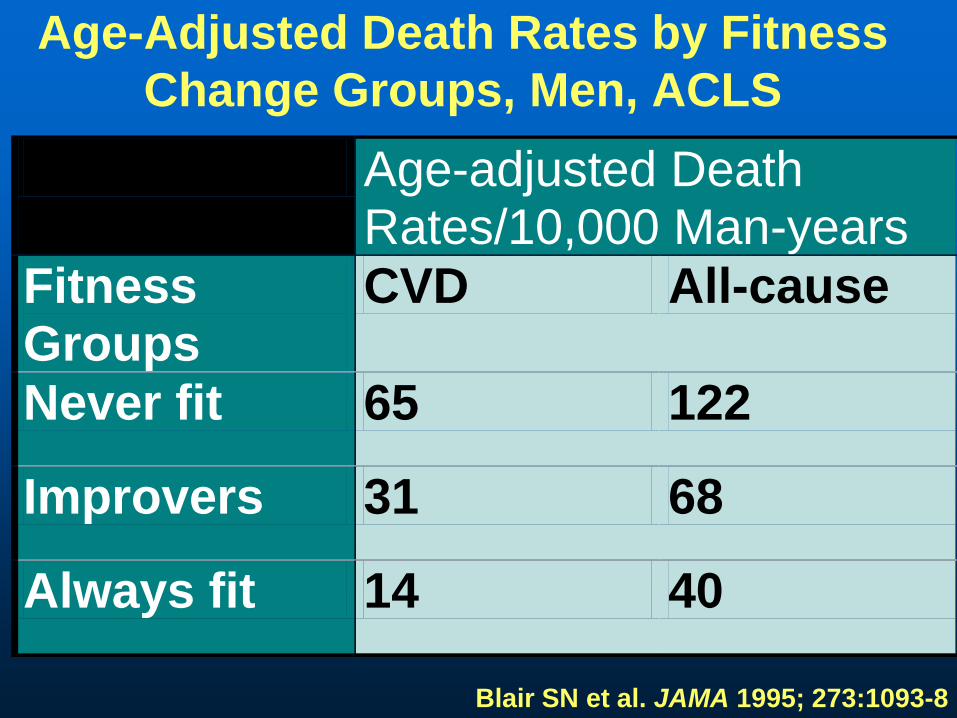
Age-Adjusted Death Rates by Fitness Change Groups, Men, ACLS
Age-adjusted Death Rates/10,000 Man-years
Fitness Groups
CVD All-cause
Never fit 65 122
Improvers 31 68
Always fit 14 40
Blair SN et al. JAMA 1995; 273:1093-8

CVD Death Rates* by Fitness Groups, 7,080 Women and 25,341 Men, ACLS
0
5
10
15
20
Women Men
LowModHigh
Deaths/10,000 PY
Adjusted for age, exam year, and other risk factors
Blair SN et al. JAMA 1996; 276:205-10

Cardiorespiratory Fitness, Risk Factors and All-Cause Mortality, Men,
ACLS
0102030405060
Dea
ths/
10,0
00 M
Y*
Low Mod High0
12 or 3
# of risk factors
Risk Factorscurrent smokingSBP >140 mmHgChol >240 mg/dl
Cardiorespiratory Fitness Groups*Adjusted for age, exam year, and other risk factors
Blair SN et al. JAMA 1996; 276:205-10

Cardiorespiratory Fitness, Risk Factors, and All-Cause Mortality,
Women, ACLS
0
1
2 or 3
01020304050
Low Mod-High
Dea
ths/
10,0
00 W
Y* # of risk factors
Risk factorscurrent smokingSBP >140 mmHgChol >240 mg/dl
Cardiorespiratory Fitness Groups*Adjusted for age, exam year, and other risk factors
Blair SN et al. JAMA 1996; 276:205-10

CRF and Other Health Outcomes

CRF and Digestive System Cancer Mortality
•38,801 men, ages 20-88 years•283 digestive system cancer deaths in 17 years of follow-upCRF was inversely associated with death after adjustment for age, examination year, body mass index, smoking, drinking, family history of cancer, personal history of diabetes•Fit men had lower risk of colon, colorectal, and liver cancer deaths
High Fit
Moderately Fit
Low Fit
Peel JB et al. Cancer Epidemiol Biomarkers Prev 2009; 18:1111

CRF and Breast Cancer Mortality
0
0,1
0,2
0,3
0,4
0,5
0,6
0,7
0,8
0,9
1
Low Moderate High
•14,551 women, ages 20-83 years•Completed exam 1970-2001•Followed for breast cancer mortality to 12/31/2003•68 breast cancer deaths in average follow-up of 16 years•Odds ration adjusted for age, BMI, smoking, alcohol intake, abnormal ECT, health status, family history, & hormone use
Odds Ratio
p for trend=0.04
Sui X et al. MSSE 2009; 41:742
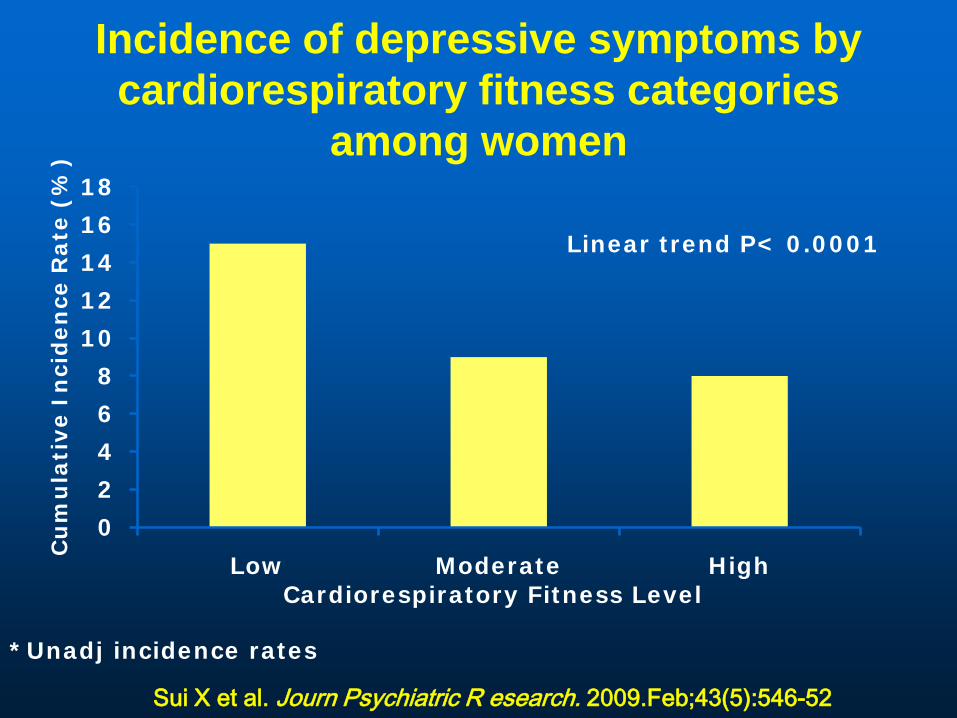
Incidence of depressive symptoms by cardiorespiratory fitness categories
among women
0
2
4
6
8
10
12
14
16
18
Low Moderate High
Linear trend P< 0.0001
Cardiorespiratory Fitness Level
Cu
mu
lati
ve I
nci
den
ce R
ate
(%
)
Sui X et al. Journ Psychiatric R esearch. 2009.Feb;43(5):546-52
*Unadj incidence rates

CRF and Risk of Incident Hypertension, ACLS Women
4,884 healthy women examined at the Cooper Clinic, 1970-1998
157 women developed hypertension during average follow-up of 5 years
Risk adjusted for age, exam year, alcohol intake, smoking, BP, family history of hypertension, waist girth, glucose, & triglycerides
00,10,20,30,40,50,60,70,80,9
1
Low
Moderate
High
FitnessGroups
Risk of Developing Hypertension
Barlow CE et al. Am J Epidemiol 2006; 163:142-50
P for trend <0.01

0
5
10
15
20
25
<7.0 7.0-7.9 8.0-8.9 9.0-9.9 ≥10.0
Inci
denc
e R
ate
per 1
0,00
0w
oman
-yea
rs
Linear trend P < 0.001
METs
Age-adjusted Incidence Rates of Type 2 Diabetes By CRF Levels Quantified by1-MET Increment, ACLS, 6249 Women
Sui X, Hooker SP, Lee I-M, …Blair SN. Diabetes Care 2008; 31:550-5
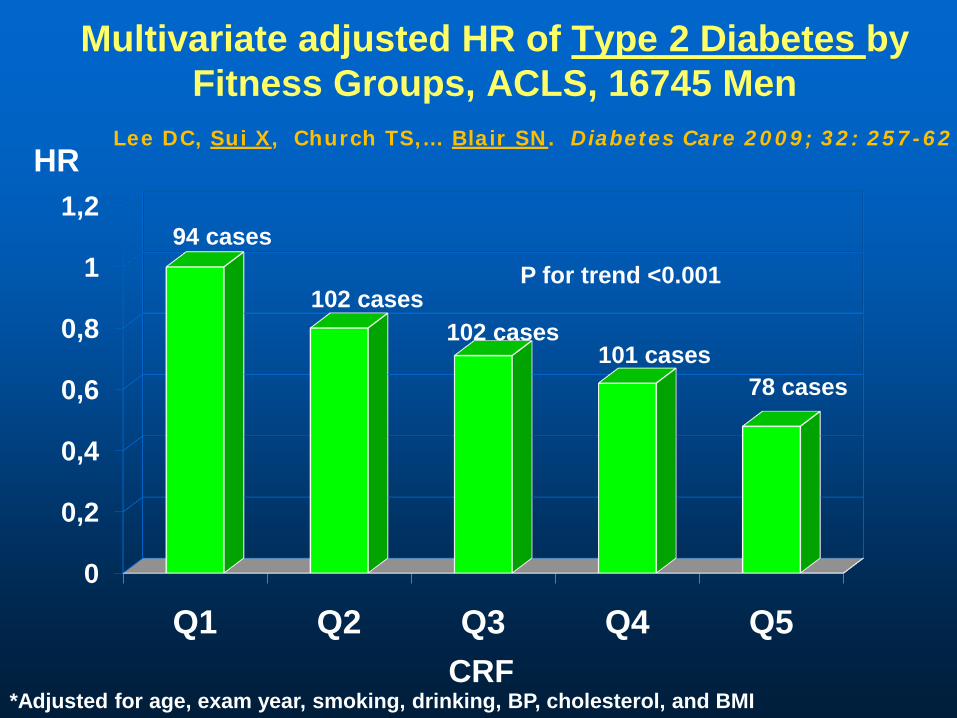
Multivariate adjusted HR of Type 2 Diabetes by Fitness Groups, ACLS, 16745 Men
0
0,2
0,4
0,6
0,8
1
1,2
Q1 Q2 Q3 Q4 Q5
HR
CRF*Adjusted for age, exam year, smoking, drinking, BP, cholesterol, and BMI
94 cases
102 cases102 cases
101 cases78 cases
P for trend <0.001
Lee DC, Sui X, Church TS,… Blair SN. Diabetes Care 2009; 32: 257-62

Multivariate adjusted HR of Incident Hypertension by Fitness Groups, ACLS, 16601 Men
0
0,2
0,4
0,6
0,8
1
1,2
Low Moderate High
HR
CRF*Adjusted for age, exam year, BMI, smoking, drinking, BP, hypercholesterolemia, DM, family history HTN and CVD
969 cases765 cases
612 cases
P for trend <0.0001
Chase NL, Sui X, Lee DC, Blair SN. Am J Hypertens 2009;22: 417-24

0
0,2
0,4
0,6
0,8
1
1,2
CVD CHD MI
Low Moderate High
HR
*adjusted for age, exam year, smoking, drinking, family history, and abnormal ECG
Event 345 664 503 289 533 400 123 212 154
P trend<0.001 P trend<0.001 P trend<0.001
Multivariate adjusted HR of Nonfatal CVD, CHD, and MI, by Fitness Groups, ACLS, 20728 men
Sui X, LaMonte MJ, Blair SN. Am J Epidemiol 2007; 165:1413-23

Number of risk factors
0
20
40
60
80
100
120
140
160
0 1 ≥ 2
CVD
inci
denc
e ra
te
per 1
0,00
0 m
an-y
ears
Low Moderate High
P < 0.001
P = 0.006
P < 0.001
*Risk factors include current smoking, hypertension, hypercholesterolemia, diabetes, and family history of CVD
Age and Exam Year-adjusted CVD Incidence Rates by Fitness Groups, across Number of Risk
Factors, ACLS, 20728 menSui X, LaMonte MJ, Blair SN. Am J Epidemio 2007; 165:1413-23

0
0,2
0,4
0,6
0,8
1
1,2
CVD CHD MI
Low Moderate High
HR
*adjusted for age, exam year, smoking, drinking, family history, and abnormal ECG
Events 35 63 61 22 40 35 12 24 17
P trend=0.05 P trend=0.09 P trend=0.19
Multivariate adjusted HR of Nonfatal CVD, CHD, and MI, by Fitness Groups, ACLS, 5909 women
Sui X, LaMonte MJ, Blair SN. Am J Epidemiol 2007; 165:1413-23

Number of risk factors0
102030405060708090
100
0 1 ≥ 2
CVD
inci
denc
e ra
te
per 1
0,00
0 w
oman
-yea
rs Low Moderate HighP = 0.03
P = 0.32P = 0.17
*Risk factors include current smoking, hypertension, hypercholesterolemia, diabetes, and family history of CVD
Age and Exam year-adjusted CVD Incidence Rate by Fitness Groups, across Number of Risk
Factors, ACLS, 5909 womenSui X, LaMonte MJ, Blair SN. Am J Epidemio 2007; 165:1413-23

Diet, Fitness, and Health

Aerobics Center Longitudinal Study 13,621 men and women from ACLS Participants were followed for
mortality until 2003. One major dietary pattern emerged
and was tagged the Unhealthy Eating Index.
This pattern was characterized by high consumption of red and processed meat, white potato products, non-whole grains, added fat, and reduced consumption of non-citrus fruits.
Heroux M et al. Int J Epid. 2010; 39:197-209
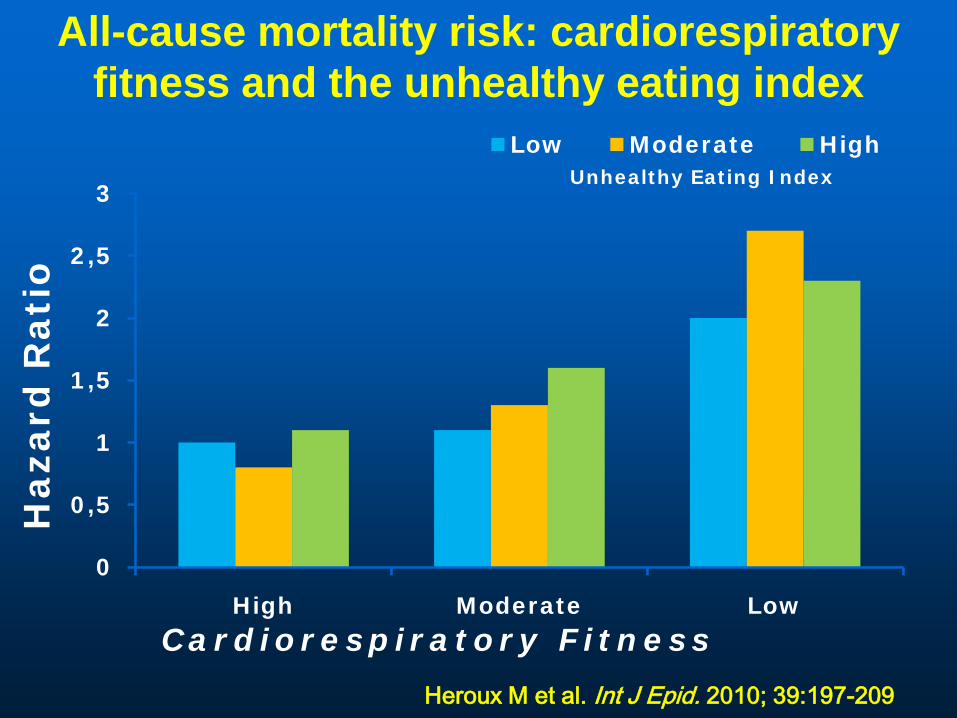
All-cause mortality risk: cardiorespiratory fitness and the unhealthy eating index
0
0,5
1
1,5
2
2,5
3
High Moderate Low
Low Moderate High
Cardiorespiratory Fitness
Haza
rd R
ati
o
Unhealthy Eating Index
Heroux M et al. Int J Epid. 2010; 39:197-209

Activity, Fitness, and Mortality in Older Adults

Cardiorespiratory Fitness and All-Cause Mortality, Women and Men ≥60 Years of Age 4060 women and men
≤60 years 989 died during ~14
years of follow-up ~25% were women Death rates adjusted
for age, sex, and exam year
05
1015202530354045
60-69 70-79 80+
LowModerateHigh
All-Cause death rates/1,000 PY
Age GroupsSui M et al. JAGS 2007.

0,2
0,3
0,4
0,5
0,6
0,7
0,8
0,9
1
1,1
1,2
≤4 4.1-5 5.1-6 6.1-7 7.1-8 8.1-9 >9
Entire Cohort (n=5314)
Age 65-70 y (n=2560)
Age>70 y (n=2754)
Mortality Risk in U.S. Veterans by Fitness CategoriesH
azar
d R
atio
Adjusted for age, peak METs achieved, resting systolic BP (mmHg), BMI, ethnicity, CVD, cardiovascular medications, and risk factors (hypertension, diabetes mellitus, dyslipidemia, and smoking)
Kokkinos P et al. Circulation 2010; 122:790-7

Prevalence of Self-reported Functional Limitations by Fitness and Age Groups
Age Groups (years)Fitness Group 40-49 50-59 60+WomenLow 18* 23 46Moderate 8 13 26High 7 3 18MenLow 7 14 24Moderate 3 5 9High 3 1 7*Prevalence (%)
Huang et al. MSSE 1998, 30:1430-5
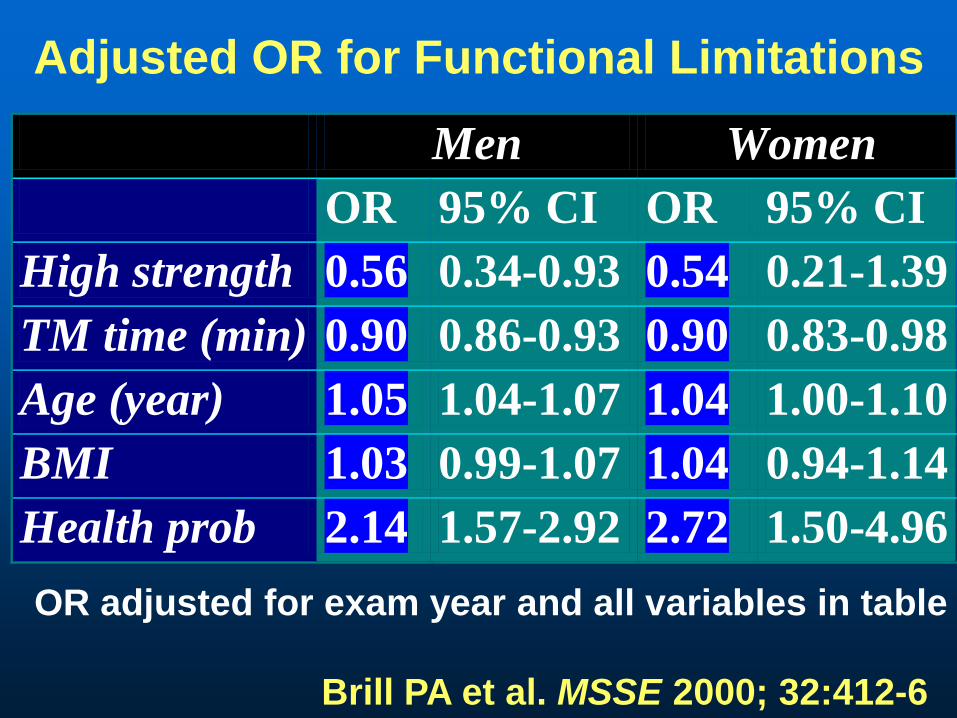
Adjusted OR for Functional Limitations
Men Women OR 95% CI OR 95% CI High strength 0.56 0.34-0.93 0.54 0.21-1.39 TM time (min) 0.90 0.86-0.93 0.90 0.83-0.98 Age (year) 1.05 1.04-1.07 1.04 1.00-1.10 BMI 1.03 0.99-1.07 1.04 0.94-1.14 Health prob 2.14 1.57-2.92 2.72 1.50-4.96
OR adjusted for exam year and all variables in table
Brill PA et al. MSSE 2000; 32:412-6

Cardiorespiratory Fitness and Risk of Dementia, ACLS
59,960 women and men Followed for 16.9 years
after clinic exam 4,108 individuals died
• 161 with dementia listed on the death certificate
Hazard ratio adjusted for age, sex, exam yr, BMI, smoking, alcohol, abnormal ECG, history of hypertension, diabetes, abnormal lipids, and health status
00.10.20.30.40.50.60.70.80.9
1
Low Moderate HighFitness Categories
Hazard Ratio
P for trend=0.002
Lui R et al. In Press. MSSE

8.58.7
7.5 7.98.0
6
7
8
9
10
0 6 12
Sco
re
Physical activitySuccessful aging
P<0.001
mo mo
Means estimated from repeated measures ANCOVA adjusted for gender, field center and baseline values
LIFE-P SPPB Score
J Gerontol Biol Sci Med Sci 2006;61:1157

Physical activityN=213
Successful agingN=211
p
Death 0.9% 0.9% >0.99Life threatening event 1.4% 1.4% >0.99Hospitalization 20.7% 20.9% >0.99Significant lab exam 2.8% 3.8% 0.60Any SAE 22.5% 23.7% 0.82
LIFE-P Serious adverse events
J Gerontol Biol Sci Med Sci 2006;61:1157
Muscular Strength and Mortality
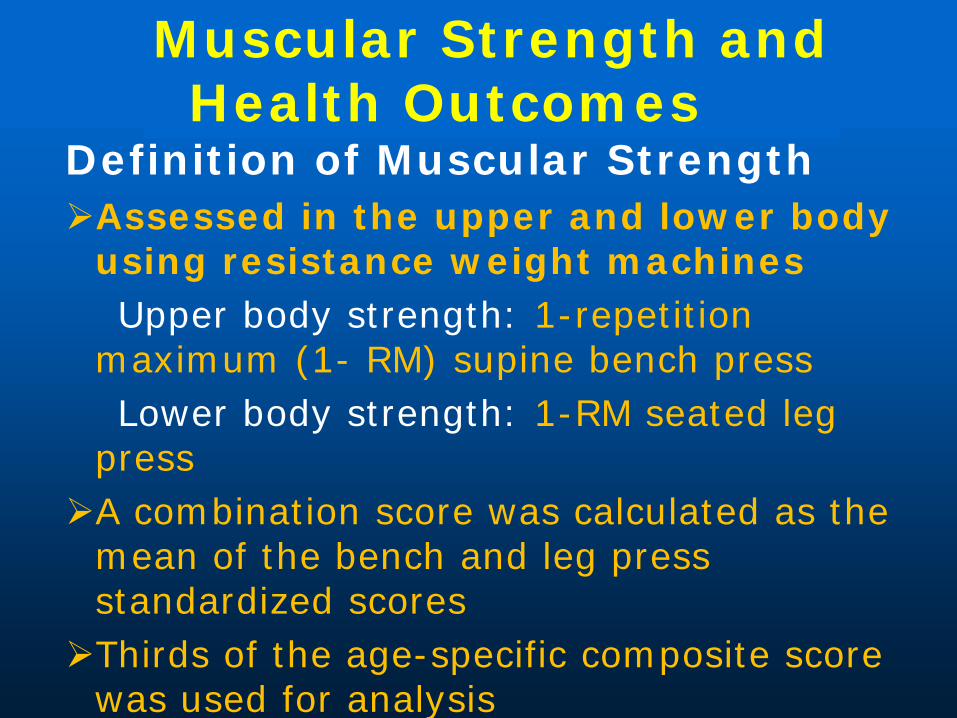
Muscular Strength and Health Outcomes
Definition of Muscular StrengthAssessed in the upper and lower body
using resistance weight machinesUpper body strength: 1-repetition
maximum (1- RM) supine bench pressLower body strength: 1-RM seated leg
pressA combination score was calculated as the
mean of the bench and leg press standardized scoresThirds of the age-specific composite score
was used for analysis

Thirds of Muscle Strength and Mortality, 8762 Men--ACLS
05
10152025303540
Age adj death rate/10,000
MY
All-Cause CVD
LowMiddleHigh
503 deaths (145 CVD) during average follow-up of 18.9 years
Ruiz J et al. BMJ 2008

Strength, Adiposity, and Cancer Mortality
0
0,2
0,4
0,6
0,8
1
1,2
Low Middle High
•8,677 men, 20-82 years•18.8 years of follow-up, 211 cancer deaths•Muscular strength assessed by 1-RM bench press and leg press •Significant trend across strength categories remained after further adjustment for BMI, % body fat, waist circumference, and cardiorespiratory fitness Thirds of Strength
Odds of Cancer Death*
*Adj for age, exam yr, smokingalcohol intake, and health status
P for trend=0.003
Ruiz J et al. Cancer EpidemiolBiomarkers Prev 2009; 18:1468

Multivariate-Adjusted HR for Incident Hypertension According to Thirds of Muscular Strength, ACLS,
4147 Men
0
0,2
0,4
0,6
0,8
1
1,2
LowestMiddleUpper
Strength Thirds
P for trend =0.009
195 161 147
Maslow AL, Sui X, Colabianchi N,…Blair SN. MSSE 2010;42:288-95
HR
*adjusted for age, exam year, smoking, drinking, BP and family history

Additional Adjusting CRF Eliminated the Observed Association Between
Muscular Strength and Hypertension
0
0,2
0,4
0,6
0,8
1
1,2
LowestMiddleUpper
Strength Thirds
P for trend =0.629
195 161 147
Maslow AL, Sui X, Colabianchi N,…Blair SN. MSSE 2010;42:288-95HR
*adjusted for age, exam year, smoking, drinking, BP, family history, and CRF

Summary
Attributable Fractions of Health Outcomes For Low Cardiorespiratory Fitness and
Other Predictors, ACLS
•Attributable fraction (%) is the estimated number of deaths due to a specific characteristic
•Based on strength of association•Prevalence of the condition

Attributable Fractions (%) forAll-Cause Deaths
40,842 Men & 12,943 Women, ACLS
02468
1012141618
Low CRF
Obese
Smoker
Hypertension
High Chol
Diabetes
MenWomen
Blair SN. Br J Sports Med 2009; 43:1-2.

Gain in Longevity for a 45-Year Old Male
5.8 years
8.7 years
0
2
4
6
8
10
Low vs Moderate Low vs High
Years of added life
Comparison of Low, Moderate, and High Fitness Levels

Thank youQuestions?


