Physical Growth Pattern of Settlements in a Traditional...
17
International Journal of Geosciences, 2014, 5, 1345-1360 Published Online October 2014 in SciRes. http://www.scirp.org/journal/ijg http://dx.doi.org/10.4236/ijg.2014.511110 How to cite this paper: Olayiwola, A.M., Ajala, O.A. and Sangodipe, J.A. (2014) Physical Growth Pattern of Settlements in a Traditional Region, Southwest Nigeria. International Journal of Geosciences, 5, 1345-1360. http://dx.doi.org/10.4236/ijg.2014.511110 Physical Growth Pattern of Settlements in a Traditional Region, Southwest Nigeria Adewale Mukhtar Olayiwola, Olayinka Akinsumbo Ajala, Johnson Adewale Sangodipe Department of Geography, Obafemi Awolowo University, Ile-Ife, Nigeria Email: [email protected] , [email protected] , [email protected] Received 14 August 2014; revised 12 September 2014; accepted 5 October 2014 Copyright © 2014 by authors and Scientific Research Publishing Inc. This work is licensed under the Creative Commons Attribution International License (CC BY). http://creativecommons.org/licenses/by/4.0/ Abstract The study examined the growth pattern of settlements in Oke-Ogun area of Oyo State, Nigeria be- tween 1984 and 2011; and predicted the future growth pattern of settlements in the study area. Both primary and secondary data were used for this study. Primary sources of data include Global Positioning System (GPS), Landsat TM and ETM+ imageries of 1984, 1990, 2000, and 2011. Secon- dary data included administrative map and population data of the study area. Descriptive statis- tics and geospatial technique were used to analyse the data collected. The results showed a ran- dom pattern of settlement distribution in the study area. Results revealed that settlements cov- ered about 0.52% of the total land area in 1984; 1.32% in 2000; and 3.78% in 2011. Whereas lin- ear pattern of growth characterised the periods between 1984 and 1990; clustering, infilling, and fringes were the patterns of growth that characterised the periods between 1990 and 2011. The study predicted that, at an average 1.2% of annual growth rate, settlements will occupy about 44.37% of the total land area by 2031. The study concluded that settlements in the study area varied in the patterns of distribution; the area was dominated by indigenous settlements type with overconcentration of social and economic infrastructures in few centres. Keywords Settlements, Distribution Patterns, Oke-Ogun, Land Use, Infrastructural Facilities, Spatial Disparity, Growth Pattern, Landscape Transition, Spatial Metrics 1. Introduction Settlements are known to change spatially with time, worldwide but the patterns of such changes vary and fac- tors that encourage spatial change are diverse [1]-[7]. Studies have shown that traditional urban settlements in Africa exhibit growth patterns that reflect the culture of the people rather than typical occurrences in developed
Transcript of Physical Growth Pattern of Settlements in a Traditional...

International Journal of Geosciences, 2014, 5, 1345-1360 Published Online October 2014 in SciRes. http://www.scirp.org/journal/ijg http://dx.doi.org/10.4236/ijg.2014.511110
How to cite this paper: Olayiwola, A.M., Ajala, O.A. and Sangodipe, J.A. (2014) Physical Growth Pattern of Settlements in a Traditional Region, Southwest Nigeria. International Journal of Geosciences, 5, 1345-1360. http://dx.doi.org/10.4236/ijg.2014.511110
Physical Growth Pattern of Settlements in a Traditional Region, Southwest Nigeria Adewale Mukhtar Olayiwola, Olayinka Akinsumbo Ajala, Johnson Adewale Sangodipe Department of Geography, Obafemi Awolowo University, Ile-Ife, Nigeria Email: [email protected], [email protected], [email protected] Received 14 August 2014; revised 12 September 2014; accepted 5 October 2014
Copyright © 2014 by authors and Scientific Research Publishing Inc. This work is licensed under the Creative Commons Attribution International License (CC BY). http://creativecommons.org/licenses/by/4.0/
Abstract The study examined the growth pattern of settlements in Oke-Ogun area of Oyo State, Nigeria be-tween 1984 and 2011; and predicted the future growth pattern of settlements in the study area. Both primary and secondary data were used for this study. Primary sources of data include Global Positioning System (GPS), Landsat TM and ETM+ imageries of 1984, 1990, 2000, and 2011. Secon-dary data included administrative map and population data of the study area. Descriptive statis-tics and geospatial technique were used to analyse the data collected. The results showed a ran-dom pattern of settlement distribution in the study area. Results revealed that settlements cov-ered about 0.52% of the total land area in 1984; 1.32% in 2000; and 3.78% in 2011. Whereas lin-ear pattern of growth characterised the periods between 1984 and 1990; clustering, infilling, and fringes were the patterns of growth that characterised the periods between 1990 and 2011. The study predicted that, at an average 1.2% of annual growth rate, settlements will occupy about 44.37% of the total land area by 2031. The study concluded that settlements in the study area varied in the patterns of distribution; the area was dominated by indigenous settlements type with overconcentration of social and economic infrastructures in few centres.
Keywords Settlements, Distribution Patterns, Oke-Ogun, Land Use, Infrastructural Facilities, Spatial Disparity, Growth Pattern, Landscape Transition, Spatial Metrics
1. Introduction Settlements are known to change spatially with time, worldwide but the patterns of such changes vary and fac-tors that encourage spatial change are diverse [1]-[7]. Studies have shown that traditional urban settlements in Africa exhibit growth patterns that reflect the culture of the people rather than typical occurrences in developed
A. M. Olayiwola et al.
1346
countries. Settlements in Africa are known to grow towards directional or multi-directional patterns, and can therefore
be distributed linearly or in clusters [2] [4] [8]-[12] based on the nature of factors that account for their growth. Factors influencing the patterns of settlements are diverse, and they include transportation and socio-economic activities [13], political fragmentation of the world, particularly the skewed areal and population sizes of states [14], distribution of infrastructural facilities and social amenities [5], economic development, population growth, industrialization, and urbanization [15], social networks and economic factors, such as unemployment and per capita income [16], topographical conditions [17].
Whilst studies exist on the specific influence of the different factors of urban growth in more developed coun-tries, existing concepts on the growth pattern of most settlements in Africa have neglected the influence of the African culture, probably because studies on settlement growth that are based on the African traditional regions are scarce. Most studies that have adopted the [18]’s concept of Central Place Theory and the latter version of [19] have suggested that their applicability in most regions of Africa are fraught with challenges [12] [20] [21]. For example, [20] argued that the Central Place Theory is mainly concerned with the way human settlements evolve, and are spaced out in many European settlements.
The processes of settlement growth pattern in many developing and populous countries, including Nigeria are characteristically different from those of the planned developed countries. For instance, [22] compared the spa-tial and temporal dynamic pattern of distribution and growth of five urban areas in the Yangtze River Delta re-gion of China over three periods, and indicated uneven patterns at the initial stage of the urban growth before the processes smoothened out with adequate planning.
In most of the developing countries, urbanisation is largely unplanned. Thus, information of the growth pat-terns is required to develop adequate plan and strategies for future settlement growth. Nigeria, for instance, is made up of different cultural groups and this study exemplifies the growth pattern of a traditional region in the southwest Nigeria. The objectives of this study are to 1) assess the growth pattern and direction in Oke-Ogun region in Nigeria, which typifies a Yoruba settlement region, 2) account for the forces of settlement growth pat-tern, and 3) predict the future settlement growth trends. The main hypothesis is that settlement growth in the tra-ditional African region is not well accounted for by the existing concepts on settlement growth.
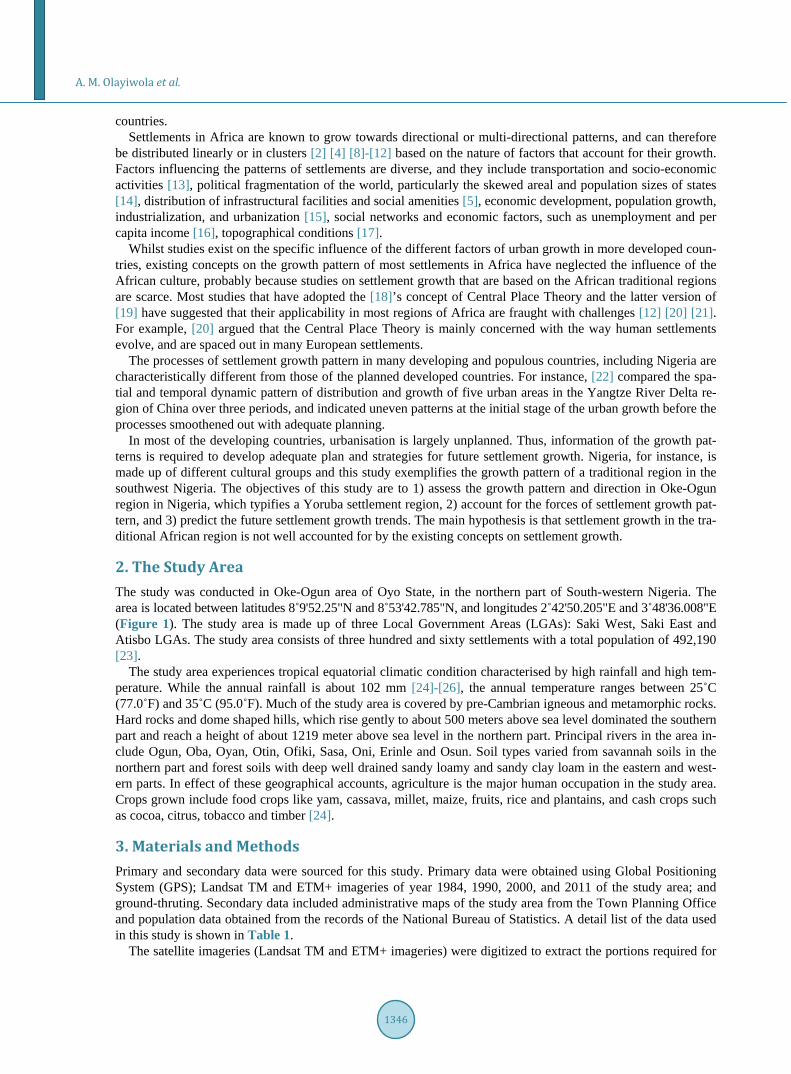
2. The Study Area The study was conducted in Oke-Ogun area of Oyo State, in the northern part of South-western Nigeria. The area is located between latitudes 8˚9'52.25"N and 8˚53'42.785"N, and longitudes 2˚42'50.205"E and 3˚48'36.008"E (Figure 1). The study area is made up of three Local Government Areas (LGAs): Saki West, Saki East and Atisbo LGAs. The study area consists of three hundred and sixty settlements with a total population of 492,190 [23].
The study area experiences tropical equatorial climatic condition characterised by high rainfall and high tem-perature. While the annual rainfall is about 102 mm [24]-[26], the annual temperature ranges between 25˚C (77.0˚F) and 35˚C (95.0˚F). Much of the study area is covered by pre-Cambrian igneous and metamorphic rocks. Hard rocks and dome shaped hills, which rise gently to about 500 meters above sea level dominated the southern part and reach a height of about 1219 meter above sea level in the northern part. Principal rivers in the area in-clude Ogun, Oba, Oyan, Otin, Ofiki, Sasa, Oni, Erinle and Osun. Soil types varied from savannah soils in the northern part and forest soils with deep well drained sandy loamy and sandy clay loam in the eastern and west-ern parts. In effect of these geographical accounts, agriculture is the major human occupation in the study area. Crops grown include food crops like yam, cassava, millet, maize, fruits, rice and plantains, and cash crops such as cocoa, citrus, tobacco and timber [24].
3. Materials and Methods Primary and secondary data were sourced for this study. Primary data were obtained using Global Positioning System (GPS); Landsat TM and ETM+ imageries of year 1984, 1990, 2000, and 2011 of the study area; and ground-thruting. Secondary data included administrative maps of the study area from the Town Planning Office and population data obtained from the records of the National Bureau of Statistics. A detail list of the data used in this study is shown in Table 1.
The satellite imageries (Landsat TM and ETM+ imageries) were digitized to extract the portions required for
A. M. Olayiwola et al.
1347
Figure 1. The study area. Source: Administrative maps of the study area, 2010.
Table 1. Data types and sources.
Material Source Year Scale/Path & Row Resolution Relevance
Landsat TM & ETM+ http://glcf.umiacs.umd.edu 1984-2011 Path 191, Row 54. For all 30 m Classification, landscape pattern,
change process, and CA with Markov
Administrative map LG. Town Planning Office 1999 1:100,000 - Base map of the study area
Population data National Bureau of Statistics/NPC 1991 - - To derive population density
GPS Field survey 2011 - - Coordinates of settlements and infrastructures
A. M. Olayiwola et al.
1348
the study. Classification of the selected settlements was carried out through image enhancement, contrast stret- ching, and false colour composition. CA_MARKOV, a combination of Cellular Automata and Markov Chain/ Multi-Criteria/Multi-Objective Land Allocation (MOLA) land cover prediction procedures, was used to develop a spatially explicit contiguity-weighting factor. Based on this, the Markov transition probability matrix was computed and fed into Cellular Automata. The results are presented in map to show the trend of future growth and pattern of settlements in the study area. In addition, spatial metrics of the study area were computed both at the landscape level and at the class of land use level. At the landscape level, NP was computed to measure the extent of subdivision or fragmentation of the patch type.
Furthermore, a test of spatial disparity in the distribution of settlements in the selected LGAs of Oke-Ogun was carried out using Nearest Neighbour Statistical Analysis. In addition, the rate at which the settlements grew over the years was calculated using a settlement expansion formula represented as:
r A 100nAο= ∆ × (1)
where: r = Growth rate; ΔA = Change in area extent between 1984 and 2011; n = Number of years (interval between 1984 and 2011); Aο = Area extent of the base year (1984) [27].
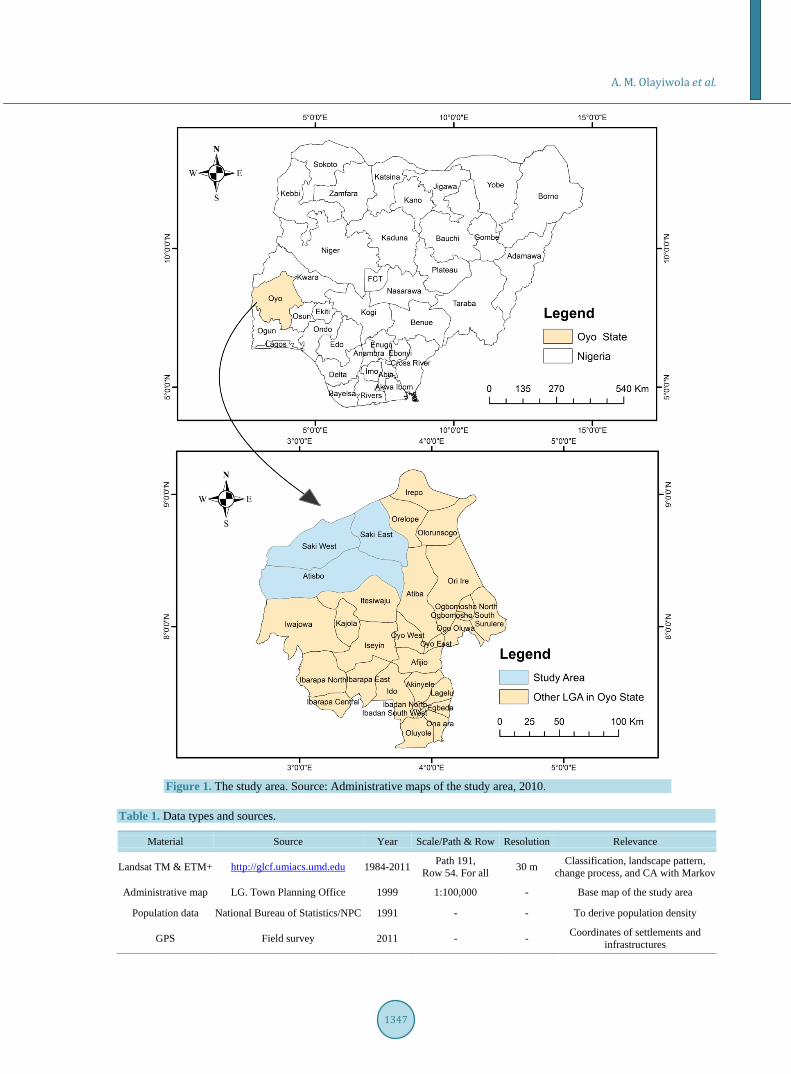
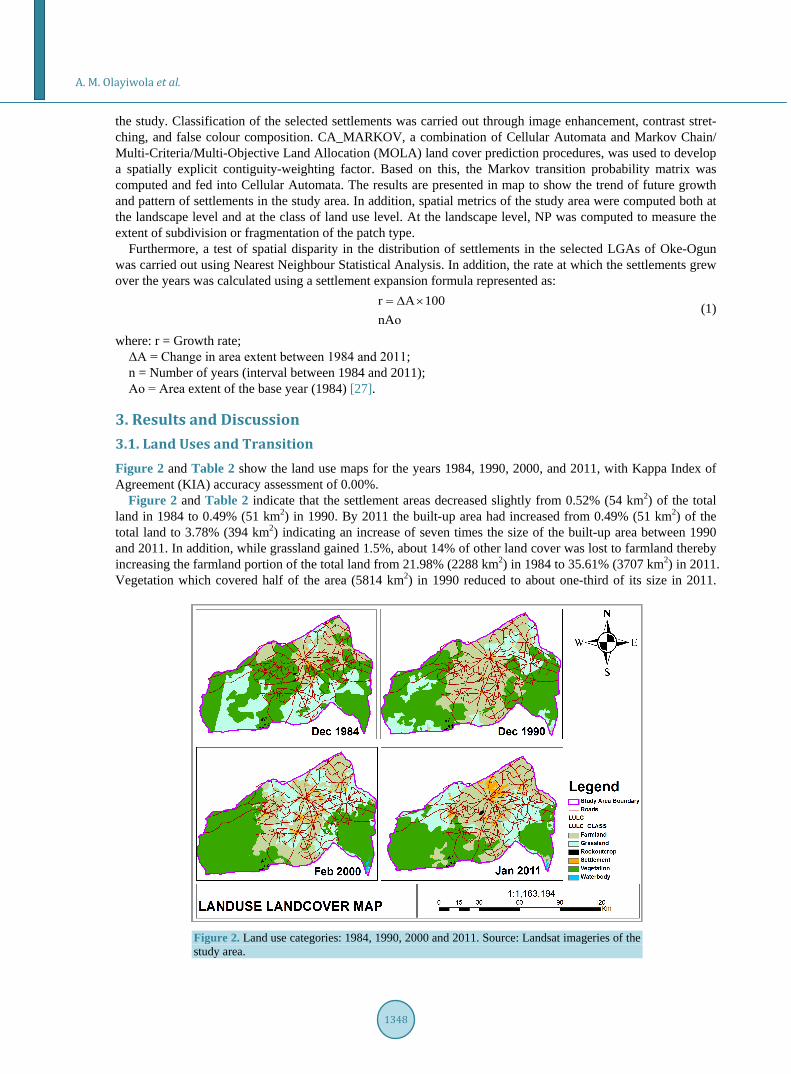
3. Results and Discussion 3.1. Land Uses and Transition Figure 2 and Table 2 show the land use maps for the years 1984, 1990, 2000, and 2011, with Kappa Index of Agreement (KIA) accuracy assessment of 0.00%.
Figure 2 and Table 2 indicate that the settlement areas decreased slightly from 0.52% (54 km2) of the total land in 1984 to 0.49% (51 km2) in 1990. By 2011 the built-up area had increased from 0.49% (51 km2) of the total land to 3.78% (394 km2) indicating an increase of seven times the size of the built-up area between 1990 and 2011. In addition, while grassland gained 1.5%, about 14% of other land cover was lost to farmland thereby increasing the farmland portion of the total land from 21.98% (2288 km2) in 1984 to 35.61% (3707 km2) in 2011. Vegetation which covered half of the area (5814 km2) in 1990 reduced to about one-third of its size in 2011.
Figure 2. Land use categories: 1984, 1990, 2000 and 2011. Source: Landsat imageries of the study area.
A. M. Olayiwola et al.
1349
Table 2. Land use/cover statistics.
Category 1984 1990 2000 2011
Area (km2) % Area (km2) % Area (km2) % Area (km2) %
Farmland 2288 21.98 3501 33.63 3320 31.89 3707 35.61
Vegetation 5814 55.85 4578 43.98 4719 45.33 3849 36.97
Grassland 2233 21.45 2255 21.66 2179 20.93 2401 23.06
Settlement 54 0.52 51 0.49 137 1.32 394 3.78
Water body 3 0.03 5 0.05 39 0.37 33 0.32
Rock 18 0.17 18 0.17 17 0.16 26 0.25
Total 10,410 100.00 10,410 100.00 10410 100.00 10,410 100.00
Source: Derived from Figure 2. Water and rock surfaces exhibited a small pattern of change which is less than 0.05% (Figure 2 and Table 2). All of these observations are indications of spatial patterns toward urbanization.
3.2. Processes of Land Use Transformation in Oke-Ogun, Southwest Nigeria Planners and policy makers are usually bothered about the negative effects of landscape fragmentation and het-erogeneous development. Reference [7] observed that there are two processes that can result in these effects, namely the reduction of the total amount of land with a specific land use, and the breaking up of land into smaller patches (increase in isolation of the land use patches).
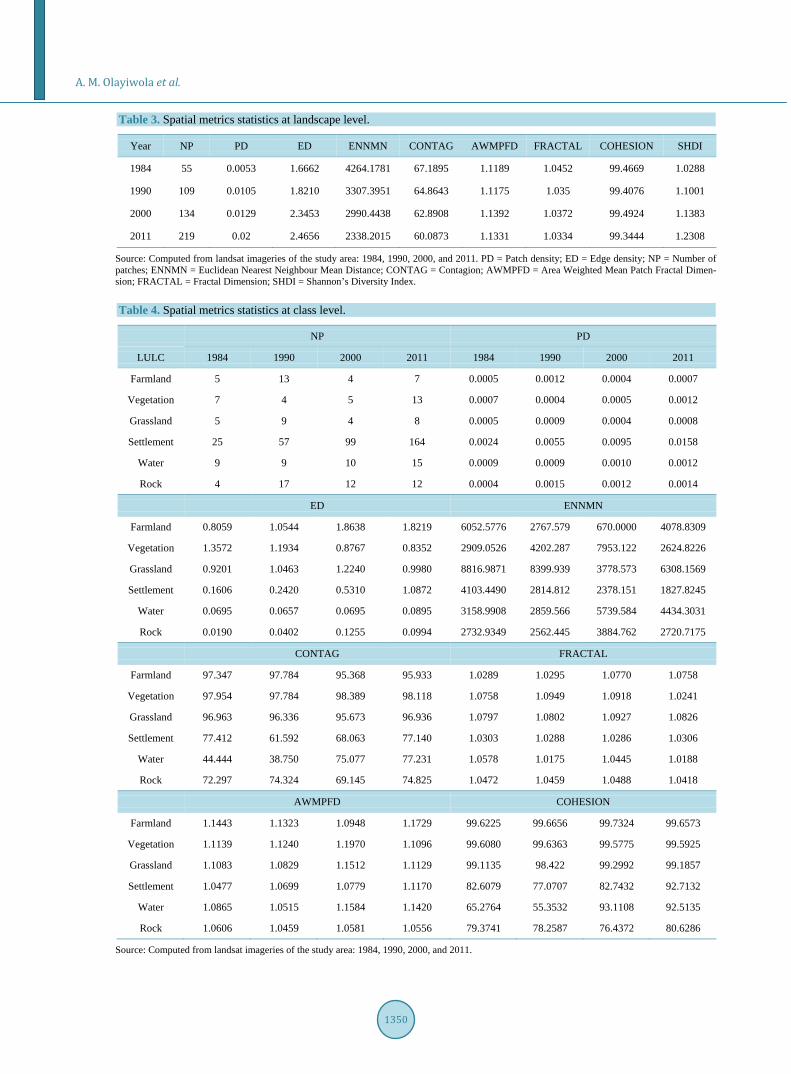
Table 3 shows that there was significant increase in the number of patches in the study area, which is an in-dication that the degree of fragmentation increased as the years advanced [1] [28] [29]. The PD in the study area increased from 0.005 in 1984 to 0.02 in 2011. The number of new patches in the landscape gradually increased in 1990 leading to increase in PD thereby creating new edge segments and, hence, increase in ED. This slight increase in ED was as a result of land use fragmentations emanating from land use changes. High increase in ED was observed mainly in the vegetation, farmland, grassland, and the built-up areas.
The transformation of land uses between 1984 and 2011 reduced the proximity (ENNMN) of the neighbour-ing land use patches. The decreased in the ENNMN can be attributed to the expansion of the built-up areas and encroachment of vegetation into farmland areas. The AWMPFD increased slightly from 1984 to 2000 and de-clined in 2011 indicating the degree at which the shapes of the patches became more complex in later years. This may be due to road network expansion towards the rural areas in 1984 and 1990 as confirmed by the dis-section change process. In effect of a growing dispersion and fragmentation of the landscape in the study area, there was a decreasing trend in CONTAG.
Expansion of settlements plays a key role in increasing the heterogeneity of the landscape. A temporal reduc-tion of the CONTAG and increase in the values of PD, SHDI, and ED indicate a higher degree of land fragmen-tation and increasing landscape heterogeneity in the study area. The ED of farmland remained higher than that of other land uses. However, this dominancy could cause higher ED values. A noticeable change is observed in the ED of vegetation and grassland. The ED and PD of settlements also correlated each other in 2000 and 2011 because increase in PD leads to increase in ED as a result of new edge segmentation formed. The trend of unor-dered individual housing development especially in the fringe areas in the corresponding decades enhanced the fragmentation and the heterogeneous landscape development.
At the class level, NP was the most valuable because it was the basis for computing other more interpretable metrics (Table 4). All classes of land use have higher number of patches with settlement recording highest in-crease in the number of the patches. Again, this is an evidence of fragmentation, onset of complexity and het-erogeneity over the landscape. In the case of PD, changes were observed in all the classes. The land between the settlements and surrounding areas were very wide, though in fractions. Therefore, this caused low fragmentation and increases proximity of the ENNMN between the neighbouring patches of similar land uses. Thus, in 1990 and 2011 growth phases and in all classes of land uses, the patches were not less than 1000 metres distance to
A. M. Olayiwola et al.
1350
Table 3. Spatial metrics statistics at landscape level.
Year NP PD ED ENNMN CONTAG AWMPFD FRACTAL COHESION SHDI
1984 55 0.0053 1.6662 4264.1781 67.1895 1.1189 1.0452 99.4669 1.0288
1990 109 0.0105 1.8210 3307.3951 64.8643 1.1175 1.035 99.4076 1.1001
2000 134 0.0129 2.3453 2990.4438 62.8908 1.1392 1.0372 99.4924 1.1383
2011 219 0.02 2.4656 2338.2015 60.0873 1.1331 1.0334 99.3444 1.2308
Source: Computed from landsat imageries of the study area: 1984, 1990, 2000, and 2011. PD = Patch density; ED = Edge density; NP = Number of patches; ENNMN = Euclidean Nearest Neighbour Mean Distance; CONTAG = Contagion; AWMPFD = Area Weighted Mean Patch Fractal Dimen-sion; FRACTAL = Fractal Dimension; SHDI = Shannon’s Diversity Index. Table 4. Spatial metrics statistics at class level.
NP PD
LULC 1984 1990 2000 2011 1984 1990 2000 2011
Farmland 5 13 4 7 0.0005 0.0012 0.0004 0.0007
Vegetation 7 4 5 13 0.0007 0.0004 0.0005 0.0012
Grassland 5 9 4 8 0.0005 0.0009 0.0004 0.0008
Settlement 25 57 99 164 0.0024 0.0055 0.0095 0.0158
Water 9 9 10 15 0.0009 0.0009 0.0010 0.0012
Rock 4 17 12 12 0.0004 0.0015 0.0012 0.0014
ED ENNMN
Farmland 0.8059 1.0544 1.8638 1.8219 6052.5776 2767.579 670.0000 4078.8309
Vegetation 1.3572 1.1934 0.8767 0.8352 2909.0526 4202.287 7953.122 2624.8226
Grassland 0.9201 1.0463 1.2240 0.9980 8816.9871 8399.939 3778.573 6308.1569
Settlement 0.1606 0.2420 0.5310 1.0872 4103.4490 2814.812 2378.151 1827.8245
Water 0.0695 0.0657 0.0695 0.0895 3158.9908 2859.566 5739.584 4434.3031
Rock 0.0190 0.0402 0.1255 0.0994 2732.9349 2562.445 3884.762 2720.7175
CONTAG FRACTAL
Farmland 97.347 97.784 95.368 95.933 1.0289 1.0295 1.0770 1.0758
Vegetation 97.954 97.784 98.389 98.118 1.0758 1.0949 1.0918 1.0241
Grassland 96.963 96.336 95.673 96.936 1.0797 1.0802 1.0927 1.0826
Settlement 77.412 61.592 68.063 77.140 1.0303 1.0288 1.0286 1.0306
Water 44.444 38.750 75.077 77.231 1.0578 1.0175 1.0445 1.0188
Rock 72.297 74.324 69.145 74.825 1.0472 1.0459 1.0488 1.0418
AWMPFD COHESION
Farmland 1.1443 1.1323 1.0948 1.1729 99.6225 99.6656 99.7324 99.6573
Vegetation 1.1139 1.1240 1.1970 1.1096 99.6080 99.6363 99.5775 99.5925
Grassland 1.1083 1.0829 1.1512 1.1129 99.1135 98.422 99.2992 99.1857
Settlement 1.0477 1.0699 1.0779 1.1170 82.6079 77.0707 82.7432 92.7132
Water 1.0865 1.0515 1.1584 1.1420 65.2764 55.3532 93.1108 92.5135
Rock 1.0606 1.0459 1.0581 1.0556 79.3741 78.2587 76.4372 80.6286
Source: Computed from landsat imageries of the study area: 1984, 1990, 2000, and 2011.

A. M. Olayiwola et al.
1351
one another. However, at the wake of 2000-2011 study period, the proximity of the farmland reduced to less than 1000 metres but rose again before the close of the phase. This is an evidence of low unordered level of socio-economic development in the study area. The ENNMN of settlement areas decreased of from 4000 meters in 1984 to less than 2000 meters in 2011. This indicates that the growth process was confined mostly in the margins of the existing built-up areas thereby leading to lower degree of isolation.
The CONTAG of farmland, vegetation and grassland are maximally aggregated, this conclusion was based on their low edge density (when a single class occupies a very large percentage of the landscape) that leads to high contagion value: a higher value very close to 100%, the implication is that these classes of land use are not highly fragmented. Settlement, water body and rock are averagely aggregated with values above 50%, especially the settlement as a focus of this study; this implies that the area is spatially distributed, though in terms of loca-tions of each settlement, they are aggregated.
Fractal Dimension Index (FRACTAL) ranged between 1 and 2 reflecting a shape complexity across a range of patch sizes. The general FRACTAL value of all the classes of land uses was greater than 1. However, indi-vidual land use produced different values: whereas each of the farmland, vegetation and grassland yielded FRACTAL values of greater than 1, the built-up area produced a value of less than 1. However, rehabilitation and expansion of roads into villages in the 2000-2011 growth phase significantly increased the shape complexity of the built-up areas resulting in a highly convoluted, plane-filing shape perimeter.
Patch Cohesion Index (COHESION) measures the physical connectedness of the corresponding patch type. The Cohesion Index indicated that the physical connectedness of the general land use decreased between 1984 and 1990, but rose between 1990 and 2000. The index decreased again between 2000 and 2011. However, the ED and CONTAG values showed that the farmland, vegetation and grassland areas were maximally aggregated. Since, the higher the degree of aggregation, the higher the degree of physical connectedness, and therefore such land uses with higher degree of aggregation were highly connected. The degree of physical connectedness of the built-up areas gradually increased over time, indicating the merging of the previously segregated parts of the built-up areas such as the city core and fringe areas. The ED, CONTAG, and COHESION are strongly interde-pendent.
Resulting from the spatial metrics analysis, the degree of spatial concentration and dispersion of settlements in the study area yielded a value of 1 (SHDI = 1). This confirms that the growth pattern of settlements in the study area was spatially random.
3.3. Spatial Change Process Involved in the Landscape Pattern Dynamics The rate of growth and change processes were computed using urban expansion formula adopted by [27].
r A 100nAο= ∆ ×
∴ r = 333011.95/27(1040886.875) × 100; r = 1.2% (annual growth rate);
where: r = Growth rate. ΔA = Change in area extent between 1984 and 2011; n = Number of years (interval between 1984 & 2011); Aο = Area extent of the base year (1984). The result of the computed rate of spatial growth and change process was 1.2% annually. Based on this result,
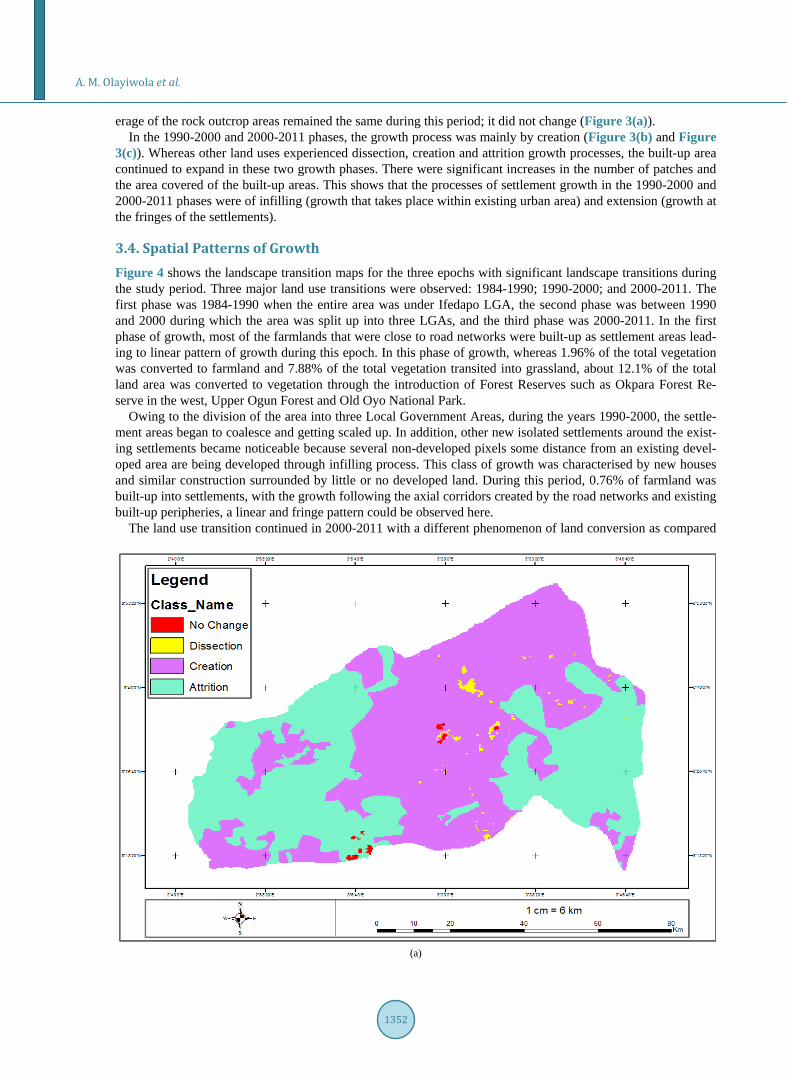
the change processes in the study area were found to be associated with dissection, creation, and attrition. How-ever, there were some areas that did not change. In the 1984-1990 growth phase, the number of patches of ho-mogenous area representing the built-up areas increased while the area coverage decreased. The built-up area grew along the road networks through a dissection process. Reference [30] concluded that dissection is associ-ated with the roads or similar linear structures, usually anthropogenic. Therefore, the growth process of the built-up area identified in this phase was of a linear pattern with infill (growth that takes place within existing settlement area), and with this, one can infer that the causal factors were expansion of the road networks and the location of the central market. In addition, during the 1984-1990 period, the growth of farmland areas was by creation process with significant increase in both the number of patches and the area coverage. Furthermore, both number of patches and area coverage of the vegetation area decreased through attrition process. The long run effect of this process, if not controlled, could result into deforestation. The number of patches and area cov-
A. M. Olayiwola et al.
1352
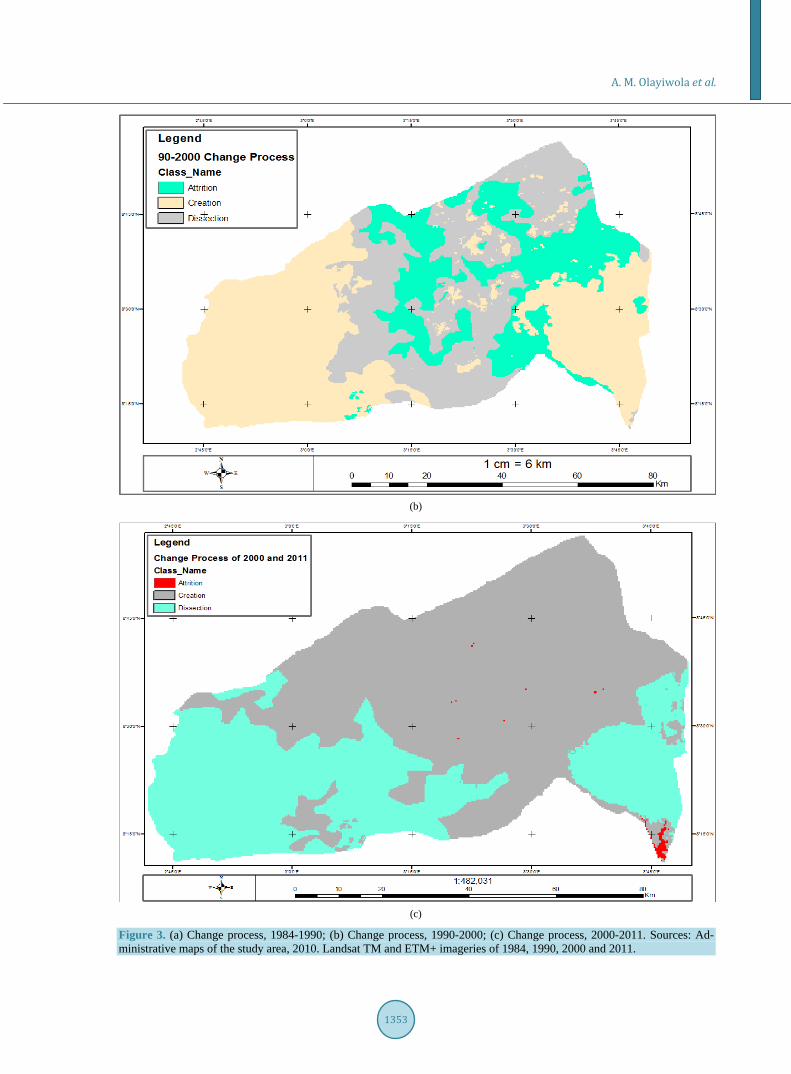
erage of the rock outcrop areas remained the same during this period; it did not change (Figure 3(a)). In the 1990-2000 and 2000-2011 phases, the growth process was mainly by creation (Figure 3(b) and Figure
3(c)). Whereas other land uses experienced dissection, creation and attrition growth processes, the built-up area continued to expand in these two growth phases. There were significant increases in the number of patches and the area covered of the built-up areas. This shows that the processes of settlement growth in the 1990-2000 and 2000-2011 phases were of infilling (growth that takes place within existing urban area) and extension (growth at the fringes of the settlements).
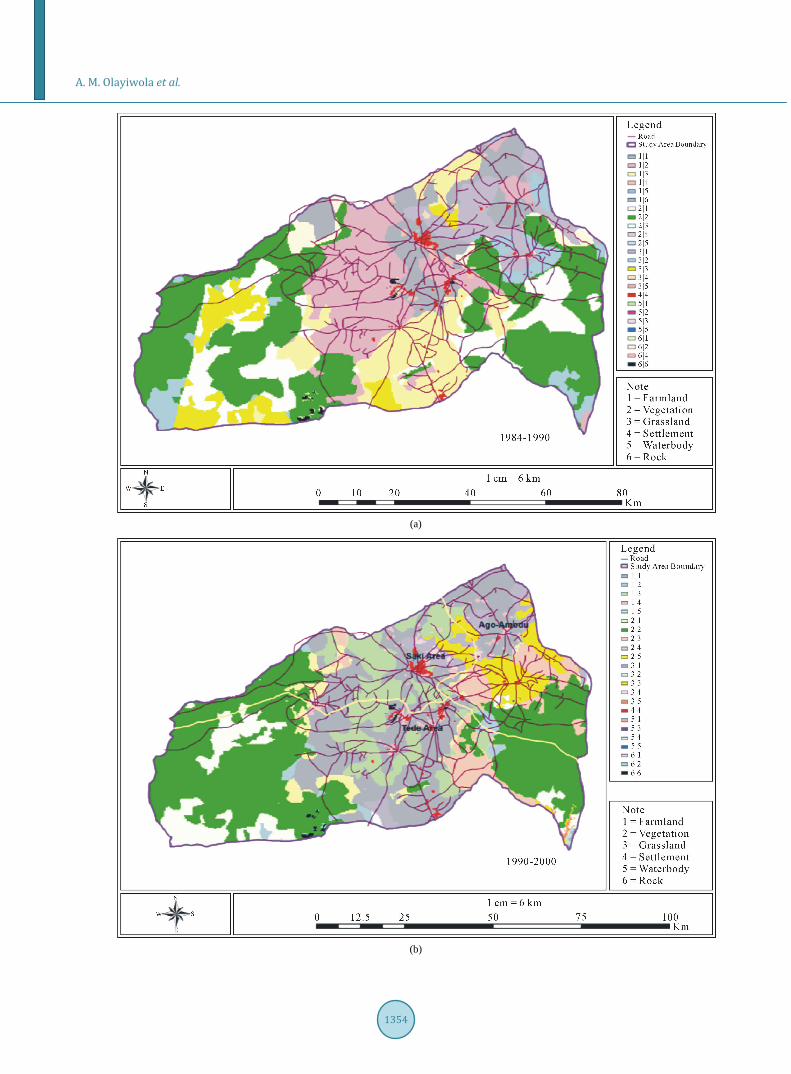
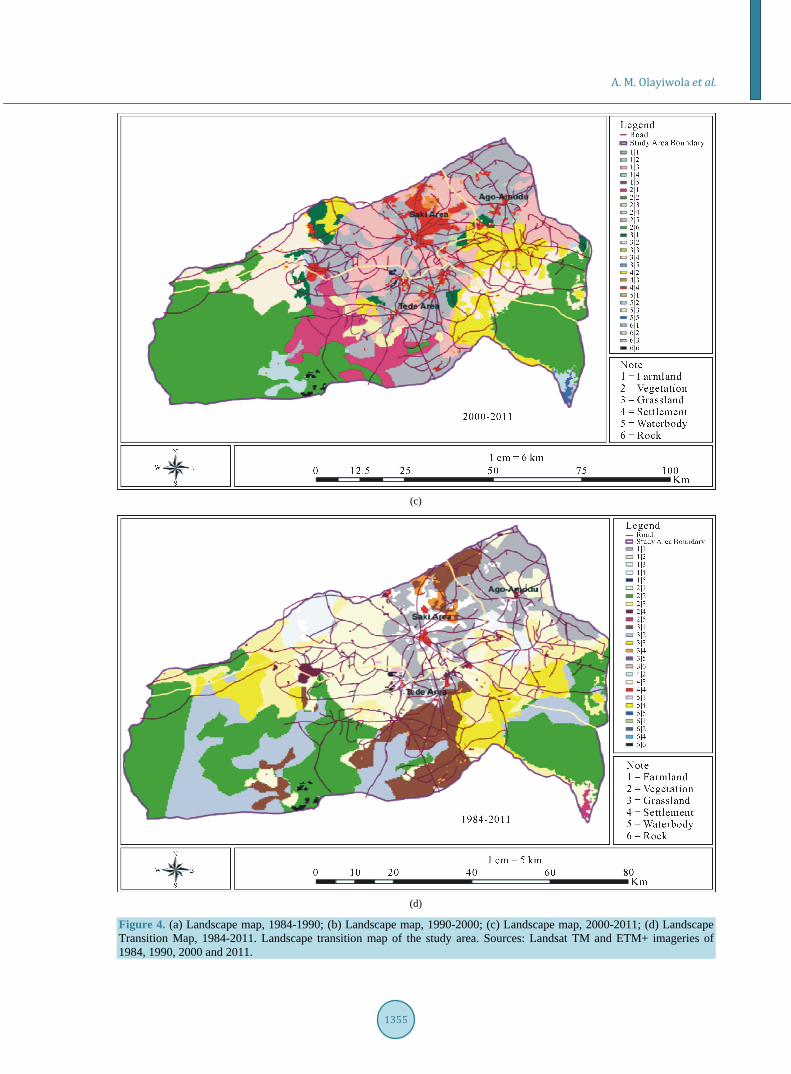
3.4. Spatial Patterns of Growth Figure 4 shows the landscape transition maps for the three epochs with significant landscape transitions during the study period. Three major land use transitions were observed: 1984-1990; 1990-2000; and 2000-2011. The first phase was 1984-1990 when the entire area was under Ifedapo LGA, the second phase was between 1990 and 2000 during which the area was split up into three LGAs, and the third phase was 2000-2011. In the first phase of growth, most of the farmlands that were close to road networks were built-up as settlement areas lead-ing to linear pattern of growth during this epoch. In this phase of growth, whereas 1.96% of the total vegetation was converted to farmland and 7.88% of the total vegetation transited into grassland, about 12.1% of the total land area was converted to vegetation through the introduction of Forest Reserves such as Okpara Forest Re-serve in the west, Upper Ogun Forest and Old Oyo National Park.
Owing to the division of the area into three Local Government Areas, during the years 1990-2000, the settle-ment areas began to coalesce and getting scaled up. In addition, other new isolated settlements around the exist-ing settlements became noticeable because several non-developed pixels some distance from an existing devel-oped area are being developed through infilling process. This class of growth was characterised by new houses and similar construction surrounded by little or no developed land. During this period, 0.76% of farmland was built-up into settlements, with the growth following the axial corridors created by the road networks and existing built-up peripheries, a linear and fringe pattern could be observed here.
The land use transition continued in 2000-2011 with a different phenomenon of land conversion as compared
(a)
A. M. Olayiwola et al.
1353
(b)
(c)
Figure 3. (a) Change process, 1984-1990; (b) Change process, 1990-2000; (c) Change process, 2000-2011. Sources: Ad-ministrative maps of the study area, 2010. Landsat TM and ETM+ imageries of 1984, 1990, 2000 and 2011.
A. M. Olayiwola et al.
1354
(a)
(b)
A. M. Olayiwola et al.
1355
(c)
(d)
Figure 4. (a) Landscape map, 1984-1990; (b) Landscape map, 1990-2000; (c) Landscape map, 2000-2011; (d) Landscape Transition Map, 1984-2011. Landscape transition map of the study area. Sources: Landsat TM and ETM+ imageries of 1984, 1990, 2000 and 2011.
A. M. Olayiwola et al.
1356
to the previous phase. Some parts of the built-up area was lost to farmland (2.06%), vegetation (0.23%), and 0.66% to grassland. This is a very rare case in settlement transformations. The cause was attributed to a monar-chy crisis that ensued in 2002 in some parts of the study area, which resulted into house burning and general de-struction of properties. In effect, many people fled for their lives in exile for years. The physiographic milieu created by this trauma is still obvious in the up till the time of this research. In the 2000-2011 growth phase, about one-third of the farmland was transformed to grassland, while 2.87% was converted to vegetation. Also, the vegetation land-cover lost 4.42% of its area to farmland, 0.94% transited to grassland and 0.01% to settle-ment. In Saki West LGA which lies towards the northern part of the study, settlements were more aggregated, and the built-up area increased and concentrated resulting in clustering pattern of growth. In Saki East and At-sibo LGAs, settlements were less aggregated, thus the degree of physical connectedness was very low. Infilling, linear, and fringe were the observed patterns of growth in these parts of the study area. On the whole, Figure 4 (1984-2011) indicates that agglomeration between the patches started in 1990, particularly in Saki area. Refill development connecting the several fringe patches and more heterogeneous landscape development in the exist-ing built-up periphery characterised the 2000 and 2011 periods. Series of isolated settlements in small patches were found in almost every part of the study area.
3.5. Spatial Pattern of Settlements Distribution in Oke-Ogun The results of the Nearest Neighbour Analysis (Rn) based on LGA level reveals that Rn in Saki West LGA and Saki East LGA is 1.13, while the Rn for ATISBO LGA is 1.52. Going by these results, the indication is that spa-tial distribution of settlements in Saki West and East LGAs is random, but moving towards perfectly random. In the case of ATISBO LGA, the spatial distribution pattern of settlements is perfectly random (Table 5). Refer-ence [31] presented a scale of Rn values indicating the various spatial distribution patterns of settlements. Ac-cording to him, Rn value of 0.0 - 0.49 indicates a situation of “Perfectly Clustered”; 0.5 - 0.99 is “Clustered”; 1.0 - 1.49 is “Random”; 1.5 - 1.99 indicates “Perfectly Random”; 2.0 - 2.5 shows “Regular”; and if Rn is greater than 2.5, the pattern is “Perfectly Regular”. In other words, when the results are compared with the King’s Rn Scale, the result of the first two LGAs exhibit random distribution, though moving toward perfect random dis-tribution, but the result of the third LGA shows a perfectly random distribution of settlements.
On a general note, Random Settlement pattern distributions is simply an indication or characteristic of an in-digenous settlements with low centrality rank, low access to services and facilities, low population growth, and high poverty incidence [33]. Also, Random scatter of settlements is primarily due to homogenous physical space with respect to level land, soil fertility, availability of ground water, irrigation facility and above all, the social composition [7]. Based on the predominant primary activities of the study area, random pattern of distribution of settlements could be associated with the homogenous physical space with respect to level land, soil fertility and availability of ground water. Reference [34] comments that if settlements are in an area of uniform or flat to-pography, it implies that the settlements are ecologically suitable for farming, good for road network and distri-bution of infrastructural facilities and above all, they attract a larger population.
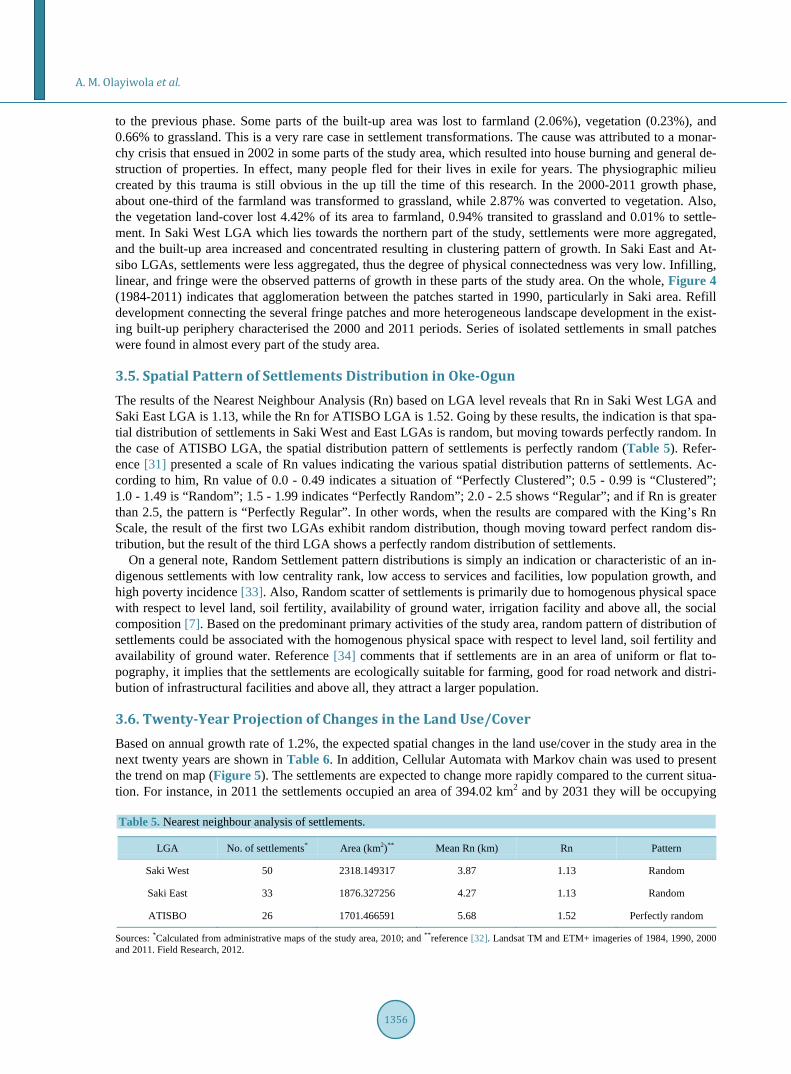
3.6. Twenty-Year Projection of Changes in the Land Use/Cover Based on annual growth rate of 1.2%, the expected spatial changes in the land use/cover in the study area in the next twenty years are shown in Table 6. In addition, Cellular Automata with Markov chain was used to present the trend on map (Figure 5). The settlements are expected to change more rapidly compared to the current situa-tion. For instance, in 2011 the settlements occupied an area of 394.02 km2 and by 2031 they will be occupying Table 5. Nearest neighbour analysis of settlements.
LGA No. of settlements* Area (km2)** Mean Rn (km) Rn Pattern
Saki West 50 2318.149317 3.87 1.13 Random
Saki East 33 1876.327256 4.27 1.13 Random
ATISBO 26 1701.466591 5.68 1.52 Perfectly random
Sources: *Calculated from administrative maps of the study area, 2010; and **reference [32]. Landsat TM and ETM+ imageries of 1984, 1990, 2000 and 2011. Field Research, 2012.
A. M. Olayiwola et al.
1357
Table 6. Expected changes in the land use/cover in the next twenty years.
Land uses Land uses in 2011 Expected land uses by 2031
Expected change in 2031 (km2) % Change
Farmland 3707.0162 4337.2718000 630.2556 14.53
Vegetation 3848.64415 3028.9527500 −819.6914 −27.06
Grassland 2400.604975 2279.4019750 −121.203 −5.32
Settlement 394.021975 708.2519750 314.23 44.37
Water body 32.7697 25.9239750 −6.845725 − 26.41
Rock 25.81175 29.0662750 3.254525 11.20
Total 10408.86875 10408.86875
Source: Computed from landsat imageries of the study area: 1984, 1990, 2000, and 2011.
Figure 5. Twenty-year growth projection. Sources: Projection based on Landsat TM and ETM+ imageries of 1984, 1990, 2000 and 2011.
an area of 708.25 km2, representing 44.37% change.
Cellular Automata (CA) was used to explain the spatial distribution of occurrences within each land use cate-gory. CA_Markov uses the output from the Markov Chain Analysis to apply a contiguity filter to “grow out” land use. The result revealed that the expected spatial changes of the settlements will be more visible at the fringes, probably, following the road network. While some of the small settlements will pass through scaling-up processes of growth, some others will be growing through infilling and outlaying processes. The expected spa-tial growth pattern of settlements in the next twenty years is presented in Figure 6.

A. M. Olayiwola et al.
1358
Figure 6. Expected spatial growth pattern of settlements by 2031. Sources: Landsat TM and ETM+ imageries of 1984, 1990, 2000 and 2011.
4. Summary In this study, spatial and temporal growth patterns of settlements have been investigated in Oke-Ogun Area of Oyo State, Nigeria, using descriptive statistics, remote sensing and spatial metrics techniques. The study re-vealed that pattern of settlements in the study area is random; while the pattern of settlements in ATISBO LGA was perfectly random, it was just random in Saki West and East LGAs.
Spatial pattern of changes was determined using land use/cover of the area in four different epochs. The result showed dynamics of spatial pattern changes among various classes of land use/cover with their transition proc-esses. The growth pattern of settlements was discovered to be in various directions following the trend of the road network in many parts of the study area. The general landscape pattern (both at the landscape level and at the class level) of the areas was determined using spatial metrics; the result showed an indication of complexity with high level of heterogeneity specifically the settlements.
As the landscape keeps transforming, getting more complex, fragmented and building more patches especially the settlements, there is a process underway. Three major growth processes were found to be in progress in the study area, these are attrition, dissection and creation. In addition, the annual growth rate of the built-up area was found to be 1.2%.
The future growth pattern of settlements in the study area was projected to the next 20 years using CA_ Markov. The expected growth pattern for the next 20 years showed that infilling, outlying, and isolated kind of growth pattern will be experienced both at the core and fringe of the settlements.
5. Conclusions Settlements appear to be the most dynamic human element over the earth’s surface. It needs serious geographi-cal investigations and scientific explorations. This study, which examined the pattern of settlements’ growth in Oke-Ogun area of Oyo State, Nigeria, found the settlements in the area to be expanding on their fringes; there-

A. M. Olayiwola et al.
1359
fore, there is the need to give physical development laudable priorities. The study revealed that there was spatial disparity in the pattern of settlements’ growth. Also, there was over concentration of central place functions in few places. The dominant growth process of settlements in the study area was attributed to creation process where both the settlement and area patches were increasing simultaneously. The result of landscape analysis showed that the area was becoming more heterogeneous and the trend of growth was toward the road network. Hence, the growth of settlements is more obvious at the fringe area. If this trend continues unabated, it may re-sult in the expansion of urban centres into rural areas. In effect of this, the agricultural lands would be converted into other uses which in turn may translate into food scarcity in the area and, consequently affecting the national economy.
In addition, there was lop-sidedness in the location of infrastructural facilities; they were concentrated in a few favoured centres. This has culminated into upsurge in the population of the so favoured centres. The over- concentration of socio-economic services in few centres is an attracting force to rural populace to the centres in search of better economic activities; educational advancement; employment opportunity and better living condi-tion. Again, the end result would be neglect of agriculture when able bodied individuals have fled the rural areas to have a taste of better living condition it is provided.
In view of the observed imbalances, it is desirable that remote sensing capabilities should be harnessed in spa-tial analysis in Nigeria to enhance reliable data. This will enable planners and decision makers arrest errors be-fore they occur, as well as manage changes in the dynamic environment. This study, in the same way as noted by [22], will be beneficial in understanding the size distribution and urban growth process in Oke-Ogun area of Oyo State, Nigeria. In addition, it will provide an insight into the future growth and development of such areas that are characteristic of similar cases so that planners can put necessary control measures in place.
References [1] Mahavir (1996) Modelling Settlement Patterns for Metropolitan Regions: Inputs from Remote Sensing. ITC Publica-
tion, Enschede. [2] Salami, A.T. (1997) Urban Growth and Rural Land Retreat in Ibadan Area of Southwestern Nigeria, 1935-1990. Ife-
Planning Journal, 1, 107-119. [3] Silbernagel, J., Martin, S.R., Gale, M.R. and Chen, J. (1997) Prehistoric, Historic, and Present Settlement Patterns Re-
lated to Ecological Hierarchy in the Eastern Upper Peninsula of Michigan, U.S.A. Landscape Ecology, 12, 223-240. http://dx.doi.org/10.1023/A:1007946907682
[4] Abolade, O. (2007) The Pattern, Direction and Factors Responsible for Urban Growth in a Developing African City. Journal of Human Ecology, 22, 221-226.
[5] Ahmed, Y.A. (2009) Settlements Pattern and Functional Distribution in an Emerging Communities: A Case of a Local Government Area of Kwara State, Nigeria. The Social Sciences, 4, 256-263.
[6] Rajesh, B.T. and Yuji, M. (2009) Examining Spatiotemporal Urbanization Patterns in Kathmandu Valley, Nepal: Re-mote Sensing and Spatial Metrics Approaches. www.mdpi.com/journal/remotesensing
[7] Sarkar, A. (2010) Analysis of Human Settlement Patterns Using RS and GIS in the Plains of West Bengal. The On-Line Indian Journal of Spatial Science, 1, Article 1.
[8] Oyeleye, D.A. (2001) Settlement Geography. University of Lagos Press, Nigeria. [9] Camagni, R., Cristina, M. and Paolo, R. (2002) Urban Mobility and Urban Form: The Social and Environment Cost of
Different Patterns of Urban Expansion. Ecological Economics, 40, 199-216. http://dx.doi.org/10.1016/S0921-8009(01)00254-3
[10] Wilson, E.H., Hurd, J.D., Civco, D.L., Prisloe, S. and Arnold, C. (2003) Development of a Geospatial Model to Quan-tify, Describe and Map Urban Growth. Remote Sensing of Environment, 86, 275-285. http://dx.doi.org/10.1016/S0034-4257(03)00074-9
[11] Sudhira, H.S., Ramachandra, T.V. and Jagdish, K.S. (2004) Urban Sprawl: Metrics, Dynamics and Modelling Using GIS. International Journal of Applied Earth Observation and Geoinformation, 5, 29-39. http://dx.doi.org/10.1016/j.jag.2003.08.002
[12] Aguilera, F., Valenzuela, L.M. and Botequilha-Leitão, A. (2011) Landscape Metrics in the Analysis of Urban Land Use Patterns: A Case Study in a Spanish Metropolitan Area. Landscape and Urban Planning, 99, 226-238. http://dx.doi.org/10.1016/j.landurbplan.2010.10.004
[13] Whynne-Hamond, C. (1979) Elements of Human Geography. George Allen and Unwin, London. [14] Clarke, J.I. (1985) Patterns of Settlement and Factors Affecting Population Distribution. International Population Con-

A. M. Olayiwola et al.
1360
ference, Florence, 5-12 June 1985, 63-72. [15] Wu, K.Y. and Zhang, H. (2012) Land Use Dynamics, Built-Up Land Expansion Patterns, and Driving Forces Analysis
of the Fast-Growing Hangzhou Metropolitan Area, Eastern China (1978-2008). Applied Geography, 34, 137-145. http://dx.doi.org/10.1016/j.apgeog.2011.11.006
[16] Maza, A., Villaverde, J. and Hierro, M. (2013) Explaining the Settlement Patterns of Foreigners in Spain. Applied Ge-ography, 40, 11-20. http://dx.doi.org/10.1016/j.apgeog.2013.01.004
[17] Oruı, S.Z. (2013) Harbor Settlement Patterns of the Second Millennium BC in Cilicia and the Amuq. M.A. Thesis, De- partment of Archaeology, Ihsan Doiramaci Bilkent University, Ankara.
[18] Christaller, W. (1933) Die ZentralenOrte in Suddeutscland, Fischer, Jena. In: Baskinm, L.W., Ed., Central Places in Southern Germany, Prentice Hall, Englewood Cliffs.
[19] Losch, A. (1940) Die Raeumliche Ordnung der Wirtschaft. In: Woglom, W.H. and Stolper, W.F., Eds., The Economics of Location, Yale University Press, New Haven, Wiley, New York.
[20] Knox, P.L. and Marston, S.A. (2007) Places and Regions in Global Context: Human Geography. 4th Edition, Prentice Hall, Upper Saddle River.
[21] Olayiwola, A.M. and Aguda, A.S. (2009) Hierarchy of Service Centres in Ijesaland, Nigeria. Journal of Geography and Regional Planning, 2, 131-143.
[22] Tian, G., Jiang, J., Yang, Z. and Zhang, Y. (2011) The Urban Growth, Size Distribution and Spatio-Temporal Dynamic Pattern of the Yangtze River Delta Megalopolitan Region, China. Ecological Modelling, 222, 865-878. http://dx.doi.org/10.1016/j.ecolmodel.2010.09.036
[23] National Population Commission of Nigeria (2006) 2006 National Population Census Manual. [24] National Bureau of Statistics (2012) Oyo State Information. Retrieved from the Official Website of Government of
Oyo State. http://www.oyostate.gov.ng/ [25] Adeniji-Oloukoi, G., Urmilla, B. and Vadi, M. (2013) Households’ Coping Strategies for Climate Variability Related
Water Shortages in Oke-Ogun Region, Nigeria. Environmental Development, 5, 23-38. http://dx.doi.org/10.1016/j.envdev.2012.11.005
[26] Oloukoi, G., Bob, U. and Jaggernath, J. (2014) Perception and Trends of Associated Health Risks with Seasonal Cli-mate Variation in Oke-Ogun Region, Nigeria. Health and Places, 25, 47-55. http://dx.doi.org/10.1016/j.healthplace.2013.09.009
[27] Jinadu, A.M. (2004) Urban Expansion and Physical Problems in Abuja. Implications for the National Urban Develop-ment Policy. Journal of the Nigerian Institute of Town Planners, 17, 15-27
[28] Herold, M., Scepan, J. and Clarke, K.C. (2002) The Use of Remote Sensing and Landscape Metrics to Describe Struc-tures and Changes in Urban Land Uses. Environment and Planning, 34, 1443-1458. http://dx.doi.org/10.1068/a3496
[29] Liu, Y. and Phinn, S.R. (2003) Modelling Urban Development with Cellular Automata Incorporating Fuzzy-Set Ap-proaches. Computers, Environment and Urban Systems, 27, 637-658. http://dx.doi.org/10.1016/S0198-9715(02)00069-8
[30] Forman, R.T.T. (1995) Land Mosaics: The Ecology of Landscapes and Regions. Cambridge University Press, Cam-bridge.
[31] King, L.J. (1962) Central Place Theory and the Spacing of Towns in the United States: Land and Livelihood. Mckasc- kill, Ed., New Zealand Geographical Society.
[32] National Population Commission of Nigeria (1991) Result of 1991 Population Census. [33] Krishna V.B. (2009) Determinants of the Patterns of Settlements in the Province of Tarlac. U. P. School of Urban and
Regional Planning. [34] Idachaba, F.S. (1985) Rural Infrastructures in Nigeria: A Basic Need for Rural Majority. University Press, Ibadan.


![[Need Settlement Pattern Photo] Traditional Land Tenure Use](https://static.fdocuments.in/doc/165x107/6239fdd83f30eb4c060ddfb7/need-settlement-pattern-photo-traditional-land-tenure-use.jpg)