Physical and Mechanical Properties of Polymer Composites ... · 2015; 18(6) Physical and Mechanical...
9
DOI: http://dx.doi.org/10.1590/1516-1439.009815 Materials Research. 2015; 18(6): 1188-1196 © 2015 *e-mail: [email protected], [email protected] 1. Introduction Particulate fillers are used to modify the physical and mechanical properties of polymers in many ways. Polymeric materials are noted for their versatility, high resistance to chemicals, outstanding adhesion to a variety of substrates, toughness, high electrical resistance, durability at high and low temperatures, low shrinkage upon cure, flexibility, and the ease with which they can be poured or cast without forming bubbles 1-3 . Various kinds of polymers and polymer-matrix composites reinforced with filler particles have a wide range of industrial applications such as electrical industries, commercial and military aircrafts, heaters, electrodes 4 , floor covering, composites with thermal durability at high temperature 5 , etc. The cured resins with tight three-dimensional molecular network structures have many useful properties, such as the excellent combination of stiffness, strength, chemical resistance, insulating properties and environmental stability 6 . The addition of such particulate fillers into polymers is primarily aimed at the cost reduction and stiffness improvement for commercial applications 7 . Polymers are ideal materials because of resistance to corrosion, low coefficients of friction as glazing materials, low density and high toughness along with high transparency properties. The practical choice of polymeric materials is however not only determined by the mechanical and tribological properties, but also by the price, simplicity of production, processing and the practical limitations in the real application 8-12 . Addition of filler particles to polymer resins in small volume fractions led to the decrease in compressive strength, however, led to the increase in impact strength of the composite specimens 13 . The volume deformation ratio decreases and the thermal stability increases with increasing amount of silica as filler in epoxy based polymer composites when the axial thermal deformation of the epoxy resin cured using the polyamide type hardener is considered. The optimum amount of reinforcement silica content is 50 wt%, while the optimum particle size is 1.0-1.6 mm 14 . Epoxy resins are the extensively used thermoset materials in polymer composites. They have good bonding strength to other materials, good chemical and environmental resistance, good chemical properties and good insulating properties, and are generally manufactured by reacting epichlorohydrin with bisphenol 7 . Epoxy resins are also used in coating industry as surface coating materials due to their toughness, flexibility, adhesion and chemical resistance. Several researchers were interested in the investigation of the physical and mechanical properties of epoxy based polymer mortars. Vipulanandan et al. 15,16 investigated epoxy and polyester based polymer mortars, and they determined that the optimal quantity of resin is between 14% and 16%. Singla & Chawla 7 studied epoxy based composites including fly ash. They observed that with the addition of fly-ash (from 30% to 54%) in epoxy resin–fly-ash composite the compressive strength was found to increase with increase in fly ash content. Fu et al. 17 performed a review on the effects Physical and Mechanical Properties of Polymer Composites with High Content of Wastes Including Boron Tayfun Uygunoglu a *, Ibrahim Gunes b , Witold Brostow c a Civil Engineering Department, Engineering Faculty, Afyon Kocatepe University, 03200, Afyonkarahisar, Turkey b Metallurgical and Materials Engineering Department, Faculty of Technology, Afyon Kocatepe University, 03200, Afyonkarahisar, Turkey c Laboratory of Advanced Polymers & Optimized Materials – LAPOM, Department of Materials Science and Engineering, Center for Advanced Research and Technology – CART, University of North Texas, 3940 North Elm Street, Denton TX 76207, USA Received: June 25, 2015; Revised: October 18, 2015 In this study, we studied the physical and mechanical properties of polymer composite with wastes that incorporating boron. The polymer composites were produced with epoxy based resin and wastes as mineral additive. The wastes were added to mixtures in different ratio by replacing the resin from 0 to 66% by weight. Slump-flow and viscosity tests are carried out on fresh samples after mixing. Composites were cured in air condition and they were de-molded after 24 hours. They gain ultimate strength after 7 days. Therefore, tests for characteristics were performed on 7 aged specimens. On the polymer composite samples, compressive strength, flexural strength, wear resistance, water absorption and density tests were performed. As a result, addition of the wastes that including boron increased the compressive strength of polymer composites; however, it made the composites more brittle material with low flexural strength. Keywords: boron, waste material, polymer, mechanical properties, abrasion
Transcript of Physical and Mechanical Properties of Polymer Composites ... · 2015; 18(6) Physical and Mechanical...

DOI: http://dx.doi.org/10.1590/1516-1439.009815Materials Research. 2015; 18(6): 1188-1196 © 2015
*e-mail: [email protected], [email protected]
1. IntroductionParticulate fillers are used to modify the physical and
mechanical properties of polymers in many ways. Polymeric materials are noted for their versatility, high resistance to chemicals, outstanding adhesion to a variety of substrates, toughness, high electrical resistance, durability at high and low temperatures, low shrinkage upon cure, flexibility, and the ease with which they can be poured or cast without forming bubbles1-3. Various kinds of polymers and polymer-matrix composites reinforced with filler particles have a wide range of industrial applications such as electrical industries, commercial and military aircrafts, heaters, electrodes4, floor covering, composites with thermal durability at high temperature5, etc. The cured resins with tight three-dimensional molecular network structures have many useful properties, such as the excellent combination of stiffness, strength, chemical resistance, insulating properties and environmental stability6. The addition of such particulate fillers into polymers is primarily aimed at the cost reduction and stiffness improvement for commercial applications7. Polymers are ideal materials because of resistance to corrosion, low coefficients of friction as glazing materials, low density and high toughness along with high transparency properties. The practical choice of polymeric materials is however not only determined by the mechanical and tribological properties, but also by the price, simplicity of production, processing and the practical limitations in the real application8-12. Addition of filler
particles to polymer resins in small volume fractions led to the decrease in compressive strength, however, led to the increase in impact strength of the composite specimens13. The volume deformation ratio decreases and the thermal stability increases with increasing amount of silica as filler in epoxy based polymer composites when the axial thermal deformation of the epoxy resin cured using the polyamide type hardener is considered. The optimum amount of reinforcement silica content is 50 wt%, while the optimum particle size is 1.0-1.6 mm14.
Epoxy resins are the extensively used thermoset materials in polymer composites. They have good bonding strength to other materials, good chemical and environmental resistance, good chemical properties and good insulating properties, and are generally manufactured by reacting epichlorohydrin with bisphenol7. Epoxy resins are also used in coating industry as surface coating materials due to their toughness, flexibility, adhesion and chemical resistance. Several researchers were interested in the investigation of the physical and mechanical properties of epoxy based polymer mortars. Vipulanandan et al.15,16 investigated epoxy and polyester based polymer mortars, and they determined that the optimal quantity of resin is between 14% and 16%. Singla & Chawla7 studied epoxy based composites including fly ash. They observed that with the addition of fly-ash (from 30% to 54%) in epoxy resin–fly-ash composite the compressive strength was found to increase with increase in fly ash content. Fu et al.17 performed a review on the effects
Physical and Mechanical Properties of Polymer Composites with High Content of Wastes Including Boron
Tayfun Uygunoglua*, Ibrahim Gunesb, Witold Brostowc
aCivil Engineering Department, Engineering Faculty, Afyon Kocatepe University, 03200, Afyonkarahisar, Turkey
bMetallurgical and Materials Engineering Department, Faculty of Technology, Afyon Kocatepe University, 03200, Afyonkarahisar, Turkey
cLaboratory of Advanced Polymers & Optimized Materials – LAPOM, Department of Materials Science and Engineering, Center for Advanced Research and Technology – CART, University of North Texas,
3940 North Elm Street, Denton TX 76207, USA
Received: June 25, 2015; Revised: October 18, 2015
In this study, we studied the physical and mechanical properties of polymer composite with wastes that incorporating boron. The polymer composites were produced with epoxy based resin and wastes as mineral additive. The wastes were added to mixtures in different ratio by replacing the resin from 0 to 66% by weight. Slump-flow and viscosity tests are carried out on fresh samples after mixing. Composites were cured in air condition and they were de-molded after 24 hours. They gain ultimate strength after 7 days. Therefore, tests for characteristics were performed on 7 aged specimens. On the polymer composite samples, compressive strength, flexural strength, wear resistance, water absorption and density tests were performed. As a result, addition of the wastes that including boron increased the compressive strength of polymer composites; however, it made the composites more brittle material with low flexural strength.
Keywords: boron, waste material, polymer, mechanical properties, abrasion

Physical and Mechanical Properties of Polymer Composites with High Content of Wastes Including Boron2015; 18(6) 1189
of particle size, particle and matrix interface adhesion and particle loading on the stiffness, strength and toughness of polymer composites. They reported that composite strength and toughness are strongly affected by particle size, particle-matrix adhesion and particle loading factors. Sumita et al.18 emphasized the interest of replacing microscale silica by its nanoscale counterpart, since nanoscale silica particles possess superior mechanical properties. They found that these nanoparticles give higher rigidity and superior yield strength to the polymers. Wang et al.19 studied the effects of silica content as filler material on the mechanical properties of a silica-filled epoxy resin. The experimental results showed that the material properties were increased with the increasing of filler content at low temperatures. Another study was conducted on the tribological behavior of glass epoxy polymer composites with silicon carbide (SiC) and Graphite particles as filler using a pin-on-disc wear rig under dry sliding conditions20. The test results showed that the using of SiC and Graphite as filler materials in glass epoxy composites increased the wear resistance of the composite greatly. A series of epoxy composites filled with fly ash of different volume fraction are prepared by Gu et al.21. Thermogravimetric analyses are carried out to characterize the heat-resistant performance of the fly ash filled composites. Results showed that the decomposition temperatures of the prepared composites are 30-50 °C higher than that of the matrix. Martínez-Barrera & Brostow22 investigated the effect of marble particle size on dynamic modulus of elasticity (Ed) depending on ultrasonic pulse velocity measurements, and they found that the highest values are for polymer composites with medium particle size (1.4 mm, and the Ed values are ranged from 9.0 to 11.3 GPa. Ahmad et al.23 studied the modified effects of reinforcement dispersion of nanoparticle (<600 µm) silica from 0 to 20% in epoxy resin on the properties of prepared composites. They found that the polymer composites with silica sand being denser as compared to pure epoxy due to high specific gravity of silica particles. The increase in density was between 2-6% by comparing silica sand nanoparticles added epoxy with its pure form as control element. It was also reported that if the silica nanoparticles are not properly mixed with the epoxy, cause voids and increase level of porosity inside the system.
The cost of epoxy resin based materials is almost high due to demand and energy consumption. When the energy saving and conservation of natural resources are considered, the use of alternative constituents such as waste materials in construction materials is now a global concern. There are different types of fillers used in the polymer composites. After the treatment of boron, dewatering sieve waste is discharged as landfilling. For a ton borax production, 500 kg of waste is obtained24,25. The amount of waste material that obtained from the beneficiation plant has being progressively increased due the lower recycling rate of the waste materials26. Therefore, its disposal currently poses a serious problem. So, the main objective of this paper is to study the effects of waste material
that including boron addition as filler on the physical and mechanical properties of epoxy based composites.
2. Experimental Studies2.1. Production of specimens
The wastes including boron used in the study were provided by the Eti Holding Borax Plant in Kırka/Eskişehir, and was taken from the outlet of dewatering sieve of dissolution units. The maximum particle size of waste was 500 µm. The specific gravity and fineness of wastes were 2.30 and 1700 cm2/g. Chemical phase and component of wastes including boron are presented in Figure 1 (XRD) and Table 1.
Commercially available Teknobond 300 (liquid diglycidyl ether of biphenol –A) epoxy resin along with hardener was used as matrix material in fabrication of different specimens. Epoxy resin has modulus of 3.42 GPa, and possess density of 1100 kg/m3. The curing agent was clear epoxy hardener (NN0 (2-amineethylethane-1, 2- diamin)) is also used with epoxy resin. Both the epoxy resign and curing agent were obtained from supplier. For processing the mix ratio (by weight) of epoxy resin (2 parts) and hardener (1 part) were used as specified. The required mixture of resin & hardener (Table 2) were made by mixing them in (2:1) parts in a beaker by stirring the mixture in a beaker by a rod taking into care that no air should be entrapped inside the solution.
Production of the polymer matrix composite was done at room temperature. The required ingredients of resin, hardener and wastes as additive were mixed thoroughly and the mixture so made was transferred to mould cavity of the mould which is coated with separator. The wastes were replaced with epoxy resin in ratio of 0%, 17%, 33%, 50% and 66% by weight (Table 2). A 3100 mL batch was prepared for all mortar mixtures using a mixer with a rotational speed of 1000 rpm. The mixing sequence consisted of homogenizing the waste and epoxy resin for 1 min dry, and addition of the hardener to the mixing container. The mortar mixture was mixed for 3 minutes. Prismatic steel moulds in size 40×40×160 mm were used for casting of polymer matrix
Figure 1. XRD test results for wastes including boron.
Table 1. Chemical content of wastes including boron.
Oxide B2O3 SiO2 AI2O3 CaO MgO K2O Na2O Fe2O3 LOIContent, % 12.09 15.5 1.38 17.7 13.79 0.5 3.34 0.22 34.4

Uygunoglu et al.1190 Materials Research
composite specimens. Curing was done at room temperature for approximately 24 h. After curing, the prismatic specimens were de-moulded after 24 hours and cured under room temperature for 1 and 7 days.
2.2. Tests on polymer compositesFollowing the mixing of mortar, viscosity of epoxy based
polymer pastes with and without wastes were determined by using the Brookfield RV-II type viscometer according to ASTM D 182427 in order to establish the effect of waste on resistance to flow on polymer pastes. The viscosity measurements were carried out by disc spindles at rotational speed of 10, 20, 30, 40 and 50 in laboratory temperature of 20±2 °C.
Also, the fluidity was evaluated by measuring the slump-flow. The slump-flow was measured using a cylindrical frustum (Figure 2a). The tested volume in the frustum was 0.287 L. The slump measurement consisted of filling a cylindrical frustum with the freshly polymer composite to be tested in the specified way, slowly lifting the frustum off and allowing the polymer composite to collapse under its weight. In order to prevent any thixotropic effect, the frustum mold was lifted immediately after having been filled with the polymer composite as similar to cement based composites28. Slump-flow measurements were carried out on a flat and transparent sheet. The slump-flow (SF) of the final deformed, or slumped, polymer composite paste was measured from two perpendicular diameters 2 min after cone lifting (Figure 2b).
The hardened prism specimens were used for measuring compressive strength, flexural strength, ultrasonic pulse velocity, water absorption, apparent porosity and dry unit weight. Unit weights, apparent porosity and water absorption were determined on the 7 days aged specimens according to Archimedes principle which utilizes the weight measurements of saturated specimens in air (at 65% humidity) and in water (20±2 °C) as well as their dry weights (oven drying at 105 °C to constant weight). Compressive strength, flexural strength and ultrasonic pulse velocity tests were carried out on 1 and 7 day-aged specimens according to EN 196-129 standard. Dynamic modulus of elasticity of specimens was calculated depending on ultrasonic pulse velocity by Eq. (1) at 7 day-aged specimens30:
( )( ) ( )2E V 1 1 2 1= + − −ρ υ υ υ (1)
where: Ed is dynamic modulus of elasticity; ρ is density (kg/m3); V is ultrasonic pulse velocity (km/s); υ is the Poisson ratio (= 0.20).
Polymer composites including boron (PCB) specimens were subjected to abrasion testing at 7 days after casting
according to TS 2824 EN 133831 standard. Before testing, specimens were dried in an oven at 60±5 °C until reaching a constant weight. 142.5 N loads were applied to the specimens in the abrasion system. The length and diameter of disc was 70 and 200 mm, respectively. In the test procedure, 1 L of corundum-crystalline powder was flowed between the disc and the specimen from powder box, and the disc was rotated with a rotational velocity of 75 rpm for 1 min for each specimen. After that, the length due to wear was measured from the three points on the specimens, and the averages of these measurements were determined for each specimen as wear length (Figure 3a, b). Three samples were used for each test. Also, fractured surfaces of PCB including boron waste material chips were prepared and coated with gold in a vacuum evaporator for scanning electron microscopy (SEM) investigations. They were examined using a LEO VP-1431 scanning electron microscopy to determine interfacial zone features.
3. Results and DiscussionsThe flow properties of PCBs incorporating waste with
boron are defined by slump-flow (SF). The SF test results are presented in Figure 4 relating to waste content. It is clearly seen that the slump flow diameter decreases as the waste
Table 2. Composition of epoxy based polymer composites.
Mixture code Epoxy resin*, kg/m3 Boron, kg/m3
B0 100 -B17 83 17B33 67 33B50 50 50B66 66 34
*Epoxy resin was used with hardener (2:1).
Figure 2. Slump-flow measurement with frustum (a: mini-slump frustum; b: measurement of mortar diameter).

Physical and Mechanical Properties of Polymer Composites with High Content of Wastes Including Boron2015; 18(6) 1191
material content for each series is increased. The highest SF was observed at the control mixtures (without waste additive) as 420 mm. On the other hand, the SF significantly decreased to 240 mm with use of the waste including boron in ratio of 66%. In the case of 17%, 33%, 50% and 66% waste content, the SF value decreased in ratio of 14%, 17%, 24% and 43%, respectively, when compared to control mixture. This was due to the lack of lubrication between the particles. Thus, yield stress of composite increases depending on movement of particles in the mixture. Yield stress is the minimum stress
to flow on a material28. In the slump flow experiment, flow of mixtures depends on exceeding of yield stress. Yield stress whatever is low; mixture should much flow under self weight, and flow stops when yield stress and other stress that occurring due to self weight of polymer mixture became equal32. The most important factor which affects the yield stress is internal friction which occurs between the particles. The increase of friction between the particles and escape of polymer resin from between the particles resulted with an increase of yield stress. In the experiment of slump flow of fresh polymer based mixture, when the flow of mixture stops, it is accepted that yield stress and shear stress are equal. When high SF represents that yield stress of fresh mixture is low; low SF indicates that yield stress of mixture is high.
Viscosity describes the resistance of a mixture to flow under external stress. Viscosity is caused by internal friction. The speed of flow of mixture is related to its viscosity33,34. All the apparent viscosities measured are plotted in Figure 5 depending on waste using ratios and deformation speed. It can be clearly seen that all viscosity values are decreased by increasing of the rotational speed of spindle, i.e. increasing of the shear rates in high waste content. It was also observed that viscosity values increased by increasing of waste content, and they are inversely proportioned with slump-flow. In other words, viscosity was decreased by increasing of slump flow. The binder content can drastically alter the rheological properties of the pastes, as they typically absorb on the particle surfaces, thus influencing both yield stress and plastic viscosities34,35. The highest viscosity values are obtained in the highest waste content when regardless of rotational speed. This is probably because the waste material is clay based and it requires more binder than control mixtures. The increase of waste material content resulted with the increase of internal friction between particles and thus, PCBs has higher viscosity values when compared to control mixtures. For the PCB with waste using ratio of from 0% to 66%, viscosity values are ranged between 290 and 810 cp at 10 rpm, when it was between 290 and 740 cp at 50 rpm, respectively.
The effect of different percentage of waste material that including boron on polymer composite compressive strength is shown in Figure 6 for 1 and 7 days aged, respectively. Using waste replacement of polymer resin from 0% to 17% causes the decrease in the compressive strength of 1 day aged specimens by 19%. When compared to composite without waste material, the compressive strength value
Figure 3. Wear test on PCB specimens (a: wear test machine; b: measurement of worn surface).
Figure 4. Slump-flow values of PCBs versus waste content. Figure 5. Viscosity of PCBs depending on deformation speed.
Uygunoglu et al.1192 Materials Research
of specimens containing the waste in ratio of 33 and 66% has the same values, at 1 day. The highest volume of waste material particles lead to the creation of pore in mixes, thus, the compressive strength decreased. Using either a relatively low or high replacement of waste material, except for 66%, increases the compressive strength of composites at 7 days curing ages. The composites containing 50% waste material shows the highest increase in strength at all ages. When the epoxy resins are used in the production of polymer composite, cross-linking occurs during polymerization and a tridimensional reticulate structure (a thermoset) results. Waste material that used as additive fills the space between the polymer chains and pores in the matrix, and they pinch the polymer in its vicinity, reducing strain and increasing stiffness. Also, the particle/matrix interfacial adhesion has a prominent effect on the strength of particulate-filled polymer composites. A strong interfacial bonding between particles and polymer matrix is critical for effective stress transfer leading to high composite strength17. Vice-versa, a weak particle/matrix interface bonding will only give low composite strength. The polymer composite containing after 50% waste material shows decrease strength at all ages. However, the compressive strengths are the about same values at the highest waste content with that of control mixtures. At higher waste material replacement, the amount of increase for compressive strength is smaller. This is expected because of the excessive filler effect which will cause greater
surface area of the waste material particle that they were not surrounded with polymer binder, thus providing a decrease chemical interaction inside the polymer matrix3,4.
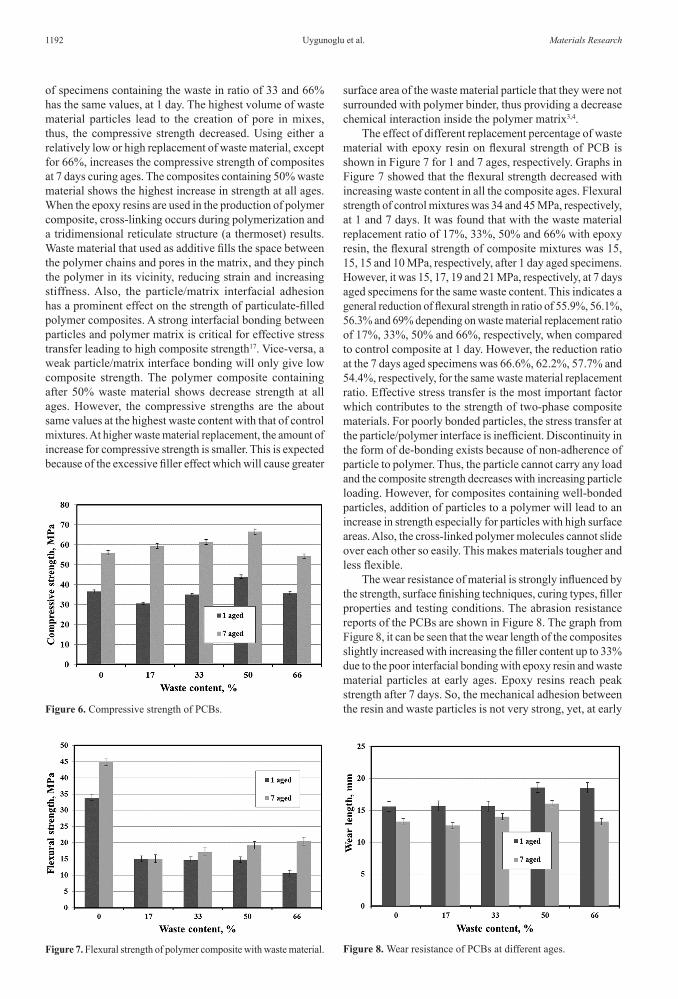
The effect of different replacement percentage of waste material with epoxy resin on flexural strength of PCB is shown in Figure 7 for 1 and 7 ages, respectively. Graphs in Figure 7 showed that the flexural strength decreased with increasing waste content in all the composite ages. Flexural strength of control mixtures was 34 and 45 MPa, respectively, at 1 and 7 days. It was found that with the waste material replacement ratio of 17%, 33%, 50% and 66% with epoxy resin, the flexural strength of composite mixtures was 15, 15, 15 and 10 MPa, respectively, after 1 day aged specimens. However, it was 15, 17, 19 and 21 MPa, respectively, at 7 days aged specimens for the same waste content. This indicates a general reduction of flexural strength in ratio of 55.9%, 56.1%, 56.3% and 69% depending on waste material replacement ratio of 17%, 33%, 50% and 66%, respectively, when compared to control composite at 1 day. However, the reduction ratio at the 7 days aged specimens was 66.6%, 62.2%, 57.7% and 54.4%, respectively, for the same waste material replacement ratio. Effective stress transfer is the most important factor which contributes to the strength of two-phase composite materials. For poorly bonded particles, the stress transfer at the particle/polymer interface is inefficient. Discontinuity in the form of de-bonding exists because of non-adherence of particle to polymer. Thus, the particle cannot carry any load and the composite strength decreases with increasing particle loading. However, for composites containing well-bonded particles, addition of particles to a polymer will lead to an increase in strength especially for particles with high surface areas. Also, the cross-linked polymer molecules cannot slide over each other so easily. This makes materials tougher and less flexible.
The wear resistance of material is strongly influenced by the strength, surface finishing techniques, curing types, filler properties and testing conditions. The abrasion resistance reports of the PCBs are shown in Figure 8. The graph from Figure 8, it can be seen that the wear length of the composites slightly increased with increasing the filler content up to 33% due to the poor interfacial bonding with epoxy resin and waste material particles at early ages. Epoxy resins reach peak strength after 7 days. So, the mechanical adhesion between the resin and waste particles is not very strong, yet, at early Figure 6. Compressive strength of PCBs.
Figure 7. Flexural strength of polymer composite with waste material. Figure 8. Wear resistance of PCBs at different ages.

Physical and Mechanical Properties of Polymer Composites with High Content of Wastes Including Boron2015; 18(6) 1193
ages. Because, in the abrasion wear which mainly depends on the mechanical properties of the interacting materials, the frictional work involves quite large volumes close to the interface, either exploiting the interaction of surface forces and the consequent traction stresses or through the geometric interlocking exerted by the interpenetrating contacts36. The acceptability of polymeric materials for abrasive wear conditions largely depends upon its mechanical load carrying capacity and the wear rate. The performance of polymers sliding against hard and smooth counterface is determined by the transfer ability and buildup of a polymer film. Efficiency of materials in reducing friction and wear depends on the molecular polymer structure and counterface type. However, the wear length was the about same with that of control composites in content of 66% waste material at 7 days aged. The increase in the wear length was observed at 33% and 50% waste material content for 7 days aged composites.
The unit weights (UW) of PCBs with and without waste content were measured at right after 7-day curing. It can be seen from Figure 9 that the unit weight of PCBs increased with an increase in waste content. While the UW of control samples was 1.13 kg/dm3, the unit weight of PCBs of those made up of waste content with 17, 33, 50 and 66% ratios was 1.24, 1.34, 1.52 and 1.58 kg/dm3, respectively. This is due to the higher specific weight of waste particles than epoxy resin and the decrease of porous structure and in PCBs with high waste content. When comparing the control samples, increase in the unit weight due to the 17%, 33%, 50% and 66% waste content was 9.73%, 18.6%, 34.51% and 39.8%, respectively. This is probably due to waste content which have higher specific gravity than that of epoxy resin.
The specific porosity (SP) of mortars without filler was higher than that of mortars with waste including boron for all the percentage are presented in Table 3. There is a substantial
decrease in SP with the increase in waste ratio. While the SP of control mortars that without waste was 0.35%, the SP values of composites of those made up of 17%, 33%, 50% and 66% waste replacement with epoxy were 0.26%, 0.25%, 0.20% and 0.15%, respectively. In composites with waste that including boron the average pore content was lower than that of control mortars, the pores in the PCB were filled completely with waste particles. Thus mortars with waste material have lower apparent porosity. The low specific porosity is an indication of good compaction and denser structure achieved in the composite mortar3.
The effect of water absorption is important in case the material that has been developed when used for applications comes in contact of water. From Table 3, the water absorption of PCBs for different waste content can also be seen. The amount of water uptake by epoxy resin is almost negligible as it is hydrophobic in nature37,38. There is a substantial increase in absorption with the increase in waste content. However, it was lower than that of control series at waste content of 17% and 33%. While the water absorption of control PCBs that without waste was 0.28%, the water absorption values of PCBs of those made up of 17%, 33%, 50% and 66% waste content replacement with water absorption were 0.18%, 0.24%, 0.37% and 0.46%, respectively. As seen, the enhancement of water absorption was quite less with of the waste content. The increasing water absorption is due to the hydrophilic nature of waste material and the greater interfacial area between the particles and the matrix.
Ultrasonic pulse velocity (UPV) of composites with waste content is increased with increasing waste content (Table 3). The average ultrasonic pulse velocities in specimens are 2.54, 2.53, 2.57, 2.86 and 2.74 km/s, respectively, depending on waste material content. As seen, ultrasonic pulse velocities of polymer composites were increased with increasing waste content. However, increase in UPV on composites was quite less up to 33% of waste material replacement ratio as 1.2%. The highest UPV was obtained on PCBs with waste content of 50% in ratio of 12.6%. This may be due to filling of porous structure between the cross-link products in the mixtures with higher volume of waste particles, thus, resulting in higher compact structure. UPV changes with ingredients and conditions of material, specifically the volume of pores and moisture content within the pores.
The influence of varying waste replacement ratio with epoxy resin on modulus of elasticity of PCBs is shown in Table 3. There is a substantial decrease in modulus of elasticity with the increase in waste content from 0 to 66%. Replacement of waste with binder causes a decrease in modulus of elasticity compared with control mortar due to Figure 9. Unit weight of PCBs at different waste content.
Table 3. Different properties of PCBs and (±) standard deviation.
Waste content, (%) Specific Porosity, (%) Water Absorption (%) UPV(km/s)
Modulus of Elasticit, (MPa)
0 0.392927±0.00608 0.28±0.01 2.54±0.01 7410±6517 0.26178±0.00471 0.18±0.05 2.53±0.03 8098±12933 0.254453±0.00396 0.24±0.02 2.57±0.02 9013±17250 0.202184±0.00252 0.37±0.06 2.86±0.03 12678±22566 0.149198±0.00108 0.46±0.04 2.74±0.05 12082±294

Uygunoglu et al.1194 Materials Research
Figure 12. SEM image of PCBs ((a) 0%; (b) 17%; (c) 33%; (d) 50%; (e) 66%), (1: matrix; 2: particle).
Figure 10. DSC Analysis of PCB series. Figure 11. TG Analysis of PCB series.

Physical and Mechanical Properties of Polymer Composites with High Content of Wastes Including Boron2015; 18(6) 1195
them cause’s increase of porous structure in the mixtures as explained before. While the dynamic modulus of elasticity of control mortar without waste content was 7.41 GPa, the dynamic modulus of elasticity values of mortars of those made up of 17, 33, 50 and 66% waste content replacement with binder were 3.25, 3.42, 4.95 and 4.72 GPa, respectively. When comparing the control specimens, decrease in the modulus of elasticity due to the 17, 33, 50 and 66 percent waste content was 43.85%, 46.15%, 66.80% and 63.69%, respectively.
Different content of PCB specimens were compared with epoxy resin by means of DSC analysis. The analytical results are shown in Figure 10, where each of them had one peak in the range of the temperature. This provided additional evidence that pure epoxy resin (PCB0), PCB33, and PC B66 reacted and formed uniform structure. Also, the glass transition temperature of including boron specimens was higher than that of PCB0 specimen and increased with increasing of amount of boron. While the addition of wastes including boron decreased the structure of polymer links, however, they increased the melting temperature of epoxy composites because of high temperature resistance of wastes. Cross-linking also gives materials high melting points. This results in an appreciable increase in the composites’ thermal stability. The TG curves of the composites filled with different volume fractions of wastes including boron are presented in Figure 11. From the TG curves, it can be seen that the thermal stability of the composites is better than that of the epoxy based polymer matrix, which can be demonstrated from two aspects: i) the increase of the decomposition temperature, and ii) the increase of temperatures at the same thermogravimetric quantity21. The decomposition temperature of the control series is 330.8 while that of prepared composites are 361.0 C and 367.79 °C for PCB33 and PCB66, respectively, as 30-40 °C higher than that of the matrix. Furthermore, the decomposition temperatures ascend with the increase of volume fraction of waste materials, which indicates that the heat resistance of the matrix can be optimized by controlling the waste material content.
Filler cracking at various loadings condition was observed in PCB series with waste boron particles from 0 to 50% using SEM; see Figure 12. It can be seen that the cracked surface became much brittle when the percentage of filler getting higher. Importantly, waste material particles are uniformly distributed in the epoxy matrix from large to fine. As can be seen from the Figure 12, surface around of waste materials has covered with densely hardened polymer
matrix. This case showed that there is a good bond between waste material particles and polymer matrix. Mechanical properties of polymer matrix such as compressive strength, E-moduli and compactness are mainly affected by interfacial adhesive bond.
4. ConclusionThe increase of waste material content resulted with
the increase of internal friction between particles and thus, PCBs has higher viscosity values and lower slump flow values when compared to control mixtures. Using either a relatively low or high replacement of waste material, except for 66%, increases the compressive strength of composites at 7 days curing ages. The composites containing 50% waste material shows the highest increase in strength at all ages. At the highest waste material replacement, compressive strength is lower than control mixtures. The flexural strength decreased with increasing waste content in all the composite ages. The wear length of the composites slightly increased with increasing the filler content up to 33% due to the poor interfacial bonding with epoxy resin and waste material particles at early ages. However, the wear length was the about same with that of control composites in content of 66% waste material at 7 days aged. The water absorption capacity was found to be maximum for 0.46 wt % of polymer composites at waste content of 66%. The pores in the binder material were filled completely with waste particles. Thus mortars with waste material have lower pores and apparent porosity. The ultrasonic pulse velocities of polymer composites were increased with increasing waste content. The average ultrasonic pulse velocities in specimens are 2.54, 2.53, 2.57, 2.86 and 2.74 km/s, respectively, depending on waste material content. Replacement of waste with binder causes a decrease in modulus of elasticity compared with control mortar due to them cause’s increase of porous structure in the mixtures. Consequently, it may be concluded that waste materials including boron can be used with epoxy resin in different applications due to favorable mechanical and physical properties of polymer composites. Also, early strength of composites is fairly high for traffic loads after 1 day if waste material is used in the production of epoxy based composite as floor covering.
AcknowledgementsThe author would like to thank National Boron Research
Institute (BOREN) for the financial support with Project No. 2013.Ç0405.
References1. Brostow W, Dutta M and Rusek P. Modified epoxy coatings
on mild steel: tribology and surface energy. European Polymer Journal. 2010; 46(11):2181-2189. http://dx.doi.org/10.1016/j.eurpolymj.2010.08.006.
2. Bilyeu B, Brostow W, Menard KP. Determination of volume changes during cure via void elimination and shrinkage of an epoxy prepreg using a quartz dilatometry cell. Polimery. 2001;46:799-802.
3. Bilyeu B, Brostow W, Menard KP. Epoxy thermosets and their applications. III. Kinetic equations and models. J. Mater. Ed. 2001;23:189-197.
4. Jang BZ. Advanced polymer composites: principles and applications. Materials Park: ASM International; 1994.
5. Kim J, Kang PH and Nho YC. Positive temperature coefficient behavior of polymer composites having a high melting temperature. Journal of Applied Polymer Science. 2004; 92(1):394-401. http://dx.doi.org/10.1002/app.20064.
6. Wan YJ, Gong LX, Tang LC, Wu LB and Jiang JX. Mechanical properties of epoxy composites filled with silane-functionalized graphene oxide. Composites. Part A, Applied Science and Manufacturing. 2014; 64:79-89. http://dx.doi.org/10.1016/j.compositesa.2014.04.023.
7. Singla M and Chawla V. Mechanical properties of epoxy resin-fly ash composite. Journal of Minerals & Materials

Uygunoglu et al.1196 Materials Research
Characterization & Engineering. 2010; 9(3):199-210. http://dx.doi.org/10.4236/jmmce.2010.93017.
8. Harsha AP. An investigation on low stress abrasive wear characteristics of high performance engineering thermoplastic polymers. Wear. 2011; 271(5-6):942-951. http://dx.doi.org/10.1016/j.wear.2011.03.019.
9. Shipway PH and Ngao NK. Microscale abrasive wear of polymeric materials. Wear. 2003; 255(1-6):742-750. http://dx.doi.org/10.1016/S0043-1648(03)00106-6.
10. Cayer-Barrioz J, Mazuyer D, Kapsa PA, Chateauminois A and Robert G. Abrasive wear micromechanisms of oriented polymers. Polymer. 2004; 45(8):2729-2736. http://dx.doi.org/10.1016/j.polymer.2004.02.013.
11. Ginzburg BM, Tochil’nikov DG, Bakhareva VE, Anisimov AV and Kireenko OF. Polymeric materials for water-lubricated plain bearings. Russian Journal of Applied Chemistry. 2006; 79(5):695-706. http://dx.doi.org/10.1134/S1070427206050016.
12. Golchin A, Simmons GF, Glavatskih S and Prakash B. Tribological behaviour of polymeric materials in water lubricated contacts. Proceedings of the Institution of Mechanical Engineers. Part J, Journal of Engineering Tribology. 2012; 227(8):811-825. http://dx.doi.org/10.1177/1350650113476441.
13. Gupta N, Singh Brar B and Woldesenbet E. Effect of filler addition on the compressive and impact properties of glass fibre reinforced epoxy. Bulletin of Materials Science. 2001; 24(2):219-223. http://dx.doi.org/10.1007/BF02710105.
14. Lee SB, Lee HJ and Hong IK. Diluent filler particle size effect for thermal stability of epoxy type resin. Journal of Industrial and Engineering Chemistry. 2012; 18(2):635-641. http://dx.doi.org/10.1016/j.jiec.2011.11.030.
15. Vipulanandan C and Dharmarajan N. Flexural behavior of polyester polymer concrete. Concr. Cem. Res. 1987; 17(2):219-230. http://dx.doi.org/10.1016/0008-8846(87)90105-0.
16. Vipulanandan C, Dharmarajan N and Ching E. Mechanical behaviour of polymer concrete systems. Materials and Structures. 2006; 21(4):268-277. http://dx.doi.org/10.1007/BF02481825.
17. Fu SY, Feng XQ, Lauke B and Mai YW. Effects of particle size, particle/matrix interface adhesionand particle loading on mechanical propertiesof particulate-polymer composites. Composites. Part B, Engineering. 2008; 39(6):933-961. http://dx.doi.org/10.1016/j.compositesb.2008.01.002.
18. Sumita M, Shizuma T, Miyasaka K, Ishikawa K. Effect of reducible properties of temperature, rate of strain, and filler content on the tensile yield stress of nylon 6 composites filled with ultrafine particles. Journal of Macromolecular Science, Part B: Physics. 1983;B22(4):601-618.
19. Wang H, Bai Y, Liu S, Wu J and Wong CP. Combined effects of silica filler and its interface in epoxy resin. Acta Materialia. 2002; 50(17):4369-4377. http://dx.doi.org/10.1016/S1359-6454(02)00275-6.
20. Basavarajappa S, Arun KV and Davim JP. Effect of filler materials on dry sliding wear behavior of polymer matrix composites: a taguchi approach. Journal of Minerals & Materials Characterization & Engineering. 2009; 8(5):379-391. http://dx.doi.org/10.4236/jmmce.2009.85034.
21. Gu J, Wu G and Zhang Q. Preparation and damping properties of fly ash filled epoxy composites. Materials Science and Engineering A. 2007; 452-453:614-618. http://dx.doi.org/10.1016/j.msea.2006.11.006.
22. Martínez-Barrera G., Brostow W. Effect of marble particle size and gamma irradiation on mechanical properties of polymer concrete. e-Polymers. 2010, 61:1-14.
23. Ahmad T, Mamat O and Ahmad R. Studying the effects of adding silica sand nanoparticles on epoxy based composites. Journal of Nanoparticles. 2013; 2013:1-5. http://dx.doi.org/10.1155/2013/603069.
24. Kurama S, Kara A and Kurama H. The effect of boron waste in phase and microstructural development of a terracotta body during firing. Journal of the European Ceramic Society. 2006; 26(4-5):755-760. http://dx.doi.org/10.1016/j.jeurceramsoc.2005.07.039.
25. Uslu T and Arol AI. Use of boron waste as an additive in red bricks. Waste Management. 2004; 24(2):217-220. http://dx.doi.org/10.1016/S0956-053X(03)00031-X. PMid:14761761.
26. Shiao ST, Tsai CM. The study on improving masonry cement for the solidifications of borate wastes. Radiact. Waste Manage. Nucl. Fuel Cycle. 1989;11(4):319-331.
27. American Society for Testing and Materials – ASTM. ASTM D 1824-95: test method for apparent viscosity of plastisols and organosols at low shear rates by Brookfield Viscometer. West Conshohocken: ASTM; 2010.
28. Roussel N, Stefani C and Leroy R. From mini-cone test to Abrams cone test: measurement of cement-based materials yield stress using slump tests. Cement and Concrete Research. 2005; 35(5):817-822. http://dx.doi.org/10.1016/j.cemconres.2004.07.032.
29. Turkish Standard Institute - TSE. TS EN 196-1: methods of testing cement: part 1: determination of strength. Ankara: TSE; 2002.
30. Uygunoğlu T, Brostow W, Gencel O and Topçu İB. Bond strength of polymer lightweight aggregate concrete. Polymer Composites. 2013; 34(12):2125-2132. http://dx.doi.org/10.1002/pc.22621.
31. Turkish Standard Institute - TSE. TS 2824 EN 1338: concrete paving blocks: requirements and test methods. Ankara: TSE; 2009.
32. Saak AW, Jennings HM and Shah SP. A generalized approach for the determination of yield stress by slump and slump flow. Cement and Concrete Research. 2004; 34(3):363-371. http://dx.doi.org/10.1016/j.cemconres.2003.08.005.
33. Experts for Specialised Construction and Concrete Systems – EFNARC. Specification and guidelines for self-consolidating concrete. Surrey: EFNARC; 2002. p. 5-20.
34. Borstow, W., Uygunoğlu, T., Influence of chemical admixture content particle and grade on viscosity of self-leveling mortar, El-Cezerî Journal of Science and Engineering, 2014, 1(2); 12-21.
35. Schatzmann M, Fischer P and Bezzola GR. Rheological behavior of fine and large particle suspensions. Journal of Hydraulic Engineering. 2003; 129(10):796-803. http://dx.doi.org/10.1061/(ASCE)0733-9429(2003)129:10(796).
36. Malucelli G, Marino F. Abrasion resistance of polymer nanocomposites: a review. In: Adamiak M. Abrasion resistance of materials. Croatia: InTech; 2012.
37. Sanjeevamurthy GC, Srinivas GR. Sisal/coconut coir natural fibers-epoxy composites: water absorption and mechanical properties. International Journal of Engineering and Innovative Technology. 2012; 2(3):166-170.
38. Bhaskar J, Singh VK. Water absorption and compressive properties of coconut shell particle reinforced-epoxy composite. Journal of Materials and Environmental Science. 2013;4(1):113-118.