Phylogeography and population genetics of the maize stalk ...sesamia.pagesperso-orange.fr/Busseola...
14
Molecular Ecology (2006) 15, 407–420 doi: 10.1111/j.1365-294X.2005.02761.x © 2006 Blackwell Publishing Ltd Blackwell Publishing, Ltd. Phylogeography and population genetics of the maize stalk borer Busseola fusca (Lepidoptera, Noctuidae) in sub-Saharan Africa M. SEZONLIN,*† S. DUPAS,* B. LE RÜ,‡ P. LE GALL,*† P. MOYAL,* P.-A. CALATAYUD,‡ I. GIFFARD, * N. FAURE * and J.-F. SILVAIN * * Unité de Recherche IRD 072, CNRS, Laboratoire Populations, Génétique et Evolution, BP1, 91198 Gif-sur-Yvette cedex, France, † Unité de Recherche IRD 072, IITA, Cotonou, Bénin, ‡ Unité de Recherche IRD 072, ICIPE, Nairobi, Kenya Abstract The population genetics and phylogeography of African phytophagous insects have received little attention. Some, such as the maize stalk borer Busseola fusca, display significant geographic differences in ecological preferences that may be congruent with patterns of molecular variation. To test this, we collected 307 individuals of this species from maize and cultivated sorghum at 52 localities in West, Central and East Africa during the growing season. For all collected individuals, we sequenced a fragment of the mitochondrial cyto- chrome b. We tested hypotheses concerning the history and demographic structure of this species. Phylogenetic analyses and nested clade phylogeographic analyses (NCPA) separated the populations into three mitochondrial clades, one from West Africa, and two — Kenya I and Kenya II — from East and Central Africa. The similar nucleotide divergence between clades and nucleotide diversity within clades suggest that they became isolated at about the same time in three different refuges in sub-Saharan Africa and have similar demographic histories. The results of mismatch distribution analyses were consistent with the demographic expansion of these clades. Analysis of molecular variance (AMOVA) indicated a high level of geographic differentiation at different hierarchical levels. NCPA suggested that the observed distribution of haplotypes at several hierarchical levels within the three major clades is best accounted for by restricted gene flow with isolation by distance. The domestication of sorghum and the introduction of maize in Africa had no visible effect on the geographic patterns observed in the B. fusca mitochondrial genome. Keywords: African biogeography, Busseola fusca, phylogeography, Pleistocene, population genetics Received 14 February 2005; revision received 17 June 2005; accepted 1 September 2005 Introduction Several species of noctuid moths behave as larval stem borers of cultivated plants. Busseola fusca, Sesamia calamistis, and Sesamia nonagrioides are major pests on maize ( Zea mays L.) and cultivated sorghum [ Sorghum bicolor (L.) Moench] throughout sub-Saharan Africa (reviewed in Kfir et al . 2002). Their larvae damage cereal crops, reducing yields. Some of these species, such as B . fusca, are endemic to sub-Saharan Africa. B . fusca known as the maize stalk borer displays ecological preferences that differ between regions. This pest is more adapted to middle- and high-altitude conditions in East Africa, where it is abundant in the highlands (above 1500 m) and is rarely reported in the lowlands (Kfir et al . 2002). In Cameroon (Central Africa), it is abundant from high- (above 1000 m) to mid-altitude (700 m) regions (Ndemah et al . 2001). However, in West Africa, it is generally more abundant at lower altitudes than in other regions. Moyal (1998) reported that this insect was more frequent in Guineo-Congolian rainforest (dry type) (White 1983) areas than in savannah, whereas other studies reported that it is more frequent in dry savannah than in forests (Kfir et al . 2002). The pest status of B . fusca on cereal crops also varies between regions. It is the most important pest in the highlands of East and Southern Africa (Nye 1960; Sithole Correspondence: Stéphane Dupas, Fax: +33169070421; E-mail: [email protected]
Transcript of Phylogeography and population genetics of the maize stalk ...sesamia.pagesperso-orange.fr/Busseola...

Molecular Ecology (2006)
15
, 407–420 doi: 10.1111/j.1365-294X.2005.02761.x
© 2006 Blackwell Publishing Ltd
Blackwell Publishing, Ltd.
Phylogeography and population genetics of the maize stalk borer
Busseola fusca
(Lepidoptera, Noctuidae) in sub-Saharan Africa
M. SEZONLIN,
*†
S . DUPAS,
*
B . LE RÜ,
‡
P . LE GALL,
*†
P . MOYAL,
*
P . -A. CALATAYUD,
‡
I . GIFFARD,
*
N . FAURE
*
and J . -F . S ILVAIN
*
*
Unité de Recherche IRD 072, CNRS, Laboratoire Populations, Génétique et Evolution, BP1, 91198 Gif-sur-Yvette cedex, France,
†
Unité de Recherche IRD 072, IITA, Cotonou, Bénin,
‡
Unité de Recherche IRD 072, ICIPE, Nairobi, Kenya
Abstract
The population genetics and phylogeography of African phytophagous insects have receivedlittle attention. Some, such as the maize stalk borer
Busseola fusca
, display significantgeographic differences in ecological preferences that may be congruent with patterns ofmolecular variation. To test this, we collected 307 individuals of this species from maizeand cultivated sorghum at 52 localities in West, Central and East Africa during the growingseason. For all collected individuals, we sequenced a fragment of the mitochondrial cyto-chrome
b
. We tested hypotheses concerning the history and demographic structure of thisspecies. Phylogenetic analyses and nested clade phylogeographic analyses (NCPA) separatedthe populations into three mitochondrial clades, one from West Africa, and two — Kenya Iand Kenya II — from East and Central Africa. The similar nucleotide divergence betweenclades and nucleotide diversity within clades suggest that they became isolated at about thesame time in three different refuges in sub-Saharan Africa and have similar demographichistories. The results of mismatch distribution analyses were consistent with thedemographic expansion of these clades. Analysis of molecular variance (
AMOVA
) indicateda high level of geographic differentiation at different hierarchical levels. NCPA suggestedthat the observed distribution of haplotypes at several hierarchical levels within the threemajor clades is best accounted for by restricted gene flow with isolation by distance. Thedomestication of sorghum and the introduction of maize in Africa had no visible effect onthe geographic patterns observed in the
B
.
fusca
mitochondrial genome.
Keywords
: African biogeography,
Busseola fusca
, phylogeography, Pleistocene, population genetics
Received 14 February 2005; revision received 17 June 2005; accepted 1 September 2005
Introduction
Several species of noctuid moths behave as larval stemborers of cultivated plants.
Busseola fusca
,
Sesamia calamistis
,and
Sesamia nonagrioides
are major pests on maize (
Zea mays
L.) and cultivated sorghum [
Sorghum bicolor
(L.) Moench]throughout sub-Saharan Africa (reviewed in Kfir
et al
. 2002).Their larvae damage cereal crops, reducing yields. Some ofthese species, such as
B
.
fusca,
are endemic to sub-SaharanAfrica.
B
.
fusca
known as the maize stalk borer displaysecological preferences that differ between regions. This pest
is more adapted to middle- and high-altitude conditions inEast Africa, where it is abundant in the highlands (above1500 m) and is rarely reported in the lowlands (Kfir
et al
.2002). In Cameroon (Central Africa), it is abundant fromhigh- (above 1000 m) to mid-altitude (700 m) regions (Ndemah
et al
. 2001). However, in West Africa, it is generally moreabundant at lower altitudes than in other regions. Moyal(1998) reported that this insect was more frequent inGuineo-Congolian rainforest (dry type) (White 1983) areasthan in savannah, whereas other studies reported that it ismore frequent in dry savannah than in forests (Kfir
et al
.2002). The pest status of
B
.
fusca
on cereal crops also variesbetween regions. It is the most important pest in thehighlands of East and Southern Africa (Nye 1960; Sithole
Correspondence: Stéphane Dupas, Fax: +33169070421; E-mail:[email protected]

408
M . S E Z O N L I N
E T A L
.
© 2006 Blackwell Publishing Ltd,
Molecular Ecology
, 15, 407–420
1989; Ndemah
et al
. 2001; Kfir
et al
. 2002) whereas in WestAfrica, it generally has a lower economic impact (Schultess
et al
. 1997) except in sorghum-growing areas where it is themost important stem borer (Dakouo & Ratnadass 1997;Ajayi 1998). In Cameroon, it was shown to be the main pestacross years, seasons and ecological zones (Ndemah
et al
.2001). Locally, for each region, the population density of
B
.
fusca
varies according to season and year. Climatic factors,and biotic factors such as human activity, availability of wildand cultivated plants and natural enemies, are responsiblefor the population fluctuations from year to year (Dakouo& Ratnadass 1997; Moyal 1998; Ndemah
et al
. 2000).
B
.
fusca
has been reported to attack a wide range of host plantsfrom three monocotyledonous families: Cyperaceae, Poaceaeand Typhaceae (Khan
et al
. 1997; Polaszek & Khan 1998;Haile & Hofsvang 2001). However, a 2-year exhaustivesurvey carried out across East Africa (Kenya, Tanzania,Uganda) indicates that
B
.
fusca
is uncommon in the wildhabitat, showing on the contrary that it is specificallyadapted to maize and sorghum crops (Le Rü, unpublished).The domestication of sorghum probably began some 5000years ago in northeast Africa (Doggett 1988; Murty & Renard2001) whereas maize was introduced more recently, at theend of the 16th century (Chastanet 1998; Madeira Santos& Ferraz Torrao 1998). Since its rapid expansion at thebeginning of the 20th century, maize has become one of themost important crops in sub-Saharan Africa (Ristanovic2001). Several insect species switched from wild plants tocultivated crops, and became pests. The timing of theseevents, and whether there were multiple or independenthost switches is unknown. Molecular phylogeographicanalysis can help to understand the possible effects ofsorghum domestication and maize introduction on
B
.
fusca
genetic structure and can provide insights on the ecologicaland historical conditions of the switch.
Apart from domestication, the genetic structure of
B
.
fusca
is also likely to be influenced by its evolutionary history onwild host plants before domestication. Very little is knownabout the population genetics and phylogeography of Africaninsects, despite their diversity and, for some of them, theireconomic importance (Kuchta & Meyer 2001). For example,only 10 of the 246 articles published in
Molecular Ecology
,in the ‘Phylogeography, Speciation and Hybridization’section between January 2001 and June 2004 dealt withAfrican animal species — vertebrates in each case. The eco-logical and economic importance of African phytophagousinsects makes them particularly suitable models for studiesof the biogeography and demographic history of Africaninsects. Ndemah
et al
. (2001) suggested that geographicbarriers, such as mountains or forests, might facilitate thedevelopment of specific races differing in climatic require-ments and host-plant specificities. If this is the case, thenit should be possible to identify these natural barriers byanalysing the genetic structure of molecular markers. An
understanding of the ecological and genetic diversity ofinsect pests would make it possible to develop and to improvemonitoring and biological control strategies. Two mainquestions need to be answered: Do the different ecologicalpreferences of
B. fusca
from different regions correspond tomolecular genetic differences? Has the ecological differen-tiation of populations of
B. fusca
from different regionsdepended on geography (West vs. East Africa), palaeogeo-graphic history, or biotopes occupied (high- or low-altitudebiotopes, wet or dry biotopes, savannah or forests)? The aimsof this study were to (i) analyse the genetic structure andphylogeography of the
B. fusca
populations present on maizeand cultivated sorghum in various countries and biotopesfrom West, Central and East Africa, and (ii) determine thehistorical, demographic and ecological factors shaping thegenetic diversity of this species. We studied the mitochondrialcytochrome
b
gene, because it is informative at the intrage-neric level in Lepidoptera (Simmons & Weller 2001).
Several approaches must be combined to infer the demo-graphic history of a species from sequence data. Some ofthese approaches are used to describe the genetic structure,whereas others such as nested clade phylogeographicanalyses (NCPA) are used to develop and test hypothesesconcerning the evolutionary history responsible for gener-ating the observed structure (Bernatchez 2001). This lattermethodological approach is widely used in phylogeography(Althoff & Pellmyr 2002; Duran
et al
. 2004). Knowles &Maddison (2002) pointed out the lack of statistical tests todistinguish between inferences. However, Templeton (2004)re-estimated the reliability and the validity of this methodby applying the NCPA methodology to cases in which therewere clear a priori expectations. He concluded that NCPAmakes the correct inferences in the vast majority of case.We therefore combined descriptive methods, statisticalmethods, and NCPA to investigate the historical factors ofgenetic differentiation of
B. fusca
populations.
Materials and methods
Insect DNA sampling
Busseola fusca
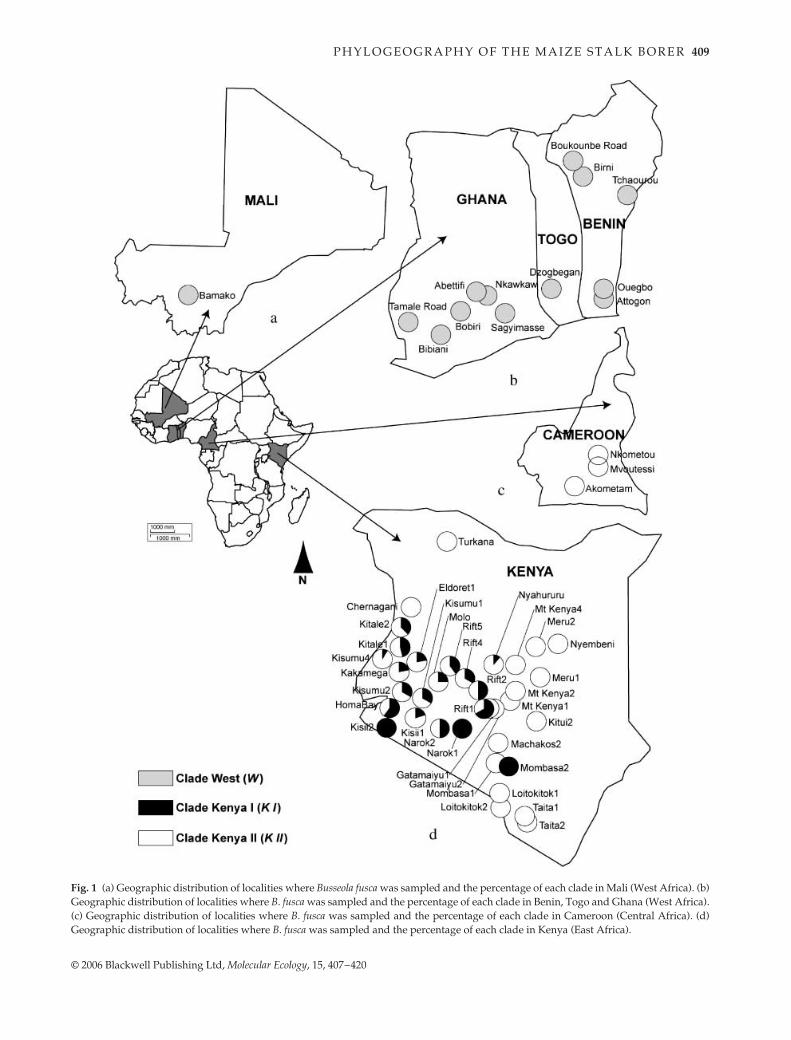
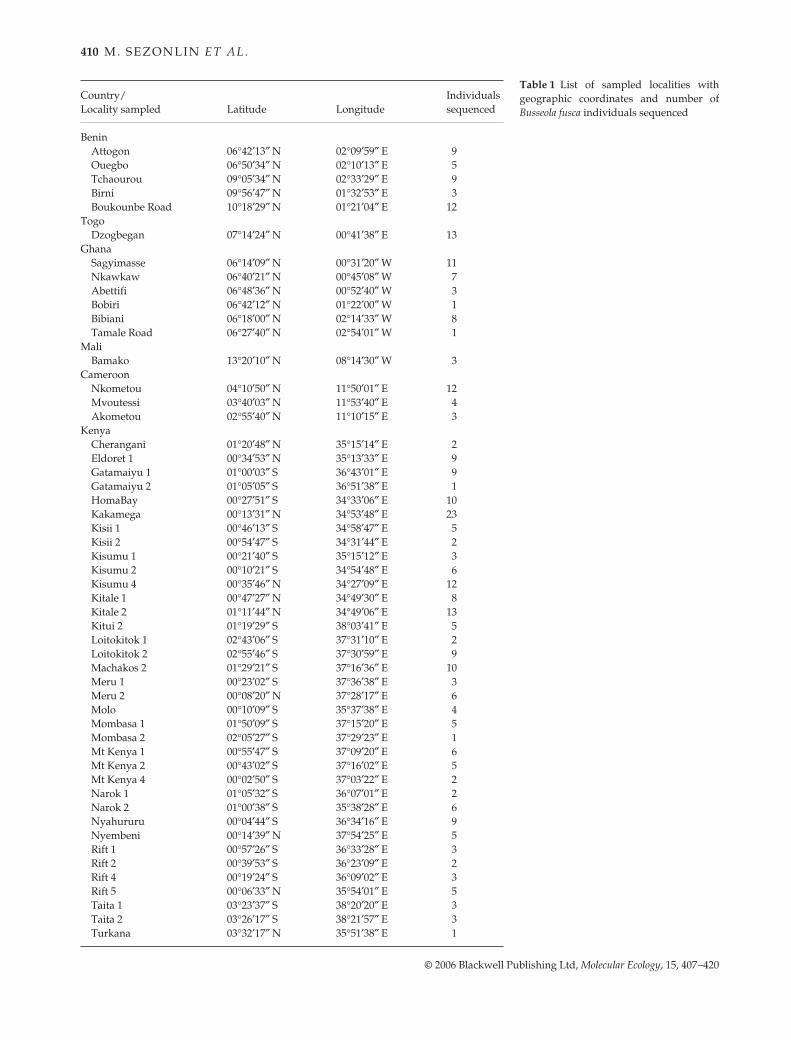
larvae were collected from maize and sorghumplants during the wet seasons of 2001–2003. The larvae andpupae sampled were reared to adult stage in the laboratoryon host plant stems. Moths were preserved in absolutealcohol immediately after emergence. Three hundred sevenindividuals from sub-Saharan Africa were analysed: 85individuals from 13 localities in Benin, Togo, Ghana andMali in West Africa; 19 individuals from three localities inCameroon in Central Africa; and 203 individuals from 36localities in five different agroecological zones in Kenya,East Africa (Hassan
et al
. 1998) (Fig. 1a–d). Table 1 providesinformation about the localities, latitude and longitudeand the individuals of
B
.
fusca
analysed for each locality.
P H Y L O G E O G R A P H Y O F T H E M A I Z E S T A L K B O R E R
409
© 2006 Blackwell Publishing Ltd,
Molecular Ecology
, 15, 407–420
Fig. 1 (a) Geographic distribution of localities where Busseola fusca was sampled and the percentage of each clade in Mali (West Africa). (b)Geographic distribution of localities where B. fusca was sampled and the percentage of each clade in Benin, Togo and Ghana (West Africa).(c) Geographic distribution of localities where B. fusca was sampled and the percentage of each clade in Cameroon (Central Africa). (d)Geographic distribution of localities where B. fusca was sampled and the percentage of each clade in Kenya (East Africa).
410
M . S E Z O N L I N
E T A L
.
© 2006 Blackwell Publishing Ltd,
Molecular Ecology
, 15, 407–420
Country/Locality sampled Latitude Longitude
Individuals sequenced
BeninAttogon 06°42′13″ N 02°09′59″ E 9Ouegbo 06°50′34″ N 02°10′13″ E 5Tchaourou 09°05′34″ N 02°33′29″ E 9Birni 09°56′47″ N 01°32′53″ E 3Boukounbe Road 10°18′29″ N 01°21′04″ E 12
TogoDzogbegan 07°14′24″ N 00°41′38″ E 13
GhanaSagyimasse 06°14′09″ N 00°31′20″ W 11Nkawkaw 06°40′21″ N 00°45′08″ W 7Abettifi 06°48′36″ N 00°52′40″ W 3Bobiri 06°42′12″ N 01°22′00″ W 1Bibiani 06°18′00″ N 02°14′33″ W 8Tamale Road 06°27′40″ N 02°54′01″ W 1
MaliBamako 13°20′10″ N 08°14′30″ W 3
CameroonNkometou 04°10′50″ N 11°50′01″ E 12Mvoutessi 03°40′03″ N 11°53′40″ E 4Akometou 02°55′40″ N 11°10′15″ E 3
KenyaCherangani 01°20′48″ N 35°15′14″ E 2Eldoret 1 00°34′53″ N 35°13′33″ E 9Gatamaiyu 1 01°00′03″ S 36°43′01″ E 9Gatamaiyu 2 01°05′05″ S 36°51′38″ E 1HomaBay 00°27′51″ S 34°33′06″ E 10Kakamega 00°13′31″ N 34°53′48″ E 23Kisii 1 00°46′13″ S 34°58′47″ E 5Kisii 2 00°54′47″ S 34°31′44″ E 2Kisumu 1 00°21′40″ S 35°15′12″ E 3Kisumu 2 00°10′21″ S 34°54′48″ E 6Kisumu 4 00°35′46″ N 34°27′09″ E 12Kitale 1 00°47′27″ N 34°49′30″ E 8Kitale 2 01°11′44″ N 34°49′06″ E 13Kitui 2 01°19′29″ S 38°03′41″ E 5Loitokitok 1 02°43′06″ S 37°31′10″ E 2Loitokitok 2 02°55′46″ S 37°30′59″ E 9Machakos 2 01°29′21″ S 37°16′36″ E 10Meru 1 00°23′02″ S 37°36′38″ E 3Meru 2 00°08′20″ N 37°28′17″ E 6Molo 00°10′09″ S 35°37′38″ E 4Mombasa 1 01°50′09″ S 37°15′20″ E 5Mombasa 2 02°05′27″ S 37°29′23″ E 1Mt Kenya 1 00°55′47″ S 37°09′20″ E 6Mt Kenya 2 00°43′02″ S 37°16′02″ E 5Mt Kenya 4 00°02′50″ S 37°03′22″ E 2Narok 1 01°05′32″ S 36°07′01″ E 2Narok 2 01°00′38″ S 35°38′28″ E 6Nyahururu 00°04′44″ S 36°34′16″ E 9Nyembeni 00°14′39″ N 37°54′25″ E 5Rift 1 00°57′26″ S 36°33′28″ E 3Rift 2 00°39′53″ S 36°23′09″ E 2Rift 4 00°19′24″ S 36°09′02″ E 3Rift 5 00°06′33″ N 35°54′01″ E 5Taita 1 03°23′37″ S 38°20′20″ E 3Taita 2 03°26′17″ S 38°21′57″ E 3Turkana 03°32′17″ N 35°51′38″ E 1
Table 1 List of sampled localities withgeographic coordinates and number ofBusseola fusca individuals sequenced

P H Y L O G E O G R A P H Y O F T H E M A I Z E S T A L K B O R E R 411
© 2006 Blackwell Publishing Ltd, Molecular Ecology, 15, 407–420
Busseola phaia (Lepidoptera, Noctuidae) has been chosen asthe outgroup based on recent unpublished work. Althoughthe systematics of African lepidopteran stem borers is stillrather confused (Holloway 1998), our studies (Moyal et al.,unpublished) show that B. phaia, collected from variousregions of East Africa, is the sister species of B. fusca.
Molecular analyses
Total DNA was extracted from insect thoraxes, using theDNeasy Tissue Kit (QIAGEN GmbH). A 1000-bp fragmentof the gene encoding cytochrome b was amplified with theprimers CP1 (modified from Harry et al. 1998): 5′-GATGAT-GAAATTTTGGATC-3′ and TRs (Simon et al. 1994): 5′-TATTTCTTTATTATGTTTTCAAAAC-3′. Polymerase chainreaction (PCR) cycling conditions were as follows: initialdenaturation for 5 min at 94 °C; 40 cycles of 94 °C for 1 min,46 °C for 1 min 30 s, 72 °C for 1 min 30 s and a final extensionperiod of 10 min at 72 °C. The reaction mixture contained3 mm MgCl2, 0.4 µm primers, 0.24 µm dNTPs, and 100 ng ofDNA plus 2 U of Promega Taq polymerase per 50 µL of reac-tion mixture. Amplified products were purified with theQIAquick purification kit (QIAGEN) and sequenced on anautomated sequencer using the amplification primers in bothdirections. The consensus sequences obtained were alignedmanually, using macclade 4.05 (Maddison & Maddison 2002).
Haplotype phylogeny
Phylogenetic relationships were estimated by means ofmaximum parsimony (MP) and neighbour joining (NJ) usingmaximum-likelihood distances. MP analyses were performedusing heuristic search strategy starting with stepwise additiontrees replicated 10 times, using a random input order ofsequences to get the initial tree for each replicate. Robustnessof MP topologies was assessed by bootstrap with 1000replicates (full heuristic search) of 10 random stepwiseaddition replicates each, for all analyses. modeltest version3.07 (Posada & Crandall 1998) was used to select the sub-stitution model that best describes the data. An NJ analysisof the ML distances obtained using the parameter estimatesderived from modeltest was performed. Bootstrap valuesfor this analysis were obtained from 1000 replications.
In order to estimate divergence time between clades,corrected pairwise genetic distances between haplotypeswere calculated using the parameters inferred from thenucleotide substitution model selected by modeltest. Allphylogenetic analyses were performed with paup* version4.0b10 (Swofford 2002).
Population genetic structure and diversity indices
An analysis of molecular variance (amova) was performedas described by Excoffier et al. (1992). The population
structure of B. fusca mitochondrial DNA was explored bycalculating the different fixation indices (ΦCT and ΦSC). Atthe regional scale, Central and East Africa were groupedand separated from West Africa according to biogeographicrelationships highlighted by studies on the African herbivorespecies that are associated with gramineous plant com-munities (Arctander et al. 1999; Flagstad et al. 2001; Alperset al. 2004). Within each region, localities were groupedbased on hypothetical biogeographic barriers (the effect ofEast Africa Rift Valley in Kenya) or according to ecologicalcategories. In West Africa, for which ecological categorieswere defined based on White (1983) phytogeographicmap, three zones concerned our study area: Sudanianwoodland with abundant Isoberlinia, mosaic of Guineo-Congolian lowland rainforest and secondary grassland, andGuineo-Congolian rainforest (drier types). In East Africa,ecological categories were based on Hassan et al. (1998)agro-ecological zones. Five zones were used for our study,Dry-mid-altitude, Dry-transitional, Moist-mid-altitude,Moist-transitional, Highland-tropical. All possible regroupingof these five zones were tested for their effect on ΦSC andΦCT values.
Haplotypic (h) and nucleotide (π) diversities have beenused to estimate the level of polymorphism and to infer thedemographic history of each clade (Grant & Bowen 1998)independently of fragment length and sample size (Nei &Li 1979; Nei 1987).
amova and diversity index calculations were performedwith the arlequin 2.000 software (Schneider et al. 2000).
Demographic history of populations
We investigated the demographic history of the cladesidentified in the phylogenetic analyses. The distributionof pairwise differences between individual sequences wasanalysed by means of mismatch distribution analysis(Slatkin & Hudson 1991; Schneider & Excoffier 1999). Aunimodal distribution would be expected for populationsin expansion and a multimodal distribution for populationsat equilibrium (Slatkin & Hudson 1991). The raggednessindex of the observed distribution (r) representing themodality of the distribution, and the sum of square deviationfrom the mismatch expected from a model of suddenpopulation expansion (SSD) were calculated. Since thenucleotide substitution model selected by hierarchicallikelihood-ratio tests (hLRTs) and Akaike informationcriterion (AIC) (HKY + I + G) was not available in thearlequin 2.000 software, the r and SSD indices werecalculated by using pairwise difference. The significance ofthese statistics was tested as implemented in arlequin.We calculated Tajima’s D index. This index can provideinformation about demographic history, with demographicexpansion leading to negative values, and subdividedpopulations at equilibrium leading to positive values (Tajima

412 M . S E Z O N L I N E T A L .
© 2006 Blackwell Publishing Ltd, Molecular Ecology, 15, 407–420
1989a, b). All demographic parameters were calculatedwith the arlequin 2.000 software (Schneider et al. 2000).
Nested clade phylogeographic analysis
NCPA was performed as described by Templeton (1998,2004). The genealogic relationships were representedthrough a haplotype parsimony network to define a seriesof nested clades. The hypothesis of random geographicdistributions was tested through permutation tests foreach clade and subclade components and the causes of thesignificant geographic patterns observed were inferred bymeans of an inference key. The probabilities of haplotypeconnections were calculated using tcs 1.17 software(Clement et al. 2000) and the network with probabilitiesabove the parsimony limit (0.95) was selected. Statisticalanalyses of geographic distances were carried out withgeodis 2.1 (Posada et al. 2000). GPS coordinates of all thesampling localities were used for the analyses. The geographicdistances between centres of distributions of clades weretested for significance in permutation tests, within clade(Dc), with nested clade centre (Dn) or between interior andtip [(I-T)Dc and (I-T)Dn] at each level. Significant valueswere interpreted in terms of population history, using thelatest inference key from Templeton (2004).
Results
Phylogenetic reconstruction
A fragment of 965 bp encoding cytochrome b was sequencedfrom 307 individuals of Busseola fusca from West, Central andEast Africa. We observed 70 different haplotypes (GenBankAccession nos AY769536–AY769605). One hundred elevennucleotide sites were variable (11.50%) and 50 were infor-mative in parsimony analysis (5.18%). According to both hLRTsand AIC, the HKY + I + G model of evolution (Hasegawa et al.1985; Yang 1993; Gu et al. 1995) was selected by modeltestversion 3.07. The parameters estimated from this modelwere: transition/transversion (ti/tv) ratio = 13.21; Pinvar =0.6981; gamma shape parameter = 0.9657; nucleotidebase frequencies: A = 0.34; C = 0.14; G = 0.10; T = 0.42. Ascommonly observed in insect mitochondria, the nucleotidesequenced had a high A + T content (A + T = 76%).
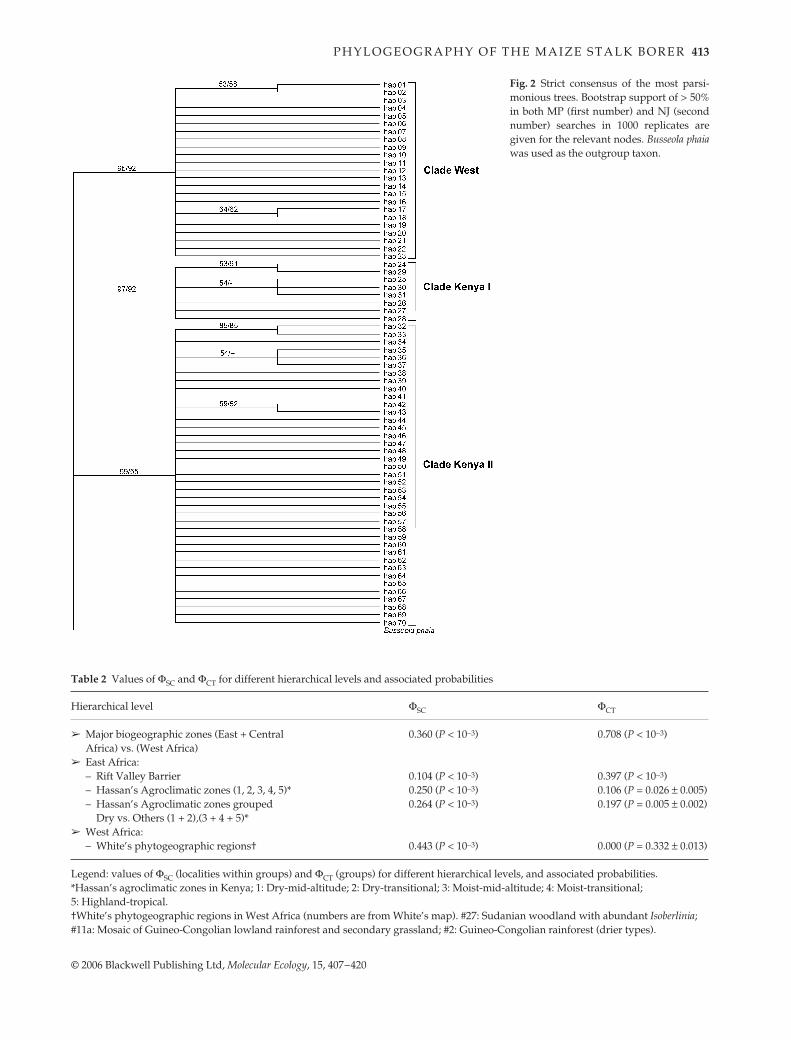
Parsimony analyses generated six equiparsimonious trees(length = 162, CI = 0.698, RI = 0.931). Each of these trees wasdivided into same three clades: a clade grouping sequencesfrom the West African region only (W ), a Kenya I clade (KI )and a Kenya II clade (KII ), which also contained sequencesfrom Cameroon. Discrepancies between these six equi-parsimonious topologies concerned only the apical nodes. Itwas therefore possible to construct a strict consensus of themost parsimonious trees (Fig. 2). NJ tree obtained using MLdistances was similar to topology derived from MP analyses.
The three conspicuous clades of individuals and haplo-types are supported by bootstrap values exceeding 50%both for MP and NJ analyses. The smallest clade KIcomprised 8 haplotypes and 43 individuals, all of whichcame from Kenya. The clade KII comprised 39 haplotypesand 179 individuals and had the largest distribution fromEast to Central Africa. Finally, the clade W comprised 23haplotypes and 85 individuals and was found only in WestAfrica. No haplotype was shared between West Africanpopulations and East–Central African populations. Bothin MP and NJ analyses, W and KI were supported by highbootstrap values whereas KII was supported by lowerbootstrap values. The phylogenetic relationships betweenthese three major clades remain unclear. The sister groupstatus of clades W and KI was observed only in NJ analysisand supported by low bootstrap values.
The corrected mean pairwise genetic distances betweenhaplotypes within and between clades are shown in Table 3.
Genetic structure and diversity indices of the B. fusca populations
Significant genetic structure was observed at various hier-archical levels (Table 2). Most of the molecular variationwas accounted for by the differentiation between largepopulation units corresponding to biogeographic units,West Africa on one hand and Eastern Africa + Cameroon onthe other hand (ΦCT = 0.708, P < 10−3). Significant geneticdifferentiation was observed among the populations withinthese two biogeographic units (ΦCS = 0.360, P < 10−3). WithinKenya, most of the variation was accounted for by the RiftValley (ΦCT = 0.397, P < 10−3), suggesting that this geographicfeature constitutes a strong natural barrier to gene flow.Other arrangements based on Hassan’s agroclimatic zonesin Kenya were tested. The differentiation among theseagroclimatic zones was significant (ΦCT = 0.106, P = 0.026 ±0.005) but this value remained low compared to effect ofthe East Africa Rift Valley. The highest ΦCT value amongcombinations of agroclimatic zones (0.197, P = 0.005 ± 0.002)was obtained by grouping dry vs. others agro-ecologicalzones. In West Africa, no genetic structure was observedbetween White’s (1983) phytogeographic zones. For allhierarchical structures tested in West and East Africa, thegenetic differentiation between localities (ΦSC) was significantwithin group (Table 2).
The three conspicuous clades are separated by similarmean distances and displayed similar nucleotide andhaplotype diversity indexes (Table 3).
Demographic history of B. fusca
In the absence of a suitable intrinsic calibration we canapply the approximate 2% per million years divergence ratefor insect mtDNA of Brower (1994). While this provides
P H Y L O G E O G R A P H Y O F T H E M A I Z E S T A L K B O R E R 413
© 2006 Blackwell Publishing Ltd, Molecular Ecology, 15, 407–420
Fig. 2 Strict consensus of the most parsi-monious trees. Bootstrap support of > 50%in both MP (first number) and NJ (secondnumber) searches in 1000 replicates aregiven for the relevant nodes. Busseola phaiawas used as the outgroup taxon.
Table 2 Values of ΦSC and ΦCT for different hierarchical levels and associated probabilities
Hierarchical level ΦSC ΦCT
➢ Major biogeographic zones (East + Central Africa) vs. (West Africa)
0.360 (P < 10−3) 0.708 (P < 10−3)
➢ East Africa:– Rift Valley Barrier 0.104 (P < 10−3) 0.397 (P < 10−3)– Hassan’s Agroclimatic zones (1, 2, 3, 4, 5)* 0.250 (P < 10−3) 0.106 (P = 0.026 ± 0.005)– Hassan’s Agroclimatic zones grouped
Dry vs. Others (1 + 2),(3 + 4 + 5)*0.264 (P < 10−3) 0.197 (P = 0.005 ± 0.002)
➢ West Africa:– White’s phytogeographic regions† 0.443 (P < 10−3) 0.000 (P = 0.332 ± 0.013)
Legend: values of ΦSC (localities within groups) and ΦCT (groups) for different hierarchical levels, and associated probabilities.*Hassan’s agroclimatic zones in Kenya; 1: Dry-mid-altitude; 2: Dry-transitional; 3: Moist-mid-altitude; 4: Moist-transitional; 5: Highland-tropical.†White’s phytogeographic regions in West Africa (numbers are from White’s map). #27: Sudanian woodland with abundant Isoberlinia; #11a: Mosaic of Guineo-Congolian lowland rainforest and secondary grassland; #2: Guineo-Congolian rainforest (drier types).
414 M . S E Z O N L I N E T A L .
© 2006 Blackwell Publishing Ltd, Molecular Ecology, 15, 407–420
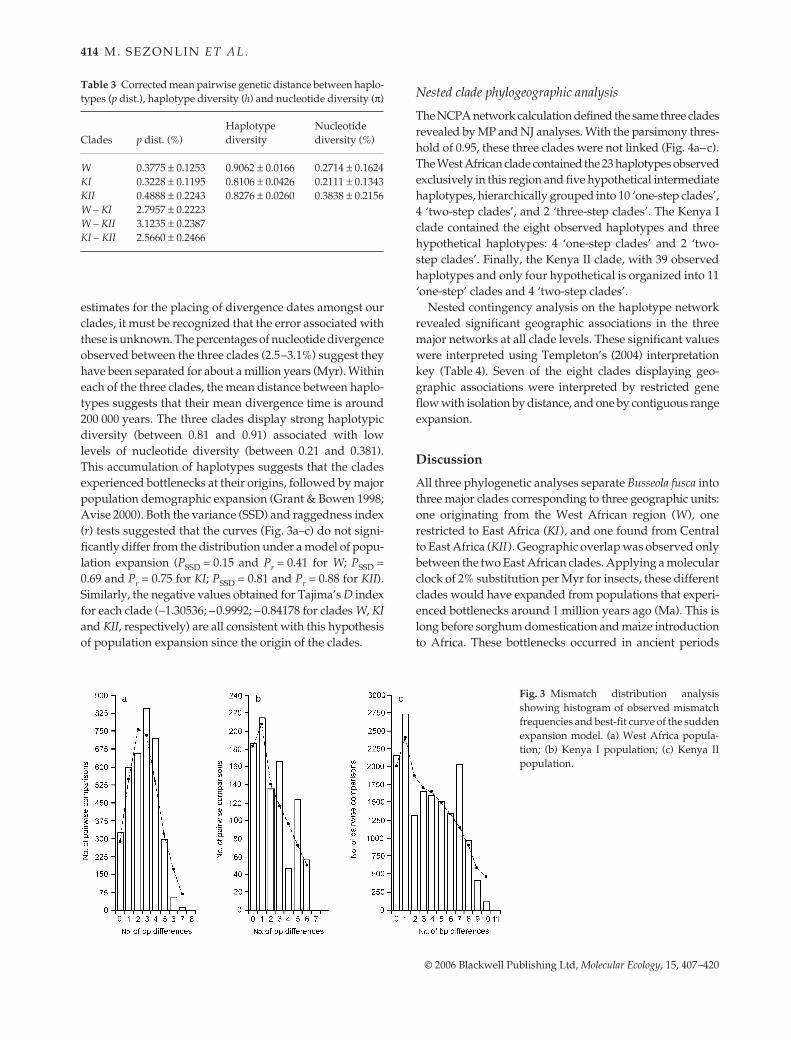
estimates for the placing of divergence dates amongst ourclades, it must be recognized that the error associated withthese is unknown. The percentages of nucleotide divergenceobserved between the three clades (2.5–3.1%) suggest theyhave been separated for about a million years (Myr). Withineach of the three clades, the mean distance between haplo-types suggests that their mean divergence time is around200 000 years. The three clades display strong haplotypicdiversity (between 0.81 and 0.91) associated with lowlevels of nucleotide diversity (between 0.21 and 0.381).This accumulation of haplotypes suggests that the cladesexperienced bottlenecks at their origins, followed by majorpopulation demographic expansion (Grant & Bowen 1998;Avise 2000). Both the variance (SSD) and raggedness index(r) tests suggested that the curves (Fig. 3a–c) do not signi-ficantly differ from the distribution under a model of popu-lation expansion (PSSD = 0.15 and Pr = 0.41 for W; PSSD =0.69 and Pr = 0.75 for KI; PSSD = 0.81 and Pr = 0.88 for KII).Similarly, the negative values obtained for Tajima’s D indexfor each clade (−1.30536; –0.9992; –0.84178 for clades W, KIand KII, respectively) are all consistent with this hypothesisof population expansion since the origin of the clades.
Nested clade phylogeographic analysis
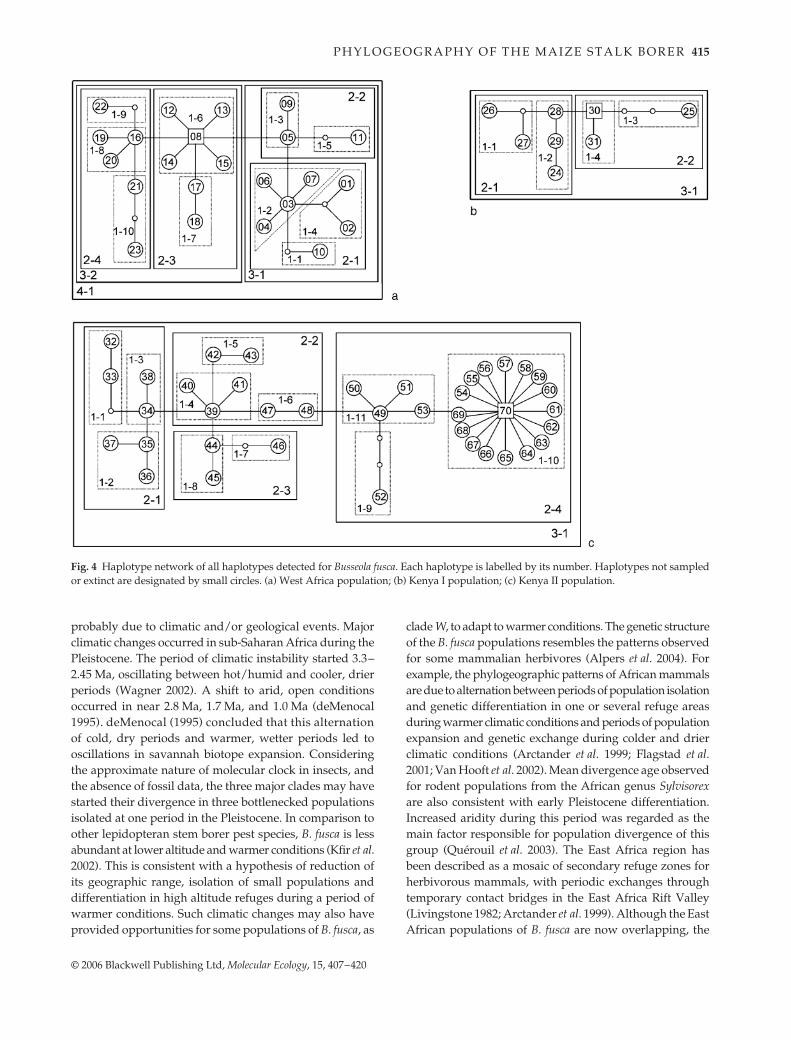
The NCPA network calculation defined the same three cladesrevealed by MP and NJ analyses. With the parsimony thres-hold of 0.95, these three clades were not linked (Fig. 4a–c).The West African clade contained the 23 haplotypes observedexclusively in this region and five hypothetical intermediatehaplotypes, hierarchically grouped into 10 ‘one-step clades’,4 ‘two-step clades’, and 2 ‘three-step clades’. The Kenya Iclade contained the eight observed haplotypes and threehypothetical haplotypes: 4 ‘one-step clades’ and 2 ‘two-step clades’. Finally, the Kenya II clade, with 39 observedhaplotypes and only four hypothetical is organized into 11‘one-step’ clades and 4 ‘two-step clades’.
Nested contingency analysis on the haplotype networkrevealed significant geographic associations in the threemajor networks at all clade levels. These significant valueswere interpreted using Templeton’s (2004) interpretationkey (Table 4). Seven of the eight clades displaying geo-graphic associations were interpreted by restricted geneflow with isolation by distance, and one by contiguous rangeexpansion.
Discussion
All three phylogenetic analyses separate Busseola fusca intothree major clades corresponding to three geographic units:one originating from the West African region (W ), onerestricted to East Africa (KI ), and one found from Centralto East Africa (KII ). Geographic overlap was observed onlybetween the two East African clades. Applying a molecularclock of 2% substitution per Myr for insects, these differentclades would have expanded from populations that experi-enced bottlenecks around 1 million years ago (Ma). This islong before sorghum domestication and maize introductionto Africa. These bottlenecks occurred in ancient periods
Table 3 Corrected mean pairwise genetic distance between haplo-types (p dist.), haplotype diversity (h) and nucleotide diversity (π)
Clades p dist. (%)Haplotype diversity
Nucleotide diversity (%)
W 0.3775 ± 0.1253 0.9062 ± 0.0166 0.2714 ± 0.1624KI 0.3228 ± 0.1195 0.8106 ± 0.0426 0.2111 ± 0.1343KII 0.4888 ± 0.2243 0.8276 ± 0.0260 0.3838 ± 0.2156W – KI 2.7957 ± 0.2223W – KII 3.1235 ± 0.2387KI – KII 2.5660 ± 0.2466
Fig. 3 Mismatch distribution analysisshowing histogram of observed mismatchfrequencies and best-fit curve of the suddenexpansion model. (a) West Africa popula-tion; (b) Kenya I population; (c) Kenya IIpopulation.
P H Y L O G E O G R A P H Y O F T H E M A I Z E S T A L K B O R E R 415
© 2006 Blackwell Publishing Ltd, Molecular Ecology, 15, 407–420
probably due to climatic and/or geological events. Majorclimatic changes occurred in sub-Saharan Africa during thePleistocene. The period of climatic instability started 3.3–2.45 Ma, oscillating between hot/humid and cooler, drierperiods (Wagner 2002). A shift to arid, open conditionsoccurred in near 2.8 Ma, 1.7 Ma, and 1.0 Ma (deMenocal1995). deMenocal (1995) concluded that this alternationof cold, dry periods and warmer, wetter periods led tooscillations in savannah biotope expansion. Consideringthe approximate nature of molecular clock in insects, andthe absence of fossil data, the three major clades may havestarted their divergence in three bottlenecked populationsisolated at one period in the Pleistocene. In comparison toother lepidopteran stem borer pest species, B. fusca is lessabundant at lower altitude and warmer conditions (Kfir et al.2002). This is consistent with a hypothesis of reduction ofits geographic range, isolation of small populations anddifferentiation in high altitude refuges during a period ofwarmer conditions. Such climatic changes may also haveprovided opportunities for some populations of B. fusca, as
clade W, to adapt to warmer conditions. The genetic structureof the B. fusca populations resembles the patterns observedfor some mammalian herbivores (Alpers et al. 2004). Forexample, the phylogeographic patterns of African mammalsare due to alternation between periods of population isolationand genetic differentiation in one or several refuge areasduring warmer climatic conditions and periods of populationexpansion and genetic exchange during colder and drierclimatic conditions (Arctander et al. 1999; Flagstad et al.2001; Van Hooft et al. 2002). Mean divergence age observedfor rodent populations from the African genus Sylvisorexare also consistent with early Pleistocene differentiation.Increased aridity during this period was regarded as themain factor responsible for population divergence of thisgroup (Quérouil et al. 2003). The East Africa region hasbeen described as a mosaic of secondary refuge zones forherbivorous mammals, with periodic exchanges throughtemporary contact bridges in the East Africa Rift Valley(Livingstone 1982; Arctander et al. 1999). Although the EastAfrican populations of B. fusca are now overlapping, the
Fig. 4 Haplotype network of all haplotypes detected for Busseola fusca. Each haplotype is labelled by its number. Haplotypes not sampledor extinct are designated by small circles. (a) West Africa population; (b) Kenya I population; (c) Kenya II population.

416M
. SE
ZO
NL
IN E
T A
L.
© 2006 Blackw
ell Publishing Ltd, Molecular Ecology, 15, 407–420
Table 4 Result of nested clade analysis for clades in which a significant geographic association was detected. Haplotypes/clades shaded in grey are interior. RGF-IBD: restricted geneflow with isolation by distance, CRE: contiguous range expansion. Dc, average distance of individuals from the clade’s geographic centre. Dn, the average distance of individuals fromthe geographic centre of all members of the nested clade. (I-T)c, the average distance between interior and tip clades within a given clade, and (I-T)n, the average distance between interiorand tip clades in the nested clade. Superscript L or S denotes significantly large distances and significantly small distances for P < 0.05, respectively.
P H Y L O G E O G R A P H Y O F T H E M A I Z E S T A L K B O R E R 417
© 2006 Blackwell Publishing Ltd, Molecular Ecology, 15, 407–420
Rift Valley explains most of the molecular variation inKenya and seems to have worked as an important naturalbarrier to maintain population structure. The Rift Valleyhave arisen and expanded from 2.9 to 1.6 Ma (Zeitoun2000). It works as a natural barrier reinforcing populationstructure in many species of vertebrates (Arctander et al.1999; Pitra et al. 2002). Our results on B. fusca suggest thisnatural barrier plays a similar role on reinforcement ofpopulation structure within this species, which in our casewere probably initially isolated in climatic refuges. In addition,biogeographic distinction has been observed between thevertebrate faunas of West Africa and Cameroon/EastAfrica (Alpers et al. 2004) and this pattern is what we foundfor B. fusca populations. In summary, the major effect ofRift Valley, the possible importance of Pleistocene climaticcycles and the strong differentiation between Central +East Africa and West Africa suggest that similar climaticand geological processes drove the genetic differentiation ofB. fusca and herbivorous vertebrate populations. Variousdemographic indices suggest that each of the three cladesof B. fusca experienced population expansion after thisperiod of bottlenecks. Within each clade, genetic diversityis now geographically distributed in a pattern suggestiveof restricted gene flow with isolation by distance.
The presence of a large population unit, clade KII, fromCameroon to Kenya is consistent with the hypothesis of afaunistic link between these two regions (Carcasson 1964;De Jong & Congdon 1993; Bruhl 1997), which are separatedby a distance of 3000 km. An eastern origin is a possibilityas it was suggested for a butterfly species in Cameroon (DeJong & Congdon 1993). De Jong & Congdon (1993) arguethat the low animal species diversity in highland forests ofCameroon suggests that these species originated from long-distance migration from East Africa. However, the natureof this faunistic link was not elucidated by our study andremains unknown for B. fusca.
In West Africa, only a few haplotypes were shared betweenlocalities. The same was true, but to a lesser extent, in EastAfrica. Significant fine-scale structure was observed withineach biogeographic region, and each geological andecological category. This fine-scale structure suggests thatB. fusca is a fairly sedentary species. However, field experi-ments are required to determine whether this behaviouralpattern is the rule in all ecological situations. Kfir et al. (2002)have shown that, during the dry season, crop residuescontain a large number of B. fusca larvae. The authorsconcluded that the insects present in the crops came fromcrop residues at the same site rather than migrating fromother areas. Moyal (1998) reported large differences in larvalpopulation densities between two sites less than 50 kmapart, which might be due to demographic isolation andlow dispersal capacities. Nevertheless, our recent spuriousobservations of B. fusca in remote poorly suitable sites innorthern Kenya, suggest that within this region, B. fusca
population density is low or that long-distance migrationmay occur sporadically. The population from western Kenya(KI) seems to be more restricted geographically than theother two clades. Future collections of moths in CentralAfrican states (such as Uganda and Congo) will be requiredto improve our estimates of the geographic range of thisclade.
The original wild host plant of B. fusca has not been iden-tified in the field since this maize stalk borer is uncommonin wild habitats. However, the preference of this species forcultivated sorghum (Khan et al. 1997; Haile & Hofsvang2002) suggests that it was originally associated with aparticular species of wild sorghum. Experimental labor-atory studies of oviposition choice among a large numberof wild and cultivated Poacae, Cyperacae and Typhacaedemonstrated that both adults (for oviposition) andlarvae (for their development) display a preference for aparticular wild sorghum variety (Sorghum vulgare pres.var. sudanense) (Khan et al. 2000; Haile & Hofsvang 2002).Haile & Hofsvang (2002) also showed that S. vulgare wasthe only wild host plant allowing complete developmentof this insect. The simplest hypothesis is that B. fuscaswitched from wild to cultivated sorghum during theprocess of domestication.
The domestication of wild sorghum began in northeastAfrica, but investigations have shown that genetic exchangeoccurred locally between this common genetic stock andwild sorghum in all regions during the expansion ofagriculture in Africa. Ollitrault et al. (1989) revealed thatwild sorghum is geographically structured into three maingroups, one from West Africa, one from southern Africaand one group associating East and Central Africa. Thegenetic structure of populations of cultivated sorghumhas therefore, to some extent, been influenced by regionalhybridization/introgression events with the wild sorghumspecies and this may have resulted in various regionallydistinct genetic groups within cultivated sorghum (Deu &Hamon 1994). For insects associated with wild or cultivatedsorghum, the same regional influence seems to be true.B. fusca displays a similar geographic pattern, with cladesspecific to West Africa and clades from East and CentralAfrica. Further analyses on southern African populationswill show us whether they belong to yet another clade.Although we have found a similar pattern, we cannotconclude that the same events structured the insect and itsputative wild host plant. We infer the existence of palaeo-refuges for B. fusca based on phylogeographic analysesand present ecological preferences of this species. Incontrast, the ecological preferences of wild sorghum strainsare highly variable (De Wet 1978). This suggests that therefuges and/or fragmentation barriers that have shapedthe population structure of the insect may be different forthe plant. However, for both the insect and the plant it islikely that ancient events shaped the observed genetic
418 M . S E Z O N L I N E T A L .
© 2006 Blackwell Publishing Ltd, Molecular Ecology, 15, 407–420
structure. The influence of ancient genetic events may beeven more important for the insect than for the plant: thegenetic structure of B. fusca populations clearly does notderive from a recent invasion of a common genetic pooloriginating from the region of sorghum domestication(northeast Africa), but it is instead exclusively inheritedfrom patterns determined by the ancient history of theinsect on wild Poaceae in a palaeoclimatic context thatfavoured the geographic isolation of three different popu-lations in refuge zones corresponding to B. fusca ecologicalpreferences. This suggests that the switch from wild tocultivated sorghum occurred several times from localpopulations of B. fusca. This hypothesis of the stability ofgenetic structure from ancient wild B. fusca to actualpopulations associated to cultivated plants should betested for other regions of the genome, in particularnuclear genes. This will increase our understanding onthe signature of plant domestication on pest populationgenetic structure. For instance, in the pyralid Ostrinianubilalis, the European corn borer, no genetic differenti-ation was observed between insects on maize and wildhosts for mitochondrial markers whereas strong differ-entiation was observed for nuclear allozymes (Thomaset al. 2003). Thus, only part of the genome may be affectedby domestication and involved in the adaptation tocultivated plants.
In conclusion, based on mitochondrial DNA, three majorgroups of populations can be distinguished in B. fusca:a homogeneous and geographically isolated populationfrom West Africa, and two populations from East andCentral Africa with overlapping distributions. Phylogeneticrelationships suggest that the three populations differenti-ated in different regions of Africa during the same period,before human-mediated ecological changes. Analysis ofmolecular variance and NCPA interpretations suggest thatlocal population differentiation was shaped by restrictedgene flow with isolation by distance. The strong geneticstructure observed suggests that B. fusca has in generallimited dispersal capacities.
Although little is known about the biogeography ofAfrican phytophagous insects, the factors responsible forthe patterns observed in B. fusca can be compared withthose identified in studies on other herbivores, particularlymammals. The East Africa Rift Valley was also identifiedas a major factor for genetic structure for several groups ofvertebrates in Africa (Arctander et al. 1999; Pitra et al. 2002).More generally, the study on B. fusca suggests that climaticfluctuations in the Pleistocene generated isolated popula-tions and shaped the genetic structures of various groups ofherbivores associated with gramineous plant communitiesin Africa, both for mammals (Arctander et al. 1999; Flagstadet al. 2001; Alpers et al. 2004) and insects. These results forB. fusca generate new hypotheses for future investigationsof African insect phylogeography.
Acknowledgements
This study was supported by IRD UR072. We would like to thankD. Baille for technical assistance in the development of molecularmarkers and preliminary phylogeographic analyses, and themembers of the ICIPE Noctuid Stem Borer Biodiversity Project fortechnical assistance during insect collection and insect rearing inthe laboratory in Kenya. We are grateful to C. Wanjiru Gitau andL. Corley for their help to the English correction of the manuscript.We are indebted to G. Goergen for his support and Z. Djihou fortechnical assistance at IITA-Cotonou in Benin. B. Emerson andtwo anonymous referees also helped greatly in improving thismanuscript.
References
Ajayi O (1998) Sorghum: West Africa. In: African Cereal Stem Borers:Economic Importance, Taxonomy, Natural Enemies and Control (ed.Polaszek A), pp. 39–45. CABI, Wallingford, UK.
Alpers DL, Van Vuuren BJ, Arctander P, Robinson TJ (2004)Population genetics of the roan antelope (Hippotragus equinus) withsuggestions for conservation. Molecular Ecology, 13, 1771–1784.
Althoff MD, Pellmyr O (2002) Examining genetic structure inbogus yucca moth: a sequential approach to phylogeography.Evolution, 56, 1632–1643.
Arctander P, Johansen C, Coutellec-Vreto M (1999) Phylogeographyof three closely related African bovids (tribe Alcelaphini).Molecular Biology and Evolution, 16, 1724–1739.
Avise JC (2000) Phylogeography: The History and Formation of Species.Harvard University Press, Cambridge, Massachusetts.
Bernatchez L (2001) The evolutionary history of brown trout(Salmo trutta L.) inferred from phylogeographic, nested clade,and mismatch analyses of mitochondrial DNA variation.Evolution, 55, 351–379.
Brower AVZ (1994) Rapid morphological radiation and conver-gence among races of the butterfly Heliconius erato inferred frompatterns of mitochondrial DNA evolution. Proceedings of theNational Academy of Sciences, USA, 91, 6491–6495.
Bruhl CA (1997) Flightless insects: a test case for historical relation-ships of African mountains. Journal of Biogeography, 24, 233–250.
Carcasson RH (1964) A preliminary survey of the zoogeographyof African butterflies. East African Wildlife Journal, 2, 122–157.
Chastanet M (1998) Introduction et place du maïs au SahelOccidental (Sénégal-Mauritanie). In: Plantes et Paysages d’Afrique.Une Histoire à Explorer (ed. Chastanet M), pp. 251–275. Karthala-CRA, Paris.
Clement M, Posada D, Crandall KA (2000) tcs: a computer programto estimate gene genealogies. Molecular Ecology, 9, 1657–1660.
Dakouo D, Ratnadass A (1997) Les lépidoptères foreurs de tige dusorgho en Afrique de l’Ouest: fluctuations saisonnières, import-ance économique et perspectives de lutte intégrée. Annales de laSociété Entomologique de France, 35 (Suppl.), 463–470.
De Jong R, Congdon TCE (1993) The montane butterflies of theeastern Afrotropics. In: Biogeography and Ecology of the RainForests of Eastern Africa (eds Lovett JC, Wasser SK), pp. 133–164.Cambridge University Press, Cambridge.
Deu M, Hamon P (1994) Diversité des sorghos: application à lagestion des ressources génétiques et à la sélection. Agriculture etDéveloppement, 3, 25–30.
De Wet JMJ (1978) Systematics and evolution of sorghum sectionSorghum (Graminae). American Journal of Botany, 65, 477–484.

P H Y L O G E O G R A P H Y O F T H E M A I Z E S T A L K B O R E R 419
© 2006 Blackwell Publishing Ltd, Molecular Ecology, 15, 407–420
Doggett H (1988) Sorghum, 2nd edn. Longman Scientific andTechnical Publishers, London.
Duran S, Giribet G, Turon X (2004) Phylogeography history of thesponge Crambe crambe (Porifera, Poecilosclerida): range expansionand recent invasion of the Macaronesian islands from theMediterranean Sea. Molecular Ecology, 13, 109–122.
Excoffier L, Smouse PE, Quattro JM (1992) Analysis of molecularvariance inferred from metric distances among DNA haplo-types: application to human mitochondrial DNA restrictiondata. Genetics, 131, 479–491.
Flagstad Ø, Syvertsen PO, Stenseth NC, Jakobsen KS (2001)Environmental change and rate of evolution: the phylo-geographic pattern within the hartebeest complex as related toclimatic variation. Proceedings of the Royal Society of London. SeriesB, Biological Sciences, 268, 667–677.
Grant SW, Bowen BW (1998) Shallow population histories in deepevolutionary lineages of marine fishes: insights from sardinesand anchovies and lessons for conservation. Journal of Heredity,89, 415–426.
Gu X, Fu YX, Li WH (1995) Maximum likelihood estimation ofheterogeneity of substitution rate among nucleotide sites.Molecular Biology and Evolution, 12, 546–557.
Haile A, Hofsvang T (2001) Survey of lepidopterous stem borersof sorghum, maize and pearl millet in Eritrea. Crop Protection,20, 151–157.
Haile A, Hofsvang T (2002) Host plant preference of the stem borerBusseola fusca (Fuller) (Lepidoptera: Noctuidae). Crop Protection,21, 227–233.
Harry M, Solignac M, Lachaise D (1998) Molecular evidence forparallel evolution of adaptive syndromes in fig-breedingLissocephala (Drosophilidae). Molecular Phylogenetics andEvolution, 9, 542–551.
Hasegawa M, Kishino H, Yano T (1985) Dating of the human–apesplitting by a molecular clock of mitochondrial DNA. Journal ofMolecular Evolution, 21, 160–174.
Hassan RM, Corbett JD, Njoroge K (1998) Maize TechnologyDevelopment and Transfer: A GIS Application for Research Planningin Kenya. CAB International, Wallington, Oxon, UK.
Holloway JD (1998) Noctuidae. In: African Cereal Stem Borers:Economic Importance, Taxonomy, Natural Enemies and Control (ed.Polaszek A), pp. 79–86. CABI, Wallingford, UK.
Kfir R, Overholt AW, Khan RZ, Polaszek A (2002) Biology andmanagement of economically important lepidopteran cerealstem borers in Africa. Annual Review of Entomology, 47, 701–731.
Khan ZR, Chiliswa P, Ampong-Nyarko K et al. (1997) Utilizationof wild gramineous plants for the management of cerealstem borers in Africa. Insect Science and its Application, 17, 143–150.
Khan ZR, Pickett JA, van den Berg J, Wadhams LJ, Woodcock CM(2000) Exploiting chemical ecology and species diversity: stemborer and striga control for maize and sorghum in Africa. PestManagement Science, 56, 957–962.
Knowles LL, Maddison WP (2002) Statistical phylogeography.Molecular Ecology, 11, 2623–2635.
Kuchta SR, Meyer D (2001) A genealogical view of geographicalvariation. Molecular Ecology, 10, 2569–2576.
Livingstone DA (1982) Quaternary geography of Africa andrefuge theory. In: Biological Diversification in the Tropics: Proceedingsof the 5th International Symposium of the Association for TropicalBiology (ed. Prance GT), pp. 523–536. Columbia UniversityPress, New York.
Maddison DR, Maddison WP (2002) MACCLADE: Analysis of Phylogenyand Character Evolution, Version 4.02. Sinauer Associates,Sunderland, Massachusetts.
Madeira Santos ME, Ferraz Torrao MM (1998) Entre l’Amérique etl’Afrique, les îles du Cap-vert et Sao Tomé: les cheminements desmilhos (mil, sorgho et maïs). In: Plantes et Paysages d’Afrique. UneHistoire à Explorer (ed. Chastanet M), pp. 69–83. Karthala-CRA, Paris.
deMenocal PB (1995) Plio–Pleistocene African climate. Science,270, 53–59.
Moyal P (1998) Infestation patterns and parasitism of the maizestalk borer, Busseola fusca (Fuller) (Lepidoptera: Noctuidae) inthe Ivory Coast. African Entomology, 6, 289–296.
Murty DS, Renard C (2001) Sorgho (Sorghum bicolor (L.) Moench).In: Agriculture en Afrique Tropicale (ed. Raemaekers RH), pp. 105–125. Direction Générale de la Coopération Internationale,Bruxelles, Belgique.
Ndemah R, Schulthess F, Poelhing M, Borgemeister C (2000)Species composition and seasonal dynamics of lepidopterousstem borers on maize and elephant grass, Pennisetum purpureum(Moench) (Poaeceae), at two forest margin sites in Cameroon.African Entomology, 8, 265–272.
Ndemah R, Schulthess F, Korie S, Borgemeister C, Cardwell KF(2001) Distribution, relative importance and effect of lepido-pterous borers on maize yields in forest zone and mid-altitudeof Cameroon. Journal of Economic Entomology, 94, 1434–1444.
Nei M (1987) Molecular Evolutionary Genetics. Columbia UniversityPress, New York.
Nei M, Li WH (1979) Mathematical model for studying geneticvariation in terms of restriction endonucleases. Proceedings of theNational Academy of Sciences, USA, 76, 5269–5273.
Nye IWR (1960) The Insect Pests of Graminaceous Crops in East Africa.Colonial Research Studies, 31. Her Majesty’s Stationary Office,London, UK.
Ollitrault P, Arnaud M, Chantereau J (1989) Polymorphismeenzymatique des sorghos. II. Organisation génétique et évolutivedes sorghos cultivés. L’Agronomie Tropicale, 44, 211–222.
Pitra C, Hansen JA, Lieckfeldt D, Arctander P (2002) An exceptionalcase of historical outbreeding in African sable antelope popula-tions. Molecular Ecology, 11, 1197–1208.
Polaszek A, Khan ZR (1998) Host plants. In: African Cereal StemBorers: Economic Importance, Taxonomy, Natural Enemies andControl (ed. Polaszek A), pp. 3–10. CABI, Wallingford, UK
Posada D, Crandall KA (1998) modeltest: testing the model ofDNA substitution. Bioinformatics, 14, 817–818.
Posada D, Crandall KA, Templeton AR (2000) geodis: a programfor the cladistic nested analysis of geographical distribution ofgenetic haplotypes. Molecular Ecology, 9, 487–488.
Quérouil S, Verheyen E, Dillen M, Colyn M (2003) Patterns ofdiversification in two African forest shrews: Sylvisorex johnstoniand Sylvisorex ollula (Soricidae, Insectivora) in relation to paleo-environmental changes. Molecular Phylogenetics and Evolution,28, 24–37.
Ristanovic D (2001) Maïs (Zea mays L.). In: Agriculture en AfriqueTropicale (ed. Raemaekers RH), pp. 44–70. Direction Générale dela Coopération Internationale, Bruxelles, Belgique.
Schneider SD, Excoffier L (1999) Estimation of past demographicparameters from the distribution of pairwise distances whenthe mutation rates vary among sites: application to humanmitochondrial DNA. Genetics, 152, 1079–1089.
Schneider SD, Roessli D, Excoffier L (2000) ARLEQUIN (version 2 000):A software for genetic data analysis. Genetics and BiometryLaboratory, University of Geneva, Geneva, Switzerland.
420 M . S E Z O N L I N E T A L .
© 2006 Blackwell Publishing Ltd, Molecular Ecology, 15, 407–420
Schultess F, Bosque-Pérez NA, Shabi-Olaye A, Gounou S,Ndemah R, Goergen G (1997) Exchanges of natural enemies oflepidopteran cereal stem borers between African regions. InsectSciences and its Application, 17, 97–108.
Simmons RB, Weller SJ (2001) Utility and evolution of cytochromeb in insects. Molecular Phylogenetics and Evolution, 20, 196–210.
Simon C, Frati F, Beckenbach A, Crespi B, Liu H, Flook P (1994)Evolution, weighting and phylogenetic utility of mitochondrialgene sequences and a compilation of conserved polymerasechain reaction primers. Annals of the Entomological Society ofAmerica, 87, 651–701.
Sithole SZ (1989) Sorghum stem borers in Southern Africa. In:International Workshop Sorghum Stem Borers, Patancheru, 1987 (ed.Nwanze KF), pp. 41–47. ICRISAT, Patancheru, India.
Slatkin M, Hudson RR (1991) Pairwise comparisons of mitochon-drial DNA sequences in stable and exponentially growingpopulations. Genetics, 129, 555–562.
Swofford DL (2002) PAUP*. Phylogenetic Analysis Using Parsimony(*and other Methods), Version 4.0b10. Sinauer Associates,Sunderland, Massachusetts.
Tajima F (1989a) Statistical method for testing the neutral mutationhypothesis by DNA polymorphism. Genetics, 123, 585–595.
Tajima F (1989b) The effect of change in population size on DNApolymorphism. Genetics, 123, 597–601.
Templeton AR (1998) Nested clade analysis of phylogeographicdata: testing hypothesis about gene flow and population history.Molecular Ecology, 7, 381–397.
Templeton AR (2004) Statistical phylogeography: methods ofevaluating and minimizing inference errors. Molecular Ecology,13, 789–809.
Thomas Y, Bethenod MT, Pelozuelo L, Frérot B, Bourguet D (2003)Genetic isolation between two sympatric host-plant races of theEuropean corn borer, Ostrinia nubilalis Hübner. I. Sex pheromone,moth emergence timing, and parasitism. Evolution, 57, 261–273.
Van Hooft WF, Groen AF, Prins HHT (2002) Phylogeography ofthe African buffalo based on mitochondrial and Y-chromosomal
loci: Pleistocene origin and population expansion of the Capebuffalo subspecies. Molecular Ecology, 11, 267–279.
Wagner T (2002) Late Cretaceous to early Quaternary organicsedimentation in the eastern Equatorial Atlantic. Palaeogeography,Palaeoclimatology, Palaeoecology, 179, 113–147.
White F (1983) The vegetation of Africa, a descriptive memoir toaccompany the UNESCO/AETFAT/UNSO vegetation map ofAfrica. UNESCO, Natural Resources Research, 20, 1–356.
Yang Z (1993) Maximum likelihood estimation of phylogenyfrom DNA sequences when substitution rates differ over sites.Molecular Biology and Evolution, 10, 1396–1402.
Zeitoun V (2000) Adéquation entre changements environne-mentaux et spéciations humaines au Plio–Pléistocène. ComptesRendus de l’Académie Des Sciences, 330, 161–166.
Michel Sezonlin is a population geneticist. His research aims tounderstand the factors that shaped cereal stemborer populationheterogeneity in Africa. Stéphane Dupas is a population geneticiststudying insect-parasitoid-microorganism coevolutionary dynamics.Bruno Le Rü is an entomologist whose main line of research is tounderstand plant-insect spatial dynamics in relation to wild hostplants use in agricultural systems. Philippe Le Gall is an entomo-logist working on African insect biogeography. Pascal Moyal is anentomologist studying the systematics, phylogeny and phylogeo-graphy of African noctuid stem borers of monocot plants. Paul-André Calatayud is a chemical ecologist whose main line ofresearch is understanding the biochemistry and genetic diversityof host plant choice and suitability for development of cerealstemborers. Isabelle Giffard is a chemist working on insectmolecular biology. Nathalie Faure is a molecular ecologistworking on insect population genetics and systematics. Jean-François Silvain is an insect systematician and evolutionarybiologist. His main line of research is to understand factors thatshaped insect diversity.