Phylloxera Pest Risk Analysis by grapegrowing region in ...
52
Phylloxera Pest Risk Analysis by grapegrowing region in South Australia 2010 Phylloxera and Grape Industry Board 15 February, 2010
Transcript of Phylloxera Pest Risk Analysis by grapegrowing region in ...
Phylloxera Pest Risk Analysis
by grapegrowing region
in South Australia
2010
Phylloxera and Grape Industry Board
15 February, 2010

P hy l l ox e r a and G r a pe I nd u st r y B o a r d o f S ou t h A u st r a l i a
F e b r u a r y 2 0 1 0 V e r s i o n 2 0 1 0 . 1 . 0 P a g e 2
Acknowledgements Report prepared by Sandy Hathaway on behalf of the PGIBSA. Many thanks to the industry reference group for their practical guidance and technical input:
Mark Gilbert (Davidson Viticulture and PGIBSA Board);
Ben Lacey (Lacey Vineyards, McLaren Vale)
Craig Markby (Henschke Wines, Adelaide Hills)
John Peet (Fosters Group, Clare Valley)
Kirsty Waller (Barossa Valley Estate and PGIBSA Board) Additional technical advice provided by Dr Kevin Powell, DPI Victoria, and Dr Peter Dry, Australian Wine Research Institute and PGIBSA Board. Their contribution to the project is gratefully acknowledged. It should be noted that the conclusions and opinions expressed in this report do not necessarily reflect theirs. Thanks also to Colin Hopkins, Jean Dennis, Amy Richards, Chris Rogers, Kevin Schulz, Lyall Schulz and Graeme Wellman for region-specific, operational and other background information. Original photo courtesy of Ginger Korosi, DPI Victoria (Rutherglen Centre). Photo shows major life stages of phylloxera on a match head. Disclaimer While every effort is made to ensure the accuracy and integrity of the information contained in this document, no responsibility is taken for any errors or omissions. The Phylloxera and Grape Industry Board of South Australia expressly disclaims any liability for the accuracy and sufficiency of the information, and in no circumstances shall it be held liable for the consequences of decisions, actions, assumptions and interpretations made by those who use the information contained within the report. © Copyright PGIBSA February 2010

P hy l l ox e r a and G r a pe I nd u st r y B o a r d o f S ou t h A u st r a l i a
F e b r u a r y 2 0 1 0 V e r s i o n 2 0 1 0 . 1 . 0 P a g e 3
Contents
List of tables ........................................................................................................ 4
Executive summary ............................................................................................. 5
Introduction ........................................................................................................ 7
Phylloxera pest risk analysis ............................................................................... 9
1. Basis for pest risk analysis .............................................................................................. 9
2. Regional risk analysis ................................................................................................... 15
2.1 Size of the region and number of registered growers ....................................................... 16
2.2 Proximity to an existing source of phylloxera ................................................................... 18
2.3 Environmental factors ..................................................................................................... 18
2.4 Movement of vineyard machinery and workers into region .............................................. 23
2.5 Visits by GLOs and other winery representatives .............................................................. 27
2.6 Vineyard management practices ..................................................................................... 29
2.7 New plantings ................................................................................................................. 30
2.8 Visits by tourists to the region (especially from interstate) ............................................... 31
2.9 Movement of grapes and grape products into region for processing ................................ 34
2.10 Level of awareness .......................................................................................................... 36
3. Summary of risk assessment ........................................................................................ 39
Summary and recommendations ...................................................................... 44
List of references ............................................................................................... 46
Appendix 1 ........................................................................................................ 47
Appendix 2 ........................................................................................................ 48

P hy l l ox e r a and G r a pe I nd u st r y B o a r d o f S ou t h A u st r a l i a
F e b r u a r y 2 0 1 0 V e r s i o n 2 0 1 0 . 1 . 0 P a g e 4
List of tables
1.1 The relative probability that a region has phylloxera based on its phylloxera classification (as described in the National Phylloxera Management Protocol) ....................................................... 9
1.2 The relative probability that a vector will spread phylloxera from one vineyard to another .............. 11
1.3a Physical / environmental characteristics ......................................................................................... 12
1.3b Risk vectors .................................................................................................................................... 13
1.3c Level of awareness ......................................................................................................................... 14
2.1 Total vineyard area and number of growers in South Australian grapegrowing regions ................... 16
2.2 Relative risk ratings of regions based on area/number of growers ................................................... 17
2.3 Relative risk ratings of regions based on proximity to an existing source of phylloxera. .................... 18
2.4 Regional statistics on selected environmental factors considered relevant to phylloxera survival. .... 19
2.5 Calculated percentage of vines on surface soils with high clay content. ........................................... 21
2.6 Regional risk ratings based on environmental factors...................................................................... 22
2.7a Number of respondents who operate machinery in SA – by region of operation ............................... 23
2.7b Number of contractors servicing multiple regions who service each of the listed regions ................. 24
2.8 Number of growers in each region who own vineyards in multiple regions in SA. ............................. 25
2.9 Relative risk ratings of regions based on vineyard contracting and multiple ownership. ................... 26
2.10 Relative risk ratings of regions based on number of multiple region purchasers in the region. .......... 28
2.11 Relative risk ratings of regions based on estimated amount of spraying and canopy manipulation. . 29
2.12 Relative risk ratings of regions based on amount of new planting between 2005 and 2008.............. 30
2.13 Number of cellar doors and visitors to regions. ............................................................................... 31
2.14 Major events held in South Australian grapegrowing regions .......................................................... 32
2.15 Relative risk ratings of regions based on visitor numbers to the region and to cellar doors............... 33
2.16 Amount of whole grapes brought into each region for processing from other regions and interstate34
2.17 Must and juice imports into SA between 2007 and 2009 ................................................................. 35
2.18 Relative risk ratings of regions based on imports of grapes and grape products for processing ........ 36
2.19 Information related to various indirect measures of awareness ....................................................... 37
2.20 Relative risk ratings of regions based on lack of awareness ............................................................. 38
3.1 Summary of risk ratings for all variables by region .......................................................................... 39
3.2 Overall regional risk assessments and summary risk profiles ........................................................... 40

P hy l l ox e r a and G r a pe I nd u st r y B o a r d o f S ou t h A u st r a l i a
F e b r u a r y 2 0 1 0 V e r s i o n 2 0 1 0 . 1 . 0 P a g e 5
Executive summary Aims and scope This Pest Risk Analysis (PRA) presents a comparison of the relative risk of a phylloxera infestation occurring in each grapegrowing region in South Australia. Its aim is to describe the risk profile for each region, and identify those regions comparatively most at risk of a phylloxera infestation. The PRA only considered the risk of establishment of an infestation, not ease of spread of that infestation within a vineyard or region. Establishment was defined as surviving to adulthood and producing eggs - thus starting a sustainable cycle that would inevitably spread within the vineyard. Method The pest risk analysis identified ten factors that are considered to be the most important contributors to the risk of an infestation of phylloxera. These were:
1. Size of the region and number of growers 2. Proximity to a source of phylloxera (detected or undetected) 3. Environmental factors (climate variables, soil types, resistant rootstocks) 4. Movement of machinery and vineyard workers into the region 5. Number of vineyard visitors (GLOs, winemakers and other winery representatives, consultants
etc) 6. Amount of certain vineyard management practices (spraying, canopy manipulation) requiring
entry into the vineyard during spring/summer 7. New plantings in the region since 2005 8. Number of tourists visiting the region – particularly wine tourists 9. Amount of processing of grapes and grape products 10. Level of active awareness of growers in the region
Each grapegrowing region was assessed against each risk factor and given a relative rating (very high, high, moderate, low or very low), comparing its risk against the other regions. Important note on methodology The risk assessments and ratings provided in the pest risk analysis have been derived from a combination of statistical information, survey results, industry knowledge, discussion and debate, logical argument, scientific evidence and informed guesses. It should be noted that the conclusions in this document are essentially speculative, as there is no way of proving that they or any of the underlying assumptions are correct. Results The results showed that the region with the highest relative risk overall was the Adelaide Hills – which received high or very high risk ratings for six of the ten risk factors and a rating of very high risk overall. It should be noted that this does not imply it is actually at high risk of an infestation – only that it is assessed to be at the highest risk of all SA grapegrowing regions. The results for all regions were:

P hy l l ox e r a and G r a pe I nd u st r y B o a r d o f S ou t h A u st r a l i a
F e b r u a r y 2 0 1 0 V e r s i o n 2 0 1 0 . 1 . 0 P a g e 6
Overall risk rating Region
Very high Adelaide Hills
High Coonawarra
Barossa Valley
McLaren Vale
Riverland
Moderate Padthaway
Wrattonbully
Eden Valley
Clare Valley Langhorne Creek
Low Currency Creek
Southern Fleurieu
Mount Benson
Robe
Adelaide Plains
Kangaroo Island
Very low Peninsulas
Southern Flinders Ranges
It is important to note that these are relative, not absolute ratings – ie they only compare a region’s risk against other regions. A high relative risk does not mean that the region is actually at a high risk of an outbreak (the report does not measure absolute risk). The results of the pest risk analysis will be used by the Phylloxera and Grape Industry Board in developing its strategic plan and allocating resources, as well as in communicating with regional groups, raising awareness and tailoring education programs and risk reduction initiatives.

P hy l l ox e r a and G r a pe I nd u st r y B o a r d o f S ou t h A u st r a l i a
F e b r u a r y 2 0 1 0 V e r s i o n 2 0 1 0 . 1 . 0 P a g e 7
Introduction In 2002, a pest risk analysis was undertaken on behalf of the Phylloxera and Grape Industry Board of SA (PGIBSA) by Scholefield Robinson Horticultural Services and Econsearch, to assess the relative probability of an infestation of phylloxera occurring in South Australia’s key viticultural regions and estimate the economic impact of a phylloxera outbreak in each region. As part of the Board’s strategic plan 2009 – 2014, it was agreed to revise the [2002] pest risk analysis for phylloxera for all South Australian grapegrowing regions to identify priority target regions. There have been significant changes in the industry in the seven years since the original report was published – including:
A near doubling of production since 2000 and three record vintages in 2004, 2005 and 2006
A swing into over-supply after at least 10 years of under-supply
Consolidation of large corporate grapegrowing and winemaking entities
Severe prolonged drought conditions and the introduction of water restrictions for irrigators
A dramatic slow-down in the rate of new planting and growth in the industry
New phylloxera outbreaks in Victoria
The upgrading of nearly the whole of NSW and parts of Victoria to Phylloxera Exclusion Zone status after extensive surveys
Aims and scope The aims of the 2010 pest risk analysis were to:
Undertake a new pest risk analysis, building on the information in the original document
Identify priority risk regions for allocation of Board resources
Provide a basis for regional associations to carry out more detailed individual analyses (if they should wish to)
Communicate risks to growers/industry to raise awareness and increase motivation to implement protocols
The revised pest risk analysis does not include an assessment of the economic impact of a phylloxera outbreak. It has been changed substantially from the original format; it has been expanded to include all South Australian recognised GI regions separately and the risk factors considered are largely different from those originally identified. Method The pest risk analysis identified ten factors that are considered to be the most important contributors to the risk of an infestation of phylloxera. These were:
1. Size of the region and number of growers 2. Proximity to a source of phylloxera (detected or undetected) 3. Environmental factors (climate variables, soil types, resistant rootstocks) 4. Movement of machinery and vineyard workers into the region 5. Number of vineyard visitors (GLOs, winemakers and other winery representatives, consultants
etc) 6. Amount of certain vineyard management practices (spraying, canopy manipulation) requiring
entry into the vineyard during spring/summer 7. New plantings in the region since 2005 8. Number of tourists visiting the region – particularly wine tourists 9. Amount of processing of grapes and grape products 10. Level of active awareness of growers in the region
P hy l l ox e r a and G r a pe I nd u st r y B o a r d o f S ou t h A u st r a l i a
F e b r u a r y 2 0 1 0 V e r s i o n 2 0 1 0 . 1 . 0 P a g e 8
Level of awareness was considered to act differently as a risk factor from the others. In the absence of other risk factors, it is unlikely that lack of awareness per se would lead to an infestation. However, if there is a significant risk of infestation due to one or more other risk factors, then lack of awareness is considered to act as a multiplier, increasing the risk of an infestation because growers are less likely to follow appropriate hygiene and vineyard protection protocols, or to be aware of or choose to comply with legislative requirements. Conversely, a high level of awareness among growers in a region may be expected to have a protective effect – increasing the likelihood that disinfestation and other protection strategies will be carried out to reduce the risk associated with the entry of a risk vector. The rationale for including each risk factor is described in table 1.3. Each grapegrowing region was assessed against each risk factor and given a relative rating (very high, high, moderate, low or very low), comparing its risk against the other regions. There were 17 recognised GI regions and one zone (Peninsulas) included in the study. In determining the overall risk rating, some risk factors were considered to be more important than others and therefore were given an increased weighting. Size received a weighting of 2.0 and proximity and vineyard management practices received weightings of 1.5. All other risk factors received a weighting of 1.0. Important note on methodology The risk assessments and ratings provided in the PRA have been derived from a combination of statistical information, survey results, industry knowledge, discussion and debate, logical argument, scientific evidence and informed guesses. It should be noted that the conclusions in this document are essentially speculative, as there is no way of proving that they or any of the underlying assumptions are correct.
P hy l l ox e r a and G r a pe I nd u st r y B o a r d o f S ou t h A u st r a l i a
F e b r u a r y 2 0 1 0 V e r s i o n 2 0 1 0 . 1 . 0 P a g e 9
Phylloxera pest risk analysis
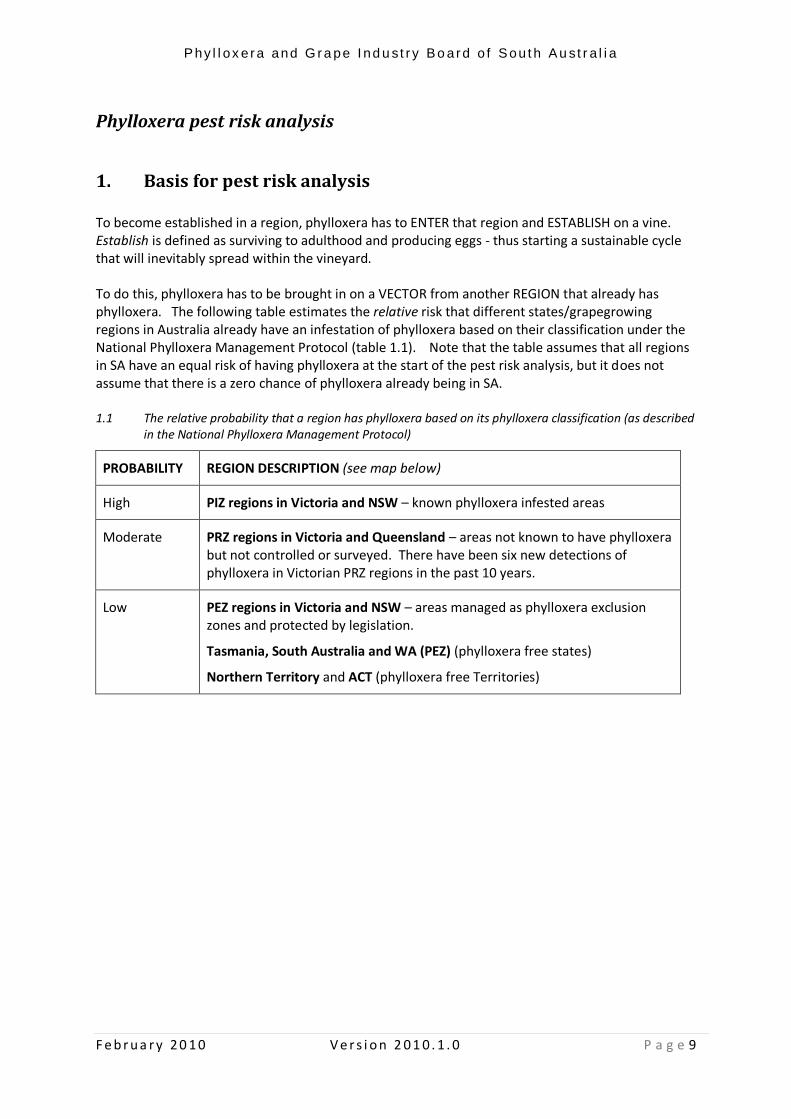
1. Basis for pest risk analysis To become established in a region, phylloxera has to ENTER that region and ESTABLISH on a vine. Establish is defined as surviving to adulthood and producing eggs - thus starting a sustainable cycle that will inevitably spread within the vineyard. To do this, phylloxera has to be brought in on a VECTOR from another REGION that already has phylloxera. The following table estimates the relative risk that different states/grapegrowing regions in Australia already have an infestation of phylloxera based on their classification under the National Phylloxera Management Protocol (table 1.1). Note that the table assumes that all regions in SA have an equal risk of having phylloxera at the start of the pest risk analysis, but it does not assume that there is a zero chance of phylloxera already being in SA. 1.1 The relative probability that a region has phylloxera based on its phylloxera classification (as described
in the National Phylloxera Management Protocol)
PROBABILITY REGION DESCRIPTION (see map below)
High PIZ regions in Victoria and NSW – known phylloxera infested areas
Moderate PRZ regions in Victoria and Queensland – areas not known to have phylloxera but not controlled or surveyed. There have been six new detections of phylloxera in Victorian PRZ regions in the past 10 years.
Low PEZ regions in Victoria and NSW – areas managed as phylloxera exclusion zones and protected by legislation.
Tasmania, South Australia and WA (PEZ) (phylloxera free states)
Northern Territory and ACT (phylloxera free Territories)

P hy l l ox e r a and G r a pe I nd u st r y B o a r d o f S ou t h A u st r a l i a
F e b r u a r y 2 0 1 0 V e r s i o n 2 0 1 0 . 1 . 0 P a g e 10

P hy l l ox e r a and G r a pe I nd u st r y B o a r d o f S ou t h A u st r a l i a
F e b r u a r y 2 0 1 0 V e r s i o n 2 0 1 0 . 1 . 0 P a g e 11
Table 1.2 describes the vectors that are recognised as being able to transfer phylloxera from one region to another if not disinfested and an assessment of their relative probability of causing a new infestation. 1.2 The relative probability that a vector will spread phylloxera from one vineyard to another
PROBABILITY VECTOR DESCRIPTION
Very high
Planting material – is directly planted into vineyard soil giving phylloxera the best chance of establishment. Also provides a food source for all life stages of the insect and can harbour crawlers over winter. Rootlings are higher risk than cuttings because they have actively growing roots, which are a food source for developing life-stages.
High Machine harvesters – have very close contact with the vine canopy when phylloxera is most active and provide places where the insects can remain protected for some time. May provide a food source but only if root fragments are captured in the machinery or there are leaf galls present. Move directly between vineyards.
Other vineyard equipment and machinery –generally lower risk than harvesters because of less contact with the canopy or soil and/or less ability to harbour insects in inaccessible places. Does travel directly between vineyards. Risk will depend on nature of machine and time of year it is in the vineyard.
Vineyard workers (including contract labour gangs) – work directly in the vineyard in close contact with the ground and canopy. Have the opportunity to pick up crawlers on clothing and footwear and transfer them to another vineyard. Risk varies to some extent depending on the season and type of work being carried out.
Moderate GLOs, winemakers and other vineyard visitors – move between vineyards and interact directly with the vines. May travel substantial distances between regions in a short space of time. Can transfer phylloxera on clothing and/or footwear but do not provide a food source for the insect. Relatively low numbers and higher awareness of biosecurity issues reduce the risk.
Tourists – are individually low risk because they do not generally spend a substantial amount of time in a vineyard and do not provide a food source for phylloxera, but large numbers of tourists mean a multiplier of an individually low risk. The recent outbreak in the Yarra Valley, a major tourist region, increases the risk because it is closer than other infested regions with a major tourism focus. Tourists are relatively less educated about phylloxera and their behaviour is difficult to control.
Whole grapes – are highly likely to pick up phylloxera insects when picked but do not provide a food source and are taken to a winery, not to another vineyard. Therefore the risk varies according to the proximity of the receiving winery to another vineyard and whether the winery disposes of grape stalks and stems directly onto vines.
Grape bins – may collect vineyard soil as well as grape residue. Empty bins may travel from the winery to vineyards in other regions and cover large distances.
P hy l l ox e r a and G r a pe I nd u st r y B o a r d o f S ou t h A u st r a l i a
F e b r u a r y 2 0 1 0 V e r s i o n 2 0 1 0 . 1 . 0 P a g e 12
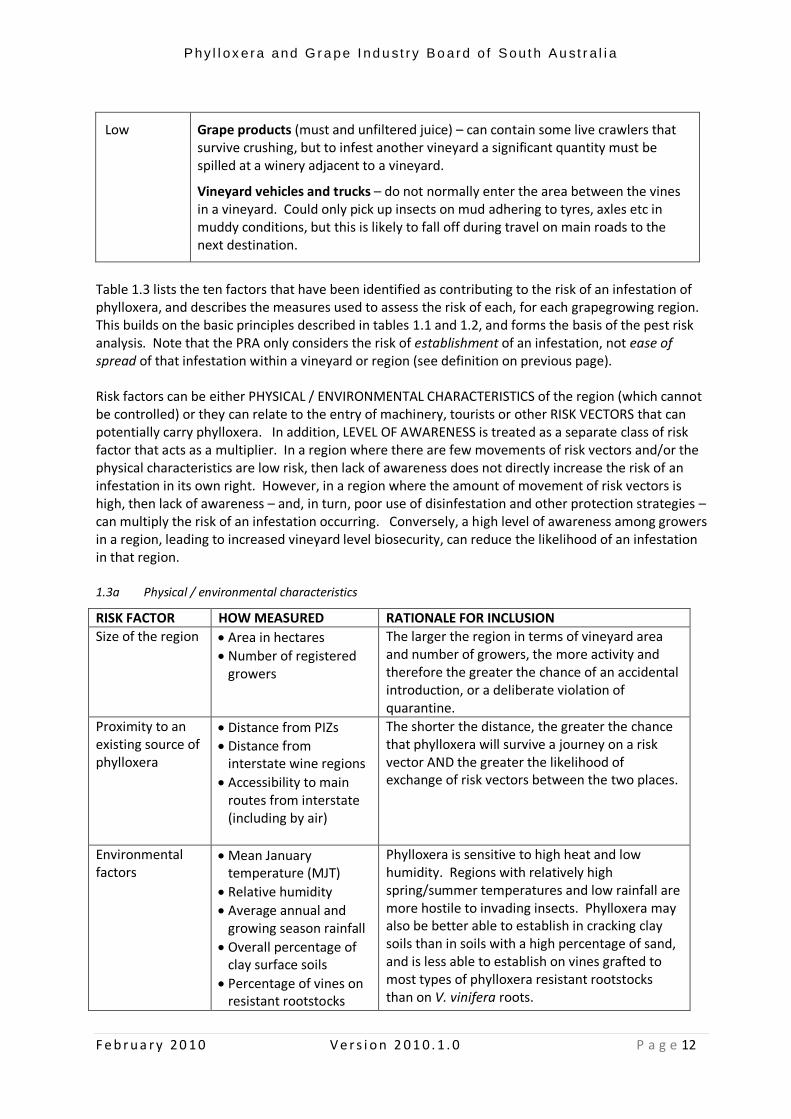
Low Grape products (must and unfiltered juice) – can contain some live crawlers that survive crushing, but to infest another vineyard a significant quantity must be spilled at a winery adjacent to a vineyard.
Vineyard vehicles and trucks – do not normally enter the area between the vines in a vineyard. Could only pick up insects on mud adhering to tyres, axles etc in muddy conditions, but this is likely to fall off during travel on main roads to the next destination.
Table 1.3 lists the ten factors that have been identified as contributing to the risk of an infestation of phylloxera, and describes the measures used to assess the risk of each, for each grapegrowing region. This builds on the basic principles described in tables 1.1 and 1.2, and forms the basis of the pest risk analysis. Note that the PRA only considers the risk of establishment of an infestation, not ease of spread of that infestation within a vineyard or region (see definition on previous page). Risk factors can be either PHYSICAL / ENVIRONMENTAL CHARACTERISTICS of the region (which cannot be controlled) or they can relate to the entry of machinery, tourists or other RISK VECTORS that can potentially carry phylloxera. In addition, LEVEL OF AWARENESS is treated as a separate class of risk factor that acts as a multiplier. In a region where there are few movements of risk vectors and/or the physical characteristics are low risk, then lack of awareness does not directly increase the risk of an infestation in its own right. However, in a region where the amount of movement of risk vectors is high, then lack of awareness – and, in turn, poor use of disinfestation and other protection strategies – can multiply the risk of an infestation occurring. Conversely, a high level of awareness among growers in a region, leading to increased vineyard level biosecurity, can reduce the likelihood of an infestation in that region. 1.3a Physical / environmental characteristics
RISK FACTOR HOW MEASURED RATIONALE FOR INCLUSION
Size of the region Area in hectares
Number of registered growers
The larger the region in terms of vineyard area and number of growers, the more activity and therefore the greater the chance of an accidental introduction, or a deliberate violation of quarantine.
Proximity to an existing source of phylloxera
Distance from PIZs
Distance from interstate wine regions
Accessibility to main routes from interstate (including by air)
The shorter the distance, the greater the chance that phylloxera will survive a journey on a risk vector AND the greater the likelihood of exchange of risk vectors between the two places.
Environmental factors
Mean January temperature (MJT)
Relative humidity
Average annual and growing season rainfall
Overall percentage of clay surface soils
Percentage of vines on resistant rootstocks
Phylloxera is sensitive to high heat and low humidity. Regions with relatively high spring/summer temperatures and low rainfall are more hostile to invading insects. Phylloxera may also be better able to establish in cracking clay soils than in soils with a high percentage of sand, and is less able to establish on vines grafted to most types of phylloxera resistant rootstocks than on V. vinifera roots.

P hy l l ox e r a and G r a pe I nd u st r y B o a r d o f S ou t h A u st r a l i a
F e b r u a r y 2 0 1 0 V e r s i o n 2 0 1 0 . 1 . 0 P a g e 13
1.3b Risk vectors
RISK FACTOR HOW MEASURED RATIONALE FOR INCLUSION
Vineyard machinery and vineyard workers
Results of contractor survey
Number of growers in region who also have vineyards in other regions
Machinery is a potential risk vector for phylloxera – particularly harvesters, slashers and other equipment used in spring and summer on canopy manipulation or soil disturbing activities. Vineyard workers – including contract labour gangs – work directly in the vineyard and have the opportunity to pick up crawlers on clothing and footwear. Machinery and vineyard workers employed by vineyard contractors and labour hire companies, or by growers who own vineyards in multiple regions, are likely to move between regions and hence have the potential to spread phylloxera more than machinery/employees dedicated to a particular property.
GLOs and other vineyard visitors
Results of research into GLO work patterns
Number of wineries who purchase from region as well as from other regions
GLOs (also winemakers, technical officers and other winery representatives) are a risk because they enter vineyards directly to examine the vines, and often travel large distances and visit several vineyards in a number of regions within a one week timeframe.
Vineyard management practices
Estimated relative amount of canopy manipulation and spraying in region
Some vineyard management practices require more machinery or workers in the vineyard, which increases the potential for an introduction. NB Hand-harvesting has been omitted because the risk of machine harvesting is likely to be as high as hand-harvesting although for different reasons.
Amount of new plantings in the region in the past few years
New plantings registered with the Board between 2005 and 2008.
A higher level of new plantings increases the risk of an introduction of phylloxera on planting material or on vineyard establishment equipment.
Visits by tourists to the region (especially from interstate)
Number of cellar doors in region
Estimated tourism numbers in regions
Number of major events in region
Tourists present a small risk of spreading phylloxera on clothing or footwear if they walk into or near a vineyard. Highest risk tourists are those that have come directly from in or near an infested region. Tourists staying overnight in a region are more likely to walk into vineyards.
Movement of grapes and grape products into the region for processing
Tonnes of grapes processed in region from interstate PEZs and from other SA regions
Litres of must/juice imported into region from interstate PIZs and PRZs
Loads of whole grapes can contain phylloxera. Because these are taken to a winery, not a vineyard, this is a lower risk than machinery but the risk is higher if the winery is adjacent to a vineyard and/or if the winery deposits its grape stems and stalks on the vines as mulch. Grape products such as must and juice can also contain phylloxera crawlers although in much lower numbers than whole grapes. Because the intrinsic risk with grape products is much lower than with whole grapes, the risk associated with must/juice from PEZs (including regions within SA) is considered to be negligible.

P hy l l ox e r a and G r a pe I nd u st r y B o a r d o f S ou t h A u st r a l i a
F e b r u a r y 2 0 1 0 V e r s i o n 2 0 1 0 . 1 . 0 P a g e 14
1.3c Level of awareness
RISK FACTOR HOW MEASURED RATIONALE FOR INCLUSION
Level of active awareness of growers in the region
PGIBSA surveillance activity in region
Use of protocols (as measured by PGIBSA grower survey)
Presence of active regional/technical committees
Attendance at phylloxera workshops
PGIBSA annual grower meetings held in region.
The higher the level of awareness, the more likely it is that growers will take action to protect their vineyards through use of protocols etc. and will follow quarantine regulations. This risk factor is considered to interact with the other risk factors - ie if other risk factors are present then a low level of awareness compounds the risk of an infestation, and conversely, a high level of awareness can have a protective effect even where risk factors are present because growers are more likely to take measures to protect their properties - eg disinfesting risk products or preventing entry to their vineyard.
P hy l l ox e r a and G r a pe I nd u st r y B o a r d o f S ou t h A u st r a l i a
F e b r u a r y 2 0 1 0 V e r s i o n 2 0 1 0 . 1 . 0 P a g e 15
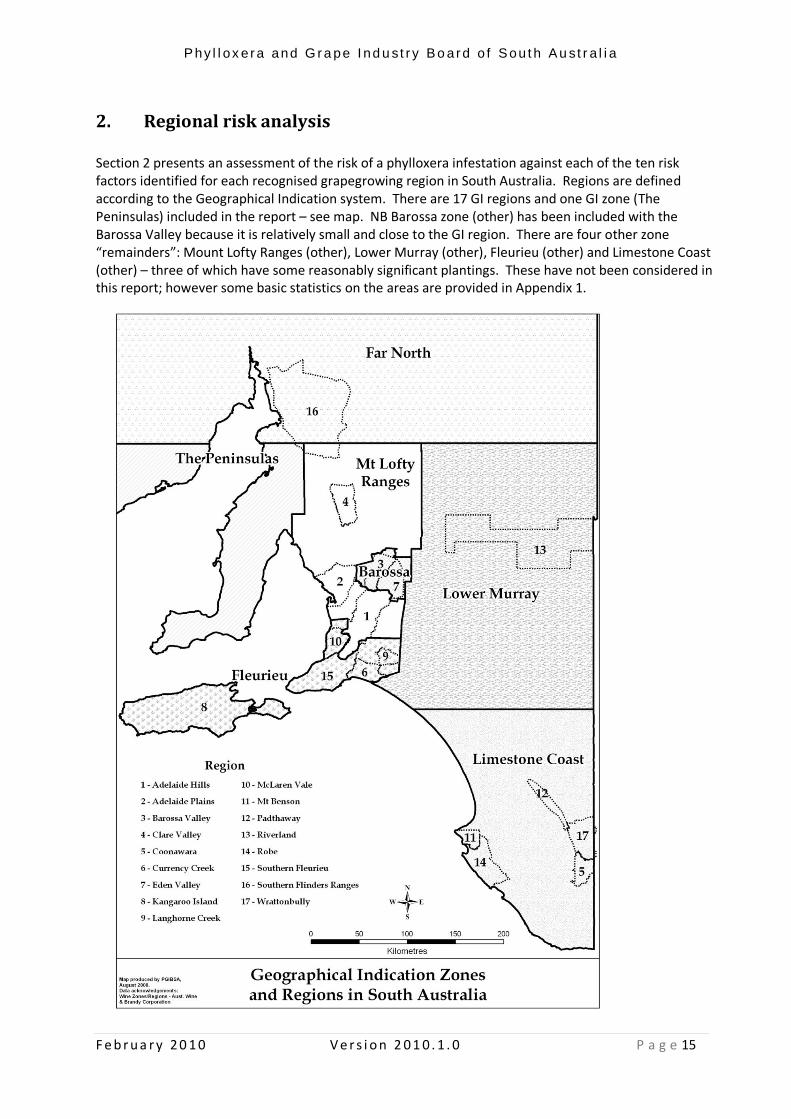
2. Regional risk analysis Section 2 presents an assessment of the risk of a phylloxera infestation against each of the ten risk factors identified for each recognised grapegrowing region in South Australia. Regions are defined according to the Geographical Indication system. There are 17 GI regions and one GI zone (The Peninsulas) included in the report – see map. NB Barossa zone (other) has been included with the Barossa Valley because it is relatively small and close to the GI region. There are four other zone “remainders”: Mount Lofty Ranges (other), Lower Murray (other), Fleurieu (other) and Limestone Coast (other) – three of which have some reasonably significant plantings. These have not been considered in this report; however some basic statistics on the areas are provided in Appendix 1.

P hy l l ox e r a and G r a pe I nd u st r y B o a r d o f S ou t h A u st r a l i a
F e b r u a r y 2 0 1 0 V e r s i o n 2 0 1 0 . 1 . 0 P a g e 16
2.1 Size of the region and number of registered growers
The size of the region and number of registered growers is considered to be a major risk factor. The larger the vineyard area, the higher the likely number of movements of risk vectors such as machinery, contractors, employees, vineyard visitors and planting material. The number of growers in a region is also likely to correlate with amount of activity in terms of movement of risk vectors, while a higher number of growers compared with the total area (ie smaller average vineyard size) may also indicate a greater risk because smaller properties may on average have fewer resources for training, less experience with phylloxera and more absentee and non-full-time grower ownership. Table 2.1 shows the total vineyard area in hectares and the number of grapegrowers in each region. This information is taken from the South Australian WInegrape Utilisation and Pricing Survey 2009. 2.1 Total vineyard area and number of growers in South Australian grapegrowing regions
Region Vineyard area (hectares)
Number of registered growers
Rank by number of
growers
% growers with
<10hectares
Riverland 22,156 1242 1 60%
Barossa Valley 11,357 617 2 56%
McLaren Vale 7,390 522 3 67%
Langhorne Creek 6,214 102 8 21%
Coonawarra 5,734 133 7 41%
Clare Valley 5,687 280 5 65%
Padthaway 4,151 30 12 7%
Adelaide Hills 4,020 315 4 65%
Wrattonbully 2,675 56 10 20%
Eden Valley 2,269 138 6 64%
Currency Creek 950 30 12 40%
Adelaide Plains 744 68 9 75%
Robe 741 11 17 10%
Mount Benson 553 19 15 32%
Southern Fleurieu 550 53 11 70%
Southern Flinders Ranges 166 16 16 63%
Kangaroo Island 145 22 14 86%
The Peninsulas 34 6 18 67%

P hy l l ox e r a and G r a pe I nd u st r y B o a r d o f S ou t h A u st r a l i a
F e b r u a r y 2 0 1 0 V e r s i o n 2 0 1 0 . 1 . 0 P a g e 17
Based on the above information about the size and number of growers in the regions, the following table ranks them according to relative risk based only on a combination of total vineyard area and number of growers. 2.2 Relative risk ratings of regions based on area/number of growers
Relative risk Region Rationale
Very high Riverland Twice the area and twice the number of growers compared with the next largest region.
High Barossa Valley
McLaren Vale
Clare Valley
Adelaide Hills
These regions all have a significant area and number of growers.
Moderate Coonawarra
Langhorne Creek
Padthaway
Wrattonbully
Eden Valley
These regions have less than half the area and/or half the number of growers of the group above.
Low Currency Creek
Southern Fleurieu
Adelaide Plains
Robe
Mount Benson
These regions have less than half the area and/or half the number of growers of the group above.
Very low Southern Flinders Ranges
Kangaroo Island
The Peninsulas
These regions have very low numbers of growers and relatively low vineyard area (less than half that of the next group).
P hy l l ox e r a and G r a pe I nd u st r y B o a r d o f S ou t h A u st r a l i a
F e b r u a r y 2 0 1 0 V e r s i o n 2 0 1 0 . 1 . 0 P a g e 18
2.2 Proximity to an existing source of phylloxera
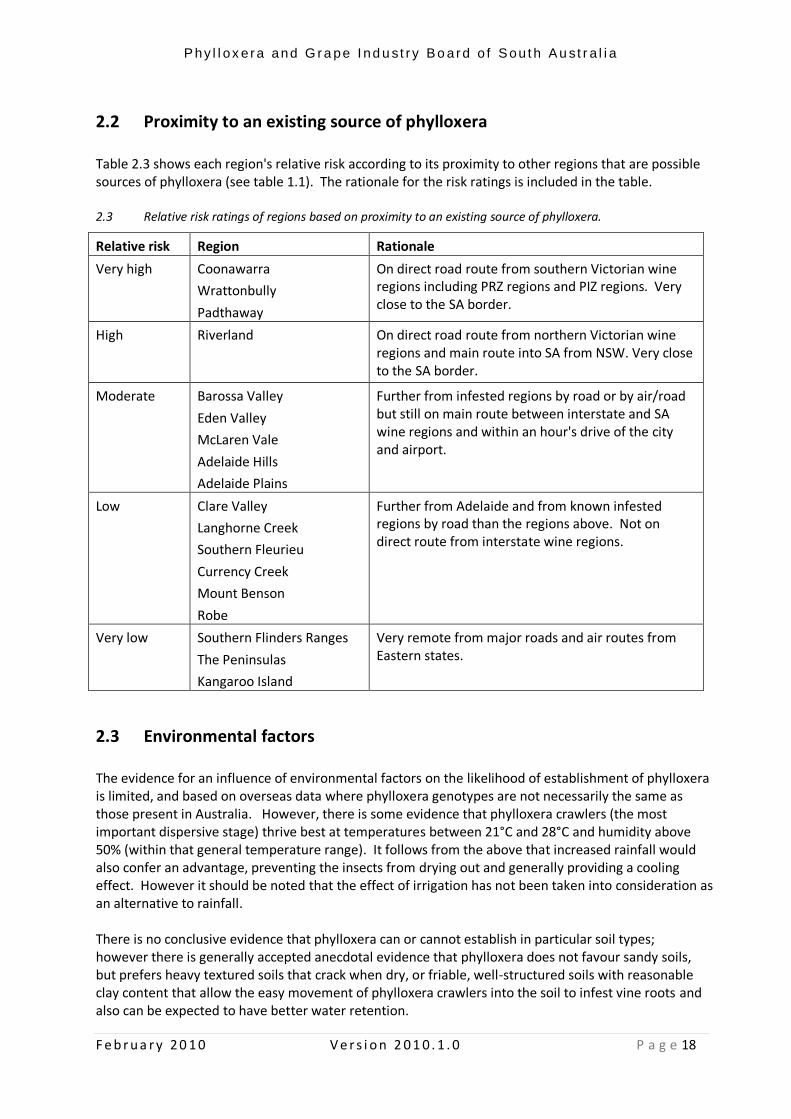
Table 2.3 shows each region's relative risk according to its proximity to other regions that are possible sources of phylloxera (see table 1.1). The rationale for the risk ratings is included in the table. 2.3 Relative risk ratings of regions based on proximity to an existing source of phylloxera.
Relative risk Region Rationale
Very high Coonawarra
Wrattonbully
Padthaway
On direct road route from southern Victorian wine regions including PRZ regions and PIZ regions. Very close to the SA border.
High Riverland
On direct road route from northern Victorian wine regions and main route into SA from NSW. Very close to the SA border.
Moderate Barossa Valley
Eden Valley
McLaren Vale
Adelaide Hills
Adelaide Plains
Further from infested regions by road or by air/road but still on main route between interstate and SA wine regions and within an hour's drive of the city and airport.
Low Clare Valley
Langhorne Creek
Southern Fleurieu
Currency Creek
Mount Benson
Robe
Further from Adelaide and from known infested regions by road than the regions above. Not on direct route from interstate wine regions.
Very low Southern Flinders Ranges
The Peninsulas
Kangaroo Island
Very remote from major roads and air routes from Eastern states.
2.3 Environmental factors The evidence for an influence of environmental factors on the likelihood of establishment of phylloxera is limited, and based on overseas data where phylloxera genotypes are not necessarily the same as those present in Australia. However, there is some evidence that phylloxera crawlers (the most important dispersive stage) thrive best at temperatures between 21°C and 28°C and humidity above 50% (within that general temperature range). It follows from the above that increased rainfall would also confer an advantage, preventing the insects from drying out and generally providing a cooling effect. However it should be noted that the effect of irrigation has not been taken into consideration as an alternative to rainfall. There is no conclusive evidence that phylloxera can or cannot establish in particular soil types; however there is generally accepted anecdotal evidence that phylloxera does not favour sandy soils, but prefers heavy textured soils that crack when dry, or friable, well-structured soils with reasonable clay content that allow the easy movement of phylloxera crawlers into the soil to infest vine roots and also can be expected to have better water retention.
P hy l l ox e r a and G r a pe I nd u st r y B o a r d o f S ou t h A u st r a l i a
F e b r u a r y 2 0 1 0 V e r s i o n 2 0 1 0 . 1 . 0 P a g e 19
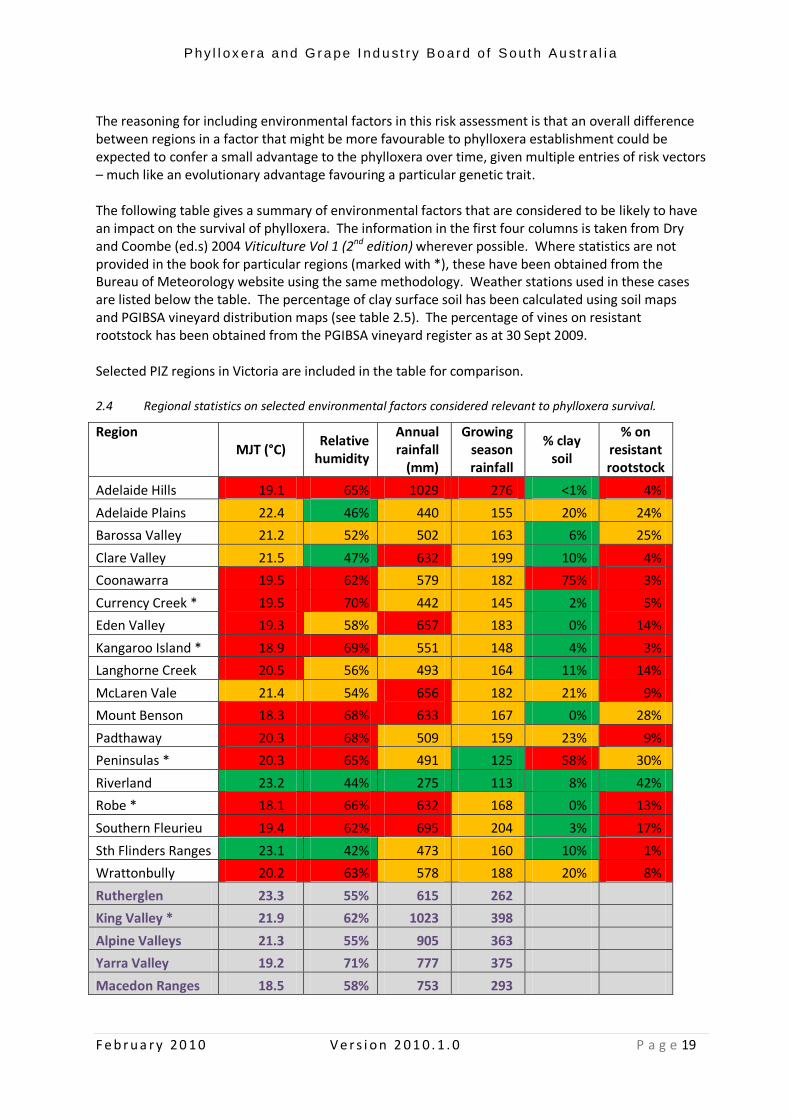
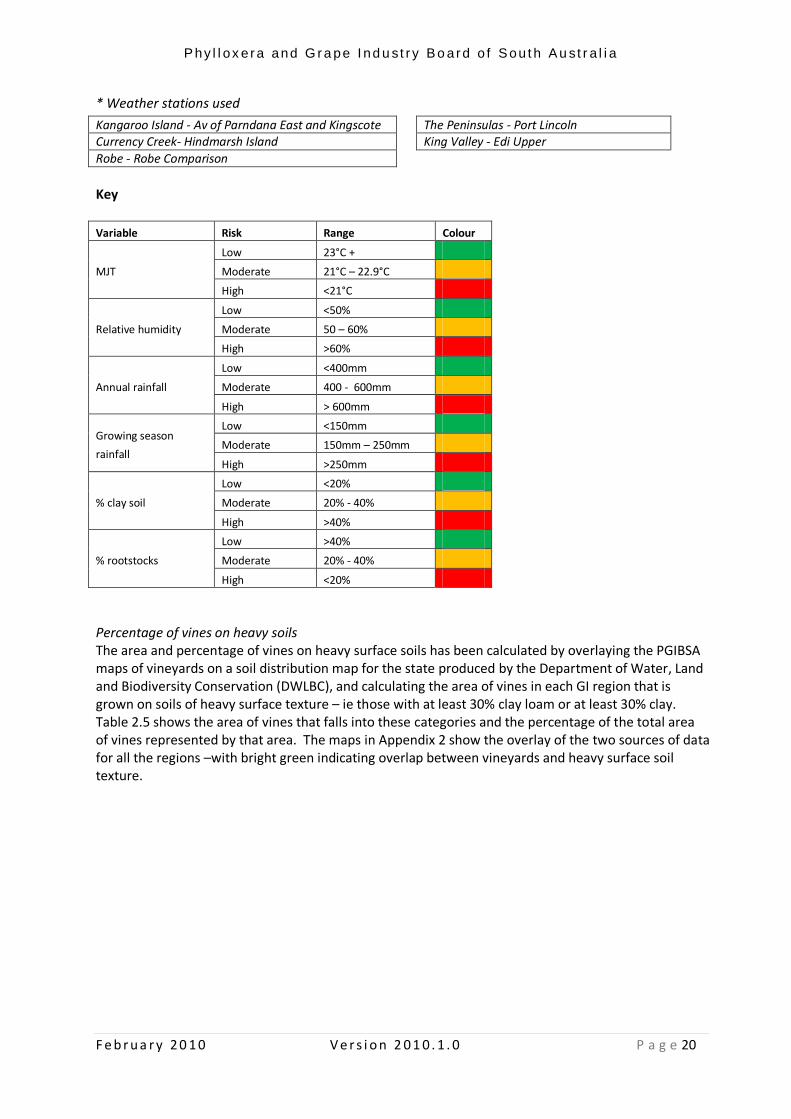
The reasoning for including environmental factors in this risk assessment is that an overall difference between regions in a factor that might be more favourable to phylloxera establishment could be expected to confer a small advantage to the phylloxera over time, given multiple entries of risk vectors – much like an evolutionary advantage favouring a particular genetic trait. The following table gives a summary of environmental factors that are considered to be likely to have an impact on the survival of phylloxera. The information in the first four columns is taken from Dry and Coombe (ed.s) 2004 Viticulture Vol 1 (2nd edition) wherever possible. Where statistics are not provided in the book for particular regions (marked with *), these have been obtained from the Bureau of Meteorology website using the same methodology. Weather stations used in these cases are listed below the table. The percentage of clay surface soil has been calculated using soil maps and PGIBSA vineyard distribution maps (see table 2.5). The percentage of vines on resistant rootstock has been obtained from the PGIBSA vineyard register as at 30 Sept 2009. Selected PIZ regions in Victoria are included in the table for comparison. 2.4 Regional statistics on selected environmental factors considered relevant to phylloxera survival.
Region MJT (°C)
Relative humidity
Annual rainfall
(mm)
Growing season rainfall
% clay soil
% on resistant rootstock
Adelaide Hills 19.1 65% 1029 276 <1% 4%
Adelaide Plains 22.4 46% 440 155 20% 24%
Barossa Valley 21.2 52% 502 163 6% 25%
Clare Valley 21.5 47% 632 199 10% 4%
Coonawarra 19.5 62% 579 182 75% 3%
Currency Creek * 19.5 70% 442 145 2% 5%
Eden Valley 19.3 58% 657 183 0% 14%
Kangaroo Island * 18.9 69% 551 148 4% 3%
Langhorne Creek 20.5 56% 493 164 11% 14%
McLaren Vale 21.4 54% 656 182 21% 9%
Mount Benson 18.3 68% 633 167 0% 28%
Padthaway 20.3 68% 509 159 23% 9%
Peninsulas * 20.3 65% 491 125 58% 30%
Riverland 23.2 44% 275 113 8% 42%
Robe * 18.1 66% 632 168 0% 13%
Southern Fleurieu 19.4 62% 695 204 3% 17%
Sth Flinders Ranges 23.1 42% 473 160 10% 1%
Wrattonbully 20.2 63% 578 188 20% 8%
Rutherglen 23.3 55% 615 262
King Valley * 21.9 62% 1023 398
Alpine Valleys 21.3 55% 905 363
Yarra Valley 19.2 71% 777 375
Macedon Ranges 18.5 58% 753 293
P hy l l ox e r a and G r a pe I nd u st r y B o a r d o f S ou t h A u st r a l i a
F e b r u a r y 2 0 1 0 V e r s i o n 2 0 1 0 . 1 . 0 P a g e 20
* Weather stations used
Kangaroo Island - Av of Parndana East and Kingscote The Peninsulas - Port Lincoln Currency Creek- Hindmarsh Island King Valley - Edi Upper
Robe - Robe Comparison
Key
Variable Risk Range Colour
MJT
Low 23°C +
Moderate 21°C – 22.9°C
High <21°C
Relative humidity
Low <50%
Moderate 50 – 60%
High >60%
Annual rainfall
Low <400mm
Moderate 400 - 600mm
High > 600mm
Growing season
rainfall
Low <150mm
Moderate 150mm – 250mm
High >250mm
% clay soil
Low <20%
Moderate 20% - 40%
High >40%
% rootstocks
Low >40%
Moderate 20% - 40%
High <20%
Percentage of vines on heavy soils The area and percentage of vines on heavy surface soils has been calculated by overlaying the PGIBSA maps of vineyards on a soil distribution map for the state produced by the Department of Water, Land and Biodiversity Conservation (DWLBC), and calculating the area of vines in each GI region that is grown on soils of heavy surface texture – ie those with at least 30% clay loam or at least 30% clay. Table 2.5 shows the area of vines that falls into these categories and the percentage of the total area of vines represented by that area. The maps in Appendix 2 show the overlay of the two sources of data for all the regions –with bright green indicating overlap between vineyards and heavy surface soil texture.
P hy l l ox e r a and G r a pe I nd u st r y B o a r d o f S ou t h A u st r a l i a
F e b r u a r y 2 0 1 0 V e r s i o n 2 0 1 0 . 1 . 0 P a g e 21
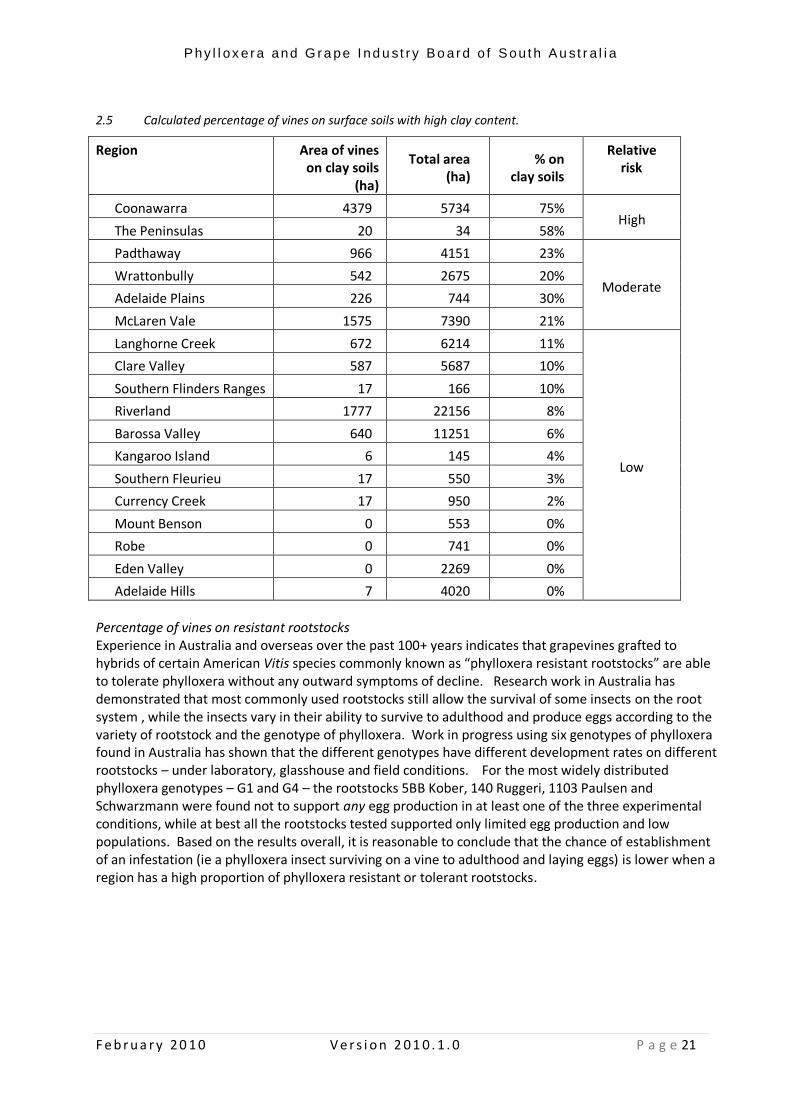
2.5 Calculated percentage of vines on surface soils with high clay content.
Region Area of vines on clay soils
(ha)
Total area (ha)
% on clay soils
Relative risk
Coonawarra 4379 5734 75% High
The Peninsulas 20 34 58%
Padthaway 966 4151 23%
Moderate Wrattonbully 542 2675 20%
Adelaide Plains 226 744 30%
McLaren Vale 1575 7390 21%
Langhorne Creek 672 6214 11%
Low
Clare Valley 587 5687 10%
Southern Flinders Ranges 17 166 10%
Riverland 1777 22156 8%
Barossa Valley 640 11251 6%
Kangaroo Island 6 145 4%
Southern Fleurieu 17 550 3%
Currency Creek 17 950 2%
Mount Benson 0 553 0%
Robe 0 741 0%
Eden Valley 0 2269 0%
Adelaide Hills 7 4020 0%
Percentage of vines on resistant rootstocks Experience in Australia and overseas over the past 100+ years indicates that grapevines grafted to hybrids of certain American Vitis species commonly known as “phylloxera resistant rootstocks” are able to tolerate phylloxera without any outward symptoms of decline. Research work in Australia has demonstrated that most commonly used rootstocks still allow the survival of some insects on the root system , while the insects vary in their ability to survive to adulthood and produce eggs according to the variety of rootstock and the genotype of phylloxera. Work in progress using six genotypes of phylloxera found in Australia has shown that the different genotypes have different development rates on different rootstocks – under laboratory, glasshouse and field conditions. For the most widely distributed phylloxera genotypes – G1 and G4 – the rootstocks 5BB Kober, 140 Ruggeri, 1103 Paulsen and Schwarzmann were found not to support any egg production in at least one of the three experimental conditions, while at best all the rootstocks tested supported only limited egg production and low populations. Based on the results overall, it is reasonable to conclude that the chance of establishment of an infestation (ie a phylloxera insect surviving on a vine to adulthood and laying eggs) is lower when a region has a high proportion of phylloxera resistant or tolerant rootstocks.
P hy l l ox e r a and G r a pe I nd u st r y B o a r d o f S ou t h A u st r a l i a
F e b r u a r y 2 0 1 0 V e r s i o n 2 0 1 0 . 1 . 0 P a g e 22
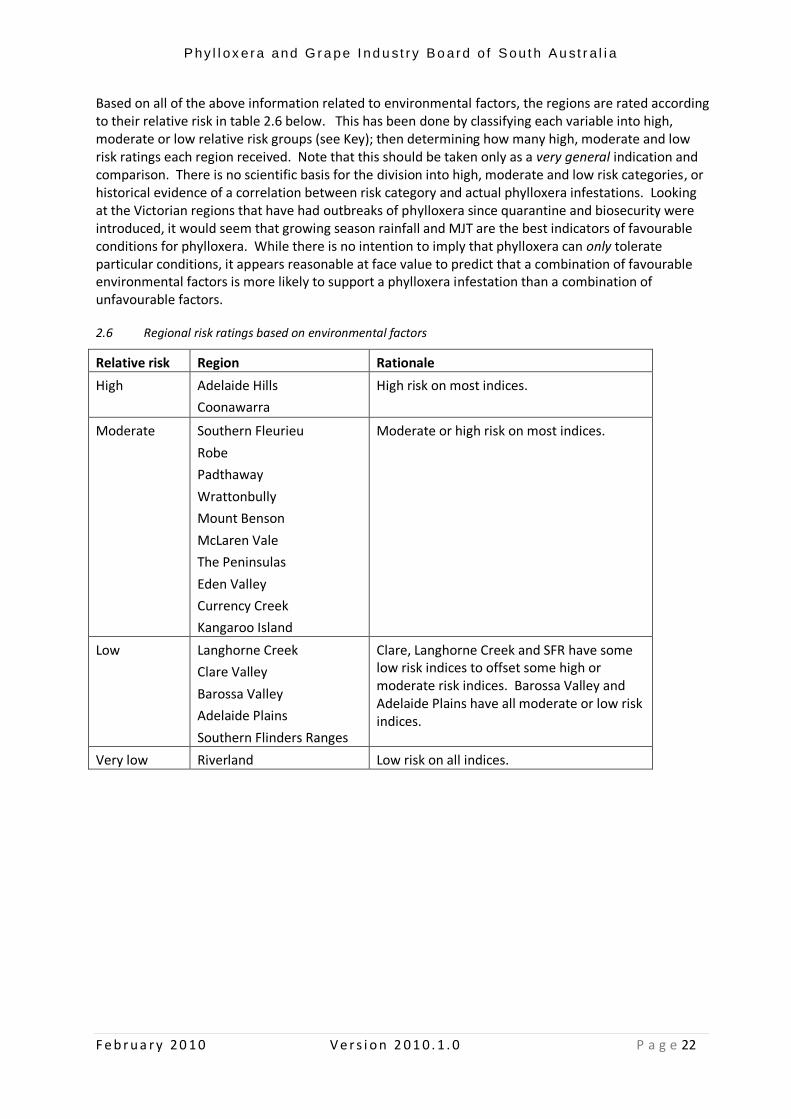
Based on all of the above information related to environmental factors, the regions are rated according to their relative risk in table 2.6 below. This has been done by classifying each variable into high, moderate or low relative risk groups (see Key); then determining how many high, moderate and low risk ratings each region received. Note that this should be taken only as a very general indication and comparison. There is no scientific basis for the division into high, moderate and low risk categories, or historical evidence of a correlation between risk category and actual phylloxera infestations. Looking at the Victorian regions that have had outbreaks of phylloxera since quarantine and biosecurity were introduced, it would seem that growing season rainfall and MJT are the best indicators of favourable conditions for phylloxera. While there is no intention to imply that phylloxera can only tolerate particular conditions, it appears reasonable at face value to predict that a combination of favourable environmental factors is more likely to support a phylloxera infestation than a combination of unfavourable factors. 2.6 Regional risk ratings based on environmental factors
Relative risk Region Rationale
High Adelaide Hills
Coonawarra
High risk on most indices.
Moderate Southern Fleurieu
Robe
Padthaway
Wrattonbully
Mount Benson
McLaren Vale
The Peninsulas
Eden Valley
Currency Creek
Kangaroo Island
Moderate or high risk on most indices.
Low Langhorne Creek
Clare Valley
Barossa Valley
Adelaide Plains
Southern Flinders Ranges
Clare, Langhorne Creek and SFR have some low risk indices to offset some high or moderate risk indices. Barossa Valley and Adelaide Plains have all moderate or low risk indices.
Very low Riverland Low risk on all indices.

P hy l l ox e r a and G r a pe I nd u st r y B o a r d o f S ou t h A u st r a l i a
F e b r u a r y 2 0 1 0 V e r s i o n 2 0 1 0 . 1 . 0 P a g e 23
2.4 Movement of vineyard machinery and workers into region
Movement of machinery Vineyard machinery potentially has a high risk of spreading phylloxera – assuming it is not disinfested and assuming it has previously been in contact with an infested vineyard. This is because the machinery (by definition) works in vineyards and is directly in contact with the soil and grapevines. In practice, the risk varies according to the type of work being done, the nature of the machine (how easy it is for insects or contaminated leaf or soil material to become lodged in it and how hard it is to clean) and the time of year that it is in the vineyard. During winter, when phylloxera insects are dormant, there are no crawlers above ground and the only means of transfer would be via root material containing hibernating crawlers. For an infestation to occur, the machinery must previously (and recently – except if the insects are overwintering) been in contact with an infested vineyard. The regions at highest risk of being infested are PIZs and PRZs in Victoria, Queensland and New South Wales. Any machinery entering South Australia from these other states must be cleaned, while machinery from an interstate PRZ or PIZ must be disinfested as well. Distance reduces the risk, as this increases the time before the machine enters a South Australian vineyard, thus reducing the chance of an insect surviving the journey. Therefore the most probable way that a machine could cause a phylloxera infestation in a South Australian region is if it comes in illegally from a PRZ or PIZ region without any disinfestation, or comes from another PEZ including a South Australian region and is not fully clean. However, it is normal practice to clean machinery between jobs even within regions, because this improves the operation of the machinery, and awareness of other problems such as unwanted weed seeds means that growers are likely to require contractor machinery to be clean before entering their property, which reduces the risk of crawlers being present on the machinery. A survey of South Australian vineyard contractors was conducted as part of this risk assessment. Over 100 surveys were distributed and 39 replies were received – including: 20 machinery contractors, six machinery and labour contractors; five labour contractors, two vineyard consultants and six transport or non-viticultural contractors. The list of contractors was not comprehensive and coverage was not even across regions. However, indications are that the largest contractors in most regions have been included, and the results are considered to be broadly indicative of machinery contracting practices. The following tables give a summary of results obtained from the survey. 2.7a Number of respondents who operate machinery in SA – by region of operation
Region of operation Number of respondents
Riverland only 5
Coonawarra or Coonawarra/Wrattonbully only 4
Barossa Valley or Barossa/Eden Valley only 3
McLaren Vale only 2
Langhorne Creek only 1
Adelaide Hills only 1
Padthaway only 1
Multiple regions in SA 8
Multiple regions including interstate 1
TOTAL 26

P hy l l ox e r a and G r a pe I nd u st r y B o a r d o f S ou t h A u st r a l i a
F e b r u a r y 2 0 1 0 V e r s i o n 2 0 1 0 . 1 . 0 P a g e 24
2.7b Number of contractors servicing multiple regions who service each of the listed regions
Regions serviced by multiple region contractors
Number of respondents
Adelaide Hills 7
Langhorne Creek 6
Limestone Coast 4
McLaren Vale 4
Barossa /Eden Valley 3
Clare 2
Riverland 2
Adelaide Plains 1
Fleurieu Peninsula 1
Southern Flinders Ranges 1 All contractors who serviced more than one region reported that they move their machinery between regions. Also all but one of the contractors who provide labour as well as machinery contracting serviced multiple regions. They were not asked about disinfestation practices. These results are not conclusive but suggest that: - Most contractors operate in a single region - The vast majority do not work in interstate regions - Those who service multiple regions move their machinery between regions It should be noted that only one contractor serviced interstate regions. Legal movement of machinery from interstate is very low risk, because of the disinfestation requirements that are in place under state regulations. Movement of vineyard workers Vineyard workers represent a moderate risk overall of spreading phylloxera. There are no regulations governing the movement of vineyard workers between regions; they work in direct contact with the vines and have the potential to pick up phylloxera insects on their clothing and footwear, particularly in spring/ summer. A worker moving from one region to another within up to a week in the same clothing/ footwear could transfer an insect to a vine in the second region (a crawler can live for up to a week without a food source in ideal temperature/humidity conditions). Casual workers employed by labour hire companies or vineyard contracting businesses represent the greatest risk as they are most likely to move between regions within a short space of time on a regular basis and are not likely to change or clean their footwear between jobs. Those who are not employed full-time in viticulture and those with non-English-speaking backgrounds may have very little knowledge of vineyard biosecurity issues and therefore represent a greater risk. The survey of contractors referred to above included labour hire contractors. As stated previously, the list of contractors was not comprehensive and coverage was not even across regions. Responses were received from 11 companies who reported doing labour contracting. Of those 11, five worked in single regions and six worked in multiple regions. Five of those six also provide machinery therefore are included in table 2.7b above.
P hy l l ox e r a and G r a pe I nd u st r y B o a r d o f S ou t h A u st r a l i a
F e b r u a r y 2 0 1 0 V e r s i o n 2 0 1 0 . 1 . 0 P a g e 25
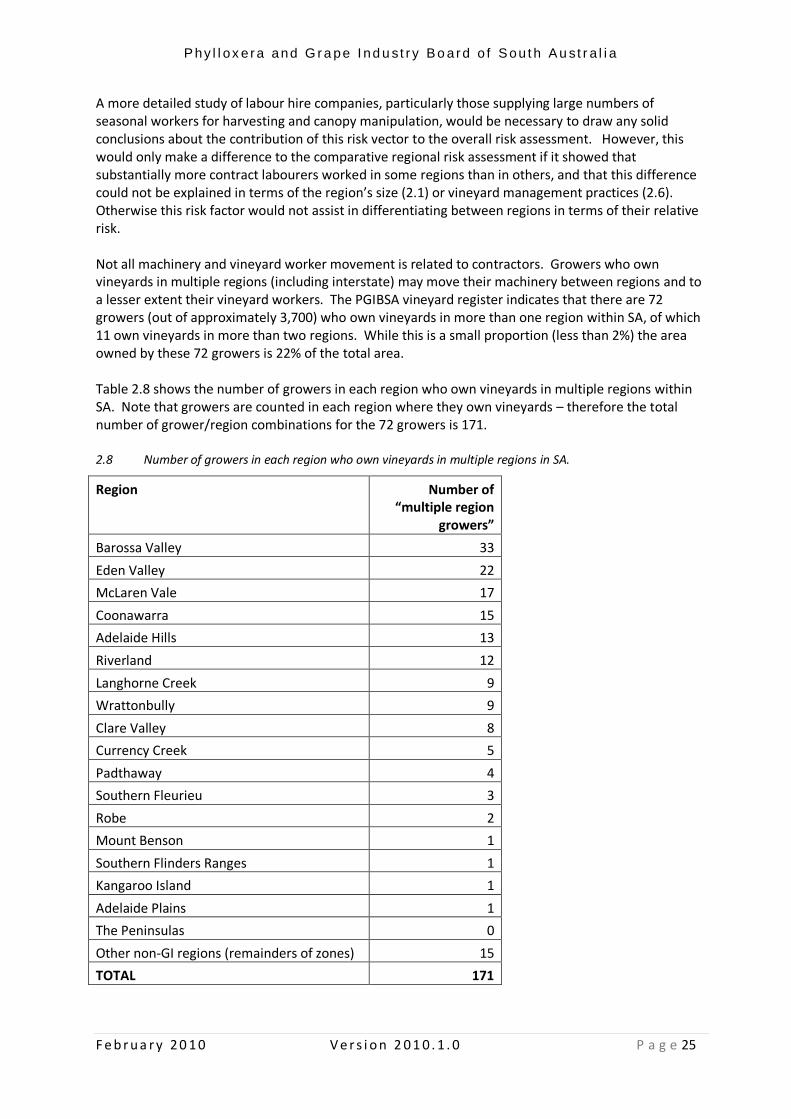
A more detailed study of labour hire companies, particularly those supplying large numbers of seasonal workers for harvesting and canopy manipulation, would be necessary to draw any solid conclusions about the contribution of this risk vector to the overall risk assessment. However, this would only make a difference to the comparative regional risk assessment if it showed that substantially more contract labourers worked in some regions than in others, and that this difference could not be explained in terms of the region’s size (2.1) or vineyard management practices (2.6). Otherwise this risk factor would not assist in differentiating between regions in terms of their relative risk. Not all machinery and vineyard worker movement is related to contractors. Growers who own vineyards in multiple regions (including interstate) may move their machinery between regions and to a lesser extent their vineyard workers. The PGIBSA vineyard register indicates that there are 72 growers (out of approximately 3,700) who own vineyards in more than one region within SA, of which 11 own vineyards in more than two regions. While this is a small proportion (less than 2%) the area owned by these 72 growers is 22% of the total area. Table 2.8 shows the number of growers in each region who own vineyards in multiple regions within SA. Note that growers are counted in each region where they own vineyards – therefore the total number of grower/region combinations for the 72 growers is 171. 2.8 Number of growers in each region who own vineyards in multiple regions in SA.
Region Number of “multiple region
growers”
Barossa Valley 33
Eden Valley 22
McLaren Vale 17
Coonawarra 15
Adelaide Hills 13
Riverland 12
Langhorne Creek 9
Wrattonbully 9
Clare Valley 8
Currency Creek 5
Padthaway 4
Southern Fleurieu 3
Robe 2
Mount Benson 1
Southern Flinders Ranges 1
Kangaroo Island 1
Adelaide Plains 1
The Peninsulas 0
Other non-GI regions (remainders of zones) 15
TOTAL 171

P hy l l ox e r a and G r a pe I nd u st r y B o a r d o f S ou t h A u st r a l i a
F e b r u a r y 2 0 1 0 V e r s i o n 2 0 1 0 . 1 . 0 P a g e 26
Based on the above findings and information obtained from local industry representatives, regions have been ranked according to their relative risk based on machinery movements, amount of vineyard contracting and labour hire, and multiple ownership of vineyards in the region. The results are presented in table 2.9 (below). 2.9 Relative risk ratings of regions based on vineyard contracting and multiple ownership.
Relative risk Region Rationale
High Adelaide Hills
Langhorne Creek
Barossa Valley
Eden Valley
More likely to be serviced by contractors servicing multiple regions – probably due to region’s size and fairly central location. Relatively high number of growers who own vineyards in other regions (except Langhorne Creek).
Moderate McLaren Vale
Coonawarra
Wrattonbully
Padthaway
Mount Benson
Robe
Most likely to be serviced by contractors remaining in the region but serviced by one or more larger contractors working in multiple regions. Moderate number of growers with vineyards in other regions (except Padthaway, Robe and Mt Benson). NB Some survey responses only indicated “Limestone Coast” or “South East” therefore it is not clear whether they also service Robe and Mount Benson as well as the larger regions in the zone.
Low
Riverland
Clare Valley
Contractors in the Riverland mainly remain in that region. Larger, cross-region contractors mainly do not service Clare or the Riverland. Moderate number of growers with vineyards in other regions.
Adelaide Plains
Southern Fleurieu
Currency Creek
Very little information was obtained about contractors working in these regions. Most large contractors who responded to the survey do not work in these regions. Relatively few growers with vineyards in multiple regions in SA.
Southern Flinders Ranges
Most harvesting and winter pruning done by machinery brought in by a single contractor from Clare. Machinery always cleaned. First region to be picked in a season – therefore harvesters are likely to have been stored for some time rather than recently working in another region.
Very low Kangaroo Island All harvesting is done by local contractors with machines that stay on the island, while barrel pruning is done by a single contractor from the mainland. The machine is thoroughly cleaned before crossing to the island. Hand-picking and other vineyard labour is carried out in general by local workers and volunteers.
The Peninsulas Yorke Peninsula: harvesting done by single contractor from Clare. Pruning all done locally by hand. Vineyard labour supplied by local workers and volunteers.
No information was obtained about Eyre Peninsula
P hy l l ox e r a and G r a pe I nd u st r y B o a r d o f S ou t h A u st r a l i a
F e b r u a r y 2 0 1 0 V e r s i o n 2 0 1 0 . 1 . 0 P a g e 27
2.5 Visits by GLOs and other winery representatives
GLOs, winemakers and other winery representatives visit growers whom their wineries have contracts with or might be seeking to buy fruit from. Visits usually include entry into the vineyard proper to examine the fruit or the vines or to take samples, especially in the lead-up to vintage, when visits are also likely to be shorter and time pressure greater. This coincides with the time when phylloxera is most likely to be above ground and in the canopy. Technical officers employed by the larger wineries and private consultants also monitor crops and enter vineyards on a regular basis. They are likely to service a wider area on average than GLOs. There is a risk that these types of vineyard visitors could pick up and transfer phylloxera on their clothing, footwear or vehicles. Phylloxera can live for up to a week without a food source in ideal temperature/humidity conditions. GLOs typically visit a number of growers in a day and can cover a substantial distance – depending on the number and location of their growers. Where wineries own vineyards or have contracts with growers interstate, GLOs, winemakers or technical staff and consultants based in South Australia might travel to the interstate vineyards – unlike vineyard workers who are more likely to be based in the region in which they work. Number of “multiple region purchasers” in each region An analysis was done of the 2009 South Australian harvest data1 to identify all wineries that purchased from at least two regions in SA – including those based interstate. These wineries were defined as “multiple region purchasers (MRP)”. A higher number of MRPs in a region is likely to correspond approximately with a higher number of GLOs, winemakers, grape supply managers etc who visit the region and also visit or are based in other regions. The number of MRPs that purchased from each region was counted and tabulated. The results of the analysis are shown in table 2.10 below. Note that the table includes MRPs who only source from two adjacent regions such as Barossa / Eden Valley or Coonawarra / Wrattonbully; however this was considered the most objective and simplest way to present the results – rather than attempting to exclude certain combinations. The fact that a region has a large number of MRPs does not automatically imply that GLOs from those wineries visit a number of different regions. For example, anecdotal evidence suggests that GLOs from the larger wineries who service the Riverland are likely to be dedicated to that region, because of its size, number of growers and relative isolation. Convenience and efficiency would normally imply that regions would be divided into natural “territories” based on proximity – eg Limestone Coast zone; central regions (Adelaide Hills, Langhorne Creek, McLaren Vale); Barossa/Eden Valleys and perhaps Clare; Riverland and perhaps Mildura/Griffith if these regions are in the winery’s portfolio. It is also more likely that the larger regions (Barossa, McLaren Vale, Riverland) would have their own GLO for a particular winery, whereas none of the MRPs would have a GLO based in the Southern Flinders Ranges or other small regions – thus increasing those regions’ relative risk in terms of this risk factor. Another general principle is that the higher the grade of fruit, the more visits paid to the vineyard – therefore those regions with a higher proportion of A and B grade fruit may receive more visits from GLOs, winemakers etc.
1 This information was derived from the 2009 South Australian Utilisation and Pricing Survey.

P hy l l ox e r a and G r a pe I nd u st r y B o a r d o f S ou t h A u st r a l i a
F e b r u a r y 2 0 1 0 V e r s i o n 2 0 1 0 . 1 . 0 P a g e 28
However, it is impossible to generalise across all wineries, because they all have different combinations of regions from which they purchase, numbers of contracted growers in each region, philosophies about number of visits and number of growers per GLO, level of association with interstate vineyards etc. The pattern of movement for GLOs would also not necessarily reflect the pattern for winemakers or other winery representatives, consultants and technical officers etc. Therefore the risk rating for each region for this risk factor has been based on the results shown in table 2.10 only. The risk ratings are included in the table. 2.10 Relative risk ratings of regions based on number of multiple region purchasers in the region.
Region Number of “multiple region purchasers”
(MRPs) in total
Number of MRPs based interstate
Relative risk rating
Adelaide Hills 49 6 High
McLaren Vale 45 3
Coonawarra 24 5
Moderate
Langhorne Creek 30 4
Barossa Valley 33 3
Wrattonbully 17 4
Eden Valley 24 3
Riverland 26 2
Padthaway 16 2
Clare Valley 21 1
Adelaide Plains 14 1
Southern Fleurieu 8 1
Low
Southern Flinders Ranges 8 1
Mount Benson 6 1
Currency Creek 6 1
Robe 4 1
Kangaroo Island 3 0 Very low
The Peninsulas 1 0

P hy l l ox e r a and G r a pe I nd u st r y B o a r d o f S ou t h A u st r a l i a
F e b r u a r y 2 0 1 0 V e r s i o n 2 0 1 0 . 1 . 0 P a g e 29
2.6 Vineyard management practices
The amount of vineyard management practices such as spraying and canopy manipulation carried out in a vineyard can increase its risk of a phylloxera infestation, because of the increased amount of machinery and number of people working in the vineyard. While vineyard management practices vary between growers according to their philosophy, organisational structure etc, some regions are likely to have a greater amount of spraying and canopy manipulation in general because of their climate. Table 2.11 shows each region's relative risk according to the amount of spraying and canopy manipulation activities undertaken on average in the region. The rationale for the assessments is included in the table. 2.11 Relative risk ratings of regions based on estimated amount of spraying and canopy manipulation.
Relative risk Region Rationale
Very high Adelaide Hills Coolest region with highest rainfall - therefore greatest requirement for fungicide and herbicide spraying; also more shoot thinning, wire lifting etc to minimise disease pressure and facilitate ripening.
High Coonawarra
Wrattonbully
Mount Benson
Robe
Padthaway
Southern Fleurieu
Kangaroo Island
Cool regions requiring a high relative amount of spraying and canopy manipulation to maintain quality and minimise disease.
Moderate Barossa Valley
Eden Valley
McLaren Vale
Langhorne Creek
Currency Creek
Central regions - warmer and drier than regions in above categories - still require some regular spraying and canopy manipulation.
Low Adelaide Plains
Clare Valley
Southern Flinders Ranges
Riverland
The Peninsulas
Furthest north, driest and hottest grapegrowing regions require minimal sprays and canopy manipulation in general.
P hy l l ox e r a and G r a pe I nd u st r y B o a r d o f S ou t h A u st r a l i a
F e b r u a r y 2 0 1 0 V e r s i o n 2 0 1 0 . 1 . 0 P a g e 30
2.7 New plantings
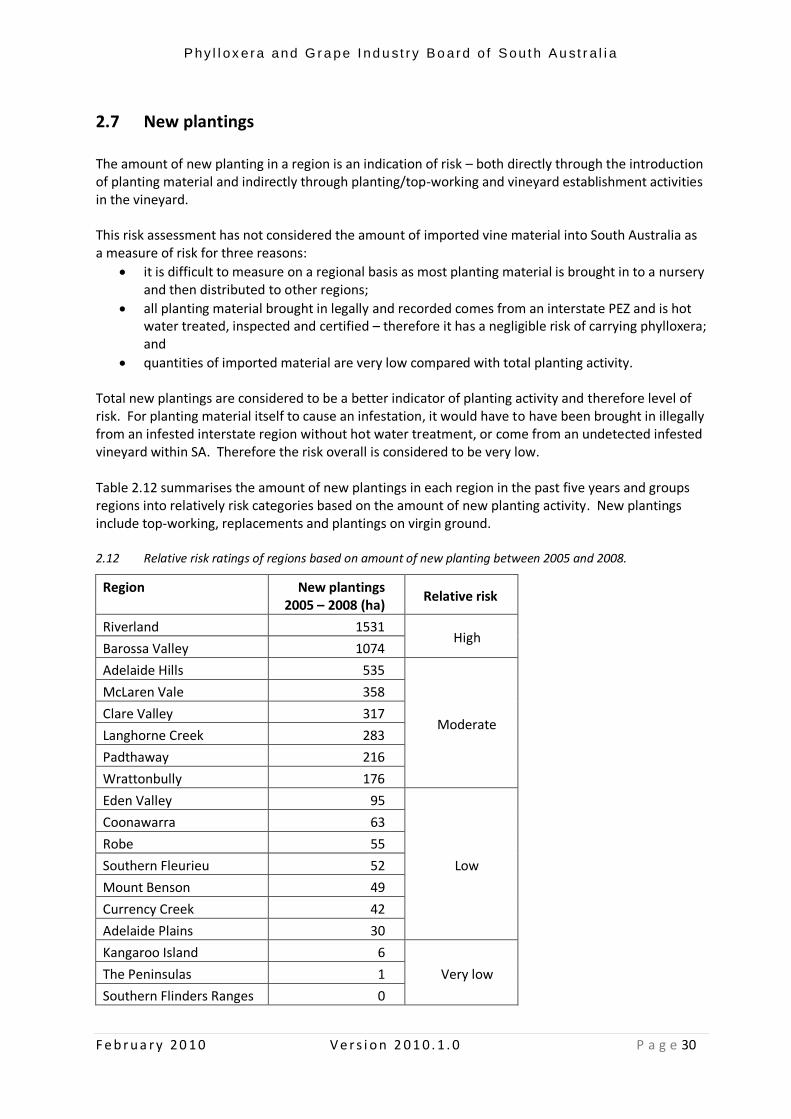
The amount of new planting in a region is an indication of risk – both directly through the introduction of planting material and indirectly through planting/top-working and vineyard establishment activities in the vineyard. This risk assessment has not considered the amount of imported vine material into South Australia as a measure of risk for three reasons:
it is difficult to measure on a regional basis as most planting material is brought in to a nursery and then distributed to other regions;
all planting material brought in legally and recorded comes from an interstate PEZ and is hot water treated, inspected and certified – therefore it has a negligible risk of carrying phylloxera; and
quantities of imported material are very low compared with total planting activity.
Total new plantings are considered to be a better indicator of planting activity and therefore level of risk. For planting material itself to cause an infestation, it would have to have been brought in illegally from an infested interstate region without hot water treatment, or come from an undetected infested vineyard within SA. Therefore the risk overall is considered to be very low. Table 2.12 summarises the amount of new plantings in each region in the past five years and groups regions into relatively risk categories based on the amount of new planting activity. New plantings include top-working, replacements and plantings on virgin ground. 2.12 Relative risk ratings of regions based on amount of new planting between 2005 and 2008.
Region New plantings 2005 – 2008 (ha)
Relative risk
Riverland 1531 High
Barossa Valley 1074
Adelaide Hills 535
Moderate
McLaren Vale 358
Clare Valley 317
Langhorne Creek 283
Padthaway 216
Wrattonbully 176
Eden Valley 95
Low
Coonawarra 63
Robe 55
Southern Fleurieu 52
Mount Benson 49
Currency Creek 42
Adelaide Plains 30
Kangaroo Island 6
Very low The Peninsulas 1
Southern Flinders Ranges 0

P hy l l ox e r a and G r a pe I nd u st r y B o a r d o f S ou t h A u st r a l i a
F e b r u a r y 2 0 1 0 V e r s i o n 2 0 1 0 . 1 . 0 P a g e 31
2.8 Visits by tourists to the region (especially from interstate)
Tourists are considered to represent a small but not insignificant risk of spreading phylloxera. To cause an infestation, they would need to have visited an infested vineyard in the past week or so and carry at least one live phylloxera on their clothing or footwear into a South Australian vineyard. It is not only visitors to cellar door sales that present a potential risk, as other visitors to the region might still enter a vineyard to take photos, go for a walk, etc. As such, overnight visitors are considered to be a higher risk than day visitors because they are more likely to go for a walk and explore vineyards – especially if they are staying in accommodation close to vineyards. They are also more likely to bring walking shoes that they may have worn in other vineyard regions within the recent past – whereas day visitors are more likely to be wearing casual or dress shoes that have smooth soles, which are less suited for walking among vines and less likely to pick up crawlers in mud or dirt. Statistical information related to tourism numbers is presented below. This has been obtained from research published by the SA Tourism Commission on its website and from regional information centres/websites. Where the published figures group regions together into a zone, it should be kept in mind that many of these visitors may not go anywhere near vineyard regions (eg in the case of the Fleurieu and Limestone Coast zones where there is significant beach-side tourism that is quite separate from the major wine regions, and in the Riverland where most visitors are based around the river). Also note that this information was not obtained for the purpose it is being used for here.
2.13 Number of cellar doors and visitors to regions.
Region # of cellar doors
% of all winery visitors to SA
Number of overnight visitors to region in 2008 (not just to wineries)
% visitors who visit wineries
Interstate Intrastate Total
Barossa Valley 71 51% 71,000 105,000 176,000 41%
Eden Valley 6
McLaren Vale 62
24% 92,000 505,000 597,000 9%
Langhorne Creek 7
Southern Fleurieu 5
Currency Creek 4
Kangaroo Island 8 33,000 64,000 97,000 5%
Clare Valley 33 9% 14,000 34,000 48,000 28%
Adelaide Hills 23 2% 49,000 54,000 103,000 11%
Adelaide Plains 4 N/A N/A N/A N/A N/A
Riverland 13 3% 37,000 164,000 201,000 8%
Coonawarra 19
10%
171,000 310,000 481,000
9% Mount Benson 9
Padthaway 2
Wrattonbully 0 0% 0%
Robe 0 0% 0%
Sthrn Flinders Ranges 2 N/A N/A N/A N/A N/A
The Peninsulas 1 N/A N/A N/A N/A N/A

P hy l l ox e r a and G r a pe I nd u st r y B o a r d o f S ou t h A u st r a l i a
F e b r u a r y 2 0 1 0 V e r s i o n 2 0 1 0 . 1 . 0 P a g e 32
Table 2.14 gives a summary of major events held in South Australian grapegrowing regions that attract significant numbers of international and/or interstate visitors.
2.14 Major events held in South Australian grapegrowing regions
EVENT REGION WHEN HELD
Lights of Lobethal Adelaide Hills December/January
Coonawarra Cup Coonawarra January
Tour Down Under Barossa Valley
McLaren Vale
Clare Valley
Adelaide Hills
Southern Fleurieu
Currency Creek
Langhorne Creek
January
A Day on the Green McLaren Vale
Barossa Valley
Clare Valley
February
December, February
February
Barossa Under the Stars Barossa Valley March
Barossa Vintage Festival Barossa Valley April (biannually)
Oakbank Racing Carnival Adelaide Hills April
A Day on the Green is considered to be a particular risk, because this event is often part of a series where the same performer has previously performed in a region interstate and roadies, equipment, trucks etc are transported from one region to the next. In addition, the main winery tourism regions generally hold a number of regional events such as the Coonawarra Cabernet Tasting, Barossa, Clare and McLaren Vale Gourmet Weekends, Lobethal Grand Prix etc. that would attract large numbers of visitors but generally either local or from the city and suburbs of Adelaide. These are therefore not considered to be high risk events. Major events that are held in Adelaide can be expected to attract visitors who may in turn visit wine regions – especially those regions within an easy day trip of the city (Barossa, Clare, McLaren Vale and Adelaide Hills). Events in this category include:
- The Adelaide Festival and Festival Fringe - The International Guitar Festival - The Clipsal 500 - The Classic Car Rally - Womadelaide.
All these events occur during the spring – autumn period when phylloxera could be present above ground. However, infestation would depend on a visitor to one of these events having already visited an infested vineyard in the same clothing/footwear within approximately a week of visiting a South Australian vineyard region.

P hy l l ox e r a and G r a pe I nd u st r y B o a r d o f S ou t h A u st r a l i a
F e b r u a r y 2 0 1 0 V e r s i o n 2 0 1 0 . 1 . 0 P a g e 33
Based on the above information, the regions are rated according to their relative risk in the table below. 2.15 Relative risk ratings of regions based on visitor numbers to the region and to cellar doors
Relative risk Region Rationale
High
Barossa Valley
Clare Valley
McLaren Vale
Coonawarra
Adelaide Hills
High number of visitors – especially interstate visitors. Largest number of cellar door sales and bed and breakfast accommodation. Winery tourism is major focus of region for tourists (except Adelaide Hills). Large number of visitors to region means more people likely to wander into vineyards - even if not visiting cellar doors.
Moderate
Riverland
The Riverland does not have a predominant focus on winery tourism but does have high numbers of visitors and therefore relatively high numbers of potential winery tourists or entrants to vineyards.
Low
Currency Creek
Southern Fleurieu
Langhorne Creek
Kangaroo Island
Mount Benson
These regions have a handful of cellar doors. Visitors are likely to come to the regions for another main reason but would probably visit at least one cellar door while in the area.
Eden Valley Eden Valley has relatively few cellar doors but its proximity to and association with the Barossa Valley mean that it receives a relatively high number of winery tourists.
The Peninsulas There are only two wineries with cellar doors across the two Peninsulas; however, visitor numbers are relatively high and the wineries offer some high profile events for large numbers of visitors.
Very low
Padthaway
Wrattonbully
Robe
Adelaide Plains
Southern Flinders Ranges
These regions have negligible winery tourism. Visitor numbers are also comparatively low.

P hy l l ox e r a and G r a pe I nd u st r y B o a r d o f S ou t h A u st r a l i a
F e b r u a r y 2 0 1 0 V e r s i o n 2 0 1 0 . 1 . 0 P a g e 34
2.9 Movement of grapes and grape products into region for processing
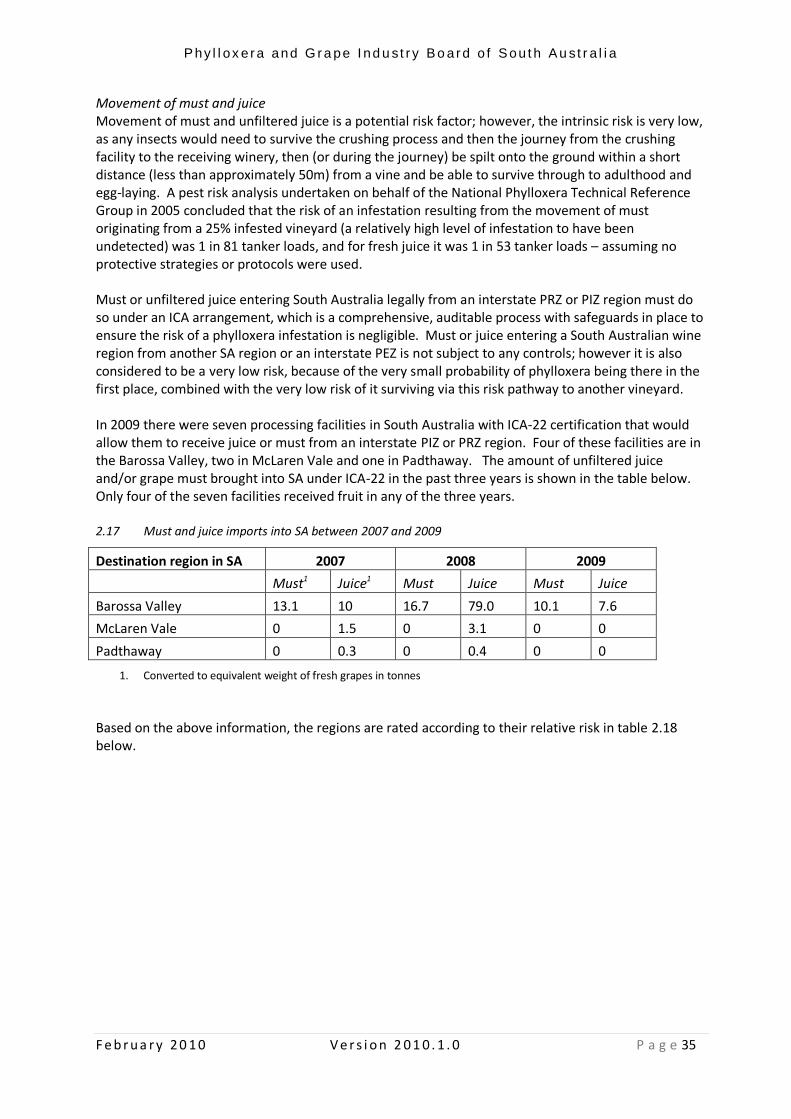
Whole grapes and grape products represent a small risk of spreading phylloxera. Bins of grapes from an infested vineyard are likely to contain live insects as there are insects in the canopy during summer when harvest occurs; however, in order to infest a vineyard in another region, some grapes would need to be spilled en route or at the winery, and the insect(s) be able to make their way to a vineyard (within a distance of approximately 50m maximum). The number of insects in a small spillage of grapes from an infested but undetected vineyard is likely to be low. Alternatively, an infestation could occur where grape stalks and stems removed during crushing are deposited directly onto a vineyard as mulch. While the crushing process would be expected to remove and kill the majority of any insects present, depositing them directly onto a vineyard increases their chances of establishment. Movement of whole grapes The following table gives an estimate of the amount of fruit brought into each region for processing from other regions in SA and from interstate, and the number of regions sending in fruit. This information was collected via a survey of grape processors conducted by PGIBSA as part of the pest risk analysis in March 2009 and is based on the 2009 vintage. Note it is not complete as some large processors have not responded. 2.16 Amount of whole grapes brought into each region for processing from other regions and interstate
Region Fruit brought in for processing
from interstate PEZs (tonnes)
Fruit brought in for processing from other SA
regions (tonnes)
# of regions sending in fruit
Barossa Valley 4176 151,540 16
Riverland 21,466 8,090 13
Langhorne Creek 59 14,149 10
McLaren Vale 0 14,708 12
Coonawarra 0 12,595 4
Eden Valley 0 9,131 9
Wrattonbully 0 4,242 3
Padthaway 0 3,700 3
Clare Valley 0 3,265 6
Adelaide Hills 0 2,748 7
Currency Creek 0 2,570 5
Adelaide Plains 0 649 1
Kangaroo Island 0 0 0
Sthrn Fleurieu 0 0 0
Robe 0 0 0
Mount Benson 0 0 0
S Flinders Ranges 0 0 0
The Peninsulas 0 0 0
P hy l l ox e r a and G r a pe I nd u st r y B o a r d o f S ou t h A u st r a l i a
F e b r u a r y 2 0 1 0 V e r s i o n 2 0 1 0 . 1 . 0 P a g e 35
Movement of must and juice Movement of must and unfiltered juice is a potential risk factor; however, the intrinsic risk is very low, as any insects would need to survive the crushing process and then the journey from the crushing facility to the receiving winery, then (or during the journey) be spilt onto the ground within a short distance (less than approximately 50m) from a vine and be able to survive through to adulthood and egg-laying. A pest risk analysis undertaken on behalf of the National Phylloxera Technical Reference Group in 2005 concluded that the risk of an infestation resulting from the movement of must originating from a 25% infested vineyard (a relatively high level of infestation to have been undetected) was 1 in 81 tanker loads, and for fresh juice it was 1 in 53 tanker loads – assuming no protective strategies or protocols were used. Must or unfiltered juice entering South Australia legally from an interstate PRZ or PIZ region must do so under an ICA arrangement, which is a comprehensive, auditable process with safeguards in place to ensure the risk of a phylloxera infestation is negligible. Must or juice entering a South Australian wine region from another SA region or an interstate PEZ is not subject to any controls; however it is also considered to be a very low risk, because of the very small probability of phylloxera being there in the first place, combined with the very low risk of it surviving via this risk pathway to another vineyard. In 2009 there were seven processing facilities in South Australia with ICA-22 certification that would allow them to receive juice or must from an interstate PIZ or PRZ region. Four of these facilities are in the Barossa Valley, two in McLaren Vale and one in Padthaway. The amount of unfiltered juice and/or grape must brought into SA under ICA-22 in the past three years is shown in the table below. Only four of the seven facilities received fruit in any of the three years. 2.17 Must and juice imports into SA between 2007 and 2009
Destination region in SA 2007 2008 2009
Must1 Juice1 Must Juice Must Juice
Barossa Valley 13.1 10 16.7 79.0 10.1 7.6
McLaren Vale 0 1.5 0 3.1 0 0
Padthaway 0 0.3 0 0.4 0 0
1. Converted to equivalent weight of fresh grapes in tonnes
Based on the above information, the regions are rated according to their relative risk in table 2.18 below.

P hy l l ox e r a and G r a pe I nd u st r y B o a r d o f S ou t h A u st r a l i a
F e b r u a r y 2 0 1 0 V e r s i o n 2 0 1 0 . 1 . 0 P a g e 36
2.18 Relative risk ratings of regions based on imports of grapes and grape products for processing
Relative risk Region Rationale
Very high
Barossa Valley Very high amount of fruit brought into region for processing from other regions, as well as some from interstate. Almost all must and juice from interstate PIZs and PRZs is processed in the Barossa Valley.
High
Riverland
McLaren Vale
Langhorne Creek
Large amount of fruit brought in for processing, from several different regions. Riverland receives largest amount of interstate fruit while McLaren Vale receives some juice from PIZ and PRZ regions.
Moderate Eden Valley
Coonawarra
No interstate fruit or must/juice received for processing. Smaller tonnage received from SA and fewer regions sending in fruit for processing.
Low
Wrattonbully
Padthaway
Clare Valley
Adelaide Hills
Currency Creek
Adelaide Plains
Smaller amount of fruit received for processing from other SA regions. No interstate fruit. Padthaway has received very small quantities of juice from interstate PIZs or PRZs in the past.
Very low
Kangaroo Island
Southern Fleurieu
Robe
Mount Benson
Southern Flinders Ranges
The Peninsulas
No processing of fruit or grape products from outside the region.
2.10 Level of awareness
Level of awareness is considered to act differently as a risk factor from the others. In the absence of other risk factors, it is unlikely that lack of awareness per se would lead to an infestation. However, if there is a significant risk of infestation due to one or more other risk factors, then lack of awareness is considered to act as a multiplier, increasing the risk of an infestation because growers are less likely to follow appropriate hygiene and vineyard protection protocols, or to be aware of or choose to comply with legislative requirements. Conversely, a high level of awareness among growers in a region may be expected to have a protective effect – increasing the likelihood that disinfestation and other protection strategies will be carried out to reduce the risk associated with the entry of a risk vector. Note: it is assumed that there is a direct relationship between awareness and protective behaviour – ie if growers are aware of the risk of phylloxera and what steps need to be taken to protect their vineyards, then they are more likely to take those steps. Level of awareness is estimated based on a number of different indirect measures. These are summarised in the table below.

P hy l l ox e r a and G r a pe I nd u st r y B o a r d o f S ou t h A u st r a l i a
F e b r u a r y 2 0 1 0 V e r s i o n 2 0 1 0 . 1 . 0 P a g e 37
2.19 Information related to various indirect measures of awareness
Region # times surveyed
(aerial imagery)2
Use of protocols3
Active regional committee4
(Yes/No)
Attendees at phylloxera workshop 2001-2008 per 100 growers5
Grower meeting in
region
Adelaide Hills 1 3.44 Yes 4.4 Part6
Adelaide Plains 1 3.67 No 2.9 No
Barossa Valley 2 3.52 Yes 6.3 Yes
Clare Valley 2 3.60 Yes 4.6 Yes
Coonawarra 17 4.43 Yes 23.8 Part
Currency Creek 2 4.00 No 0 No
Eden Valley 2 3.44
Kangaroo Island 0 2.83 No 0 No
Langhorne Creek 2 3.88 Yes 17.6 Part
McLaren Vale 2 3.57 Yes 2.5 Yes
Mount Benson 1 5.17 Yes 10.5 No
Padthaway 1 4.45 Yes 56.7 Part
Peninsulas 0 7.00 No 0 No
Riverland 2 3.06 Yes 2.09 Yes
Robe 1 4.33 Yes 36.4 No
Southern Fleurieu 1 3.33 No 0 No
Sth Flinders Ranges 0 3.50 No 0 No
Wrattonbully 1 4.41 Yes Part
2 Since 2001, the PGIBSA has had an aerial surveillance program in place. This involves taking aerial imagery of vineyards in early summer, digitising the imagery, identifying patches of low vigour consistent with phylloxera symptoms, and then carrying out root surveys of those patches to determine the cause of the low vigour. As part of the program, the owners of the vineyards with “suspect” patches are contacted and involved in the process. In addition, all growers in the surveyed region receive copies of their aerial imagery. This program is therefore considered to contribute to raising awareness of phylloxera in the surveyed region. 3 Use of protocols measured by the PGIBSA grower survey (January 2009) on a scale from 1 (not at all) to 7 (full protocols in place). 4 Active regional committee is a committee that is engaged with the PGIBSA and includes phylloxera on its agenda regularly 5 As per table 2.1. Note that the number of vineyard workers in a region may not correlate with the number of
registered growers. 6 Part – indicates meeting held in some years only or not directly in region 7 A trial of aerial imagery was conducted in the Limestone Coast zone in 2001 in addition to the survey counted in this table; however, ground truthing was not included as part of the trial – therefore it is not counted.
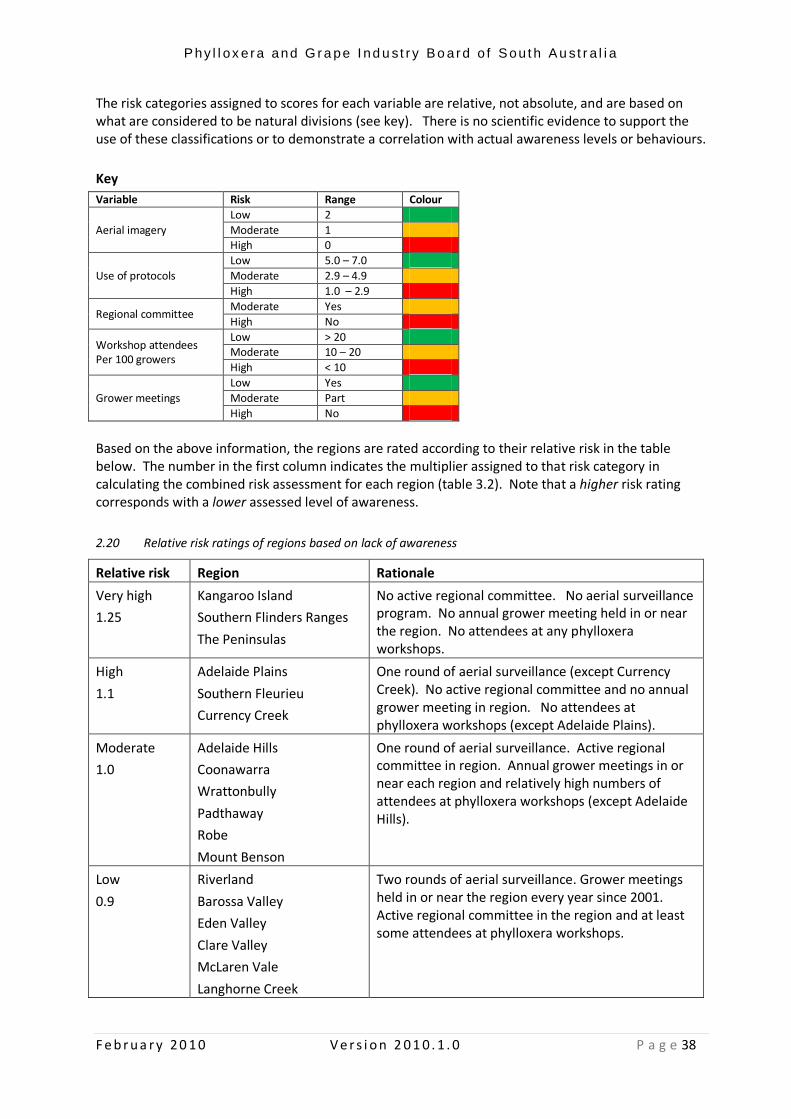
P hy l l ox e r a and G r a pe I nd u st r y B o a r d o f S ou t h A u st r a l i a
F e b r u a r y 2 0 1 0 V e r s i o n 2 0 1 0 . 1 . 0 P a g e 38
The risk categories assigned to scores for each variable are relative, not absolute, and are based on what are considered to be natural divisions (see key). There is no scientific evidence to support the use of these classifications or to demonstrate a correlation with actual awareness levels or behaviours.
Key
Variable Risk Range Colour
Aerial imagery
Low 2
Moderate 1 High 0
Use of protocols
Low 5.0 – 7.0
Moderate 2.9 – 4.9
High 1.0 – 2.9
Regional committee Moderate Yes
High No
Workshop attendees Per 100 growers
Low > 20 Moderate 10 – 20
High < 10
Grower meetings
Low Yes
Moderate Part
High No
Based on the above information, the regions are rated according to their relative risk in the table below. The number in the first column indicates the multiplier assigned to that risk category in calculating the combined risk assessment for each region (table 3.2). Note that a higher risk rating corresponds with a lower assessed level of awareness.
2.20 Relative risk ratings of regions based on lack of awareness
Relative risk Region Rationale
Very high
1.25
Kangaroo Island
Southern Flinders Ranges
The Peninsulas
No active regional committee. No aerial surveillance program. No annual grower meeting held in or near the region. No attendees at any phylloxera workshops.
High
1.1
Adelaide Plains
Southern Fleurieu
Currency Creek
One round of aerial surveillance (except Currency Creek). No active regional committee and no annual grower meeting in region. No attendees at phylloxera workshops (except Adelaide Plains).
Moderate
1.0
Adelaide Hills
Coonawarra
Wrattonbully
Padthaway
Robe
Mount Benson
One round of aerial surveillance. Active regional committee in region. Annual grower meetings in or near each region and relatively high numbers of attendees at phylloxera workshops (except Adelaide Hills).
Low
0.9
Riverland
Barossa Valley
Eden Valley
Clare Valley
McLaren Vale
Langhorne Creek
Two rounds of aerial surveillance. Grower meetings held in or near the region every year since 2001. Active regional committee in the region and at least some attendees at phylloxera workshops.

P hy l l ox e r a and G r a pe I nd u st r y B o a r d o f S ou t h A u st r a l i a
F e b r u a r y 2 0 1 0 V e r s i o n 2 0 1 0 . 1 . 0 P a g e 39
3. Summary of risk assessment The following table summarises the results of the risk ratings for each variable by region. In determining overall risk ratings, each of the variables has been given a weighting (shown in the table) based on its importance as a risk factor AND the sufficiency of the information used in this analysis to measure it. The assessment of importance has been made by the project reference group based on industry knowledge and experience. Where the source information is believed to be incomplete or not reliable then the risk factor is given a lower rating than it might otherwise have received. Awareness is treated as a multiplier – ie the overall risk rating determined from the other risk factors is multiplied by the weighting factor shown in table 2.20 to give a final rating. 3.1 Summary of risk ratings for all variables by region
Reg
ion
Size
/ n
um
ber
of
gro
wer
s
Pro
xim
ity
to s
ou
rce
of
ph
yllo
xera
Envi
ron
men
tal f
acto
rs
Mo
verm
ent
of
mac
hin
ery
/ w
ork
ers
Vis
its
by
GLO
s an
d
oth
er
win
ery
rep
.s
Vin
eyar
d m
anag
em
ent
pra
ctic
es
New
pla
nti
ngs
2
00
5 -
20
08
Tou
rist
s
Pro
cess
ing
of
grap
es
and
gra
pe
pro
duct
s
Lack
of
awar
enes
s
Weighting 2.0 1.5 1.0 1.0 1.0 1.5 1.0 1.0 1.0 *
Adelaide Hills H M H H H VH M H L M
Adelaide Plains L M L L M L L VL L H
Barossa Valley H M L H M M H H VH L
Clare Valley H L L L M L M H L L
Coonawarra M VH H M M H L H M M
Currency Creek L L M L L M L L L H
Eden Valley M M M H M M L L M L
Kangaroo Island VL VL M VL VL H VL L VL VH
Langhorne Creek M L L H M M M L H L
Mount Benson L L M M L H L L VL M
McLaren Vale H M M M H M M H H L
Padthaway M VH M M M H M VL L M
Peninsulas VL VL M VL VL L VL L VL VH
Riverland VH H VL L M L H M H L
Robe L L M M L H L VL VL M
Southern Fleurieu L L M L L H L L VL H
Sth Flinders Ranges VL VL L L L L VL VL VL VH
Wrattonbully M VH M M M H M VL L M
Key VH = very high; H = high; M = moderate; L = low; VL = very low.

P hy l l ox e r a and G r a pe I nd u st r y B o a r d o f S ou t h A u st r a l i a
F e b r u a r y 2 0 1 0 V e r s i o n 2 0 1 0 . 1 . 0 P a g e 40
Table 3.2 provides a summary of the risk profile for each region, and a combined overall risk assessment relative to other regions. 3.2 Overall regional risk assessments and summary risk profiles
Overall rating
Region Comments
Very high risk
Adelaide Hills
The Adelaide Hills is the highest risk region by a significant margin. Although it is not one of the largest regions, it is assessed as high risk in terms of size – particularly as it has a relatively large number of growers for its size (it is ranked eighth by size but fourth by number of growers). It has the most naturally suited climate (and therefore highest risk) of any SA region – highest rainfall and highest growing season rainfall. It also has the highest estimated amount of vineyard management activities requiring entry to the vineyard (spraying and canopy manipulation) and is rated as high risk in terms of movement of machinery and contractors and entry of GLOs and other vineyard visitors. Tourists are a high risk because although the region is not as predominantly focused on wine tourism as some other regions, it has a relatively large number of visitors and is very close to the city of Adelaide and the airport. It is rated as moderate risk for proximity to a source of phylloxera, based on its accessibility from the airport. It is rated as moderate risk in terms of new plantings and low for grape processing. Awareness is considered to be moderate overall – therefore there is no adjustment of the overall risk rating (see table 2.20).
P hy l l ox e r a and G r a pe I nd u st r y B o a r d o f S ou t h A u st r a l i a
F e b r u a r y 2 0 1 0 V e r s i o n 2 0 1 0 . 1 . 0 P a g e 41
3.2 Overall regional risk assessments and summary risk profiles (cont.d)
Overall rating
Region Comments
High risk
Coonawarra Coonawarra is the closest to interstate PRZ and PIZ regions and receives a very high risk rating for proximity. As one of the major tourism regions, it also receives a high risk rating for number of tourists. The combination of proximity to PIZ and PRZ regions and high tourist traffic, although not quantified in this assessment, is likely to magnify this risk. Coonawarra is also rated as high risk on both environmental factors and relative amount of vineyard management practices. Machinery movement into the region is assessed as moderate risk – as is movement of vineyard visitors such as GLOs. Amount of grape processing and size are also rated as moderate risk. The only variable on which this region was assessed as low risk is amount of new plantings. Awareness is considered to be moderate overall – therefore there is no adjustment of the overall risk rating.
Barossa Valley The Barossa Valley is the second largest region in SA, with the highest number of tourists and the most grape processing from other regions. It has also had a relatively large amount of new plantings over the past few years. It is therefore rated as high risk or very high risk on all these risk factors, as well as on machinery/ vineyard worker movements. It is considered to be at moderate risk based on proximity to a source of phylloxera, vineyard visitors and vineyard management practices. The only factor on which it is rated as low risk is environmental factors. However, the region’s overall risk has been discounted because it is assessed as having a relatively high level of awareness (low risk) among growers.
McLaren Vale McLaren Vale is the third largest grapegrowing region in SA, and a major wine tourism region. It is centrally located which makes it highly interconnected with other regions. It receives high risk ratings for size, tourists, grape processing and visits by GLOs, and moderate risk ratings for proximity to a source of phylloxera, environmental factors and vineyard management practices. It is also assessed as moderate risk for machinery movements and new plantings. It does not have any low risk ratings. However, the overall risk rating for the region has been discounted because of a high awareness (low risk) rating.
Riverland The Riverland is a difficult region to assess. It has several high and very high risk ratings – for size and amount of grape processing, proximity and new plantings; however it also has some important low and very low risk ratings – for vineyard management practices and environmental suitability. Although the region is not one of the major wine tourism regions, it does have a very high number of visitors, which means it receives a moderate risk rating for tourists. Machinery movement is rated as low risk. The Riverland receives a high awareness (low risk) rating, which means that the overall risk has been reduced by 10%.

P hy l l ox e r a and G r a pe I nd u st r y B o a r d o f S ou t h A u st r a l i a
F e b r u a r y 2 0 1 0 V e r s i o n 2 0 1 0 . 1 . 0 P a g e 42
3.2 Overall regional risk assessments and summary risk profiles (cont.d)
Overall rating
Region Comments
Moderate
Risk
Padthaway Padthaway is similar to Coonawarra in being very high risk in terms of proximity to a source of phylloxera, high in terms of vineyard practices and moderate in terms of size, vineyard visitors and movement of machinery / contractors. However, it receives a lower risk rating for environmental suitability and grape processing, and a very low rating for tourism, which puts it in a lower overall risk category, despite a higher risk rating for new plantings. Awareness is rated as moderate overall, so there is no change to the calculated risk rating.
Wrattonbully Wrattonbully's risk profile is identical to Padthaway's on every variable.
Eden Valley Eden Valley is moderate risk on most factors – including proximity, size, environmental factors, vineyard visitors, grape processing and vineyard management practices. It is only considered to be high risk for movement of machinery/workers (although in fact much of the exchange may only be with the Barossa Valley). It is rated as low risk for new plantings and tourists; awareness is also rated as low risk (high awareness) so the overall risk has been reduced by 10%.
Clare Valley The Clare Valley has a mixture of high, moderate and low risk ratings – giving it a moderate risk overall. Its size is in the high risk category – particularly because of the relatively high number of growers in the region, and it is also considered to be high risk in terms of tourists because it is one of the major tourism regions – particularly for overnight stays. It is considered moderate risk in terms of the amount of new plantings and movement of visitors. The remaining risk factors: proximity, environmental suitability, grape processing, machinery movement and vineyard management practices are all rated as low risk. Awareness is also rated as low risk (high awareness) so the overall risk rating has been reduced by 10%.
Langhorne Creek
Langhorne Creek has a moderate overall risk rating, made up of high risk ratings for processing of grapes (there is a significant amount of contract processing in Langhorne Creek) and movement of machinery and contractors (its central location and relatively small size makes it less likely that machinery/contractors would operate only in this region), moderate risk ratings for size, vineyard management practices, vineyard visitors and new plantings; and low ratings for proximity, environmental suitability and tourists. Awareness is rated as high overall (low risk), which means that the overall risk rating has been discounted by 10%.

P hy l l ox e r a and G r a pe I nd u st r y B o a r d o f S ou t h A u st r a l i a
F e b r u a r y 2 0 1 0 V e r s i o n 2 0 1 0 . 1 . 0 P a g e 43
3.2 Overall regional risk assessments and summary risk profiles (cont.d)
Overall rating
Region Comments
Low risk
Currency Creek
Currency Creek receives a low risk rating on most risk factors – including size, proximity to a source of phylloxera, movement of machinery/contractors, visits by GLOs, new plantings, grape processing and tourists. It receives moderate risk ratings for environmental factors and vineyard management practices. The awareness risk is rated as high (low awareness); therefore the overall risk rating has been increased by 10%.
Southern Fleurieu
Southern Fleurieu has a very similar risk profile to Currency Creek, except that it is rated as higher risk in terms of vineyard management practices, and lower on grape processing – giving it a similar overall risk rating. Once again, awareness risk is rated as high (low awareness) so the overall risk rating has been increased by 10%.
Mount Benson
Mount Benson has a higher overall risk rating than the two regions above it in this group, but this is counter-balanced by a higher awareness rating (moderate risk – therefore no increase to the calculated risk rating). In particular, it is rated as high risk in terms of vineyard management practices and moderate in terms of environmental factors and movement of machinery/contractors. It is rated as low risk for size, proximity to a source of phylloxera (while it is also relatively close to the Victorian border in the South-East, it is not on a main route through SA), amount of new plantings, vineyard visitors and tourists.
Robe Robe has an almost identical risk profile to Mount Benson – with the exception that it receives a very low risk rating for tourists.
Adelaide Plains
The Adelaide Plains receives a low or very low risk rating on most risk factors – except for proximity to a phylloxera source (moderate risk, based on its accessibility to the airport as well as being on a major access route between interstate wine regions and Adelaide) and visits by GLOs (also moderate risk). The awareness risk is rated as high (low awareness); therefore the overall risk rating has been increased by 10%.
Kangaroo Island
Kangaroo Island is rated as very low risk on six out of the nine risk factors – all except tourists (low risk), environmental factors (moderate risk) and vineyard management practices (high risk). However, awareness risk is considered to be very high. Therefore the overall risk rating has been increased by 25%.

P hy l l ox e r a and G r a pe I nd u st r y B o a r d o f S ou t h A u st r a l i a
F e b r u a r y 2 0 1 0 V e r s i o n 2 0 1 0 . 1 . 0 P a g e 44
3.2 Overall regional risk assessments and summary risk profiles (cont.d)
Overall rating
Region Comments
Very low risk
Peninsulas The Peninsulas has an almost identical risk profile to Kangaroo Island, being very low risk for size, proximity to a source of phylloxera, movement of machinery/contractors, GLOs, amount of new plantings, tourists and grape processing. However it has a much lower risk rating for vineyard management practices (low risk compared with high risk), which has a weighting of 1.5. This puts it in a lower risk category overall. Once again, the awareness risk is rated as very high so the calculated risk rating has been increased by 25%.
Southern Flinders Ranges
This region has the lowest overall risk rating of all. It is rated as very low or low risk on all risk factors. It is the smallest, most remote region with negligible risk in terms of grape processing, wine tourism and new plantings and an unsuitable climate which also requires a low level of vineyard management practices such as spraying and canopy manipulation. Once again, however, the awareness risk is rated as very high so the calculated risk rating has been increased by 25%.
Summary and recommendations Summary This Pest Risk Analysis has found that the Adelaide Hills is at the highest relative risk of a phylloxera infestation, by a fairly substantial margin. Compared with the 2002 Risk Analysis conducted by SRHS and Econsearch, the Adelaide Hills and Coonawarra have received higher risk ratings, while the Clare Valley, Mount Benson/Robe, Eden Valley and Wrattonbully have received a lower rating (although the basis for the ratings is completely different). The three newly included regions: Kangaroo Island, Peninsulas and Southern Flinders Ranges – all received low or very low risk overall ratings. It is important to note that these are relative, not absolute ratings – ie they only compare a region’s risk against other regions. A high relative risk does not mean that the region is actually at a high risk of an outbreak (the report does not measure absolute risk). Discussion The study suggests that the movement of machinery and vineyard workers, including contractors, may not be as important a risk factor as is commonly believed within industry. The results of the contractor survey indicated that there is very little movement of machinery between regions, particularly interstate, and that machinery is generally cleaned before it is moved. It should be noted that labour hire companies were not thoroughly surveyed as part of this study and therefore no conclusions can be drawn about risk associated with this group. On the other hand, the research conducted into work patterns of GLOs and other vineyard visitors suggests that this may be a significant risk factor, as most regions have large numbers of multiple region purchasers, GLOs generally have more than one region in their “territory” and it is not common practice for GLOs to follow hygiene protocols between regions or vineyards within SA. New plantings are not likely to be a significant risk factor in the current industry climate. The total amount of new plantings recorded in this report was less than 5,000 hectares across the four years.

P hy l l ox e r a and G r a pe I nd u st r y B o a r d o f S ou t h A u st r a l i a
F e b r u a r y 2 0 1 0 V e r s i o n 2 0 1 0 . 1 . 0 P a g e 45
For the same four year period 10 years ago (1995 – 1998) the total amount of new planting in SA was more than five times that much (over 25,000 hectares). The most significant risk factors: size, proximity to a source of phylloxera and vineyard management practices, as well as environmental factors, cannot be controlled or mitigated. Biosecurity measures can be put in place to reduce the risk associated with machinery, vineyard visitors, tourists, new plantings and grape processing. This can most effectively be achieved by increasing levels of grower (active) awareness and motivation. The lowest risk regions – Kangaroo Island, Peninsulas and Southern Flinders Ranges – were also the regions with the lowest assessed level of awareness, and have the least amount of involvement with the PGIBSA. This suggests a traditionally low allocation of resources, which now appears to be justified by the results of the PRA. However, they are all assessed to be at very high risk in terms of lack of awareness. Recommendations Based on the conclusions of this report, the following recommendations are made:
Develop and implement a targeted risk reduction strategy for the Adelaide Hills region
Develop and implement an awareness program for GLOs, winemakers and other vineyard visitors (starting with a systematic research study into work patterns and risk)
Target awareness activities at regions assessed as high risk on level of awareness
Limitations of the PRA report The report has some limitations, which affect the validity of the conclusions drawn. In particular the following should be noted:
Dr Kevin Powell does not support the inclusion of environmental factors as a risk factor, as there is insufficient scientific evidence to justify any differentiation between regions on these grounds.
The contractor survey was very limited – both in its initial scope and in the subsequent response rate. A more comprehensive survey could be undertaken to enable more confidence to be placed in the conclusions relating to this risk factor.
Labour hire gangs have not been adequately studied in this report. They may warrant further investigation.
Grape bins have not been considered as a separate category.
Cross-ownership of vineyards in different states has not been measured. Where vineyards are in or near infested regions, this would be a relatively high risk – therefore this factor could be considered in a subsequent version of the report.
The areas omitted from consideration: Limestone Coast zone other, Lower Murray other, Mount Lofty Ranges other and Fleurieu other – are all larger than the Southern Flinders Ranges, Kangaroo Island and the Peninsulas and may warrant consideration in their own right. Mount Lofty Ranges (other) in particular may be at risk from “backyard growers” with little knowledge as well as large numbers of general public in close proximity to vineyards.
In general, the risk ratings cannot be said to be objective or amenable to scientific scrutiny. They cannot be proven to be correct or incorrect. The value of the conclusions drawn needs to be assessed in this context.
P hy l l ox e r a and G r a pe I nd u st r y B o a r d o f S ou t h A u st r a l i a
F e b r u a r y 2 0 1 0 V e r s i o n 2 0 1 0 . 1 . 0 P a g e 46
List of references Dry P.R. and Coombe B.G. (ed.s) 2004 Viticulture Vol 1 (2nd edition) Phylloxera and Grape Industry Board of South Australia 2009 South Australian Winegrape Utilisation
and Pricing Survey 2009 Phylloxera and Grape Industry Board of South Australia 2009 Grower survey report 2009 National Vine Health Steering Committee 2009. National Phylloxera Management Protocol. National Vine Health Steering Committee 2005 Pest Risk Analysis for the establishment of a new
infestation of phylloxera in Australia as a result of harvest processes. Powell, K.S., 2003. Targeted phylloxera management options. GWRDC Final Project Report. Powell, K.S., 2000. Management of grape phylloxera in South-east Australia Phase I and II. GWRDC
Final Project Report, p 17. Scholefield Robinson Horticultural Services and Econsearch, 2002. The Risk and Economic Impact of
Phylloxera in South Australia's Viticultural Regions Volume 1

P hy l l ox e r a and G r a pe I nd u st r y B o a r d o f S ou t h A u st r a l i a
F e b r u a r y 2 0 1 0 V e r s i o n 2 0 1 0 . 1 . 0 P a g e 47
Appendix 1
Statistical information on zone remainders outside GI regions
Zone remainder Size (ha) Number of growers
Number of MRPs
New plantings 2005 - 2008
Limestone Coast (other) 2121 50 13 89
Lower Murray (other) 464 33 7 20
Mount Lofty Ranges (other) 363 37 5 10
Fleurieu (other) 201 14 5 30

P hy l l ox e r a and G r a pe I nd u st r y B o a r d o f S ou t h A u st r a l i a
F e b r u a r y 2 0 1 0 V e r s i o n 2 0 1 0 . 1 . 0 P a g e 48
Appendix 2
Soil maps overlaid with vineyard boundary information

P hy l l ox e r a and G r a pe I nd u st r y B o a r d o f S ou t h A u st r a l i a
F e b r u a r y 2 0 1 0 V e r s i o n 2 0 1 0 . 1 . 0 P a g e 49
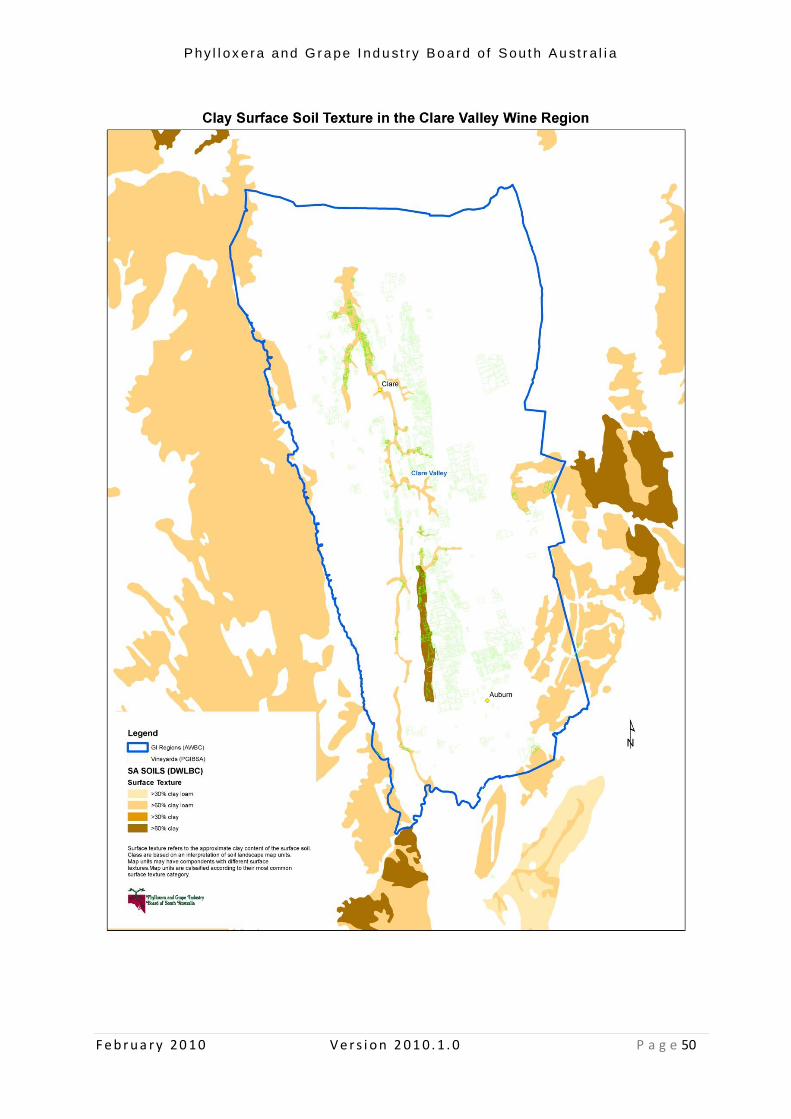
P hy l l ox e r a and G r a pe I nd u st r y B o a r d o f S ou t h A u st r a l i a
F e b r u a r y 2 0 1 0 V e r s i o n 2 0 1 0 . 1 . 0 P a g e 50

P hy l l ox e r a and G r a pe I nd u st r y B o a r d o f S ou t h A u st r a l i a
F e b r u a r y 2 0 1 0 V e r s i o n 2 0 1 0 . 1 . 0 P a g e 51
P hy l l ox e r a and G r a pe I nd u st r y B o a r d o f S ou t h A u st r a l i a
F e b r u a r y 2 0 1 0 V e r s i o n 2 0 1 0 . 1 . 0 P a g e 52