PhUSE 2014 Arcticle Implementation of Oncology specific SDTM … · 2014-11-10 · PhUSE 2014 1...
8
PhUSE 2014 1 Paper PP06 Implementation of Oncology Specific SDTM domains Jacintha Eben, SGS Life Science Services, Mechelen, Belgium ABSTRACT Information regarding tumor lesions and disease response is key in oncology clinical trials to evaluate if the primary or secondary endpoint, usually being defined as a time to event endpoint, has been achieved. Specific oncology domains described in Study Data Tabulation Model Implementation Guide (SDTMIG) 3.2, are representing the data collection of tumor lesions and the evaluation of response(s). Identification information of the lesion is collected in the tumor identification domain (TU). Each identified lesion is repeatedly measured or assessed at subsequent time points. The follow up of each of these lesions, lesions that are split up or merged, and new lesions is captured in the tumor results domain (TR). Using all of this information the investigator evaluates the disease response, captured in the disease response domain (RS). Often in parallel with the investigator, multiple independent reviewers are evaluating the lesions and the disease response to better assess patient outcomes and provide standardized endpoint classification. INTRODUCTION In the last decade the oncology therapeutic area has grown strongly and becomes one of the largest therapeutic areas within the clinical research field. This is also reflected in the interest that companies share in oncology research, despite the complexity and risks with regards to uncertain trial endpoints in oncology clinical trials. 1 Overall survival, progression free survival and time to progression are only a few of the most commonly used time to event endpoints in oncology clinical trials. An endpoint refers to the occurrence of a disease, symptom or sign that constitutes the target outcome of the trial and thus is an important feature of the clinical evaluation of cancer therapeutics. However it is a challenge to determine correctly and objectively if an endpoint has been achieved. This is one of the reasons why standardized response criteria have been developed. Standardized response criteria describe response definitions and advise which techniques, measurements, and assessments are needed to evaluate the response. Standardization helps to facilitate the interpretation of the response but it also enhances the comparison of clinical trials and helps in streamlining the approval process of new therapeutic agents. In order to capture all of the information on the tumor lesions and the disease response, a standard data structure has been developed by the Submission Data Standards team of Clinical Data Interchange Standards Consortium (CDISC) and is described in the Study Data Tabulation Model Implementation Guide (SDTMIG) v3.2. The tumor package in SDTMIG v3.2 consists of three SDTM domains: TU (Tumor Identification), TR (Tumor Results) and RS (Disease Response). The three domains are related but each has a distinct purpose. This paper will describe by means of real-life examples how the information of the standardized response criteria can be collected in each of the three finding domain classes of a clinical database and how these domains are linked. The information in this paper is based on SDTMIG v3.2 and SDTM v1.4. 2,3 ONCOLOGY SPECIFIC SDTM DOMAINS The oncology specific SDTM domains were introduced in SDTMIG v3.1.3 in July 2012. The domains, TU, TR, RS are intended to represent data collected in clinical trials where tumors or lymph nodes are identified at baseline visits and then repeatedly measured or assessed at subsequent time points. A tumor lesion is measured in size if it is large enough to measure. If the tumor lesion is not large enough to measure, the tumor lesion is assessed to be present at baseline and on subsequent visits it is followed up qualitatively (decreased, no change or increased in size). The results of the measurements and assessments are used in the evaluation of the disease response. 2,3 Each of the figures used in this paper is an illustration of data coming from one patient. In order to simplify the figures and make them easier to understand it was decided not to include all variables nor do they contain all the required variables. The information in this paper demonstrates a possible way of implementing of what is described in SDTMIG v3.2. TU DOMAIN GENERAL INFORMATION The TU domain represents data that uniquely identify tumors. The identification is usually done at a baseline visit by using certain methods of assessments, e.g. MRI, CT, PET, or physical examination, as recommended by the
Transcript of PhUSE 2014 Arcticle Implementation of Oncology specific SDTM … · 2014-11-10 · PhUSE 2014 1...
PhUSE 2014
1
Paper PP06
Implementation of Oncology Specific SDTM domains
Jacintha Eben, SGS Life Science Services, Mechelen, Belgium ABSTRACT Information regarding tumor lesions and disease response is key in oncology clinical trials to evaluate if the primary or secondary endpoint, usually being defined as a time to event endpoint, has been achieved. Specific oncology domains described in Study Data Tabulation Model Implementation Guide (SDTMIG) 3.2, are representing the data collection of tumor lesions and the evaluation of response(s). Identification information of the lesion is collected in the tumor identification domain (TU). Each identified lesion is repeatedly measured or assessed at subsequent time points. The follow up of each of these lesions, lesions that are split up or merged, and new lesions is captured in the tumor results domain (TR). Using all of this information the investigator evaluates the disease response, captured in the disease response domain (RS). Often in parallel with the investigator, multiple independent reviewers are evaluating the lesions and the disease response to better assess patient outcomes and provide standardized endpoint classification. INTRODUCTION In the last decade the oncology therapeutic area has grown strongly and becomes one of the largest therapeutic areas within the clinical research field. This is also reflected in the interest that companies share in oncology research, despite the complexity and risks with regards to uncertain trial endpoints in oncology clinical trials.1 Overall survival, progression free survival and time to progression are only a few of the most commonly used time to event endpoints in oncology clinical trials. An endpoint refers to the occurrence of a disease, symptom or sign that constitutes the target outcome of the trial and thus is an important feature of the clinical evaluation of cancer therapeutics. However it is a challenge to determine correctly and objectively if an endpoint has been achieved. This is one of the reasons why standardized response criteria have been developed. Standardized response criteria describe response definitions and advise which techniques, measurements, and assessments are needed to evaluate the response. Standardization helps to facilitate the interpretation of the response but it also enhances the comparison of clinical trials and helps in streamlining the approval process of new therapeutic agents.
In order to capture all of the information on the tumor lesions and the disease response, a standard data structure has been developed by the Submission Data Standards team of Clinical Data Interchange Standards Consortium (CDISC) and is described in the Study Data Tabulation Model Implementation Guide (SDTMIG) v3.2. The tumor package in SDTMIG v3.2 consists of three SDTM domains: TU (Tumor Identification), TR (Tumor Results) and RS (Disease Response). The three domains are related but each has a distinct purpose. This paper will describe by means of real-life examples how the information of the standardized response criteria can be collected in each of the three finding domain classes of a clinical database and how these domains are linked. The information in this paper is based on SDTMIG v3.2 and SDTM v1.4.2,3
ONCOLOGY SPECIFIC SDTM DOMAINS The oncology specific SDTM domains were introduced in SDTMIG v3.1.3 in July 2012. The domains, TU, TR, RS are intended to represent data collected in clinical trials where tumors or lymph nodes are identified at baseline visits and then repeatedly measured or assessed at subsequent time points. A tumor lesion is measured in size if it is large enough to measure. If the tumor lesion is not large enough to measure, the tumor lesion is assessed to be present at baseline and on subsequent visits it is followed up qualitatively (decreased, no change or increased in size). The results of the measurements and assessments are used in the evaluation of the disease response.2,3 Each of the figures used in this paper is an illustration of data coming from one patient. In order to simplify the figures and make them easier to understand it was decided not to include all variables nor do they contain all the required variables. The information in this paper demonstrates a possible way of implementing of what is described in SDTMIG v3.2.
TU DOMAIN GENERAL INFORMATION The TU domain represents data that uniquely identify tumors. The identification is usually done at a baseline visit by using certain methods of assessments, e.g. MRI, CT, PET, or physical examination, as recommended by the

PhUSE 2014
2
Standardized Response Criteria being used. This information is collected in the TUMETHOD-variable. What characterizes the tumor identification the most is the anatomic location which is collected in the variable, TULOC. Additional anatomical location qualifiers (TULAT, TUDIR, TUPORTOT) might also be used in the database and are permissible fields. Figure 1 is an example of clinical data representing measurable, assessable, and new lesions. Each record corresponds to the identification of one lesion (in this example: TUTESTCD = TUMIDENT). The result of the identification can be found in TUORRES and shows the classification of the identified tumor. Besides the VISIT-information, also the date on which the image/scan/physical exam was done, is collected in the TU-domain in TUDTC. TUDTC is not the date that the image was read by the radiologist to identify tumors and thus does not necessarily represent the date of VISIT. Once the tumor lesion is identified at baseline, the tumor is followed up on subsequent time points (visits). The measurements and assessments of each of these lesions and time points are collected in the TR domain. In order to link the identified tumors to the corresponding assessment or measurement results in the TR domain, TULNKID is used (see Figure 3). Figure 1: Example of TU domain data collected for one patient
NEW AND SPLIT LESIONS Since the TU domain only contains identification information, the main part of data in TU will be collected at the baseline visit (in this example the screening visit). However there are some cases for which post-baseline information might be included in the TU domain. In Figure 1 a new lesion was identified in the mesenteric lymph nodes on visit 3 by using a spiral CT-scan which was done on 11th of June 2013.
Another example for which post-baseline information can be collected in TU is split or merged lesions. A tumor lesion which was identified at baseline, might split into one or more distinct tumors lesions during trial conduct or two or more tumors lesions might merge to form one single tumor lesion. Depending on the set up of the trial, different approaches can be followed to collect this information in the datasets. However, to collect information of each distinct tumor lesion the eCRF will need to be set up in a way that allows measurements of each distinct tumor lesion to be captured individually.
In figure 2 TULNKID reflects the split of a tumor lesion on visit 2 by adding ‘.1’ and ‘.2’ to the original TULNKID (see red circle). TUGRPID is a variable used to link together a block of related records within a subject in a domain. In this case the split tumor lesion and the originally identified tumor lesion are grouped by using TUGRPID = M2 (measurable lesion 2). A similar principle can be applied for merged lesions. TULNKID will then be a concatenation of the original TULNKID so it reflects the original TULNKID values assigned at the screening visit. For example if M1 and M3 merge, TULNKID might become M1/M3.
Another approach would be to not collect data of each split lesion or merged lesion as newly identified tumor lesions. In these cases the information of the split/merged tumor will only be represented in the TR domain. For example the clinical trial study team can decide that if two or more measurable lesions merge, the measurement of the first measurable tumor lesion is put on 0 mm x 0 mm, while the measurement of the other lesion will contain the total diameters of the merged lesion.

PhUSE 2014
3
Figure 2: Example of split lesion in the TU domain
TR DOMAIN GENERAL INFORMATION The TR domain represents quantitative measurements and/or qualitative assessments of each time point for each tumor identified in the TU domain. The TR domain does not include anatomical location information of each measurement record, this information can be found in the TU domain. The variable TRMETHOD describes the method used to measure or assess the tumor. For consistency purposes it is recommended to use the same method for measuring or assessing the same lesion during the trial. For this reason TUMETHOD and TRMETHOD are, in most cases, the same per lesion throughout the trial. For assessable lesions (also called non-target lesions) the assessment is qualitative and thus the tumor results, collected in TR, can only be collected on post-baseline visits (see Figure 3). In the example of figure 3 the tumor lesion, A1, identified at screening, did not change on visit 1, while on visit 3 the tumor lesion decreased in size compared to baseline. Figure 3: Example of TR domain data collected for 1 patient with regards to assessable tumor lesion A1 identified at screening. The upper table is part of the TU- domain and is linked with the TR domain (as shown in the lower table) via the --LNKID variable
For measurable lesions (also called target lesions) the measurement is quantitative and results for baseline and post- baseline measurements will be collected in TR. Depending on the Standardized Response Criteria being used, it may be necessary to collect more than one measurement per visit. In the example in Figure 4 the tumor lesion was measured in 2 perpendicular dimensions reported per VISIT in TR. The bi-dimensional measurement is reflected in TRTESTCD and TRTEST. The result of the bi-dimensional measurement is captured in TRORRES and TRORRESU. For the TR date (TRDTC) the same principle applies as for TUDTC: The date reflects the date of measurement or assessment and not the date on which the investigator/radiologist read the image.

PhUSE 2014
4
Figure 4 also shows that the measurable lesion, M2, was split on VISIT 2. For this reason the identification of the distinct split lesions were collected in TU, grouped with the originally identified lesion via TUGRPID (see also above). On VISIT 2 and subsequent visits each of the distinct split lesions will be seen as separate lesions and thus measurements will be done for each of them. Figure 4: Example of TR domain data collected for 1 patient with regards to measurable tumor lesion M2 identified at screening. The upper table is a part of the TU- domain and shows the link with TR domain (as shown in the lower table) via --LNKID variable
NEW LESIONS The occurrence of a new tumor lesion is a sign of disease progression and often means that the endpoint of the trial has been reached. The level of detail being collected about this newly identified lesion might be different within each trial. For some clinical trials it is decided to collect limited information as no further details are needed to determine progressive disease. For other clinical trials it might be necessary to also collect the measurements and assessments of this lesion. In each case, a record should be included in both TU and TR domains and they will be linked via –LNKID (see Figure 5). Figure 5: Example of new lesion for which measurements are done, represented in the TU (upper table) and TR domains (lower table).
PhUSE 2014
5
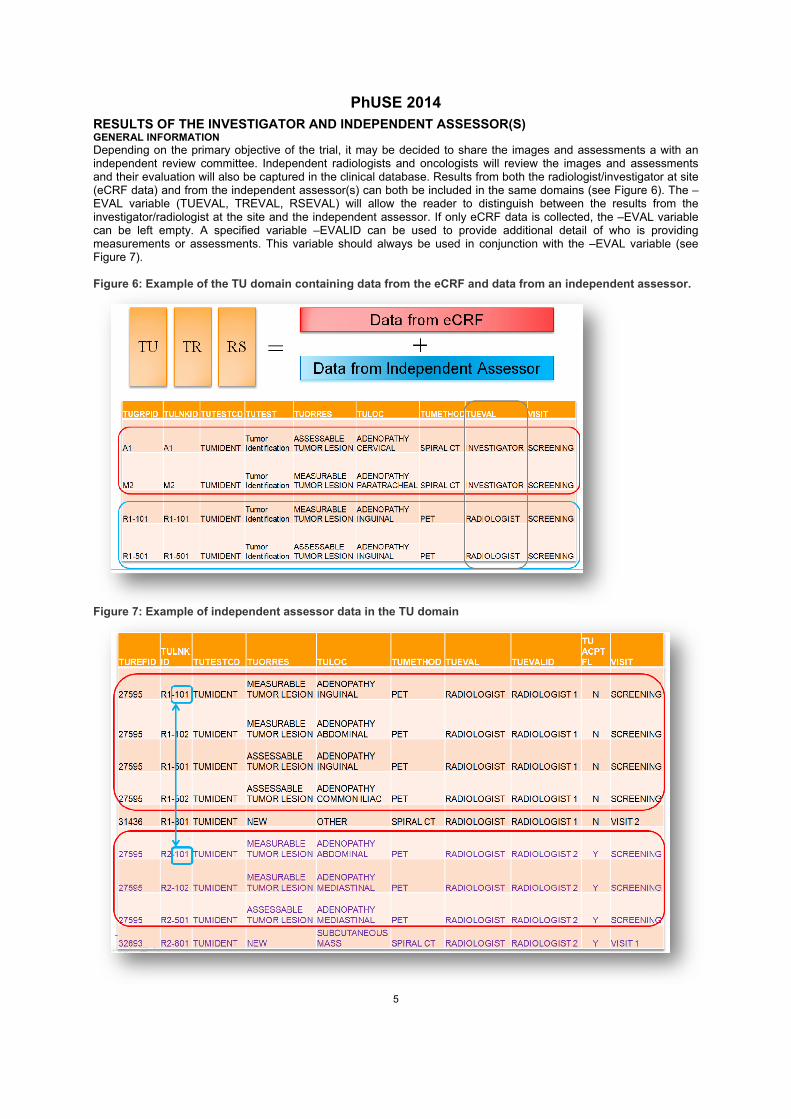
RESULTS OF THE INVESTIGATOR AND INDEPENDENT ASSESSOR(S) GENERAL INFORMATION Depending on the primary objective of the trial, it may be decided to share the images and assessments a with an independent review committee. Independent radiologists and oncologists will review the images and assessments and their evaluation will also be captured in the clinical database. Results from both the radiologist/investigator at site (eCRF data) and from the independent assessor(s) can both be included in the same domains (see Figure 6). The –EVAL variable (TUEVAL, TREVAL, RSEVAL) will allow the reader to distinguish between the results from the investigator/radiologist at the site and the independent assessor. If only eCRF data is collected, the –EVAL variable can be left empty. A specified variable –EVALID can be used to provide additional detail of who is providing measurements or assessments. This variable should always be used in conjunction with the –EVAL variable (see Figure 7). Figure 6: Example of the TU domain containing data from the eCRF and data from an independent assessor.
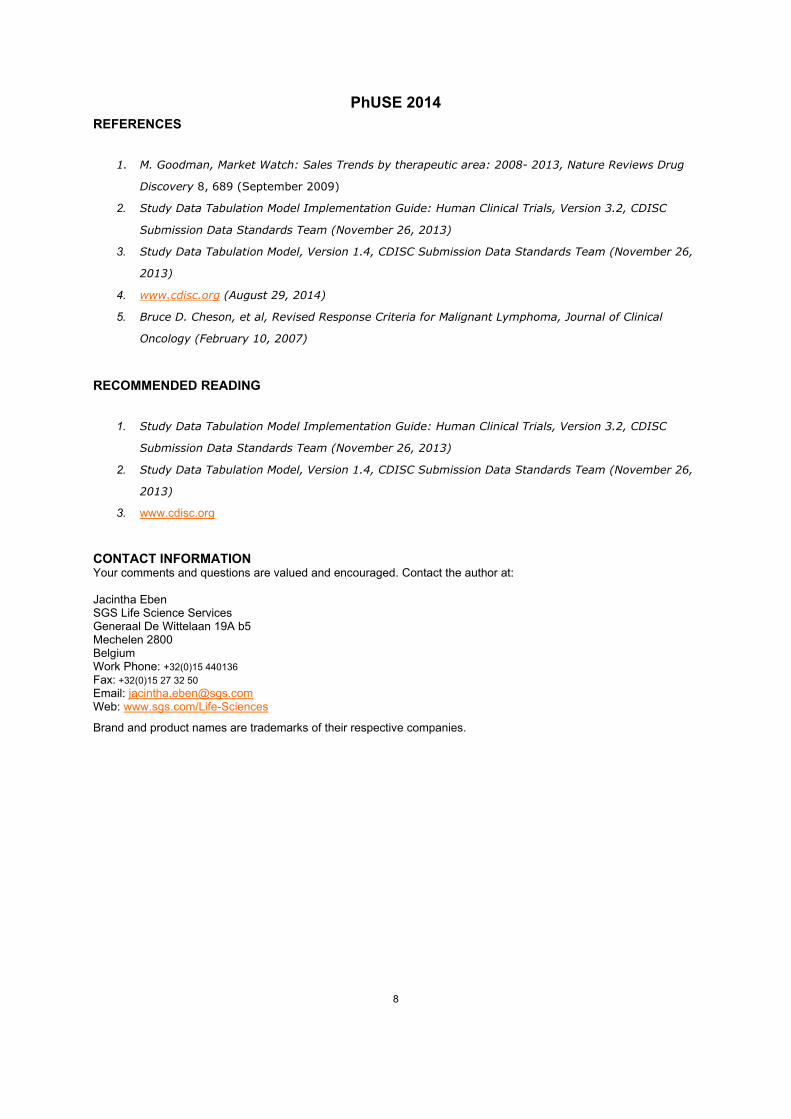
Figure 7: Example of independent assessor data in the TU domain

PhUSE 2014
6
Figure 7 displays the data from two radiologists (TUEVALID = RADIOLOGIST 1 and TUEVALID = RADIOLOGIST 2). Each image has its own identifying reference number (TUREFID and in domain TR, TRREFID). The red circles in the image indicate the tumor lesions that were read on image 27595 by each radiologist. In the example of Figure 7 TULNKID (and thus TRLNKID as well) consists of an indication of the assessor and an identification number of the tumor lesion: R1-101 is lesion 101 identified by Radiologist 1. Despite the fact that the identification number 101 is used twice, once for a tumor lesion identified by radiologist 1 and once for a tumor lesion identified by radiologist 2, it doesn’t mean that it concerns the same tumor. Radiologist 1 and 2 are reading the images independently of each other. ADJUDICATION If for example the overall response, or time to progression of both independent assessors differ, adjudication by a third independent assessor needs to be done. The third independent assessor will indicate which data should be used for analysis per patient. This information is collected in an acceptance flag variable, –ACPTFL (TUACPTFL, TRACPTFL, RSACPTFL). In the example in Figure 7 the data of radiologist 2 has been accepted for this patient on all time points (TUACPTFL = Y and thus TRACPTFL and RSACPTFL will also be Y for this patient). This means that the new lesion which was identified on VISIT1 by radiologist 2 is also accepted and the patient was diagnosed with progressive disease on VISIT 1. RS DOMAIN The RS domain collects the response evaluation. This evaluation is based on all relevant information which is available from the patient and is thus not limited to only the data in the TR domain (e.g. data collected in the following SDTM domains: LB, PE, …). Variables like RSEVAL, RSEVALID, RSLNKID are variables that also can be used within the RS domain as explained in the two other domains. RSLNKGRP is a supplementary variable in RS which is used to link the response assessment to the measurement and assessment records in TR via TRLNKGRP. In Figure 8 the most important response assessment is done on visit level thus –LNKGRP is a variable which groups the measurements and assessments on time point. In this example more than one independent assessor is assessing the response on the same visit and thus information with regards to the assessor should also be included in –LNKGRP e.g. R2-V2 is a concatenation of radiologist 2- visit 2. RSTEST and RSTESTCD represent the type of response assessment e.g. overall response, response of measurable lesions, response of assessable lesions, and spleen response. The result of the response assessment as specified in the standardized response criteria is captured in RSORRES. For example, as already seen by the new lesion identified on VISIT 1 by Radiologist 2 (see above), the evaluation of response of VISIT 1 by radiologist 2 is progressive disease (PD) while radiologist 1 did not yet identify a new lesion on VISIT 1 and concluded stable disease (SD), as disease response based on the measurements and assessments done by radiologist 1 taking the definitions specified in the standardized response criteria into account. The standardized response criteria being used within the trial can be found in RSCAT. Within the example Cheson criteria 2007 has been used.5 For some RSTEST’s, RSLNKGRP is empty. Best Overall Response is an evaluation of response determined on patient level and independent of the visit. For this reason RSLNKGRP and VISIT are empty for this RSTEST. For each response grouped on type of tumor RSLNKGRP is also empty in the example as RSLNKGRP is used to link to all of the measurements and assessments in the TR domain per time point. (Figure 9)

PhUSE 2014
7
Figure 8: Example of linking between TR domain and RS domain.
Figure 9: Example of different RSTEST's with an empty RSLNKGRP variable.
CONCLUSION With the increase of clinical trials in oncology and the associated collection of complex data, new domains have been developed in 2012 by CDISC to collect the information about tumors in a more structured and standardized way. Three main domains are used to represent this type of data. Each of the domains is unique in its purpose but all three are related and linked to each other in a specific way. This is only the beginning of a structured guidance with regards to oncology related data. More is yet to come as CDISC is actively collaborating with a variety of partners on the development of Therapeutic Area Data Standards (CFAST project). One of the initiatives is to develop a Breast Cancer Therapeutic Area Data Standards containing maps, metadata, examples and controlled terminology related to breast cancer. The guidance is not limited to the three SDTM domains described in this paper but will also include information on how to deal with specific biomarker data, relevant family history, treatment history, and more.4 Using these standards will help to compare data across clinical trials and it will enhance the review and approval process of new agents. With these advantages we can only expect that more specific guidelines for oncology will follow in order to set up clinical databases consistently and with a high standard of quality.
PhUSE 2014
8
REFERENCES
1. M. Goodman, Market Watch: Sales Trends by therapeutic area: 2008- 2013, Nature Reviews Drug
Discovery 8, 689 (September 2009)
2. Study Data Tabulation Model Implementation Guide: Human Clinical Trials, Version 3.2, CDISC
Submission Data Standards Team (November 26, 2013)
3. Study Data Tabulation Model, Version 1.4, CDISC Submission Data Standards Team (November 26,
2013)
4. www.cdisc.org (August 29, 2014)
5. Bruce D. Cheson, et al, Revised Response Criteria for Malignant Lymphoma, Journal of Clinical
Oncology (February 10, 2007)
RECOMMENDED READING
1. Study Data Tabulation Model Implementation Guide: Human Clinical Trials, Version 3.2, CDISC
Submission Data Standards Team (November 26, 2013)
2. Study Data Tabulation Model, Version 1.4, CDISC Submission Data Standards Team (November 26,
2013)
3. www.cdisc.org
CONTACT INFORMATION Your comments and questions are valued and encouraged. Contact the author at: Jacintha Eben SGS Life Science Services Generaal De Wittelaan 19A b5 Mechelen 2800 Belgium Work Phone: +32(0)15 440136 Fax: +32(0)15 27 32 50 Email: [email protected] Web: www.sgs.com/Life-Sciences
Brand and product names are trademarks of their respective companies.