PHStat2 Users Guide
50
PHStat2 Version 2.7 Users Guide Copyright 2007 Prentice-Hall, a division of Pearson Education.
-
Upload
achal-jain -
Category
Documents
-
view
84 -
download
5
Transcript of PHStat2 Users Guide

PHStat2Version 2.7
Users Guide
Copyright 2007 Prentice-Hall, a division of Pearson Education.

Table of Contents
Introduction........................................................................................................................4What is PHStat2?...........................................................................................................4What PHStat2 is not......................................................................................................4How PHStat2 Presents Its Results...............................................................................5Preparing Data for Analysis.........................................................................................5
PHStat2 Commands..........................................................................................................6Data Preparation Menu................................................................................................6
Stack Data....................................................................................................................6UnStack Data...............................................................................................................7
Descriptive Statistics Menu...........................................................................................7Box-and-Whisker Plot.................................................................................................7Dot Scale Diagram.......................................................................................................8Frequency Distribution................................................................................................8Histogram & Polygons................................................................................................9Stem-and-Leaf Display..............................................................................................10One-Way Tables & Charts.........................................................................................11Two-Way Tables & Charts........................................................................................12
Decision-Making Menu...............................................................................................12Covariance and Portfolio Analysis............................................................................12Expected Monetary Value.........................................................................................13Expected Opportunity Loss.......................................................................................13Opportunity Loss.......................................................................................................14
Probability & Prob. Distributions Menu...................................................................14Simple & Joint Probabilities......................................................................................14Normal.......................................................................................................................14Normal Probability Plot.............................................................................................15Binomial Probabilities...............................................................................................15Exponential................................................................................................................16Hypergeometric.........................................................................................................17Poisson.......................................................................................................................17
Sampling Menu............................................................................................................18Random Sample Generation......................................................................................18Sampling Distributions Simulation............................................................................18
Confidence Intervals Menu.........................................................................................19Estimate for the Mean, sigma known.....................................................................19Estimate for the Mean, sigma unknown.................................................................19Estimate for the Population Variance........................................................................20Estimate for the Proportion........................................................................................21Estimate for the Population Total..............................................................................21Estimate for the Total Difference..............................................................................22
Sample Size Menu........................................................................................................22Determination for the Mean.......................................................................................22Determination for the Proportion...............................................................................23
One-Sample Tests Menu.............................................................................................24Z Test for the Mean, sigma known............................................................................24

PHStat2 User’s Guide. Page 3
t Test for the Mean, sigma unknown.........................................................................24Chi-Square Test for the Variance..............................................................................25Z Test for the Proportion...........................................................................................26
Two-Sample Tests Menu.............................................................................................27t Test for Differences in Two Means.........................................................................27Z Test for Differences in Two Means........................................................................27F Test for Differences in Two Variances..................................................................28Wilcoxon Rank Sum Test..........................................................................................29Chi-Square Test for the Differences In Two Proportions..........................................30Z Test for Differences in Two Proportions................................................................31McNemar Test...........................................................................................................31
Multiple-Sample Tests.................................................................................................32Chi-Square Test.........................................................................................................32Kruskal-Wallis Rank Test..........................................................................................33Levene Test................................................................................................................33Tukey-Kramer Procedure..........................................................................................33
Control Charts Menu..................................................................................................34p Chart.......................................................................................................................34R and XBar Chart......................................................................................................34
Regression Menu..........................................................................................................35Simple Linear Regression..........................................................................................35Multiple Regression...................................................................................................36Best Subsets...............................................................................................................37Stepwise Regression..................................................................................................38
Utilities Menu...............................................................................................................38Fix Up Chart..............................................................................................................38Remove Worksheet Cell Tints...................................................................................39
About PHStat…...........................................................................................................39Help for PHStat.............................................................................................................39

IntroductionThis guide describes all PHStat2 commands, in order of their appearance in the
PHStat menu in Microsoft Excel. For each command, this guide explains how to select
the command, provides a summary of what the command does, and presents a sample
dialog box.
For more detailed information about a PHStat2 command, open the PHStat2 help file
(PHStatHelp.hlp) directly on the Windows desktop or by clicking the Help button in the
dialog box for the command. (You can also choose Help for PHStat for the PHStat
menu, as is explained in the beginning of the PHStat2 Commands section.)
You should also review the PHStat2 readme file on the PHStat2 CD for technical
requirements and security considerations of this software and consider visiting the
PHStat2 version 2.7 web page on PHStat Web site (www.prenhall.com/phstat) for any
late-breaking information about the software or for further technical assistance.
What is PHStat2?PHStat2 is software that makes operating Microsoft Excel as distraction-free as possible.
As a student studying statistics, you can focus solely on mastering statistics now and not
worry about having to become an expert user of Excel at the same time. When combined
with the Data Analysis ToolPak add-in included with Microsoft Excel, just about all
statistical methods taught in an introductory statistics course can be illustrated in
Microsoft Excel.
What PHStat2 is notPHStat2 is not designed as a commercial statistical package and should not be used as a
replacement for packages such as SAS or SPSS. Because PHStat2 emphasizes learning,
PHStat2 tries to use the methods of calculation that a learner could easily follow and
would find presented in a textbook that discusses manual calculation. In other cases,
PHStat2 uses pre-existing Microsoft Excel methods to produce results that are too
complex to manually calculate or present to the learner. These choices will occasionally
produce results that are not as precise as those produced by commercial packages that
rely on methods of calculation which are fine-tuned to the limitations of computing
technology. While these differences are not significant for most sets of data, real-world

PHStat2 User’s Guide. Page 5
data sets with unusual numerical properties or with extreme values could produce
significant anomalies when used with PHStat2 and Microsoft Excel.
How PHStat2 Presents Its ResultsPHStat2 produces new worksheets and chart sheets inserted into the currently active
workbook. Cells containing important values and results are highlighted by a light yellow
tint and boldface text. These cells and the cells that hold intermediate calculations are
usually only minimally numerically formatted. For some procedures, the values in these
cells will have an excessive number of seemingly significant digits and you may want to
change the numeric formatting for such cells for presentation purposes.
Worksheets that contain cells tinted in light turquoise are designed to be interactive
and you can change the numeric values of those cells to produce different results without
reselecting the PHStat2 command
Preparing Data for AnalysisPlace your data for analysis by PHStat2 in columns. If you are selecting only part of a
column if a pre-existing worksheet, copy that partial column range to a blank column or
worksheet. Generally, you should place your data starting in row 1, using the row 1 cell
for a heading label, if desired (this is recommended). No cells inside a column range
should be left blank.
Due to the limitations of Microsoft Excel, select the worksheet (make it the currently
active sheet) containing the data to be analyzed before selecting the PHStat2 procedure
that will use the data in order to proper operation. If you forget to do this, you may
encounter an error message that refers to an unexpected error or an error in handling a
cell range, although PHStat2 procedures that do not use the Data Analysis ToolPak are
more forgiving of this than others.
For procedures that require two or more cell ranges, such as all of the regression
procedures, make sure that all your cell ranges are from the same worksheet.

PHStat2 User’s Guide. Page 6
PHStat2 CommandsWhen properly installed, PHStat2 displays the PHStat
menu that is shown at right either as part of the Microsoft
Excel menu bar (Excel 97-2003) or as part of the Add-Ins
tab (Excel 2007). Use the Help for PHStat choice at the
bottom of the menu to display the PHStat2 help system
inside Microsoft Excel. Use the About PHStat choice to
determine the actual version of your software (this will be
useful when using the PHStat2 web site or seeking
technical assistance.)
All other menu choices lead to a submenu that
contains commands associated with the choice. The rest
of this section of the user’s guide presents those
(submenu) commands in order of appearance in the
menu.
Data Preparation Menu
Stack Data
Takes group data that has been arranged in columns and stacks it into two new columns,
the first one of which contains the group labels, on a new worksheet. The Unstacked
Data Cell Range must be a consecutive multiple-column cell range arranged one column
per group.
Use: Select PHStat Data Preparation Stack Data.

PHStat2 User’s Guide. Page 7
UnStack Data
Takes grouped data that has been placed in two columns, one of which contains group
labels, and unstacks it into a series of columns, one for each group, on a new worksheet.
The Grouping Variable Cell Range must be single column cell range containing the
group labels and the Stacked Data Cell Range must be a single-column cell range
containing the data.
Use: Select PHStat Data Preparation Unstack Data.
Descriptive Statistics Menu
Box-and-Whisker Plot
Generates box-and-whisker plots on a new chart sheet from one or more groups of
numerical data. Optionally generates a five-number summary on a separate worksheet.
This command invisibly uses the Chart Wizard to construct a plot from a hidden
worksheet that PHStat2 creates.
Use: Select PHStat Descriptive Statistics Box-and-Whisker Plot.

PHStat2 User’s Guide. Page 8
Dot Scale Diagram
Generates a dot scale diagram as a chart object on a new worksheet that also contains the
numerical data plotted and a summary table of statistics.
Use: Select PHStat Descriptive Statistics Dot Scale Diagram.
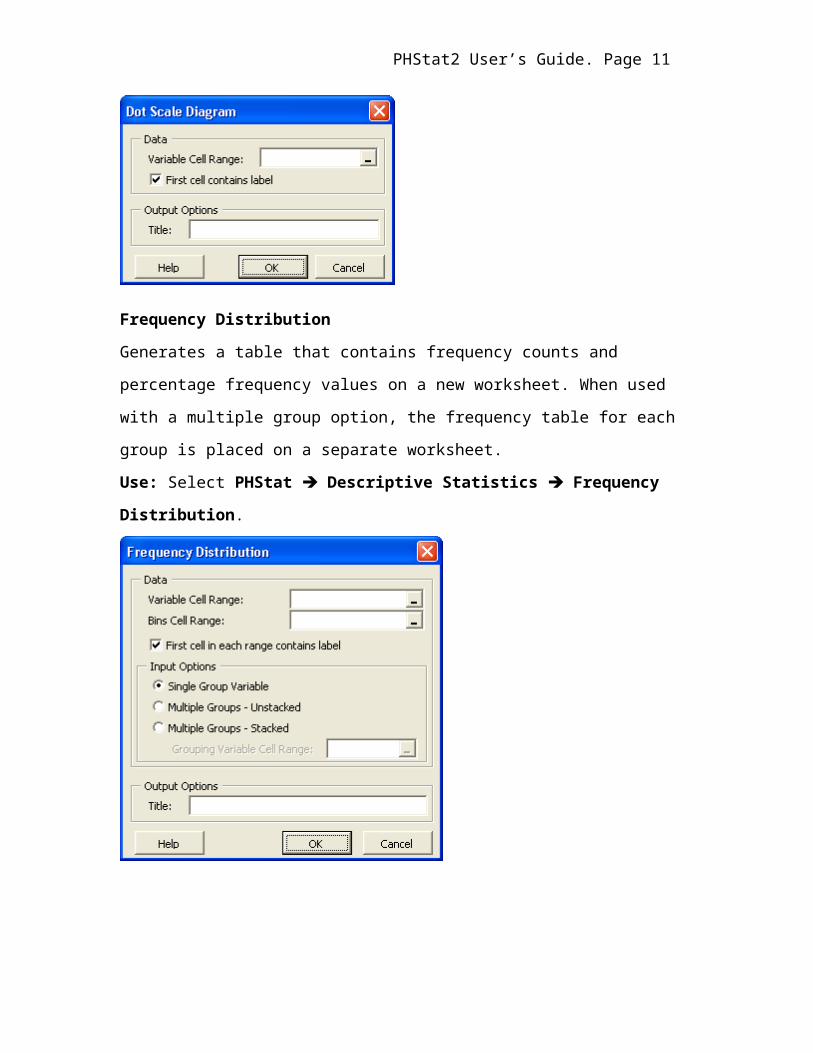
Frequency Distribution
Generates a table that contains frequency counts and percentage frequency values on a
new worksheet. When used with a multiple group option, the frequency table for each
group is placed on a separate worksheet.
Use: Select PHStat Descriptive Statistics Frequency Distribution.

PHStat2 User’s Guide. Page 9
Histogram & Polygons
Generates a frequency table and a histogram on a new worksheet and optionally
generates polygons on separate chart sheets. When used with a multiple group option, the
frequency table and histogram for each group is placed on a separate worksheet and the
multiple group data are plotted together on the same polygons.
Because the command invisibly uses the Data Analysis Histogram procedure, the
command uses “bins” and not class groupings to create a frequency table. A bin is a
number that specify the maximum value for a class. Bins are entered as an ordered,
ascending list of values in a contiguous cell range (the Bins Cell Range). A bin range
containing values 0, 10, 20 would correspond to these three classes: all values less than or
equal to 0, values greater than 0 but less than or equal to 10, values greater than 10 but
less than or equal to 20.
Because the first class will be always open-ended towards negative infinity, this class
will never have a true midpoint. Therefore, this command expects that your Midpoints
Cell Range will be one cell smaller than your Bins Cell Range and will assign the first
midpoint to the second class.
Use: Select PHStat Descriptive Statistics Histogram & Polygons.

PHStat2 User’s Guide. Page 10
Stem-and-Leaf Display
Generates a stem-and-leaf display using the rounding method on a new worksheet from a
set of numerical data and optionally generates a summary statistics table on the same
worksheet. Letting PHStat2 autocalculate the stem unit is recommended but if used, the
Set stem unit as value must be a power of ten. Due to the limitations of Microsoft Excel,
this command may produce a plot with inaccurate leaves if the range of the data set is
very large or if many significant digits are needed to convey the largest and smallest
value.
Use: Select PHStat Descriptive Statistics Stem-and-Leaf Display.
PHStat2 User’s Guide. Page 11
One-Way Tables & Charts
Generates a one-way summary table (in the form of a Microsoft Excel PivotTable) on a
new worksheet for a set of categorical data and optionally generates a bar chart, a pie
chart, and a Pareto diagram on separate chart sheets. This command accepts either
unsummarized data (Raw Categorical Data option) or a Table of Frequencies in which
categories have already been tallied.
Use: Select PHStat Descriptive Statistics One-Way Tables & Chart.

PHStat2 User’s Guide. Page 12
Two-Way Tables & Charts
Generates a two-way summary table (in the form of a Microsoft Excel PivotTable) on a
new worksheet for bivariate categorical data and optionally generates a side-by-side bar
chart on a separate chart sheet.
Use: Select PHStat Descriptive Statistics Two-Way Tables & Chart.
Decision-Making Menu
Covariance and Portfolio Analysis
Generates a new worksheet that calculates the covariance of two variables. The new
worksheet contains an empty probabilities & outcomes table into which you enter
probability and outcome data for each variable to complete the analysis. Command
optionally generates a portfolio management analysis of two investments using a weight-
assigned-to-X value that you can change interactively in the worksheet.
Use: Select PHStat Decision-Making Covariance and Portfolio Analysis.

PHStat2 User’s Guide. Page 13
Expected Monetary Value
Generates a new worksheet that calculates expected monetary value from probability and
payoff data for the events associated with a set of alternative courses of action. The new
worksheet contains an empty probabilities & payoffs table into which you enter
probability and payoff data for each combination of event and alternative course of action
to complete the analysis.
Use: Select PHStat Decision-Making Expected Monetary Value.
Expected Opportunity Loss
Generates a new worksheet that calculates expected opportunity losses from probability
and opportunity loss data for the events associated with a set of alternative courses of
action. The new worksheet contains an empty probabilities & opportunity losses table
into which you enter probability and opportunity loss data for each combination of event
and alternative course of action to complete the analysis.
Use: Select PHStat Decision-Making Expected Opportunity Loss.

PHStat2 User’s Guide. Page 14
Opportunity Loss
Generates a new worksheet that calculates opportunity losses from payoff data for the
events associated with a set of alternative courses of action. The new worksheet contains
an empty payoff table into which you enter payoff data for each combination of event and
alternative course of action to complete the analysis.
Use: Select PHStat Decision-Making Opportunity Loss.
Probability & Prob. Distributions Menu
Simple & Joint Probabilities
Generates a new worksheet that calculates probabilities from a 2 x 2 cross-classification,
or contingency, table of outcomes. The new worksheet contains an empty table of
outcomes into which you enter data for each event to complete the analysis.
Use: Select PHStat Probability & Prob. Distributions Simple & Joint
Probabilities.
(This command does not use a dialog box.)
Normal
Generates a new worksheet that calculates normal probabilities. The new worksheet uses
the STANDARDIZE, NORMDIST, NORMSINV, and NORMINV Functions to
calculate normal probabilities and related values.
Use: Select PHStat Probability & Prob. Distributions Normal.

PHStat2 User’s Guide. Page 15
Normal Probability Plot
Generates a normal probability plot on a new chart sheet. This command also generates a
worksheet that calculates the Z values for each value plotted.
Use: Select PHStat Probability & Prob. Distributions Normal Probability Plot.
Binomial Probabilities
Generates a table of binomial probabilities on a new worksheet. If you select Cumulative
Probabilities, the binomial table will include additional columns for P(<=X), P(<X),
P(>X), and P(>=X). The new worksheet uses the BINOMDIST Function to calculate
binomial probabilities. Given the limitations of this function, the values in the table
should be considered as fair approximations of the actual probability values.
Use: Select PHStat Probability & Prob. Distributions Binomial.

PHStat2 User’s Guide. Page 16
Exponential
Calculates the exponential probability for values less than or equal to a given X value on
a new worksheet. The new worksheet uses the EXPONDIST Function to calculate the
exponential probability.
Use: Select PHStat Probability & Prob. Distributions Exponential.

PHStat2 User’s Guide. Page 17
Hypergeometric
Generates a table of hypergeometric probabilities on a new worksheet.. If you select
Cumulative Probabilities, the hypergeometric table will include additional columns for
P(<=X), P(<X), P(>X), and P(>=X). The new worksheet uses the HYPGEOMDIST
Function to calculate hypergeometric probabilities.
Use: Select PHStat Probability & Prob. Distributions Hypergeometric.
Poisson
Generates a table of Poisson probabilities for 0 to 20 successes per unit (X) on a new
worksheet. If you select Cumulative Probabilities, the binomial table will include
additional columns for P(<=X), P(<X), P(>X), and P(>=X). The new worksheet the
POISSON Function to calculate Poisson probabilities.
Use: Select PHStat Probability & Prob. Distributions Poisson.

PHStat2 User’s Guide. Page 18
Sampling Menu
Random Sample Generation
Generates a random sample without replacement on a new worksheet.
Use: Select PHStat Sampling Random Sample Generation.
Sampling Distributions Simulation
Generates a simulated sampling distribution of the mean on a new worksheet.
Use: Select PHStat Sampling Sampling Distributions Simulation.

PHStat2 User’s Guide. Page 19
Confidence Intervals Menu
Estimate for the Mean, sigma known
Calculates the confidence interval estimate for the mean when sigma is known on a new
worksheet. The new worksheet uses the NORMSINV and CONFIDENCE Functions to
determine the Z value and calculate the interval half width, respectively.
Use: Select PHStat Confidence Intervals Estimate for the Mean, sigma known.
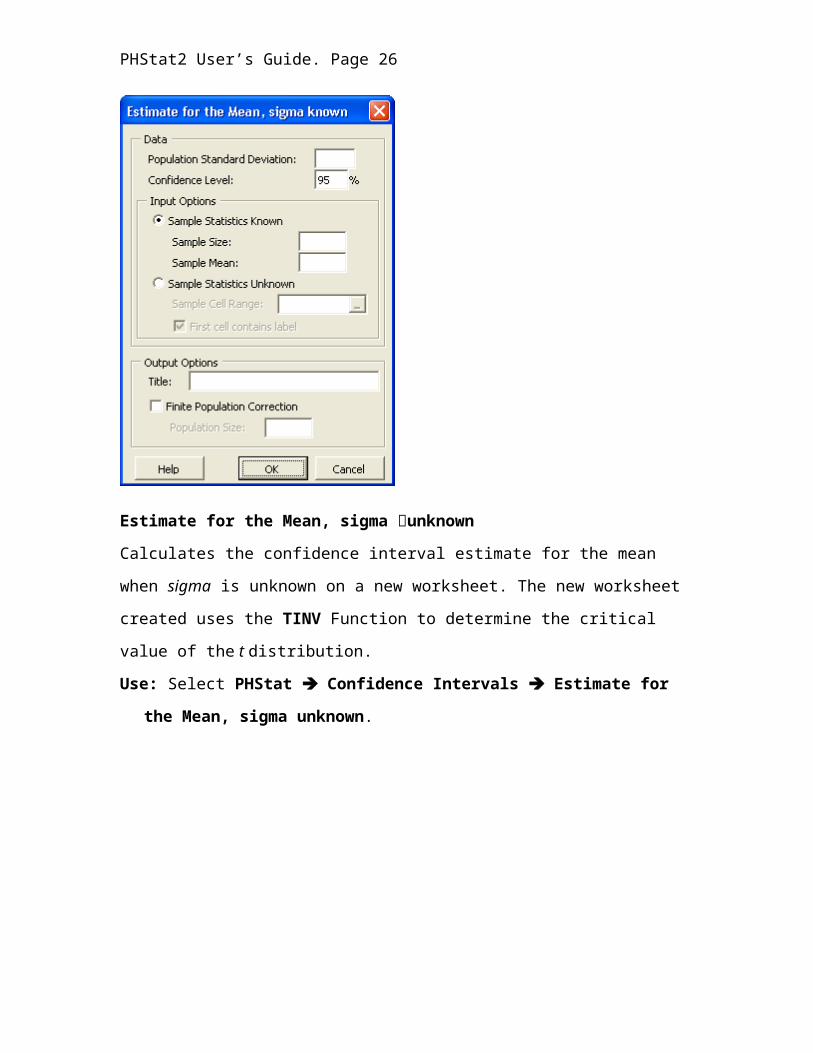
Estimate for the Mean, sigma unknown
Calculates the confidence interval estimate for the mean when sigma is unknown on a
new worksheet. The new worksheet created uses the TINV Function to determine the
critical value of the t distribution.
Use: Select PHStat Confidence Intervals Estimate for the Mean, sigma
unknown.

PHStat2 User’s Guide. Page 20
Estimate for the Population Variance
Calculates the confidence interval estimate for the population variance and standard
deviation on a new worksheet.
Use: Select PHStat Confidence Intervals Estimate for the Population
Variance.

PHStat2 User’s Guide. Page 21
Estimate for the Proportion
Calculates the confidence interval estimate for the population proportion on a new
worksheet. The new worksheet uses the NORMSINV Function to determine the Z value.
Use: Select PHStat Confidence Intervals Estimate for the Proportion.
Estimate for the Population Total
Calculates the confidence interval estimate for the population total on a new worksheet.
The new worksheet uses the TINV Function to determine the critical value from the t
distribution.
Use: Select PHStat Confidence Intervals Estimate for the Population Total.

PHStat2 User’s Guide. Page 22
Estimate for the Total Difference
Calculates the confidence estimate for the total difference on a new worksheet.
Use: Select PHStat Confidence Intervals Estimate for the Total Difference.
Sample Size Menu
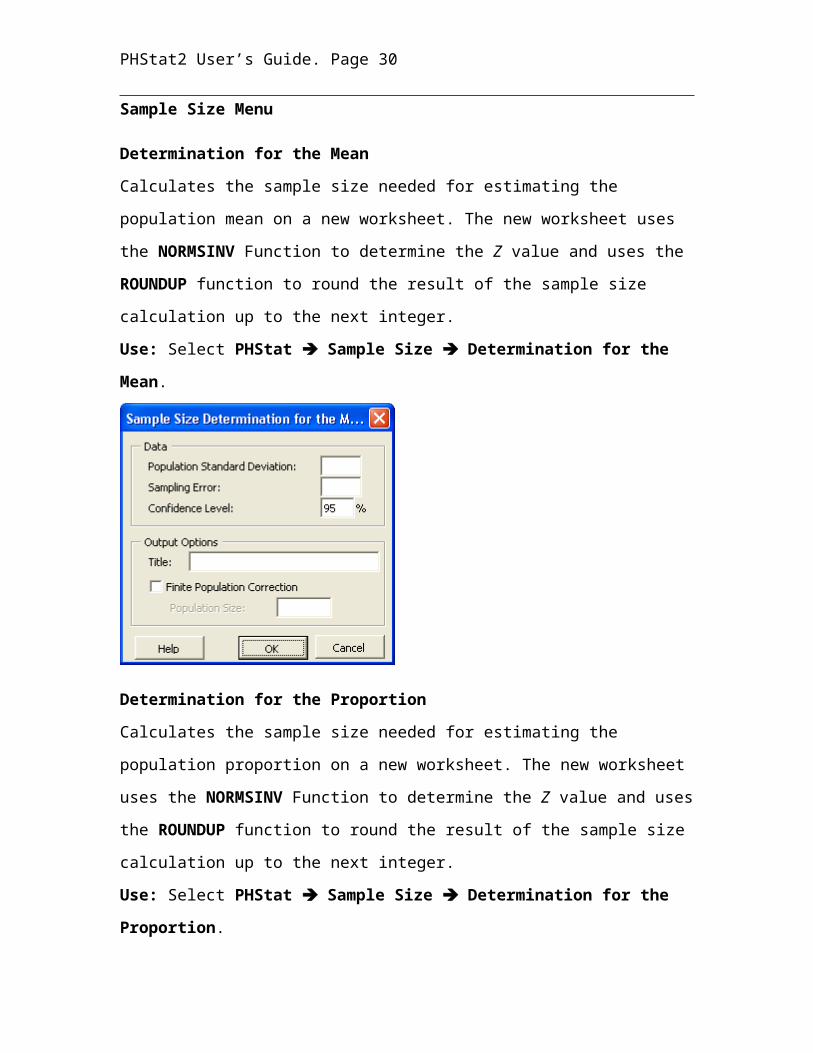
Determination for the Mean
Calculates the sample size needed for estimating the population mean on a new
worksheet. The new worksheet uses the NORMSINV Function to determine the Z value

PHStat2 User’s Guide. Page 23
and uses the ROUNDUP function to round the result of the sample size calculation up to
the next integer.
Use: Select PHStat Sample Size Determination for the Mean.
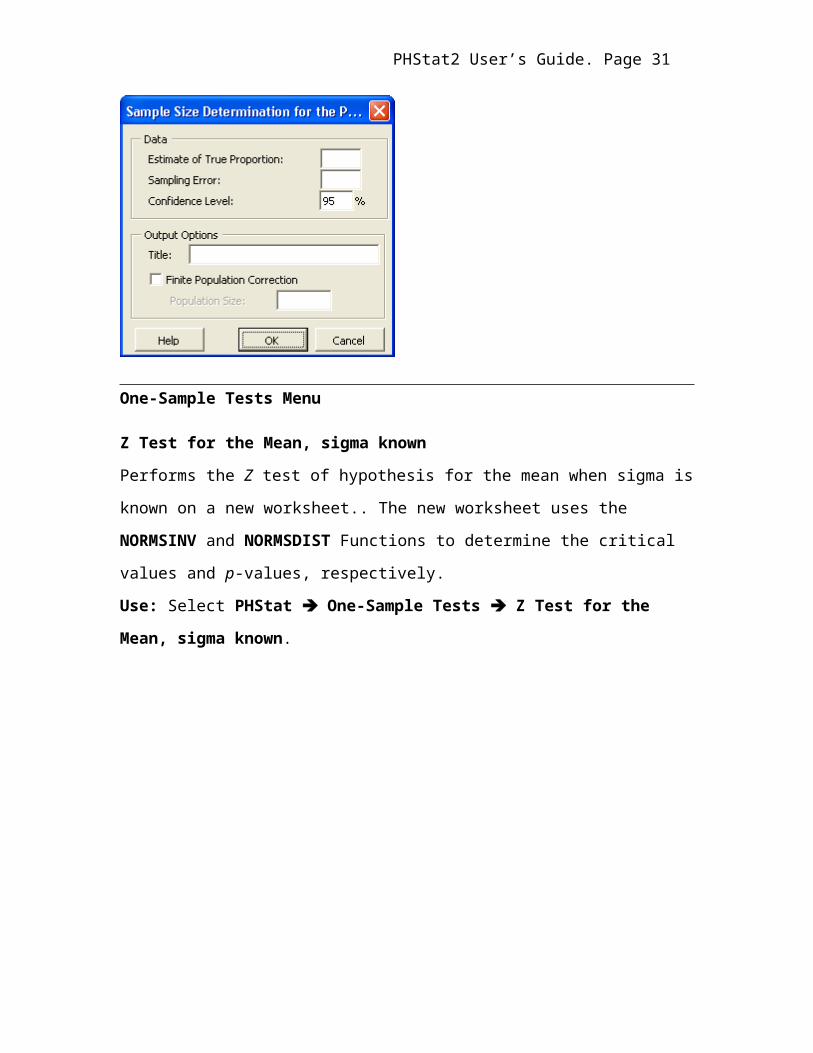
Determination for the Proportion
Calculates the sample size needed for estimating the population proportion on a new
worksheet. The new worksheet uses the NORMSINV Function to determine the Z value
and uses the ROUNDUP function to round the result of the sample size calculation up to
the next integer.
Use: Select PHStat Sample Size Determination for the Proportion.

PHStat2 User’s Guide. Page 24
One-Sample Tests Menu
Z Test for the Mean, sigma known
Performs the Z test of hypothesis for the mean when sigma is known on a new
worksheet.. The new worksheet uses the NORMSINV and NORMSDIST Functions to
determine the critical values and p-values, respectively.
Use: Select PHStat One-Sample Tests Z Test for the Mean, sigma known.
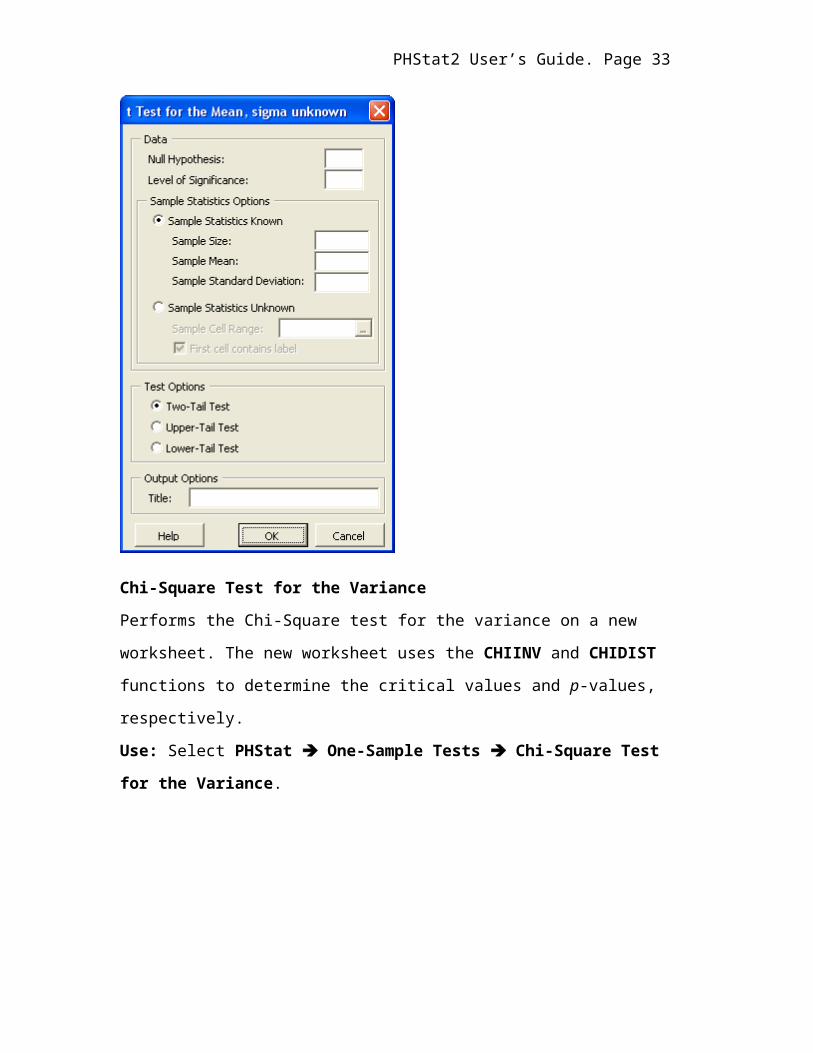
t Test for the Mean, sigma unknown
Performs the t test of hypothesis for the mean when sigma is unknown on a new
worksheet. The new worksheet uses the TINV and TDIST Functions to determine the
critical values and p-values, respectively.
Use: Select PHStat One-Sample Tests t Test for the Mean, sigma unknown.

PHStat2 User’s Guide. Page 25
Chi-Square Test for the Variance
Performs the Chi-Square test for the variance on a new worksheet. The new worksheet
uses the CHIINV and CHIDIST functions to determine the critical values and p-values,
respectively.
Use: Select PHStat One-Sample Tests Chi-Square Test for the Variance.
PHStat2 User’s Guide. Page 26
Z Test for the Proportion
Performs the Z test of hypothesis for the proportion on a new worksheet. The new
worksheet uses the NORMSINV and NORMSDIST functions to determine the critical
values and p-values, respectively.
Use: Select PHStat One-Sample Tests Z Test for the Proportion.

PHStat2 User’s Guide. Page 27
Two-Sample Tests Menu
t Test for Differences in Two Means
Performs the t test of hypothesis for differences between two means on a new worksheet.
The new worksheet uses the TINV and TDIST functions to determine the critical values
and p-values, respectively.
Use: Select PHStat Two-Sample Tests t Test for Differences in Two Means.
Z Test for Differences in Two Means
Performs the Z test of hypothesis for differences between two means on a new worksheet.
The new worksheet uses the NORMSINV and NORMSDIST functions to determine the
critical values and p-values, respectively.
Use: Select PHStat Two-Sample Tests Z Test for Differences in Two Means.

PHStat2 User’s Guide. Page 28
F Test for Differences in Two Variances
Performs the F test of hypothesis for differences between two variances on a new
worksheet. The new worksheet uses the FINV and FDIST functions to determine the
critical values and to calculate the p-value, respectively.
Use: Select PHStat Two-Sample Tests F Test for the Differences in Two
Variances.

PHStat2 User’s Guide. Page 29
Wilcoxon Rank Sum Test
Performs the Wilcoxon rank sum test for differences between two medians on a new
worksheet. The new worksheet uses the COUNTIF and SUMIF functions to determine
the sample size and sum of ranks for each population sample and uses the NORMSINV
and NORMSDIST functions to determine the critical values and p-values, respectively.
Use: Select PHStat Two-Sample Tests Wilcoxon Rank Sum Test.
PHStat2 User’s Guide. Page 30
Chi-Square Test for the Differences In Two Proportions
Generates a new worksheet that performs the Chi-square test of hypothesis for
differences between two proportions. The new worksheet contains an empty observed
frequencies table into which you enter the observed frequencies to complete the analysis
and uses the CHIINV and CHIDIST functions to determine the critical values and p-
value, respectively.
Use: Select PHStat Two-Sample Tests Chi-Square Test for Differences in Two
Proportions.
PHStat2 User’s Guide. Page 31
Z Test for Differences in Two Proportions
Performs the Z test of hypothesis for differences between two proportions on a new
worksheet. The new worksheet uses the NORMSINV and NORMSDIST functions to
determine the critical values and to calculate the p-value, respectively.
Use: Select PHStat Two-Sample Tests Z Test for the Difference in Two
Proportions.
McNemar Test
Generates a new worksheet that performs the McNemar test of hypothesis for differences
between two proportions (related samples). The worksheet generated contains an empty
observed frequencies table into which you enter the observed frequencies to complete the
analysis.
Use: Select PHStat Two-Sample Tests McNemar Test.

PHStat2 User’s Guide. Page 32
Multiple-Sample Tests
Chi-Square Test
Generates a new worksheet that performs the Chi-square test of hypothesis for
differences in the proportions among multiple independent populations. The new
worksheet contains an empty cross-classification, or contingency, table into which you
the observed frequencies to complete the analysis. The worksheet created uses the
CHIINV and CHIDIST functions to determine the critical values and p-value,
respectively.
Use: Select PHStat Multiple-Sample Tests Chi-Square Test.
PHStat2 User’s Guide. Page 33
Kruskal-Wallis Rank Test
Performs the Kruskal-Wallis rank sum test of hypothesis for differences between medians
from multiple independent sample groups on a new worksheet. The new worksheet uses
the CHIINV and CHIDIST functions to determine the critical values and p-values,
respectively.
Use: Select PHStat Multiple-Sample Tests Kruskal-Wallis Rank Test.
Levene Test
Performs the Levene Test for homogeneity of variance for multiple independent sample
groups on a new worksheet.
Use: Select PHStat Multiple-Sample Tests Levene Test.
Tukey-Kramer Procedure
Generates a new worksheet that performs the Tukey-Kramer procedure to determine
which means from multiple independent groups are significantly different. In the new
worksheet, you enter a Q statistic value to complete the analysis.

PHStat2 User’s Guide. Page 34
Use: Select PHStat Multiple-Sample Tests Tukey-Kramer Procedure.
Control Charts Menu
p Chart
Generates a p chart on a new chart sheet. This commands also generates two worksheets
that contain calculations for the control limits and data for the p chart.
Use: Select PHStat Control Charts p Chart.
R and XBar Chart
Generates an R chart on a new chart sheet and optionally generates an chart on a
separate chart sheet. This command also generates two worksheets that calculations for
the control limits and data for the chart(s).

PHStat2 User’s Guide. Page 35
Use: Select PHStat Control Charts R and XBar Chart.
Regression Menu
Simple Linear Regression
Generates a simple linear regression analysis on a new worksheet. This command
enhances and extends the results generated by the Data Analysis Regression tool and will
generate four additional sheets if all options are selected..
Use: Select PHStat Regression Simple Linear Regression.

PHStat2 User’s Guide. Page 36
Multiple Regression
Generates a simple linear regression analysis on a new worksheet. This command
enhances and extends the results generated by the Data Analysis Regression tool. This
command can generate many additional sheets, depending on the number of X variables
and the options selected.
Use: Select PHStat Regression Multiple Regression.

PHStat2 User’s Guide. Page 37
Best Subsets
Generates a best subsets multiple regression analysis on a new worksheet. This command
also procedure generates additional worksheets, each one containing the results of one of
the regression analyses considered.
Use: Select PHStat Regression Best Subsets.

PHStat2 User’s Guide. Page 38
Stepwise Regression
Generates a stepwise regression analysis on a new worksheet. This command also
generates a separate worksheet that contains the multiple regression analysis that uses all
of the X variables..
Use: Select PHStat Regression Stepwise Regression.
Utilities Menu
Fix Up Chart
Modifies a chart, eliminating common errors made by Microsoft Excel in generating the
chart.
Use: Select PHStat Utilities Fix Up Chart.
(This command does not use a dialog box.)

PHStat2 User’s Guide. Page 39
Remove Worksheet Cell Tints
Removes the light turquoise and light yellow cell tints used in worksheets created by
PHStat2.
Use: Select PHStat Utilities Remove Worksheet Cell Tints.
(This command does not use a dialog box.)
About PHStat…Displays information about the version of PHStat2 begin used.
Help for PHStatDisplays the PHStat2 help system window. Allows easy access to all help topics.