Photovoltaic deployment: from subsidies to a market-driven ... filephotovoltaic deployment : from...
40
HAL Id: hal-00749385 https://hal.archives-ouvertes.fr/hal-00749385 Submitted on 7 Nov 2012 HAL is a multi-disciplinary open access archive for the deposit and dissemination of sci- entific research documents, whether they are pub- lished or not. The documents may come from teaching and research institutions in France or abroad, or from public or private research centers. L’archive ouverte pluridisciplinaire HAL, est destinée au dépôt et à la diffusion de documents scientifiques de niveau recherche, publiés ou non, émanant des établissements d’enseignement et de recherche français ou étrangers, des laboratoires publics ou privés. Photovoltaic deployment: from subsidies to a market-driven growth: A panel econometrics approach Anna Créti, Léonide Michael Sinsin To cite this version: Anna Créti, Léonide Michael Sinsin. Photovoltaic deployment: from subsidies to a market-driven growth: A panel econometrics approach. cahier de recherche 2012-32. 2012. <hal-00749385>
Transcript of Photovoltaic deployment: from subsidies to a market-driven ... filephotovoltaic deployment : from...

HAL Id: hal-00749385https://hal.archives-ouvertes.fr/hal-00749385
Submitted on 7 Nov 2012
HAL is a multi-disciplinary open accessarchive for the deposit and dissemination of sci-entific research documents, whether they are pub-lished or not. The documents may come fromteaching and research institutions in France orabroad, or from public or private research centers.
L’archive ouverte pluridisciplinaire HAL, estdestinée au dépôt et à la diffusion de documentsscientifiques de niveau recherche, publiés ou non,émanant des établissements d’enseignement et derecherche français ou étrangers, des laboratoirespublics ou privés.
Photovoltaic deployment: from subsidies to amarket-driven growth: A panel econometrics approach
Anna Créti, Léonide Michael Sinsin
To cite this version:Anna Créti, Léonide Michael Sinsin. Photovoltaic deployment: from subsidies to a market-drivengrowth: A panel econometrics approach. cahier de recherche 2012-32. 2012. <hal-00749385>

PHOTOVOLTAIC DEPLOYMENT : FROM SUBSIDIES TO A MARKET-DRIVEN GROWTH : A PANEL ECONOMETRICS APPROACH
Anna CRETI
Léonide Michael SINSIN
Cahier n° 2012-32
ECOLE POLYTECHNIQUE CENTRE NATIONAL DE LA RECHERCHE SCIENTIFIQUE
DEPARTEMENT D'ECONOMIE Route de Saclay
91128 PALAISEAU CEDEX (33) 1 69333033
http://www.economie.polytechnique.edu/ mailto:[email protected]

∗∗


0
1
2
3
4
5
6
7
8
9
0.6 0.7 0.8 0.9 1.0 1.1 1.2 1.3 1.4 1.5
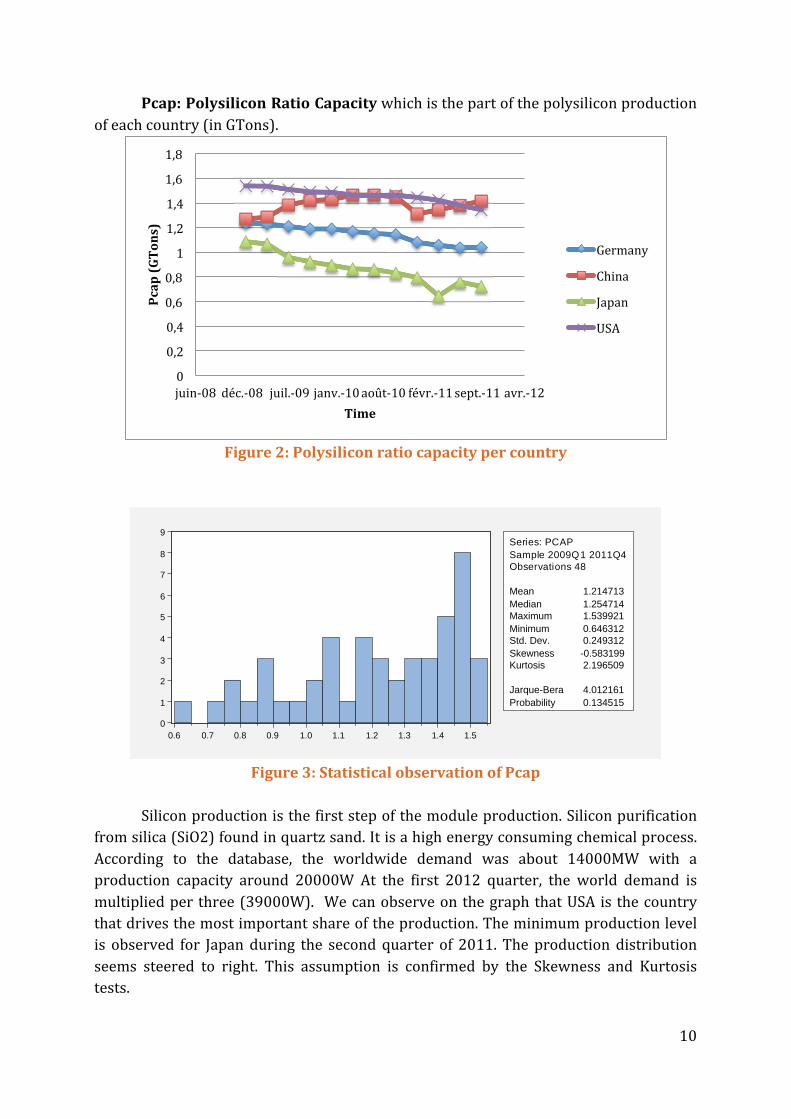
Series: PCAPSample 2009Q1 2011Q4Observations 48
Mean 1.214713Median 1.254714Maximum 1.539921Minimum 0.646312Std. Dev. 0.249312Skewness 0.583199Kurtosis 2.196509
JarqueBera 4.012161Probability 0.134515
0
2
4
6
8
10
12
0.0 0.2 0.4 0.6 0.8 1.0 1.2 1.4 1.6
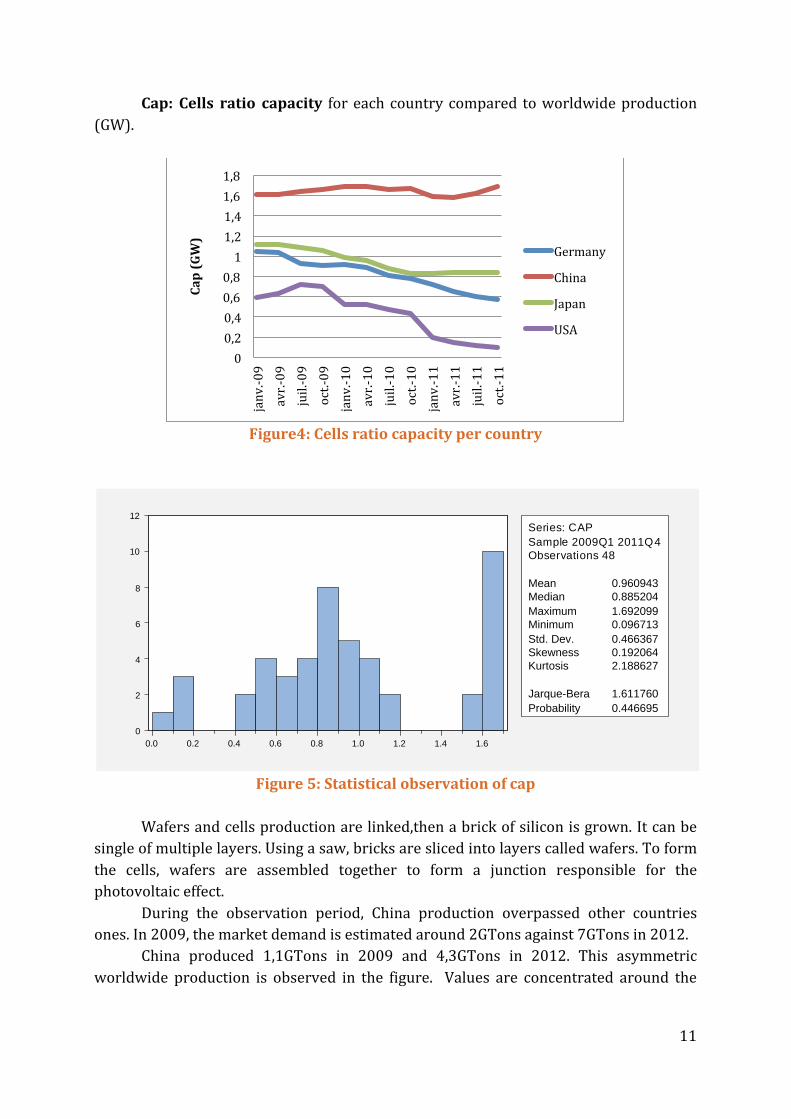
Series: CAPSample 2009Q1 2011Q4Observations 48
Mean 0.960943Median 0.885204Maximum 1.692099Minimum 0.096713Std. Dev. 0.466367Skewness 0.192064Kurtosis 2.188627
JarqueBera 1.611760Probability 0.446695
0
2
4
6
8
10
12
14
1.8 2.0 2.2 2.4 2.6 2.8 3.0 3.2 3.4 3.6
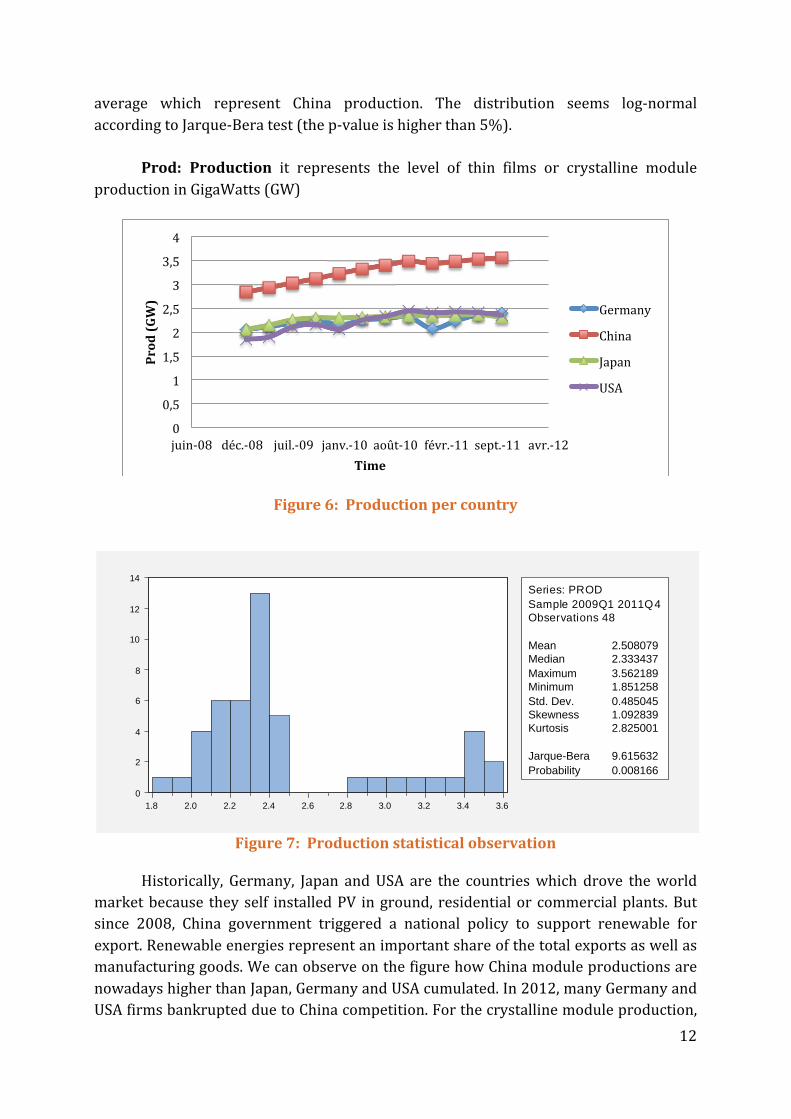
Series: PRODSample 2009Q1 2011Q4Observations 48
Mean 2.508079Median 2.333437Maximum 3.562189Minimum 1.851258Std. Dev. 0.485045Skewness 1.092839Kurtosis 2.825001
JarqueBera 9.615632Probability 0.008166
0
1
2
3
4
5
6
7
8
9
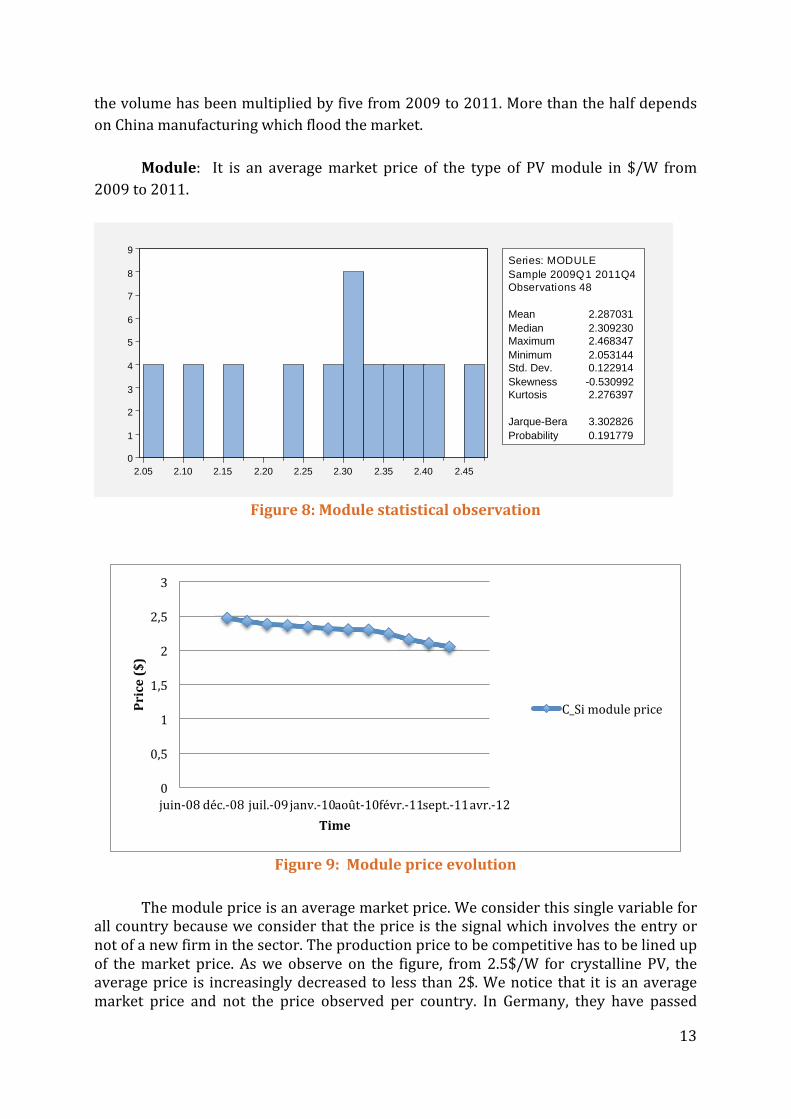
2.05 2.10 2.15 2.20 2.25 2.30 2.35 2.40 2.45
Series: MODULESample 2009Q1 2011Q4Observations 48
Mean 2.287031Median 2.309230Maximum 2.468347Minimum 2.053144Std. Dev. 0.122914Skewness 0.530992Kurtosis 2.276397
JarqueBera 3.302826Probability 0.191779

0.4
0.5
0.6
0.7
0.8
0.9
1.0
1.1
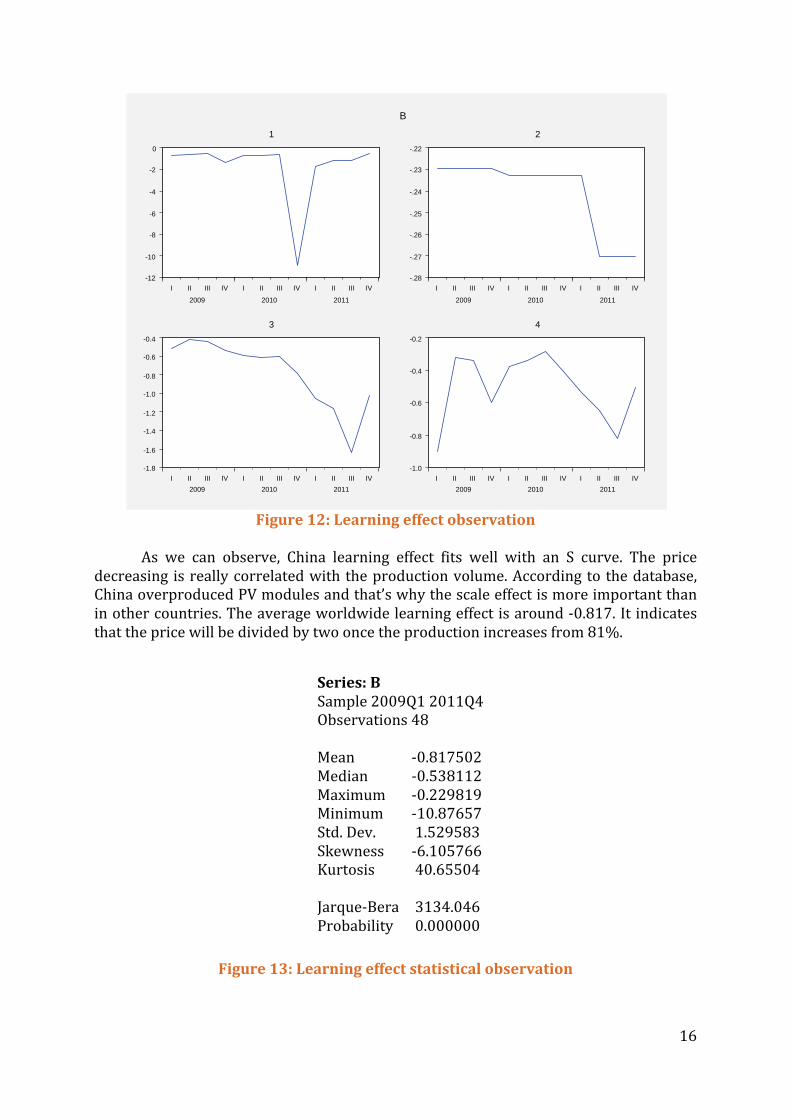
I II III IV I II III IV I II III IV
2009 2010 2011
1
1.64
1.68
1.72
1.76
1.80
I II III IV I II III IV I II III IV
2009 2010 2011
2
0.5
0.6
0.7
0.8
0.9
1.0
I II III IV I II III IV I II III IV
2009 2010 2011
3
.45
.50
.55
.60
.65
.70
.75
.80
I II III IV I II III IV I II III IV
2009 2010 2011
4
MCAP
0
2
4
6
8
10
12
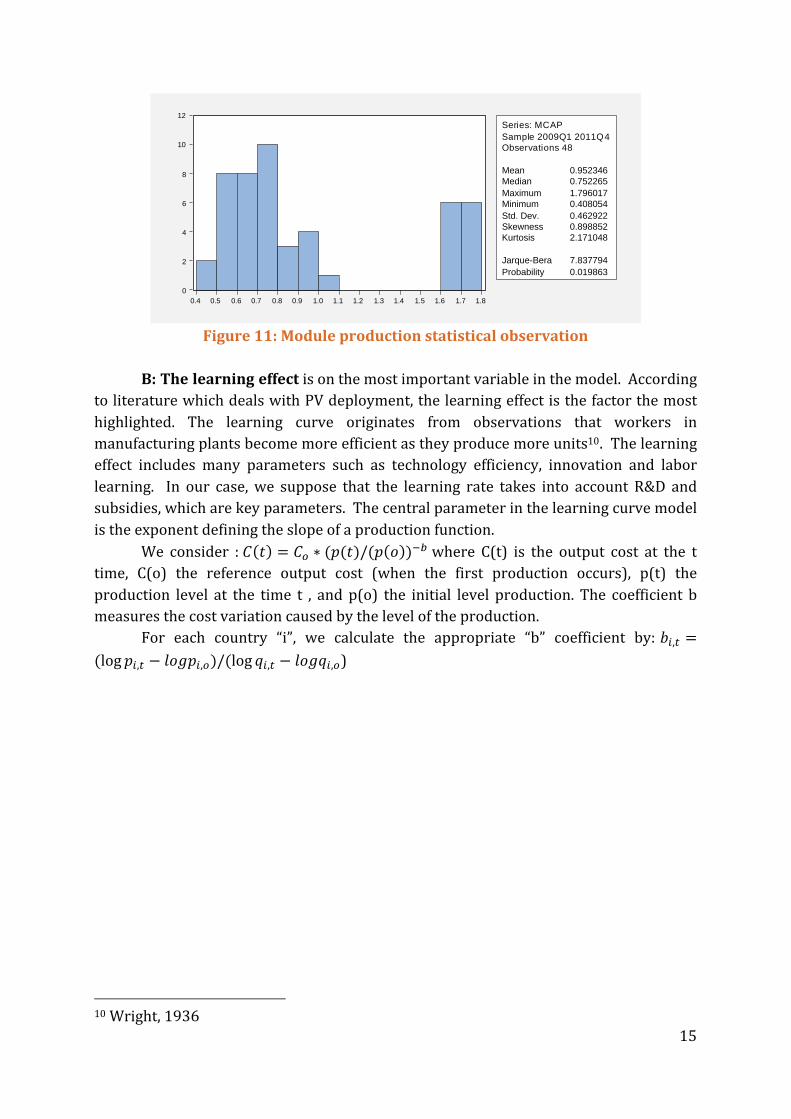
0.4 0.5 0.6 0.7 0.8 0.9 1.0 1.1 1.2 1.3 1.4 1.5 1.6 1.7 1.8
Series: MCAPSample 2009Q1 2011Q4Observations 48
Mean 0.952346Median 0.752265Maximum 1.796017Minimum 0.408054Std. Dev. 0.462922Skewness 0.898852Kurtosis 2.171048
JarqueBera 7.837794Probability 0.019863
12
10
8
6
4
2
0
I II III IV I II III IV I II III IV
2009 2010 2011
1
.28
.27
.26
.25
.24
.23
.22
I II III IV I II III IV I II III IV
2009 2010 2011
2
1.8
1.6
1.4
1.2
1.0
0.8
0.6
0.4
I II III IV I II III IV I II III IV
2009 2010 2011
3
1.0
0.8
0.6
0.4
0.2
I II III IV I II III IV I II III IV
2009 2010 2011
4
B


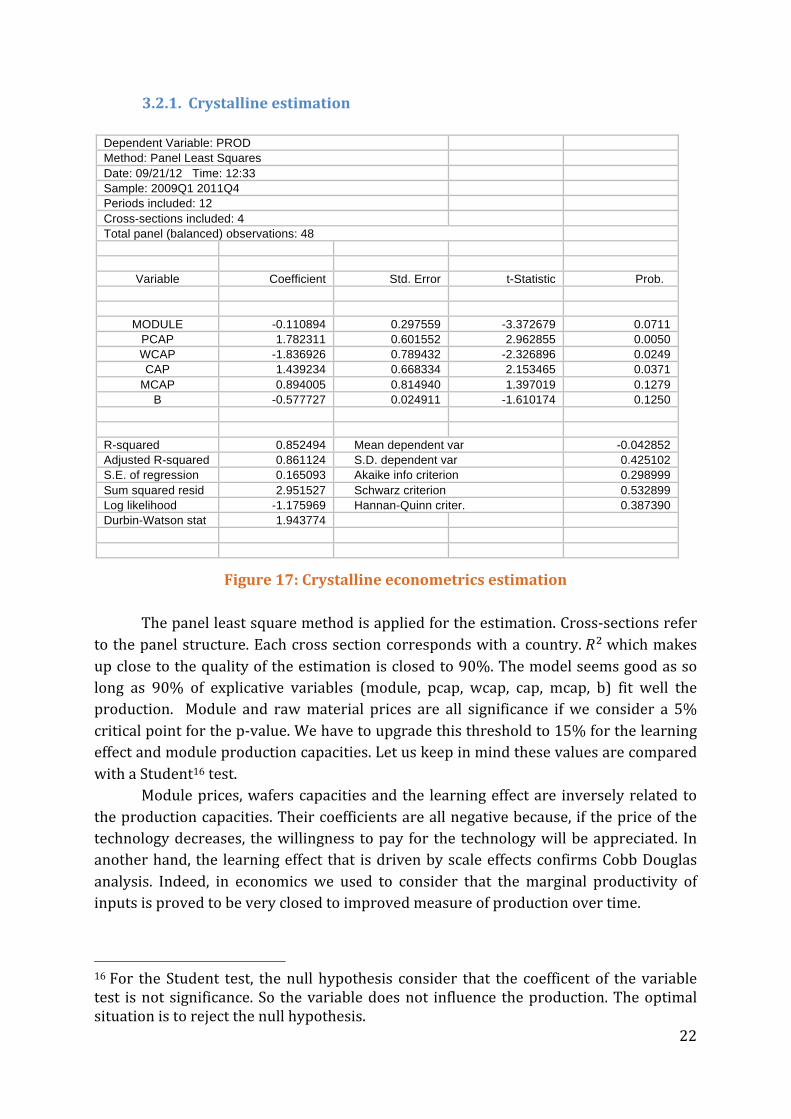
Dependent Variable: PROD Method: Panel Least Squares Date: 09/21/12 Time: 12:33 Sample: 2009Q1 2011Q4 Periods included: 12 Crosssections included: 4 Total panel (balanced) observations: 48
Variable Coefficient Std. Error tStatistic Prob.
MODULE 0.110894 0.297559 3.372679 0.0711 PCAP 1.782311 0.601552 2.962855 0.0050 WCAP 1.836926 0.789432 2.326896 0.0249 CAP 1.439234 0.668334 2.153465 0.0371
MCAP 0.894005 0.814940 1.397019 0.1279 B 0.577727 0.024911 1.610174 0.1250
Rsquared 0.852494 Mean dependent var 0.042852 Adjusted Rsquared 0.861124 S.D. dependent var 0.425102 S.E. of regression 0.165093 Akaike info criterion 0.298999 Sum squared resid 2.951527 Schwarz criterion 0.532899 Log likelihood 1.175969 HannanQuinn criter. 0.387390 DurbinWatson stat 1.943774


Dependent Variable: RES2^2 Method: Panel Least Squares Date: 08/20/12 Time: 11:27 Sample: 2009Q1 2011Q4 Periods included: 12 Cross-sections included: 4 Total panel (balanced) observations: 48 Variable Coefficient Std. Error t-Statistic Prob. MCAP^2 -0.000652 0.006362 -0.102553 0.9188 B^2 9.55E-06 4.30E-05 0.222166 0.8252 MODULE^2 0.014192 0.030488 0.465487 0.6438 R-squared -0.664139 Mean dependent var 0.003559 Adjusted R-squared -0.738100 S.D. dependent var 0.004360 S.E. of regression 0.005749 Akaike info criterion -7.419214 Sum squared resid 0.001487 Schwarz criterion -7.302264 Log likelihood 181.0611 Hannan-Quinn criter. -7.375018 Durbin-Watson stat 1.995618
Dependent Variable: RES2 Method: Panel Least Squares Date: 08/20/12 Time: 11:59 Sample (adjusted): 2009Q2 2011Q4 Periods included: 11 Cross-sections included: 4 Total panel (balanced) observations: 44
Variable Coefficient Std. Error t-Statistic Prob. C -0.001323 0.008406 -0.157449 0.8756
RES2(-1) 0.512306 0.145489 3.521272 0.0010 R-squared 0.227932 Mean dependent var 0.002024
Adjusted R-squared 0.209549 S.D. dependent var 0.062310 S.E. of regression 0.055399 Akaike info criterion -2.904139 Sum squared resid 0.128898 Schwarz criterion -2.823039 Log likelihood 65.89105 Hannan-Quinn criter. -2.874063 F-statistic 12.39935 Durbin-Watson stat 1.891035 Prob(F-statistic) 0.001049
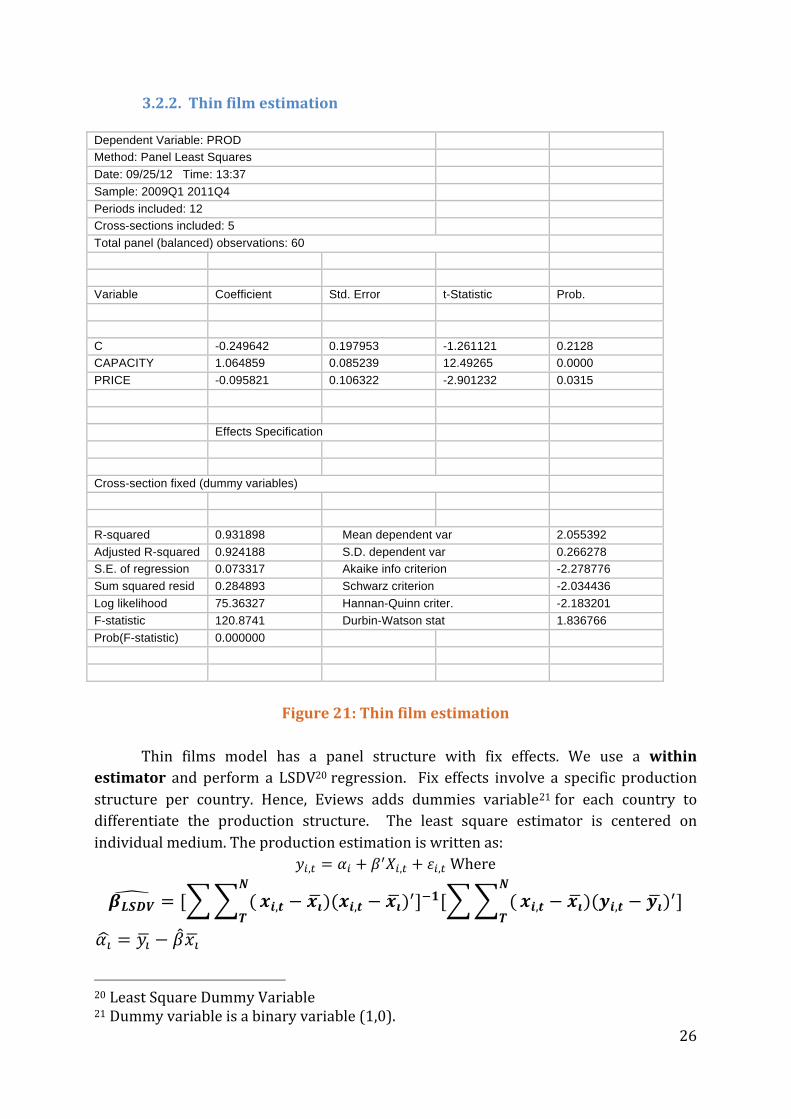
Dependent Variable: PROD Method: Panel Least Squares Date: 09/25/12 Time: 13:37 Sample: 2009Q1 2011Q4 Periods included: 12 Crosssections included: 5 Total panel (balanced) observations: 60 Variable Coefficient Std. Error tStatistic Prob. C 0.249642 0.197953 1.261121 0.2128 CAPACITY 1.064859 0.085239 12.49265 0.0000 PRICE 0.095821 0.106322 2.901232 0.0315 Effects Specification Crosssection fixed (dummy variables) Rsquared 0.931898 Mean dependent var 2.055392 Adjusted Rsquared 0.924188 S.D. dependent var 0.266278 S.E. of regression 0.073317 Akaike info criterion 2.278776 Sum squared resid 0.284893 Schwarz criterion 2.034436 Log likelihood 75.36327 HannanQuinn criter. 2.183201 Fstatistic 120.8741 DurbinWatson stat 1.836766 Prob(Fstatistic) 0.000000