Photosynthetic Rates in Mangrovesiicbe.org/upload/3865C0115015.pdf · Fig. 1 Recalculating the...
5
Abstract—Generally mangrove forests have high productivity and provide habitat for many species. Pulse Amplitude Modulation fluorometry (PAM) methods are a revolutionary way of measuring photosynthesis in plants based on PSII fluorescence. Mangroves growing in Paklok (Phuket) such as Avicennia alba (L.), Rhizophora mucronata and Bruguiera cylindrica are all C3 plants. Photosynthesis of common mangroves growing in the Phuket area was characterized using PAM (Pulse Amplitude Modulation) Fluorometry (Blue diode based). We have found that Rhizophora sp. has photosynthetic rates (Pmax) of ≈ 102 µmol mgChl a -1 h -1 . Avicennia has higher photosynthetic rates (Pmax) of ≈ 183 µmol mg Chl a -1 h -1 . Bruguiera sp. has a relatively low Pgmax ≈ 51 µmol mgChl a -1 h -1 . Photosynthetic efficiency (α) and non-photochemical quenching were also measured. The results of the photosynthesis studies will be used to make it possible to estimate carbon-fixation of mangroves. Estimates of photosynthesis will be valuable in assessing the productivity of mangroves stands. Keywords—Light Curves, Mangroves, Photosynthesis, Pulse Amplitude Modulation fluorometry (PAM). I. INTRODUCTION OASTAL environments refer to various kinds of natural habitats such as muddy areas, sandy substrates, rocky beaches, mangrove forest, submerged aquatic vegetation and coral reefs. They provide food, shelter, and breeding grounds for terrestrial and marine species [1]. It is important to be able to measure the level of environment stress on mangrove plants. Measurement of photosystem II fluorescence is a convenient way of estimating photosynthetic activity of plants in particular stress physiology. Basically plant cells using Chlorophyll a as their primary photosynthetic pigment strongly absorb light at the blue (430 nm) and red (680 nm) peaks of in vivo Chlorophyll a absorption. Some of this absorbed light is used to power the light reactions of photosynthesis and some is re-emitted as waste heat and some is re-emitted as fluorescent light with a peak at about 730 nm. Hence, plants appear bright red in the Peerapat Wongpattanakul 1 is a master student of Faculty of Technology and Environment, Prince of Songkla University, Phuket campus, Phuket, CO 83120 Thailand (corresponding author’s phone: +66944927073 e-mail: [email protected] ). Raymond J. Ritchie 2 is with Technology and Environment, Prince of Songkla University-Phuket campus, Phuket, CO 83120 Thailand (e-mail: [email protected]). Werapong Koedsin 3 is with Technology and Environment, Prince of Songkla University-Phuket campus, Phuket, CO 83120 Thailand, (e-mail: [email protected]). Chanida Suwanprasit 4 is now with the Department of Geography, Chiang Mai University, Chiang Mai, CO 50200 Thailand. (e-mail: [email protected]). Far-Red/NIR part of the spectrum (> 700 nm to 800 nm). This infrared glow of vegetation is used as a basis for monitoring vegetation using satellite and aerial photometric methods. Pulse Amplitude Modulation fluorometry (PAM) methods are a revolutionary way of measuring photosynthesis in plants based on PSII fluorescence [2,3,4] which can be used to monitor photosynthetic activity of a wide variety of photosynthetic organisms including green algae such as Chlorella and diatoms [4,5] as well as vascular plants such as orchids, pineapple and water lilies [6,7]. Mangroves such as Rhizophora sp., Avicennia sp., Bruguiera sp. and the mangrove Palm (Nipa fructans) are all C3 plants and so interpretation of PAM measurements on these plants should be straightforward. Photosynthetic rates, as measured by leaf stomatal conductance and leaf chlorophyll fluorescence induction, were tested as indicators of salinity stress in seedlings of the red mangrove, Rhizophora mangle, grown under five different salinity levels: 0, 15, 30, 45, and 60 parts per thousand [8]. Photosynthetic gas exchange (measured by stomatal conductance), as well as the light reaction of photosynthesis (measured by chlorophyll fluorescence) were found to decrease as salinity increased. The use of leaf stomatal conductance and chlorophyll fluorescence as a measure of photosynthesis has allowed rapid and reliable quantification of the known stressor, salinity, in seedlings of R. mangle. These non-destructive in-vivo techniques were found to be rapid and reliable for monitoring photosynthetic stress, an important physiological parameter determining survival and growth of mangrove plants. PAM methods are the most rapid techniques for monitoring photosynthesis in forestry management and mangrove restoration projects to assess plant condition [9]. II. METHODOLOGY Suitable mangrove areas are readily accessible on the eastern coast of Phuket, Thailand. We selected a seagrass and mangrove reserve on the East Coast as a suitable field site: located at Paklok, Phuket, Thailand (8 o 0’49” N, 98 o 24’33”E). We have characterised photosynthesis of three mangrove species growing in the Phuket area using PAM (Pulse Amplitude Modulation) Fluorometry (Blue diode based). PAM Fluorometry can measure photosynthetic quantum yield (Y), electron transport rate (ETR), optimum light (Eopt), maximum gross photosynthesis (Pg max ), photosynthetic efficiency (α) and photochemical and non-photochemical quenching (qN and NPQ) characteristics of the plants. Light saturation curve measurements were made on the adaxial surfaces with a Junior-PAM portable chlorophyll fluorometer Peerapat Wongpattanakul 1 , Raymond J. Ritchie 2 , Werapong Koedsin 3 , and Chanida Suwanprasit 4 Photosynthetic Rates in Mangroves C International Conference on Plant, Marine and Environmental Sciences (PMES-2015) Jan. 1-2, 2015 Kuala Lumpur (Malaysia) http://dx.doi.org/10.15242/IICBE.C0115015 57
Transcript of Photosynthetic Rates in Mangrovesiicbe.org/upload/3865C0115015.pdf · Fig. 1 Recalculating the...
Abstract—Generally mangrove forests have high productivity
and provide habitat for many species. Pulse Amplitude Modulation
fluorometry (PAM) methods are a revolutionary way of measuring
photosynthesis in plants based on PSII fluorescence. Mangroves
growing in Paklok (Phuket) such as Avicennia alba (L.), Rhizophora
mucronata and Bruguiera cylindrica are all C3 plants.
Photosynthesis of common mangroves growing in the Phuket area
was characterized using PAM (Pulse Amplitude Modulation)
Fluorometry (Blue diode based). We have found that Rhizophora sp.
has photosynthetic rates (Pmax) of ≈ 102 µmol mgChl a-1h-1.
Avicennia has higher photosynthetic rates (Pmax) of ≈ 183 µmol mg
Chl a-1 h-1. Bruguiera sp. has a relatively low Pgmax ≈ 51 µmol
mgChl a-1h-1. Photosynthetic efficiency (α) and non-photochemical
quenching were also measured. The results of the photosynthesis
studies will be used to make it possible to estimate carbon-fixation
of mangroves. Estimates of photosynthesis will be valuable in
assessing the productivity of mangroves stands.
Keywords—Light Curves, Mangroves, Photosynthesis, Pulse
Amplitude Modulation fluorometry (PAM).
I. INTRODUCTION
OASTAL environments refer to various kinds of natural
habitats such as muddy areas, sandy substrates, rocky
beaches, mangrove forest, submerged aquatic vegetation and
coral reefs. They provide food, shelter, and breeding grounds
for terrestrial and marine species [1].
It is important to be able to measure the level of
environment stress on mangrove plants. Measurement of
photosystem II fluorescence is a convenient way of estimating
photosynthetic activity of plants in particular stress
physiology. Basically plant cells using Chlorophyll a as their
primary photosynthetic pigment strongly absorb light at the
blue (430 nm) and red (680 nm) peaks of in vivo Chlorophyll
a absorption. Some of this absorbed light is used to power the
light reactions of photosynthesis and some is re-emitted as
waste heat and some is re-emitted as fluorescent light with a
peak at about 730 nm. Hence, plants appear bright red in the
Peerapat Wongpattanakul
1 is a master student of Faculty of Technology and
Environment, Prince of Songkla University, Phuket campus, Phuket, CO 83120
Thailand (corresponding author’s phone: +66944927073 e-mail:
Raymond J. Ritchie2 is with Technology and Environment, Prince of Songkla
University-Phuket campus, Phuket, CO 83120 Thailand (e-mail:
Werapong Koedsin3 is with Technology and Environment, Prince of Songkla
University-Phuket campus, Phuket, CO 83120 Thailand, (e-mail:
Chanida Suwanprasit4 is now with the Department of Geography, Chiang
Mai University, Chiang Mai, CO 50200 Thailand. (e-mail:
Far-Red/NIR part of the spectrum (> 700 nm to 800 nm).
This infrared glow of vegetation is used as a basis for
monitoring vegetation using satellite and aerial photometric
methods. Pulse Amplitude Modulation fluorometry (PAM)
methods are a revolutionary way of measuring photosynthesis
in plants based on PSII fluorescence [2,3,4] which can be
used to monitor photosynthetic activity of a wide variety of
photosynthetic organisms including green algae such as
Chlorella and diatoms [4,5] as well as vascular plants such as
orchids, pineapple and water lilies [6,7].
Mangroves such as Rhizophora sp., Avicennia sp.,
Bruguiera sp. and the mangrove Palm (Nipa fructans) are all
C3 plants and so interpretation of PAM measurements on
these plants should be straightforward. Photosynthetic rates,
as measured by leaf stomatal conductance and leaf
chlorophyll fluorescence induction, were tested as indicators
of salinity stress in seedlings of the red mangrove,
Rhizophora mangle, grown under five different salinity
levels: 0, 15, 30, 45, and 60 parts per thousand [8].
Photosynthetic gas exchange (measured by stomatal
conductance), as well as the light reaction of photosynthesis
(measured by chlorophyll fluorescence) were found to
decrease as salinity increased. The use of leaf stomatal
conductance and chlorophyll fluorescence as a measure of
photosynthesis has allowed rapid and reliable quantification
of the known stressor, salinity, in seedlings of R. mangle.
These non-destructive in-vivo techniques were found to be
rapid and reliable for monitoring photosynthetic stress, an
important physiological parameter determining survival and
growth of mangrove plants. PAM methods are the most rapid
techniques for monitoring photosynthesis in forestry
management and mangrove restoration projects to assess
plant condition [9].
II. METHODOLOGY
Suitable mangrove areas are readily accessible on the
eastern coast of Phuket, Thailand. We selected a seagrass and
mangrove reserve on the East Coast as a suitable field site:
located at Paklok, Phuket, Thailand (8o0’49” N, 98o24’33”E).
We have characterised photosynthesis of three mangrove
species growing in the Phuket area using PAM (Pulse
Amplitude Modulation) Fluorometry (Blue diode based). PAM Fluorometry can measure photosynthetic quantum yield
(Y), electron transport rate (ETR), optimum light (Eopt),
maximum gross photosynthesis (Pgmax), photosynthetic
efficiency (α) and photochemical and non-photochemical
quenching (qN and NPQ) characteristics of the plants. Light
saturation curve measurements were made on the adaxial
surfaces with a Junior-PAM portable chlorophyll fluorometer
Peerapat Wongpattanakul1, Raymond J. Ritchie
2, Werapong Koedsin
3, and Chanida Suwanprasit
4
Photosynthetic Rates in Mangroves
C
International Conference on Plant, Marine and Environmental Sciences (PMES-2015) Jan. 1-2, 2015 Kuala Lumpur (Malaysia)
http://dx.doi.org/10.15242/IICBE.C0115015 57
(Gademann Instruments, Wurzburg, Germany) fitted with a
1.5-mm-diameter optic fiber and a blue diode (485-640 nm)
light source. PAM parameters (Y, rETR, qN, and NPQ) were
calculated with the WinControl software (ver. 2.13) [10].
Quantum yield of photosystem II (PSII) electron transport (Y
or Φ) s calculated as (Fm0 – F)/Fm0. In this research we
sampled a total of 16 replicates in the laboratory (seedlings in
sea water). We studied three mangrove species: Rhizophora
mucronata, Avicennia alba and Bruguiera cylindrica. We
found that all three species were very sensitive to wounding
and leaves rapidly shut down if cut from the plants. Leaves
still attached to the plants were used in this study.
F is the light-adapted fluorescence when a saturating light
pulse of about 2000 to 2500 (or higher) µmol m–2 s–1 PPFD
for 700 ms duration is superimposed on the prevailing
environmental irradiance level [10]. Electron transport rate
(ETR) through PSII can be calculated as 0.5×0.84×PPFD×Y
assuming that 84% of incidental light is absorbed by leaves
(Absorptance, Abt) [11] and that photons are equally
distributed between PSII and PSI (0.5). We have a RAT
(Reflectance/Absorptance/Transmission) machine which can
experimentally measure Absorptance and so we were able to
use actual Abt values rather than the assumed value of 0.84
[12]. Absorptances of all three species in blue light are very
much higher than 0.84.
Since four electrons move through PSII for each O2
produced the conversion factor for Pg from ETR is to divide
by 4. The ETR of plants is calculated on a surface area basis
(mol m-2 s-1 or mol m-2 h-1). If the Chlorophyll a content of
the leaves is also known it is possible to recalculate ETR and
hence Pg as mol mgChl a-1 h-1. Chl a was determined on
disks of mangrove leaf (97 mm) cut with a cork borer, then
extracted in hot ethanol and Chl a estimated by spectroscopy
[13].
Plots of Photosynthesis vs. irradiance follow a
saturation/inhibition curve called the Waiting-in-Line (W-in-
L) model. A form of the W-in-L saturation model suitable for
modelling photosynthesis with experimentally determinable
constants that are easily recognisable on a graphical
representation of the data is [4,5]
EoptE
opt
eE
EPgPg /1max
(1)
where, Pg is gross photosynthesis,
Pgmax is the maximum gross photosynthesis,
E is the Irradiance (µmol m-2 s-1 400 – 700 nm
PPFD),
Eopt is the optimum irradiance.
Non-Photochemical quenching measured as qN and
NPQ increases as irradiance increases and can usually be
described as a simple exponential saturation curve [4,5]. Thus
for NPQ,
ENPQk
maxe1NPQNPQ (2)
where, NPQ is non-photochemical quenching,
kNPQ is a constant,
E is the irradiaance.
III. RESULTS AND DISCUSSION
Table 1 shows to the absorptances of mangrove leaves
measured using the RAT machine (blue light and white
light). The absorptances for blue light were used for the ETR
determinations using the PAM machine because the Junior
PAM uses a blue-diode light source. In all three mangroves
the absorptances are about 99% in the case of blue light and
so the default value of 84% used in most PAM studies of
photosynthesis seriously underestimates photosynthesis in
mangroves. For example, ETR estimates calculated on
Avicennia using the PAM machine in default mode needed to
be corrected by multiplying by a factor of 99.7/84 to obtain
the true ETR. Some types of PAM machine use a white light
source (quartz halogen). The absorptances of Avicennia and
Rhizophora in white light is also well above the default value
of 84%. The absorptance in white light for Bruguiera
however is close to the default value. The RAT results show
that it is important to be able to measure absorptances of
leaves experimentally rather than use default values [12].
TABLE I
TABLE OF ABSORPTANCE OF MANGROVE
Photosynthesis of Avicennia sp. on a leaf surface area basis
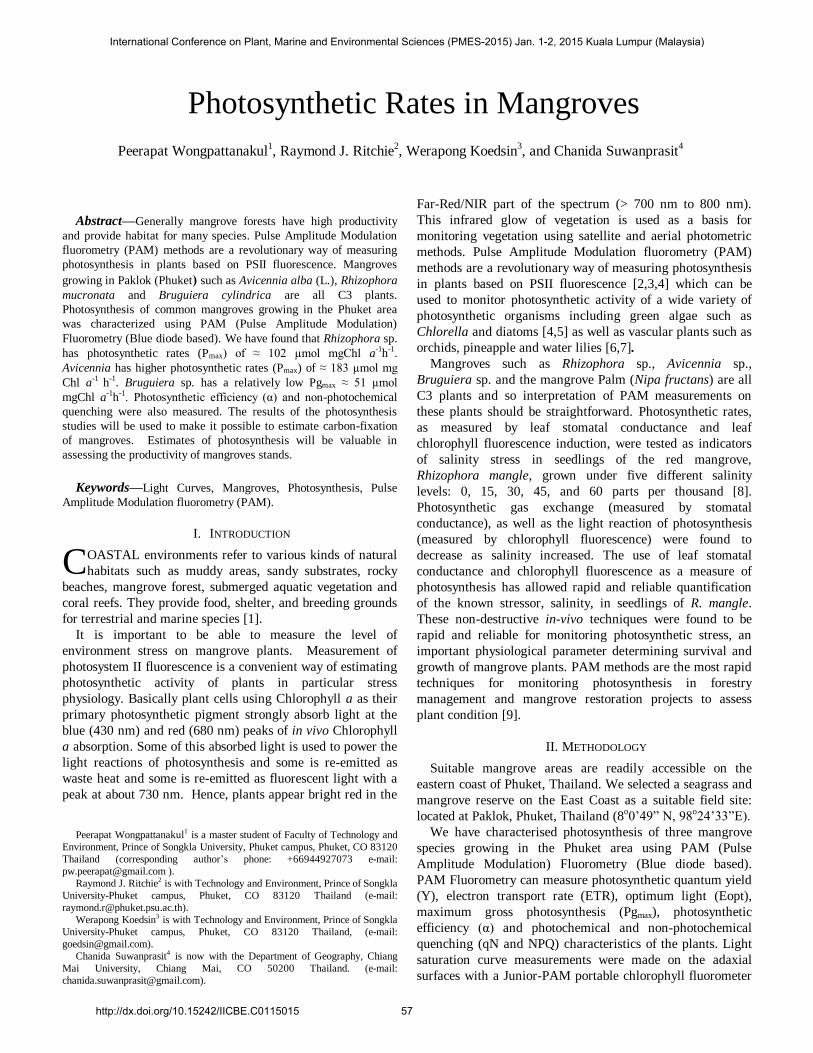
has an Optimum Irradiance of about 859 ± 102 µmol photons
m-2 s-1 (Fig. 1) This about 41% of full sunlight. This is
typical of a “sun plant” and Maximum photosynthesis (Pgmax)
is about 56.97 ± 4.08µmol m-2 s-1. This is a high value for a
higher plant. The maximum photosynthetic Efficiency
(Alpha, α) is about 0.180 ± 0.0250. This means that at zero
irradiance (the instantaneous slope of Equation 1 at zero
irradiance) 18% of photons are used for photosynthesis. The
fit to data is very good (r = 0.714) and the relative errors of
the fitted parameters are low (RE ≈ ±4.6 to 7.6%).
Species Absorptance (%)
Blue light White light
Avicennia alba 99.7 ± 0.1 93.4 ± 0.5
Rhizophora mucronata 99.2 ± 0.3 94.1 ± 1.0
Bruguiera cylindrica 98.8 ± 0.6 85.5 ± 0.8
International Conference on Plant, Marine and Environmental Sciences (PMES-2015) Jan. 1-2, 2015 Kuala Lumpur (Malaysia)
http://dx.doi.org/10.15242/IICBE.C0115015 58
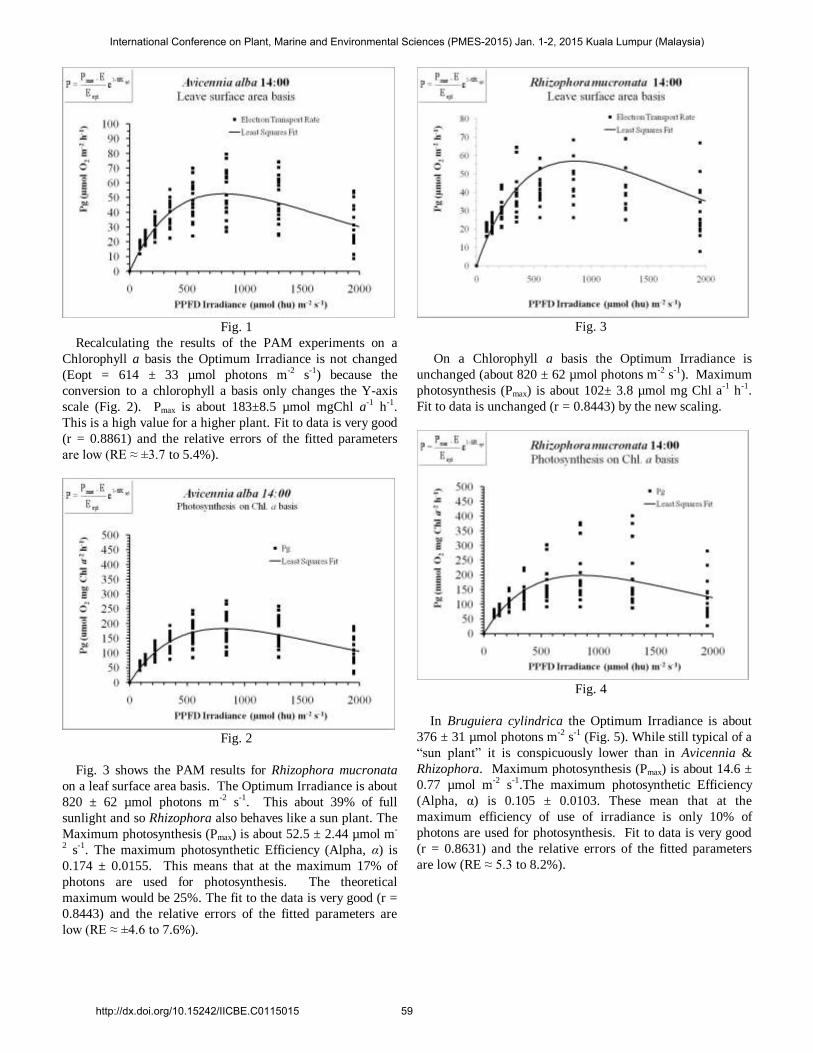
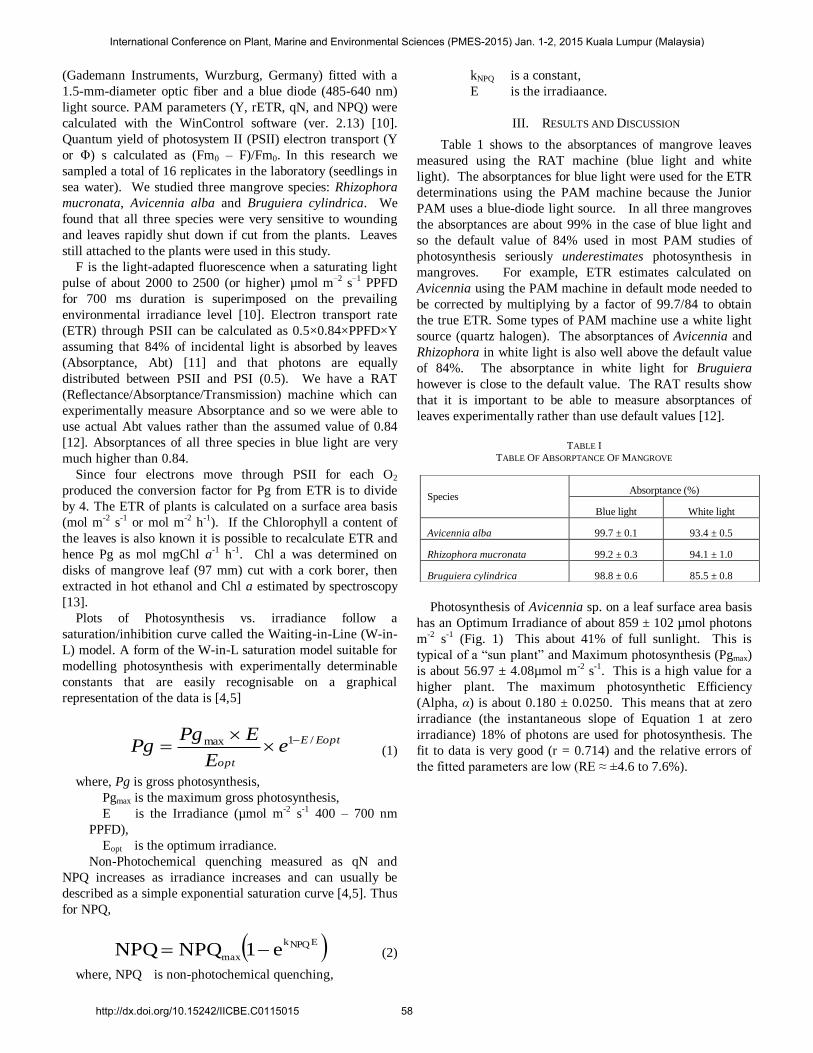
Fig. 1
Recalculating the results of the PAM experiments on a
Chlorophyll a basis the Optimum Irradiance is not changed
(Eopt = 614 ± 33 µmol photons m-2 s-1) because the
conversion to a chlorophyll a basis only changes the Y-axis
scale (Fig. 2). Pmax is about 183±8.5 µmol mgChl a-1 h-1.
This is a high value for a higher plant. Fit to data is very good
(r = 0.8861) and the relative errors of the fitted parameters
are low (RE ≈ ±3.7 to 5.4%).
Fig. 2
Fig. 3 shows the PAM results for Rhizophora mucronata
on a leaf surface area basis. The Optimum Irradiance is about
820 ± 62 µmol photons m-2 s-1. This about 39% of full
sunlight and so Rhizophora also behaves like a sun plant. The
Maximum photosynthesis (Pmax) is about 52.5 ± 2.44 µmol m-
2 s-1. The maximum photosynthetic Efficiency (Alpha, α) is
0.174 ± 0.0155. This means that at the maximum 17% of
photons are used for photosynthesis. The theoretical
maximum would be 25%. The fit to the data is very good (r =
0.8443) and the relative errors of the fitted parameters are
low (RE ≈ ±4.6 to 7.6%).
Fig. 3
On a Chlorophyll a basis the Optimum Irradiance is
unchanged (about 820 ± 62 µmol photons m-2 s-1). Maximum
photosynthesis (Pmax) is about 102± 3.8 µmol mg Chl a-1 h-1.
Fit to data is unchanged (r = 0.8443) by the new scaling.
Fig. 4
In Bruguiera cylindrica the Optimum Irradiance is about
376 ± 31 µmol photons m-2 s-1 (Fig. 5). While still typical of a
“sun plant” it is conspicuously lower than in Avicennia &
Rhizophora. Maximum photosynthesis (Pmax) is about 14.6 ±
0.77 µmol m-2 s-1.The maximum photosynthetic Efficiency
(Alpha, α) is 0.105 ± 0.0103. These mean that at the
maximum efficiency of use of irradiance is only 10% of
photons are used for photosynthesis. Fit to data is very good
(r = 0.8631) and the relative errors of the fitted parameters
are low (RE ≈ 5.3 to 8.2%).
International Conference on Plant, Marine and Environmental Sciences (PMES-2015) Jan. 1-2, 2015 Kuala Lumpur (Malaysia)
http://dx.doi.org/10.15242/IICBE.C0115015 59
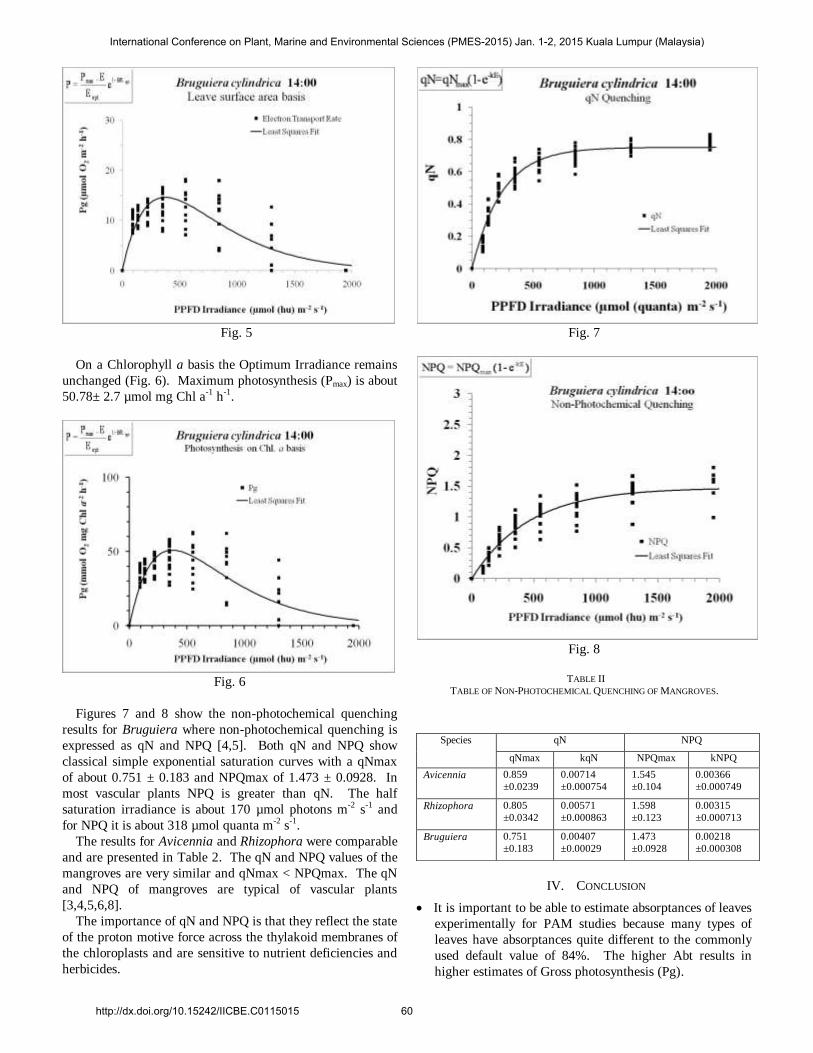
Fig. 5
On a Chlorophyll a basis the Optimum Irradiance remains
unchanged (Fig. 6). Maximum photosynthesis (Pmax) is about
50.78± 2.7 µmol mg Chl a-1 h-1.
Fig. 6
Figures 7 and 8 show the non-photochemical quenching
results for Bruguiera where non-photochemical quenching is
expressed as qN and NPQ [4,5]. Both qN and NPQ show
classical simple exponential saturation curves with a qNmax
of about 0.751 ± 0.183 and NPQmax of 1.473 ± 0.0928. In
most vascular plants NPQ is greater than qN. The half
saturation irradiance is about 170 µmol photons m-2 s-1 and
for NPQ it is about 318 µmol quanta m-2 s-1.
The results for Avicennia and Rhizophora were comparable
and are presented in Table 2. The qN and NPQ values of the
mangroves are very similar and qNmax < NPQmax. The qN
and NPQ of mangroves are typical of vascular plants
[3,4,5,6,8].
The importance of qN and NPQ is that they reflect the state
of the proton motive force across the thylakoid membranes of
the chloroplasts and are sensitive to nutrient deficiencies and
herbicides.
Fig. 7
Fig. 8
TABLE II
TABLE OF NON-PHOTOCHEMICAL QUENCHING OF MANGROVES.
IV. CONCLUSION
It is important to be able to estimate absorptances of leaves
experimentally for PAM studies because many types of
leaves have absorptances quite different to the commonly
used default value of 84%. The higher Abt results in
higher estimates of Gross photosynthesis (Pg).
Species qN NPQ
qNmax kqN NPQmax kNPQ
Avicennia 0.859
±0.0239
0.00714
±0.000754
1.545
±0.104
0.00366
±0.000749
Rhizophora 0.805
±0.0342
0.00571
±0.000863
1.598
±0.123
0.00315
±0.000713
Bruguiera 0.751
±0.183
0.00407
±0.00029
1.473
±0.0928
0.00218
±0.000308
International Conference on Plant, Marine and Environmental Sciences (PMES-2015) Jan. 1-2, 2015 Kuala Lumpur (Malaysia)
http://dx.doi.org/10.15242/IICBE.C0115015 60

Gross photosynthesis was estimated as mol m-2 s-1 (leaf
area basis for productivity studies) and mol mg Chl a-1 h-1
(for interspecies comparisons).
Avicennia and Rhizophora are adapted to very high
irradiance and have high photosynthetic efficiencies.
Bruguiera saturates at much lower irradiance, has a lower
photosynthetic rate both on a surface area and Chl a basis
and a lower Photosynthesis efficiency.
Non-photochemical quenching characteristics of
Avicennia, Rhizophora and Bruguiera are closely similar
and typical of vascular plants.
ACKNOWLEDGMENT
The authors wish to thank the Prince of Songkla
University-Phuket for providing the facilities for the project.
The study was based upon an ongoing Master of
Environmental Science project by Peerapat Wongpattanakul
funded by a Prince of Songkla University Post-graduate
Scholarship.
REFERENCES
[1] Y. Wang, Remote Sensing of Coastal Environments. Taylor and Francis
Series in Remote Sensing Applications. Indiana State University, Terre
Haute, Indiana. U.S.A.2010.
[2] U. Schreiber, W. Bilger, and C. Neubauer, Ecophysiology of
Photosynthesis: Ecological Studies, 100. Chlorophyll fluorescence as a
non-intrusive indicator for rapid assessment of in vivo photosynthesis (E.D.
Schulze & M.M.Caldwell, eds): Springer, Berlin. 1995. p. 49-70.
http://dx.doi.org/10.1007/978-3-642-79354-7_3
[3] A.J. White, C. Critchley, “Rapid light curves: A new fluorescence method
to assess the state of the photosynthetic apparatus,” Photosynthesis
Research vol. 59. p. 63-72, 1999.
http://dx.doi.org/10.1023/A:1006188004189
[4] R.J. Ritchie, “Fitting light saturation curves measured using PAM
fluorometry,” Photosynthesis Research vol. 96. p. 201-215, 2008.
http://dx.doi.org/10.1007/s11120-008-9300-7
[5] R.J. Ritchie, A.W.D. Larkum, “Modeling Photosynthesis in Shallow Algal
Production Ponds,” Photosynthetica vol. 50. p. 481-500, 2012
http://dx.doi.org/10.1007/s11099-012-0076-9
[6] R.J. Ritchie, S. Bunthawin, “The Use of PAM (Pulse Amplitude
Modulation) Fluorometry to Measure Photosynthesis in Pineapple (Ananas
comosus [L.] Merr),” Tropical Plant Biology vol. 3, p. 193-203, 2010.
http://dx.doi.org/10.1007/s12042-010-9057-y
[7] R.J. Ritchie, “Modeling Photosynthetically Active Radiation and
Maximum Potential Gross Photosynthesis,” Photosynthetica vol. 48. p.
596-609, 2010. http://dx.doi.org/10.1007/s11099-010-0077-5
[8] M.C. Ball, “Photosynthesis in Mangroves,” Wetlands (Australia) vol. 6.
p. 12 – 22, 1986.
[9] P.D. Biber, “Measuring the effects of salinity stress in the red mangrove,
Rhizophora mangle L.,” African Journal of Agricultural Research vol. 1.
p. 001-004, 2006.
[10] B. Genty, J.M. Briantais, N.R. Baker, “The relationship between the
quantum yield of photosynthetic electron transport and quenching of
chlorophyll fluorescence,” Biochim. Biophys. Acta vol. 990. p. 87–92,
1989. http://dx.doi.org/10.1016/S0304-4165(89)80016-9
[11] O. Bjorkman, B. Demmig, “Photon yield of O2 evolution and chlorophyll
fluorescence characteristics at 77 K among vascular plants of diverse
origins,” Planta vol. 170. p. 489–504, 1987.
http://dx.doi.org/10.1007/BF00402983
[12] R.J. Ritchie, R.W. Runcie, “A portable Reflectance-Absorptance-
Transmittance (RAT) meter for vascular Plant leaves,” Accepted for
publication Photosynthetica 18 April 2014.
[13] R.J. Ritchie, “Consistent Sets of Spectrophotometric Equations for
Acetone, Methanol and Ethanol Solvents,” Photosynthesis Research vol.
89, p. 27 – 41, 2006. http://dx.doi.org/10.1007/s11120-006-9065-9
International Conference on Plant, Marine and Environmental Sciences (PMES-2015) Jan. 1-2, 2015 Kuala Lumpur (Malaysia)
http://dx.doi.org/10.15242/IICBE.C0115015 61


![Inter-hour direct normal irradiance forecast with multiple ... · ahead solar irradiance forecast [11, 12] and long-term solar irradiance estimation [13]. However, for an inter-hour](https://static.fdocuments.in/doc/165x107/5f43655640b4404ee374a6b6/inter-hour-direct-normal-irradiance-forecast-with-multiple-ahead-solar-irradiance.jpg)