Photoshop and Multispectral Imaging for Art …€¦ · · 2014-10-21PHOTOSHOP AND MULTISPECTRAL...
8
91 TECHNICAL PAPER 1. Cultural Heritage Science Open Source, Piazza Cantarella 11, 95025 Aci Sant’Antonio, Italy. 2. Center of Interdisciplinary Science for Art, Architecture and Archaeology (CISA3), University of California, San Diego, 9500 Gilman Drive, La Jolla, CA 92093-0418, USA. corresponding author: [email protected] e-PS, 2014, 11, 91-98 ISSN: 1581-9280 web edition ISSN: 1854-3928 print edition e-Preservation Science (e-PS) is published by Morana RTD d.o.o. www.Morana-rtd.com Copyright M O R A N A RTD d.o.o. Antonino Cosentino 1 , Samantha Stout 2 received: 17/02/2014 accepted: 05/09/2014 key words: multispectral imaging, Adobe Photoshop, infrared reflectography, ultraviolet fluores- cence photography, infrared fluorescence, ultraviolet reflected photography Abstract Adobe ® Photoshop ® has been applied already in a number of scientific fields. This paper presents some of Photoshop’s segmenting and blend- ing tools and discusses their application for art examination and docu- mentation, with a particular focus to speed up the workflow of profes- sionals working in museum conservation. These tools produce results comparable with those of much more expensive and difficult to use sci- entific software with the relevant advantages that come from using mainstream software with a large professional user base. This effort matches the current interest in the conservation sector to pursue low- cost methods and commercial equipment. Specifically this paper pres- ents the semiautomatic identification and quantification of retouches and losses by editing and analyzing the ultraviolet fluorescence images. It also shows the use of luminosity blending mode applied for the color- aided visualization of cadmium pigments in the infrared fluorescence images, the enhancement of infrared images and the preliminary exami- nation of multispectral images to guide in planning further analytical measures. 1 Introduction Adobe ® Photoshop ® is an untapped powerful tool for conservation and art documentation professionals examining an artifact using multispectral imaging (MSI). There are few examples of image analysis software developed or adapted specifically for art examination 1,2 . Otherwise, there is software for scientific imaging analysis which provides fine quantitative analysis but is either costly or, when available with free access 3,4 , difficult to use. Photoshop has been applied in a number of scientific fields already. It was proposed for semiautomatic identification of anatomical structures in MRI imaging 5 and breast cancer research 6 and there is specific literature regard- ing its use for scientific imaging 7 . The implementation of a commercially available image editing software such as Photoshop for the art documenta- tion workflow has a number of advantages: a) Photoshop is likely to be com- monly available and updated longer than any software developed specifical- ly for the tiny field of art examination; b) Photoshop is the industry standard in digital imaging. It is powerful and actually has the best image analysis tools for a high quality, first approximation qualitative analysis of artworks. Furthermore, there are a number of plugins available to enhance its capabil- ities specifically for scientific use; c) The scripting and automation tools can be tailored to the needs of art documentation and facilitate the batch pro- cessing of multiple images providing workflow efficiency. Photoshop can be customized to be a useful MSI analysis tool without requiring any coding skill, unlikely for a conservator to have; d) Using a mainstream software with a large professional user base allows for sharing the material using the same platform without issues with file conversion; e) There is a great interest in the conservation sector on techniques that require low-cost, simple and com- mercial instrumentation; such as a digital cameras modified for MSI 8 and the Reflectance Transformation Imaging technique 9 . This paper describes some Photoshop features which are of use for specific tasks in art examination and PHOTOSHOP AND MULTISPECTRAL IMAGING FOR ART DOCUMENTATION e-PRESERVATIONScience
Transcript of Photoshop and Multispectral Imaging for Art …€¦ · · 2014-10-21PHOTOSHOP AND MULTISPECTRAL...
91
TECHNICAL PAPER
1. Cultural Heritage Science Open Source,Piazza Cantarella 11, 95025 Aci Sant’Antonio,Italy.
2. Center of Interdisciplinary Science for Art,Architecture and Archaeology (CISA3),University of California, San Diego,9500 Gilman Drive, La Jolla,CA 92093-0418, USA.
corresponding author:[email protected]
e-PS, 2014, 11, 91-98ISSN: 1581-9280 web editionISSN: 1854-3928 print edition
e-Preservation Science (e-PS)
is published by Morana RTD d.o.o.www.Morana-rtd.com
Copyright M O R A N A RTD d.o.o. Antonino Cosentino1, Samantha Stout2
received: 17/02/2014accepted: 05/09/2014
key words:multispectral imaging, Adobe Photoshop,infrared reflectography, ultraviolet fluores-cence photography, infrared fluorescence,ultraviolet reflected photography
Abstract
Adobe® Photoshop® has been applied already in a number of scientificfields. This paper presents some of Photoshop’s segmenting and blend-ing tools and discusses their application for art examination and docu-mentation, with a particular focus to speed up the workflow of profes-sionals working in museum conservation. These tools produce resultscomparable with those of much more expensive and difficult to use sci-entific software with the relevant advantages that come from usingmainstream software with a large professional user base. This effortmatches the current interest in the conservation sector to pursue low-cost methods and commercial equipment. Specifically this paper pres-ents the semiautomatic identification and quantification of retouchesand losses by editing and analyzing the ultraviolet fluorescence images.It also shows the use of luminosity blending mode applied for the color-aided visualization of cadmium pigments in the infrared fluorescenceimages, the enhancement of infrared images and the preliminary exami-nation of multispectral images to guide in planning further analyticalmeasures.
1 Introduction
Adobe® Photoshop® is an untapped powerful tool for conservation and artdocumentation professionals examining an artifact using multispectralimaging (MSI). There are few examples of image analysis software developedor adapted specifically for art examination1,2. Otherwise, there is software forscientific imaging analysis which provides fine quantitative analysis but iseither costly or, when available with free access3,4, difficult to use.Photoshop has been applied in a number of scientific fields already. It wasproposed for semiautomatic identification of anatomical structures in MRIimaging5 and breast cancer research6 and there is specific literature regard-ing its use for scientific imaging7. The implementation of a commerciallyavailable image editing software such as Photoshop for the art documenta-tion workflow has a number of advantages: a) Photoshop is likely to be com-monly available and updated longer than any software developed specifical-ly for the tiny field of art examination; b) Photoshop is the industry standardin digital imaging. It is powerful and actually has the best image analysistools for a high quality, first approximation qualitative analysis of artworks.Furthermore, there are a number of plugins available to enhance its capabil-ities specifically for scientific use; c) The scripting and automation tools canbe tailored to the needs of art documentation and facilitate the batch pro-cessing of multiple images providing workflow efficiency. Photoshop can becustomized to be a useful MSI analysis tool without requiring any codingskill, unlikely for a conservator to have; d) Using a mainstream software witha large professional user base allows for sharing the material using the sameplatform without issues with file conversion; e) There is a great interest in theconservation sector on techniques that require low-cost, simple and com-mercial instrumentation; such as a digital cameras modified for MSI8 and theReflectance Transformation Imaging technique9. This paper describes somePhotoshop features which are of use for specific tasks in art examination and
PHOTOSHOP AND MULTISPECTRAL IMAGING FORART DOCUMENTATION
e-PRESERVATIONScience
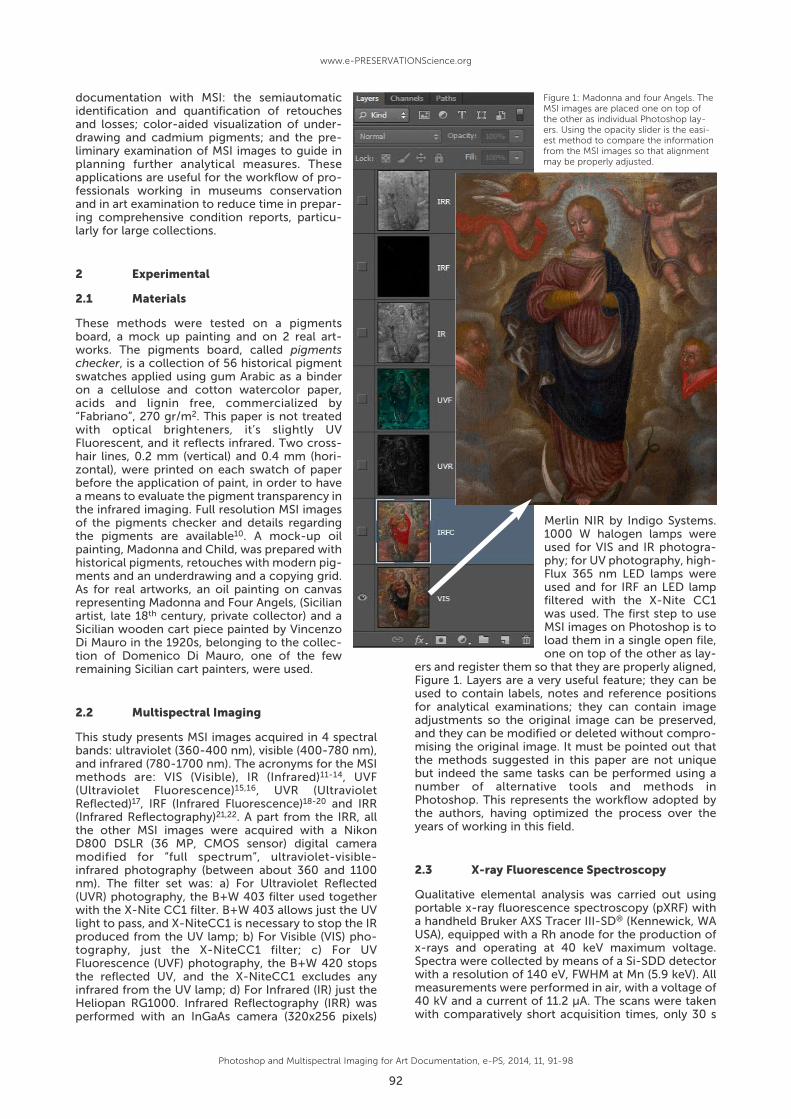
Merlin NIR by Indigo Systems.1000 W halogen lamps wereused for VIS and IR photogra-phy; for UV photography, high-Flux 365 nm LED lamps wereused and for IRF an LED lampfiltered with the X-Nite CC1was used. The first step to useMSI images on Photoshop is toload them in a single open file,one on top of the other as lay-
ers and register them so that they are properly aligned,Figure 1. Layers are a very useful feature; they can beused to contain labels, notes and reference positionsfor analytical examinations; they can contain imageadjustments so the original image can be preserved,and they can be modified or deleted without compro-mising the original image. It must be pointed out thatthe methods suggested in this paper are not uniquebut indeed the same tasks can be performed using anumber of alternative tools and methods inPhotoshop. This represents the workflow adopted bythe authors, having optimized the process over theyears of working in this field.
2.3 X-ray Fluorescence Spectroscopy
Qualitative elemental analysis was carried out usingportable x-ray fluorescence spectroscopy (pXRF) witha handheld Bruker AXS Tracer III-SD® (Kennewick, WAUSA), equipped with a Rh anode for the production ofx-rays and operating at 40 keV maximum voltage.Spectra were collected by means of a Si-SDD detectorwith a resolution of 140 eV, FWHM at Mn (5.9 keV). Allmeasurements were performed in air, with a voltage of40 kV and a current of 11.2 μA. The scans were takenwith comparatively short acquisition times, only 30 s
documentation with MSI: the semiautomaticidentification and quantification of retouchesand losses; color-aided visualization of under-drawing and cadmium pigments; and the pre-liminary examination of MSI images to guide inplanning further analytical measures. Theseapplications are useful for the workflow of pro-fessionals working in museums conservationand in art examination to reduce time in prepar-ing comprehensive condition reports, particu-larly for large collections.
2 Experimental
2.1 Materials
These methods were tested on a pigmentsboard, a mock up painting and on 2 real art-works. The pigments board, called pigmentschecker, is a collection of 56 historical pigmentswatches applied using gum Arabic as a binderon a cellulose and cotton watercolor paper,acids and lignin free, commercialized by“Fabriano”, 270 gr/m2. This paper is not treatedwith optical brighteners, it’s slightly UVFluorescent, and it reflects infrared. Two cross-hair lines, 0.2 mm (vertical) and 0.4 mm (hori-zontal), were printed on each swatch of paperbefore the application of paint, in order to havea means to evaluate the pigment transparency inthe infrared imaging. Full resolution MSI imagesof the pigments checker and details regardingthe pigments are available10. A mock-up oilpainting, Madonna and Child, was prepared withhistorical pigments, retouches with modern pig-ments and an underdrawing and a copying grid.As for real artworks, an oil painting on canvasrepresenting Madonna and Four Angels, (Sicilianartist, late 18th century, private collector) and aSicilian wooden cart piece painted by VincenzoDi Mauro in the 1920s, belonging to the collec-tion of Domenico Di Mauro, one of the fewremaining Sicil ian cart painters, were used.
2.2 Multispectral Imaging
This study presents MSI images acquired in 4 spectralbands: ultraviolet (360-400 nm), visible (400-780 nm),and infrared (780-1700 nm). The acronyms for the MSImethods are: VIS (Visible), IR (Infrared)11-14, UVF(Ultraviolet Fluorescence)15,16, UVR (UltravioletReflected)17, IRF (Infrared Fluorescence)18-20 and IRR(Infrared Reflectography)21,22. A part from the IRR, allthe other MSI images were acquired with a NikonD800 DSLR (36 MP, CMOS sensor) digital cameramodified for “full spectrum”, ultraviolet-visible-infrared photography (between about 360 and 1100nm). The filter set was: a) For Ultraviolet Reflected(UVR) photography, the B+W 403 filter used togetherwith the X-Nite CC1 filter. B+W 403 allows just the UVlight to pass, and X-NiteCC1 is necessary to stop the IRproduced from the UV lamp; b) For Visible (VIS) pho-tography, just the X-NiteCC1 filter; c) For UVFluorescence (UVF) photography, the B+W 420 stopsthe reflected UV, and the X-NiteCC1 excludes anyinfrared from the UV lamp; d) For Infrared (IR) just theHeliopan RG1000. Infrared Reflectography (IRR) wasperformed with an InGaAs camera (320x256 pixels)
Photoshop and Multispectral Imaging for Art Documentation, e-PS, 2014, 11, 91-98
92
www.e-PRESERVATIONScience.org
Figure 1: Madonna and four Angels. TheMSI images are placed one on top ofthe other as individual Photoshop lay-ers. Using the opacity slider is the easi-est method to compare the informationfrom the MSI images so that alignmentmay be properly adjusted.
versus the typically longer times (up to 300 s) used inother references23-25. These settings allowed thedetection of elements of atomic number 13 (Al) orhigher. The settings also provided a sufficient rawcount rate (range 50.000-110.000, avg. 90.000) toacquire good spectra without saturating the detec-tor (saturation occurs over 125.000 counts).
2.4 FORS, Fiber Optics Reflectance Spectroscopy
A FORS26,27 system was also used to complement theMSI and XRF analysis. It is composed of 4 Oceanoptics elements; the light source, the spectrometer,the probe and the two fiber optics. The light is pro-vided by a halogen lamp HL-2000-FHSA, with outputpower 7 W and color temperature 2960 K. TheUSB4000 spectrometer features a 3648-elementToshiba linear CCD array, a diffraction grating with aworking range of 360-1000 nm and resolution 1.5 –2.3 nm (FWHM). Spectra have been acquired with thefollowing parameters: integration time: 5 s (integratingsphere), 5 ms (reflectance probe), scans to average: 4,boxcar width: 5. As a probe, was used the integratingsphere ISP-R which averages the diffused and thereflected components, providing a spectrum which ischaracteristic of the material analyzed and does notdepend on the specific measuring angle.
3 Results and Discussion
3.1 Mapping Retouchings
It is often necessary to select areas of interest, some-times simply to highlight them in condition reports.However, it might be even to measure their area, suchas to estimate the time needed for a cleaning interven-tion, or to know the percentage of the original worksurviving. The process of partitioning a digitalimage into multiple segments is called segmentation.This task can be accomplished manually or it can beautomatized with Photoshop tools. The selections canbe saved and recalled for a number of useful applica-tions in art conservation and documentation. The UVFimage makes the retouched areas visible. They do notemit any fluorescence under UV light and appear ascharacteristic black spots surrounded by the originalpaint, which is strongly fluorescent15,16. The contrast isso intense, suggesting that the automatic segmenta-tion should be successful. The following are illustratedsteps to perform this segmentation task. It must bepointed out that highly compressed images cannotprovide accurate results andtherefore it is necessary to workwith an uncompressed formatsuch as TIFF.
3.1.1 Choosing RGB Channel
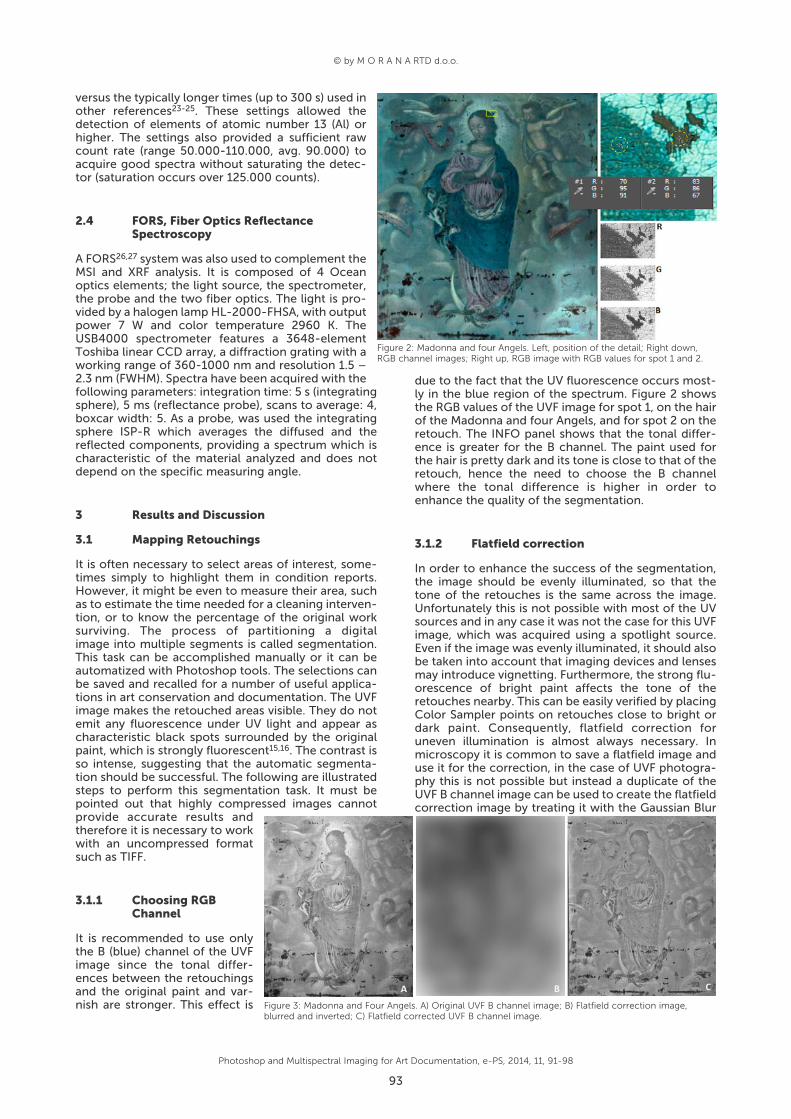
It is recommended to use onlythe B (blue) channel of the UVFimage since the tonal differ-ences between the retouchingsand the original paint and var-nish are stronger. This effect is
due to the fact that the UV fluorescence occurs most-ly in the blue region of the spectrum. Figure 2 showsthe RGB values of the UVF image for spot 1, on the hairof the Madonna and four Angels, and for spot 2 on theretouch. The INFO panel shows that the tonal differ-ence is greater for the B channel. The paint used forthe hair is pretty dark and its tone is close to that of theretouch, hence the need to choose the B channelwhere the tonal difference is higher in order toenhance the quality of the segmentation.
3.1.2 Flatfield correction
In order to enhance the success of the segmentation,the image should be evenly illuminated, so that thetone of the retouches is the same across the image.Unfortunately this is not possible with most of the UVsources and in any case it was not the case for this UVFimage, which was acquired using a spotlight source.Even if the image was evenly illuminated, it should alsobe taken into account that imaging devices and lensesmay introduce vignetting. Furthermore, the strong flu-orescence of bright paint affects the tone of theretouches nearby. This can be easily verified by placingColor Sampler points on retouches close to bright ordark paint. Consequently, flatfield correction foruneven illumination is almost always necessary. Inmicroscopy it is common to save a flatfield image anduse it for the correction, in the case of UVF photogra-phy this is not possible but instead a duplicate of theUVF B channel image can be used to create the flatfieldcorrection image by treating it with the Gaussian Blur
Photoshop and Multispectral Imaging for Art Documentation, e-PS, 2014, 11, 91-98
93
© by M O R A N A RTD d.o.o.
Figure 2: Madonna and four Angels. Left, position of the detail; Right down,RGB channel images; Right up, RGB image with RGB values for spot 1 and 2.
Figure 3: Madonna and Four Angels. A) Original UVF B channel image; B) Flatfield correction image,blurred and inverted; C) Flatfield corrected UVF B channel image.
filter (radius = 100 pixels) and inverting it in order tocreate a negative image of the original. This flatfieldimage is placed as a layer over the original image andthen blended with Hard Light Mode and Opacity 30%or any other value, so that the color sampling points -that have been placed at the beginning of the processon the retouches - read values as close as possible toeach other, Figure 3.
3.1.3 Blurring
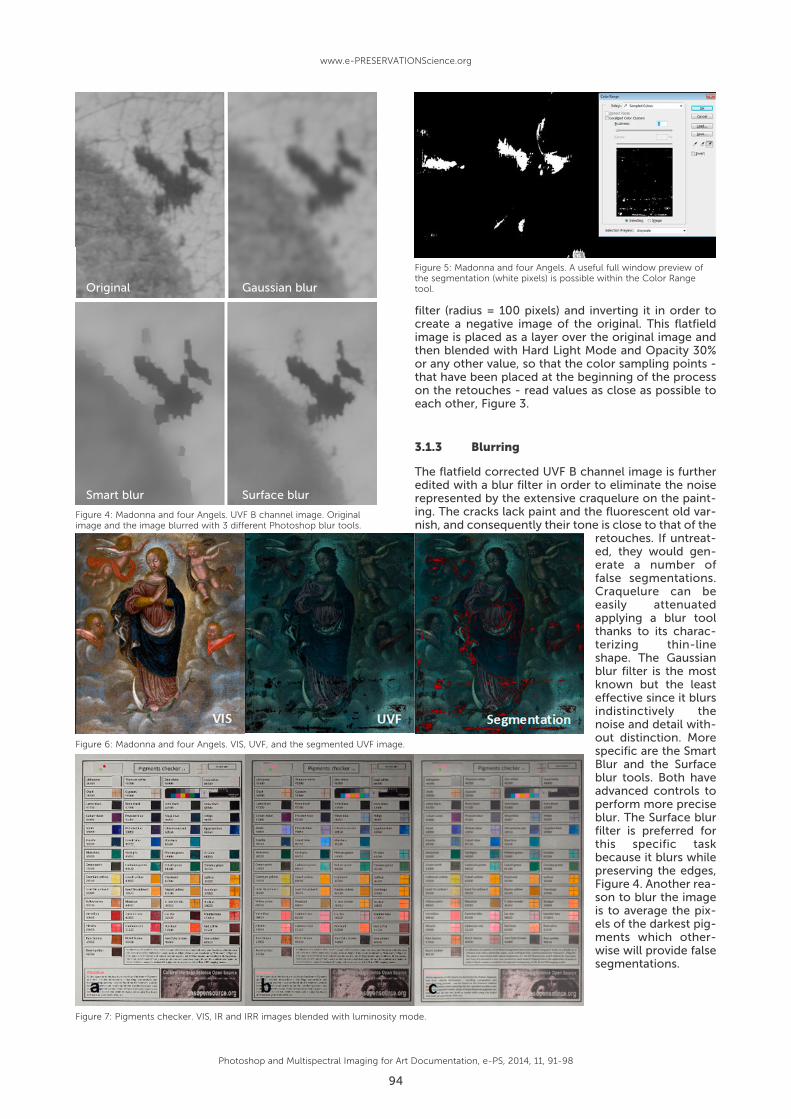
The flatfield corrected UVF B channel image is furtheredited with a blur filter in order to eliminate the noiserepresented by the extensive craquelure on the paint-ing. The cracks lack paint and the fluorescent old var-nish, and consequently their tone is close to that of the
retouches. If untreat-ed, they would gen-erate a number offalse segmentations.Craquelure can beeasily attenuatedapplying a blur toolthanks to its charac-terizing thin-lineshape. The Gaussianblur filter is the mostknown but the leasteffective since it blursindistinctively thenoise and detail with-out distinction. Morespecific are the SmartBlur and the Surfaceblur tools. Both haveadvanced controls toperform more preciseblur. The Surface blurfilter is preferred forthis specific taskbecause it blurs whilepreserving the edges,Figure 4. Another rea-son to blur the imageis to average the pix-els of the darkest pig-ments which other-wise will provide falsesegmentations.
Photoshop and Multispectral Imaging for Art Documentation, e-PS, 2014, 11, 91-98
94
www.e-PRESERVATIONScience.org
Figure 4: Madonna and four Angels. UVF B channel image. Originalimage and the image blurred with 3 different Photoshop blur tools.
Figure 5: Madonna and four Angels. A useful full window preview ofthe segmentation (white pixels) is possible within the Color Rangetool.
Figure 7: Pigments checker. VIS, IR and IRR images blended with luminosity mode.
Figure 6: Madonna and four Angels. VIS, UVF, and the segmented UVF image.
Original Gaussian blur
Smart blur Surface blur
3.1.4 Segmentation
Color Range is a powerful selection tool for the seg-mentation of retouches. It analyzes the luminance ofthe image and selects tonal ranges within a singlecolor or tonal ranges in grayscale chosen by the oper-ator. Color Range is used as the popular magic wandbut it makes the selection dynamic and shows a fullpreview. So it is possible to choose the best FUZZINESSvalue for the specific task, as opposed to just trial anderror, like with the magic wand tolerance bar, Figure 5.The best procedure is to set FUZZINESS = 1 and pro-ceed by adding or subtracting the tones until theselected areas represent sufficiently the retouches inthe full preview, Figure segmentation. The selectioncan be saved as an alpha channel and manually editedusing the brush tool to refine the selection.
3.1.5 Calibrating and Measuring retouchings
The final goal of the segmentation is to measure thetotal area occupied by the retouches and, therefore,the image must be calibrated using the SetMeasurement Scale tool. Art documentation photog-raphy always includes a color checker that has a meas-urement scale which can be set as the scale for thecalibration. Otherwise, if the size of the painting isknown, one of the sides can be used for the calibra-tion. Once the segmentation is active, theMeasurement Log tool provides the total area as wellas other geometrical parameters. For the Madonna andfour Angels painting, which measures 60 x 75 cm, theretouched area was found to be 228 cm2 (0,05%),Figure 6.
3.2 Paint and underdrawing
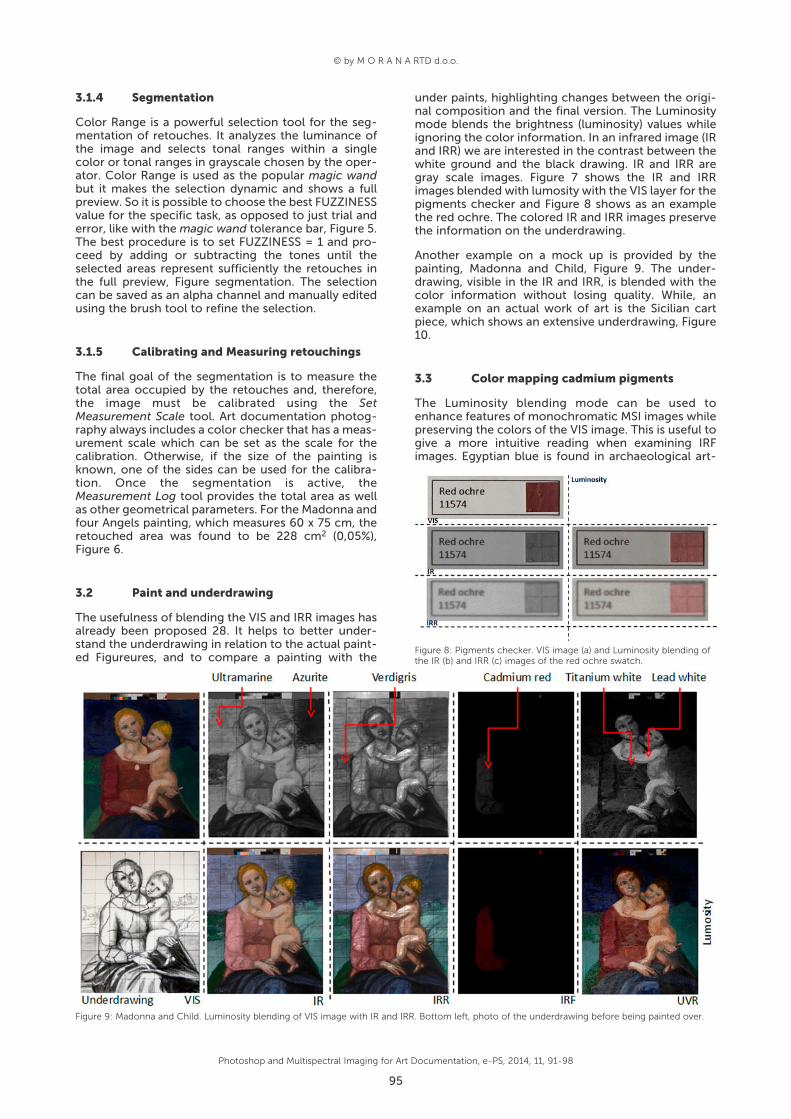
The usefulness of blending the VIS and IRR images hasalready been proposed 28. It helps to better under-stand the underdrawing in relation to the actual paint-ed Figureures, and to compare a painting with the
under paints, highlighting changes between the origi-nal composition and the final version. The Luminositymode blends the brightness (luminosity) values whileignoring the color information. In an infrared image (IRand IRR) we are interested in the contrast between thewhite ground and the black drawing. IR and IRR aregray scale images. Figure 7 shows the IR and IRRimages blended with lumosity with the VIS layer for thepigments checker and Figure 8 shows as an examplethe red ochre. The colored IR and IRR images preservethe information on the underdrawing.
Another example on a mock up is provided by thepainting, Madonna and Child, Figure 9. The under-drawing, visible in the IR and IRR, is blended with thecolor information without losing quality. While, anexample on an actual work of art is the Sicilian cartpiece, which shows an extensive underdrawing, Figure10.
3.3 Color mapping cadmium pigments
The Luminosity blending mode can be used toenhance features of monochromatic MSI images whilepreserving the colors of the VIS image. This is useful togive a more intuitive reading when examining IRFimages. Egyptian blue is found in archaeological art-
Photoshop and Multispectral Imaging for Art Documentation, e-PS, 2014, 11, 91-98
95
© by M O R A N A RTD d.o.o.
Figure 8: Pigments checker. VIS image (a) and Luminosity blending ofthe IR (b) and IRR (c) images of the red ochre swatch.
Figure 9: Madonna and Child. Luminosity blending of VIS image with IR and IRR. Bottom left, photo of the underdrawing before being painted over.
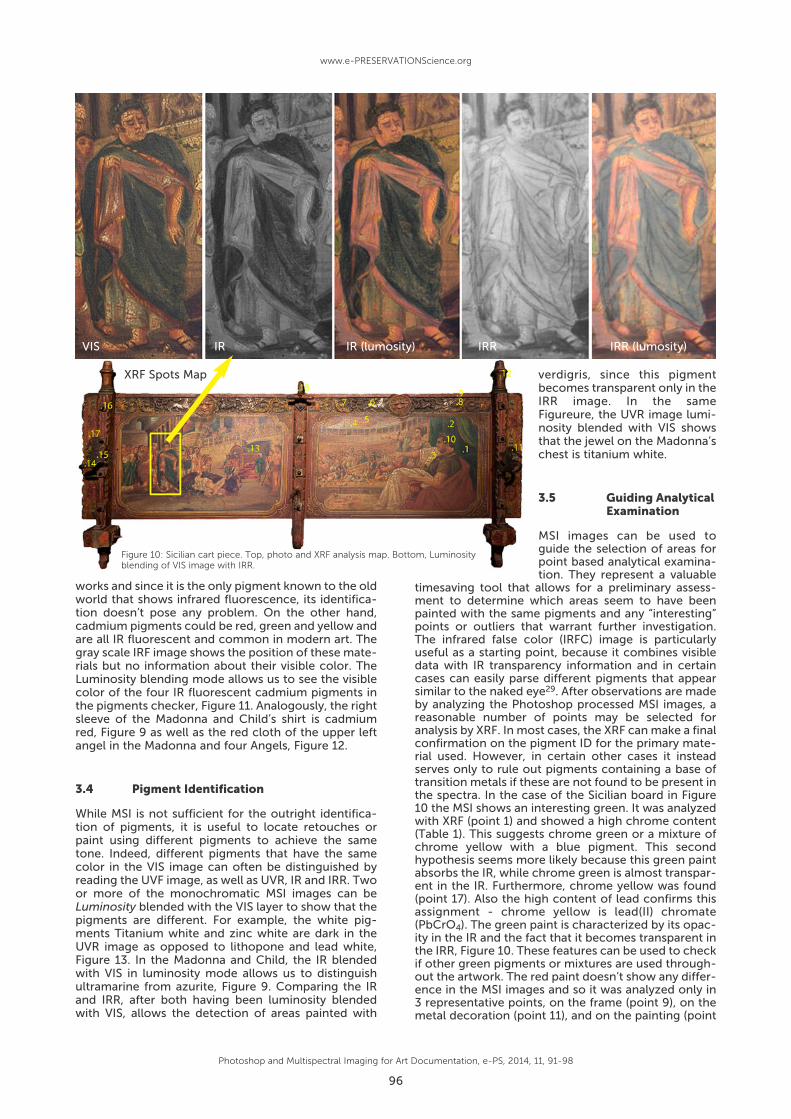
verdigris, since this pigmentbecomes transparent only in theIRR image. In the sameFigureure, the UVR image lumi-nosity blended with VIS showsthat the jewel on the Madonna’schest is titanium white.
3.5 Guiding Analytical Examination
MSI images can be used toguide the selection of areas forpoint based analytical examina-tion. They represent a valuable
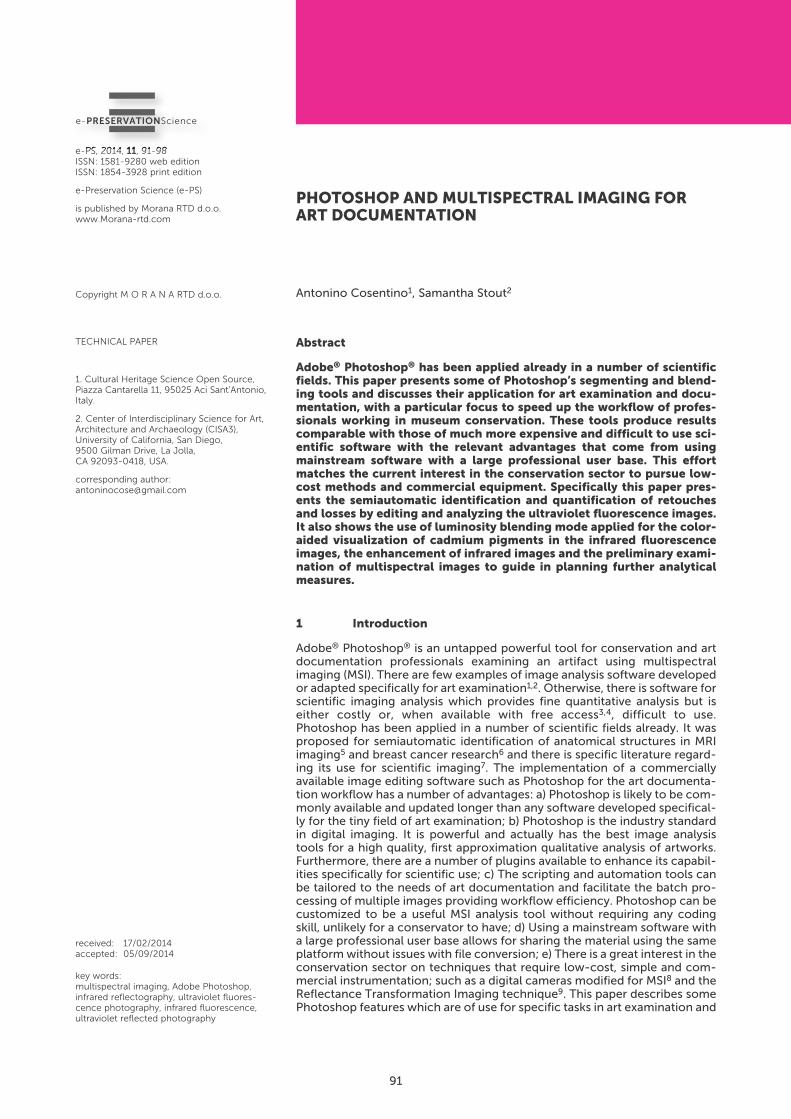
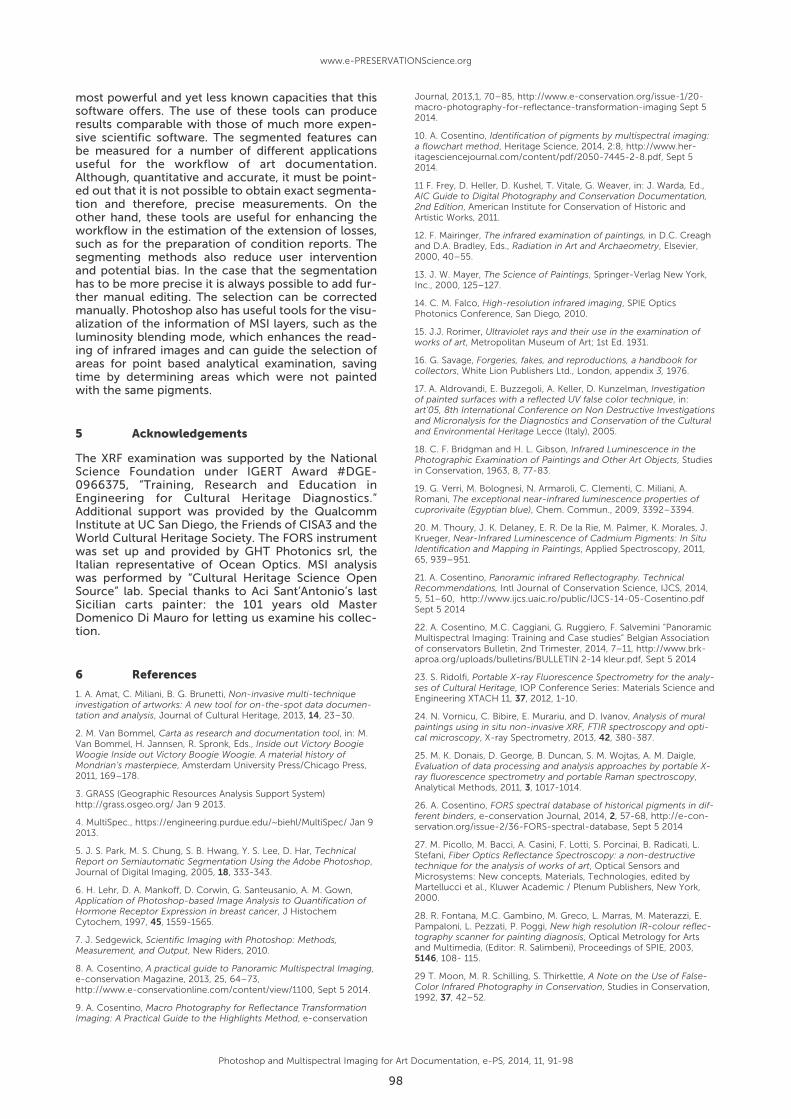
timesaving tool that allows for a preliminary assess-ment to determine which areas seem to have beenpainted with the same pigments and any “interesting”points or outliers that warrant further investigation.The infrared false color (IRFC) image is particularlyuseful as a starting point, because it combines visibledata with IR transparency information and in certaincases can easily parse different pigments that appearsimilar to the naked eye29. After observations are madeby analyzing the Photoshop processed MSI images, areasonable number of points may be selected foranalysis by XRF. In most cases, the XRF can make a finalconfirmation on the pigment ID for the primary mate-rial used. However, in certain other cases it insteadserves only to rule out pigments containing a base oftransition metals if these are not found to be present inthe spectra. In the case of the Sicilian board in Figure10 the MSI shows an interesting green. It was analyzedwith XRF (point 1) and showed a high chrome content(Table 1). This suggests chrome green or a mixture ofchrome yellow with a blue pigment. This secondhypothesis seems more likely because this green paintabsorbs the IR, while chrome green is almost transpar-ent in the IR. Furthermore, chrome yellow was found(point 17). Also the high content of lead confirms thisassignment - chrome yellow is lead(II) chromate(PbCrO4). The green paint is characterized by its opac-ity in the IR and the fact that it becomes transparent inthe IRR, Figure 10. These features can be used to checkif other green pigments or mixtures are used through-out the artwork. The red paint doesn’t show any differ-ence in the MSI images and so it was analyzed only in3 representative points, on the frame (point 9), on themetal decoration (point 11), and on the painting (point
works and since it is the only pigment known to the oldworld that shows infrared fluorescence, its identifica-tion doesn’t pose any problem. On the other hand,cadmium pigments could be red, green and yellow andare all IR fluorescent and common in modern art. Thegray scale IRF image shows the position of these mate-rials but no information about their visible color. TheLuminosity blending mode allows us to see the visiblecolor of the four IR fluorescent cadmium pigments inthe pigments checker, Figure 11. Analogously, the rightsleeve of the Madonna and Child’s shirt is cadmiumred, Figure 9 as well as the red cloth of the upper leftangel in the Madonna and four Angels, Figure 12.
3.4 Pigment Identification
While MSI is not sufficient for the outright identifica-tion of pigments, it is useful to locate retouches orpaint using different pigments to achieve the sametone. Indeed, different pigments that have the samecolor in the VIS image can often be distinguished byreading the UVF image, as well as UVR, IR and IRR. Twoor more of the monochromatic MSI images can beLuminosity blended with the VIS layer to show that thepigments are different. For example, the white pig-ments Titanium white and zinc white are dark in theUVR image as opposed to lithopone and lead white,Figure 13. In the Madonna and Child, the IR blendedwith VIS in luminosity mode allows us to distinguishultramarine from azurite, Figure 9. Comparing the IRand IRR, after both having been luminosity blendedwith VIS, allows the detection of areas painted with
Photoshop and Multispectral Imaging for Art Documentation, e-PS, 2014, 11, 91-98
96
www.e-PRESERVATIONScience.org
XRF Spots Map
Figure 10: Sicilian cart piece. Top, photo and XRF analysis map. Bottom, Luminosityblending of VIS image with IRR.
VIS IR IR (lumosity) IRR IRR (lumosity)
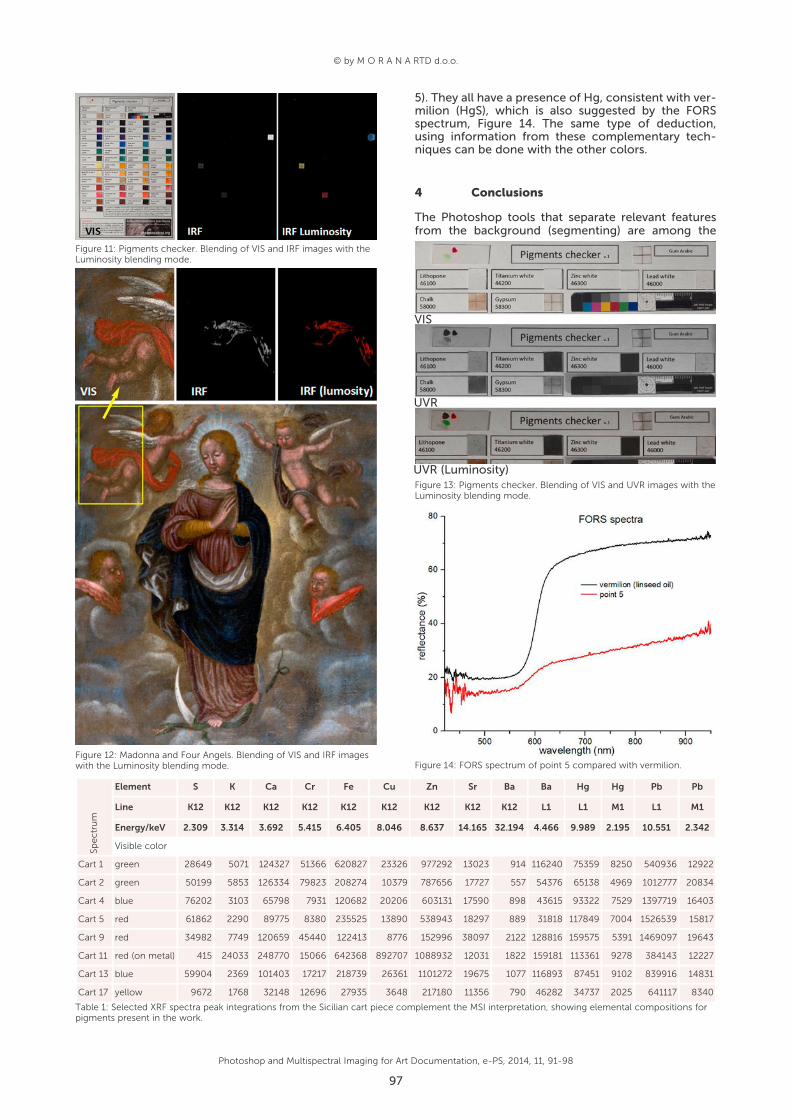
5). They all have a presence of Hg, consistent with ver-milion (HgS), which is also suggested by the FORSspectrum, Figure 14. The same type of deduction,using information from these complementary tech-niques can be done with the other colors.
4 Conclusions
The Photoshop tools that separate relevant featuresfrom the background (segmenting) are among the
Photoshop and Multispectral Imaging for Art Documentation, e-PS, 2014, 11, 91-98
97
© by M O R A N A RTD d.o.o.
Figure 11: Pigments checker. Blending of VIS and IRF images with theLuminosity blending mode.
Figure 12: Madonna and Four Angels. Blending of VIS and IRF imageswith the Luminosity blending mode.
Spe
ctr
um
Element S K Ca Cr Fe Cu Zn Sr Ba Ba Hg Hg Pb Pb
Line K12 K12 K12 K12 K12 K12 K12 K12 K12 L1 L1 M1 L1 M1
Energy/keV 2.309 3.314 3.692 5.415 6.405 8.046 8.637 14.165 32.194 4.466 9.989 2.195 10.551 2.342
Visible color
Cart 1 green 28649 5071 124327 51366 620827 23326 977292 13023 914 116240 75359 8250 540936 12922
Cart 2 green 50199 5853 126334 79823 208274 10379 787656 17727 557 54376 65138 4969 1012777 20834
Cart 4 blue 76202 3103 65798 7931 120682 20206 603131 17590 898 43615 93322 7529 1397719 16403
Cart 5 red 61862 2290 89775 8380 235525 13890 538943 18297 889 31818 117849 7004 1526539 15817
Cart 9 red 34982 7749 120659 45440 122413 8776 152996 38097 2122 128816 159575 5391 1469097 19643
Cart 11 red (on metal) 415 24033 248770 15066 642368 892707 1088932 12031 1822 159181 113361 9278 384143 12227
Cart 13 blue 59904 2369 101403 17217 218739 26361 1101272 19675 1077 116893 87451 9102 839916 14831
Cart 17 yellow 9672 1768 32148 12696 27935 3648 217180 11356 790 46282 34737 2025 641117 8340
Table 1: Selected XRF spectra peak integrations from the Sicilian cart piece complement the MSI interpretation, showing elemental compositions forpigments present in the work.
Figure 13: Pigments checker. Blending of VIS and UVR images with theLuminosity blending mode.
VIS
UVR
UVR (Luminosity)
Figure 14: FORS spectrum of point 5 compared with vermilion.
Journal, 2013,1, 70–85, http://www.e-conservation.org/issue-1/20-macro-photography-for-reflectance-transformation-imaging Sept 52014.
10. A. Cosentino, Identification of pigments by multispectral imaging:a flowchart method, Heritage Science, 2014, 2:8, http://www.her-itagesciencejournal.com/content/pdf/2050-7445-2-8.pdf, Sept 52014.
11 F. Frey, D. Heller, D. Kushel, T. Vitale, G. Weaver, in: J. Warda, Ed.,AIC Guide to Digital Photography and Conservation Documentation,2nd Edition, American Institute for Conservation of Historic andArtistic Works, 2011.
12. F. Mairinger, The infrared examination of paintings, in D.C. Creaghand D.A. Bradley, Eds., Radiation in Art and Archaeometry, Elsevier,2000, 40–55.
13. J. W. Mayer, The Science of Paintings, Springer-Verlag New York,Inc., 2000, 125–127.
14. C. M. Falco, High-resolution infrared imaging, SPIE OpticsPhotonics Conference, San Diego, 2010.
15. J.J. Rorimer, Ultraviolet rays and their use in the examination ofworks of art, Metropolitan Museum of Art; 1st Ed. 1931.
16. G. Savage, Forgeries, fakes, and reproductions, a handbook forcollectors, White Lion Publishers Ltd., London, appendix 3, 1976.
17. A. Aldrovandi, E. Buzzegoli, A. Keller, D. Kunzelman, Investigationof painted surfaces with a reflected UV false color technique, in:art’05, 8th International Conference on Non Destructive Investigationsand Micronalysis for the Diagnostics and Conservation of the Culturaland Environmental Heritage Lecce (Italy), 2005.
18. C. F. Bridgman and H. L. Gibson, Infrared Luminescence in thePhotographic Examination of Paintings and Other Art Objects, Studiesin Conservation, 1963, 8, 77-83.
19. G. Verri, M. Bolognesi, N. Armaroli, C. Clementi, C. Miliani, A.Romani, The exceptional near-infrared luminescence properties ofcuprorivaite (Egyptian blue), Chem. Commun., 2009, 3392–3394.
20. M. Thoury, J. K. Delaney, E. R. De la Rie, M. Palmer, K. Morales, J.Krueger, Near-Infrared Luminescence of Cadmium Pigments: In SituIdentification and Mapping in Paintings, Applied Spectroscopy, 2011,65, 939–951.
21. A. Cosentino, Panoramic infrared Reflectography. TechnicalRecommendations, Intl Journal of Conservation Science, IJCS, 2014,5, 51–60, http://www.ijcs.uaic.ro/public/IJCS-14-05-Cosentino.pdfSept 5 2014
22. A. Cosentino, M.C. Caggiani, G. Ruggiero, F. Salvemini “PanoramicMultispectral Imaging: Training and Case studies” Belgian Associationof conservators Bulletin, 2nd Trimester, 2014, 7–11, http://www.brk-aproa.org/uploads/bulletins/BULLETIN 2-14 kleur.pdf, Sept 5 2014
23. S. Ridolfi, Portable X-ray Fluorescence Spectrometry for the analy-ses of Cultural Heritage, IOP Conference Series: Materials Science andEngineering XTACH 11, 37, 2012, 1-10.
24. N. Vornicu, C. Bibire, E. Murariu, and D. Ivanov, Analysis of muralpaintings using in situ non-invasive XRF, FTIR spectroscopy and opti-cal microscopy, X-ray Spectrometry, 2013, 42, 380-387.
25. M. K. Donais, D. George, B. Duncan, S. M. Wojtas, A. M. Daigle,Evaluation of data processing and analysis approaches by portable X-ray fluorescence spectrometry and portable Raman spectroscopy,Analytical Methods, 2011, 3, 1017-1014.
26. A. Cosentino, FORS spectral database of historical pigments in dif-ferent binders, e-conservation Journal, 2014, 2, 57-68, http://e-con-servation.org/issue-2/36-FORS-spectral-database, Sept 5 2014
27. M. Picollo, M. Bacci, A. Casini, F. Lotti, S. Porcinai, B. Radicati, L.Stefani, Fiber Optics Reflectance Spectroscopy: a non-destructivetechnique for the analysis of works of art, Optical Sensors andMicrosystems: New concepts, Materials, Technologies, edited byMartellucci et al., Kluwer Academic / Plenum Publishers, New York,2000.
28. R. Fontana, M.C. Gambino, M. Greco, L. Marras, M. Materazzi, E.Pampaloni, L. Pezzati, P. Poggi, New high resolution IR-colour reflec-tography scanner for painting diagnosis, Optical Metrology for Artsand Multimedia, (Editor: R. Salimbeni), Proceedings of SPIE, 2003,5146, 108- 115.
29 T. Moon, M. R. Schilling, S. Thirkettle, A Note on the Use of False-Color Infrared Photography in Conservation, Studies in Conservation,1992, 37, 42–52.
most powerful and yet less known capacities that thissoftware offers. The use of these tools can produceresults comparable with those of much more expen-sive scientific software. The segmented features canbe measured for a number of different applicationsuseful for the workflow of art documentation.Although, quantitative and accurate, it must be point-ed out that it is not possible to obtain exact segmenta-tion and therefore, precise measurements. On theother hand, these tools are useful for enhancing theworkflow in the estimation of the extension of losses,such as for the preparation of condition reports. Thesegmenting methods also reduce user interventionand potential bias. In the case that the segmentationhas to be more precise it is always possible to add fur-ther manual editing. The selection can be correctedmanually. Photoshop also has useful tools for the visu-alization of the information of MSI layers, such as theluminosity blending mode, which enhances the read-ing of infrared images and can guide the selection ofareas for point based analytical examination, savingtime by determining areas which were not paintedwith the same pigments.
5 Acknowledgements
The XRF examination was supported by the NationalScience Foundation under IGERT Award #DGE-0966375, “Training, Research and Education inEngineering for Cultural Heritage Diagnostics.”Additional support was provided by the QualcommInstitute at UC San Diego, the Friends of CISA3 and theWorld Cultural Heritage Society. The FORS instrumentwas set up and provided by GHT Photonics srl, theItalian representative of Ocean Optics. MSI analysiswas performed by “Cultural Heritage Science OpenSource” lab. Special thanks to Aci Sant’Antonio’s lastSicil ian carts painter: the 101 years old Mas terDomenico Di Mauro for letting us examine his collec-tion.
6 References
1. A. Amat, C. Miliani, B. G. Brunetti, Non-invasive multi-techniqueinvestigation of artworks: A new tool for on-the-spot data documen-tation and analysis, Journal of Cultural Heritage, 2013, 14, 23–30.
2. M. Van Bommel, Carta as research and documentation tool, in: M.Van Bommel, H. Jannsen, R. Spronk, Eds., Inside out Victory BoogieWoogie Inside out Victory Boogie Woogie. A material history ofMondrian’s masterpiece, Amsterdam University Press/Chicago Press,2011, 169–178.
3. GRASS (Geographic Resources Analysis Support System)http://grass.osgeo.org/ Jan 9 2013.
4. MultiSpec., https://engineering.purdue.edu/~biehl/MultiSpec/ Jan 92013.
5. J. S. Park, M. S. Chung, S. B. Hwang, Y. S. Lee, D. Har, TechnicalReport on Semiautomatic Segmentation Using the Adobe Photoshop,Journal of Digital Imaging, 2005, 18, 333-343.
6. H. Lehr, D. A. Mankoff, D. Corwin, G. Santeusanio, A. M. Gown,Application of Photoshop-based Image Analysis to Quantification ofHormone Receptor Expression in breast cancer, J HistochemCytochem, 1997, 45, 1559-1565.
7. J. Sedgewick, Scientific Imaging with Photoshop: Methods,Measurement, and Output, New Riders, 2010.
8. A. Cosentino, A practical guide to Panoramic Multispectral Imaging,e-conservation Magazine, 2013, 25, 64–73, http://www.e-conservationline.com/content/view/1100, Sept 5 2014.
9. A. Cosentino, Macro Photography for Reflectance TransformationImaging: A Practical Guide to the Highlights Method, e-conservation
Photoshop and Multispectral Imaging for Art Documentation, e-PS, 2014, 11, 91-98
98
www.e-PRESERVATIONScience.org